a tutorial on the performance assessment of stochastic multiobjective optimizers
TRANSCRIPT

1
An invited talk at the Evolutionary Multi-Criterion Optimization Conference (EMO 2005), Guanajuato, Mexico
A Tutorial on the Performance Assessment of Stochastic Multiobjective Optimizers
Carlos M. FonsecaJoshua D. Knowles (speaker)
Lothar ThieleEckart Zitzler
Universit y of AlgarveUniversit y of Algarve
2/80An invited talk at the Evolutionary Multi-Criterion Optimization Conference (EMO 2005), Guanajuato, Mexico
Aims
Main goal: how to evaluate/compare the approximation sets from multiple runs of two or more stochastic multiobjective optimizers
We recommend two complementary approaches:
Empirical attainment function Dominance-compliant quality indicators
• Applies statistical tests direc tly to the samples of approximation sets• Gives detailed information about how and w here performance differences occur
• First, reduces each approximation set to a single value of quality• Applies statistical tests to the samples of quality values

2
3/80An invited talk at the Evolutionary Multi-Criterion Optimization Conference (EMO 2005), Guanajuato, Mexico
Scope• Do provide:
– Description of the empirical attainment function
– Recommendations for quality indicators to use
– Software for indicators and empirical attainment function approaches
– Statistical testing procedures/software for both EAFs and indicators
– Case study giving a worked example, using the software provided
• Do not consider:– Number of alternative solutions found in decision space
– Time or computational cost of optimizer
– Test function choice
– Scalability of optimizers to number of objectives / decision variables
– …And many other issues!
4/80An invited talk at the Evolutionary Multi-Criterion Optimization Conference (EMO 2005), Guanajuato, Mexico
Source Materials

3
5/80An invited talk at the Evolutionary Multi-Criterion Optimization Conference (EMO 2005), Guanajuato, Mexico
Overview
• Part 1 - Introduction– Aims and scope
– Definitions and basics of Pareto dominance– The limitations of dominance relations
• Part 2 – Methods– Special case: nondominated sorting of approximation sets
– 1st approach – empirical attainment functions
– 2nd approach – (dominance-compatible) quality indicators
• Part 3 – In Practice– Software guide – (PISA framework)
– Case study
“And what is good, Phaedrus, and what is not good? Need we as k any one to tell us these things?” – Socr at es
6/80An invited talk at the Evolutionary Multi-Criterion Optimization Conference (EMO 2005), Guanajuato, Mexico
Definitions
4
7/80An invited talk at the Evolutionary Multi-Criterion Optimization Conference (EMO 2005), Guanajuato, Mexico
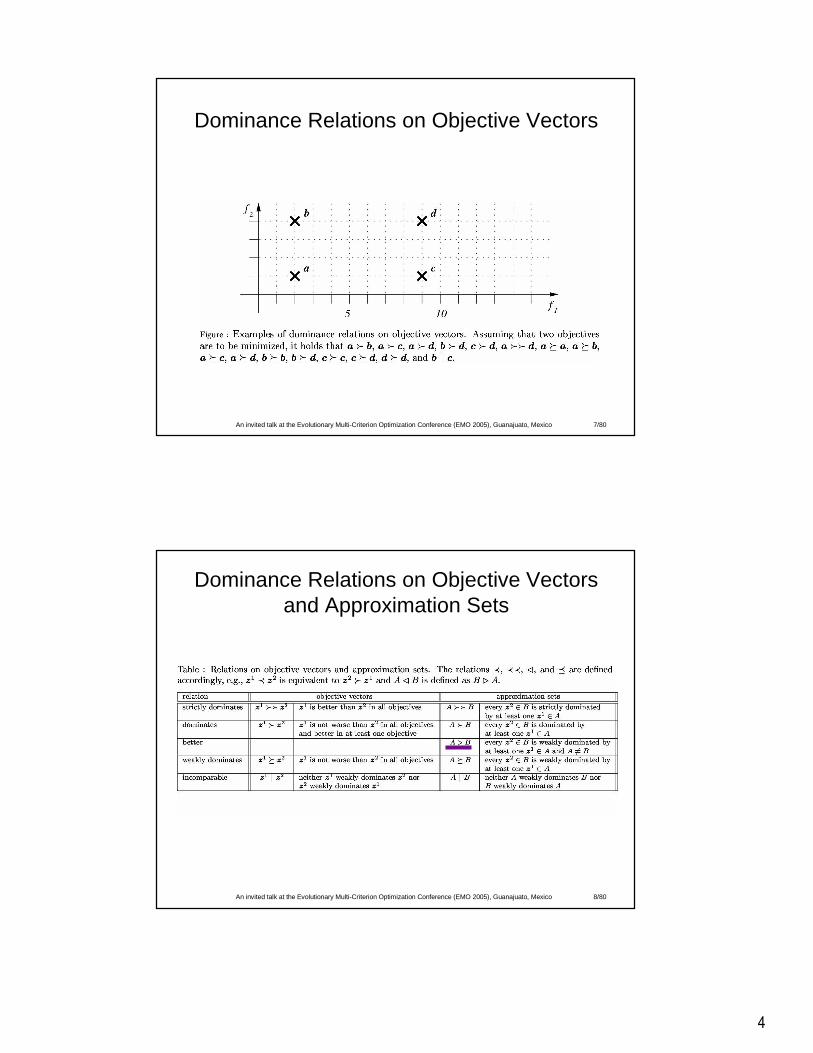
Dominance Relations on Objective Vectors
8/80An invited talk at the Evolutionary Multi-Criterion Optimization Conference (EMO 2005), Guanajuato, Mexico
Dominance Relations on Objective Vectors and Approximation Sets

5
9/80An invited talk at the Evolutionary Multi-Criterion Optimization Conference (EMO 2005), Guanajuato, Mexico
Dominance Relations on Approximation Sets
10/80An invited talk at the Evolutionary Multi-Criterion Optimization Conference (EMO 2005), Guanajuato, Mexico
Overlapping Subsets Induced by Dominance Relations (Zitzler et al, 2003)

6
11/80An invited talk at the Evolutionary Multi-Criterion Optimization Conference (EMO 2005), Guanajuato, Mexico
Limitations of Dominance Relations on Approximation Sets
BABoth
But on right, A is much betterBut A better to “most decision-makers in most situations”.
BA
12/80An invited talk at the Evolutionary Multi-Criterion Optimization Conference (EMO 2005), Guanajuato, Mexico
The Stochastic Element of Performance
Th ree run s of tw o st och asti c op timiz ers
Frequency of attaining regions

7
13/80An invited talk at the Evolutionary Multi-Criterion Optimization Conference (EMO 2005), Guanajuato, Mexico
Summary of Part 1
• Pareto dominance relations extend from objective vectors to approximation sets
• Dominance is scaling (linear or non-linear) independent, enabling comparison of vectors/sets even when objectives are non-commensurable
• Dominance does not use or account for preference information– It cannot detect degrees of “better” (it is just a binary relation)
– It cannot detect differences between non-comparable sets
• Algorithms are stochastic – different sets are attained with different frequencies. How can this be measured?
14/80An invited talk at the Evolutionary Multi-Criterion Optimization Conference (EMO 2005), Guanajuato, Mexico
Part 2 - Methods
• Using dominance relations only to compare stochastic optimizers – a special case
• Empirical attainment functions – describing the frequency distribution of attained regions
• Quality indicators – reducing the dimension of approximation sets but still respecting dominance– Principles of quality indicators, and interpretation functions– Non-Pareto-compatible indicators– Recommended indicators – Combinations of indicators– Reference points and reference sets– Statistical methods for inferences from multiple runs– Multiple testing issues

8
15/80An invited talk at the Evolutionary Multi-Criterion Optimization Conference (EMO 2005), Guanajuato, Mexico
A Special Case: Nondominated Sorting of Approximation Sets
Two optimizers on ZDT5
1B1A
Some pairs of sets aremutually dominating:
• When comparing optimizers, often performance differences are small• Then, many pairs of sets will be incomparable• However, in some special cases (due to the objective function or the optimizers), pairs of sets tend do dominate each other• If there are many pairs dominating each other, then nondominated sorting of the sets can be applied
16/80An invited talk at the Evolutionary Multi-Criterion Optimization Conference (EMO 2005), Guanajuato, Mexico
Nondominated Sorting of Approximation Sets – Rank Test
420.0Rank sum for B:
64.0Rank sum for A:
B 20.09
B 18.58
B 18.58
B 17.07
B 16.06
B 15.05
A 13.04
B 13.04
B 13.04
A 10.53
A 10.53
A 7.52
A 7.52
B 7.52
B 7.52
A 3.01
A 3.01
A 3.01
A 3.01
A 3.01
LabelRankNDS rank
420.0Rank sum for B:
64.0Rank sum for A:
B 20.09
B 18.58
B 18.58
B 17.07
B 16.06
B 15.05
A 13.04
B 13.04
B 13.04
A 10.53
A 10.53
A 7.52
A 7.52
B 7.52
B 7.52
A 3.01
A 3.01
A 3.01
A 3.01
A 3.01
LabelRankNDS rank
Step 1: Apply nondominated sorting to approximation sets i.e. “peel off” all sets that are nondominated and rank them 1, repeat with the remainder and give them rank 2, and so on.
Step 2: Compute ranks, giving ties the same rank
Step 3:Compute the test statistic – the sum of ranks for each algorithm
Step 4: Test the significance of the sum of ranks, e.g. using the Mann-Whitney U tables.
Differences in the sum of ranks significant at 05.0=α
9
17/80An invited talk at the Evolutionary Multi-Criterion Optimization Conference (EMO 2005), Guanajuato, Mexico
Nondominated Sorting of Approximation Sets – Fisher’s Test
000,10
)(0
0ttt
tTP>
=>B 9
B 8
B 8
B 7
B 6
B 5
A 4
B 4
B 4
A 3
A 3
A 2
A 2
B 2
B 2
A 1
A 1
A 1
A 1
A 1
LabelNDS rank
B 9
B 8
B 8
B 7
B 6
B 5
A 4
B 4
B 4
A 3
A 3
A 2
A 2
B 2
B 2
A 1
A 1
A 1
A 1
A 1
LabelNDS rank
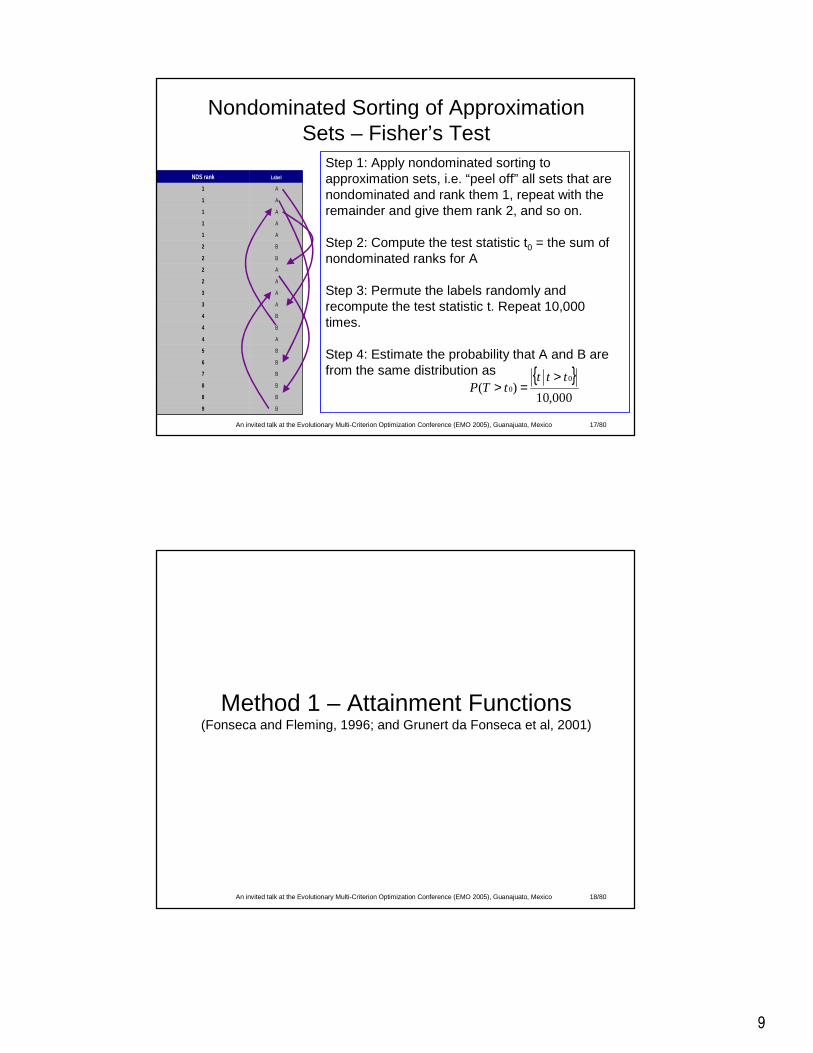
Step 1: Apply nondominated sorting to approximation sets, i.e. “peel off” all sets that are nondominated and rank them 1, repeat with the remainder and give them rank 2, and so on.
Step 2: Compute the test statistic t0 = the sum of nondominated ranks for A
Step 3: Permute the labels randomly and recompute the test statistic t. Repeat 10,000 times.
Step 4: Estimate the probability that A and B are from the same distribution as
18/80An invited talk at the Evolutionary Multi-Criterion Optimization Conference (EMO 2005), Guanajuato, Mexico
Method 1 – Attainment Functions(Fonseca and Fleming, 1996; and Grunert da Fonseca et al, 2001)

10
19/80An invited talk at the Evolutionary Multi-Criterion Optimization Conference (EMO 2005), Guanajuato, Mexico
Stochastic Optimizers
Random point sets
20/80An invited talk at the Evolutionary Multi-Criterion Optimization Conference (EMO 2005), Guanajuato, Mexico
Attainment Functions

11
21/80An invited talk at the Evolutionary Multi-Criterion Optimization Conference (EMO 2005), Guanajuato, Mexico
Global Statistical Inference from KS-like Tests
• A Kolmogorov-Smirnov test examines the maximum difference between two cumulative distribution functions
• A KS-like test can be used to probe differences between the empirical attainment functions of a pair of optimizers, A and B
• The null hypothesis is that the attainment functions of A and Bare identical
• The alternative hypothesis is that the distributions differ somewhere
22/80An invited talk at the Evolutionary Multi-Criterion Optimization Conference (EMO 2005), Guanajuato, Mexico
Investigating Differences in the Distributions of Two Sets
• If the null hypothesis of the KS-test is rejected, it is possible to investigate exactly what differences there are in the two attainment functions
• The regions where the largest differences in the frequency with which they are obtained can be found
• In 2d (i.e. two objectives), these differences can be shown clearly with pairs of plots (See next slide)
• For three or more objectives, differences can best be seen using interactive, graphical software

12
23/80An invited talk at the Evolutionary Multi-Criterion Optimization Conference (EMO 2005), Guanajuato, Mexico
Visualizing Differences in the Empirical Attainment Functions (Lopez-Ibanez 2005)
• Concatenate all runs from A and Band compute the grand best and grand w orst attainment surfaces• Compute all goals where there is a statistically significant difference in probability of attaining that region betw een algorithm A and B• Either: plot the difference inempirical frequency of attaining those goal where A is better in the left plot (and where B is better in the right plot)•Or: plot the p-values where A is better in left plot (respectively B is better in right plot)
These indicate either the difference in frequencies of attaining the goal or the p-value of the difference, coded as a shaded level
24/80An invited talk at the Evolutionary Multi-Criterion Optimization Conference (EMO 2005), Guanajuato, Mexico
Attainment Surface Plots
• Three runs of an optimizer are shown• Can show the surface that bounds the region obtained in 1/3 of the runs• Can do the same for the 2/3 and 3/3 "attainment surfaces"• In general, we can plot the surface obtained in 50% of runs

13
25/80An invited talk at the Evolutionary Multi-Criterion Optimization Conference (EMO 2005), Guanajuato, Mexico
Computational Issues
The computation of the empirical attainment function (EAF) in arbitrary dimensions is possible but not easy.
• Transitions (discontinuities) do not exist at the data points only
• In higher dimensions, the number of transition points may easily become too large to store
• However, the storage of all transition points may not always be necessary, e.g. for KS-like test
26/80An invited talk at the Evolutionary Multi-Criterion Optimization Conference (EMO 2005), Guanajuato, Mexico
Summary of Attainment Function Methods
• KS-like statistical test detects arbitrary differences in the attainment functions of two optimizers
• Local differences between EAFs can be investigated, especially in an interactive graphical environment
• In theory, attainment function methods work in any number of dimensions. This means that computation time and problem difficulty could beconsidered as extra objectives and investigated all at once!
• For now, EAFs can be computed exactly for two or three` objectives in reasonable time.
• Second order moments can also be shown – Fonseca to present in this conference.

14
27/80An invited talk at the Evolutionary Multi-Criterion Optimization Conference (EMO 2005), Guanajuato, Mexico
Method 2 – Quality Indicators
28/80An invited talk at the Evolutionary Multi-Criterion Optimization Conference (EMO 2005), Guanajuato, Mexico
The Need for Quality Indicators
independent ofuser preferences
Yes (strictly) No
dependent onuser preferences How much? In what aspects?
Is A better than B?
Ideally: quality indicators allow to make both type of statements

15
29/80An invited talk at the Evolutionary Multi-Criterion Optimization Conference (EMO 2005), Guanajuato, Mexico
Quality Measures: Examples
UnaryHypervolume measure
BinaryCoverage measure
S(A) = 70%C(A,B) = 25%C(B,A) = 75%
S(B) = 30%
A B
30/80An invited talk at the Evolutionary Multi-Criterion Optimization Conference (EMO 2005), Guanajuato, Mexico
Dependent on User Preferences
Goal: Quality measures compare two Pareto set approximations A and B.
hypervolume 432.34 420.13distance 0.3308 0.4532diversity 0.3637 0.3463spread 0.3622 0.3601cardinality 6 5
A B
“A better”
application ofquality
measures(here: unary)
comparison andinterpretation of
quality values

16
31/80An invited talk at the Evolutionary Multi-Criterion Optimization Conference (EMO 2005), Guanajuato, Mexico
How Should We Interpret Unary Indicators? (Zitzler et al 2003)
Def: quality indicatorI: Ωn → ℜ
Def: interpretation functionE: ℜk × ℜk → false, true
Def: comparison method based on I = (I1,…, Ik) and E
C: Ω × Ω → false, truewhere
A, B ℜk × ℜk false, true
qualityindicators
interpretationfunction
32/80An invited talk at the Evolutionary Multi-Criterion Optimization Conference (EMO 2005), Guanajuato, Mexico
Compatibility and Completeness
• A comparison method is compatible with a relation iff
C(A,B) A B, for all A,B in
• A comparison method is complete with respect to a relation iff
A B C(A,B), for all A,B in
• IMPORTANT note:– If a comparison method based on a unary indicator were compatible
with , then the indicator could not provide any preference in the case of two incomparable sets! Therefore, it is "better" to be compatible only with .

17
33/80An invited talk at the Evolutionary Multi-Criterion Optimization Conference (EMO 2005), Guanajuato, Mexico
Example of a Dominance-Compliant Comparison Method
))()((),( BIAIEBAC HHIH >≡
),( BAC HI
ABBAC HI ),(
The hypervolume indicator can be used as the basis of a dominance-compliant comparison method as follows:
is compatible with so:
That is, if the comparison yields true, then we know THAT B is not better than A
),( BAC HI
Is also complete with respect to so ),( BACBA HI
Therefore, all cases where A is better than B are detected by the indicator
34/80An invited talk at the Evolutionary Multi-Criterion Optimization Conference (EMO 2005), Guanajuato, Mexico
Troubles with “Functionally Independent” Indicators

18
35/80An invited talk at the Evolutionary Multi-Criterion Optimization Conference (EMO 2005), Guanajuato, Mexico
An Experiment – Are Functionally Independent Indicators Misleading in Non-Pathological Cases?
• Generate set A by generating 1000 points in the box. For each point, accept it into A with probability p proportional to distance from PF
• Generate B in exactly same way but discard points that dominate A
• Apply four indicators
Repeat 10000 times:
• M ean number of “ errors” from indicators = 1.72
36/80An invited talk at the Evolutionary Multi-Criterion Optimization Conference (EMO 2005), Guanajuato, Mexico
Three Recommended Unary Indicators
• We recommend and provide software for three unary quality indicators:– The hypervolume indicator (Zitzler, 1998)
– The unary epsilon indicator (multiplicative and additive, Zitzler et al, 2003)
– The R2 and R3 indicators (based on those proposed by Hansen and Jaszkiewicz, 1998)
• Each indicator is based on different preference information –therefore using them all will provide more information than using just one
• We also provide tools for pre-processing steps: setting reference points and reference sets
• And tools for non-parametric statistical testing of differences in indicator values

19
37/80An invited talk at the Evolutionary Multi-Criterion Optimization Conference (EMO 2005), Guanajuato, Mexico
The Hypervolume Indicator
• Advantages– Compatibility with and
completeness with
– Conceptually intuitive meaning– Scaling independent
• Weaknesses– Computational cost for large
number of objectives (see While, 2005 – this conference)
– Need reference point – Reference point affects ordering
of pairs of incomparable sets
reference
reference
Recommended quality indicator 1:
38/80An invited talk at the Evolutionary Multi-Criterion Optimization Conference (EMO 2005), Guanajuato, Mexico
Binary -indicatorPrinciples of recommended unary indicator 2
Princ iple: w hat is the smallest amount that I have to translate the set A so that every point in B is covered ?

20
39/80An invited talk at the Evolutionary Multi-Criterion Optimization Conference (EMO 2005), Guanajuato, Mexico
The Unary -indicatorRecommended unary indicator 2:
40/80An invited talk at the Evolutionary Multi-Criterion Optimization Conference (EMO 2005), Guanajuato, Mexico
The Unary -indicator
• Advantages:– If used with Pareto front as reference set, comparison method
is compatible with for pairs A,B with A=P and B=P.– If used with general reference set, compatible with and
complete with
– Indicator is fast to compute
– Intuitive meaning: how much do I need to translate/scale the set A so that it covers the reference set?
• Weaknesses:– Need to choose a reference set, and this affects the outcome of
the indicator– Objective vectors need to be in positive hyper-quadrant
Recommended unary indicator 2:

21
41/80An invited talk at the Evolutionary Multi-Criterion Optimization Conference (EMO 2005), Guanajuato, Mexico
Uniformly Distributed Utility FunctionsPrinciples of recommended unary indicator 3
On each member of a set, , of uniformlydistributed scalarizing vectors, :
…measure the distance of the point (in each set) that is closest to the reference point,...
… and add up the differences in these distances.Asymptotically compatible w ith and complete w ith
42/80An invited talk at the Evolutionary Multi-Criterion Optimization Conference (EMO 2005), Guanajuato, Mexico
The RR Indicators (Hansen and Jaszkiewicz, 1998)
Define the utility u*(A, ) of the approximation set A on scalarizingvector as the minimum distance of a point in the set A from the reference point. Then:
Recommended unary indicator 3
To obtain a unary indicator from these, replace B w ith a reference set, R :
These effectively measure the difference in the mean distance of the attainment surfaces A and R, from the reference point.

22
43/80An invited talk at the Evolutionary Multi-Criterion Optimization Conference (EMO 2005), Guanajuato, Mexico
Choosing Reference Points
• If bounds of the objective space are known, use these
• If not:– concatenate all approximation sets and compute the
ideal and nadir points– shift the ideal/nadir point so that it strictly dominates/is
strictly dominated by all points in the approximation sets
• It would be good practice to report the bound points used, to allow future comparisons to be made
44/80An invited talk at the Evolutionary Multi-Criterion Optimization Conference (EMO 2005), Guanajuato, Mexico
Choosing Reference Sets
Potentially the choice can affect the outcome of a comparison study. However, there are several choices which are a prioriunbiased for any particular algorithm:
• The true Pareto front, if it is known• An approximation set from the
literature, thought to be a good approximation
• The 50% attainment surface of random search– half of all points in the decision
space will weakly dominate this surface
– we provide a software tool for generating this

23
45/80An invited talk at the Evolutionary Multi-Criterion Optimization Conference (EMO 2005), Guanajuato, Mexico
Statistical Inference from Quality Indicators
• Non-parametric statistical tests do not require normality of data samples
• For two independent samples: – Mann-Whitney U test, or – Fisher’s permutation test
• For two matched samples: – Wilcoxon signed-rank test, or – Fisher’s matched samples test
• For three or more independent samples:– Kruskal-Wallis test
46/80An invited talk at the Evolutionary Multi-Criterion Optimization Conference (EMO 2005), Guanajuato, Mexico
A Note on Using Combinations of Indicators
• We have seen that indicators can be transformed into comparison methods by defining interpretation functions
• It is possible to define interpretation functions for combinations of indicators
• For (partially) dominance-compliant indicators, pairs of indicator values can be used to make inferences – e.g. if two comparison methods that are -compatible give true and false, respectively, for a pair of sets A, B, then it follows that A || B.
• Ironically, for non-compliant indicators (like the functionally-independent ones), no combined interpretation functions are known to exist
• More about combinations of indicators is given in the forthcoming report

24
47/80An invited talk at the Evolutionary Multi-Criterion Optimization Conference (EMO 2005), Guanajuato, Mexico
Multiple Testing Issues
• What if I have more than two algorithms?– Option 1: use the Kruskal-Wallis test. This provides an overall
judgment if any algorithms differ and, if so, gives all pair-wise one tailed p-values (software provided)
– Option 2: use standard test but adjust the p-values, e.g. using Bonferroni correction (facility not provided)
• What if I have more than one indicator?– Option 1: collect separate samples for each indicator
– Option 2: use correction factors
– Option 3: do tests normally but report that p-values do not reflect true probabilities
W hen multiple statistical tests are carried out on the same samples, p-values of the individual tests do not accurately reflect the probabilities.
M ore information given in the forthcoming report
48/80An invited talk at the Evolutionary Multi-Criterion Optimization Conference (EMO 2005), Guanajuato, Mexico
Summary of Quality Indicators
• Quality indicators are always based on preference information
• Comparison methods based on an indicator and an interpretation function can be compatible and complete with dominance, or not
• We recommend the use of quality indicators that are the basis ofcomparison methods that are compatible with the relation
• Non-parametric tests can be used to test significance of differencesin the distribution of indicator values
• Reference points and reference sets are needed for some indicators – we have given some methods for defining these

25
An invited talk at the Evolutionary Multi-Criterion Optimization Conference (EMO 2005), Guanajuato, Mexico
PART 3
CASE STUDY
50/80An invited talk at the Evolutionary Multi-Criterion Optimization Conference (EMO 2005), Guanajuato, Mexico
Overview
• PISAMaking Performance Assessment Easy
• ToolflowHow to Use PISA for Assessment
• Sample ScenarioFrom Runs to Statistical Evidence

26
51/80An invited talk at the Evolutionary Multi-Criterion Optimization Conference (EMO 2005), Guanajuato, Mexico
The Concept of PISA
SPEA2
NSGA-II
PAES
Algorithms Applications
knapsack
TSP
networkprocessordesign
Platform and programming language independent Interfacefor Search Algorithms [Bleuler et al.: 2002]
52/80An invited talk at the Evolutionary Multi-Criterion Optimization Conference (EMO 2005), Guanajuato, Mexico
PISA: Implementation
sharedfile
system
sharedfile
system
application independent• selection• individuals described
by IDs and objective vectors
selectorprocessselectorprocess
textfiles
variatorprocessvariatorprocess
handshake protocol• state / action
• individual IDs
• objective vectors
application dependent• variation operators
• stores and manages individuals

27
53/80An invited talk at the Evolutionary Multi-Criterion Optimization Conference (EMO 2005), Guanajuato, Mexico
PISA Website
http://www.tik.ee.ethz.ch/pisa
http://www.tik.ee.ethz.ch/pisa
54/80An invited talk at the Evolutionary Multi-Criterion Optimization Conference (EMO 2005), Guanajuato, Mexico
PISA Monitor
• Observe communication between Variator and Selector and store intermediate populations.
• Automatically invoke optimization runs.
Selector VariatorMonitor
populationsparameters

28
57/80An invited talk at the Evolutionary Multi-Criterion Optimization Conference (EMO 2005), Guanajuato, Mexico
Overview
• PISAMaking Performance Assessment Easy
• ToolflowHow to Use PISA for Assessment
• Sample ScenarioFrom Runs to Statistical Evidence
58/80An invited talk at the Evolutionary Multi-Criterion Optimization Conference (EMO 2005), Guanajuato, Mexico
Tools for Generated Runs• Postprocessing of objective vector sets
• bound: calculates lower and upper bounds of obj. vectors• normalize: transforms all objective values to the interval [1,2]• filter: computes the nondominated front of obj. vectors
• Computation of quality indicators• eps_ind: unary epsilon indicators• hyp_ind: unary hypervolume indicators• r_ind: R indicators
• Statistics• 5 different tests: 2x Fisher, Kruskal, Mann and Wilcoxon
• Attainment Function• eaf: computes attainment function• eaf-test: tests two functions for difference

29
59/80An invited talk at the Evolutionary Multi-Criterion Optimization Conference (EMO 2005), Guanajuato, Mexico
Recommended Tool Flowruns
bound
normalize
filter
eaf
eaf-test
indicators(eps, hyp, r)
statistics(fisher, kruskal, mann, wilcoxon)
• All intermediate data files are collected in a common directory.
• The whole process can be controlled by batch files (samples for all platforms are provided).
60/80An invited talk at the Evolutionary Multi-Criterion Optimization Conference (EMO 2005), Guanajuato, Mexico
Output of Tool FlowPopulation Plots
Surface Plots
Comparison
Box Plots
Comparison
runs
bound
normalize
filter
eaf
eaf-test
indicators(eps, hyp, r)
statistics(fisher, kruskal, mann, wilcoxon)

30
63/80An invited talk at the Evolutionary Multi-Criterion Optimization Conference (EMO 2005), Guanajuato, Mexico
Overview
• PISAMaking Performance Assessment Easy
• ToolflowHow to Use PISA for Assessment
• Sample ScenarioFrom Runs to Statistical Evidence
64/80An invited talk at the Evolutionary Multi-Criterion Optimization Conference (EMO 2005), Guanajuato, Mexico
Sample Scenario
• For demonstration purpose only!– Selectors
• NSGA2• SPEA2
• IBEA
– Benchmark Variators• DTLZ2 (3D, 100 decision variables)
• ZDT6 (2D, 100 decision variables)• Knapsack (500 decision variables)
– All 9 selector-variator combinations tested– Each one with 30 runs and 200 generations

31
65/80An invited talk at the Evolutionary Multi-Criterion Optimization Conference (EMO 2005), Guanajuato, Mexico
Population PlotsPopulation Plots
Surface Plots
Comparison
Box Plots
Comparison
runs
bound
normalize
filter
eaf
eaf-test
indicators(eps, hyp, r)
statistics(fisher, kruskal, mann, wilcoxon)
66/80An invited talk at the Evolutionary Multi-Criterion Optimization Conference (EMO 2005), Guanajuato, Mexico
Population Plots
• ZDT6 for IBEA, SPEA2, NSGA2
0.3 0.4 0.5 0.6 0.7 0.8 0.9
2.75
3.25
3.5
3.75
4
4.25
32
67/80An invited talk at the Evolutionary Multi-Criterion Optimization Conference (EMO 2005), Guanajuato, Mexico
8500 9000 9500 10000 10500
8500
9000
9500
10000
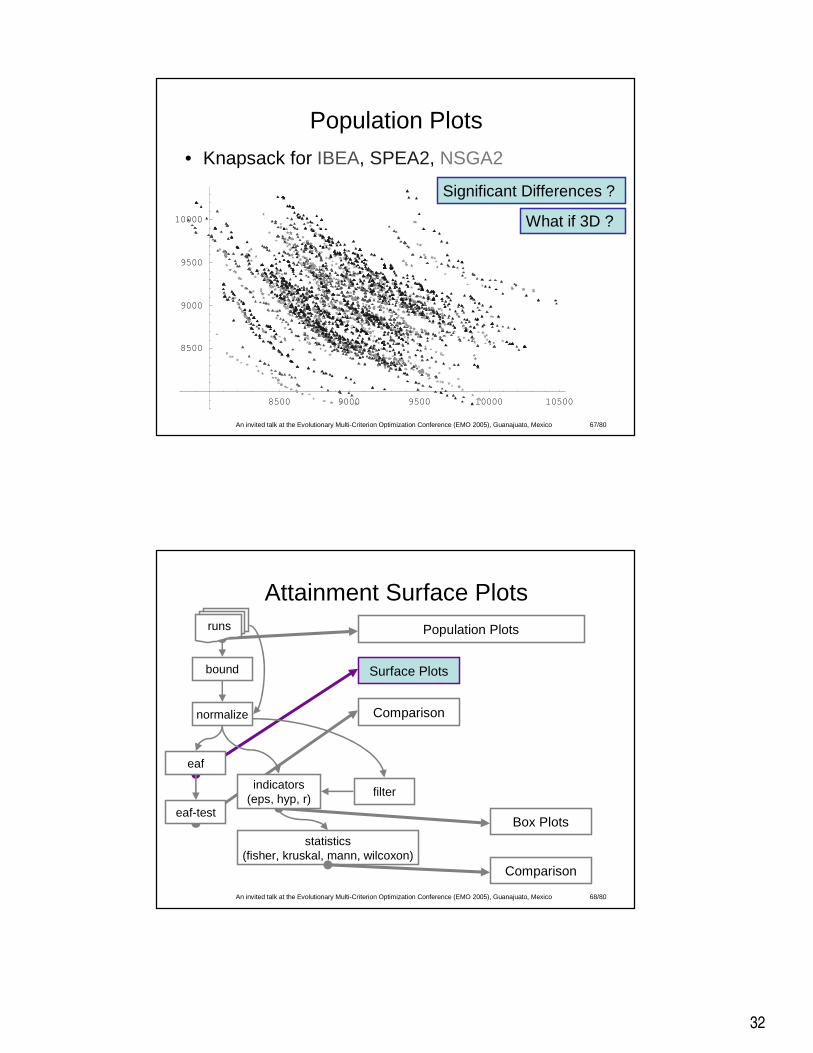
Population Plots
• Knapsack for IBEA, SPEA2, NSGA2
Significant Differences ?
What if 3D ?
68/80An invited talk at the Evolutionary Multi-Criterion Optimization Conference (EMO 2005), Guanajuato, Mexico
Attainment Surface PlotsPopulation Plots
Surface Plots
Comparison
Box Plots
Comparison
runs
bound
normalize
filter
eaf
eaf-test
indicators(eps, hyp, r)
statistics(fisher, kruskal, mann, wilcoxon)

33
69/80An invited talk at the Evolutionary Multi-Criterion Optimization Conference (EMO 2005), Guanajuato, Mexico
Attainment Plots
• 50% surfaceZDT6 for IBEA, SPEA2, NSGA2
1.2 1.4 1.6 1.8 2
1.15
1.2
1.25
1.3
1.35
70/80An invited talk at the Evolutionary Multi-Criterion Optimization Conference (EMO 2005), Guanajuato, Mexico
1.4 1.5 1.6 1.7 1.8
1.4
1.5
1.6
1.7
1.8
1.9
Attainment Plots• 50% surface
knapsack for IBEA, SPEA2, NSGA2
Significant Differences ?
What if 3D ?

34
71/80An invited talk at the Evolutionary Multi-Criterion Optimization Conference (EMO 2005), Guanajuato, Mexico
Attainment Surface ComparisonPopulation Plots
Surface Plots
Comparison
Box Plots
Comparison
runs
bound
normalize
filter
eaf
eaf-test
indicators(eps, hyp, r)
statistics(fisher, kruskal, mann, wilcoxon)
72/80An invited talk at the Evolutionary Multi-Criterion Optimization Conference (EMO 2005), Guanajuato, Mexico
Statistical Evidence (attainment function)
• IBEA – NSGA2– significant difference (p=0)
• IBEA – SPEA2– significant difference (p=0)
• SPEA2 – NSGA2– significant difference (p=0)
ZDT6 Knapsack
• IBEA – NSGA2– no significant difference
• IBEA – SPEA2– no significant difference
• SPEA2 – NSGA2– no significant difference

35
73/80An invited talk at the Evolutionary Multi-Criterion Optimization Conference (EMO 2005), Guanajuato, Mexico
Box PlotsPopulation Plots
Surface Plots
Comparison
Box Plots
Comparison
runs
bound
normalize
filter
eaf
eaf-test
indicators(eps, hyp, r)
statistics(fisher, kruskal, mann, wilcoxon)
74/80An invited talk at the Evolutionary Multi-Criterion Optimization Conference (EMO 2005), Guanajuato, Mexico
Comparison
1 2 30
0.050.1
0.150.2
0.250.3
0.35
1 2 30.2
0.4
0.6
0.8
1
1 2 30
0.020.040.060.080.10.12
1 2 30.10.2
0.30.4
0.50.6
1 2 3
0.2
0.4
0.6
0.8
1
1 2 3
0.1
0.2
0.3
0.4
1 2 3
0.02
0.04
0.06
0.08
1 2 3
0.20.40.60.8
11.2
1 2 30
0.000020.000040.000060.000080.00010.000120.00014
DTLZ2
Knapsack
ZDT6
Eps Hyp R
IBEA NSGA2 SPEA2 IBEA NSGA2 SPEA2 IBEA NSGA2 SPEA2

36
76/80An invited talk at the Evolutionary Multi-Criterion Optimization Conference (EMO 2005), Guanajuato, Mexico
ComparisonPopulation Plots
Surface Plots
Comparison
Box Plots
Comparison
runs
bound
normalize
filter
eaf
eaf-test
indicators(eps, hyp, r)
statistics(fisher, kruskal, mann, wilcoxon)
77/80An invited talk at the Evolutionary Multi-Criterion Optimization Conference (EMO 2005), Guanajuato, Mexico
Comparison
1 2 30
0.050.1
0.150.2
0.250.3
0.35
1 2 30.2
0.4
0.6
0.8
1
1 2 30
0.020.040.060.080.10.12
1 2 30.10.2
0.30.4
0.50.6
1 2 3
0.2
0.4
0.6
0.8
1
1 2 3
0.1
0.2
0.3
0.4
1 2 3
0.02
0.04
0.06
0.08
1 2 3
0.20.40.60.8
11.2
1 2 30
0.000020.000040.000060.000080.00010.000120.00014
DTLZ2
Knapsack
ZDT6
Eps Hyp R
IBEA NSGA2 SPEA2 IBEA NSGA2 SPEA2 IBEA NSGA2 SPEA2

37
78/80An invited talk at the Evolutionary Multi-Criterion Optimization Conference (EMO 2005), Guanajuato, Mexico
Statistical Evidence (Kruskal Test)ZDT6Eps
DTLZ2R
11SPEA2
~01NSGA2
~0~0IBEA
SPEA2NSGA2IBEA
Overall p-value = 6.22079e-17.Null hypothesis rejected (alpha 0.05)
is better than
~01SPEA2
11NSGA2
~0~0IBEA
SPEA2NSGA2IBEA
Overall p-value = 7.86834e-17.Null hypothesis rejected (alpha 0.05)
is better than
Knapsack/Hyp: H0 = No significance of any differences
79/80An invited talk at the Evolutionary Multi-Criterion Optimization Conference (EMO 2005), Guanajuato, Mexico
Code Source, Binaries and Documentation
http://www.tik.ee.ethz.ch/pisahttp://www.tik.ee.ethz.ch/pisa

38
80/80An invited talk at the Evolutionary Multi-Criterion Optimization Conference (EMO 2005), Guanajuato, Mexico
Thanks for listening !