a thesis submitted to the faculty of the graduate school of ... effects of clipping distortion on an...
TRANSCRIPT
i
Effects of Clipping Distortion on an Automatic Speaker Recognition System
by
JOSE LUIS RAMIREZ
B.A.S., Expression College for Digital Arts, 2012
A thesis submitted to the
Faculty of the Graduate School of the
University of Colorado In partial fulfillment
In partial fulfillment
of the requirements for the degree of
Master of Science Recording Arts
2016

ii
© 2016
JOSE LUIS RAMIREZ
ALL RIGHTS RESERVED

iii
This thesis for the Master of Science degree by
Jose Luis Ramirez
has been approved for the
Recording Arts Program
By
Catalin Grigoras, Chair
Jeff M. Smith
Lorne, Bregitzer
April 28. 2016

iv
Ramirez, Jose (M.S., Recording Arts)
Effects of Clipping Distortion on Likelihood Ratios from an Automatic Speaker Recognition System: An Analysis of the effects distortion has on Automatic Speaker Recognition results.
Thesis directed by Associate Professor Catalin Grigoras
ABSTRACT
Clipping distortion is a common problem faced in the audio recording world in
which an audio signal is recorded at higher amplitude than the recording system’s
limitations, resulting in a portion of the acoustic event not being recorded. Several
government agencies employ the use of Automatic Speaker Recognition (ASR) systems
in order to identify the speaker of an acquired recording. This is done automatically using
a nonbiased approach by running a questioned recording through an ASR system and
comparing it to a pre-existing database of voice samples of whom the speakers are
known. A matched speaker is indicated by a high correlation of likelihood between the
questioned recording and the ones from the known database. It is possible that during the
process of making the questioned recording the speaker was speaking too loudly into the
recording device, a gain setting was set too high, or there was post-processing done to the
point that clipping distortion is introduced into the recording. Clipping distortion results
from the amplitude of an audio signal surpassing the maximum sampling value of the
recording system. This affects the quantized audio signal by truncating peaks at the max
value rather than the actual amplitude of the input signal. In theory clipping distortion
will affect likelihood ratios in a negative way between two compared recordings of the
same speaker. This thesis will test this hypothesis. Currently there is no research that has

v
helped as a guideline for knowing the limitations when using clipped recordings. This
thesis will investigate to what degree of effect will clipped material have on the system
performance of a Forensic Automatic Speaker Recognition system.
The form and content of this abstract are approved. I recommend its publication.
Approved: Catalin Grigoras

vi
DEDICATION
I would like to dedicate this paper to both of my parents Rogelio Sergio Ramirez
II and Martha Ramirez for their moral support.

vii
ACKNOWLEDGEMENTS
I would like to thank my advisor Catalin Grigoras for all his help and support with
my thesis. His guidance has aided me in many small obstacles I encountered while
carrying out this study. I’d also like to thank Jeff Smith for being available throughout the
entirety of my masters program. Any time I hit a snag in any of my coursework and
needed some help he was always an email away with a prompt reply. I’d like to thank
Leah Haloin for keeping my fellow peers and I on track with up to date reminders of
deadlines necessary for the masters program and aiding us in any questions or problems
we may have had along the way.

viii
TABLE OF CONTENTS
CHAPTER
I. INTRODUCTION...................................................................................................1
Forensic Automatic Speaker Recognition Systems…………………..…...1
FASR Speaker Models…………………………………………...….…....2
FASR Order of Operations………………………………………………..3
Audio Signal Clipping Distortion…………………………………………3
Other Common Concerns and Problems Encountered in ASR Systems….4
Purpose of this Thesis……………………………………………………..8
Motivation…………………………………………………………………9
II. MATERIALS AND METHODS……...…………………………………………10
Introduction………………………………………………………………10
Signal Processing in Matlab……………………………………………...10
BATVOX………………………………………………………………...12
Using BATVOX to Test Clipped Audio Signals………………………...13
Adobe Audition 3.0…………………………….………………………...17
Acquiring Samples……………………………………………………….18
Preliminary Sample Preparation…………………………………………20
III. FINDINGS AND LIMITATIONS OF USING CLIPPED SPEECH WITH AN
FASR SYSTEM………………………..………………………………………………...23
Results…………………...……………………………………………….23
Speaker 17 Outlier…………………………………………………….…25
Findings and Limitations………………………………..……………….30

ix
IV. CONCLUSION AND FUTURE RESEARCH…………………………...…......34
Conclusion……………………………………………………………….34
Proposals for Future Research…………………………………………...35
BIBLIOGRAPHY……………………………………………………………………......36

x
LIST OF ABBREVIATIONS
ASR – Automatic Speaker Recognition dB – Decibel DAW – Digital Audio Workstation DTW – Dynamic time warping EER – Equal Error Rate FASR – Forensic Automatic Speaker Recognition GMM – Gaussian Mixture Model HMM – Hidden Markov Model LR – Likelihood Ratios MFCC - Mel-frequency cepstral coefficient PCM – Pulse-Code Modulation SPID – Speaker Identification SNR – Signal to Noise Ratio UBM - Universal Background Model VQ – Vector Quantization WAV – Waveform Audio File Format
xi
LIST OF FIGURES
Figure
1- MATLAB signal processing………………………………………………………....12
2- BATVOX plot showing a high liklihood of evidence and suspect recordings coming
from the same speaker.…………………………………………..…………………..15
3- BATVOX plot showing a low likelihood of evidence and suspect recordings coming
from the same speaker.………...…………………………………….……………....16
4- Samples collected for study……………………………………………………….....17
5- DAW requirements…………………………………………………………………..18
6- Quality sample requirements………………………………………………………...20
7- Necessary preliminary sample preparation steps………………………………….....22
8- Model recording for speaker 17 spectrum analysis………..………………………...26
9- Test recording for speaker 17 spectrum analysis…………………………………….27
10- Model recording for speaker 17 frequency analysis…..………...…………………...28
11- Test recording for speaker 17 frequency analysis........................................................28
12- Average LR scores for 1%-20% clipping test recordings reported as a % of average
LR scores for all unclipped test recordings...………………………….………….....29
13- Outlier speaker 17 compared to the rest of the test sample….……………………....30
14- BATVOX plot of Speaker 15 with no clipping showing an LR value of 13,291.......32
15- BATVOX plot of Speaker 15 with 10% clipping showing an LR value of 118….....32
16- BATVOX plot of Speaker 15 with 20% clipping showing an LR value of 0..….…..33
xii
LIST OF TABLES
Table
1 - Speaker LR results …………...…………………………………………………..24-25
2- Average LR values for clipped tests represented as a percentage of average LR values
of the unclipped tests…………………………………………………………………….31
1
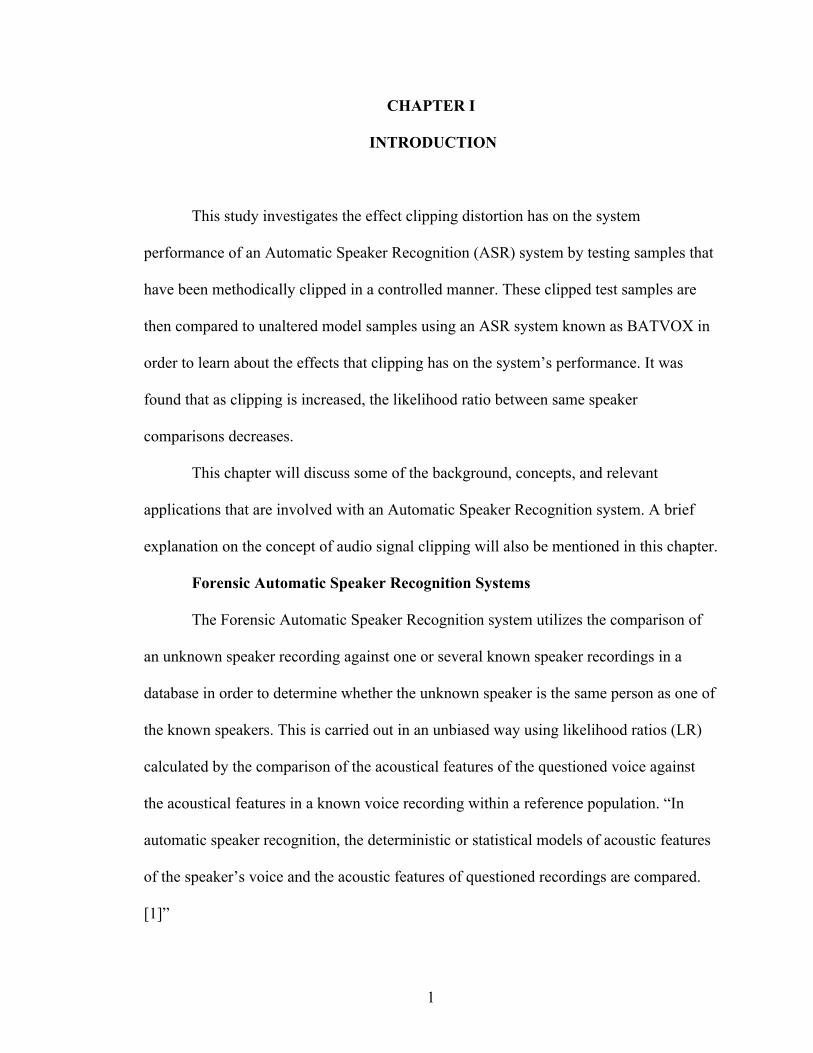
CHAPTER I
INTRODUCTION
This study investigates the effect clipping distortion has on the system
performance of an Automatic Speaker Recognition (ASR) system by testing samples that
have been methodically clipped in a controlled manner. These clipped test samples are
then compared to unaltered model samples using an ASR system known as BATVOX in
order to learn about the effects that clipping has on the system’s performance. It was
found that as clipping is increased, the likelihood ratio between same speaker
comparisons decreases.
This chapter will discuss some of the background, concepts, and relevant
applications that are involved with an Automatic Speaker Recognition system. A brief
explanation on the concept of audio signal clipping will also be mentioned in this chapter.
Forensic Automatic Speaker Recognition Systems
The Forensic Automatic Speaker Recognition system utilizes the comparison of
an unknown speaker recording against one or several known speaker recordings in a
database in order to determine whether the unknown speaker is the same person as one of
the known speakers. This is carried out in an unbiased way using likelihood ratios (LR)
calculated by the comparison of the acoustical features of the questioned voice against
the acoustical features in a known voice recording within a reference population. “In
automatic speaker recognition, the deterministic or statistical models of acoustic features
of the speaker’s voice and the acoustic features of questioned recordings are compared.
[1]”

2
FASR Speaker Models
FASR systems can generally be split into two categories. The first one is known
as being a text-dependent speaker system, which may only be used when there are
cooperative users who are willing to read a specifically chosen script of texts. The other
speaker system associated with FASR is the text-independent speaker system. [2] For the
purpose of this thesis we will be testing the text-independent system as it has a more
realistic application to the real world. Because a person not wanting to be connected with
criminal activity would likely be motivated to spoof the system by not speaking naturally
or being uncooperative, text-dependent systems and techniques are unfavorable and, with
advances in text-independent technology, unnecessary. Speaker models can be either
deterministic (nonparametric) or statistical (parametric). There are deterministic speaker
models as well as statistical models for both text-dependent and text-independent FASR
systems. “Dynamic time warping (DTW) and vector quantization (VQ) are representative
examples of deterministic models for text-dependent and text-independent recognition,
respectively…The hidden Markov model (HMM) and the Gaussian mixture model
(GMM) are the most popular statistical models for text-dependent and text-independent
recognition, respectively. [1]” For the purpose of this thesis we will be using statistical
models such as GMM as it is associated with text-independent recognition. The FASR
system should be able to first identify the speaker from a database of known speakers,
then conclude whether or not the identified speaker matches the known speaker from the
database using likelihood ratios in a process known as speaker verification. [2]

3
FASR Order of Operations
The order of operations carried out by the FASR system is as follows. Beginning
with an unknown test suspect recording and a known model recording a comparison is
carried out. A database of known speaker recordings with similar characteristics to the
suspect recording (recording channel, format, spoken language, ect) is compiled and
referred to as the general population model. This database is used for comparison by the
FASR to compare the test unknown suspect recording between the model known speaker
recording and the population of known speakers. Voice features are extracted by the
feature extraction module, which takes raw speech data and calculates feature vectors that
highlight speaker-specific properties in regards to the speaker’s vocal tract system. These
feature vectors are extracted from the test unknown suspect recording and the known
speaker model/population recordings so that a comparison of the feature vectors can be
carried out by the FASR. The result of this comparison is a similarity score expressed as
a likelihood of the test recording matching the model recording. [2] This similarity score
is then interpreted. FASR system users must take into account certain variable factors that
may affect similarity scores such as environment noises, audio signal clipping distortion,
signal weakness and the following. “These ‘degrees of freedom’ may be manipulated at
will or may be subject to variation due to external factors such as stress, fatigue, health,
and so on. [1]” This thesis is focused on how audio signal clipping distortion will affect
likelihood ratios from an FASR.
Audio Signal Clipping Distortion
Audio signal clipping happens when the maximum amplitude of an audio signal
surpasses the maximum sampling value allowed by the recording system. “Audio

4
clipping is a signal degradation process in which an undistorted audio waveform is
truncated whenever the maximum input range of a digital acquisition system is
exceeded… [3]” This gives us an end product where a portion of the acoustical event is
truncated and not recorded due to the input range limitations of the system. Aside from
this missing information there is spectrum distortion in the form of additional harmonics
being introduced into the audio signal. The effects of digital clipping have been
experimented with a 100Hz sine wave investigated by Bie et al. Their research has found
that the fundamental frequency of an audio signal will remain intact other than
experiencing lowered amplitude as a higher clipping rate is introduced. Clipping
distortion will however introduce spectrum distortion via harmonics resulting from the
induced clipping. “We can see that clipping does not change the fundamental frequency,
however it does introduce extra harmonics that attenuate the energy at the original
(fundamental) frequency. Obviously, a larger clipping rate leads to a more aggressive
clipping, and more spectrum distortion. [4]”
Other Common Concerns and Problems Encountered in FASR Systems
There are a few common concerns and problems encountered when using an
Automatic Speaker Recognition system apart from the audio signal clipping distortion.
Herman J. Kunzel carried out many studies looking into some of the problems that may
arise while using an ASR system. One of the concerns involving potential problems was
how the aging of a speaker can affect the parameters of the voice when comparing a
model recording and a test recording that have been recorded many years apart [5]. In
Kunzel’s published article he studies what effects an eleven year delay has between
model and test recordings when ran through an ASR (BATVOX). The older recordings

5
(when speakers were younger) were used as a model, while the newer recordings made
eleven years later were used to create “unknown” tests. It is known that certain events
may occur during the eleven-year delay that may affect some of the vocal characteristics
of the speakers. “Apart from natural physiological aging a host of other potentially
relevant factors have to be considered, especially in the forensic environment. These
include starting or giving up smoking, changes of drinking habits, surgery affecting
structures required for the production of speech, loss of teeth / (new) prosthetic devices,
and various kinds of diseases that either accelerate aging in general or have implications
on parameters of vocal behaviour (changes of the hormonal balance, apoplectic insults
etc.).” His findings were that a delay of eleven years had practically no affect on the
results found by the ASR BATVOX. “Automatic speaker identification with the same set
of non-contemporary voices shows that an 11 year delay has almost no influence on the
identification performance. An effect of a delay in the order of up to nine months is not
measurable. ”
Another concern regarding automatic speaker recognition systems and speaker
identification systems is whether or not the system is able to distinguish between two
identical twins [6]. A study was carried out by Künzel to investigate this concern. The
twin speakers ranged from seven to seventy-six years old and were all tested positive for
monozygoticity to ensure they were identical twins. The Speaker Identification (SPID)
used for Künzel’s experiment was BATVOX 3.1. When testing speech dependent
samples between male and female twins, BATVOX was able to distinguish between the
male population with no problems. “Put differently, the twins of each pair were
distinguished by the system, albeit by individually differing margins… In Test A, where

6
both target voices consisted of the same (read) text, LRs smaller than unity were obtained
for 8 of the ‘blue’ sisters, i.e. they were clearly correctly distinguished from their
siblings.” It should be noted that female twins can sometimes trigger false acceptances by
a ASR system when the test and model consist of speech independent samples. “In the
majority of cases, however, LRs larger than unity were obtained for the ‘blue’ sisters.
Strictly speaking, these are incidences of false acceptance, i.e. non-distinctions of both
female twins… A total of 11 ‘blue’ sisters obtained equal or even higher LRs than their
own ‘red’ sisters. In these cases, both twins were clearly not distinguished by the
automatic system.”
Yet another concern when using an ASR system is how cross-language speech
material will affect how accurate an ASR will perform when comparing a model and test
of the same speaker speaking two different languages [7]. Künzel ran an experiment
using BATVOX in order to investigate how this particular ASR system’s results are
affected by cross-language speech samples. “Using the automatic system Batvox 3 in an
experiment with 75 bilingual speakers of seven languages and four kinds of transmission
channels, it can be shown that, if speaker model and reference population are matched in
terms of language, the remaining mismatch between speaker model and test sample can
be neglected, since equal error rates (EERs) for same-language or cross-language
comparisons are approximately the same, ranging from zero to 5.6%.” In other words, as
long as the general population model matches the language of the speaker model, then the
test sample can be of another language and the ASR system (BATVOX) will still produce
consistent results. It should be noted that due to the fact that ASR, FASR, and SPID
systems vary so much in how the particular system works, it is stated that all systems

7
would have to be individually tested for the effects cross-language may have on them. “In
essence, the claim that automatic speaker-identification systems of the kind described
here are largely independent of language can be confirmed. However, since currently
available systems differ greatly in terms of their architecture, all will have to be tested
individually for cross-language effects.”
Noisy recordings also pose another problem, when it comes to trying to use an
ASR system. Noise may be introduced into the recordings in many forms. Background
noise from a loud environment, such as a busy city street, an induced electrical hum
introduced by mains power from a plugged in audio recorder, clipping distortion, and
even reverberations due to the dimensions and materials of the room the recording is
taking place. All can affect the Signal to Noise Ration (SNR) of a recording. The cleaner
the recording is, the higher the SNR will be. Künzel studied the effects of these types of
noises and treating them with enhancements in one of his papers titled "Forensic
Automatic Speaker Recognition with Degraded and Enhanced Speech."[8*]. He found
that in some cases it would improve the accuracy of the FASR system to treat the speech
samples with some form of speech enhancement. “The results of the present study
suggest that speech enhancement cannot be generally rejected as a tool for the pre-
processing of speech samples that have to be used for forensic speaker recognition.
Although based on a very limited amount of types and degrees of typical forensic sources
of noise it has become obvious that some types of enhancement can improve the
performance of an automatic speaker recognition system for at least certain types of
additive noises, in particular (instrumental) music and noise inside a moving car.” Some
types of noise present in the speech samples do not require speech enhancement prior to

8
input into the FASR system as they do not seem to affect the results the system produces.
“On the other hand, road traffic and restaurant noise, even at low SNRs (down to 6 dB),
do not affect the performance of the recognition system markedly and thus do not call for
enhancement.” As part of the experiment Künzel also clipped an audio signal to 50%
total samples clipped and then ran it through the FASR. The signal was treated with
CEDAR Audio’s Declip function and ran it through the FASR system again. What he
observed was that regardless of processing the clipped signal with a Declip function, the
results were the same for both the clipped and Declipped samples passed through the
FASR. “As was shown earlier, amplitude clipping and room reverberation are virtually
irrelevant to the performance of the recognition system. Consequently no differences in
terms of EER between dirty and enhanced files are observable.” Please note that this
paper that Künzel wrote only involved testing one particular FASR system (BATVOX)
and one speech enhancement system (CEDAR Audio).
Any added/subtracted equalization or filtering that affects the speaker’s
frequencies from being recorded as they are normally present in the voice will also effect
the accuracy of an ASR.
Purpose of This Thesis
The purpose of this research is to discover to what degree will audio signal
clipping distortion have an effect on a FASR system’s results, where the system is being
ran off a text-independent speaker model. This research will incorporate controlled
clipping distortion defined as a percentage of the audio signal as a whole and will closely
observe how performance is affected. This will help determine at what level of clipping
9
distortion will using a FASR system be no longer reliable to conduct a forensic
comparison of an unknown speaker.
Motivation
The motivation for this research is to help the community of FASR system users
better understand what conditions involving clipping distortion on their test audio signal
will render the FASR system no longer reliable in helping to identify and verify an
unknown speaker. This research aims to shed light to some of the gray areas involving
the limitations of using audio signals with a FASR system that contain the presence of
clipping distortion. Very limited research has been done on the subject and the fact that
this common problem is encountered often when dealing with investigative recordings
serves as a motivation to help learn about this subject of study and use it’s findings for
real world application.

10
CHAPTER II
MATERIALS AND METHODS
Introduction
In this chapter I will discuss the software that was used to carry out the
experimentation for the research needed to complete this thesis. Matlab was used to first
normalize and then amplify the audio signals of unknown speakers to induce clipping
distortion. Normalization is defined in the following quotation. “Peak normalization is an
automated process that changes the level of each sample in a digital audio signal by the
same amount, such that the loudest sample reaches a specified level. Traditionally, the
process is used to ensure that the signal peaks at 0dBfs, the loudest level allowed in a
digital system. [9]” Audio signal amplification was carried out in controlled increments
of 1% through 20% of clipped samples out of the total samples for each test speech
recording. The testing of the speaker FASR system BATVOX followed. One by one the
unknown speaker’s 20 different variations were tested against the known model and the
general population model of 35 speakers. The reported likelihood ratios coming from
BATVOX then provided insight to what the limitations of the FASR system were
regarding the use of clipped audio speech recordings when running a forensic speaker
comparison.
Signal Processing in Matlab
Signal processing in Matlab was necessary to prepare the test samples for use in
the FASR system BATVOX. All samples used for the purpose of this thesis were in the
Waveform Audio File Format (WAV). Signal processing was done by creating a script

11
that completed the following steps in chronological order. First the script was
programmed to verify whether or not the original audio signal had any clipping distortion
to begin with. If the signal was already clipped it would be considered unusable for this
experiment and discarded. This was necessary because for the purpose of this research we
were interested in having complete control over the introduction of clipping distortion.
Next the script was programmed to normalize the test audio signals. The reason for
normalizing the audio signals prior to amplifying the signal was to have all the test audio
signals at the same relative amplitude level when beginning to clip the signal. This was
important because each sample was recorded on different recording systems with varying
gain configurations. If a test audio signal was recorded at a very low gain setting and the
signal is weak, then it would require extra amplification to clip the signal. Vice versa if
the test audio signal was recorded at a very high gain, there might be extreme amounts of
clipping with only very little signal amplification. This step prepared all test audio
signals to have a similar amplitude level prior to having their samples methodically
clipped. Something important taken into consideration is that no test samples were used
that already contained clipping present in the audio signal. This would have tainted the
results of the testing and would have defeated the purpose of the research. The new
normalized test speech signal was then saved and the amplification of the normalized test
speech signal was executed starting from a 1% of total samples clipped increased up to a
20% total of samples clipped from a given recording. These variations of clipped test
signals were then also saved as individual WAV files with an appropriate name to
identify each audio recording accordingly. Once these steps had been successfully carried
out a message was displayed to confirm that the processes have completed correctly.
12
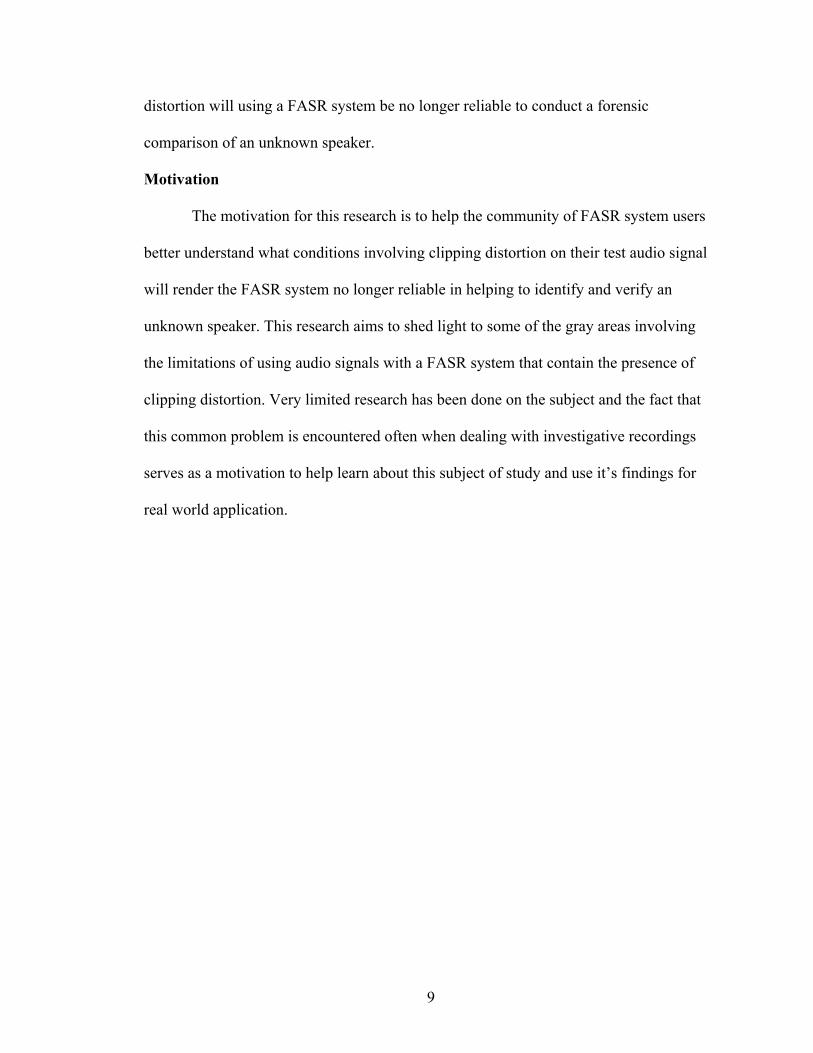
Figure 1: MATLAB signal processing
Next BATVOX was used to test the newly clipped audio signals against its
populated database of known model speakers. Before going into a description of this
process a brief introduction to the FASR system BATVOX is given in the following
section.
BATVOX
BATVOX is a speech-independent software that is utilized for Speaker
Identification (SPID). It can be used in any language and is currently only available for
government use. The reason it is able to be used in any language is because it is not text-
dependent and relies on extracting speaker specific information coming from the
individual’s vocal track. “BATVOX allows the identification of unknown voices against
voices coming from known speakers, as well as identity verification of a speaker making
1:1 comparisons, independently of text, channel and language. [10]” Its means for
making the comparisons of an unknown speaker to a database of known speakers
3.Create clipped variations of each normalized test sample ranging from 1%-‐20% total samples clipped. (21 =iles
including original and the 1%-‐20% variations)
2.Normalize audio samples
MATLAB Signal Processing
1.Detect if any clipping present in original audio sample.

13
incorporates the usage of probabilistic LR in accordance with the Bayesian Approach.
“BATVOX provides detailed speaker verifications with Likelihood Ratios (LR)
computation based on Bayesian Networks. The LR gives a robust estimation of the
verification task, in a probabilistic way, which can be easily presented and justified in
legal processes, always with the support of an expert. [10]” The LR is the outcome of two
probabilities explained in the following excerpt. “This LR is the ratio of two
probabilities: the probability of the evidence E if the test and reference samples originate
from the same speaker (HSS) and the probability of the evidence E if the test and
reference samples originate from different speakers (HDS). [11]”
Using BATVOX to Test Clipped Audio Signals
Once the unknown test speaker recordings were normalized and prepared, each
having twenty-one versions (original test recording with twenty different variations of
percentages of total clipped samples), the testing process followed. The test samples each
had a matching known model speaker and a general population model of unknown
speakers sharing the same characteristics of speech (same language, same gender, same
microphonic recording input, etc). One by one the test unknown speaker’s original and 20
different variations were tested against the known same speaker model as well as the
general model population of 35 speakers. This is where BATVOX followed the
previously mentioned FASR order of operations located on page three of chapter I. First
there was an input of the audio signal where it passed through signal sensors that separate
speech from silence. Next the separated speech passed through a feature extraction
module. “The system measures Mel-frequency cepstral coefficient (MFCC) parameters
that reflect the physical properties of the vocal tract. [12]” After passing through the

14
feature extraction module and the speaker feature vectors had been extracted into raw
data the speaker Gaussian Mixture Model (GMM) was created in preparation for
comparison. BATVOX then used the GMM taken from the speech signal and compared it
to the Universal Background Model (UBM) derived from the general population model.
“BATVOX (Basic v3.1) GMM-UBM system was used to extract and analyze MFCC data
from the samples. BATVOX is automatic in so far as it extracts sections of speech ….and
also selects a specified number of optimal reference speakers from a given reference
population. A ‘model’ is then trained from a sample of speech (this is analogous to the
known suspect sample) to be compared with test data (evidential recordings). [12]” The
comparison was made between the unknown test model and the known reference model
as well as the general population model and has a likelihood ratio calculated based off of
the suspect’s intra-variability and the general population model’s inter-variability.
Example plots of a high intra-variability result followed by high inter-variability are
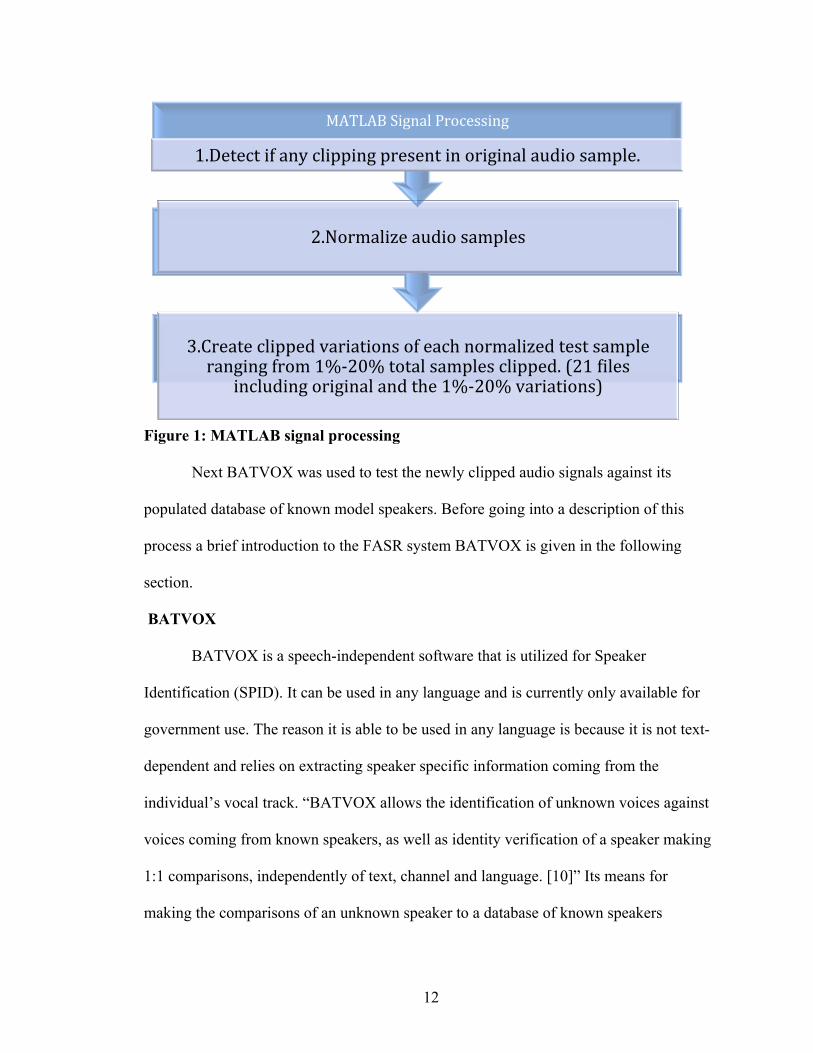
demonstrated in the following figures 2 and 3. Note that BATVOX uses the green bar to
indicate where the test, or evidence, recording stands in regards to relating more to the
general population model (red histogram) or to the suspect speaker’s model (blue
histogram).

15
Figure 2: BATVOX plot showing a high liklihood of evidence and suspect
recordings coming from the same speaker.
16
Figure 3: BATVOX plot showing a low likelihood of evidence and suspect
recordings coming from the same speaker.
This likelihood ratio is then used to determine the strength of the evidence and aids in
making the decision whether the test speaker and reference speaker are the same person
or not. Once the LR has been calculated a forensically competent analyst can then make a
decision of whether or not the test recording is the same speaker as the known model that
it was compared to. The higher the LR is, the stronger the evidence is considered to be.
“It goes without saying that the higher the LR, the stronger is the support for the
respective hypothesis. [5]”
The LRs were calculated for the original test sample and twenty other variants of
the test sample being purposely clipped with their total samples clipped ranging from
1%-20%. This was done for all 20 male test speakers. There were twenty “unknown” test
17
speakers (with 21 variants per speaker) being compared to twenty “known” male model
speakers as well as a general population model of speakers. This comparison helps
calculate the intra-variability. BATVOX also requires you to create a general population
model with similar characteristics of the test speaker’s recording such as being of the
same gender, language spoken, and recording input (GSM, microphonic, etc). For this
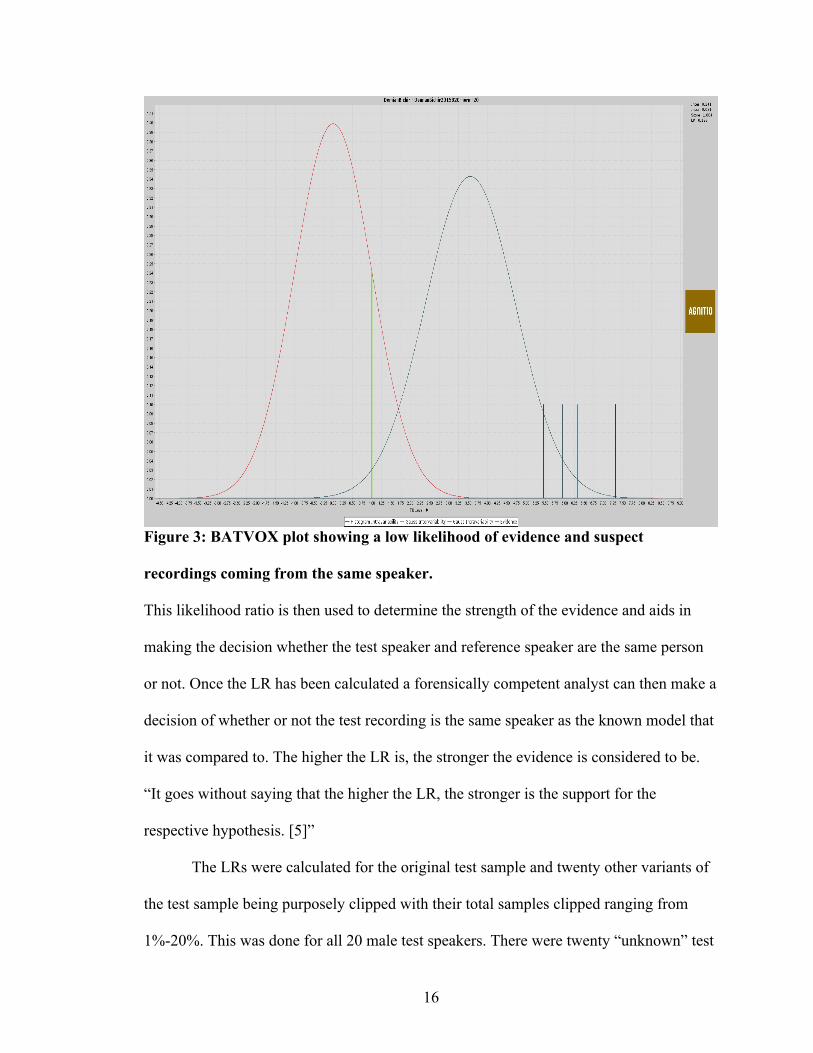
thesis a reference population of 35 male Spanish speakers were used. Total speakers used
for this study were 55 male native Spanish speakers. 20 speakers had two recordings for
each speaker making up the test and model population. An additional 35 different
speakers were needed to make up the general population model. Figure 4 below outlines
the necessary samples needed for this study.
Figure 4: Samples collected for study
Adobe Audition 3.0
The functions used in this DAW were the extraction of audio from video, an
analysis of total samples clipped, the editing of audio, resampling of audio, and the
reformatting of audio. The reason for using this DAW was due to the fact that it was
available to me at my educational institution. Any DAW that can perform the previously
stated functions will meet the requirements for a suitable DAW needed for the sample
General Population Model
• 35 samples of male native Spanish speakers different than the 20 used for both test and models.
Model Population
• 20 samples of same male native Spanish speakers used for test population
Test Population
• 20 samples of same male native Spanish speakers used for model population

18
acquisition and preliminary sample preparation for this research. Figure 5 outlines the
necessary DAW requirements for this study.
Figure 5: DAW requirements
Acquiring Samples
Samples acquired for the testing of this thesis had to meet specific criteria in order
to be usable for the study. Speech samples acquired were originating from open sourced
interview style television programs. The reasoning behind this was to have a consistent
recording system setup amongst all the speech samples acquired for test, model, and
reference population. The following conditions were carefully followed in order to obtain
quality samples for the study.
DAW Requirements
• ability to import video/audio • ability to extract embedded audio from a video =ile containing audio
• ability to edit audio • ability to detect clipping • ability to =ilter out electrical hum if present • ability to resample audio to 8khz • ability to reformat audio to mono ch, 16 bit depth
• ability to save as WAV PCM
19
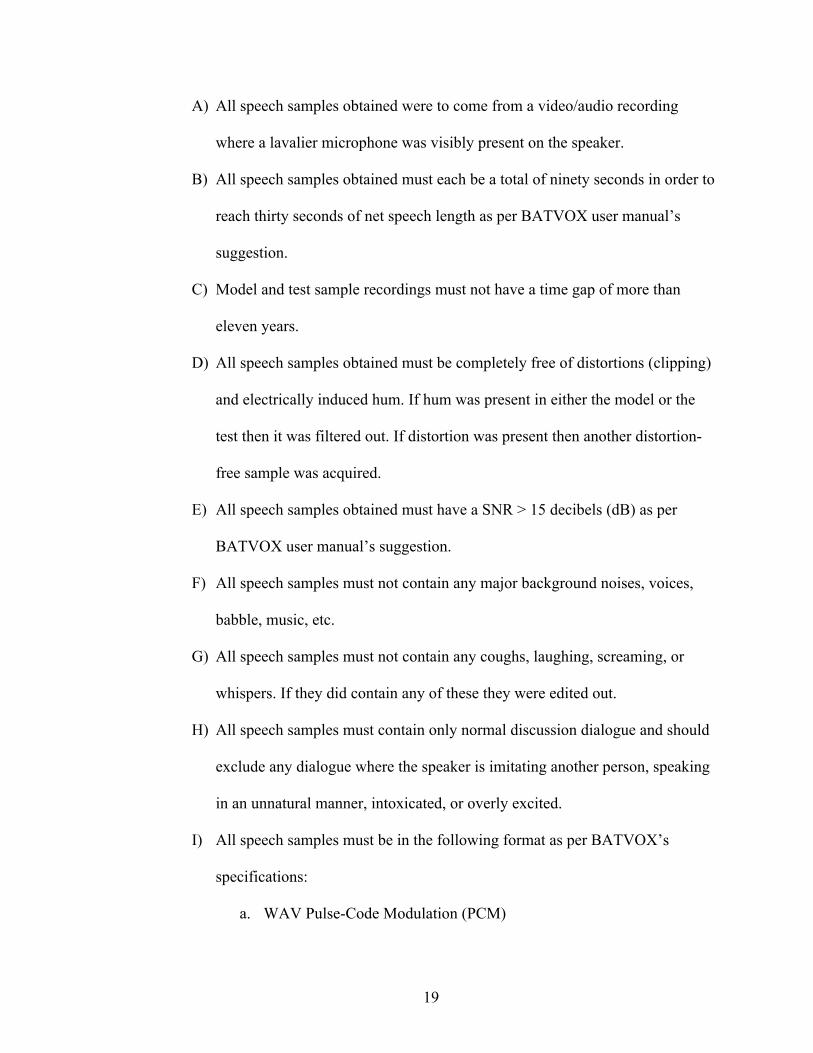
A) All speech samples obtained were to come from a video/audio recording
where a lavalier microphone was visibly present on the speaker.
B) All speech samples obtained must each be a total of ninety seconds in order to
reach thirty seconds of net speech length as per BATVOX user manual’s
suggestion.
C) Model and test sample recordings must not have a time gap of more than
eleven years.
D) All speech samples obtained must be completely free of distortions (clipping)
and electrically induced hum. If hum was present in either the model or the
test then it was filtered out. If distortion was present then another distortion-
free sample was acquired.
E) All speech samples obtained must have a SNR > 15 decibels (dB) as per
BATVOX user manual’s suggestion.
F) All speech samples must not contain any major background noises, voices,
babble, music, etc.
G) All speech samples must not contain any coughs, laughing, screaming, or
whispers. If they did contain any of these they were edited out.
H) All speech samples must contain only normal discussion dialogue and should
exclude any dialogue where the speaker is imitating another person, speaking
in an unnatural manner, intoxicated, or overly excited.
I) All speech samples must be in the following format as per BATVOX’s
specifications:
a. WAV Pulse-Code Modulation (PCM)
20
b. 8 khz sample rate
c. 16-bit bit depth
d. mono
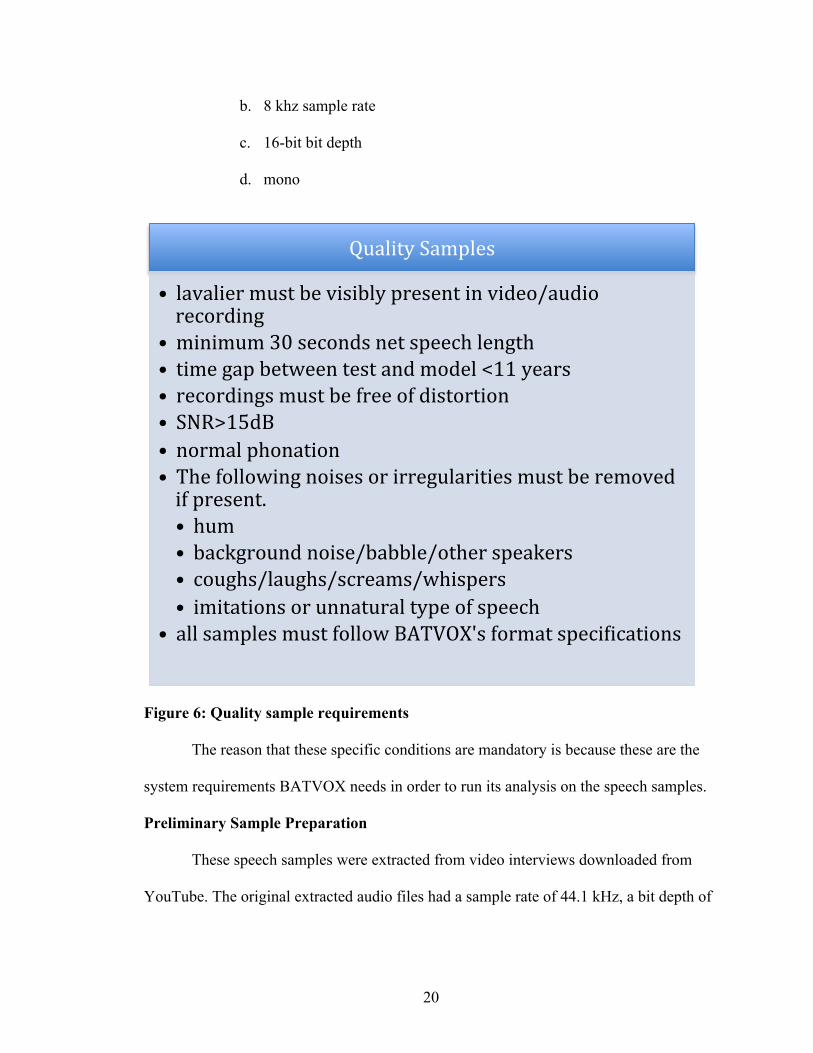
Figure 6: Quality sample requirements
The reason that these specific conditions are mandatory is because these are the
system requirements BATVOX needs in order to run its analysis on the speech samples.
Preliminary Sample Preparation
These speech samples were extracted from video interviews downloaded from
YouTube. The original extracted audio files had a sample rate of 44.1 kHz, a bit depth of
Quality Samples
• lavalier must be visibly present in video/audio recording
• minimum 30 seconds net speech length • time gap between test and model <11 years • recordings must be free of distortion • SNR>15dB • normal phonation • The following noises or irregularities must be removed if present. • hum • background noise/babble/other speakers • coughs/laughs/screams/whispers • imitations or unnatural type of speech
• all samples must follow BATVOX's format speci=ications

21
32 bits and were typically in stereo. For this reason Adobe Audition 3.0 was used for the
following operations in the preliminary sample preparation.
A) Audio was extracted from the downloaded video file containing the speaker.
B) Extracted audio was analyzed for clipped samples prior to being processed
with Matlab.
C) Other speakers were edited out manually so that only one subject was focused
on per recording.
D) Long pauses of silence were edited out so that the most speaker speech
content could be analyzed by BATVOX in the 90-second frame fed to the
system. A 90-second sample was used to ensure a minimum net speech of 30
seconds as suggested by BATVOX’s user manual.
E) Extracted audio was converted to an audio file with a sample rate of 8 kHz, a
resolution of 16 bits, and a single mono channel as per BATVOX’s system
requirements in order to function. (The original WAV PCM format was
preserved)

22
Figure 7: Necessary preliminary sample preparation steps
Audio was extracted from downloaded open sourced video =ile.
Audio analyzed for clipping distortion.
Speakers other than main speaker were edited out.
Silence manually edited out.
Audio converted to BATVOX's suggested sample rate, bit depth, ch con=iguration and format.
23
CHAPTER III
FINDINGS AND LIMITATIONS OF USING CLIPPED SPEECH WITH A FASR
SYSTEM
Results
After running a BATVOX ASR analysis on all twenty-two variations of the
twenty test speakers against twenty model speakers and thirty-five population speakers
the following results were discovered. It is clear that as clipping is increased, the LRs
calculated by BATVOX decrease making the system less accurate when the higher
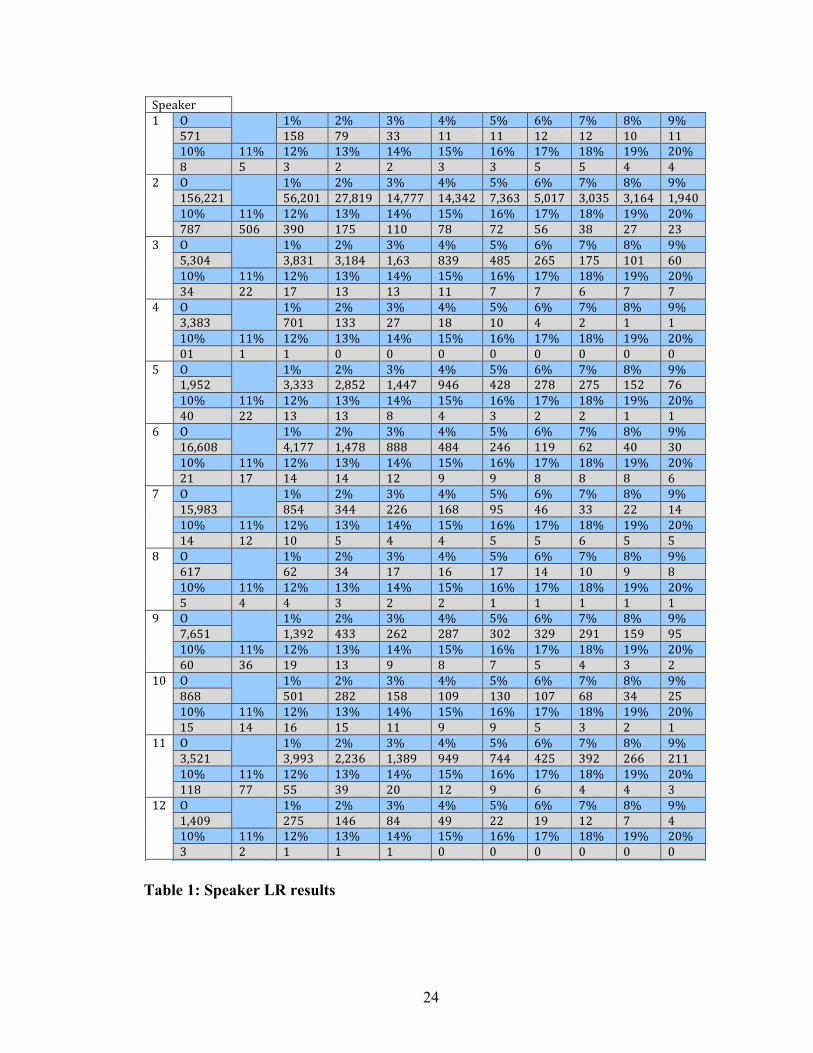
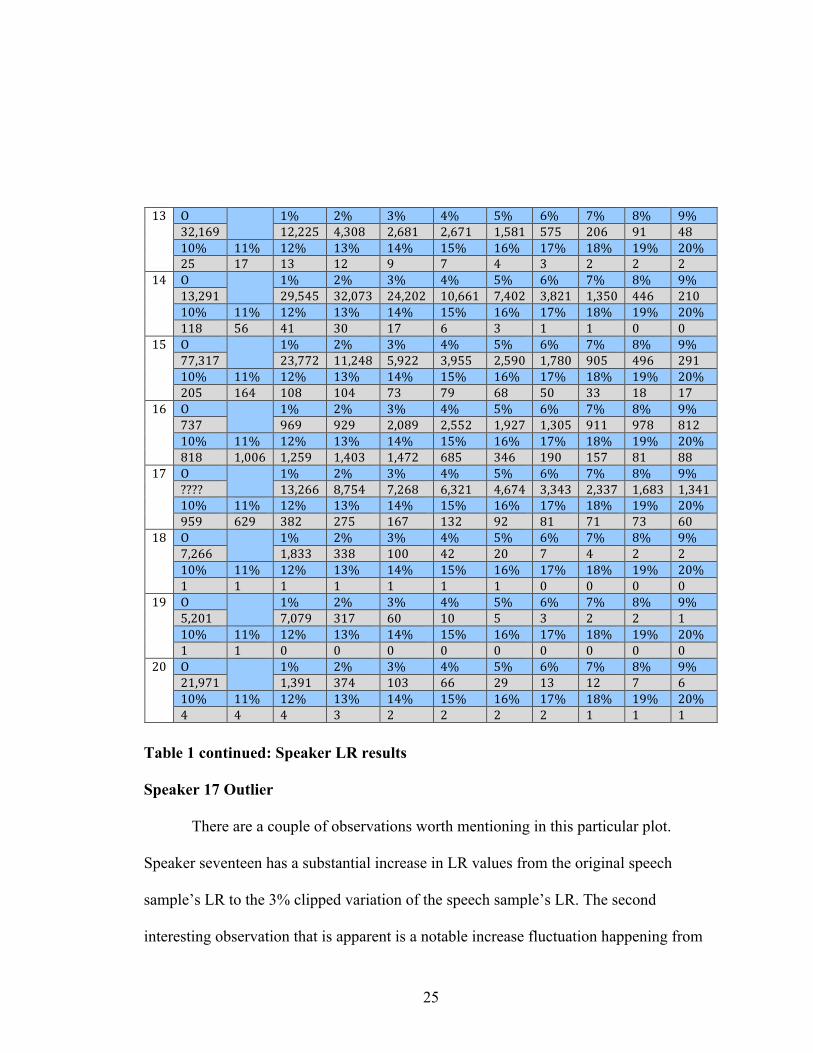
clipping rate test recordings are introduced into the system. Table 1 shows the LRs
rounded to the nearest whole number for each speaker and each variation of that speaker.
The letter O in the table stands for original, meaning the test speech material is original
and has not been altered. The percentage values identify the test speech material’s level
of clipping ranging from 1% to 20%. The numbers found under the percentage values are
the LR values produced by BATVOX for that particular test speech variation.
24
Table 1: Speaker LR results
!"#$%&$'!(! )! ! (*! +*! ,*! -*! .*! /*! 0*! 1*! 2*!
.0(! (.1! 02! ,,! ((! ((! (+! (+! (3! ((!(3*! ((*! (+*! (,*! (-*! (.*! (/*! (0*! (1*! (2*! +3*!1! .! ,! +! +! ,! ,! .! .! -! -!
+! )! ! (*! +*! ,*! -*! .*! /*! 0*! 1*! 2*!(./4++(! ./4+3(! +041(2! (-4000! (-4,-+! 04,/,! .43(0! ,43,.! ,4(/-! (42-3!(3*! ((*! (+*! (,*! (-*! (.*! (/*! (0*! (1*! (2*! +3*!010! .3/! ,23! (0.! ((3! 01! 0+! ./! ,1! +0! +,!
,! )! ! (*! +*! ,*! -*! .*! /*! 0*! 1*! 2*!.4,3-! ,41,(! ,4(1-! (4/,! 1,2! -1.! +/.! (0.! (3(! /3!(3*! ((*! (+*! (,*! (-*! (.*! (/*! (0*! (1*! (2*! +3*!,-! ++! (0! (,! (,! ((! 0! 0! /! 0! 0!
-! )! ! (*! +*! ,*! -*! .*! /*! 0*! 1*! 2*!,4,1,! 03(! (,,! +0! (1! (3! -! +! (! (!(3*! ((*! (+*! (,*! (-*! (.*! (/*! (0*! (1*! (2*! +3*!3(! (! (! 3! 3! 3! 3! 3! 3! 3! 3!
.! )! ! (*! +*! ,*! -*! .*! /*! 0*! 1*! 2*!(42.+! ,4,,,! +41.+! (4--0! 2-/! -+1! +01! +0.! (.+! 0/!(3*! ((*! (+*! (,*! (-*! (.*! (/*! (0*! (1*! (2*! +3*!-3! ++! (,! (,! 1! -! ,! +! +! (! (!
/! )! ! (*! +*! ,*! -*! .*! /*! 0*! 1*! 2*!(/4/31! -4(00! (4-01! 111! -1-! +-/! ((2! /+! -3! ,3!(3*! ((*! (+*! (,*! (-*! (.*! (/*! (0*! (1*! (2*! +3*!+(! (0! (-! (-! (+! 2! 2! 1! 1! 1! /!
0! )! ! (*! +*! ,*! -*! .*! /*! 0*! 1*! 2*!(.421,! 1.-! ,--! ++/! (/1! 2.! -/! ,,! ++! (-!(3*! ((*! (+*! (,*! (-*! (.*! (/*! (0*! (1*! (2*! +3*!(-! (+! (3! .! -! -! .! .! /! .! .!
1! )! ! (*! +*! ,*! -*! .*! /*! 0*! 1*! 2*!/(0! /+! ,-! (0! (/! (0! (-! (3! 2! 1!(3*! ((*! (+*! (,*! (-*! (.*! (/*! (0*! (1*! (2*! +3*!.! -! -! ,! +! +! (! (! (! (! (!
2! )! ! (*! +*! ,*! -*! .*! /*! 0*! 1*! 2*!04/.(! (4,2+! -,,! +/+! +10! ,3+! ,+2! +2(! (.2! 2.!(3*! ((*! (+*! (,*! (-*! (.*! (/*! (0*! (1*! (2*! +3*!/3! ,/! (2! (,! 2! 1! 0! .! -! ,! +!
(3! )! ! (*! +*! ,*! -*! .*! /*! 0*! 1*! 2*!1/1! .3(! +1+! (.1! (32! (,3! (30! /1! ,-! +.!(3*! ((*! (+*! (,*! (-*! (.*! (/*! (0*! (1*! (2*! +3*!(.! (-! (/! (.! ((! 2! 2! .! ,! +! (!
((! )! ! (*! +*! ,*! -*! .*! /*! 0*! 1*! 2*!,4.+(! ,422,! +4+,/! (4,12! 2-2! 0--! -+.! ,2+! +//! +((!(3*! ((*! (+*! (,*! (-*! (.*! (/*! (0*! (1*! (2*! +3*!((1! 00! ..! ,2! +3! (+! 2! /! -! -! ,!
(+! )! ! (*! +*! ,*! -*! .*! /*! 0*! 1*! 2*!(4-32! +0.! (-/! 1-! -2! ++! (2! (+! 0! -!(3*! ((*! (+*! (,*! (-*! (.*! (/*! (0*! (1*! (2*! +3*!,! +! (! (! (! 3! 3! 3! 3! 3! 3!
(,! )! ! (*! +*! ,*! -*! .*! /*! 0*! 1*! 2*!,+4(/2! (+4++.! -4,31! +4/1(! +4/0(! (4.1(! .0.! +3/! 2(! -1!
25
Table 1 continued: Speaker LR results
Speaker 17 Outlier
There are a couple of observations worth mentioning in this particular plot.
Speaker seventeen has a substantial increase in LR values from the original speech
sample’s LR to the 3% clipped variation of the speech sample’s LR. The second
interesting observation that is apparent is a notable increase fluctuation happening from
!"#! $! ! "%! &%! #%! '%! (%! )%! *%! +%! ,%!
#&-"),! "&-&&(! '-#.+! &-)+"! &-)*"! "-(+"! (*(! &.)! ,"! '+!".%! ""%! "&%! "#%! "'%! "(%! ")%! "*%! "+%! ",%! &.%!&(! "*! "#! "&! ,! *! '! #! &! &! &!
"'! $! ! "%! &%! #%! '%! (%! )%! *%! +%! ,%!"#-&,"! &,-('(! #&-.*#! &'-&.&! ".-))"! *-'.&! #-+&"! "-#(.! '')! &".!".%! ""%! "&%! "#%! "'%! "(%! ")%! "*%! "+%! ",%! &.%!""+! ()! '"! #.! "*! )! #! "! "! .! .!
"(! $! ! "%! &%! #%! '%! (%! )%! *%! +%! ,%!**-#"*! &#-**&! ""-&'+! (-,&&! #-,((! &-(,.! "-*+.! ,.(! ',)! &,"!".%! ""%! "&%! "#%! "'%! "(%! ")%! "*%! "+%! ",%! &.%!&.(! ")'! ".+! ".'! *#! *,! )+! (.! ##! "+! "*!
")! $! ! "%! &%! #%! '%! (%! )%! *%! +%! ,%!*#*! ,),! ,&,! &-.+,! &-((&! "-,&*! "-#.(! ,""! ,*+! +"&!".%! ""%! "&%! "#%! "'%! "(%! ")%! "*%! "+%! ",%! &.%!+"+! "-..)! "-&(,! "-'.#! "-'*&! )+(! #')! ",.! "(*! +"! ++!
"*! $! ! "%! &%! #%! '%! (%! )%! *%! +%! ,%!////! "#-&))! +-*('! *-&)+! )-#&"! '-)*'! #-#'#! &-##*! "-)+#! "-#'"!".%! ""%! "&%! "#%! "'%! "(%! ")%! "*%! "+%! ",%! &.%!,(,! )&,! #+&! &*(! ")*! "#&! ,&! +"! *"! *#! ).!
"+! $! ! "%! &%! #%! '%! (%! )%! *%! +%! ,%!*-&))! "-+##! ##+! "..! '&! &.! *! '! &! &!".%! ""%! "&%! "#%! "'%! "(%! ")%! "*%! "+%! ",%! &.%!"! "! "! "! "! "! "! .! .! .! .!
",! $! ! "%! &%! #%! '%! (%! )%! *%! +%! ,%!(-&."! *-.*,! #"*! ).! ".! (! #! &! &! "!".%! ""%! "&%! "#%! "'%! "(%! ")%! "*%! "+%! ",%! &.%!"! "! .! .! .! .! .! .! .! .! .!
&.! $! ! "%! &%! #%! '%! (%! )%! *%! +%! ,%!&"-,*"! "-#,"! #*'! ".#! ))! &,! "#! "&! *! )!".%! ""%! "&%! "#%! "'%! "(%! ")%! "*%! "+%! ",%! &.%!'! '! '! #! &! &! &! &! "! "! "!
!

26
14%-15%, 16%-17%, and 18%-19%. This randomized fluctuation is an anomaly
compared to the rest of the results. For this reason speaker 17 will be considered an
outlier and will not be included in the rest of the statistics. 16 out of the 19 speakers
showed a decrease in the 15%-20% clipped variant tests as the clipping was increased. 3
speakers showed insignificant increase and decrease fluctuations in the 15%-20% range
as clipping was increased only changing by a single LR value. An acoustic analysis
revealed a muffled sound source for the test recording of speaker 17. After investigating
further into the test and model speech samples I noticed a frequency response
discrepancy between test and model. This may have come from equalization, filtering, or
dynamic processing applied to the test unknown speaker recording during the recording
process. Figure 8 and Figure 9 show a spectrum analysis of the known model for speaker
17 (unfiltered) followed by the unknown test (filtered).
Figure 8: Model Recording for Speaker 17 Spectrum Analysis. (Unfiltered)

27
Figure 9: Test recording for known speaker matching speaker 17 spectrum analysis.
(filtered at 80Hz – 0Hz)
The model spectrum is saturated in contrast to that of the test’s spectrum. A
noticeable difference can be observed in the lower frequency range from 0Hz up to 80Hz
as well as the mid frequencies from 1kHz up to 4kHz. The 1kHz – 4kHz range of
frequencies contains a great amount of speech information, which seems to be missing
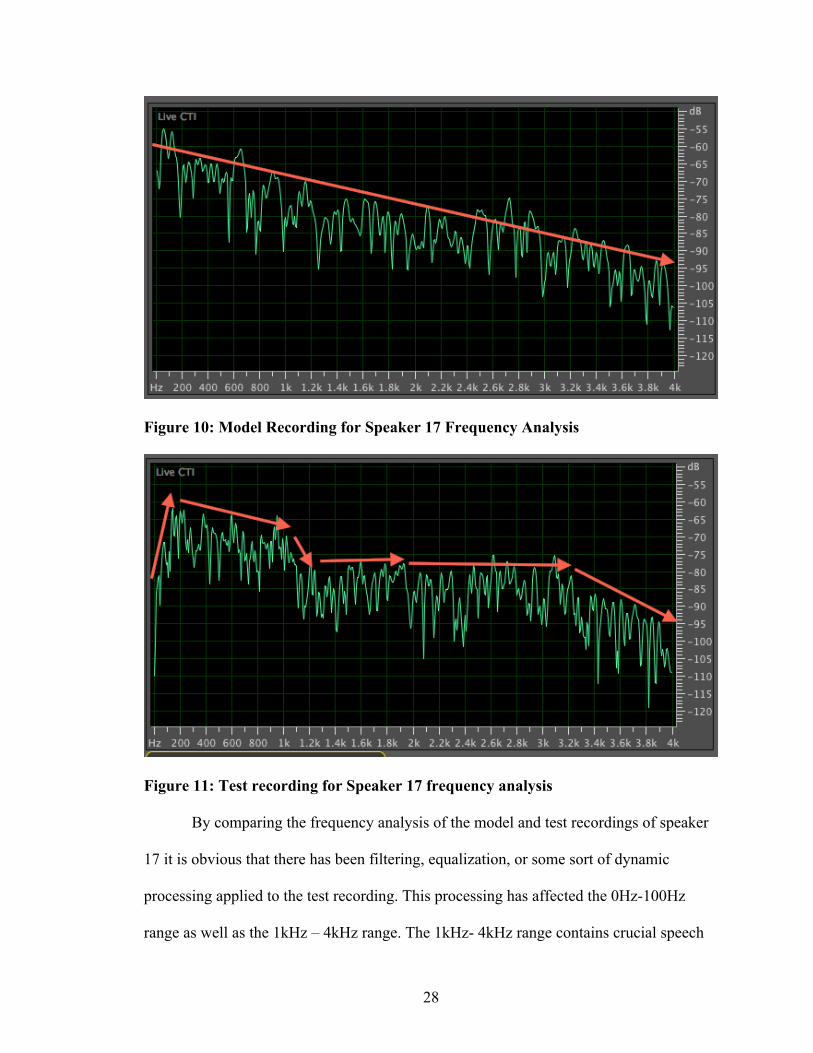
due to the filtering or dynamic processing artifacts. Figures 10 and 11 display the model
(unfiltered) and the test (filtered from 0hz-80hz/1kHz-4kHz) speech’s frequency analysis.
28
Figure 10: Model Recording for Speaker 17 Frequency Analysis
Figure 11: Test recording for Speaker 17 frequency analysis
By comparing the frequency analysis of the model and test recordings of speaker
17 it is obvious that there has been filtering, equalization, or some sort of dynamic
processing applied to the test recording. This processing has affected the 0Hz-100Hz
range as well as the 1kHz – 4kHz range. The 1kHz- 4kHz range contains crucial speech

29
information needed for an accurate comparison by the FASR. Although it is not possible
to know exactly what settings for filtering, equalization, or dynamics processing was used
during the recording process, it is obvious that there has been some form of processing
applied to the test sample recorded. Figure 12 shows the average LR scores of all test
recordings expressed as a percentage of the averaged non-clipped variant’s LR score for
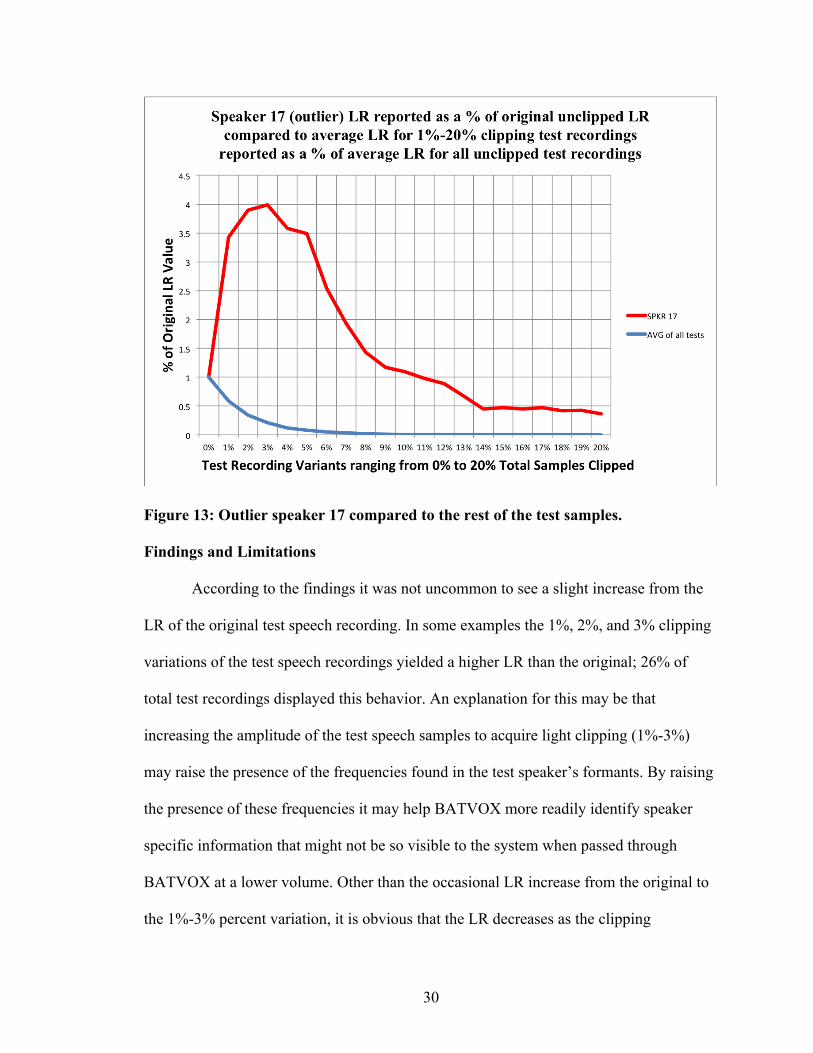
all speakers. Subsequent figure 13 shows how outlier speaker 17 relates to the pattern the
rest of the speakers follow.
Figure 12: Average LR scores for 1%-20% clipping test recordings reported as a %
of average LR scores for all unclipped test recordings.
30
Figure 13: Outlier speaker 17 compared to the rest of the test samples.
Findings and Limitations
According to the findings it was not uncommon to see a slight increase from the
LR of the original test speech recording. In some examples the 1%, 2%, and 3% clipping
variations of the test speech recordings yielded a higher LR than the original; 26% of
total test recordings displayed this behavior. An explanation for this may be that
increasing the amplitude of the test speech samples to acquire light clipping (1%-3%)
may raise the presence of the frequencies found in the test speaker’s formants. By raising
the presence of these frequencies it may help BATVOX more readily identify speaker
specific information that might not be so visible to the system when passed through
BATVOX at a lower volume. Other than the occasional LR increase from the original to
the 1%-3% percent variation, it is obvious that the LR decreases as the clipping

31
percentage is increased. On average at 2% clipping the LR values dropped by 35%. On
average at 5% clipping the LR values dropped by 92%. On average at 10% clipping the
LR values dropped by 99%. This can be seen in Table 2.
Table 2: Average LR values for clipped tests represented as a percentage of average
LR values of the unclipped tests
It can be observed from the tables and plots that with an increase of the
percentage of samples clipped, the LR values produced by BATVOX decrease, which
demonstrates how system performance can be affected by clipping distortion. As the LR
values decrease the more likely the test will look as if it relates to the general population
model rather than it’s own same speaker model. Figures 14, 15, and 16 are inter-
Percent Clipped Average LR values for clipped tests represented as a percentage of average LR values of the unclipped tests
0% 100% 1% 59% 2% 35% 3% 21% 4% 12% 5% 8% 6% 5% 7% 3% 8% 2% 9% 1% 10% 1% 11% 0% 12% 0% 13% 0% 14% 0% 15% 0% 16% 0% 17% 0% 18% 0% 19% 0% 20% 0%
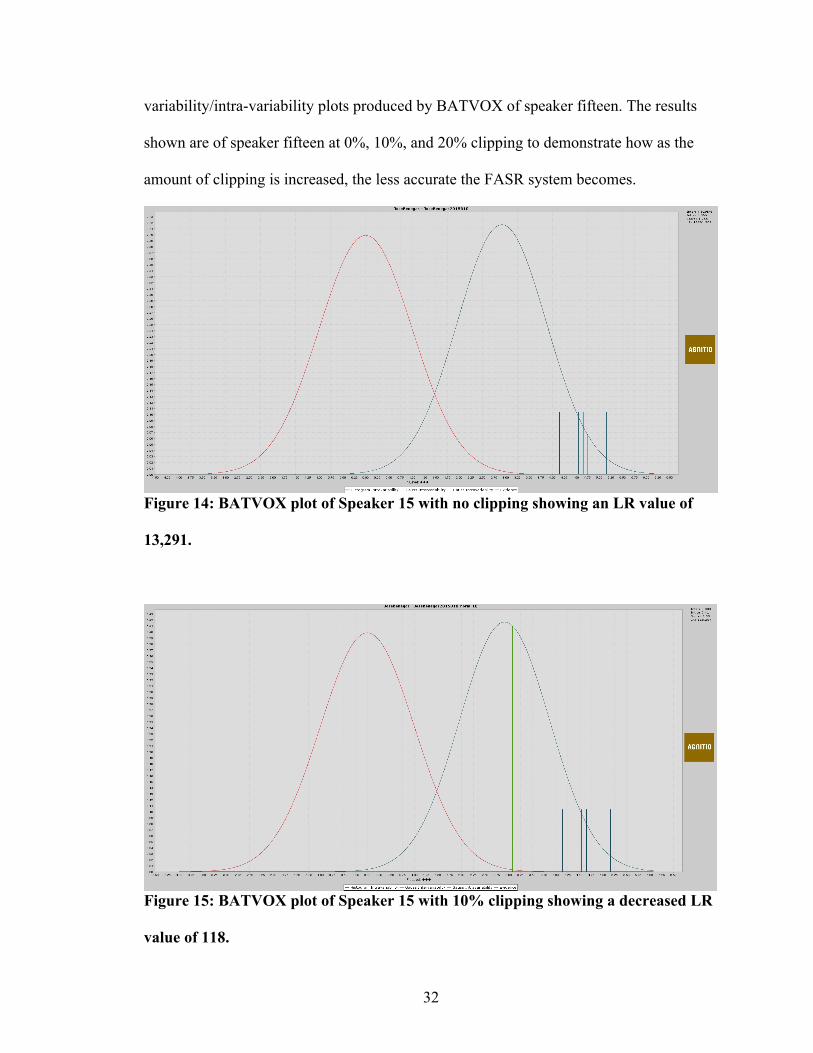
32
variability/intra-variability plots produced by BATVOX of speaker fifteen. The results
shown are of speaker fifteen at 0%, 10%, and 20% clipping to demonstrate how as the
amount of clipping is increased, the less accurate the FASR system becomes.
Figure 14: BATVOX plot of Speaker 15 with no clipping showing an LR value of
13,291.
Figure 15: BATVOX plot of Speaker 15 with 10% clipping showing a decreased LR
value of 118.
33
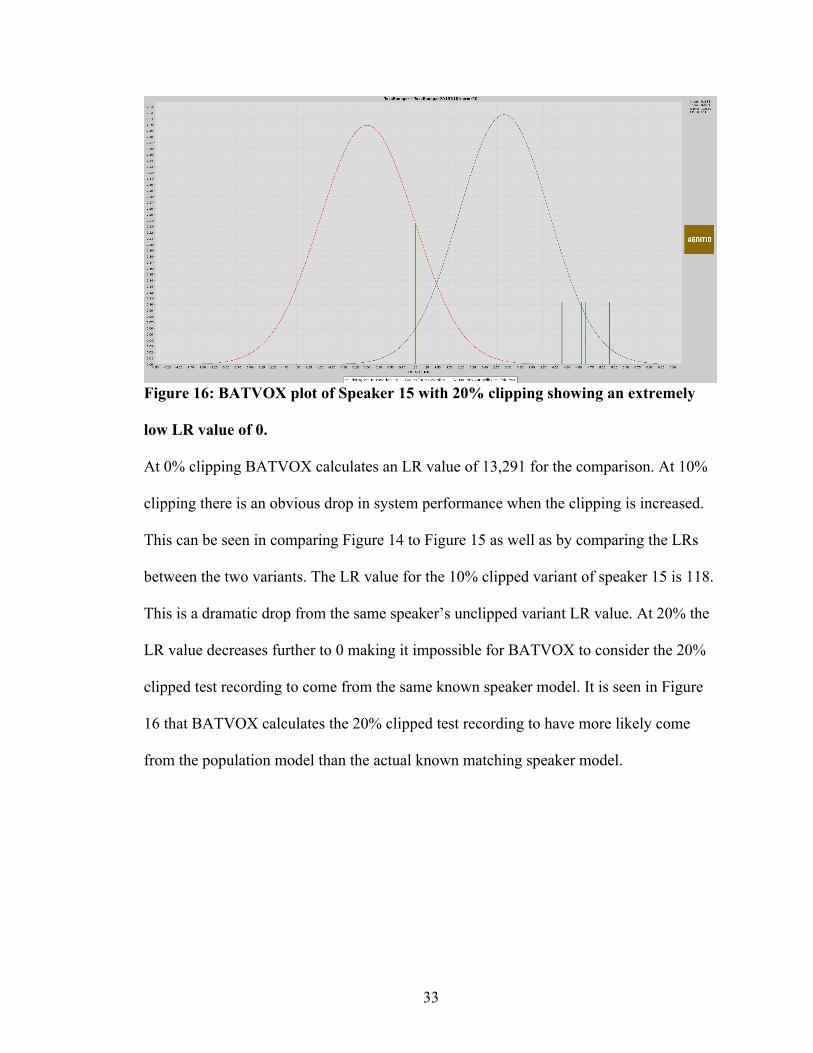
Figure 16: BATVOX plot of Speaker 15 with 20% clipping showing an extremely
low LR value of 0.
At 0% clipping BATVOX calculates an LR value of 13,291 for the comparison. At 10%
clipping there is an obvious drop in system performance when the clipping is increased.
This can be seen in comparing Figure 14 to Figure 15 as well as by comparing the LRs
between the two variants. The LR value for the 10% clipped variant of speaker 15 is 118.
This is a dramatic drop from the same speaker’s unclipped variant LR value. At 20% the
LR value decreases further to 0 making it impossible for BATVOX to consider the 20%
clipped test recording to come from the same known speaker model. It is seen in Figure
16 that BATVOX calculates the 20% clipped test recording to have more likely come
from the population model than the actual known matching speaker model.

34
CHAPTER IV
CONCLUSION AND FUTURE RESEARCH
Conclusion
In conclusion it was seen that LR values increased 26% of the time when a
test recording was clipped from 1%-3%. After this effect, the LR values would lower
dramatically as clipping was increased. The remainder of the 74% of samples that didn’t
display this behavior showed a decrease in LR values starting from the unclipped all the
way up to 20% clipping. On average at 2% clipping the LR values dropped by 65%, at
5% clipping the LR values dropped by 92%, and at 10% clipping the LR values dropped
by 99%. The only exception to this was the outlier speaker 17 which seemed impervious
to affecting the FASR system’s performance when clipping was applied as much as the
rest of the speakers did. Apart from a significant initial increase, the outlier displayed
unique behavior in the form of randomized increases and decreases in LR values in the
15%-20% clipping variants. It was discovered that the outlier had some sort of filtering,
equalization, or dynamics processing done to it which may be an explanation as to why
the speaker’s results did not behave as the other speakers’ results. An acoustic analysis
also revealed a muffled sound source for the test recording of speaker 17.
In order to maintain BATVOX’s system performance, it is recommended only to
use test recordings with 1%-2% total clipped samples at most. If the test recording is
above this percentage of total clipped samples it is highly likely to affect BATVOX’s
system performance and cause the system to provide a LR of lower value than if the test
recording was unclipped. Findings from this paper conclude that care should be taken

35
when forensic comparison analysis is conducted with recordings that have more than 2%
total samples clipped.
Proposals for Future Research
As a possibility for a deeper investigation into this study, I would like to increase
the test, model, and general population model by five fold. Other possible future research
can include a similar study with BATVOX, while changing all speakers to female as this
study was only carried out on a male population. Another suggested investigation can
include carrying out the same study on other different automatic speaker recognition
systems, as no two FASR systems are exactly alike. Lastly I propose to follow up on the
anomaly of outlier speaker 17 and to investigate what exactly it was that made this
particular speaker’s recording samples robust to the FASR system. If the reasons for this
outlier’s strange behavior could be determined it would be interesting to see if the
conditions could be replicated.
36
BIBLIOGRAPHY
[1] Neustein, Amy, and Hemant A. Patil. "Chapter 2: Automatic Speaker Recognition for Forensic Case Assessment and Interpretation." Forensic Speaker Recognition: Law Enforcement and Counter-terrorism. New York: Springer, 2012. N. pag. Print. [2] Rao, Sreenivasa K., Ramu Reddy, Vuppala A. Kumar, and Saswat Chakrabarti. "Chapter 8: Robust Speaker Recognition in Noisy Environments: Using Dynamics of Speaker-Specific Prosody." Forensic Speaker Recognition: Law Enforcement and Counter-terrorism. By Shashidhar G. Koolagudi. New York: Springer, 2012. 182-204. [3] Amir Adler, Valentin Emiya, Maria Jafari, Michael Elad, Rémi Gribonval, et al.. A Constrained Matching Pursuit Approach to Audio Declipping. Acoustics, Speech and Signal Processing, IEEE International Conference on (ICASSP 2011), May 2011, Prague, Czech Republic. IEEE, 2011 [4] F Bie, Wang, Dong, Jun Wang, and Thomas Fang Zheng. "Detection and Reconstruction of Clipped Speech in Speaker Recognition." (n.d.): n. pag. Web. [5] Künzel, Hermann J. "Non-contemporary Speech Samples: Auditory Detectability of an 11 Year Delay and Itseffect on Automatic Speaker Identification." IJSLL International Journal of Speech Language and the Law 14.1 (2007): n. pag. Web. 4 Feb. 2016. [6] Künzel, Hermann. "Automatic Speaker Recognition of Identical Twins." IJSLL International Journal of Speech Language and the Law 17.2 (2011): n. pag. Web. 9 Feb. 2016. [7] Künzel, Hermann J. "Automatic Speaker Recognition with Crosslanguage Speech Material." IJSLL International Journal of Speech Language and the Law 20.1 (2013): n. pag. Web. 15 Feb. 2016. [8] Künzel, Hermann, and Paul Alexander. "Forensic Automatic Speaker Recognition with Degraded and Enhanced Speech." J. Audio Eng. Soc. Journal of the Audio Engineering Society 62.4 (2014): 244-53. Web. 16 Feb. 2016. [9] Admin. "10 Myths About Normalization." Hometracked: 10 Myths About Normalization Comments. Hometracked, 20 Apr. 2008. Web. 30 Jan. 2016.
37
[10] N/A. "BATVOX Data Sheet." (n.d.): 1-2. Agnitio-corp. Agnitio, 2015. Web. 30 Jan. 2016. [11] Van der Vloed, D., et al. "Influence of the size of the population dataset on the results produced by the Batvox software." paper presented at the International Association for Forensic Phonetics and Acoustics (IAFPA) Annual Conference. 2011. [12] Rhodes, Richard William. Assessing the Strength of Non-contemporaneous Forensic Speech Evidence. York: S.n., 2012. The University of York: Department of Language and Linguistic Science, Dec. 2012. Web. 31 Jan. 2016. [13] Suman K. Saksamudre , P.P. Shrishrimal, R.R. Deshmukh. “A Review on Different Approaches for Speech Recognition System. ”International Journal of Computer Applications (0975 – 8887) Volume 115 – No. 22, April 2015 [14] Phil Rose, Technical forensic speaker recognition: Evaluation, types and testing of evidence, Computer Speech & Language, Volume 20, Issues 2–3, April–July 2006, Pages 159-191, ISSN 0885-2308 [15] Eaton, J.; Naylor, P. A.“Detection of Clipping in Coded Speech Signals.” Proc. European Signal Processing Conference (EUSIPCO), EURASIP Marrakech, Morocco, 2013. [16] Lijing Ding; Radwan, A.; El-Hennawey, M.S.; Goubran, R.A., "Measurement of the effects of temporal clipping on speech quality," in Instrumentation and Measurement, IEEE Transactions on , vol.55, no.4, pp.1197-1203, Aug. 2006 [17] Furui S (1997) Recent advances in speaker recognition. Pattern Recognit Lett 18(9):859–872 [18] Reynolds D, Quatieri T, Dunn R (2000) Speaker verification using adapted Gaussian mixture models. Digital Signal Process 10(1):19–41
38
[19] Reynolds, Douglas. "An overview of automatic speaker recognition." Proceedings of the International Conference on Acoustics, Speech and Signal Processing (ICASSP). No. S 4072. 2002. [20] BATVOX. “BATVOX Basic 4.1 User Manual”. 2013.