a programmer’s guide to the fuzzy logic … technical report research project agreement no. t9903,...
TRANSCRIPT

Draft Technical ReportResearch Project Agreement No. T9903, Task 84
Fuzzy Ramp Implementation
A PROGRAMMER’S GUIDE TOTHE FUZZY LOGIC RAMP METERING ALGORITHM:
SOFTWARE DESIGN, INTEGRATION, TESTING, AND EVALUATION
by
Cynthia Taylor Deirdre MeldrumResearch Engineer Associate Professor
Department of Electrical EngineeringUniversity of Washington
Seattle, Washington 98195
Washington State Transportation Center (TRAC)University of Washington, Box 354802
University District Building1107 NE 45th Street, Suite 535
Seattle, Washington 98105-4631
Washington State Department of TransportationTechnical MonitorDave McCormick
Traffic Systems Manager, Northwest Region
Prepared for
Washington State Transportation CommissionDepartment of Transportation
and in cooperation withU.S. Department of Transportation
Federal Highway Administration
February 2000

TECHNICAL REPORT STANDARD TITLE PAGE1. REPORT NO. 2. GOVERNMENT ACCESSION NO. 3. RECIPIENT'S CATALOG NO.
WA-RD 481.3
4. TITLE AND SUBTITLE 5. REPORT DATE
A Programmer’s Guide to the Fuzzy Logic Ramp Metering February 2000Algorithm: Software Design, Integration, Testing, and Evaluation 6. PERFORMING ORGANIZATION CODE
7. AUTHOR(S) 8. PERFORMING ORGANIZATION REPORT NO.
Cynthia Taylor and Deirdre Meldrum
9. PERFORMING ORGANIZATION NAME AND ADDRESS 10. WORK UNIT NO.
Washington State Transportation Center (TRAC)University of Washington, Box 354802 11. CONTRACT OR GRANT NO.
University District Building; 1107 NE 45th Street, Suite 535 Agreement T9903, Task 84Seattle, Washington 98105-463112. SPONSORING AGENCY NAME AND ADDRESS 13. TYPE OF REPORT AND PERIOD COVERED
Research OfficeWashington State Department of TransportationTransportation Building, MS 47370
Draft technical report
Olympia, Washington 98504-7370 14. SPONSORING AGENCY CODE
Dave McCormick, Project Manager, 206-440-448615. SUPPLEMENTARY NOTES
This study was conducted in cooperation with the U.S. Department of Transportation, Federal HighwayAdministration.16. ABSTRACT
A Fuzzy Logic Ramp Metering Algorithm was implemented on 126 ramps in the greater Seattlearea. This report documents the implementation of the Fuzzy Logic Ramp Metering Algorithm at theNorthwest District of the Washington State Department of Transportation.
This programmer’s guide contains the software design for the new and modified code, theintegration procedure, the results of software regression testing, the test results of new functionality, adiscussion of the performance evaluation software used, the algorithm’s transferability to other regions,and recommendations for the future.
Two other related reports cover the project’s research approach, evaluation method, and theresults of on-line testing of the Fuzzy Logic Ramp Metering Algorithm, as well as the algorithm designand tuning technique.
17. KEY WORDS 18. DISTRIBUTION STATEMENT
Ramp metering, fuzzy logic control, intelligenttransportation systems, freeway operations,transportation management software
No restrictions. This document is available to thepublic through the National Technical InformationService, Springfield, VA 22616
19. SECURITY CLASSIF. (of this report) 20. SECURITY CLASSIF. (of this page) 21. NO. OF PAGES 22. PRICE
None None

DISCLAIMER
The contents of this report reflect the views of the authors, who are responsible
for the facts and the accuracy of the data presented herein. The contents do not
necessarily reflect the official views or policies of the Washington State Transportation
Commission, Department of Transportation, or the Federal Highway Administration.
This report does not constitute a standard, specification, or regulation

iii
TABLE OF CONTENTS
Section Page
INTRODUCTION . . . . . . . . . . . . . . . . . . . . . . . . . . . . . . . . . . . . . . . . . . . . . . . . . . . . . . . . . . . . . 1
SOFTWARE DESIGN . . . . . . . . . . . . . . . . . . . . . . . . . . . . . . . . . . . . . . . . . . . . . . . . . . . . . . . . . 2Modified Code ... . . . . . . . . . . . . . . . . . . . . . . . . . . . . . . . . . . . . . . . . . . . . . . . . . . . . . . . . . . . . . . . . . . . . . . 2
Ramp Metering Database .. . . . . . . . . . . . . . . . . . . . . . . . . . . . . . . . . . . . . . . . . . . . . . . . . . . 3Changes to rmdb.h .. . . . . . . . . . . . . . . . . . . . . . . . . . . . . . . . . . . . . . . . . . . . . . . . . . . . . . 3Changes to rmdb_tbl.c.. . . . . . . . . . . . . . . . . . . . . . . . . . . . . . . . . . . . . . . . . . . . . . . . . . 4Changes to build_rmdb.c.. . . . . . . . . . . . . . . . . . . . . . . . . . . . . . . . . . . . . . . . . . . . . . . 8Changes to rmdb_sub.c.. . . . . . . . . . . . . . . . . . . . . . . . . . . . . . . . . . . . . . . . . . . . . . . . . 8
Real-Time Processes .. . . . . . . . . . . . . . . . . . . . . . . . . . . . . . . . . . . . . . . . . . . . . . . . . . . . . . . . 15Communications Protocol.. . . . . . . . . . . . . . . . . . . . . . . . . . . . . . . . . . . . . . . . . . . . . . 17Changes to opc_comm.... . . . . . . . . . . . . . . . . . . . . . . . . . . . . . . . . . . . . . . . . . . . . . . . 17Changes to rmdc_comm.... . . . . . . . . . . . . . . . . . . . . . . . . . . . . . . . . . . . . . . . . . . . . . 17Changes to fddb.h .. . . . . . . . . . . . . . . . . . . . . . . . . . . . . . . . . . . . . . . . . . . . . . . . . . . . . . . 21
170 ... . . . . . . . . . . . . . . . . . . . . . . . . . . . . . . . . . . . . . . . . . . . . . . . . . . . . . . . . . . . . . . . . . . . . . . . . . . . 23Utilities .. . . . . . . . . . . . . . . . . . . . . . . . . . . . . . . . . . . . . . . . . . . . . . . . . . . . . . . . . . . . . . . . . . . . . . . . 24
New Code... . . . . . . . . . . . . . . . . . . . . . . . . . . . . . . . . . . . . . . . . . . . . . . . . . . . . . . . . . . . . . . . . . . . . . . . . . . . . 25Fuzzymeter.c .. . . . . . . . . . . . . . . . . . . . . . . . . . . . . . . . . . . . . . . . . . . . . . . . . . . . . . . . . . . . . . . . . 27Watch_fuzzymeter.c.. . . . . . . . . . . . . . . . . . . . . . . . . . . . . . . . . . . . . . . . . . . . . . . . . . . . . . . . . 28Fuzzymeter_sub.c.. . . . . . . . . . . . . . . . . . . . . . . . . . . . . . . . . . . . . . . . . . . . . . . . . . . . . . . . . . . . 35Fuzzy.h .. . . . . . . . . . . . . . . . . . . . . . . . . . . . . . . . . . . . . . . . . . . . . . . . . . . . . . . . . . . . . . . . . . . . . . . . 68Configuration Management .. . . . . . . . . . . . . . . . . . . . . . . . . . . . . . . . . . . . . . . . . . . . . . . . 70Edit_20_sec.c.. . . . . . . . . . . . . . . . . . . . . . . . . . . . . . . . . . . . . . . . . . . . . . . . . . . . . . . . . . . . . . . . . 73
SOFTWARE TESTING. . . . . . . . . . . . . . . . . . . . . . . . . . . . . . . . . . . . . . . . . . . . . . . . . . . . . . . . 76Integration Procedure.. . . . . . . . . . . . . . . . . . . . . . . . . . . . . . . . . . . . . . . . . . . . . . . . . . . . . . . . . . . . . . . . . 76Results of Regression Testing.. . . . . . . . . . . . . . . . . . . . . . . . . . . . . . . . . . . . . . . . . . . . . . . . . . . . . . . 79
Rmdb ... . . . . . . . . . . . . . . . . . . . . . . . . . . . . . . . . . . . . . . . . . . . . . . . . . . . . . . . . . . . . . . . . . . . . . . . . 79Build_all_db ... . . . . . . . . . . . . . . . . . . . . . . . . . . . . . . . . . . . . . . . . . . . . . . . . . . . . . . . . . . . . . . . . 79Fmdb... . . . . . . . . . . . . . . . . . . . . . . . . . . . . . . . . . . . . . . . . . . . . . . . . . . . . . . . . . . . . . . . . . . . . . . . . . 80Rtdb... . . . . . . . . . . . . . . . . . . . . . . . . . . . . . . . . . . . . . . . . . . . . . . . . . . . . . . . . . . . . . . . . . . . . . . . . . . 80Rmdc ... . . . . . . . . . . . . . . . . . . . . . . . . . . . . . . . . . . . . . . . . . . . . . . . . . . . . . . . . . . . . . . . . . . . . . . . . 81Rmdc_comm .... . . . . . . . . . . . . . . . . . . . . . . . . . . . . . . . . . . . . . . . . . . . . . . . . . . . . . . . . . . . . . . 82Opc_comm.... . . . . . . . . . . . . . . . . . . . . . . . . . . . . . . . . . . . . . . . . . . . . . . . . . . . . . . . . . . . . . . . . . 82VMS_comm .... . . . . . . . . . . . . . . . . . . . . . . . . . . . . . . . . . . . . . . . . . . . . . . . . . . . . . . . . . . . . . . . 83NOAA_monitor .. . . . . . . . . . . . . . . . . . . . . . . . . . . . . . . . . . . . . . . . . . . . . . . . . . . . . . . . . . . . . . 83CCTV... . . . . . . . . . . . . . . . . . . . . . . . . . . . . . . . . . . . . . . . . . . . . . . . . . . . . . . . . . . . . . . . . . . . . . . . . 84Mon_event_log.. . . . . . . . . . . . . . . . . . . . . . . . . . . . . . . . . . . . . . . . . . . . . . . . . . . . . . . . . . . . . . . 84Log Files .. . . . . . . . . . . . . . . . . . . . . . . . . . . . . . . . . . . . . . . . . . . . . . . . . . . . . . . . . . . . . . . . . . . . . . 84Incident Detect . . . . . . . . . . . . . . . . . . . . . . . . . . . . . . . . . . . . . . . . . . . . . . . . . . . . . . . . . . . . . . . . 88TMSUW .... . . . . . . . . . . . . . . . . . . . . . . . . . . . . . . . . . . . . . . . . . . . . . . . . . . . . . . . . . . . . . . . . . . . 88
Test Results of New Functionality . . . . . . . . . . . . . . . . . . . . . . . . . . . . . . . . . . . . . . . . . . . . . . . . . . 89Build_rmdb ... . . . . . . . . . . . . . . . . . . . . . . . . . . . . . . . . . . . . . . . . . . . . . . . . . . . . . . . . . . . . . . . . . 89Fuzzymeter .. . . . . . . . . . . . . . . . . . . . . . . . . . . . . . . . . . . . . . . . . . . . . . . . . . . . . . . . . . . . . . . . . . . 94170 ... . . . . . . . . . . . . . . . . . . . . . . . . . . . . . . . . . . . . . . . . . . . . . . . . . . . . . . . . . . . . . . . . . . . . . . . . . . . 96CPU Requirements .. . . . . . . . . . . . . . . . . . . . . . . . . . . . . . . . . . . . . . . . . . . . . . . . . . . . . . . . . . 98
Bug Report. . . . . . . . . . . . . . . . . . . . . . . . . . . . . . . . . . . . . . . . . . . . . . . . . . . . . . . . . . . . . . . . . . . . . . . . . . . . . . 100

iv
PERFORMANCE EVALUATION SOFTWARE . . . . . . . . . . . . . . . . . . . . . . . . . . . . . . 101Methods Explored .. . . . . . . . . . . . . . . . . . . . . . . . . . . . . . . . . . . . . . . . . . . . . . . . . . . . . . . . . . . . . . . . . . . . 101Getting 20-Second Data.. . . . . . . . . . . . . . . . . . . . . . . . . . . . . . . . . . . . . . . . . . . . . . . . . . . . . . . . . . . . . . 103Processing 20-Second Data.. . . . . . . . . . . . . . . . . . . . . . . . . . . . . . . . . . . . . . . . . . . . . . . . . . . . . . . . . . 104
TRANSFERABILITY. . . . . . . . . . . . . . . . . . . . . . . . . . . . . . . . . . . . . . . . . . . . . . . . . . . . . . . . . . 112
RECOMMENDATIONS. . . . . . . . . . . . . . . . . . . . . . . . . . . . . . . . . . . . . . . . . . . . . . . . . . . . . . . 114
ACKNOWLEDGEMENTS . . . . . . . . . . . . . . . . . . . . . . . . . . . . . . . . . . . . . . . . . . . . . . . . . . . . 118
REFERENCES . . . . . . . . . . . . . . . . . . . . . . . . . . . . . . . . . . . . . . . . . . . . . . . . . . . . . . . . . . . . . . . . 119

v
LIST OF FIGURES
Figure Page
1. New Poll Format for Central Metering Rates .. . . . . . . . . . . . . . . . . . . . . . . . . . 18
LIST OF TABLES
Table Page
1. Fuzzy Metering Parameters .. . . . . . . . . . . . . . . . . . . . . . . . . . . . . . . . . . . . . . . . . . . . . . 52. Summary of Modified Files for the Ramp Metering Database .. . . . . . 143. Summary of Modified Files for the Real-Time Processes.. . . . . . . . . . . . 164. Summary of Modified Files for Communications Protocol.. . . . . . . . . . 195. Lane Status.. . . . . . . . . . . . . . . . . . . . . . . . . . . . . . . . . . . . . . . . . . . . . . . . . . . . . . . . . . . . . . . . . . 226. Summary of Modified Files for Utilities.. . . . . . . . . . . . . . . . . . . . . . . . . . . . . . . . 247. Summary of New Files for Fuzzy Metering.. . . . . . . . . . . . . . . . . . . . . . . . . . . . 268. Parallel Modules Called from Fuzzymeter and Watch_fuzzymeter . 369. Description of the Fuzzy Table’s Layout in Memory.. . . . . . . . . . . . . . . . . 42
10. Summary of New MMS Files for Configuration Management. . . . . . . 7111. Regression Test Results for Incident Detection... . . . . . . . . . . . . . . . . . . . . . . 8812. Equation Error Checks Performed in Build RMDB... . . . . . . . . . . . . . . . . . 9313. Equation Error Checks Performed by Fuzzymeter Upon Start-Up... 9614. CPU Requirements of Processes Over a 2-Hour Period.. . . . . . . . . . . . . . 99

1
INTRODUCTION
This report documents the implementation of the Fuzzy Logic Ramp Metering
Algorithm at the Northwest District of the Washington State Department of Transportation
(WSDOT). The preliminary stages of the software documentation and the software
integration plan were carried out under a previous WSDOT/TransNow research grant. For
documentation of the pre-existing code that now interfaces with the Fuzzy Logic Ramp
Metering Algorithm, see Taylor and Meldrum, 1997.
Three reports represent the culmination of the Fuzzy Logic Ramp Metering
Algorithm project. 1) This programmer’s guide contains the software design for the new
and modified code, the integration procedure, the results of software regression testing, the
test results of new functionality, a discussion of the performance evaluation software used,
the algorithm’s transferability to other regions, and recommendations for the future. 2) See
“Evaluation of a Fuzzy Logic Ramp Metering Algorithm: A Comparative Study Among
Three Ramp Metering Algorithms used in the Greater Seattle Area” for the research
approach, evaluation method, and the on-line test results of the Fuzzy Logic Ramp
Metering Algorithm (Taylor and Meldrum, 2000). 3) For information regarding the
algorithm design and tuning technique, see the technical report “Algorithm Design, User
Interface, and Optimization Procedure for a Fuzzy Logic Ramp Metering Algorithm: A
Training Manual for Freeway Operations Engineers” (Taylor and Meldrum, 2000).
2
SOFTWARE DESIGN
The Fuzzy Logic Ramp Metering Algorithm was implemented in a manner parallel
to the other processes within the Transportation Management Software (TMS). Fuzzy
metering is implemented as the last Traffic Analysis Program (TAP) before the Real Time
Data Base (RTDB) is scrolled. All TAPS read an input file created during the data base
build. In the case of fuzzymeter, it reads “fuzzy_meter.eqn” produced by running
build_rmdb. All TAPS execute their calculations every 20 seconds when rt_skeleton sets
their particular start flag. As soon as the rt_skeleton receives the flag that a TAP has
completed or timed-out (whichever comes first), rt_skeleton will begin the next process.
Watch_fuzzymeter was implemented as a utility in a manner parallel to the other
stand-alone utilities. It updates the display of the fuzzymeter calculations every 20 seconds
when it is called from rt_skeleton. It is called from rt_skeleton after the other watch utilities
have completed. (The TAPS are executed before the RTDB is scrolled, and the utilities are
executed after the RTDB has been scrolled.)
All modified and new code contains internal documentation in the source code,
which is more detailed than that given here. This report contains supplementary
documentation to provide an overview of the software design. For the psuedo code given,
the bulleted level of indentation refers to the software control structure. Module names are
in boldface. Defined constants are in all capital letters.
MODIFIED CODE
The Fuzzy Logic Ramp Metering Algorithm interfaces with the Ramp Metering Data
Base (RMDB), real-time skeleton, operator console, and 170s. Through the RMDB, the
user can specify the inputs for each metered lane and define the control parameter defaults.
The real-time skeleton executes all real-time processes at the appropriate time. Through the
operator console, the operators can monitor and adjust the Fuzzy Logic Ramp Metering
3
Algorithm. With changes to rmdc_comm, fuzzymeter can send its metering rates to the
170s. All total, approximately 77,000 lines of code were modified to integrate the
algorithm. These modifications were for the controller interface (not the controller itself)
and are specific to Seattle’s TSMC.
Ramp Metering Database
To incorporate the fuzzy ramp metering algorithm, additional global parameters
were added to the RMDB. New fuzzy metering parameters allow the operators to enable
and tune the algorithm. The resulting fuzzy metering rates are written to new elements in
RMDB. To add these new elements to the RMDB, changes to the RMDB were made in
rmdb.h and rmdb_tbl.c. To parse the new fuzzy parameters and fuzzy equations in the
input file, modifications were made to build_rmdb.c, rmdb_sub.c, and tok_tabl.c. The
prototypes for the new functions to parse the fuzzy equations were added to
rmdb_func_prot.h. This section describes in detail the changes made to each file and the
psuedo code for the new functions. Table 2 summarizes the modifications for each file
related to the RMDB.
Changes to rmdb.h
1) Define indices for two new group names
#define FUZZYMETER_PARAMS 20
#define FUZZYMETER_EQNS 21
2) Modify the structure rmdb_file_pointers (structure rmdb_table_list points to this table
as well as other tables) to include a FILE pointer for fuzzy_meter.eqn. This is for the
temporary equation file created by build_rmdb and used by fuzzymeter to build the
fuzzy table.
3) Modify the structure for rm_dc_data_col to include the three new 170_Data
parameters, _MeterRateLane1, _MeterRateLane2 and _MeterRateLane3, which store
the resulting fuzzy logic ramp metering rates for each lane.

4
4) Modify the structure for rm_dc_data_col to include the 52 new
Fuzzy_Meter_Parameters that include dynamic range limits, rule weights, operator
permit fuzzy control. The parameter specifications are given in Table 1.
5) Change defined indices to enumerated constants. (The values are equivalent.)
Changes to rmdb_tbl.c
1) Add the two new group names Fuzzymeter_Parameters and Fuzzymeter_Equations to
the group_table array. This array is of the structure fddb_group_table, defined in
fddb.h. The structure itself does not need modification. This array must correspond
to the group name indices defined in rmdb.h.
2) Modify the minimum, maximum, default, and ep_mask arrays to include initial values
for the new parameters (See Table 1). These arrays are of structure type
rm_dc_data_col defined in rmdb.h. The arrays must fit this structure.
3) Add new parameters to the name_table. This array is of type fddb_name_table, which
is defined in fddb.h. The structure itself does not need modification. This array must
correspond with parameter structure for data column in rmdb.h.
4) Add new group names and element names to output_list array. This array is of the
structure fddb_output_list, defined in fddb.h. The structure itself does not need
modification. The output list must correspond with the parameter structure and group
indices defined in rmdb.h.

5
Table 1. Fuzzy Metering Parameters
NAME DESCRIPTION CODING UNIT MIN MAX DEFAULT EXAMPLE
AdvQueueOccHigh1 High end of dynamic range for Advance Queue Occ, lane 1 USHORT1P % 0.0% 100.0% 30.0% AdvQueueOccHigh1 = 30.0%
AdvQueueOccHigh2 High end of dynamic range for Advance Queue Occ, lane 2 USHORT1P % 0.0% 100.0% 30.0% AdvQueueOccHigh2 = 30.0%
AdvQueueOccHigh3 High end of dynamic range for Advance Queue Occ, lane 3 USHORT1P % 0.0% 100.0% 30.0% AdvQueueOccHigh3 = 30.0%
AdvQueueOccLow1 Low end of dynamic range for Advance Queue Occ, lane 1 USHORT1P % 0.0% 100.0% 12.0% AdvQueueOccLow1 = 12.0%
AdvQueueOccLow2 Low end of dynamic range for Advance Queue Occ, lane 2 USHORT1P % 0.0% 100.0% 12.0% AdvQueueOccLow2 = 12.0%
AdvQueueOccLow3 Low end of dynamic range for Advance Queue Occ, lane 3 USHORT1P % 0.0% 100.0% 12.0% AdvQueueOccLow3 = 12.0%
AdvQueueOccWt1 Weight for Adv Queue Occupancy Rule, lane 1 UBYTE1 N/A 0.0 25.5 4.0 AdvQueueOccWt1 = 4.0
AdvQueueOccWt2 Weight for Adv Queue Occupancy Rule, lane 2 UBYTE1 N/A 0.0 25.5 4.0 AdvQueueOccWt2 = 4.0
AdvQueueOccWt3 Weight for Adv Queue Occupancy Rule, lane 3 UBYTE1 N/A 0.0 25.5 4.0 AdvQueueOccWt3 = 4.0
DownOccHigh High end of dynamic range for Downstream Occupancy USHORT1P % 0.0% 100.0% 25.0% DownOccHigh = 25.0%
DownOccLow Low end of dynamic range for Downstream Occupancy USHORT1P % 0.0% 100.0% 11.0% DownOccLow = 11.0%
DownSpeedHigh High end of dynamic range for Downstream Speed USHORT1 MPH 0.0 100.0 55.0 DownSpeedHigh = 55.0
DownSpeedLow Low end of dynamic range for Downstream Speed USHORT1 MPH 0.0 100.0 40.0 DownSpeedLow = 40.0
DownSpVs_OccVbWt Weight for Very Small Speed and Very Big Occ Rule UBYTE1 N/A 0.0 25.5 4.0 DownSpVs_OccVbWt= 4.0

6
NAME DESCRIPTION CODING UNIT MIN MAX DEFAULT EXAMPLE
LocalOccHigh HIgh end of dynamic range for Local Occupancy USHORT1P % 0.0% 100.0% 25.0% LocalOccHigh = 25.0%
LocalOccLow Low end of dynamic range for Local Occupancy USHORT1P % 0.0% 100.0% 11.0% LocalOccLow = 11.0%
LocalOccVbWt Weight for Local Very Big Occupancy Rule UBYTE1 N/A 0.1 25.5 2.5 LocalOccVbWt =2.5
LocalOccBWt Weight for Local Big Occupancy Rule UBYTE1 N/A 0.1 25.5 1.0 LocalOccBWt = 1.0
LocalOccMWt Weight for Local Medium Occupancy Rule UBYTE1 N/A 0.1 25.5 1.0 LocalOccMWt = 1.0
LocalOccSWt Weight for Local Small Occupancy Rule UBYTE1 N/A 0.1 25.5 1.0 LocalOccSWt = 1.0
LocalOccVsWt Weight for Local Very Small Occupancy Rule UBYTE1 N/A 0.1 25.5 1.0 LocalOccVsWt = 1.0
LocalSpeedHigh High end of dynamic range for Local Speed USHORT1 MPH 0.0 100.0 55.0 LocalSpeedHigh = 55.0
LocalSpeedLow Low end of dynamic range for Local Speed USHORT1 MPH 0.0 100.0 35.0 LocalSpeedLow = 35.0
LocSpVs_OccVbWt Weight for Local Very Small Speed and Very Big Occ Rule UBYTE1 N/A 0.0 25.5 3.0 LocSpVs_OccVbWt = 3.0
LocalSpeedSWt Weight for Local Small Speed Rule UBYTE1 N/A 0.0 25.5 1.0 LocalSpeedSWt = 1.0
LocalSpeedBWt Weight for Local Big Speed UBYTE1 N/A 0.0 25.5 1.0 LocalSpeedBWt = 1.0
LocSpVb_OccVsWt Weight for Local Very Big Speed and Very Small Occ Rule UBYTE1 N/A 0.0 25.5 1.0 LocSpVb_OccVsWt = 1.0
MeterRateHigh1 High limit for metering rate produced by fuzzy controller, lane 1 UBYTE1 VPM 0.0 25.5 19.3 MeterRateHigh1 = 19.3
MeterRateHigh2 High limit for metering rate produced by fuzzy controller, lane 2 UBYTE1 VPM 0.0 25.5 19.3 MeterRateHigh2 = 19.3
MeterRateHigh3 High limit for metering rate produced by fuzzy controller, lane 3 UBYTE1 VPM 0.0 25.5 19.3 MeterRateHigh3 = 19.3

7
NAME DESCRIPTION CODING UNIT MIN MAX DEFAULT EXAMPLE
MeterRateLow1 Low limit for metering rate produced by fuzzy controller, lane 1 UBYTE1 VPM 0.0 25.5 3.0 MeterRateLow1 = 3.0
MeterRateLow2 Low limit for metering rate produced by fuzzy controller, lane 2 UBYTE1 VPM 0.0 25.5 3.0 MeterRateLow2 = 3.0
MeterRateLow3 Low limit for metering rate produced by fuzzy controller, lane 3 UBYTE1 VPM 0.0 25.5 3.0 MeterRateLow3 = 3.0
PermitFuzzyMr1 Enable fuzzy control at this meter YES_NO FLAG NO YES NO PermitFuzzyMr1 = NO
PermitFuzzyMr2 Enable fuzzy control at this meter YES_NO FLAG NO YES NO PermitFuzzyMr2 = NO
PermitFuzzyMr3 Enable fuzzy control at this meter YES_NO FLAG NO YES NO PermitFuzzyMr3 = NO
QueueOccHigh1 High end of dynamic range for Queue Occupancy, lane 1 USHORT1P % 0.0% 100.0% 30.0% QueueOccHigh1 = 30.0%
QueueOccHigh2 High end of dynamic range for Queue Occupancy, lane 2 USHORT1P % 0.0% 100.0% 30.0% QueueOccHigh2 = 30.0%
QueueOccHigh3 High end of dynamic range for Queue Occupancy, lane 3 USHORT1P % 0.0% 100.0% 30.0% QueueOccHigh3 = 30.0%
QueueOccLow1 Low end of dynamic range for Queue Occupancy, lane 1 USHORT1P % 0.0% 100.0% 12.0% QueueOccLow1 = 12.0%
QueueOccLow2 Low end of dynamic range for Queue Occupancy, lane 2 USHORT1P % 0.0% 100.0% 12.0% QueueOccLow2 = 12.0%
QueueOccLow3 Low end of dynamic range for Queue Occupancy, lane 3 USHORT1P % 0.0% 100.0% 12.0% QueueOccLow3 = 12.0%
QueueOccWt1 Weight for Queue Occupancy Rule, Lane 1 UBYTE1 N/A 0.0 25.5 2.0 QueueOccWt1 = 2.0
QueueOccWt2 Weight for Queue Occupancy Rule, Lane 2 UBYTE1 N/A 0.0 25.5 2.0 QueueOccWt2 = 2.0
QueueOccWt3 Weight for Queue Occupancy Rule, Lane 3 UBYTE1 N/A 0.0 25.5 2.0 QueueOccWt3 = 2.0

8
Changes to build_rmdb.c
Build_rmdb opens and reads rmdb_input.fil, builds RMDB, creates temporary files
(loop_names.lst, inc_det.eqn, btl_neck.eqn, speed_traps.lst, stn_aggr.eqn,
station_names.lst, actv_anal.eqn) that are later used to build tables in global memory for
TAPS. It also sorts names, loops, stations, and speeds traps and writes them to a file
rtfmdbname.srt to be used for later creation of the RTDB and Five Minute Data Base
(FMDB). Build_rmdb starts a long chain of events, calling function upon function. For
details on how build_rmdb works, see Taylor and Meldrum, 1997.
To incorporate the Fuzzy Logic Ramp Metering Algorithm, build_rmdb must also
read the fuzzy parameters and fuzzy equations from rmdb_input.fil and create a temporary
file called fuzzy_meter.eqn that is subsequently used by fuzzymeter to build the fuzzy table
in global memory.
The only changes made to build_rmdb.c itself are to open the temporary equation
file fuzzy_meter.eqn before reading rmdb_input.fil and to close this file after reading
rmdb_input.fil. However, there are several changes in functions in rmdb_sub.c that are
indirectly called from build_rmdb.c.
Changes to rmdb_sub.c
Process_input_special_case is called from get_param. A pointer to the
function get_param is in the read_fddb_file, which contains a function state table that tells
read_fddb (called from build_rmdb) how to parse the input file rmdb_input.fil.
Process_input_special_case calls functions to handle the current input line, depending
on the current group index. The only change to process_input_special_case is to call
get_fuzzy_eqn when the current group index is FUZZY_EQNS.
Two new functions were added to rmdb_sub.c: 1) get_fuzzy_eqn and 2)
get_next_fuz_line. Note: Fuzzy parameters are not a special parameter case, so they
are handled by load_param, which is called from get_param.

9
1) Get_fuzzy_eqn — Parses current line from data file and writes it to a fuzzy
equation file in a fixed format. (See training manual on how to write fuzzy equations,
Taylor and Meldrum, 2000.) (Note: The return values are used differently than they are
for the other functions called from process_input_special_case. END_LINE is
returned regardless of error or success so that get_param does not continue to parse the
same line. If an error occurs, the message is logged by fddb_error, and the line is
skipped by returning END_LINE.)
• Calculate pointer to data column
• Make sure data column is a RAMP_MTR or DATA_STN. Otherwise, write error
message and return to get next line
• Get cabinet:loop name from line buffer using strtok
Note: strtok uses 1 or more skip characters as delimiters between tokens. Strtok
returns the pointer to the next token in the input buffer and writes a NULL at the
end of the token. Subsequent calls using NULL as the first argument continue to
parse the same buffer and remember the current location
• Verify that cabinet:loop name is in proper format with get_cab_loop_name
• If the cabinet name does not match the current group name
Write error to fddb_err and return to get next line
• If string is not of fuzzy equation type containing string ‘FM’
Write wrong equation type error to fddb_err and return to get next line
• Initialize current pointer to the beginning of a buffer that will subsequently be written to
fuzzy equation file

10
Note: Before writing the reformatted equation is written to the fuzzy equation file, the
buffer is written to a temporary buffer. This buffering technique allows writing
over the equation (skipping) if an error is found.
• Write cabinet:loop name to buffer and update pointer
• Initialize number of loops written to this line to 1
• For each station location
• Initialize the number of station/loops at this location to zero
• Do-while stations are of same type (the loop executes the first time and continues
to execute as long as the `&' delimiter is between station names)
Note: `&' is used to delimit between two stations of the same location type, and `|'
is used to delimit stations of different location type
• If the allowable number of loops is exceeded, write error message to fddb_error
One loop or station is allowed for the UP and HOV_BYPASS input (see
training manual). The LOCAL, QUEUE and ADV_QUEUE allow up to five
loops or stations. The DOWNSTREAM input allows up to 20 loops or
stations
• Get cab:loop name from input line using strtok
• If no token is found
• Get next line from input file with get_next_fuz_line
• If line_type is not a parameter, write error message to fddb_error and
return to get next line

11
• Try again to get loop detector (or station) name from input line using strtok
• Verify that cabinet:loop name is in proper format with get_cab_loop_name
• If the cabinet name does not match the current group name
Write error to fddb_err and return to get next line
• If this location is QUEUE, ADV_QUEUE, or HOV_BYPASS, get the number
of samples used to calculate the input or % adjustment applied to lane
• If number of samples or % adjustment is not found
Write error to fddb_err and return to get next line
• If location is HOV_BYPASS
• If % adjustment applied to lane is outside of 0-100 range
Write error to fddb_err and return to get next line
• If loop name is not of HOV passage type containing string “HP”
Write error to fddb_err and return to get next line
• If location is ADV_QUEUE
• If loop name is of HOV passage type containing string “HP”
Write error to fddb_err and return to get next line
• Increment the number of loops found for this station
• If the number of loops already written to this line in buffer is 3, begin on next
line because this line is full
• If the location is QUEUE, ADV_QUEUE, or HOV_BYPASS
Write the detector name and number of samples or percentage of adjustment to
buffer and update buffer pointer

12
• Else
Write detector name to buffer and update buffer pointer
• Increment the number of loops written to this line in buffer
• Get delimiter from input line using strtok (expecting `&' or `|' to continue
equation)
• If location is greater than or equal to ADV_QUEUE and delimiter is not found
End of sucessful equation was found. Write equation to buffer and return.
• Else if delimiter is not found
Not expecting end of equation. Write error message with fddb_error and
return to get next line
• Else if token is `&'
Write delimiter to buffer and update pointer
• End of do-while no more stations of this type
• If location is HOV BYPASS and delimiter is `|', error because too many locations
Write error message with fddb_error and return to get next line
• Else If delimiter is not equal to `|', there is a missing delimiter. (The equation was
expected to continue.)
Write error message with fddb_error and return to get next line
• Else write delimiter to buffer and update pointer
• End for each station location
13
2) Get_next_fuz_line — This new function is called from get_fuzzy_eqn
when a fuzzy equation continues past more than one line. This function is identical to
get_next_btl_line (located in /fddb/rmdb/rmdb_sub.c) except for the error message.
Although the same function could have been used for both with slight modification,
changes to bottleneck were avoided.
• Loop until line type returned by get_next_fuz_line is a blank, form feed, or
comment
Get_next_line returns line_type of comment, curly_brace, square_bracket, or
parameter. (See Taylor and Meldrum, 1997, for details). Line is stored in global
memory tl->lb_ptr->line_buffer
• If find wrong line_type, write error
• Else return with parameter type line

14
Table 2. Summary of Modified Files for the Ramp Metering Data Base
FILE MODIFICATION
Rmdb.h 1) Defined indices for new group names FUZZYMETER_PARAMS and
FUZZYMETER_EQNS.
2) Declared file pointer for FUZZY_METER.EQN.
3) Declared new elements _MeterRateLane1, _MeterRateLane2 and
_MeterRateLane3 in 170_Data group of data column.
4) Declared 52 new Fuzzy_Meter_Parameters in data column.
5) Changed defined indices to enumerated constants.
Rmdb_tbl.c 1) Added two new group: [Fuzzymeter_Parameters] and [Fuzzymeter_Equations]
2) Initialized minimum, maximum, default, and ep_mask for the new parameters
in data column
3) Added 52 new Fuzzymeter_Parameters and 3 in 170_Data group to the
fddb_name_table.
4) Added new Fuzzymeter_Parameters to the fddb_output_list
Build_rmdb.c 1) Added Open/Close of fuzzy_meter.eqn file.
2) Deleted path for include files.
rmdb_sub.c 1) Added get_fuzzy_eqn.
2) Added get_next_fuz_line .
3) Modified process_input_special_case to call get_fuzzy_eqn when the
current group index is FUZZY_EQNS.
Tok_tabl.cAdded fuzzy metering options to loop_name entry. Declare char arrays fuzzylane1,
fuzzylane2, and fuzzylane3 to be "FM1", "FM2", and "FM3"
Rmdb_func_prot.h Added function prototypes for get_fuzzy_eqn and get_next_fuz_line

15
Real-Time Processes
To start up fuzzymeter with the other processes and incorporate the stand-alone
utility watch_fuzzymeter, minor changes were made to the real-time processes. Table 3
describes the changes made to tms_startup.c, rt_skeleton.c, tms_realtime.h,
event_common.h, tap.h, and stop_tms.com. For a further description of how the real-time
processes work, see Taylor and Meldrum, 1997.

16
Table 3. Summary of Modified Files for the Real-Time Processes
FILE MODIFICATION
tms_startup.c 1) Delete paths for include *.h
2) Added start_tms_process for fuzzymeter
3) Associate event flags for watch_fuzzymeter
4) Added start_process for tmsuw
5) Changed to support a developmental version
rt_skeleton.c 1) Deleted paths for include *.h.
2) Added run_process_wait for fuzzymeter
3) Added run_process_alt_bit for watch_fuzzymeter.
4) Associate to event flags for watch_fuzzymeter.
5) Added local flag wm_v_20_sec_tick.
6) Fixed version string to include ‘V’ on log_tms_event.
tms_realtime.h 1) Added in event flags: RT_V_FUZZYMETER_START and
RT_V_FUZZYMETER_DONE. Add event masks for those
events: RT_M_FUZZYMETER_START and RT_M_
FUZZYMETER_DONE.
2) Added WATCH_FUZZYMETER Event Flag Cluster Name
Descriptors
3) Added WATCH_FUZZYMETER Event Flag Bit Assignment
event_common.h Defined facility number for FUZZYMETER
Tap.hDefined action codes FM_TABLE_START and FM_SET_START
used in fuzzy meter table
stop_tms.com Added Stop Fuzzymeter

17
Communications Protocol
To implement Fuzzy Metering, the changes listed in Table 4 were made to
opc_comm_sub.c, rmdc_comm.h, rmdc_comm.c, rmdc_comm_sub.c, and fddb.h.
Changes to opc_comm
To tune the Fuzzy Metering Algorithm from the operator consoles running TMS, it
is necessary that the new fuzzy parameters are sent to TMS along with the other tunable
parameters. Within opc_comm_sub.c, a module called wc_search_param_tuning_list
contains a list of parameters that are sent to TMS upon receiving a parameter request from a
PC. The fuzzy metering parameters given in Table 1 were added to this module’s list.
Changes to rmdc_comm
Prior to this project, the VAX and 170 software did not support the capability of
implementing a central metering rate directly. The 170 was able to implement a metering
rate adjustment from the central VAX (like the bottleneck metering rate adjustment), but
because most of the logic was embedded in the 170 logic, the old design precluded the
ability to directly implement a central metering rate. Prior to this project, the only way that
it could be done was to set both the minimum and maximum allowable metering rates for a
given ramp to equal the desired rate. This method was found to be too cumbersome for the
implementation of the Fuzzy Logic Ramp Metering Algorithm, particularly when
supporting multiple ramp metering algorithms simultaneously. For this reason, the
software was altered both on the VAX and 170s to support the capability of directly
implementing ramp metering rates from the VAX.
We modified the communications protocol between the VAX and 170. This
involved minor code changes to rmdc_comm_sub.c, rmdc_comm.c, and the 170. A new
data poll containing direct metering rates was created, called
DATA_POLL_METER_RATE. The old data poll was renamed DATA_POLL_
RATE_ADJ. The command bytes for these data polls were defined in rmdc_comm.h as
shown in Figure 1. The new data poll is requested from rmdc_comm.c and

18
rmdc_comm_sub.c, which builds and sends it using a new module called
build_and_queue_170_meter_rate (Figure 1).
SOH To From CMD
(=0x45)
Seq No. Count
(=4)
Header
CRCByte 0 Byte 1 Byte 2 Byte 3 Byte 4 Byte 5 Byte 6-7
Btl
Adj
Frate
Lane 1
FRate
Lane 2
FRate
Lane 3
Data CRC
Byte 8 Byte 9 Byte 10 Byte 11 Byte 12-13
Figure 1. New Poll Format for Central Metering Rates

19
Table 4. Summary of Modified Files for Communications Protocol
FILE MODIFICATION
opc_comm_sub.c Fuzzy Parameters added to parameter list in wc_search_param_tuning_list
Rmdc_comm.h 1) Renamed DATA_POLL to DATA_POLL_RATE_ADJ
2) Defined DATA_POLL_METER_RATE as 0x45
Rmdc_comm.c 1) Renamed DATA_POLL to DATA_POLL_RATE_ADJ.
2) Added new case to handle data poll DATA_POLL_METER_RATE on line
1782. The new case calls process_data, which handles the
DATA_POLL_METER_RATE the same as the case for
DATA_POLL_RATE_ADJ.
3) Replaced call to build_and_queue_170_msg with call to
build_and_queue_170_meter_rate for test case on line 2725.
4) Replaced call to build_and_queue_170_msg with call to
build_and_queue_170_meter_rate for multi_port case on line 2992
5) Added if-else to send statement to send appropriate data poll. This if
statement is not necessary now that all of the 170s can handle the new data
poll.
Rmdc_comm_sub.c 1) Renamed DATA_POLL to DATA_POLL_RATE_ADJ, line 2914.
2) Added new data poll function on build_and_queue_170_meter_rate,
line 2922.
3) Replaced test menu case 'P' to build_and_queue_170_meter_rate from
build_and_queue_170_msg, line 6761.
4) Added if-else to send appropriate type of data poll. This if statement is not
necessary now that all of the 170s can handle the new data poll.
fddb.h Redefined Lane Status 0x0F from LS_COMM_FAIL to LS_FUZZY.

20
It is possible for bottleneck and fuzzymeter to operate simultaneously on different
lanes within the same cabinet (although this is not recommended). Because fuzzy metering
is lane specific while bottleneck is cabinet specific, there is not a flag to indicate whether
bottleneck or fuzzymeter is in effect for that cabinet. Instead, a fuzzy metering rate of 0
indicates to the 170 that fuzzy metering is disabled for that lane. If the fuzzy metering rate
is disabled or cannot be calculated because of insufficient data, the bottleneck metering rate
is used on that lane, unless bottleneck is also disabled. If both central algorithms are
disabled, the 170 determines the metering rate, which is usually the local metering rate.
Essentially, the control hierarchy is unaltered except that fuzzy metering has been added to
the top of the ramp metering decision tree. In general, inexplicit override of one controller
over another is undesirable but was difficult to avoid in this case because fuzzymeter is lane
specific while bottleneck is cabinet specific. For further details regarding the control
hierarchy between the ramp metering algorithms, see the training manual (Taylor and
Meldrum, 2000).
Fuzzymeter is similar to bottleneck in that both algorithms disable the central
metering rate or rate adjustment before writing over it. Every time bottleneck is called, it
writes -128 to the metering rate adjustment for all cabinets, which has the effect of
disabling the Bottleneck adjustment if –128 is sent to the 170. Then bottleneck writes over
the adjustments for which OperPermitBtl is enabled. Likewise, Fuzzymeter initially writes
0 into MeterRateLane1, MeterRateLane2, and MeterRateLane3, which signifies to the 170
that the metering rates are disabled. If PermitFuzzy1, PermitFuzzy2, or PermitFuzzy3 is
enabled, fuzzy metering calculates a metering rate for the specified lanes and writes over the
disabled metering rates.
In the future, it may be desirable to add a third central metering algorithm and have
the capability to choose between them. It would not be difficult to add this capability.
Additional parameters will need to be added to data columns within RMDB, including flags
to indicate which algorithm to use in each lane and storage space for the metering rates

21
generated by each central algorithm. If logic were to be used to choose a metering rate, this
new main would be treated as an additional TAP. Because each TAP is completed before
the next begins, logic to choose metering rates could use the results from fuzzymeter,
bottleneck, and any additional algorithms. (However, because the fuzzy logic controller
already uses system-wide information to arrive a metering rate, we expect that performance
would degrade with a piece-meal control approach.)
Changes to fddb.h
The lane status is among the data returned from the 170 to the VAX. The
interpretation of the lane status has been redefined as shown in Table 5. The value of the
lane status indicates the mode of metering last implemented by the 170.

22
Table 5. Lane Status
Value Group Meter
Status
Single Meter
Status
Condition
0x00 OFF Meter Off Meter Off
0x01 (L) (L) Local rate used
0x02 (L)Q (L) Q Adjust Local w/ Queue Adjustment
0x03 (L)AQ (L) AQ Adjust Local w/ Advance Q Adjustment
0x04 (B) (B) Bottleneck rate used
0x05 (B)Q (B)Q Adjust Bottleneck w/ Queue Adjustment
0x06 (B)AQ (B) AQ Adjust Bottleneck w/ Advance Q Adjustment
0x07 (P) (P) Prediction rate used
0x08 (P)Q (P) Q Adjust Prediction w/ Queue Adjustment
0x09 (P)AQ (P) AQ Adjust Prediction w/ Advance Q Adjustment
0x0A (T) (T) TOD rate used
0x0B (T)A (T) Q Adjust TOD w/ Queue Adjustment
0x0C (T)AQ (T) AQ Adjust TOD w/ Advance Q Adjustment
0x0D -P- Police Mode Police Mode – Steady Green
0x0E E D/F Comm is Failed or Disabled
0x0F FUZY Fuzzy Control Fuzzy Meter Control

23
170
To correctly interpret the new data poll containing direct metering rates, the 170
logic was modified. Because fuzzymeter directly implements a rate without further
adjustments, the new logic must bypass the local logic within the 170 when this occurs.
This design allows the existing logic to remain in place and operate as before, unless a
nonzero (enabled) fuzzy metering rate is provided. The new logic functions in this way:
For each lane
• If fuzzy metering rate > 0 (it is not disabled)
Implement fuzzy meter rate
• Else
Proceed with logic for other ramp metering algorithms
The 170 interprets the fuzzy metering rate as an unsigned byte ranging between 0 and 255,
corresponding to metering rates between 0 and 25.5 VPM. (The bottleneck adjustment
ranges between -12.8 and 12.7 VPM.)
Note that any central ramp metering algorithm which needs to directly implement a
metering rate can use this same mechanism by putting the desired metering rates in
MeterRate1, MeterRate2, and MeterRate3 of the RMDB. Rmdc_comm will send the direct
rates through the new data poll, and the 170 will implement them. The use of the new data
poll and new 170 logic is not limited to use by fuzzymeter. Currently, Fuzzy Metering is
the only algorithm which implements rates directly.

24
Utilities
Minor modifications were made to the utilities listed in Table 6.
Table 6. Summary of Modified Files for Utilities
FILE MODIFICATION
Get_20_sec_data.c Defined GET_20_LOG in order to create text files.
Ifdef's have been added so that *.dat files are no longer created unless
GET_20_DAT is defined.
Watch_actv_anal.c Moved mvwrtstr and mvwrtstr_attrib to watch_sub.c
Watch_bottleneck.c Moved mvwrtstr and mvwrtstr_attrib to watch_sub.c
Watch_fmdb.c Moved mvwrtstr and mvwrtstr_attrib to watch_sub.c
Watch_rmdc.c Moved mvwrtstr and mvwrtstr_attrib to watch_sub.c
Wfmdb.c Moved mvwrtstr and mvwrtstr_attrib to watch_sub.c
Wrtdb.c Moved mvwrtstr and mvwrtstr_attrib to watch_sub.c
Tms_lib_func_prot.h Added mvwrtstr, mvwrtstr_vertical, mvwrtstr_attrib,
mvwrtstr_underline

25
NEW CODE
To implement the Fuzzy Logic Ramp Metering Algorithm, the new files in Table 7
were created. These files reside in the directory tms_code/rt_skeleton/fuzzymeter. Overall,
approximately 8000 lines of code were added to the TMSC VAX software.

26
Table 7. Summary of New Files for Fuzzy Metering
FILEFUNCTION
Fuzzymeter.c Main process called every 20 seconds from rt_skeleton for
calculating rates. Calls build_fuzzymeter_table and
calc_fuzzymeter.
Watch_fuzzymeter.c Stand alone process, updated every 20 seconds when called by
rt_skeleton. Calls to build_watch_fuzzymeter_table and
calc_watch_fuzzymeter.
Fuzzymeter_sub.c Contains modules called by watch_fuzzymeter and fuzzymeter:
build_fuzzymeter_table, build_watch_fuzzymeter_table,
calc_fuzzymeter, calc_watch_fuzzymeter, calc_fuzzy_rate,
calc_watch_fuzzy_rate, fuzzify, rules, watch_rules, and
defuzzify.
Fuzzy.h Contains definitions, structures, function prototypes, and compile
options for fuzzymeter and watch_fuzzymeter.
Watch_sub.c mvwrtstr — Move Cursor and Write String
mvwrtstr_attrib — Move Cursor and Write String w/ Attributes
mvwrtstr_vertical — Move Cursor and Write String Vertically
mvwrtstr_underline — Move Cursor and Write Underline
Edit_20_sec.c A stand-alone utility that automatically rewrites the input file used
by get_20_sec_data and starts the 20-second data collector at the
desired time. Allows automatic weekday collection of specified
data for the morning and afternoon metering periods. This
process is not required to run fuzzymeter, nor is it required to run
start_20_sec (which starts get_20_sec_data). See Performance
Evaluation Software for discussion.

27
Fuzzymeter.c
Fuzzymeter starts up the main, builds the fuzzymeter analysis table, and then
waits for an event flag from the real time skeleton to calculate metering rates. Fuzzymeter
is integrated as a TAP and is designed in a parallel manner to the other TAPS.
General_process_startup
Connect_to_mailbox
Write_to_crash_log
• Associate to event flag cluster
• Clear all event flags
Log_tms_event
Log_tms_common
Write_to_crash_log
• Get time
• Compose message
Write_to_mailbox_nowait
Map_to_RTDB
Map_to_global_section
Init_rtdb_tl
Map_to_RMDB
Map_to_global_section

28
Init_rmdb_tl
• Build_fuzzymeter_table (see fuzzymeter_sub.c)
While SHUTDOWN_TMS event flag is clear
Wait for fuzzymeter start event flag with SYS$WAITFR
This flag gets set in rt_skeleton by SYS$SETEF
Clear fuzzymeter start flag with SYS$CLREF
calc_fuzzymeter (see fuzzymeter_sub.c)
Set fuzzymeter done flag with SYS$SETEF
Test shutdown flag with SYS$READEF
cond_code of SS$_WASCLR means do not shutdown
cond_code of SS$_WASSET means shutdown
Watch_fuzzymeter.c
Watch_fuzzymeter is a stand=alone utility. Upon start up, watch_fuzzymeter
builds the watch fuzzymeter analysis table. The user chooses which metered lane to
observe. Upon receiving an event flag from rt_skeleton, watch_fuzzymeter writes the
controller crisp inputs, fuzzified inputs, and rule outcomes, rule weights, and metering
rates are written to the screen. Watch_fuzzymeter is integrated as a utility program and is
designed in a manner parallel to the other utility programs.
Map_to_RTDB
Map_to_global_section
Init_rtdb_tl
Map_to_RMDB
29
Map_to_global_section
Init_rmdb_tl
Get_iochan – usually keyboard
Get_term_char —get I/O channel number for TTY port
Set_port_partial – TTY driver handles flow control
Build_watch_fuzzymeter_table (see fuzzymeter_sub.c)
If no fuzzy equation sets were returned by build_watch_fuzzymeter_table
Print error message
Set error_flag to YES
• Else
Set error_flag to NO
While error_flag is NO
Print Banner
Print User Options
Get a character from user input
Convert character to upper case
If user did not choose watch fuzzymeter
Break from while loop
Else
Print user input
30
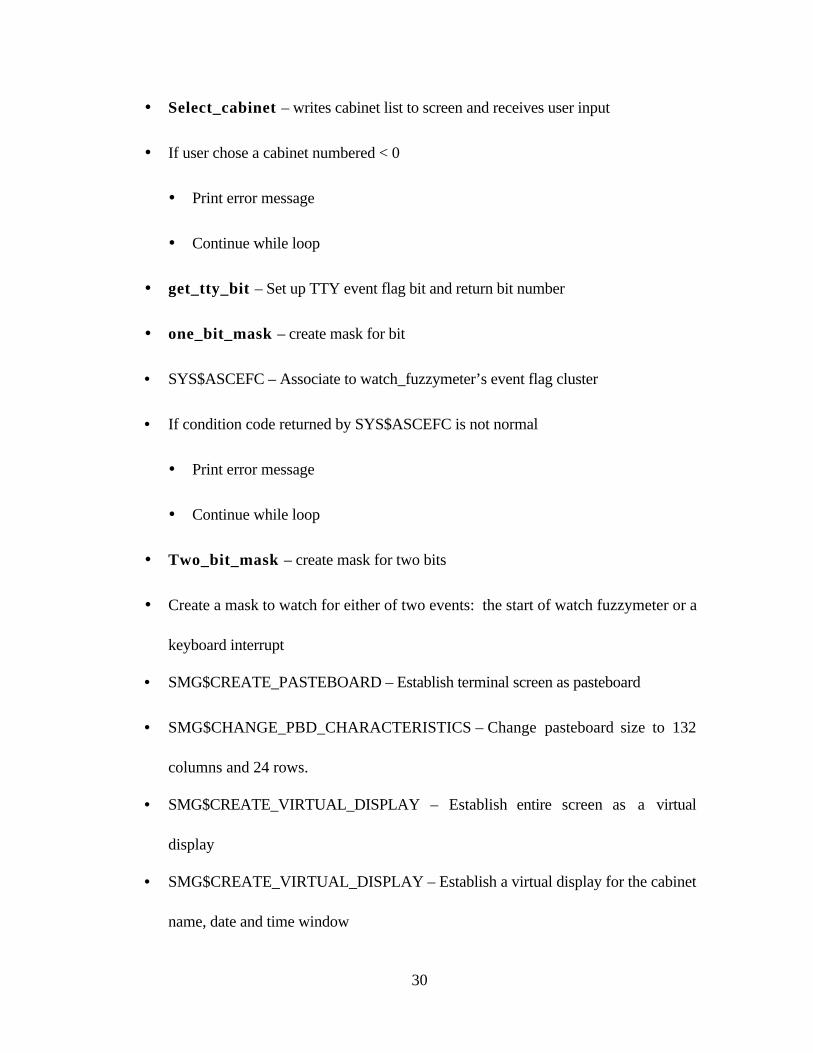
Select_cabinet – writes cabinet list to screen and receives user input
If user chose a cabinet numbered < 0
Print error message
Continue while loop
get_tty_bit – Set up TTY event flag bit and return bit number
one_bit_mask – create mask for bit
• SYS$ASCEFC – Associate to watch_fuzzymeter’s event flag cluster
• If condition code returned by SYS$ASCEFC is not normal
Print error message
Continue while loop
Two_bit_mask – create mask for two bits
Create a mask to watch for either of two events: the start of watch fuzzymeter or a
keyboard interrupt
• SMG$CREATE_PASTEBOARD – Establish terminal screen as pasteboard
• SMG$CHANGE_PBD_CHARACTERISTICS – Change pasteboard size to 132
columns and 24 rows.
• SMG$CREATE_VIRTUAL_DISPLAY – Establish entire screen as a virtual
display
• SMG$CREATE_VIRTUAL_DISPLAY – Establish a virtual display for the cabinet
name, date and time window

31
• SMG$CREATE_VIRTUAL_DISPLAY – Establish a virtual display for the prompt
message window
• SMG$CREATE_VIRTUAL_DISPLAY – Establish a virtual display for the
diagnostic message window
• SMG$PASTE_VIRTUAL_DISPLAY – Paste entire screen as a virtual display
• SMG$PASTE_VIRTUAL_DISPLAY – Paste a virtual display for the prompt
message window
• SMG$PASTE_VIRTUAL_DISPLAY – Paste a virtual display for the cabinet
name, date and time window
• SMG$PASTE_VIRTUAL_DISPLAY – Paste a virtual display for the diagnostic
message window
• SMG$DRAW_LINE – Draw horizontal lines on the I/O window
• SMG$DRAW_LINE – Draw vertical lines on the I/O window
• SMG$DRAW_LINE – Draw horizontal lines on the rules window
• SMG$DRAW_LINE – Draw vertical lines on the rules window
Get cabinet name from indexed cabinet list
Find_fddb_cl_name – retrieve index to specified cabinet within RMDB
Calculate pointer to cabinet column in RMDB
• Retrieve cabinet’s roadway type from RMDB
• Retrieve cabinet’s milepost from RMDB
• Retrieve cabinet’s location name from RMDB
32
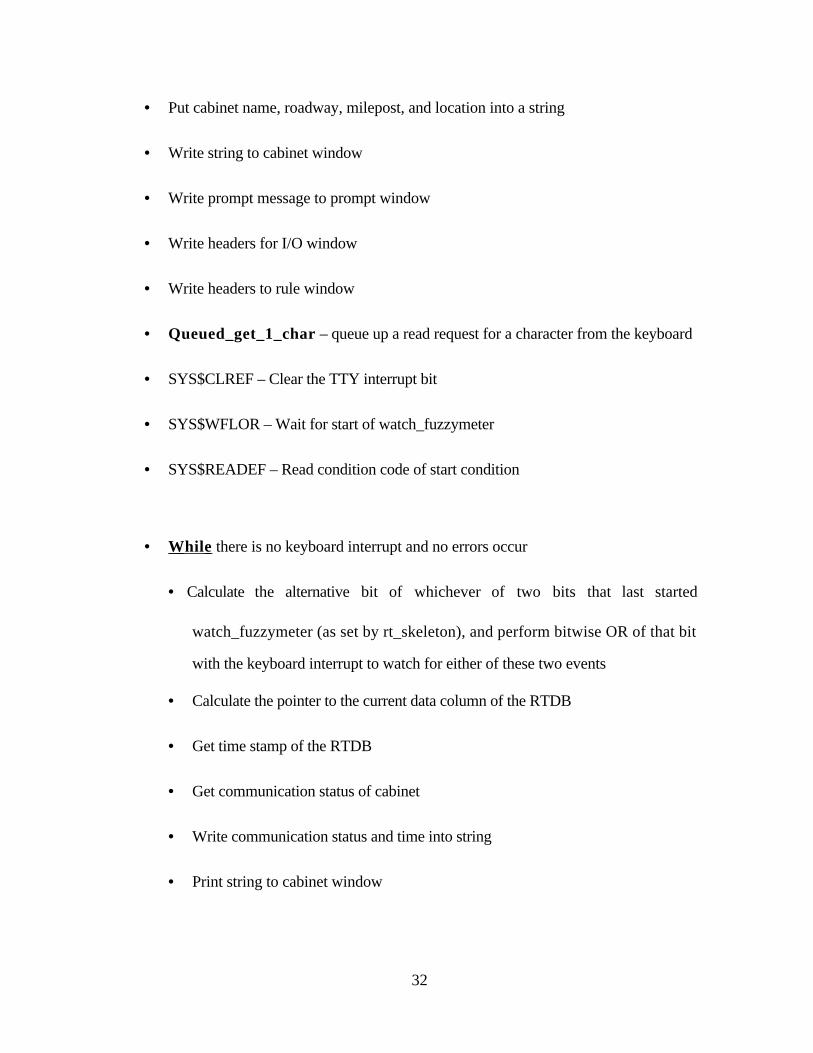
• Put cabinet name, roadway, milepost, and location into a string
• Write string to cabinet window
• Write prompt message to prompt window
• Write headers for I/O window
• Write headers to rule window
• Queued_get_1_char – queue up a read request for a character from the keyboard
• SYS$CLREF – Clear the TTY interrupt bit
• SYS$WFLOR – Wait for start of watch_fuzzymeter
• SYS$READEF – Read condition code of start condition
• While there is no keyboard interrupt and no errors occur
• Calculate the alternative bit of whichever of two bits that last started
watch_fuzzymeter (as set by rt_skeleton), and perform bitwise OR of that bit
with the keyboard interrupt to watch for either of these two events
• Calculate the pointer to the current data column of the RTDB
• Get time stamp of the RTDB
• Get communication status of cabinet
• Write communication status and time into string
• Print string to cabinet window

33
• Calc_watch_fuzzymeter – calculate a metering rate and return data and
diagnostic flag (see fuzzymeter_sub.c)
• If diagnostic flag is YES (calc_watch_fuzzymeter could not successfully
calculate a fuzzy metering rate)
• SMG$ERASE_DISPLAY — Erase old I/O data
• SMG$ERASE_DISPLAY — Erase old rule data
• Convert the rule weights from floats to integers to use them as data validity
flags. (The rule weights were set to zero by calc_watch_fuzzymeter if
their input data was bad)
• If the local occupancy input has good data
• Write the local occupancy and local speed data to the I/O window
• If the downstream input has good data, write the downstream
occupancy and downstream speed to the I/O window
• If the queue input has good data, write the queue data to the I/O window
• If the advance queue input has good data, write the advance queue data
to the I/O window
• Write the HOV data to the I/O window. (A zero HOV bypass volume
may mean that there was zero passage or that the data were bad.)
• Write diagnostic message to the diagnostic window

34
• Else (diagnostic flag was NO — calc_watch_fuzzymeter successfully
calculated a metering rate)
• SMG$ERASE_DISPLAY – erase diagnostic window
• Write data to I/O window
• Scroll old metering rate data on I/O window
• Write new metering rate data to I/O window
• Write rule weights to rule window
• Write rule outcomes to rule window
• Move cursor to the end of prompt message on prompt window
• Wait for start of watch_fuzzymeter
• SYS$WFLOR – Wait for start of watch_fuzzymeter
• SYS$READEF – Read condition code of start condition
• If interrupt bit was set
• Clear the TTY interrupt bit
• Associate to the TTY Reservation EFC
• Clear the TTY reservation bit
• Clear any outstanding TTY input
• SMG$DELETE_PASTEBOARD – unpaste all virtual displays and clear screen

35
• Cancel any outstanding input from the keyboard
• SMG$DELETE_PASTEBOARD – unpaste all virtual displays and clear screen
• Restore the saved TTY characteristics
Fuzzymeter_sub.c
Fuzzymeter_sub.c contains modules which are called from the main processes
fuzzymeter and watch_fuzzymeter. Watch_fuzzymeter displays fuzzymeter’s input,
internal calculations, and output for a specified metered lane. Ideally, these processes
would share identical modules to ensure that they use the same data and calculations.
However, this module sharing was not entirely feasible for a couple of reasons.
Watch_fuzzymeter does its calculation during a different time frame of the real-time data
cycle, so it must use indeces different than those of fuzzymeter for the recently scrolled
RTDB. We did not want to clutter up a global database by storing all of the internal
calculations for all ramp meters, nor did we want to slow processing time of the TAPS.
Instead, watch_fuzzymeter stores an index of pointers for each metered lane. When users
specify the metered lane that they want to examine, internal data are stored for only that
metered lane. In general, watch_fuzzymeter’s modules need to store additional information
in addition to that of fuzzymeter, but otherwise their modules are identical. Each row of
Table 8 list the parallel modules called from fuzzymeter and watch_fuzzymeter, along with
a brief overview. If you make a change to one of these fuzzymeter modules, be sure that
you examine the parallel watch_fuzzymeter module to see if it needs the change as well.

36
Table 8. Parallel modules called from Fuzzymeter and Watch_fuzzymeter
Fuzzymeter Modules Watch_fuzzymeter Modules Overview
Build_fuzzymeter_table Build_watch_fuzzymeter_table Builds of table of pointers to the RMDB and
RTDB data needed to calculate the metering rates
for each lane
Calc_fuzzymeter --
Calls calc_fuzzy_rate
Calc_watch_fuzzymeter --
Calls calc_watch_fuzzy_rate
Obtains the inputs to the controller
Calc_fuzzy_rate --
Calls fuzzify, rules, and
defuzzify
Calc_watch_fuzzy_rate --
Calls fuzzify, watch_rules, and
defuzzify
Calculates the metering rate
Fuzzify Fuzzify Converts each crisp input into a set of fuzzy
classes
Rules Watch_rules Evaluates rule base
Defuzzify Defuzzify Converts a set of fuzzy metering rates to a single
numerical metering rate

37
Build_fuzzymeter_table — Parses the fuzzymeter equation file (which was
created by build_rmdb and must adhere to the format specified in the training manual,
Taylor and Meldrum, 2000) searches for the cabinet name in RMDB and station names in
RTDB, and writes the action codes and data pointers to fuzzymeter table. (See Table 9.)
Initialize memory allocation for fuzzymeter table
Write header to table: start table label, number of sets, table size, date/time
Open fuzzymeter equation file
Initialize counters and flags
While not EOF, read line of fuzzy_meter.eqn (equation file)
Get cabinet name at start of equation
Initialize location to LOCAL
Save pointer to beginning of set
Initialize error flag to no error
Find_fddb_cl_name — Search for cabinet name in Field Device Data Base
(FDDB) and return index
Extract metered lane number from the cabinet:loop name
If cabinet name is not in RMDB, write error message and set error flag
If "FM" is not given after cabinet name to be fuzzy metered, write error message
and set error flag

38
If an error occurred, send error message and search for beginning of next equation
If more memory is needed to write next set, allocate additional memory
Write set header to table: start set code, lane number, space for number of bytes in
set, pointer to cabinet in RMDB (for metered lane to be fuzzy metered)
Get token from eqn_file
While token is a delimiter (not end of equation)
If token is `|', increment location
Get next token. Expecting a station:loop name
If a token is not returned
Build_tap_error — station:loop name not found
• Set error flag
Break out of while-loop to skip equation. (Error handling at end of while-
loop resets pointer to the beginning of set and looks for next equation.)
If location is QUEUE, ADV_QUEUE, or HOV_BYPASS
Parse token with strtok to get the station:loop name
If station:loop name is not found, set error flag and break out of while-loop
to skip this equation
Parse same token with strtok to get a number token which represents either
the number of samples to calculate input or the percentage of HOV bypass
volume adjustment applied to this lane

39
If number token is not found, set error flag and break out of while-loop to
skip this equation
Convert number of samples from ASCII to integer
If number of samples is less then 128, convert it to an unsigned char (1
byte)
Else number token is OK
• Build_tap_error — number of samples is too large
• Set error flag
• Break out of while-loop to skip this equation
• Else
• Store station:loop name
• If location is HOV_BYPASS
• If loop name is not of type “HP”
• Set error flag
• Break out of while-loop to skip this equation
Write location code to table
Search_rtdb_name_table — search for index to loop in RTDB
If loop index is not found
Build_tap_error – “Stn/Loop name is not in RTDB”
Set error flag

40
Break out of while-loop to skip this equation
• Else station/loop name is good
Obtain offset in table for stn_loop in RTDB based on index
Write offset to table
If location is QUEUE, ADV_QUEUE, or HOV_BYPASS, write number of
samples or percentage of HOV bypass to table
Get next token — expecting a delimiter or cabinet
If next token is NULL (OK if EOF)
build_tap_error — Null result when parsing fuzzy equation set error flag
Set error flag
Break out of while-loop to skip this equation
End of while-loop that reads equation
If location is less than ADV_QUEUE
Point to set start to skip this equation because it does not have enough station
locations. (Fscanf has already grabbed the next token.)
Else if no errors occurred (the equation is good)
Increment the number of sets in the table
Calculate the number of bytes in the set
Write the number of bytes in set to table

41
Else an error occurred during parsing (NULL fscanf result)
Point to set start to skip this equation
Get token to search for next equation
End of while-loop to read file of equations
Close fuzzy equation file
Write number of sets and table size into table header
Write table end label, check sum (calculate number bytes in table)
Trim table size
Return base address of table

42
Table 9. Description of the Fuzzy Table’s Layout in Memory
LABELS ITEM # BYTES DESCRIPTION---------------------------------------------------------------------------- (begin table)table_base-> code 1 FM_TABLE_START
ushort 2 number of setsulong 4 table sizedate_time 8 struct system_time
---------------------------------------------------------------- (end of table header)-------------------------------------------------------------------------------------------------------------------------------- (beginning of sets)set_start code 1 FM_SET_START
byte 1 lane_no -- which ramp lane to meter(1, 2, or 3)
byte 1 # of bytes in setulong 4 col_ptr to cabinet in RMDB
(to get fuzzy parameters)---------------------------------------------------------------- (end of a set header)---------------------------------------------------------------- (begin local stations)
byte 1 LOCAL -- adjacent mainline station typeushort 2 rtdb_offset to LOCAL station in RTDB
---------------------------------------------------------------- (repeat for each local input)byte 1 DOWN -- downstream station typeushort 2 rtdb_offset to downstream station in RTDB
---------------------------------------------------------------- (repeat for each downstream input)byte 1 UP -- upstream station typeushort 2 rtdb_offset to upstream station in RTDB
---------------------------------------------------------------- (end of upstream input)byte 1 QUEUE -- ramp queue station typeushort 2 rtdb_offset to queue loop in RTDBbyte 1 # of samples to calculate queue_occ
---------------------------------------------------------------- (repeat for each queue input)byte 1 ADV_QUEUE -- station typeushort 2 rtdb_offset to advance queue loop in RTDBbyte 1 # of samples to calculate adv_queue_occ
---------------------------------------------------------------- (repeat for each advance queue input)byte 1 HOV_BYPASS – this input is optionalushort 2 rtdb_offset to bypass loop in RTDBbyte 1 percentage of HOV bypass volume adjustment to apply
---------------------------------------------------------------- (end of HOV input)---------------------------------------------------------------- (end of a set)---------------------------------------------------------------- (begin next set)Repeat for each set (every metered lane of every cabinet with fuzzy metering)---------------------------------------------------------------- (end of all sets)-------------------------------------------------------------------------------------------------------------------------------- (label end of table)
code 1 TABLE_ENDshort 2 check sum -- # of bytes in table
---------------------------------------------------------------- (end of table)

43
Build_watch_fuzzymeter_table — This module is identical to
build_fuzzymeter_table, except that it stores an array of structures containing pointers
to the beginning of each set for every metered lane and then returns the number of sets.
Subsequently, the set number that the watch_fuzzymeter user chooses is the index to the
array of structures of pointers to access the specified data set.
Initialize memory allocation for cabinet list
Initialize memory allocation for fuzzymeter table
Write header to table: start table label, number of sets, table size, date/time
Open fuzzymeter equation file
Initialize counters and flags
While not EOF, read line of FUZZY_METER.EQN (equation file)
Get cabinet name at start of equation
Initialize location to LOCAL
Save pointer to beginning of set
Initialize error flag to no error
Find_fddb_cl_name — Search for cabinet name in Field Device Data Base
(FDDB) and return index
Extract metered lane number from the cabinet:loop name
If cabinet name is not in RMDB, write error message and set error flag

44
If "FM" is not given after cabinet name to fuzzy meter, write error message and set
error flag
If an error occurred, send error message and search for beginning of next equation
If more memory is needed to write next set, allocate additional memory
Write set header to table: start set code, lane number, space for number of bytes in
set, pointer to cabinet in RMDB (for fuzzy parameters)
Get token from eqn_file
While token is a delimiter (not end of equation)
If token is `|', increment location
Get next token. Expecting a station:loop name
If a token not returned
build_tap_error — station:loop name not found
• Set error flag
Break out of while-loop to skip equation. (Error handling at end of while
loop resets pointer to the beginning of set and looks for next equation)
If location is QUEUE, ADV_QUEUE, or HOV_BYPASS
Parse token with strtok to get the station:loop name
If station:loop name is not found, set error flag and break out of while-loop
to skip this equation

45
Parse same token with strtok to get a number token which represents either
the number of samples to calculate input or the percentage of HOV bypass
volume adjustment applied to this lane
If number token is not found, set error flag and break out of while-loop to
skip this equation
Convert number of samples from ASCII to integer
If number of samples is less then 128, convert it to an unsigned char (1
byte)
Else number token is OK
• Build_tap_error — number of samples is too large
• Set error flag
• Break out of while-loop to skip this equation
• Else
• Store station:loop name
• If location is HOV_BYPASS
• If loop name is not of type “HP”
• Set error flag
• Break out of while-loop to skip this equation
Write location code to table
Search_rtdb_name_table — search for index to loop in RTDB

46
If loop index is not found
Build_tap_error – “Stn/Loop name is not in RTDB”
Set error flag
Break out of while-loop to skip this equation
• Else station/loop name is good
Obtain offset in table for stn_loop in RTDB based on index
Write offset to table
If location is QUEUE, ADV_QUEUE, or HOV_BYPASS, write number of
samples or percentage of HOV bypass to table
Get next token — expecting a delimiter or cabinet
If next token is NULL (OK if EOF)
Build_tap_error — Null result when parsing fuzzy equation set error flag
Set error flag
Break out of while-loop to skip this equation
End of while-loop that reads equation
If location is less than ADV_QUEUE
Point to set start to skip this equation because it does not have enough station
locations. (Fscanf has already grabbed the next token.)
Else if no errors occurred (the equation is good)

47
Increment the number of sets in the table
Calculate the number of bytes in the set
Write the number of bytes in set to table
• If necessary, get additional memory for the cabinet list
• Write the pointer of the set beginning to the cabinet list
Else an error occurred during parsing (NULL fscanf result)
Point to set start to skip this equation
Get token to search for next equation
End of while-loop to read file of equations
Close fuzzy equation file
Write number of sets and table size into table header
Write table end label, check sum (calculate number bytes in table)
Trim table size
Return base address of table
48
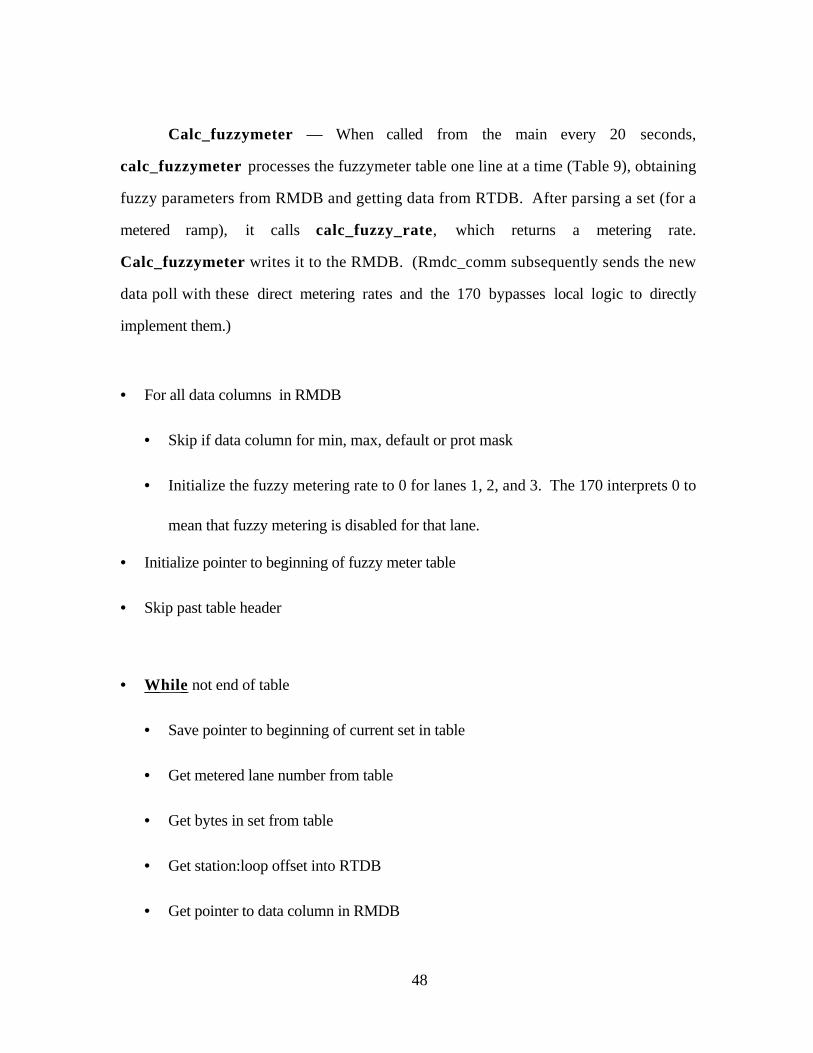
Calc_fuzzymeter — When called from the main every 20 seconds,
calc_fuzzymeter processes the fuzzymeter table one line at a time (Table 9), obtaining
fuzzy parameters from RMDB and getting data from RTDB. After parsing a set (for a
metered ramp), it calls calc_fuzzy_rate, which returns a metering rate.
Calc_fuzzymeter writes it to the RMDB. (Rmdc_comm subsequently sends the new
data poll with these direct metering rates and the 170 bypasses local logic to directly
implement them.)
• For all data columns in RMDB
• Skip if data column for min, max, default or prot mask
• Initialize the fuzzy metering rate to 0 for lanes 1, 2, and 3. The 170 interprets 0 to
mean that fuzzy metering is disabled for that lane.
• Initialize pointer to beginning of fuzzy meter table
• Skip past table header
• While not end of table
• Save pointer to beginning of current set in table
• Get metered lane number from table
• Get bytes in set from table
• Get station:loop offset into RTDB
• Get pointer to data column in RMDB
49
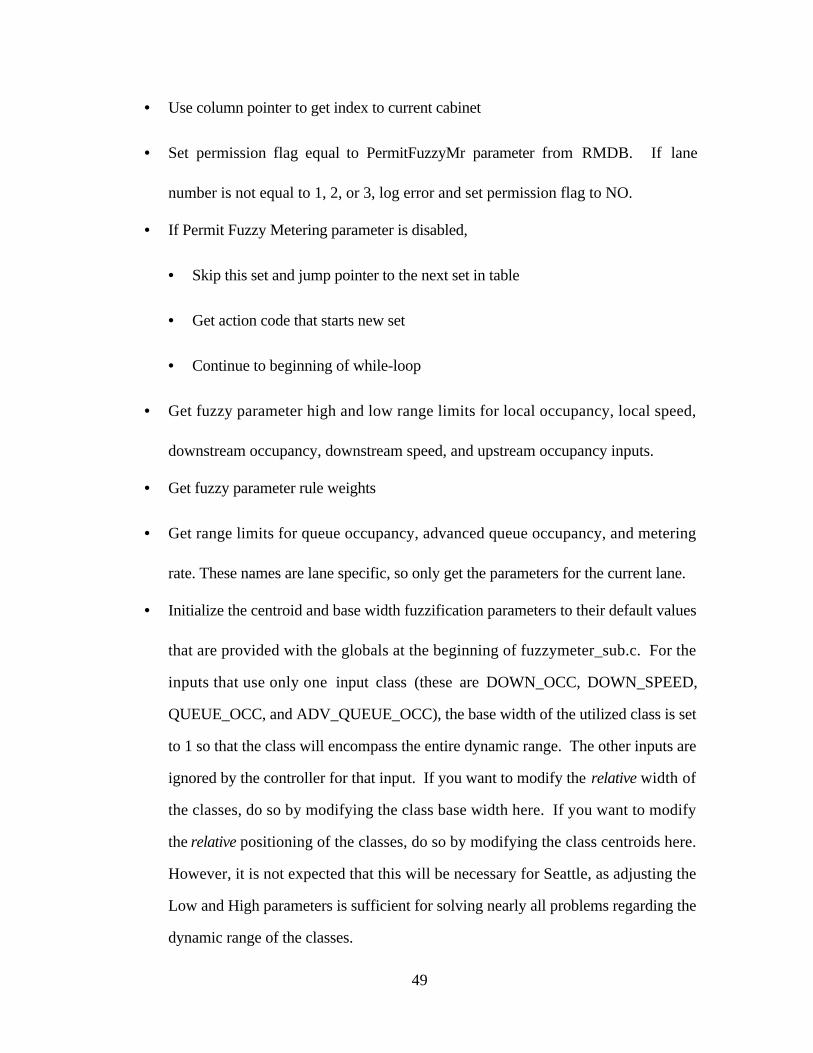
• Use column pointer to get index to current cabinet
• Set permission flag equal to PermitFuzzyMr parameter from RMDB. If lane
number is not equal to 1, 2, or 3, log error and set permission flag to NO.
• If Permit Fuzzy Metering parameter is disabled,
• Skip this set and jump pointer to the next set in table
• Get action code that starts new set
• Continue to beginning of while-loop
• Get fuzzy parameter high and low range limits for local occupancy, local speed,
downstream occupancy, downstream speed, and upstream occupancy inputs.
• Get fuzzy parameter rule weights
• Get range limits for queue occupancy, advanced queue occupancy, and metering
rate. These names are lane specific, so only get the parameters for the current lane.
• Initialize the centroid and base width fuzzification parameters to their default values
that are provided with the globals at the beginning of fuzzymeter_sub.c. For the
inputs that use only one input class (these are DOWN_OCC, DOWN_SPEED,
QUEUE_OCC, and ADV_QUEUE_OCC), the base width of the utilized class is set
to 1 so that the class will encompass the entire dynamic range. The other inputs are
ignored by the controller for that input. If you want to modify the relative width of
the classes, do so by modifying the class base width here. If you want to modify
the relative positioning of the classes, do so by modifying the class centroids here.
However, it is not expected that this will be necessary for Seattle, as adjusting the
Low and High parameters is sufficient for solving nearly all problems regarding the
dynamic range of the classes.

50
• Get next action code
• Initialize data usable flag to YES
• Initialize bypass volume to 0
• While fetching and processing data from RTDB station:loops
(Note: Fuzzymeter does not initialize any data in the RTDB. It only fetches and
uses the data from the RTDB and RMDB. Calc_fuzzymeter prepares these
inputs to the controller.)
• Initialize number of good stn/loops for this station type to zero
• Initialize data usability flag to yes
• Initialize number of good station:loops for this data type to zero
• Initialize sum of volumes for this station type to zero
• Initialize sum of scan count for this station type to zero
• If action code is HOV_BYPASS
Number of samples used to calculate input is 6
• Else
Number of samples used to calculate input is 3

51
• Do-While same station type (action codes are the same)— loop is executed at
least once. For each time this loop is executed, one input to the fuzzy controller
is calculated. (See rules for writing fuzzy equations in training manual for
details)
• Get station:loop offset into RTDB from table
• If action code is QUEUE or ADV_QUEUE
Get number of samples used to calculate input
• If action code is HOV_BYPASS
Get percentage of HOV adjustment to lane
• For each sample needed to calculate input data
• Calculate pointer to RTDB cabinet from station:loop offset
• Unpack_rtdb_loop_stn data
• If data are good – this occurs when the number of loops is greater than
1 (this means that it's a station, not a loop) and the flag not equal to 0
(the station data are usable) OR if the number of loops is 1 (loop data
rather than station) and the flag is 1 (the loop data are good). Note:
These data have already been interpolated if it is necessary and possible.
• If action code is not DOWN
• Increment number of good stations used to calculate this input
• Increment number of total loops (over all stations) to calculate
this input
• Sum scan count

52
• Sum volume to later calculate speed
• Else action code is DOWN. (DOWN is handled differently than the
other locations because it uses the maximum occupancy and
associated speed rather than averaging all inputs)
• If this occupancy is the maximum of the downstream occupancy
inputs or if no other good data were found
• Set number of good stations to calculate this input to 1
• Set number of total loops for all stations at this location to be
the number of loops returned by unpack_rtdb_loop_stn
• Set sum of scan count to the scan count returned by
unpack_rtdb_loop_stn
• Set sum of volume to the volume count returned by
unpack_rtdb_loop_stn
• Set old action code to equal current action code
• Get next action code
• End of do-while loop to process stations of same type
• If more than one station/loop is good, calculate controller inputs
• Calculate average occupancy using scan count and total number of good
loops
• If location code < QUEUE (meaning that it is a mainline input)

53
Calculate average speed for that location using average volume and
occupancy
• Switch based on old action code (detector location)
• In LOCAL or DOWN case, enter the calculated occupancy and speed in
controller input array
• In UP case,
• Enter the calculated occupancy into controller input array for
upstream input
• If there were no usable local data
• Enter the upstream occupancy as the local occupancy
• Enter the upstream speed as the local speed
• Set data usable flag to YES
• In QUEUE or ADV_QUEUE case, enter the calculated occupancy in the
controller input array
• In HOV_BYPASS case, convert from vehicles summed over all
samples to vehicles/minute
• Else (data for this location are insufficient to calculate inputs) — Check to see if
the lack of data at this location makes the rule base incomplete. If the rule base
is incomplete, set the data_usable flag to NO so that local metering will be used
instead.
• Switch based on old action code (detector location)

54
• In LOCAL case,
Set data usable to NO_LOCAL. (A complete rule base requires this
input! Do not change this logic because the output of the fuzzy logic
controller may not be undefined otherwise. The NO_LOCAL state
differs from the NO state in that there is still the possibility that the
upstream input will be a good substitute for the local input. In this
event, the data usable state would be returned to YES.)
• In DOWN case,
Set the rule weights to zero for the rules that use downstream inputs.
(The rule base does not require this input for completeness.)
• In UP case,
Set the rule weights to zero for the rules that use this input. (By default,
this input is not used for upstream rules, but only as a substitute for
the local data in the event they are bad.)
• In QUEUE case,
• Increase the advance queue rule weight by the queue rule weight to
compensate for the bad queue data
• Set the queue rule weight to zero
• In ADV_QUEUE case,
• If the queue weight is zero (meaning that there are no usable ramp
inputs), set the data usable flag to NO. (The fuzzy controller
requires this input so that the resulting fuzzy metering rate is not too
restrictive.)
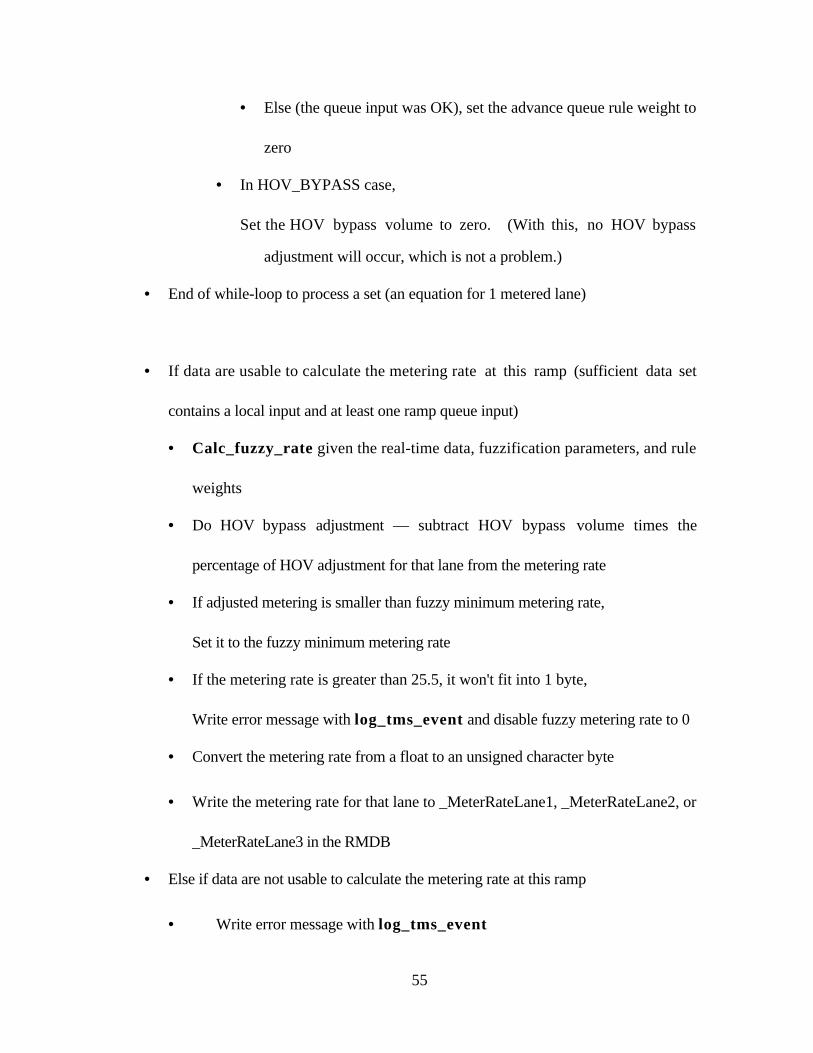
55
• Else (the queue input was OK), set the advance queue rule weight to
zero
• In HOV_BYPASS case,
Set the HOV bypass volume to zero. (With this, no HOV bypass
adjustment will occur, which is not a problem.)
• End of while-loop to process a set (an equation for 1 metered lane)
• If data are usable to calculate the metering rate at this ramp (sufficient data set
contains a local input and at least one ramp queue input)
• Calc_fuzzy_rate given the real-time data, fuzzification parameters, and rule
weights
• Do HOV bypass adjustment — subtract HOV bypass volume times the
percentage of HOV adjustment for that lane from the metering rate
• If adjusted metering is smaller than fuzzy minimum metering rate,
Set it to the fuzzy minimum metering rate
• If the metering rate is greater than 25.5, it won't fit into 1 byte,
Write error message with log_tms_event and disable fuzzy metering rate to 0
• Convert the metering rate from a float to an unsigned character byte
• Write the metering rate for that lane to _MeterRateLane1, _MeterRateLane2, or
_MeterRateLane3 in the RMDB
• Else if data are not usable to calculate the metering rate at this ramp
• Write error message with log_tms_event

56
• End of while-loop to process table
calc_watch_fuzzymeter — This module is identical to calc_fuzzymeter
computationally, but differs in functionality. It returns a diagnostic flag indicating whether
or not it was possible to calculate a metering rate. It returns a pointer to the fuzzymeter
table and a diagnostic message. In global memory, it stores the controller inputs from the
RTDB. Because the RTDB is scrolled after the TAPS (of which fuzzymeter is one), the
indexing to access the RTDB for calc_watch_fuzzymeter varies from that of
calc_fuzzymeter. Instead of processing all sets within the fuzzy meter table, it only
processes one designated set. Instead of implementing the calculated metering rates, it
stores them in global memory for watch_fuzzymeter to access. Instead of calling
calc_fuzzy_rate, it calls calc_watch_fuzzy_rate.
• Initialize diagnostic flag to NO. (This flag indicates whether a rate could
successfully be calculated.)
• Initialize pointer to beginning of set to be observed
• Get metered lane number from table
• Get bytes in set from table
• Get station:loop offset into RTDB
• Get pointer to data column in RMDB
• Use column pointer to get index to current cabinet
• Set permission flag equal to PermitFuzzyMr parameter from RMDB. If lane
number is not equal to 1, 2, or 3, set permission flag to NO.
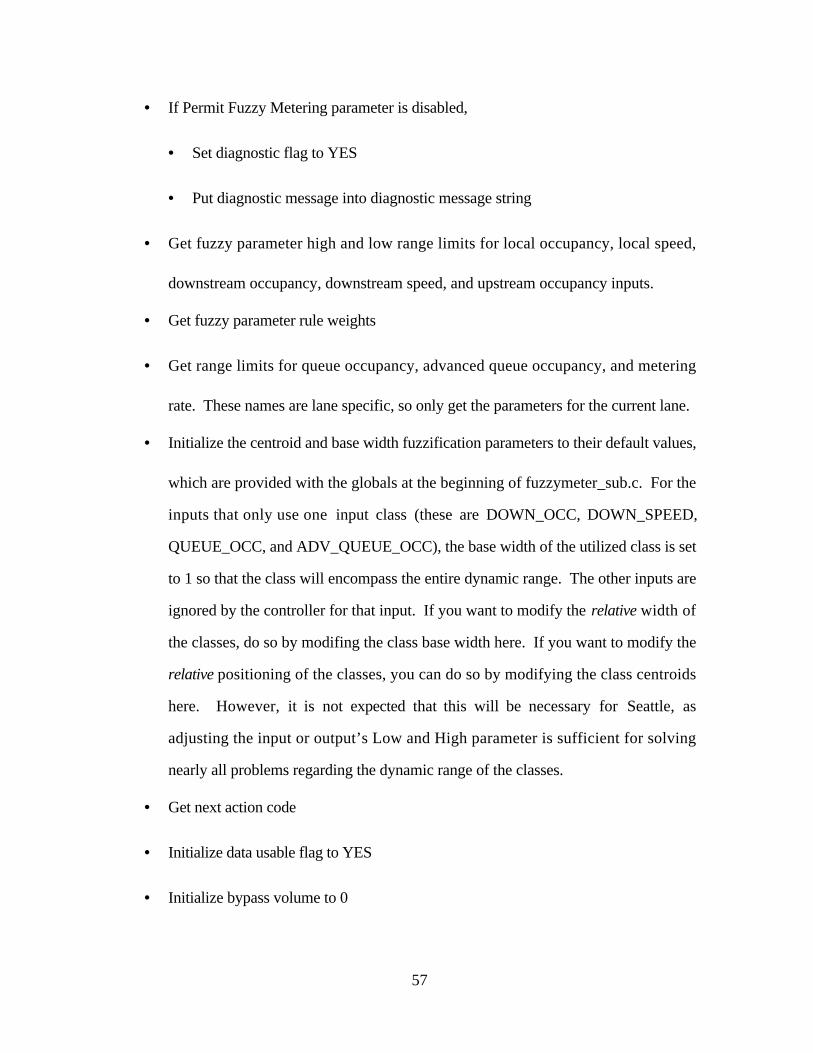
57
• If Permit Fuzzy Metering parameter is disabled,
• Set diagnostic flag to YES
• Put diagnostic message into diagnostic message string
• Get fuzzy parameter high and low range limits for local occupancy, local speed,
downstream occupancy, downstream speed, and upstream occupancy inputs.
• Get fuzzy parameter rule weights
• Get range limits for queue occupancy, advanced queue occupancy, and metering
rate. These names are lane specific, so only get the parameters for the current lane.
• Initialize the centroid and base width fuzzification parameters to their default values,
which are provided with the globals at the beginning of fuzzymeter_sub.c. For the
inputs that only use one input class (these are DOWN_OCC, DOWN_SPEED,
QUEUE_OCC, and ADV_QUEUE_OCC), the base width of the utilized class is set
to 1 so that the class will encompass the entire dynamic range. The other inputs are
ignored by the controller for that input. If you want to modify the relative width of
the classes, do so by modifing the class base width here. If you want to modify the
relative positioning of the classes, you can do so by modifying the class centroids
here. However, it is not expected that this will be necessary for Seattle, as
adjusting the input or output’s Low and High parameter is sufficient for solving
nearly all problems regarding the dynamic range of the classes.
• Get next action code
• Initialize data usable flag to YES
• Initialize bypass volume to 0
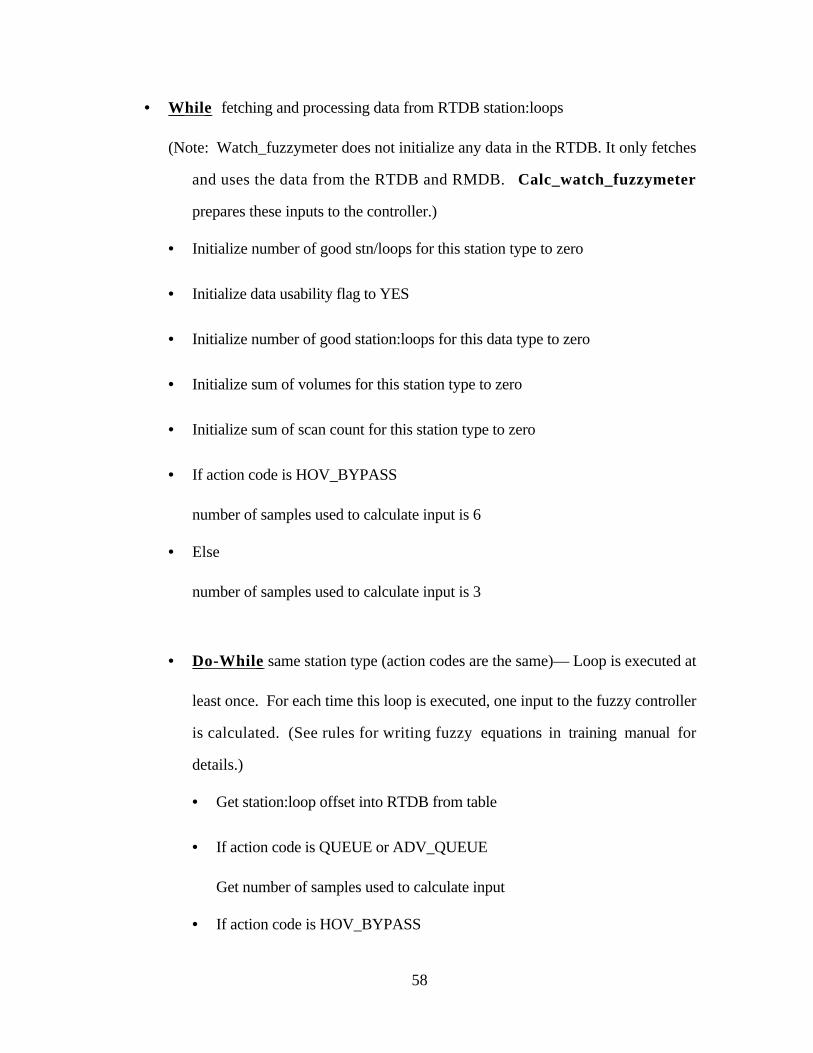
58
• While fetching and processing data from RTDB station:loops
(Note: Watch_fuzzymeter does not initialize any data in the RTDB. It only fetches
and uses the data from the RTDB and RMDB. Calc_watch_fuzzymeter
prepares these inputs to the controller.)
• Initialize number of good stn/loops for this station type to zero
• Initialize data usability flag to YES
• Initialize number of good station:loops for this data type to zero
• Initialize sum of volumes for this station type to zero
• Initialize sum of scan count for this station type to zero
• If action code is HOV_BYPASS
number of samples used to calculate input is 6
• Else
number of samples used to calculate input is 3
• Do-While same station type (action codes are the same)— Loop is executed at
least once. For each time this loop is executed, one input to the fuzzy controller
is calculated. (See rules for writing fuzzy equations in training manual for
details.)
• Get station:loop offset into RTDB from table
• If action code is QUEUE or ADV_QUEUE
Get number of samples used to calculate input
• If action code is HOV_BYPASS

59
Get percentage of HOV adjustment to lane
• For each sample needed to calculate input data
• Calculate pointer to RTDB cabinet from station:loop offset
• unpack_rtdb_loop_stn data
• If data are good — This occurs when the number of loops is greater
than 1 (meaning that it is a station, not a loop) and the flag is not equal
to 0 (the station data are usable) OR if the number of loops is 1
(meaning that the data are loop data rather than station data) and the flag
is 1 (the loop data are good). Note: These data have already been
interpolated if it is necessary and possible
• If action code is not DOWN
• Increment number of good stations used to calculate this input
• Increment number of total loops (over all stations) to calculate
this input
• Sum scan count
• Sum volume to later calculate speed
• Else action code is DOWN. (DOWN is handled differently than the
other locations because it uses the maximum occupancy and
associated speed rather than averaging all inputs)
• If this occupancy is the maximum of the downstream occupancy
inputs or if no other good data were found
• Set number of good stations to calculate this input to 1

60
• Set number of total loops for all stations at this location to be
the number of loops returned by unpack_rtdb_loop_stn
• Set sum of scan count to the scan count returned by
unpack_rtdb_loop_stn
• Set sum of volume to the volume count returned by
unpack_rtdb_loop_stn
• Set old action code to equal current action code
• Get next action code
• End of do-while loop to process stations of same type
• If more than one station/loop are good, calculate controller inputs
• Calculate average occupancy using scan count and total number of good
loops
• If location code < QUEUE (meaning that it is a mainline input)
Calculate average speed for that location using average volume and
occupancy
• Switch based on old action code (detector location)
• In LOCAL or DOWN case, enter the calculated occupancy and speed in
controller input array and store these inputs in global watch data set
• In UP case,

61
• Enter the calculated occupancy into controller input array for
upstream input and store these inputs in global watch data set
• If there were no usable local data
• Enter the upstream occupancy as the local occupancy and store
this input in global watch data set
• Enter the upstream speed as the local speed and store this input
in global watch data set
• Set data usable flag to YES
• In QUEUE or ADV_QUEUE case, enter the calculated occupancy in the
controller input array and store these inputs in global watch data set
• In the HOV_BYPASS case, convert from vehicles summed over all
samples to vehicles/minute and store this input in global watch data set
• Else (data for this location are insufficient to calculate inputs) — Check to see
whether the lack of data at this location makes the rule base incomplete. If the
rule base is incomplete, set the data_usable flag to NO so that local metering
will be used instead.
• Switch based on old action code (detector location)
• In LOCAL case,
Set data usable to NO_LOCAL. (A complete rule base requires this
input! Do not change this logic because the output of the fuzzy logic
controller may not be undefined. The NO_LOCAL state differs from
the NO state in that there is still the possibility that the upstream input

62
will be a good substitute for the local input. In this event, the data
usable state would be returned to YES.)
• In DOWN case,
Set the rule weights to zero for the rules that use downstream inputs,
(the rule base does not require this input for completeness)
• In UP case,
Set the rule weights to zero for the rules that use this input. (By default,
this input is not used for upstream rules, but only as a substitute for the
local data in the event they are bad).
• In QUEUE case,
• Increase the advance queue rule weight by the queue rule weight to
compensate for the bad data
• Set the rule weight to zero for the rule that uses this input
• In ADV_QUEUE case,
• If the queue weight was zero (this means that there are no usable
ramp inputs), set the data usable flag to NO. (The fuzzy controller
requires this input so that the resulting fuzzy metering rate is not too
restrictive.)
• Else (the queue input was OK), set the rule weight to zero for the
rule that uses this input
• In HOV_BYPASS case,
Set the HOV bypass volume to zero. (With this, no HOV bypass
adjustment will occur, which is not a problem.)

63
• End of while-loop to process a set (an equation for 1 metered lane)
• If data are usable to calculate the metering rate at this ramp (sufficient data set
contains a local input and at least one ramp queue input)
• Calc_watch_fuzzy_rate given the real-time data, fuzzification parameters,
and rule weights
• Do HOV bypass adjustment — subtract HOV bypass volume times the
percentage of HOV adjustment for that lane from metering rate
• If adjusted metering is smaller than fuzzy minimum metering rate
Set it to the fuzzy minimum metering rate
• If the metering rate is greater than 25.5, it won't fit into 1 byte
Write diagnostic message to diagnostic message string and set diagnostic flag to
YES
• Convert the metering rate from a float to an unsigned character byte
• Write the metering rate for that lane to watch data set (not to the RMDB)
• Else if data are not usable to calculate the metering rate at this ramp
Write diagnostic message to diagnostic message string and set diagnostic flag to
YES
• Return the diagnostic flag

64
calc_fuzzy_rate — This function returns a metering rate given inputs to the fuzzy
controller. If the fuzzy ramp metering algorithm were ported to other systems, this
function and those that it calls would be used because they contain the fuzzy logic
controller. All other functions interface the fuzzy logic controller with the TSMC and may
be unique to this TSMC.
• Fuzzify – Returns the fuzzy inputs given the crisp inputs and fuzzy parameters. This
function translates each input into a set of five fuzzy classes.
• Rules – Evaluates the rules given the fuzzy inputs and rule weights. Returns the fuzzy
metering classes.
• Defuzzify – Converts the fuzzy metering rates into a single numerical metering rate.
calc_watch_fuzzy_rate — This function is identical to calc_fuzzy_rate
except that it calls watch_rules rather than rules.
• Fuzzify – Returns the fuzzy inputs given the crisp inputs and fuzzy parameters. This
function translates each input into a set of five fuzzy classes.
• Watch_rules – Evaluates the rules given the fuzzy inputs and rule weights. Returns
the fuzzy metering classes.
• Defuzzify –Given the fuzzy metering rates, returns a single numerical metering rate.

65
Fuzzify — Converts each numerical input into a set of five fuzzy classes, although
some inputs do not use all five classes. For each input, it calculates the array of fuzzy
classes that indicate on a scale of 0 to 1 the degree to which each class is true. Note: By
adjusting the Low and High parameters, the dynamic range of the class can be modified.
We found that it was unnecessary to change the relative base width and relative positioning
between the fuzzy classes. Thus, inputs use the compiled defaults for the triangle base
widths and normalized centroids. If you find the need to modify the relative positioning or
relative shape of the fuzzy classes for an input, this can be done in calc_fuzzymeter and
calc_watch_fuzzymeter. For further details regarding how to adjust these classes, see
the training manual, Taylor and Meldrum, 2000.
• For each input
• If high dynamic limit is lower than the low dynamic limit
Write error message with log_tms_event
• Normalize the raw input from the parameter (Low, High) range to the (0,1) range.
All calculations internal to the fuzzy logic controller are performed on the
normalized scale to simplify calculations. In defuzzify, the resulting normalized
metering rate is rescaled to the (MeterRateLow, MeterRateHigh) range.
• Calculate very small fuzzy class. The class is 1 if the rescaled input is less than 0.
The class is 0 if the rescaled input is greater than the base width for the very small
class. In between, it's a linear relationship.
• For small, medium and big classes,
Calculate fuzzy input — It's a triangular class

66
• Calculate very big fuzzy class — The class is 1 if the rescaled input is greater than
1. The class is 0 if the rescaled input is greater than 1 minus the base width for the
very big class. In between, it's a linear relationship
Rules — Evaluate each rule and return a set of five fuzzy classes for the metering
rate given the fuzzy inputs and rule weights.
• Evaluate each rule given the fuzzy input. The degree of the rule outcome is equal to the
degree of activation of the rule premise. (A logical AND between two premises takes
the minimum of degrees in the premise.)
• Multiply each rule outcome by its rule weight
• Calculate the weighted sum of rule outcomes for each class to get the aggregated
metering fuzzy classes
Watch_rules — Identical to rules except that it stores the rule outcomes in
watch data set to be displayed by watch_fuzzymeter
• Evaluate each rule given the fuzzy input. The degree of the rule outcome is equal to the
degree of activation of the rule premise. (A logical AND between two premises takes
the minimum of degrees in the premise.)
• Store rule outcomes in watch data set
• Multiply each rule outcome by its rule weight
• Calculate the weighted sum of rule outcomes for each class to get the aggregated
metering fuzzy classes

67
Defuzzify — Use discrete fuzzy centroid to convert set of fuzzy metering rates to
a single numerical metering rate given the aggregate fuzzy metering rate classes and the
parameters for the metering rate classes.
• For each fuzzy class of metering rate
• Calculate the implicated area of the fuzzy rule outcome. (See documentation in the
training manual for details. This is the fuzzification process in reverse.)
• Calculate the centroid of the implicated area of the fuzzy class
• Accumulate numerator sum for the discrete fuzzy centroid— the area of fuzzy class
times the centroid of fuzzy class times the sum of weighted rule outcomes for that
class
• Accumulate denominator sum for discrete fuzzy centroid — the area of fuzzy class
times the sum of weighted rule outcomes for that class
• If the denominator is too small
Write error message with log_tms_event
• If MeterRateHigh is not greater than MeterRateLow for the metering rate dynamic range
limits
(Note: The resulting metering will be inside these limits because the centroid of the
end triangles is inside the Low and High limits by 1/3 of the base width.)
Write error message with log_tms_event
• Calculate the metering rate = num/den and rescale from the (0,1) range to the (Low,
High) range
• If metering rate is not within the (Low, High) range
Write an error message with log_tms_event

68
• Return metering rate
Fuzzy.h
Fuzzy.h contains definitions, structures, function prototypes, and compile options
for fuzzymeter and watch_fuzzymeter. The compile options FUZZY_DEBUG,
FUZZY_LOG, METER_LOG, and OBSERVE_ONLY warrant discussion.
The FUZZY_DEBUG option is no longer supported in the source code. It was
used to create a test version of fuzzymeter. The test version of fuzzymeter read the
fuzzy_meter.eqn file and built the fuzzy table in memory. This debug version was a useful
tool for finding bugs in parsing the file or building the table. It conveniently stood alone
and had no impact on operations because it did not calculate metering rates. For
programmers who make future additions or modifications to a database or to TAPS, this
technique is recommended.
The FUZZY_LOG option is supported in fuzzymeter.c and fuzzymeter_sub.c. If
FUZZY_LOG is defined, a logging version of fuzzymeter.exe will be created. It will log
the inputs, fuzzy classes, rule outcomes, and resulting metering rates for all fuzzy enabled
(with PermitFuzzyMr) ramp meters to a file called fuzzymeter.log. Although this logging
capability works, this version would produce TAPS time-outs now that we have so many
ramp meters using fuzzy metering, preventing the fuzzy metering rates from being
calculated and implemented in the allowable time. Thus, it is not recommended that this
option is used because of the additional CPU that it requires. If you find that you need this
capability, the logging technique would need to be rewritten in a fashion similar to that of
log_tms_event, in which the message is put on a queue to be handled. This capability
was originally created in anticipation of the need for off-line analysis of the internal
calculations of fuzzymeter in order to optimize its performance. We found that we did not
need this capability to the extent expected because of the capabilities of watch_fuzzymeter.

69
Through watch_fuzzymeter, we were able to observe all of these data real-time and
optimize the performance of fuzzymeter.
If METER_LOG is defined, a version of fuzzymeter.exe will be produced that logs
the cabinet name, lane status, and the metering rates as returned from the 170 by all actively
metered cabinets to a file called meter.log. Although this capability worked fine prior to
implementing system-wide with fuzzy metering, at this time, it is expected that this option
may require more time to execute fuzzymeter than it is allocated. For this reason, it is not
recommended that this option is used because it may prevent fuzzy metering rates from
being implemented properly during TAPS time-outs. If you find that you need this
capability, the meter logging capability would need to be rewritten in a fashion similar to
that of log_tms_event, in which the message is put on a queue to be handled. However,
if the reason you want the 170-returned metering rates is for analytical purposes, you may
be better off using the passage rate instead (which can easily be retrieved through CDR).
The passage rate is the effective metering rate.
If OBSERVE_ONLY is defined, a version of fuzzymeter.exe will be produced that
does not execute the metering rates produced by fuzzy metering. We found this option to
be invaluable for initial deployment of the Fuzzy Logic Ramp Metering Algorithm. With
this option, we were able to compare the rates produced by the Fuzzy Metering Algorithm
to those produced by other ramp metering algorithms given the same real-time data. We
were able to do initial tuning with this technique without impacting operations in any way.
However, the usage of this compile option is no longer recommended. When this option is
used, no fuzzy metering rates are executable on the system. Because many ramps have not
been thoroughly tested for any other algorithms, operations would suffer from the non-
optimal metering rates produced by other ramp metering algorithms.

70
Configuration Management
MMS files (VMS makefiles) were created for all TMS executables (Table 10). With
the new MMS files, maintenance of the proper configuration is feasible. For all MMS
files, executables can be produced in a bubble environment by redefining TMS_CODE and
TMS_RUN (see Integration Procedure).
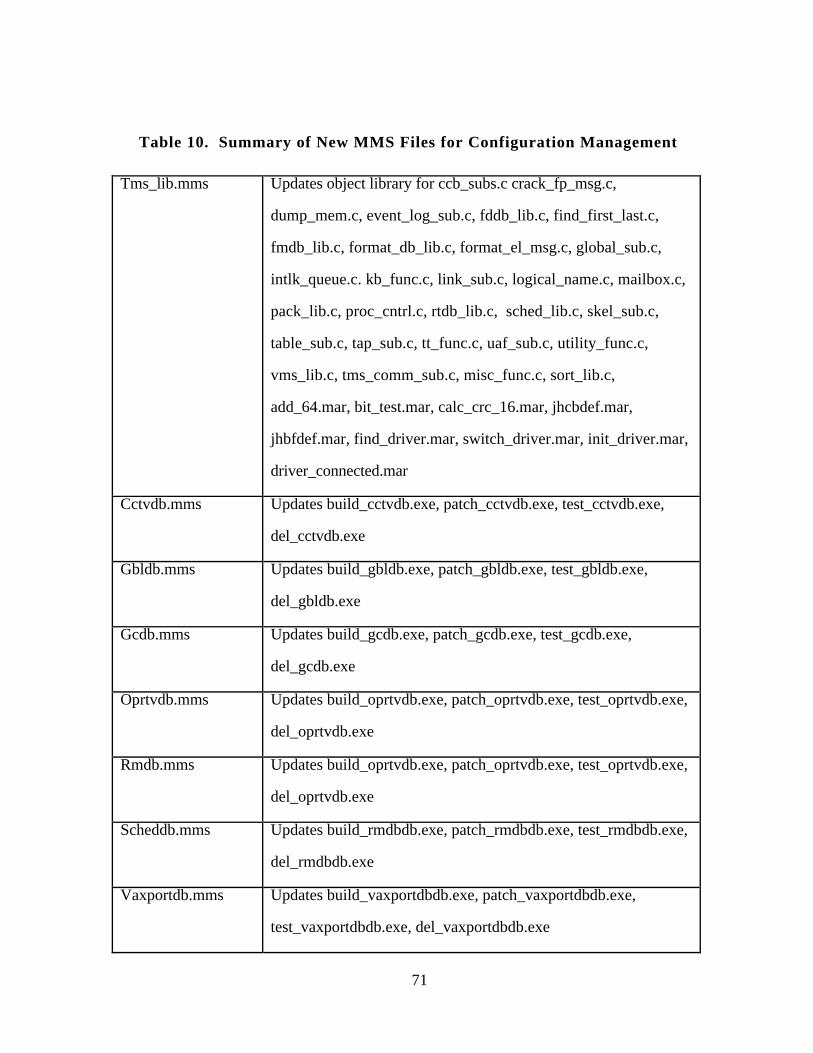
71
Table 10. Summary of New MMS Files for Configuration Management
Tms_lib.mms Updates object library for ccb_subs.c crack_fp_msg.c,
dump_mem.c, event_log_sub.c, fddb_lib.c, find_first_last.c,
fmdb_lib.c, format_db_lib.c, format_el_msg.c, global_sub.c,
intlk_queue.c. kb_func.c, link_sub.c, logical_name.c, mailbox.c,
pack_lib.c, proc_cntrl.c, rtdb_lib.c, sched_lib.c, skel_sub.c,
table_sub.c, tap_sub.c, tt_func.c, uaf_sub.c, utility_func.c,
vms_lib.c, tms_comm_sub.c, misc_func.c, sort_lib.c,
add_64.mar, bit_test.mar, calc_crc_16.mar, jhcbdef.mar,
jhbfdef.mar, find_driver.mar, switch_driver.mar, init_driver.mar,
driver_connected.mar
Cctvdb.mms Updates build_cctvdb.exe, patch_cctvdb.exe, test_cctvdb.exe,
del_cctvdb.exe
Gbldb.mms Updates build_gbldb.exe, patch_gbldb.exe, test_gbldb.exe,
del_gbldb.exe
Gcdb.mms Updates build_gcdb.exe, patch_gcdb.exe, test_gcdb.exe,
del_gcdb.exe
Oprtvdb.mms Updates build_oprtvdb.exe, patch_oprtvdb.exe, test_oprtvdb.exe,
del_oprtvdb.exe
Rmdb.mms Updates build_oprtvdb.exe, patch_oprtvdb.exe, test_oprtvdb.exe,
del_oprtvdb.exe
Scheddb.mms Updates build_rmdbdb.exe, patch_rmdbdb.exe, test_rmdbdb.exe,
del_rmdbdb.exe
Vaxportdb.mms Updates build_vaxportdbdb.exe, patch_vaxportdbdb.exe,
test_vaxportdbdb.exe, del_vaxportdbdb.exe
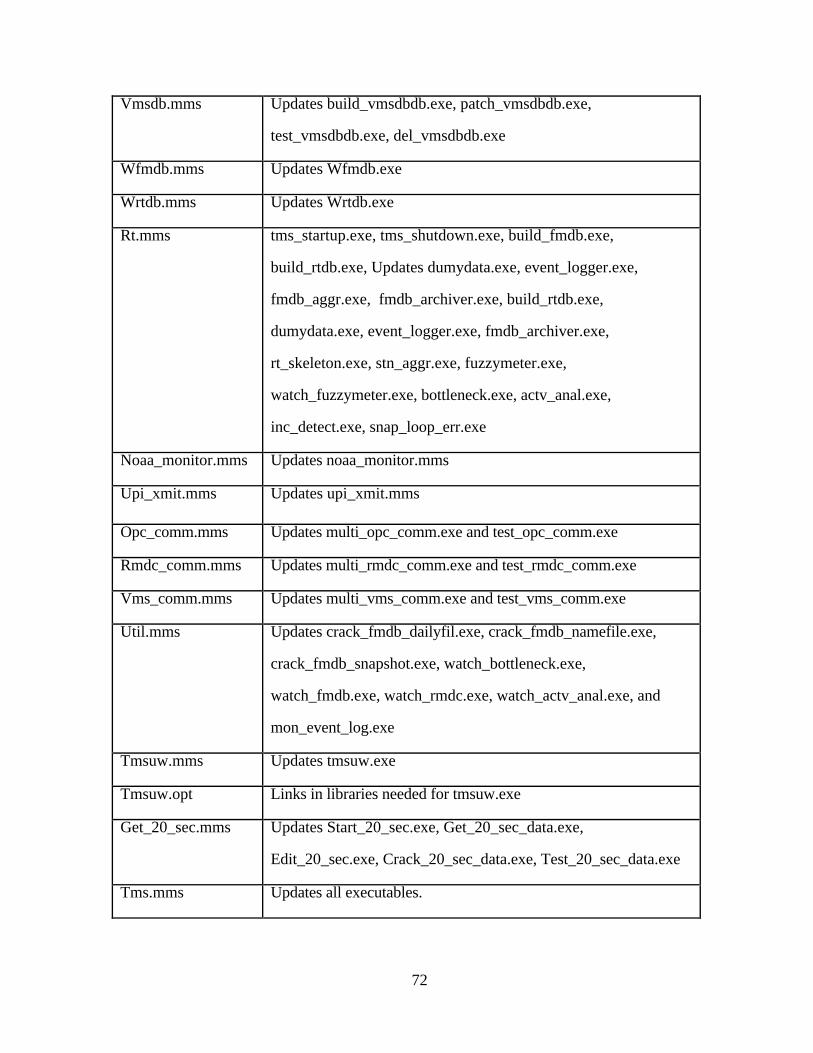
72
Vmsdb.mms Updates build_vmsdbdb.exe, patch_vmsdbdb.exe,
test_vmsdbdb.exe, del_vmsdbdb.exe
Wfmdb.mms Updates Wfmdb.exe
Wrtdb.mms Updates Wrtdb.exe
Rt.mms tms_startup.exe, tms_shutdown.exe, build_fmdb.exe,
build_rtdb.exe, Updates dumydata.exe, event_logger.exe,
fmdb_aggr.exe, fmdb_archiver.exe, build_rtdb.exe,
dumydata.exe, event_logger.exe, fmdb_archiver.exe,
rt_skeleton.exe, stn_aggr.exe, fuzzymeter.exe,
watch_fuzzymeter.exe, bottleneck.exe, actv_anal.exe,
inc_detect.exe, snap_loop_err.exe
Noaa_monitor.mms Updates noaa_monitor.mms
Upi_xmit.mms Updates upi_xmit.mms
Opc_comm.mms Updates multi_opc_comm.exe and test_opc_comm.exe
Rmdc_comm.mms Updates multi_rmdc_comm.exe and test_rmdc_comm.exe
Vms_comm.mms Updates multi_vms_comm.exe and test_vms_comm.exe
Util.mms Updates crack_fmdb_dailyfil.exe, crack_fmdb_namefile.exe,
crack_fmdb_snapshot.exe, watch_bottleneck.exe,
watch_fmdb.exe, watch_rmdc.exe, watch_actv_anal.exe, and
mon_event_log.exe
Tmsuw.mms Updates tmsuw.exe
Tmsuw.opt Links in libraries needed for tmsuw.exe
Get_20_sec.mms Updates Start_20_sec.exe, Get_20_sec_data.exe,
Edit_20_sec.exe, Crack_20_sec_data.exe, Test_20_sec_data.exe
Tms.mms Updates all executables.
73
Edit_20_sec.c
Edit_20_sec.exe was created for users who wish to automatically collect specified
20-second data for weekday metering periods. This process automatically checks the
time in order to know when to execute start_20_sec, which starts get_20_sec_data. To
use this, the user must specify the desired collection times and desired loops/stations for
the morning data in “am.input.” The user must specify the desired collection times and
desired loops/stations for the afternoon data in “pm.input.” Using this information along
with the current time and date, edit_20_sec automatically rewrites get_20_sec_data’s
input file with the date, start time, stop time, and data to collect for each metering period.
At this time, files produced are written to the test executable directory in taylorc’s
account. However, extensive usage of this software would require the implementation of
some data file management, which was beyond the scope of this project.
Prior to this project, the 20-second data collector was not usable because WSDOT
could not interpret the binary files produced. Although the Washington State
Transportation Center (TRAC) contracted HNTB to write software to utilize these binary
files, WSDOT subsequently lost the executable that did this interpretation. (It would
probably be fairly easy to rewrite this software.) In this project, we made a slight
modification to get_20_sec.c to create a usable version of get_20_sec.c With a simple
definition of GET_20_LOG, get_20_sec.c now produces ASCII data files. Because
get_20_sec.c and start_20_sec_data.c were not previously documented, they are outlined
here.

74
Get_20_sec.c is started from start_20_sec_data.c, which stands alone. In
start_20_sec_data.c, start_process calls SYS$CREPRC to start main get_20_sec.
Get_20_sec reads the desired stations from input file “get_20_sec_data.input.” If
GET_20_LOG is defined, it writes to an ASCII log file. (A sample ASCII file name is
980827_095300_20_SEC.LOG.) Ifdefs have been added to specify whether to write to
a binary data file. (A sample binary file name is 980827_095300_20_SEC.DAT.)
Start_20_sec_data calls the following functions:
Connect_to_mailbox
Map_to_RTDB
Load_get_20_name_table
Calc_num_data_blocks
Check_date_time
Read_get_20_input_file
Write_file_header
Dump_file_header — writes to log file
Dump_get_20_name_table — writes to log file
Collect_20_sec_data
Get_20_sec_sub.c calls the following functions:
Dump_file_header — prints file header to output file

75
Dump_get_20_name_table — prints name, type, size, and offset of data to
output file
Fprintf(out_file, "%16.16s %02x ", name_ptr->name, type);
Fprintf(out_file, "[ LOOP ]") or Station, speed trap, etc
Fprintf(out_file, " %8d", rtdb_offset[i]);
Crack_date_time_stamp — prints beginning month, day, year, hour, minute,
second to output file. Called from collect_20_sec_data. Prints end month, day,
year, hour, minute, second to output file in the following format:
02d/%02d/%04d+%02d:%02d%:%02d->%02d:%02d:%02d\n"
Crack_rtdb_data — prints data to output file. Called from
collect_20_sec_data and writes data in the following format:
Fprintf(out_file," %16.16s %02x ", name_ptr->name, type);
Fprintf(out_file," %16.16s %02x ", name_ptr->name, type);
Fprintf(out_file, "V=%3d S=%4d O=%5.1f F=%d I=%d n=%d\n",
volume, scan_count, occupancy, flag, inc_det, n_loops);
Sample output of log file, not including headers
09/01/1998+14:31:40->14:31:59
ES-TD4R:MMN___1 50 [ LOOP ]V= 0 S= 0 O= 0.0 F=0 I=0 n=0
ES-TD4R:MMN___2 50 [ LOOP ]V= 0 S= 0 O= 0.0 F=0 I=0 n=0
ES-TD4R:MMN___3 50 [ LOOP ]V= 0 S= 0 O= 0.0 F=0 I=0 n=0
ES-TD4R:_MNLA_1 50 [ LOOP ]V= 0 S= 0 O= 0.0 F=0 I=0 n=0
ES-TD4R:_MN_I_1 50 [ LOOP ]V= 0 S= 0 O= 0.0 F=0 I=0 n=0
76
SOFTWARE TESTING
Because no major changes had been made to the original source code prior to the
implementation of the Fuzzy Logic Ramp Metering Algorithm, it was necessary to develop
a procedure to do this. With a critical real-time system such as the TMS software, it was
important to integrate the software in such a way as to minimize the risks of TMS
downtime, software bugs, and configuration management problems. Software quality tests
were developed and used to verify that the software retained its old functionality while
performing its new functionality.
INTEGRATION PROCEDURE
The quality of new and modified software was thoroughly tested prior to on-line
implementation to reduce the risk of bugs. We did this by first testing the software on a
separate microVAX computer that had duplicate software running in real time, but was
unconnected to any field devices. In gradual steps toward implementation on the real-time
system, we used a “bubble environment” in which the original executables were
undisturbed and could always be recreated, and the new executables were always created
with the latest source code. In this manner, the risk of the new software was minimized
because we could always return to the old software.
With multiple programmers working on various aspects of the code, it was essential
that we never produced executables from incompatible versions of the source code. To
prevent problems with configuration management, we assigned domains to each
programmer. Lanping Xu was assigned to system administration, opc_comm and to
entering the files into CMS once they had passed all software tests. Harriette Lilly was
assigned to vms_comm and vmsdb. Cynthia Taylor was assigned to rt_skeleton, rmdb,
and rmdc_comm. Mark Morse was assigned to the 170 code. If programmers wanted to
alter code outside their domain, they had to do it through the programmer of that domain.

77
With this technique, we were aware of any code incompatibility issues. We coordinated
our implementation and testing schedules through daily communication. This degree of
coordination was necessary because of the sharing of test beds and the necessity that only
one programmer implement changes at a time. We only implemented one programmer’s
changes at a time in order to discern the cause of any problems that arose and to prevent
improper software configurations.
With these risk management issues in mind, the following software integration
procedure was developed:
1) Develop a list of regression tests to be performed that verify that the new software
still has the functionality of the old software.
2) Develop a list of tests to verify the new functionality of the software.
3) Perform a file comparison between the new source code and the current source code
from which the executables that are currently operating on the real-time system were
created. Merge the changes with the current source code to prevent any software
configuration problems.
4) Create a test code directory in which only the new or modified files reside. Define
the TMS_CODE path name such that the compiler first searches in the test directory
for the source code, and then searches in the official source code directory if it
cannot find the file in the test directory. In this manner, the executables will be
created from the latest files, reducing the risk of software configuration problems.
Another advantage of this “bubble” environment is that the original executables can
always be reproduced from the old source code by redefining the tms_code path.
5) Copy the MMS files (VMS makefiles) into the test code directory. Change the
specification of the executable directory from TMS_RUN to TMS_PRIMAL. With
this technique, the new executables are placed in their own test directory,
TMS_PRIMAL. In the event of a software problem, the system can be restarted
from the unaffected original executable, TMS_RUN.
78
6) Compile the code described in the bubble environment of steps 3-5 to produce the
new executables.
7) Copy the executables produced in step 6 to a separate test computer that duplicates
the real-time environment. We used a microVAX for this, complete with a TMS
console and test 170.
8) Perform the tests in steps 1-2 to verify the software quality.
9) If there are no errors in step 8, run the new executables in the TMS_PRIMAL
directory on the real time system. If a problem is encountered, the original system
can be restarted from the TMS_RUN directory.
10)Perform the tests in steps 1-2 to verify the software quality.
11)If there are no problems with step 10, check in the new source code with the
Configuration Management Software (CMS). This procedure will put the new
source code into the current source code directory. At this point, the bubble
environment of steps 3-5 is no longer necessary. Compiling directly from the
source code directory will produce the new executables in the tms_run directory.
We used this procedure both for the implementation of the Fuzzy Logic Ramp
Metering Algorithm and for the implementation of new VMS communications protocol.
The procedure was highly successful. We did not have any downtime due to the
implementation of the Fuzzy Logic Ramp Metering Algorithm, nor did the new code from
this project cause bugs that impacted operations.
Once the software quality had been established, fuzzymeter was field tested in a
procedure with gradual steps toward full deployment. A compile feature of fuzzymeter
called observation mode (see fuzzy.h) allowed us to produce fuzzy metering rates based on
real-time field data and observe the fuzzy metering rates without implementing them. With
this feature, we compared the fuzzy metering rates to the metering rates produced by the
other ramp metering algorithms. This feature proved to be very useful: we were able to do
preliminary tuning of the fuzzy ramp metering algorithm prior to field deployment. For

79
further details of the field testing plan, see the “Evaluation of a Fuzzy Logic Ramp Metering
Algorithm: A Comparative Study Between Three Ramp Metering Algorithms used in the
Greater Seattle Area” (Taylor and Meldrum, 2000).
RESULTS OF REG RESSION TESTING
Regression testing was performed to ensure that no old functionality was lost with
the new software changes. The regression testing encompassed all processes on the VAX,
including rmdb, build_all_db, fmdb, rtdb, rmdc, rmdc_comm, opc_comm, vms_comm,
noaa_monitor, cctv, mon_event_log, log files, incident_detect, and tmsuw. All tests
achieved the desired result.
Rmdb
The following tests were successfully performed on the new RMDB software to
verify the old functionality of the RMDB:
1) Viewed RMDB from patch_rmdb and verified that all values were displayed
correctly.
2) Verified that compiled defaults appeared correctly on the TMS console after start-
up. The parameter values correctly matched the compiled defaults in the cases
where they were not overridden in the rmdb_input.fil
3) Verified that parameters in rmdb_input.fil were correctly updated in the database,
overwring the compiled defaults as intended.
4) Verified that we can change a value from patch_rmdb.
5) Verified that all 287 columns were successfully displayed from patch_rmdb.
Build_all_db
We verified that all equations were created correctly when building all databases
with the new software. We compared the equations produced by the new software in the
TMS_PRIMAL directory to those created by the old software in the TMS_RUN directory
when given identical input files. The output files produced (including actv_anal.eqn,

80
inc_det.eqn, stn_aggr.eqn, and btl_neck.eqn) were identical between the old and new
software.
Fmdb
1) Compared the 5-minute aggregation using the new and old versions of
watch_fmdb. All 287 Ramp Meter/Data Collectors were shown with the new
watch_fmdb, and the data were the same for both versions.
2) Watch_fmdb was used to check station aggregation on the following test cases:
• ES-710R:_MN_Stn=_MN___1+_MN___2+_MN___3
The station volume = 120+102+124 = 346. The hand calculation matched that
shown in watch_fmdb.
• ES-710R:MMS_Stn=MMS___1+MMS___2+MMS___3
The station volume = 102+124+117=343. The hand calculation matched that
shown in watch_fmdb.
3) Used wfmdb.exe to verify that data looked valid.
4) Tested the validity of archived data. Compared real time data viewed with
watch_fmdb for loops, stations, and speed traps with the archived data viewed
from CDR. For ES-516R at 13:10, there were no discrepancies. Compared real-
time data viewed with wfmdb for loops, stations, and speed traps with the archived
data viewed from CDR. For ES-726R at 12:55, there were no discrepancies.
Rtdb
1) Checked the accuracy of 20-second station aggregation, using wrtdb.exe to
observe the loop and station data.
• ES-710R:_MN_Stn=_MN___1+_MN___2+_MN___3
Station volume = 8+10+6=24. Wrtdb matched the hand calculation.
81
Station occupancy =(6.8+12.1+12.5)/3=31.4/3=10.5 Wrtdb matched the hand
calculation.
• ES-710R:MMS_Stn=MMS___1+MMS___2+MMS___3
Station volume = 8+9+11=28. Wrtdb matched the hand calculation.
Station occupancy = (15.6+10.1+13.3)/3=39.0/3=13.0 Wrtdb matched the
hand calculation.
2) Verified that the 170s returned the data correctly and that the data were properly
placed into the RTDB.
3) Verified that the FLOW map on the WSDOT web page properly received the data.
Rmdc
We conducted tests to verify the proper operation of the metering algorithm through
the use of watch_rmdc, TMS, and the 170 test rack:
1) We verified that the local algorithm worked properly when no queue override
conditions were present. The proper local lane status and other metering data
appeared on the operator console. The 45th St. southbound ramp was metering at
16.0 VPM when the mainline occupancy was 15% and the mainline speed was 33
MPH.
2) We verified that the local algorithm worked properly when queue override
conditions were present. The override lane status appeared in the TMS console for
lanes 1, 2, and 3 when the 170 test rack’s queue occupancy value exceeded the
queue occupancy threshold for the necessary time duration.
3) We verified that the local algorithm worked properly when the advance queue
override conditions were present. The advance override lane status appeared in the
TMS console for lanes 1, 2, and 3 when the test rack’s advance queue occupancy
value exceeded the advance queue occupancy threshold for the necessary time
duration.

82
4) We verified that the volume adjustment occurred when the passage rate exceeded
the metering rate on the test rack, causing the metering rate to remain at its minimum
metering rate of 5 VPM.
Rmdc_comm
We tested the old functionality of rmdc_comm, which involves communications
between the VAX and 170.
1) We verified that Lane Parameters 1, 2, and 3 were sent to the VAX through
opc_comm when they were updated in TMS. The new paramters were then sent to
the 170 test rack through rmdc_comm.
2) Using test_rmdc_comm, we verified that the VAX sent the date/time message
properly to the 170 upon startup and that an acknowledgment was returned by the
170.
3) Using test_rmdc_comm, we verified that the reset command was properly sent to
the VAX from the 170 and that the 170 responded with an acknowledgment.
4) Using test_rmdc_comm, we verified that the data poll was properly sent from the
VAX to the 170 upon startup and that the VAX successfully received the data
returned from the 170. These returned data were displayed correctly in the TMS
console.
5) Using test_rmdc_comm, we verified that the VAX properly sent the error request
and that in turn, the VAX successfully received the error data returned from the
170.
6) We tested the start and stop metering command from the operator console and
verified the 170’s proper execution using CCTV.
Opc_comm
We verified proper communication between the operator consoles and the VAX
through the following tests:

83
1) We verified that all parameters are viewable and updateable from the operator
console. The new values were downloaded to the 170 and continued to be
displayed correctly on the operator console when it refreshed the screen.
2) Parameter changes made from the operator console properly appeared in the
rmdb_journal.fil.
3) A pass report was sent out to NOAA and to the WSDOT Web page. It reached
NOAA and the Web page successfully.
4) The ability for the operators to send messages to each other via TMS was tested. A
test message was sent to the four operators currently logged on, and the window
displaying the message appeared correctly on their consoles.
5) We tested the operator incident messaging and verified that it was correctly
displayed on WSDOT Web page.
Vms_comm
We tested the commands sent to the variable message signs (VMS) from the
operator console.
1) We sent out the VMS message “Traffic Conditions (206) 368-4499” to sign VMS-
887. We verified the display with a CCTV camera.
2) We then blanked the sign and verified it with the CCTV.
3 We switched the message to “Ride Share Info” and verified it with the CCTV
camera.
4) We successfully created a new sign cluster.
5) We created a new message within this cluster. The changes were journaled
correctly in vms_journal.fil.
Noaa_monitor
Two tests were completed to verify proper communications between the VAX and
NOAA:

84
1) We tested that a pass report reached NOAA successfully.
2) We tested that the NOAA reports reached us successfully.
Cctv
We checked all camera operations.
1) We assigned the monitor to the camera on I-405 at NE 116th St, swiveled it around,
zoomed in and out, and focused without any problems. Then we switched the
display to the camera at I-90 at 4th Ave southeast bound.
2) We viewed up-to-date camera images on WSDOT’s Web page.
Mon_event_log
We monitored the events as we ran tms_startup in the directories with the old and
new executables. There were no discrepancies. Although there were some minor errors,
these errors had pre-existed and were identical between the two versions of software.
Log Files
All output files of the new code were compared to those produced by the old code.
The output files consist of the operator log file, the tms event log file, the rmdc comm log
file, the opc comm log file, the vms comm log file, the tms crash log, the FMDB daily
primary files, the FMDB snapshot primary files, and the database journal files.
1) The operator log was created and written successfully. No errors were reported.
All operations were logged correctly into the file OPERATOR_011999.LOG;2 on
19-JAN-1999 12:25:26.60.
2) The tms event log file, TMS_EVENT_990119.LOG;2, was created successfully on
19-JAN-1999 12:24:17.84. No errors appear in the event log. Normal operations
are logged correctly. The log files created by the old and new executables were
compared. The only difference was that upi_xmit had a busy phone line in the
event log file of the old software. The VAX output is shown below:

85
TMS Event File Created - 01/19/1999 12:24:17.77------------------------------------------------------------------------------12:24:18.09 09008013 EVENTLOG Startup:ersion 0.25 - 04/29/9412:24:21.05 00000000 MONEVTLG Start MON_EVENT_LOG Echo12:24:24.80 08230003 UPI_XMIT Version 0.19 - 04/29/9412:24:24.88 00000000 UPI_XMIT Warning-UPI Port DISABLEd, set to ENABLE12:24:25.04 0822800b NOAA_MON Version 0.20 - 04/29/9412:24:25.38 08220003 NOAA_MON Warning-NOAA Port DISABLEd, set to ENABLE12:24:25.38 08228013 NOAA_MON Startup Complete12:24:25.40 0808800b BLD_RTDB Version 0.19 - 04/29/9412:24:25.42 00000000 BLD_RTDB Existing global section - Delete it12:24:25.93 00000000 BLD_RTDB Global Section Created-size=328498012:24:30.14 0809800b BLD_FMDB Version 0.28 - 04/29/9412:24:30.18 00000000 BLD_FMDB Existing global section - Delete it12:24:31.13 00000000 BLD_FMDB Global Section Created-size=566767312:24:52.65 08230003 UPI_XMIT Startup Complete12:25:20.53 080e800b DUMYDATA Version 0.30 - 04/29/9412:25:20.64 080e8013 DUMYDATA Startup Complete12:25:20.82 080f800b STN_AGGR Version 0.22 - 04/29/9412:25:21.11 0810800b INC_DET Version 0.29 - 04/29/9412:25:21.27 08108013 INC_DET Startup Complete - table_size = 1812:25:21.38 0811800b BTL_NECK Version 0.24 - 04/29/9412:25:21.56 08118013 BTL_NECK Startup Complete-table_size=12812:25:22.02 080f8013 STN_AGGR Startup Complete-table_size=1000612:25:22.26 0824800b FUZZY_MR Version 0.25 - 10/23/9812:25:22.33 08248013 FUZZY_MR Startup Complete-table_size=1812:25:22.51 0820800b FMDBAGGR Version 0.31 - 12/23/9612:25:22.62 08208013 FMDBAGGR Startup Complete12:25:22.78 0821800b FMDBARCH Version 0.22 - 04/29/9412:25:23.07 0900800b RT_SKEL ersion 0.31 - 06/03/9812:25:23.94 08218013 FMDBARCH Startup Complete12:30:00.00 00000000 EVENTLOG 10 Minute Time Stamp: Date = 01/19/199912:31:01.77 00000000 MONEVTLG Terminate MON_EVENT_LOG Immediately12:40:00.00 00000000 EVENTLOG 10 Minute Time Stamp: Date = 01/19/199912:50:00.00 00000000 EVENTLOG 10 Minute Time Stamp: Date = 01/19/199913:00:00.00 00000000 EVENTLOG 10 Minute Time Stamp: Date = 01/19/199913:08:09.51 00000000 MONEVTLG Start MON_EVENT_LOG Echo13:10:00.09 00000000 EVENTLOG 10 Minute Time Stamp: Date = 01/19/199913:20:00.00 00000000 EVENTLOG 10 Minute Time Stamp: Date = 01/19/199913:30:00.00 00000000 EVENTLOG 10 Minute Time Stamp: Date = 01/19/199913:30:03.85 00000000 MONEVTLG Stop MON_EVENT_LOG Echo13:40:00.00 00000000 EVENTLOG 10 Minute Time Stamp: Date = 01/19/199913:50:00.00 00000000 EVENTLOG 10 Minute Time Stamp: Date = 01/19/199913:58:06.83 00000000 SHUTDOWN TMS_SHUTDOWN Started13:58:06.85 08230003 UPI_XMIT Terminating13:58:06.85 00000000 NOAA_MON stop_noaa_port() called13:58:06.85 08220003 NOAA_MON Terminating13:58:13.00 00000000 RT_SKEL Polling Process Timeout13:58:13.00 00000000 RT_SKEL MULTI_RMDC_COMM Failed to Complete13:58:22.00 00000000 RT_SKEL Start TMS Shutdown Sequence13:58:22.00 00000000 EVENTLOG SHUTDOWN Bit Set13:58:22.03 080e8023 DUMYDATA Terminating13:58:23.02 080f8023 STN_AGGR Terminating13:58:23.02 08108023 INC_DET Terminating13:58:23.04 08118023 BTL_NECK Terminating13:58:23.27 08248023 FUZZY_MR Terminating13:58:23.39 08208023 FMDBAGGR Terminating13:58:23.43 00000000 RT_SKEL Terminating

86
13:58:24.02 08218023 FMDBARCH Writing Snapshot Files at Termination13:58:24.69 08218023 FMDBARCH Writing Daily Files at Termination13:58:39.85 08218023 FMDBARCH Terminating13:58:39.88 00000000 EVENTLOG Terminating------------------------------------------------------------------------------TMS Event File Closed - 01/19/1999 13:58:39.88
3) The rmdc comm log file was successfully created and written:
RMDCCOMM_M.LOG;1218 on19-JAN-1999 12:25:25.09. In both the new and
old software, all units were set to comm active upon startup. Most of the ports
operated successfully. In the cases where a port had a problem, the same port had
the same problem when the system was restarted with the other code. For example,
the following error message occurred on the same ports in both log files:
13:46:52.00 0813013a ES-662R: No response to DATA_POLL13:46:50.79 08130193 ES-662R: Possible Run-Away Port-cc=0000018c13:01:24.30 0813023b ES-TR6R: Unit set to COMM_MARGINAL12:26:05.04 0813022b ES-TR6R: Unit set to COMM_FAILURE12:59:25.01 08130213 ES-TR5R: Unit set to COMM_ACTIVE13:48:23.93 08130053 ES-156R: Data Checksum Error
In both instances, there was a higher than expected occurrence of the data checksum
error. We believe that this frequency of occurrence was caused by a bug that still
exists in the 170 chip. Although the 170 returns the correct data, the checksum error
is calculated before the final data are written, causing the checksum error. Because
this error occurred frequently on both the TMS_PRIMAL and TMS_RUN
executables, we do not believe this possible bug is related to the new code.
4) The opc_comm log file OPC_COMM_M.LOG;341 19-JAN-1999 12:25:26.07
was created and written successfully. Several errors occurred in this log.
However, all of the same errors also appeared in the opc_comm log created by the
old executables. Thus, we do not expect any of these errors to be caused by the
new code. Below is a sampling of the events that occurred:

87
OPC_COMM Log File Created - 01/19/1999 12:25:25.34------------------------------------------------------------------------------12:25:26.82 00000000 OPC_COMM Version 0.160 - 03/03/9712:25:29.33 08150003 WSP_BLV: In assign_initial_camera()-Camera name [CCTVMS1] not found12:25:29.61 00000000 OPC_COMM start_next_tms_sched():First Entry < Current Time12:25:29.72 00000000 OPC_COMM Startup Complete12:25:46.11 00000000 TMS_P2R: User NOT Logged In-Cmd=5212:25:48.67 08120003 TMS_P2R: Port/Unit set to COMM_ACTIVE12:25:56.44 08120003 O_TXF0: No Stn for ES-116R 5 Pike St-REV 2 for handle 800112:25:57.89 00000000 TMS_P2R: Invalid command in TxDoneRx=4e12:25:58.94 00000000 INTRNET: Timeout - Device did not respond12:25:58.94 08120003 INTRNET: Buffer queued for re-transmission12:26:28.64 00000000 TMS_A_L: User NOT Logged In-Cmd=5212:30:32.43 08120003 TMS_P2R: Error status from Driver (TxDone)-cc=0000022c12:30:32.43 08128003 TMS_P2R: Error from SYS$QIO(SendTx)-cc=000002c412:30:32.43 08120003 TMS_P2R: Fatal Driver Error-cc=000002c412:30:32.68 00000000 TMS_P2R: Unexpected ACK received - Ignored12:34:51.95 08120003 O_TXE0: In process_loginout()-SlaveConsole not found12:43:42.53 08120003 MS_D6 : RTDB Name(s) for handle 0005 not found12:47:20.03 08150003 MS_D6 : In switch_monitor_to_camera()-Invalid Camera Unit No=012:52:37.65 08120003 TMS_P2R: VMSDB Element V{VMS-877}*ROAD&LOCATION forhandle 7100 not found13:55:30.52 081f0163 O_TXB3: Port Inactive - Status set to ENABLE13:57:03.85 00000000 MB_TNL : Timeout - Device did not respond13:57:03.85 08120003 MB_TNL : Port/Unit set to COMM_MARGINAL due to Hard Error13:57:03.85 08120003 MB_TNL : Error limit exceeded-TxWaitRx comm aborted
5) The vms comm log file was created VMS_COMM_M.LOG;205 on 19-JAN-1999
12:25:25.40. All of the messages in this file were similar between the old and new
software.
6) There were no discrepancies in the tms crash log between the old and new
software. The output is below:
12:25:28.79 OPC_COMM:log_comm_event():Invalid mpu_no-cc=1000002312:25:29.03 OPC_COMM:Warning-Video Switch Port DISABLEd, set to ENABLE-cc=1000002312:25:29.72 OPC_COMM:log_comm_bfr():Invalid unit_no-cc=0000010b
7) The fmdb daily primary file was created successfully, 19990121.DAT;3 on 21-
JAN-1999 14:31:16.55.
8) The FMDB snapshot primary files were successfully created every 5 minutes
during operation of the new executables.
9) We verified that all database journal files were created and written successfully,
including rmdb_journal.fil, vmsdb_journal.fil, scheddb_journal.fil, oprtvdb_

88
journal.fil, gbldb_journal.fil, and cctvdb_journal.fil. The rmdb_journal.fil
showed the parameters that we edited from the operator console. The
vmsdb_journal.fil showed the new sign cluster that we created and the new test
message that we added. It recorded our deletion of the new test cluster as well.
Incident Detect
We built the following incident detect equation:
ES-TR8R:MMN_Inc = ES-TR8R:MMN_Stn & ES-TD1D:_MN_Stn
We decreased the downstream occupancy to 10.5% using dummy data, and increased the
upstream occupancy to 34.8% using the test rack. The incident was successfully detected.
When we decreased the occupancy back down to 21.7%, the incident cleared as expected.
Table 11 summarizes the events that occurred:
Table 11. Regression Test Results for Incident Detection
TIME OCC for ES-TR8R :MMN_Stn INC STATE16:11:00 21.0% NO INCIDENT16:11:20 34.8% TENTATIVE INCIDENT DETECTED16:11:40 71.8% INCIDENT OCCURRED16:11:59 68.7% INCIDENT_CONTINUING16:12:19 69.6% INCIDENT CONTINUING...16:31:19 21.7% NO INCIDENT
Tmsuw
We verified that TMSUW started up properly and that data were properly sent from
the VAX to the University of Washington (UW).
1) TMSUW started up with no errors in tmsuw.log. (In the new software, tmsuw
was added to tms_startup so that it would not need to be started independently.)
2) We examined the real-time 20-second data on the VAX using watch_rmdc, and we
compared them to those received by UW in real time for the following locations:

89
ES-726R on I-405, ES-900R on I-90, ES-159R on I-5, ES-516R on SR 520, ES-
623D on SR 167. All data matched.
TEST RESULTS OF NEW FUN CTIONALITY
The new functionality of RMDB, fuzzymeter, watch_fuzzymeter, and the 170 chip
was tested. The new processes were tested for Y2K compliancy. All tests were successful.
Build_rmdb
The following tests were performed to verify the new functionality of the RMDB. All
tests achieved the desire result.
1) Compiled new rmdb_tbl.c, rmdb_sub.c, rmdb.h without errors.
2) Compiled new tok_tabl.c without errors.
3) Compiled and linked new build_rmdb.c, rmdb.h, rmdb_func_prot.h, tok_tabl.c,
tap.h without errors.
4) Ran build_rmdb without yet using the new group names or new parameters.
Results were the same as before the software changes took place, as expected.
5) Added new group name [Fuzzymeter_Parameters] to rmdb_input.fil and verified
that new group name was written to the screen and rmdb_error.fil without errors.
(Rmdb_error.fil contains more than just error messages.)
6) Added new group name [Fuzzymeter_Equations ] to rmdb_input.fil and verified
that new group name was written to the screen and rmdb_error.fil without errors.
7) Switched the order of the two new group names in rmdb_input.fil and verified that
the switched order did not cause errors.
8) Changed the group name to lower case to verify that token parser changed it to
upper case without any problem reading it.
9) Tested that the parser would catch the error of misspelled new group names. The
error was successfully written to the screen and to rmdb_error.fil.

90
10)Tested each parameter name given an acceptable value in rmdb_input.fil. Note:
parameter type USHORT1P requires an entry format of x.x% with a percent sign.
11)Tested the range limits for each parameter type. The parser correctly accepts values
>= minimum limit and values <= maximum limit. The parser does not accept
values outside of this range.
12)Added a fuzzy equation, which was successfully parsed and written to
fuzzy_meter.eqn file.
13)In fuzzy equation, changed "FM1" to "Btl" in cab/loop name. The parser correctly
produced the message, “Error — wrong equation type. Equation not written.”
14)In fuzzy equation, changed "FM1" to "FM4" in cab/loop name. The parser correctly
produced the message, “Error — Invalid char. Invalid cabinet/loop name.
Equation not written.”
15)In fuzzy equation, changed the cabinet name to be metered so that it does not match
the current group name. Fuzzymeter correctly produced the message, “Error —
cabinet name doesn't match current group name. Equation not written to file.”
16)In fuzzy equation, put an extra character in cab/loop name. The parser correctly
produced the message, “Error — Invalid char. Invalid cabinet/loop name. Equation
not written.”
17)In fuzzy equation, exceeded the allowable number of loops for each location type.
The parser correctly produced the message, “Error — Too many loops of a location
type. Equation not written to file.”
18)In fuzzy equation, deleted the number of samples for the advance queue in fuzzy
equation. The parser correctly produced the message, “Error — Number of
samples for advance queue not given. Equation not written to file.” The next
parameter following the faulty equation was parsed properly, as intended.

91
19)Deleted the second line of the fuzzy equation. The parser correctly produced the
proper error message. The equation was not written and the next parameter after
the equation was parsed properly.
20)Deleted the last line of the fuzzy equation. The parser produced the correct error
message. The equation was not written and the next parameter after the equation
was parsed properly, as intended.
21)In fuzzy equation, added a loop for the HOV bypass. (The HOV bypass loop is
optional in the equation format). The loop was processed properly and the equation
was written to file.
22)Changed the HOV bypass loop to a bad loop name by using "_Q" instead of "HP"
in the fuzzy equation. The parser correctly handled the error with the message,
“Error — Wrong loop type for HOV bypass. Equation is not written to file.”
23)Added a seventh loop location after the HOV bypass location in the fuzzy equation.
The correct error message was produced, “Error — Too many locations. Equation
not written.”
24)In fuzzy equation, removed the location queue, but still provided the HOV bypass
location. This test verified that the parser did not try to use the optional HOV
bypass location as a required location. The correct message was produced, “Error
— Missing delimiter, equation expected to continue. Equation not written.”
25)In fuzzy equation, removed the advance queue location, but still provided the HOV
bypass location. The correct error message was produced, “Error — Missing
delimiter, equation expected to continue. Equation not written.”
26)Changed `|' delimiter to `%' in fuzzy equation. The correct message was produced,
“Error — Delimiter of `|' or `&' expected. Equation not written.”
27)Changed `&' delimiter to `%' in fuzzy equation. The correct message was
produced, “Error — Delimiter of `|' or `&' expected. Equation not written.”

92
28)In fuzzy equation, moved `|' from end of line to beginning of next line. (Note: To
continue an equation on the next line, you must end the line in a delimiter.) The
correct message was produced, “Error — Missing delimiter. Equation not written.”
29)Deleted a delimiter between stations. The correct message was produced, “Error —
Missing delimiter. Equation expected to continue. Equation not written.”
30)Added extra spaces around delimiters to verify that this did not cause a problem.
The equation was correctly written without errors.
31)Added extra space around the number of samples inside of the parenthesis to verify
that this did not cause a problem. The equation was correctly written without
errors.
32)Added extra space before the parenthesis containing the number of samples. (Note:
Spaces are optional around the parenthesis.) The equation was correctly written
without errors.
33)Left out a tab on a continued line of fuzzy equation. (Note: Tabs are considered
white space and are optional.) The equation was correctly written without errors.
34)Continued a long equation line past 80 columns. The equation was correctly written
without errors.
To summarize, several equation error checks are done when build_rmdb.exe runs
to verify that the information given in rmdb_input.fil was correctly entered. If an error
occurs during the rebuild, an error message is written both to the screen and to
rmdb_error.fil (found in the executable directory). Table 12 lists the tests performed
during the building of RMDB and the error messages generated. Quite often, more than
one error message will be generated by a single error. Subsequent errors are common
because the equation parser discards the remainder of the line when it finds an error in that
equation. It searches for the beginning of the next equation and then produces errors when
that line (often a continuation of the bad equation) does not resemble the beginning of the

93
next equation. For this reason, first fix the first error listed (the real error) and then
determine whether any errors persist on the next rebuild. Depending on how creative the
user is with writing equations, it is possible that error messages other than the ones listed
will occur. Table 12 lists the most probable error messages generated for a given event.
(For further instructions on writing fuzzy equations, please see the training manual, Taylor
and Meldrum, 2000.)
Table 12. Equation Error Checks Performed in Build RMDB
EQUATION CHECK PERFORMED ERROR MESSAGE
Data Column type must be either a ramp meter or a data
collector
“Fuzzy meter Eqn valid only for RM or DC”
Characters 13 and 14 must be the string ‘FM’ “Wrong equation type — Must be FM for
Fuzzy Meter”
Metered cabinet must match the current cabinet name “Metered cabinet name doesn't match column
name or bad fuzzy eqn continues”
The cabinet name to be metered must use the correct format “Cabinet/loop name to meter is not valid in
fuzzy eqn”
All detector names must use complete 15 character format,
using the cabinet name, followed by a ‘:’, then either the
station or loop name (the parser does not assume current
cabinet as in Bottleneck equations)
“Cabinet/loop name not found in fuzzy eqn”
(The error check that this detector actually
exists is not performed until later during
tms_startup)
A detector name must be continuous within a line with no
spaces in between
“Cabinet/loop name not found in fuzzy eqn”
The controller inputs must be given in the order of local,
downstream, upstream, queue, advance queue, and HOV.
None—The parser might catch this error
through a subsequent check, but has no way
of knowing if the order is incorrect
The number of inputs (delimited by ‘|’) may not exceed six. “Too many |'s delimiting locations in fuzzy
eqn”
Up to five loops/stations each are allowed for the Local,
Queue and Advance Queue Inputs
“Too many loops of a station type in fuzzy
equation”
Only one loop/station each is allowed for the Upstream and
HOV sinput
“Too many loops of a station type in fuzzy
equation”

94
EQUATION CHECK PERFORMED ERROR MESSAGE
Up to 20 loops/stations are allowed for the Downstream
input
“Too many loops of a station type in fuzzy
equation”
‘|’ must be used to delimit different input types “Missing delimiter — expecting ' & ' or ' |
' to continue fuzzy eqn”
‘&’ must be used to delimit stations/loops of the same input
type
“Too many |'s delimiting locations in
fuzzy eqn”
An equation to be continued on the next line must end with a
delimiter ‘=’, ‘|’, or ‘&’
“Missing delimiter — expecting ' & ' or ' |
' to continue fuzzy eqn”
The HOV input is the only optional input. “Missing delimiter in fuzzy eqn —
expecting & or |” or “Queue or Advance
Queue loops are missing from fuzzy eqn”
The number of samples used to calculate the Queue and
Advance Queue inputs must be given in parenthesis following
detector name, with no spaces in between.
“Number of samples for queue or percent
adjustment for HOV not found in fuzzy
eqn”
If there is not an HOV input, the equation must end with the
Advance Queue input, followed by the number of samples
—not a delimiter
“Cabinet/loop name not found in fuzzy
eqn”
HOV loop must be a passage loop containing the string “HP’ “Loop for HOV Bypass in fuzzy eqn is not
of correct type”
The percentage of HOV bypass applied to a lane must be
specified in parantheses immediately after the HOV loop name
“Number of samples for queue or percent
adjustment for HOV not found in fuzzy
eqn”
The percentage of HOV bypass applied must be between 0 and
100
“Percent adjustment for HOV Bypasss is
out of 0—100 range in fuzzy eqn”
Do not put more than one equation per line. (This differs from
the other Traffic Analysis Programs.)
Either second equation will not be found or
several possible messages will be generated
if the second equation continues to the next
line
Fuzzymeter
The following tests were performed to verify the operation of fuzzymeter and
watch_fuzzymeter. All tests were completed successfully.
1) Rebuilt RMDB with fuzzymeter equations, error free.

95
2) The fuzzymeter parameters appeared in patch_rmdb and could be updated
successfully.
3) Tested that fuzzymeter obtained the correct values for the known inputs provided by
the 170 test rack.
4) Watch_rmdc showed that the 170 returned the correct fuzzymeter lane status and
implemented the correct rate.
5) When PermitFuzzymeter1 was changed to NO, the 170 stopped fuzzy metering, as
intended.
6) Fuzzymeter wrote to the event log file as expected.
7) Watch_fuzzymeter displayed the correct inputs, internal calculations, and outcomes
of fuzzymeter. The metering rates calculated by watch_fuzzymeter matched those
calculated by fuzzymeter and those subsequently returned from the 170.
8) When fuzzymeter was disabled, watch_fuzzymeter correctly displayed that
fuzzymeter was not enabled.
9) When fuzzymeter had insufficient data, watch_fuzzymeter correctly stated this
message.
10) When fuzzymeter was disabled, rmdc_comm sent out the old data poll as intended
(rather than the new data poll).
Table 13 lists the error checking that fuzzymeter performs upon start-up to verify
that the inputs to the controller were specified correctly. Further tests were performed to
verify that fuzzymeter detected these errors.

96
Table 13. Equation Error Checks Performed by Fuzzymeter Upon Start-up
EQUATION CHECK PERFORMED ERROR MESSAGE
The cabinet name must exist in RMDB “Eqn:Cabinet name not in RMDB –
skipped”
The cabinet station/loop name must exist in RMDB “Station:loop name not found”
The number of samples to calculate the queue inputs and the
percentage of HOV bypass must be less than 128 (1 byte
size)
"Number of samples for queue or percent
HOV adjustment is too large”
170
The following tests were performed to check for the correct operation of the new
170 logic in receiving the new 170 data poll:
1) The fuzzy metering rates were implemented on the enabled lanes whether bottleneck
was enabled or disabled for the cabinet. Bottleneck and fuzzymeter could
simultaneously meter different lanes within the same cabinet.
• If the fuzzy metering rate was below the minimum rate allowed for that cabinet,
the minimum metering rate was used.
• If the fuzzy metering rate was above the maximum rate allowed for that cabinet,
the maximum metering rate was used.
2) The bottleneck metering rate was calculated correctly when the bottleneck
adjustment was sent via the new data poll (which also contained the fuzzy metering
rates).
• When the calculated bottleneck metering rate was above the maximum rate
allowed, the maximum rate was implemented.
• When the bottleneck metering rate was below the minimum rate allowed, the
minimum rate was implemented.

97
• The bottleneck metering rate calculation was correct when the MultiLaneSplit
was set to 0%. The volume adjustment was done correctly.
• The bottleneck metering rate calculation was correct for both negative and
positive storage rates.
3) The local metering rate was calculated correctly when the new data poll was used.
(Fuzzy metering was enabled on at least one lane, and bottleneck was disabled for
the cabinet.)
• When the local mainline occupancy was less than the first local table occupancy,
the local metering rate was the maximum allowed rate.
• When the local mainline occupancy was between the first and second local table
occupancies, the local metering rate was interpolated correctly.
• When the local mainline occupancy was between the second and third local table
occupancies, the local metering rate was interpolated correctly.
• When the local mainline occupancy was between the third and fourth local table
occupancies, the local metering rate was interpolated correctly.
• When the local mainline occupancy was between the fourth and fifth local table
occupancies, the local metering rate was interpolated correctly.
• When the local mainline occupancy was greater than the fifth local table
occupancy, the local metering rate was the minimum allowed rate.
4) The control between the different ramp metering algorithms worked properly.
• The time-of-day (TOD) rate was implemented correctly when the new data poll
was used. (Fuzzy metering was enabled but the ControlSwitch was set to
“TOD.”) When the ControlSwitch was set to “TOD,” the 170 did not

98
implement fuzzy metering or bottleneck metering. Instead, it chose the
minimum between the local metering rate and TOD rate.
• When the ControlSwitch was set to “Central” and the bottleneck adjustment was
sent via the new data poll (fuzzy metering was enabled on one or more lanes),
the 170 chose the minimum between the local metering rate and the bottleneck
metering rate. (The bottleneck rate was only applied for the lanes that did not
use fuzzy metering.)
• When bottleneck was enabled for the cabinet and fuzzy metering was enabled
for a lane within that cabinet, fuzzy metering overrode bottleneck for that lane.
(This control hierarchy was necessary because bottleneck rates are cabinet
specific, and fuzzy metering rates are lane specific.)
• When the CentralSwitch was set to “Central” and fuzzy metering was enabled,
the fuzzy metering rate was implemented regardless of the local metering rate
and TOD rates.
CPU Requirements
CPU measurements for the TAPS were aggragated over two hours to compare their
relative computational intensity on the VAX (Table 14). Given approximately the same
number of cabinets for which to calculate metering rates, fuzzymeter had CPU
requirements similar to those of bottleneck. The CPU requirements of fuzzymeter were
reasonable in comparison to the other TAPS. The 5-minute CPU usages of these processes
were also examined. The CPU requirements were nearly constant for all processes for the
two hours from 9:20 AM to 11:20 AM on March 31, 1999.
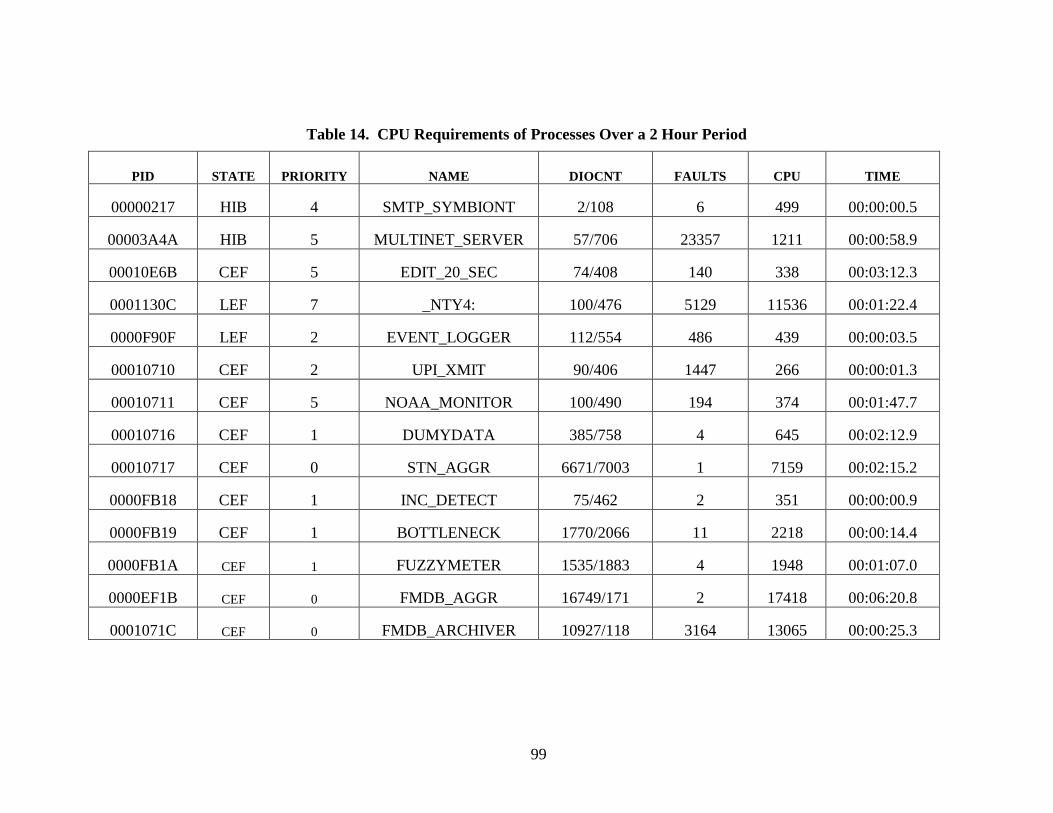
99
Table 14. CPU Requirements of Processes Over a 2 Hour Period
PID STATE PRIORITY NAME DIOCNT FAULTS CPU TIME
00000217 HIB 4 SMTP_SYMBIONT 2/108 6 499 00:00:00.5
00003A4A HIB 5 MULTINET_SERVER 57/706 23357 1211 00:00:58.9
00010E6B CEF 5 EDIT_20_SEC 74/408 140 338 00:03:12.3
0001130C LEF 7 _NTY4: 100/476 5129 11536 00:01:22.4
0000F90F LEF 2 EVENT_LOGGER 112/554 486 439 00:00:03.5
00010710 CEF 2 UPI_XMIT 90/406 1447 266 00:00:01.3
00010711 CEF 5 NOAA_MONITOR 100/490 194 374 00:01:47.7
00010716 CEF 1 DUMYDATA 385/758 4 645 00:02:12.9
00010717 CEF 0 STN_AGGR 6671/7003 1 7159 00:02:15.2
0000FB18 CEF 1 INC_DETECT 75/462 2 351 00:00:00.9
0000FB19 CEF 1 BOTTLENECK 1770/2066 11 2218 00:00:14.4
0000FB1A CEF 1 FUZZYMETER 1535/1883 4 1948 00:01:07.0
0000EF1B CEF 0 FMDB_AGGR 16749/171 2 17418 00:06:20.8
0001071C CEF 0 FMDB_ARCHIVER 10927/118 3164 13065 00:00:25.3

100
BUG REPORT
During the process of testing, one bug was found. This bug is the result of an
incompatibility between the new file ntcip.h and the watch_fuzzymeter software. Ntcip.h
is one of the new files created by a separate project to implement NTCIP standard
communications between TMS and the variable message signs (VMS). This file was
implemented onto the real-time system in January 1999 (just after The Fuzzy Logic Ramp
Metering Algorithm was implemented). The bug resides in a known line of ntcip.h that
allocates memory. When the object library is compiled with this line of ntcip.h,
watch_fuzzymeter cannot retrieve good data, although fuzzymeter works without any
problems. As far as we know, no other processes except watch_fuzzymeter are affected by
the NTCIP bug. When the object library is compiled without this particular line of ntcip.h,
watch_fuzzymeter works without any problem.
To get around this bug for the time being, watch_fuzzymeter links to a different
object library, which is identical to the object library used by all other processes except that
the one problematic line in ntcip.h is deleted. Although this version works fine for a short-
term solution, it is highly recommended that the NTCIP bug is fixed as soon as possible.
Fixing bugs in the NTCIP project is outside the scope of this project. Memory problems
such as these are the most dangerous type of bug. Although the consequences appear
benign for the present time, as the databases grow over time, locations for process memory
may move around. In the future, the NTCIP bug could overwrite different parts of
memory and damage more critical operations. Furthermore, if changes are made to the
object library before the NTCIP bug is fixed, be sure to update the same changes in
watch_fuzzymeter’s object library for proper configuration. The known details of this bug
have been reported to the TMS software manager at WSDOT, who is working on the
problem.

101
PERFORMANCE EVALUATION SOFTWARE
One of the difficulties of on-line testing was that the system-wide performance
measures that we desired were not readily available. Ideally, we wanted to know the total
distance traveled by all vehicles in the system, the total travel times of all vehicles in the
system, and ramp queue delay. Realistically, the scope of this project was limited to
performance measures that we could estimate through a combination of hardware and
software processing. In addition to mainline performance measures, we needed queue
performance measures to determine if there was system-wide benefit. (For further details
on which performance measures were used and why they were chosen, see the evaluation
report, Taylor and Meldrum, 2000). We evaluated several methods of obtaining and
processing data, and we chose the one best suited to our needs.
METHODS EXPLORED
We evaluated several possibilities for gathering 5-minute data and performance
measures for our study sites, and we decided which of these would best suit our needs to
analyze the performance of the new ramp metering algorithm:
1) Trafficview — This was a sidewalk.com Web page that used WSDOT’s 20-
second data to make travel time estimates. The estimates were based on current (not
predicted) conditions. Trafficview emailed travel times from the study sites as frequently
as we wanted. Although this was a very user friendly tool, the difficulty was in the
availability and reproducibility of this performance measure. We did not know if
TrafficView would be in operation when we needed it. (In fact, it was not, so it is
fortunate that we did not choose it.) We also did not know the exact methods used to
calculate the travel times. And we did not know if we could apply the same method in

102
subsequent studies as a standard of comparison. Despite the convenience, we chose not to
use it for these reasons.
2) CDR — This software retrieved archived 5-minute data, which was
automatically sent from the central VAX to another server every night. From this data
server, the 5-minute archived data could easily be retrieved from anywhere on the network.
We found that CDR was very useful. Using CDR, we created data files of requested data
that we could import directly into Excel. Using CDR data, we created throughput
histograms of our study sites in Excel. (See test results in evaluation report, Taylor and
Meldrum, 2000). We also used CDR to estimate the control parameters at previously
unmetered ramps. (See system-wide implementation of the evaluation report.) Primarily,
we used CDR to preprocess the data for CD Analyst.
3) CD Analyst — We decided to use the CD Analyst software produced by the
FLOW project (Ishimaru and Hallenbeck, 1999) because it will be the standard
performance evaluation software for our region and because it provides a uniform method
for future comparisons. We used FLOW software to produce occupancy contour maps of
the study sites, frequency of breakdown plots, and travel time measures. The occupancy
contour maps were very useful in evaluating congestion on the mainline. (See test results
in evaluation report, Taylor and Meldrum, 2000). The frequency of breakdown plots were
very valuable for determining which stations to use as downstream inputs for a given ramp.
(See downstream input section of the training manual, Taylor and Meldrum, 2000). We
found that the travel times were not accurate enough to be of use because of the way in
which the speed was estimated and the fact that ramp delay was not included. (See
discussion of performance measures in the evaluation report).

103
GETTING 20-SECOND DATA
While CDR and CD Analyst software are suitable for mainline performance
measures, they do not provide measures of ramp metering queue performance. To evaluate
ramp queues, ramp delays, and metering sensitivity to mainline conditions, analysis of the
queue was necessary. In particular, we thought it was necessary to use 20-second data
because previous attempts by Ishimaru and Hallenbeck found that the 5-minute data were
not adequate for queue analysis, and it was believed that 20-second analysis would be
accurate enough for queue analysis. For this reason, we continued to explore ways to
retrieve and analyze 20-second data for queue analysis to be used in conjunction with the
mainline performance measures:
1) TDAD — This project was a 20-second database project at the University of
Washington that archived 20-second data and provided files of queried data.
Unfortunately, we found that 9 months of data had been lost, and the database was not
available to us for use. There were some difficulties accessing the data behind firewalls,
and we had no way of storing the results of our query into a file because of the way that the
Java language handles security. For these reasons, we could not use TDAD.
2) SDD — This was a UW project that provided 20-second data to clients in
realtime. We installed the software to retrieve these data. Although this server worked,
much more programming would have been necessary to parse and process the incoming
data into a usable form.
3) VDR — This was a TMS utility that created 5-minute data files directly from the
VAX as specified by the user. We explored the possibility of modifying this utility to
create 20-second data files as well. It turned out that the modifications necessary for VDR
to create 20-second data files would be too involved for this project.
4) Get_20_sec_data utility on VAX — This was a VAX utility that produced 20-
second data files for the times and loop detectors specified in an input file. However, the

104
companion software to convert the resulting data files to ASCII on the PC had been lost by
WSDOT years ago. We looked at the code and discovered that it was easy to modify the
code to write ASCII files (see edit_20_sec.c section under NEW CODE). In comparison to
the other methods of gathering and processing 20-sec data, this one was the easiest of the
four methods discussed here, so we decided to use it. We made the necessary changes to
create ASCII files, wrote a makefile to compile the software in a bubble environment, and
installed the code on the VAX. Most significantly, we wrote code that automates the
process of gathering 20-sec data. Formerly, it was necessary to modify the input file every
day with the proper collection date, times, and stations. The new code that we wrote,
edit_20_sec, checks the date and time so that it automatically collects the desired loops and
stations for morning metering between 6 am and 9:30 am on weekdays. For the afternoon
metering period, it collects the desired loops and stations between 2:30 and 6 p.m. on
weekdays. This new software ran continuously for the several months during which we
evaluated our study sites, and these 20-second data files were successfully used to
evaluation the queue with respect to ramp metering performance.
PROCESSING 20-SECOND DATA
We wrote software to analyze 20-second data for evaluating ramp metering
performance. The software that processes 20-second data and provides performance
measures must run on Matlab. While we wrote this code for our purposes of evaluating
ramp metering performance, other researchers and TSMC personnel expressed an interest
in this type of software tool. For this reason, we have written the code in a modular
manner that is easy to modify, and we have made the code available to anyone at WSDOT
who needs it. (Look on the TSMC directory of the Quartz server for the 20_sec_analysis
directory at the Northwest District).
The files ending in ‘.m’ are run from the Matlab command window by typing the
file name. The files are either script files or functions. Script files read the data and run the
commands in the m-file using the variables in the workspace. Functions require certain
105
inputs. You can get help on the command line for any of these files by typing help
filename. All files can be run stand-alone or run from the main program, queue, which is
menu driven. To run these functions stand alone, you must have any necessary variables
in the workspace. You can get the variables into the workspace either by parsing a file
using queue or by loading variables from a file of type *.mat. To see the defined
variables, type who . To see the value of any variable, type the variable name. If you want
to save the variables in your workspace at any time (to save you from reparsing the original
data file), type save ES-xxxx.mat. When you want to restore the data, type load ES-
xxxx.mat.
The capabilities of the new software are summarized, followed by the module
names related to those functions.
1) Open an ASCII file that was created by the VAX utility get_20_sec and parse the
20-second data file to get the volumes, occupancies, and data validity flags for
entering and exiting ramp data: cab_sort.m, cablistinput.m, queue.m,
parse_data_file.m, queue_params.m, parse_main.m, and
main_params.m.
2) Patch bad data using good adjacent data, if possible, and create a bar graph of data
quality: data_patch*.m and data_quality.m.
3) Simulate ramp metering for each 20-second cycle: queue.m, get_mr,
meter_params.m, local_meter.m, interpolate.m, local_params.m,
queue_override_occ.m, and queue_override_vol.
4) Estimate and plot the storage rates for each 20-second cycle (using either real
passage volume or simulated metering rates): queue.m and calc_queue*.m.
5) Estimate and plot the ramp queue in vehicles as the accumulative sum of the storage
rate on the ramp: queue.m and calc_queue*.m.

106
6) Plot the ramp demand and the ramp passage versus time for general purpose lanes,
HOV lanes, or the sum of general purpose and HOV lanes: queue.m and
calc_queue*.m.
7) Calculate and plot the queue performance measures: plot_queue_occ*lane.m
8) Tune and graph the fuzzy classes to determine the appropriate design: trap*.m
and default_tuned*.m.
Psuedo code is given for some of these files.
Cab_sort.m — Reads the aggregate data files and creates the new data files for
each cabinet. Although it is not necessary to run the cab_sort.m preprocessor, it will
speed up the queue analysis if you're examining multiple on-ramps. This process may take
a while. If you have a big input file, you may want to run this over night.
• Opens the ASCII file created by the VAX utility get_20_sec.
• Opens and reads the file, cablistinput.m. Cablistinput.m must contain a list of
cabinets for which data files will be created by cab_sort.m. Modify this file to
include the cabinets that you want! This file must use the specified format:
cab_list = {'ES-xxxx' 'ES-xxxx',...};
• Sorts file by cabinet name.
• Creates a new 20-second data file for each specified cabinet name.
Queue.m — the main menu driven interface. Be sure to review the loop names in
queue_params.m before running queue.m! Be sure to review and if necessary, update
the equations in calc_queue*.m!
• Opens the ASCII file created by the VAX utility get_20_sec.

107
• If the user chooses to parse a data file (as opposed to loading the variables into the
workspace from a *.mat file), parse_data_file is called.
Parses data file to get the volumes, occupancies, and data validity flags for
entering and exiting ramp data
• If the user chooses to patch any bad data, the appropriate data_patch*.m is
called.
Estimates bad data using good adjacent data if possible.
Creates bar graph of data quality with percentage of good+fixed.
• If the user chooses to ramp meter the data, get_mr simulates ramp metering for
each 20-sec cycle. (You would want to use this feature on unmetered data for
ramps that have not previously been metered in order to estimate the queue.
Get_mr actually writes the metering rate into the passage rate, so do not use this
function if you want to analyze the queue performance of metered data.)
• If the user chooses to calculate the queue, the appropriate calc_queue*.m is
called.
Estimates the storage rate for each 20-second cycle.
Estimates the queue length in vehicles as an accumulative sum of the storage rate.
Estimates the queue delay using the current metering rate .
Plots queue length and queue delay during metering.
Queue_params.m is an m-file used by queue.m to specify the loop names,
cabinet name, and directory name. Review this file and update it before running
queue.m. Enter the cabinet name for the ramp queue analysis. If you do not run the
preprocessor called cab_sort, you'll need to rename your data file to match the cabinet
name to be analyzed with the form “ES-xxxx.log.” If you need the mainline local station

108
and it has a different cabinet name than the ramp loops, then you must use the original data
file. (The cab_sort preprocessor won't work for you.) Revise loop names as needed.
Do not delete the ones you do not need, but make sure that the ones you do need are
correct! If you want to analyze lane 3 and it is not adjacent to lanes 1 and 2, set
gp1_passage to '_MS_P_3,' and set gp1_demand to '_MS_Q_3.' Do likewise for the
HOV passage and demand. You must rerun queue.m for each set of adjacent ramps. In
other words, run queue.m first for the adjacent metered lanes 1 and 2. Then run
queue.m again for independently metered lane 3. If lane 2 is not adjacent to lane 1, the
analysis for lanes 1 and 2 must be done independently. The code does not currently
support lane 3 if it is metered adjacent to lanes 1 and 2. Be sure to look at actual loop
locations to determine whether to use the queue loops, intermediate queue loops, or
advance queue loops for the best representation of the demand. (In other words, which
queue loop is adjacent to the HOV demand? Which queue loop encompasses the end of the
queue? Do you have the unusual case where the queue loop includes the HOV volumes
before it splits off, as in geometry case #5 of the queue.m menu?) Be sure to examine the
equations in calc_queue*.m to see if these are used appropriately. If an error occurs
during calc_queue*.m, you have probably not specified your loop names correctly.
Compare them to the actual loops in the data file. You also may have specified the wrong
geometry.
Parse_data_file.m — Parses the raw data file to extract the desired data.
Queue_param.m defines what cabinet/loop/stations names to extract.
Data_patch*.m — Patches any bad data and graphs them. These modules call
the function data_quality.m to estimate the bad data by interpolating with good data that
are adjacent in time. Bar graphs show old good data plus new good data quality. They are
called by queue.m or can run standalone with the variables in workspace. If a module is

109
run more than once on the same raw data, it will patch the patched data. (It may continue to
increase the number of interpolated data points, but the reliability of repatched data
decreases with each run of data patch.) Run only one of the following modules, depending
on your ramp metering geometry. These module names correspond to how many lanes are
metered side-by-side where crossover can occur, not necessarily to the lane numbers:
1) Data_patch_1lane.m
2) Data_patch_1lane_hov.m
3) Data_patch_2lanes.m
4) Data_patch_2lanes_hov.m
5) Data_patch_1lane_hov_inc.m
Data_quality.m — Function called from data_patch*.m to patch bad data. It
returns the percentage of good data samples, the percentage of fixed data samples, and loop
structure with fixed data. It tries to interpolate the bad data with timewise adjacent data.
Get_mr — a function called from queue.m that returns the metering rate. It uses
the function protocol: passage = get_mr (main_data, queue_data, adv_queue_data,
hov_flag, hov_data, lane_no, time_index). Get_mr calls meter_params.m,
local_meter.m, and queue_override.m. It calculates metering rates for all time
intervals given the mainline occupancy, queue occupancy, advance queue occupancy, an
HOV flag to tell if there is a bypass, the HOV bypass volume, the lane number to meter,
and the number of intervals. Get_mr must be called once for each metered lane. The
results are stored in the passage loop variable, overwriting the real passage loop volume
(unless you call it with a different variable name for the result).
Meter_params.m — a script file that contains the parameters used in the Local
Metering Algorithm. Be sure to udpate these parameters before running
get_mr.m! This file is called by local_meter.m and by queue_override.m.
110
Rows (separated by colons) correspond to the lanes 1, 2, and 3. Queue_occ
contains the queue occupancies at which to start and end the queue override for each
lane. Queue_timer and adv_q_timer contain the duration in minutes that the
occupancy exceeds the start queue occupancy before adding the queue_adjust 1 and
queue_adjust 2 to the metering rate. Queue adjustment, queue override, table_rate,
max_rate, and min_rate are all in vehicles/minute.
Local_meter — a function that returns a local metering rate given a mainline
occupancy and the metered lane number. It is called from get_mr.m. It calls
local_params.m and interpolate.m. Be sure that meter_params.m contains
the correct parameters.
Queue_override — Given the queue occupancy, advance queue occupancy, the
lane number to meter, and the previous override state, this function determines the
new override state and calculates metering adjustment. It is called from get_mr and
calls meter_params.m.
Calc_queue*.m — Calculates the storage rate and the total vehicles in the queue
for each 20-second cycle. It plots the storage rate and the vehicles in the queue for each
lane versus time. It also plots the total storage rate and the queue for the metered lane(s),
taking into account any weaving in and out of the HOV bypass lane. Update these
equations as they apply to each ramp! Check the queue_params.m input file to review the
loop names! If you have run a metering simulator, the passage volume will be the
calculated metering rates rather than the actual passage volume. If you want to save your
data for this cabinet without reparsing, type "save ES-xxxx.mat". When you want to
restore the data, type "load ES-xxxx.mat". Then type calc_queue*.m to replot. Run only
one of these modules, depending on your ramp geometry. The following module names

111
correspond to how many lanes are metered side-by-side where crossover can occur, not
necessarily to the lane numbers:
1) Calc_queue_1lane.m
2) Calc_queue_1lane_hov.m
3) Calc_queue_2lanes.m
4) Calc_queue_2lanes_hov.m
5) Calc_queue_1lane_hov_inc.m
112
TRANSFERABILITY
Even before publication of the test results, we received many requests regarding the
applicability of this algorithm to other regions. This code is customized for WSDOT’s
system – it is not “plug and play” for new systems. Successful implementation requires
knowledge of the site specifics, with controller inputs determined as described in the
training manual (Taylor and Meldrum, 2000). The concepts behind this algorithm are
certainly transferable, but the algorithm may need modification depending on detector
types, detector placement, sampling frequency, and control objectives. The fuzzy classes
must be determined with respect to the detector data characteristics and control objectives.
The control objectives are embedded into the rule base. For WSDOT’s system, balancing
the queue rules with the mainline objectives is a necessary feature. For regions that do not
have such oversaturation, their control objectives may be different. Regions that will see
the most benefit from this type of logic are those that have ramp queue detection, the need
to balance mainline objectives with queue objectives, and oversaturation both on the
mainline and ramps. The more congested the facility, the greater the effect of an event.
Incidents occur with greater frequency and bigger consequences on highly congested
facilities. For this reason, adept incident handling is a key feature of the Fuzzy Logic
Ramp Metering Algorithm for Seattle. Likewise, other regions with oversaturation will
value the ability of this algorithm to handle a wide variety of conditions.
Although the controller code itself is relatively simple, the interface between the
system software, control algorithm, field devices, and user interface may need considerable
customizing. For instance, this implementation involved modifying 77,000 lines of C code
for the interface to WSDOT’s highly customized TMSC VAX system (not including the
TMS PC software), compared to 8000 lines of new C code (not including the performance
evaluation software). Of those lines of new code, only 8 percent of the new lines are for
the controller code itself. (The others are for the interface as well.) The fuzzy logic

113
controller itself consists of the following modules: calc_fuzzy_rate, fuzzify, rules,
and defuzzify . (For those interested in purchasing a non-exclusive license for new
source code created in this project, contact Deirdre Meldrum at the Electrical Engineering
Department of the University of Washington. The University of Washington owns the
code, and WSDOT owns a non-exclusive license to the code.)
114
RECOMMENDATIONS
Because this project involved implementing the Fuzzy Logic Ramp Metering
Algorithm system-wide, we also fully trained the freeway operations engineers on how to
use this system. After understanding how watch_fuzzymeter works, the freeway
operations group requested that the TMS operator console display similar data.
Implementing this request is not as simple as it may appear. Fuzzymeter does not store all
of the internal calculations displayed by watch_fuzzymeter. Watch_fuzzymeter only stores
the internal calculations for the chosen ramp. If the operators wanted to access these data,
it would be necessary to modify the TSMC VAX software to store them in a global
database. Rather than clutter up the RMDB with these data, it would be better to store the
data in new fuzzy database. However, the operators do not need this information within
the TMS PC software because they can easily access it through vt320 (a VAX terminal
emulator), which has been installed on all of the operator PCs. They have been instructed
on how to access watch_fuzzymeter through vt320. It is recommended that the operators
become more comfortable logging directly on to the VAX through vt320 to access this
information, because modifying TSMC VAX software to send these data to the TMS PC
software is not cost effective for the marginal convenience it would provide.
We recommend the integration procedure that we used in this project. By doing
preliminary testing on a spare microVAX that duplicated the real environment, we were
able to thoroughly test the code functionality without impacting operations. The bubble
environment (described in the integration procedure) was a useful intermediate step
between off-line testing and fully integrated on-line testing. With this approach, we were
able to avoid any downtime or bugs caused by the on-line implementation of the Fuzzy
Logic Ramp Metering Algorithm.
The time and funds required for software development are typically greatly
underestimated. For this project, over 90 percent of the budget was spent on software,

115
while only 10 percent of the budget was needed for design, hardware, implementation, and
evaluation. Considering this statistic, many projects may benefit by hiring experienced
programmers. Despite the high cost of experienced programmers, they should be able to
get the job done faster, saving money on the overall project. The software interface and
integration were particularly time-consuming. Of the 85,000 lines of new or modified C
code for this implementation, less than 1% of those were for the controller code itself.
When dealing with software integration and testing, particularly for a complex system that
does not permit downtime, allow ample funds to develop, test, integrate, and evaluate
software in a quality manner. For instance, the Bottleneck Algorithm never worked
properly for years after its implementation and was only recently deployed successfully
when its 170 code was debugged through this project. Likewise, we strongly recommend
that WSDOT fixes the NTCIP bug from the VMS project, or consequences could be severe
(see Bug Report). With high turnover rates in employees, documentation is important for
the long-term success of software applications (see Lessons Learned in Piotrowicz and J.
Robinson, 1995). In a nutshell, be sure that budgets for implementation projects include
ample funds for adequate software testing and documentation as part of the contract.
For successful deployment, the importance of communication cannot be overrated.
This implementation required extensive coordination among programmers, system
administrators, freeway operations engineers, software maintenance persons, and other
researchers. When communication between software engineers did not take place on a daily
basis, there were problems with shared resources, incompatible integration schedules for
different projects, and software configuration issues. With frequent feedback from the
freeway operations and software engineers, the quality of the design was improved.
Testing had to be scheduled carefully to avoid affecting other projects and events.
Software status needed to be communicated to hardware personnel to prevent
incompatibilities with field devices. Correspondence with commuters at the study sites
allowed us to fine-tune the metering performance. Progress and results needed to be

116
communicated to managers to build support for the project. Although it may seem
excessive to send out daily or weekly emails regarding the project status, schedule, and
anticipated needs, this was found to be necessary to coordinate activities among all
individuals who were affected or who could affect the project.
At the onset of this project, there was a lack of software support that made this
implementation more time-consuming. WSDOT is now heading in the right direction
regarding software infrastructure. It now has a knowledgeable system administrator for the
TSMC VAX. It has greater in-house knowledge of how to make modifications to the
TSMC VAX code, PC code, and 170 microprocessors. In-house knowledge is very
helpful when fixing bugs, making improvements, or expanding the system. WSDOT has
improved its file maintenance, including backups, security, makefiles, and code
management software. WSDOT should continue to invest in continuous improvements to
the software infrastructure and software personnel. The benefits of proper software
infrastructure include improved operations and better risk management.
As databases grow, features are added, and data requests increase, the demand
increases on the central computer’s processor speed, communication speed, and memory
requirements. It is possible that at some point in the next couple years, an engineer
planning to add a demand on the VAX may discover that the VAX cannot support the
planned functionality. The VAX computer was obsolete from the day implementation was
finished. Because of this obsolescence, maintaining the VAX has been expensive. Because
migrating the TSMC VAX software to a new platform may require several years (remember
how many years it took to migrate to the VAX), we recommend that WSDOT begin the
planning stages for this event. The recommended study should include an estimate of how
long the VAX will be able to handle projected demands, the optimal software and hardware
architecture for the next system, and the recommended timeline for migration to the new
system. Factors that should be considered in determining the new system include how to
handle loads, hardware failures, test beds (such as multiple processors to share loads, take

117
over in case one fails or is devoted to testing), operating system, memory requirements,
processor speed, modularity, expandability, connectivity, data I/O speed and ports, data
archiving, automatic backups, automatic performance measures, standardization, and
security. The study should also estimate the cost of implementing and maintaining the
recommended system, as well as a time line for the migration. With foresight and
planning, WSDOT will confidently meet growing requirements.

118
ACKNOWLEDGMENTS
The contributions of many individuals at WSDOT were integral to the success of
this project. Mark Morse assisted with software design and testing, as well as modifying
the 170 logic. Paul Neel provided input on software design. Brian Dobbins tested the 170
microprocessors. Greg Leege and Don Vondran installed and field-tested the 170
microprocessors. Lanping Xu configured and maintained tempermental VAX machines.
Harriette Lilly contributed to the software integration procedure, software configuration,
and VAX software debugging. Michael Kastner and Michael Forbis debugged the TMS
PC software. Without this cohesive team of talented and knowledgeable individuals, this
project would not have been possible.

119
REFERENCES
J. Ishimaru and M. Hallenbeck, 1999. “Flow Evaluation Design,” Technical Report, WA-RD 466.2.
G. Piotrowicz and J. Robinson, 1995. "Ramp Metering Status in North America," Officeof Traffic Operations, Federal Highway Administration, U. S. Department ofTransportation, Washington, D.C.
C. Taylor and D. Meldrum, 2000. “Algorithm Design, User Interface, and OptimizationProcedure for a Fuzzy Logic Ramp Metering Algorithm: A Training Manual forFreeway Operations Engineers,” WA-RD Technical Report to be published,Washington State Department of Transportation, National Technical InformationService.
C. Taylor and D. Meldrum, 1997. “Documentation of TSMC Software that Interfaces withTraffic Analysis Programs,” Final Technical Report. Washington State Departmentof Transportation, National Technical Information Service, WA-RD 442.2.
C. Taylor and D. Meldrum, 2000. “Evaluation of a Fuzzy Logic Ramp MeteringAlgorithm: A Comparative Study Among Three Ramp Metering Algorithms used inthe Greater Seattle Area,” WA-RD Technical Report to be published, WashingtonState Department of Transportation, National Technical Information Service.
C. Taylor and D. Meldrum, 1995. “Simulation Testing of a Fuzzy Neural Ramp MeteringAlgorithm,” Final Technical Report. Washington State Department ofTransportation, National Technical Information Service, WA-RD 395.1.