a profile of the south african peach market value …
TRANSCRIPT

A PROFILE OF THE SOUTH AFRICAN PEACH MARKET VALUE CHAIN
2015
Directorate Marketing Tel: 012 319 8455 Private Bag X 15 Fax: 012 319 8131 Arcadia E-mail:[email protected] 0007 www.daff.gov.za
TABLE OF CONTENTS
1. DESCRIPTION OF THE PEACH INDUSTRY ........................................................................................... 4 1.1 Peach types and production areas ......................................................................................... 4
1.2 Production and orchard age distribution ............................................................................... 6 1.3 Cultivars grown in South Africa ........................................................................................... 7 1.4 Employment .......................................................................................................................... 9
2. MARKET STRUCTURE .......................................................................................................................... 10 2.1 Domestic markets and prices .............................................................................................. 11
2.2 Exports ................................................................................................................................ 12 2.3 Provincial and district export values of South African peaches ......................................... 17
2.4 Share Analysis .................................................................................................................... 25 2.5 Imports ................................................................................................................................ 28 2.6 Processing ........................................................................................................................... 28
3. GROWTH, VOLATILITY & STABILITY ANALYSIS ............................................................................... 29
4. MARKET INTELIGENCE ........................................................................................................................ 30 4.1 Competitiveness of South African peach exports ............................................................... 30 4.2 South Africa vs. southern hemisphere production in 2014 ................................................. 34
4.3 South Africa vs. southern hemisphere exports in 2014 ...................................................... 34
5. MARKET ACCESS ................................................................................................................................. 35 5.1 Tariffs, quotas and the price entry system .......................................................................... 35
5.2 European Union (EU) ......................................................................................................... 37
5.2.1 Tariff barriers ............................................................................................................... 38 5.2.2 Non tariff barriers ........................................................................................................ 38
5.2.2.1 Legal requirements................................................................................................ 38
5.2.2.2 Non-legal requirements ......................................................................................... 39 5.2.2.3 Consumer health and safety requirements ............................................................ 40
5.3 United States of America (USA) ........................................................................................ 41 5.3.1 Tariff barriers ............................................................................................................... 41 5.3.2 Non tariff barriers ........................................................................................................ 41
5.4 Japan ................................................................................................................................... 42 5.5 China ................................................................................................................................... 43
6. DISTRIBUTION CHANNELS .................................................................................................................. 43 7. LOGISTICS ............................................................................................................................................. 43
7.1 Mode of transport ................................................................................................................ 44 7.2 Cold chain management ...................................................................................................... 44 7.3 Packaging ............................................................................................................................ 44
8. ORGANIZATIONAL ANALYSIS ............................................................................................................. 44 8.1 Producer and associated organizations ............................................................................... 44 8.2 Strengths, Weaknesses, Opportunities and Threat analysis ................................................ 47 8.3 Strategic challenges ............................................................................................................ 48
8.3.1 Labour markets ............................................................................................................ 48
8.3.2 Infrastructure ................................................................................................................ 49
8.3.3 Other challenges........................................................................................................... 49 8.4 Opportunities....................................................................................................................... 49 8.5 Empowerment issues and transformation in the sector....................................................... 49

3
9. PEACH SUPPLY VALUE CHAIN ........................................................................................................... 50 9.1 Suppliers of inputs and farming requisites.......................................................................... 52 9.2 Producers............................................................................................................................. 52 9.3 Fresh produce markets ........................................................................................................ 52
9.4 Retailers .............................................................................................................................. 52 9.5 Processors ........................................................................................................................... 52 9.6 Cold storage operators and transporters .............................................................................. 52 9.7 Exporters ............................................................................................................................. 53 9.8 PPECB ................................................................................................................................ 53
9.9 Terminal and port operators ................................................................................................ 54
10. ACKNOWLEDGEMENTS ..................................................................................................................... 54

4
1. DESCRIPTION OF THE PEACH INDUSTRY Peaches are one of the most important deciduous fruits grown in South Africa, taking into consideration their foreign exchange earnings, employment creation and linkage with support institutions. During the 2013/2014 season, peaches contributed approximately 8.2% (R0.82 billion) to the total gross value of deciduous fruits (R10 billion) in South Africa. The South African peach industry relies heavily on the processing sector with over half (66% in 2013/14) of the total peaches produced being absorbed by the processing market. Per capita consumption of deciduous and subtropical fruits in South Africa during 2014 was 24.45 kilograms per year. This represented a 6.9% increase from the 2013 figure of 22.87 kilograms per year. Figure 1 illustrates total value of production of peaches for the past decade.
Source: Statistics and Economic Analysis, DAFF
According to Figure 1 there has been a general increase in the gross value of peaches during the last six years. The total gross value increased by 133% between 2004/05 and 2013/14 production seasons. The rise in the total gross value can be attributed to among other things the increased demand in the processing sector and the export markets, as well as the weakening of the local currency relative to the currencies of South Africa‟s major trading partners. It is interesting to note that the increase in total gross value over the last six years did not necessarily result from increased total peach production. The 2013/14 season recorded a 2.8% increase in gross value when compared to the previous production season (2012/13). 1.1 Peach types and production areas Commercial peach production in South Africa is divided into cling peaches (cling stones) and dessert peaches (freestones). The classification depends on whether the flesh sticks to the stone or not, and both can have either white or yellow flesh. Cling peaches are peaches with stones which tend to cling to the flesh inside of the peach, making it difficult to remove the pit of the peach without damaging the flesh. Cling
0
100000
200000
300000
400000
500000
600000
700000
800000
900000
2004/05 2005/06 2006/07 2007/08 2008/09 2009/10 2010/11 2011/12 2012/13 2013/14
Val
ue
(R1
000)
Years
Figure 1: Total value of production for peaches, 2004/05 - 2013/14

5
peaches are often used for canning because the slight distortion of the fruit made by the removal of the pit becomes less noticeable. They are also preferred in the making of jellies and jams. With the freestone peaches the stone can be easily removed from the flesh, making them a good choice for eating fresh. Freestones are mostly found in local grocery stores and retail chains and tend to be larger than cling peaches, with a firmer and less juicy texture. They are excellent for canning and baking purposes. The main production areas for desert peaches (freestones) in South Africa in 2014 are shown in Figure 2. The figure shows that the main dessert peach production areas in South Africa in 2014 were Ceres, Piketberg, Wolseley/Tulbagh, Northern Province, Klein Karoo, and Paarl.
Source: Hortgro Tree Census, 2014
In terms of area planted to dessert peaches in 2014 in South Africa, the leading production area is Ceres at 19% (348 ha). Ceres is followed by Piketberg at 15% (269 ha), Northern Province and Klein Karoo at 14% (258) and 14% (253 ha) respectively. Wolsely/Tulbagh and Paarl follow at 11% (190 ha) and 7% (118 ha) respectively. A total of 1 792 ha was planted to dessert peaches in 2014. The 2014 figure represents a 2.8% increase from the 2013 total of 1 752 ha. The total acreage planted to dessert peaches has been rising during the last three years. Figure 3 presents the main production areas for cling peaches in South Africa during 2014.
Klein Karoo 14%
Ceres 19%
Wolseley/Tulbagh 11%
Piketberg 15%
Northern Province 14%
Free State 5%
Hex Valley 2%
Langkloof East 2%
Mpumalanga 3%
Paarl 7%
Gauteng 3%
Eastern Cape 1%
Others 4%
Figure 2: Production areas of dessert peaches in hectares, 2014

6
Source: Hortgro Tree Census, 2014
Figure 3 indicates that the major production area of cling peaches in South Africa is the Klein Karoo. The region accounted for 49% (2 802 ha) of the total area planted to cling peaches in South Africa during 2014. Klein Karoo is followed by Ceres and Wolseley/Tulbagh at 18% (1 038 ha) and 7% (418 ha) respectively. A total of 5 671 ha was planted to cling peaches in South Africa during 2014. The 2014 figure represents a 0.3% decline when compared with a total planted area of 5 690 ha in 2013. The total acreage planted to cling peaches has been declining over the last three years. 1.2 Production and orchard age distribution Peach production trends for the period 2004/05 to 2013/14 are presented in Figure 4. It is important to note that peach production in South Africa has not experienced any significant growth during the last decade. During the ten years under review production peaked at 191 294 tons in 2011/12 season before declining by 3.9% during the following production season (2012/13). Peach production has been relatively stable since 2004/05, remaining above 150 000 tons but below 200 000 tons per annum during the last ten production seasons. 155 086 tons of peaches were produced in South Africa during the 2013/14 production season, representing a 15.5% decrease when compared to the previous production season (2013/14).
Klein Karoo 50%
Ceres 18%
Wolseley/Tulbagh 7%
Southern Cape 7%
Worsester 6%
Piketberg 1%
Villiersdorp/Vyeboom 3%
Hex Valley 2% Langkloof East
2%
Mpumalanga 1% Others
3%
Figure 3: production areas for clingpeaches in hectares, 2014

7
Source: Statistics and Economic Analysis, DAFF
The orchard age distributions in hectares for both dessert and cling peaches are presented in Table 1. Table 1: Dessert and cling peach orchard age distribution (hectares), 20141
Age Type
0 – 2 years 3 – 5 years 6 – 15 years 16 –18 years 18+ years Total
Dessert 139 (8%)
381 (21%)
814 (45%)
93 (5%)
364 (20%)
1 792 (100%)
Cling 216 4%
407 7%
2 915 51%
523 9%
1 609 28%
5 671 (100%)
Source: Hortgro Tree Census, 2013
It is evident from Table 1 that in percentage (relative) terms, the majority of dessert peaches planted in South Africa during 2014 were 15 years old or younger. Only 20% (364 ha) of the total area planted to dessert peaches in 2014 had orchards that were older than 18 years. In the case of cling peaches, only 7% (407 ha) of the total area planted to cling peaches in 2014 was between 3 and 5 years old or younger years old. It is important that this proportion of the total orchards is increased if future production of cling peaches is to be increased in South Africa. The percentage of orchards of cling peaches that are 18 or years older is also relatively high (28%), indicating the need for replanting. 1.3 Cultivars grown in South Africa
1 Percentages in parenthesis
0
50000
100000
150000
200000
250000
2004/05 2005/06 2006/07 2007/08 2008/09 2009/10 2010/11 2011/12 2012/13 2013/14
Vo
lum
e in
To
ns
Years
Figure 4:Total South African peach production, 2004/5 - 2013/14

8
Figures 5 shows the leading cultivars in South Africa for dessert peaches in 2014. South Africa‟ main dessert peach cultivars in 2014 were Transvalia at 10% (182 ha), Sunsweet at 6% (100) as well as Temptation, Witzenberg, Sunsweet and Cederberg at 4% (80 ha, 78 ha, 73 ha and 71 ha). San Pedro and Novadonna follow at 3% each to total area planted to dessert peaches in 2014. Several other dessert cultivars planted in South Africa in 2014 accounted for 49% (868 ha) of the total area planted to dessert peaches in 2014.
Source: Hortgro Tree Census, 2014
Cling peach cultivars planted in South Africa during 2014 are shown in Figure 6. Figure 6 shows that during 2014, Keisie accounted for 25% (1 394 ha) of the total area planted to Cling peaches in South Africa. It was followed by Kakamas at 15% (864 ha), Sandvlie at 12% (697 ha), Oom Sarel t at 9% (498 ha) and Western sun at 7% (418 ha). Other cultivars accounted for 7% (368 ha) of the total acreage planted to cling peaches in 2014.
Transvalia 10%
Summersun 6%
Temptation 4%
Witzenberg 4%
Sunsweet 4%
Cederberg 4%
Golden Pride 4%
Experimental 4%
Fairtime 4%
San Pedro 3% Novadonna
3% Excellence
2%
Other 48%
Figure 5: Dessert cultivars planted in hectares, 2014

9
Source: Hortgro Tree Census, 2014
1.4 Employment The peach industry makes an important contribution in the creation of jobs in South Africa. The industry creates job opportunities in both production and processing of peaches. The industry also provides indirect employment for numerous support industries in the areas where peaches are grown. During 2014 direct employment within the peach industry was estimated at 8 059 labourers with 32 238 dependents. The 2014 figure represents a 16% decrease in the number of people directly employed in the peach industry in 2013. The peach industry has been shedding jobs during the last three years. The prescribed minimum wage is used as a baseline for determining basic wages in accordance with the legislation governing conditions of service. Minimum wages for farm workers for the period 1 March 2015 to 1 February 2018 are presented in Table 1. The consumer price index (CPI) is used in the calculation of
Kelsie 25%
Kakamas 15%
Sandvliet 12%
Oom Sarel 9%
Western sun 7%
Prof Neethling 6%
Cascade 6%
Supreme 5%
Prof Malherbe 3%
Woltemade 2%
Goudmyn 2%
Bonnigold 2%
Other 6%
Figure 6: Clingpeaches cultivars planted in hectares, 2014
10
annual wage adjustments. The sectoral determination stipulates that the wage increase will be determined by utilizing the previous year‟s minimum wage plus CPI + 1.5%. Table 1: Minimum wages for farm workers in the Republic of South Africa, 2016 - 2019
Minimum rate for the period Minimum rate for the period
Minimum rate for the period
1 March 2016 to 28 February 2017 1 March 2017 to 28 February 2018
1 March 2018 to 28 February 2019
Monthly Weekly Daily Hourly Monthly
Weekly
Hourly
Monthly
Weekly
Hourly
R2778.83 R641.32 R128.262 R R14.25 Previous year‟s minimum wage + CPI3 + 1.5%
Previous year‟s minimum wage + CPI + 1.5%
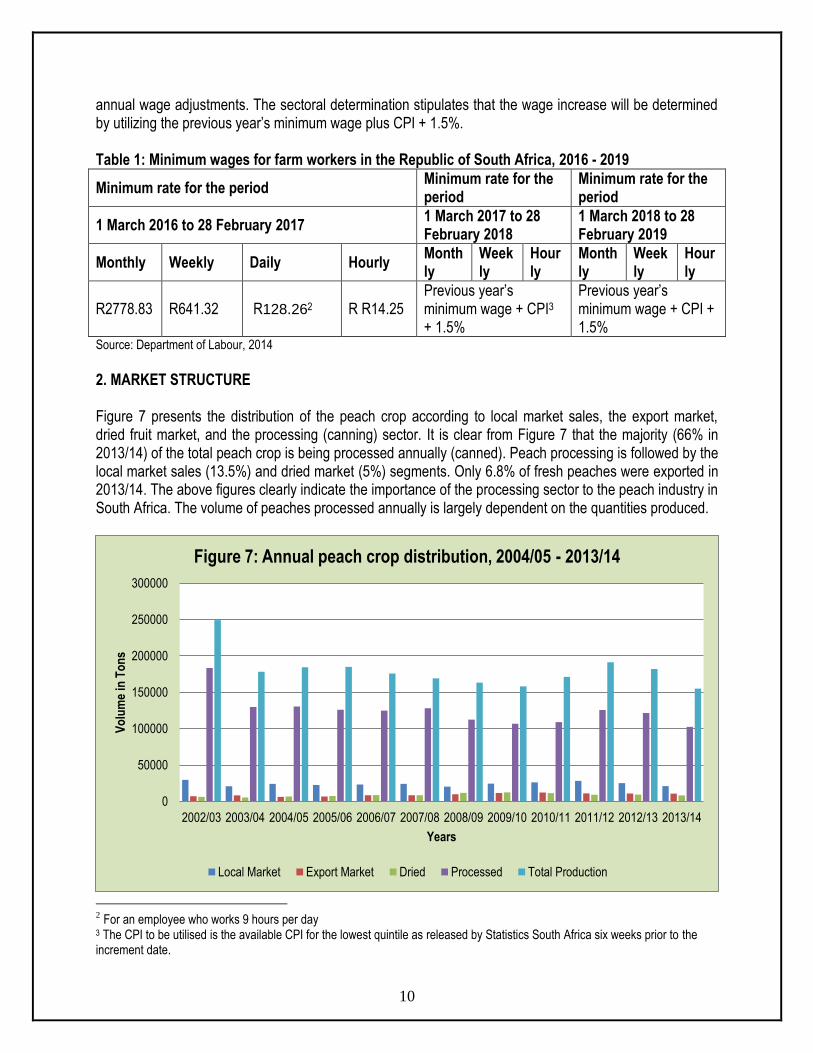
Source: Department of Labour, 2014 2. MARKET STRUCTURE Figure 7 presents the distribution of the peach crop according to local market sales, the export market, dried fruit market, and the processing (canning) sector. It is clear from Figure 7 that the majority (66% in 2013/14) of the total peach crop is being processed annually (canned). Peach processing is followed by the local market sales (13.5%) and dried market (5%) segments. Only 6.8% of fresh peaches were exported in 2013/14. The above figures clearly indicate the importance of the processing sector to the peach industry in South Africa. The volume of peaches processed annually is largely dependent on the quantities produced.
2 For an employee who works 9 hours per day
3 The CPI to be utilised is the available CPI for the lowest quintile as released by Statistics South Africa six weeks prior to the increment date.
0
50000
100000
150000
200000
250000
300000
2002/03 2003/04 2004/05 2005/06 2006/07 2007/08 2008/09 2009/10 2010/11 2011/12 2012/13 2013/14
Vo
lum
e in
To
ns
Years
Figure 7: Annual peach crop distribution, 2004/05 - 2013/14
Local Market Export Market Dried Processed Total Production
11
Source: Statistics and Economic Analysis, DAFF
Peaches generally fetch higher prices in export and local markets even though the quantities destined for these markets in South Africa are relatively lower compared to the proportion that goes to the processing or canning industry.
2.1 Domestic markets and prices
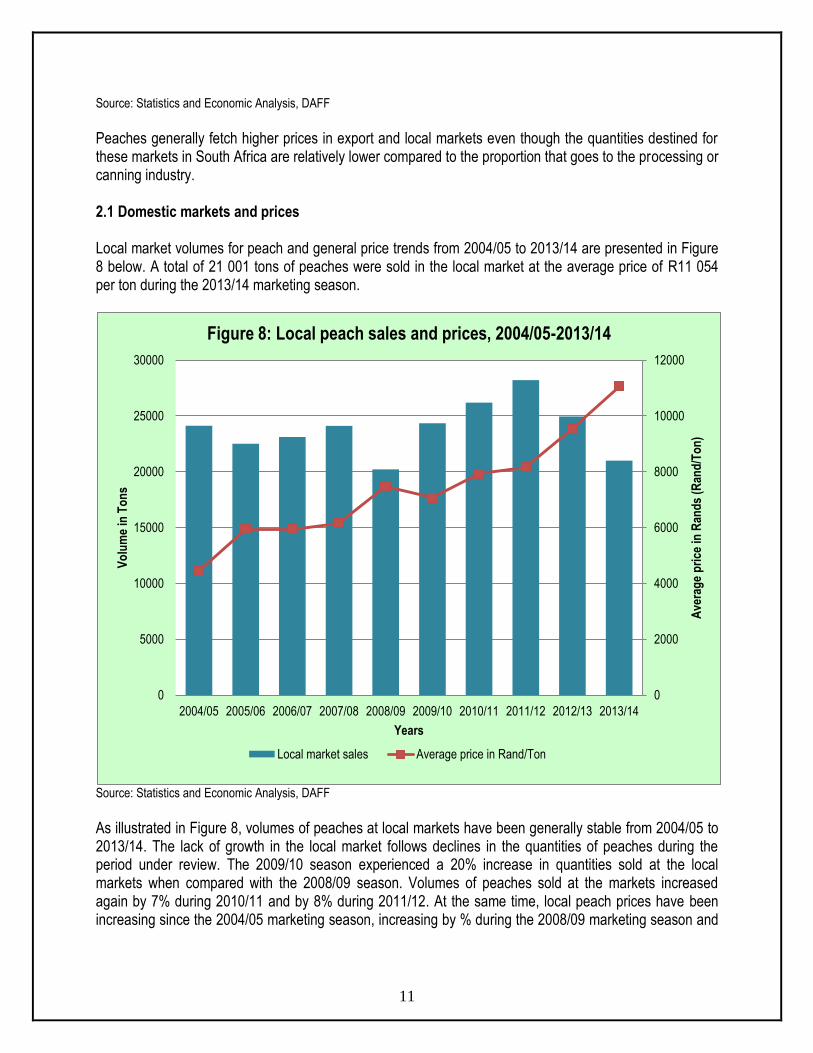
Local market volumes for peach and general price trends from 2004/05 to 2013/14 are presented in Figure 8 below. A total of 21 001 tons of peaches were sold in the local market at the average price of R11 054 per ton during the 2013/14 marketing season.
Source: Statistics and Economic Analysis, DAFF
As illustrated in Figure 8, volumes of peaches at local markets have been generally stable from 2004/05 to 2013/14. The lack of growth in the local market follows declines in the quantities of peaches during the period under review. The 2009/10 season experienced a 20% increase in quantities sold at the local markets when compared with the 2008/09 season. Volumes of peaches sold at the markets increased again by 7% during 2010/11 and by 8% during 2011/12. At the same time, local peach prices have been increasing since the 2004/05 marketing season, increasing by % during the 2008/09 marketing season and
0
2000
4000
6000
8000
10000
12000
0
5000
10000
15000
20000
25000
30000
2004/05 2005/06 2006/07 2007/08 2008/09 2009/10 2010/11 2011/12 2012/13 2013/14A
vera
ge
pri
ce in
Ran
ds
(Ran
d/T
on
)
Vo
lum
e in
To
ns
Years
Figure 8: Local peach sales and prices, 2004/05-2013/14
Local market sales Average price in Rand/Ton

12
dropping by 5% during 2009/10 before increasing again by 12% in 2010/11, while recently between 2011/12 and 2013/14, prices experienced 39% increase compared to 2010/11 season. 2.2 Exports South Africa is a relatively small peach grower in terms of global hectares. The country is also not a major volume exporter in global terms. Peaches sold in the export markets generate a greater unit price than that achieved on the local markets. Therefore, a thorough understanding of the rules of the export markets is critical for success in peach production and marketing. Figure 9 presents peach exports originating from South Africa for the period 2005 to 2014.
Source: Quantec Easydata
The volume of peaches exported by South Africa during the 2014 marketing season has increased by 20% when compared to volumes exported during 2013. In 2014 South Africa exported a total of 19 287 tons of peaches at an average price of R19 804 per ton. Total peach export volumes have been increasing since 2007 before 36% drop in 2012, increasing again by 41% between 2012 and 2014. At the same time, net realisation from exports has also been unstable. In 2009 it went up by 60% when compared to the 2007 season and by 17% when compared to the 2008 season. The price however declined by 18% during 2010 compared to 2009, further dropping again by 37% in 2011. During the 2014, export increased by 20% compared to exports in 2013. Exports of South African peaches to the various regions of the world over the past decade are shown in Figure 10.
0.00
5000.00
10000.00
15000.00
20000.00
25000.00
0.00
5000.00
10000.00
15000.00
20000.00
25000.00
2005 2006 2007 2008 2009 2010 2011 2012 2013 2014
Net
rea
lisat
ion
(R
and
/To
n)
Qu
anti
ties
exp
ort
ed (
To
ns)
Years
Figure 9: South African peach exports, 2005 - 2014
Quantity exported Net realisation

13
A total of 19 287 tons of peaches were exported by South Africa in 2014. It can be observed from Figure 10 that during the past decade, most of South Africa‟s exports of peaches went to the European and Asian markets. In 2013 exports to Europe accounted for 62% (9 075 tons) of total South African peach exports while those to Asia accounted for 30% (4 476 tons). South African exports to Europe have been increasing during the past five years. Between 2012 and 2013 South African peach exports to Europe increased by 31% while those to Asia increased by 21%.
Source: Quantec Easydata
South African peach exports to Africa remained above the 1 000 tons mark for most part of the past five yeras, only peaking at 10 064 tons in 2011. Exports to Africa decreased from 10 064 tons in 2011 to 3 043 tons in 2012, an decline of 69%. Exports to the Americas and Oceania have been insignificant. Due to their relative importance to exports of South African peaches the European and Asian markets will be looked at closely in subsections that follow. Volumes of South African peach exports to the various regions of Europe from 2005 to 2014 are presented in Figure 11.
2005 2006 2007 2008 2009 2010 2011 2012 2013 2014
World 6184 6785 8462 8484 9650 15499 21349 13658 16092 19287
Africa 438 407 482 459 573 4885 10064 3043 2426 2376
Americas 1 2 2 1 2 2 3 34 110 98
Asia 1068 1171 1775 3257 3491 4202 3321 3702 4476 5747
Europe 4633 5190 6146 4744 5565 6401 7958 6875 9075 11060
0
5000
10000
15000
20000
25000
Vo
lum
e in
To
ns
Years
Figure 10: Volume of peach exported to various regions, 2005 -2014

14
Source: Quantec Easydata
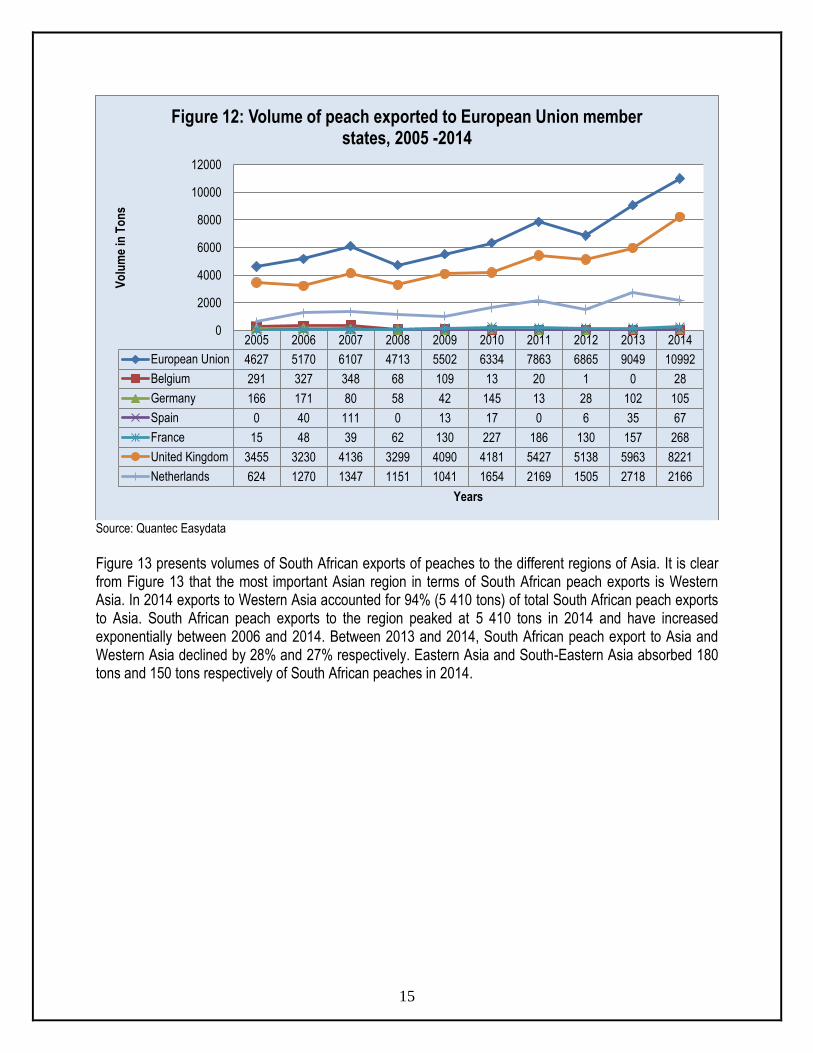
It is evident from Figure 11 that during the last decade the bulk of South African peach exports that went to Europe were destined for the European Union. In 2014 almost all (99%) South African peach exports to Europe were absorbed by the European Union, with very small quantities going to Eastern and Western Europe. Exports to Europe peaked at 11 060 tons in 2014. The volumes of peaches exported by South Africa to the European Union during 2014 increased by 21% when compared to the 2013. Due to its significance to South African peach exports the European Union market is further disaggregated below. Volumes of South African exports of peaches to the different European Union member states during the last decade are depicted in Figure 12. It is important to note that only those countries whose peach imports from South Africa were at least 100 tons in at least one year during the period under review are shown in Figure 12. As can be observed from Figure 12 the major importers of South African peaches in the European Union are the United Kingdom and the Netherlands. In 2014 the two countries accounted for 94% of all South African peach exports to the European Union, with the United Kingdom accounting for 75% and the Netherlands contributing 20%. Between 2013 and 2014 exports to the United Kingdom increased by 37% while those to the Netherlands also went down by 20%. Exports to the other European Union member states have been largely insignificant when compared to those to the United Kingdom and the Netherlands.
2005 2006 2007 2008 2009 2010 2011 2012 2013 2014
Europe 4633 5190 6146 4744 5565 6401 7958 6875 9075 11060
Eastern Europe 0 12 17 3 32 26 39 8 25 61
Northern Europe 0 0 0 0 7 7 0 0 0 0
Southern Europe 4 4 20 0 16 33 41 0 0 0
Western Europe 2 4 2 29 8 2 16 1 1 7
European Union 4627 5170 6107 4713 5502 6334 7863 6865 9049 10992
0
2000
4000
6000
8000
10000
12000
Vo
lum
e in
To
ns
Years
Figure 11: Volume of peach exported to various regions in Europe, 2005 - 2014
15
Source: Quantec Easydata
Figure 13 presents volumes of South African exports of peaches to the different regions of Asia. It is clear from Figure 13 that the most important Asian region in terms of South African peach exports is Western Asia. In 2014 exports to Western Asia accounted for 94% (5 410 tons) of total South African peach exports to Asia. South African peach exports to the region peaked at 5 410 tons in 2014 and have increased exponentially between 2006 and 2014. Between 2013 and 2014, South African peach export to Asia and Western Asia declined by 28% and 27% respectively. Eastern Asia and South-Eastern Asia absorbed 180 tons and 150 tons respectively of South African peaches in 2014.
2005 2006 2007 2008 2009 2010 2011 2012 2013 2014
European Union 4627 5170 6107 4713 5502 6334 7863 6865 9049 10992
Belgium 291 327 348 68 109 13 20 1 0 28
Germany 166 171 80 58 42 145 13 28 102 105
Spain 0 40 111 0 13 17 0 6 35 67
France 15 48 39 62 130 227 186 130 157 268
United Kingdom 3455 3230 4136 3299 4090 4181 5427 5138 5963 8221
Netherlands 624 1270 1347 1151 1041 1654 2169 1505 2718 2166
0
2000
4000
6000
8000
10000
12000
Vo
lum
e in
To
ns
Years
Figure 12: Volume of peach exported to European Union member states, 2005 -2014

16
Source: Quantec Easydata
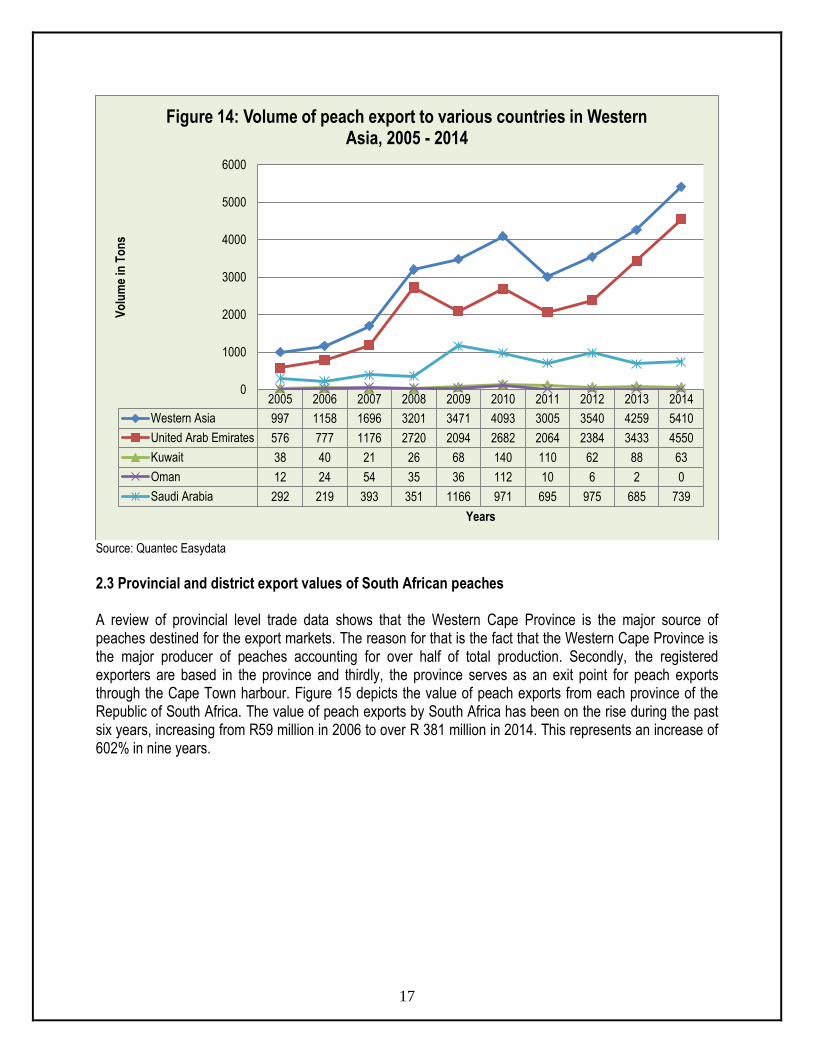
Volumes of South African peach exports to the different countries in Western Asia during the last decade are presented in Figure 14. It is important to note that only those countries whose peach imports from South Africa were at least 100 tons in at least one year during the period under review are shown in Figure 14. The major importers of South African peaches in Western Asia are the United Arab Emirates and Saudi Arabia. In 2014 the United Arab Emirates imported 4 550 tons of peaches worth over R79 million from South Africa while Saudi Arabia imported 738 tons at a value of over R12 million. Between 2013 and 2014, South African peach exports to the United Arab Emirates increased by 33% while those to Saudi Arabia declined by 8%. Other markets for South African peaches in Western Asia are Bahrain, Kuwait and Qatar.
2005 2006 2007 2008 2009 2010 2011 2012 2013 2014
Asia 1068 1171 1775 3257 3491 4202 3321 3702 4476 5747
Eastern Asia 32 0 0 1 3 3 161 91 100 181
South-central Asia 1 0 42 33 17 42 19 3 3 6
South-eastern Asia 38 13 37 22 0 66 136 68 115 150
Western Asia 997 1158 1696 3201 3471 4093 3005 3540 4259 5410
0
1000
2000
3000
4000
5000
6000
7000
Val
ue
in R
and
s (R
1 00
0)
Years
Figure 13: Volume of peach export to various regions in Asia, 2005 to 2014
17
Source: Quantec Easydata
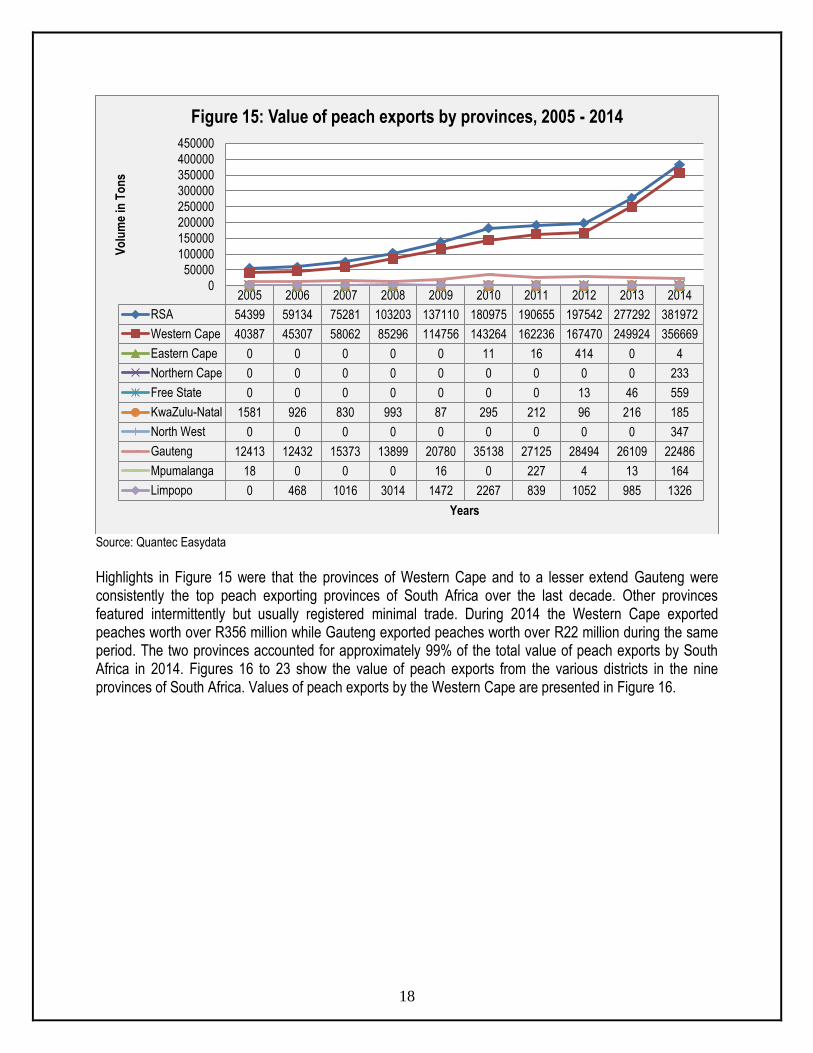
2.3 Provincial and district export values of South African peaches A review of provincial level trade data shows that the Western Cape Province is the major source of peaches destined for the export markets. The reason for that is the fact that the Western Cape Province is the major producer of peaches accounting for over half of total production. Secondly, the registered exporters are based in the province and thirdly, the province serves as an exit point for peach exports through the Cape Town harbour. Figure 15 depicts the value of peach exports from each province of the Republic of South Africa. The value of peach exports by South Africa has been on the rise during the past six years, increasing from R59 million in 2006 to over R 381 million in 2014. This represents an increase of 602% in nine years.
2005 2006 2007 2008 2009 2010 2011 2012 2013 2014
Western Asia 997 1158 1696 3201 3471 4093 3005 3540 4259 5410
United Arab Emirates 576 777 1176 2720 2094 2682 2064 2384 3433 4550
Kuwait 38 40 21 26 68 140 110 62 88 63
Oman 12 24 54 35 36 112 10 6 2 0
Saudi Arabia 292 219 393 351 1166 971 695 975 685 739
0
1000
2000
3000
4000
5000
6000
Vo
lum
e in
To
ns
Years
Figure 14: Volume of peach export to various countries in Western Asia, 2005 - 2014
18
Source: Quantec Easydata
Highlights in Figure 15 were that the provinces of Western Cape and to a lesser extend Gauteng were consistently the top peach exporting provinces of South Africa over the last decade. Other provinces featured intermittently but usually registered minimal trade. During 2014 the Western Cape exported peaches worth over R356 million while Gauteng exported peaches worth over R22 million during the same period. The two provinces accounted for approximately 99% of the total value of peach exports by South Africa in 2014. Figures 16 to 23 show the value of peach exports from the various districts in the nine provinces of South Africa. Values of peach exports by the Western Cape are presented in Figure 16.
2005 2006 2007 2008 2009 2010 2011 2012 2013 2014
RSA 54399 59134 75281 103203 137110 180975 190655 197542 277292 381972
Western Cape 40387 45307 58062 85296 114756 143264 162236 167470 249924 356669
Eastern Cape 0 0 0 0 0 11 16 414 0 4
Northern Cape 0 0 0 0 0 0 0 0 0 233
Free State 0 0 0 0 0 0 0 13 46 559
KwaZulu-Natal 1581 926 830 993 87 295 212 96 216 185
North West 0 0 0 0 0 0 0 0 0 347
Gauteng 12413 12432 15373 13899 20780 35138 27125 28494 26109 22486
Mpumalanga 18 0 0 0 16 0 227 4 13 164
Limpopo 0 468 1016 3014 1472 2267 839 1052 985 1326
0
50000
100000
150000
200000
250000
300000
350000
400000
450000
Vo
lum
e in
To
ns
Years
Figure 15: Value of peach exports by provinces, 2005 - 2014

19
Source: Quantec Easydata
It is clear from Figure 16 that peach exports from the Western Cape province are mainly from the City of Cape Town and Cape Winelands municipalities. High export values for the leading districts were recorded in 2014 for both for the City of Cape Town and for Cape Winelands. The Cape Winelands overtook the City of Cape Town as the leading exporter of peaches in the Western Cape during 2011 until 2014. A total value of over R236 million worth of peach exports were recorded by the Cape Winelands in 2014. The Cape Winelands was followed by the City of Cape Town at over R119 million. The value exported by the Cape Winelands in 2014 was 32% higher than the 2013 value. Values of peach exports by the Gauteng province are shown in Figure 17.
2005 2006 2007 2008 2009 2010 2011 2012 2013 2014
Western Cape 40387 45307 58062 85296 114756 143264 162236 167470 249924 356669
City of Cape Town 20045 23754 33896 55449 72619 80801 59044 52492 69771 119275
West Coast 209 906 608 1238 0 0 37 0 470 508
Cape Winelands 19897 20535 23276 28545 41339 61930 102063 114736 179422 236743
Overberg 0 3 119 0 704 325 0 0 130 15
Eden 236 109 163 64 93 209 1093 241 131 128
0
50000
100000
150000
200000
250000
300000
350000
400000
Val
ue
in R
and
s (R
1 00
0)
Years
Figure 16: Value of peach exports by Western Cape provinces, 2005 - 2014

20
Source: Quantec Easydata
In the Gauteng province, there have been major fluctuations in terms of peach exports during the last decade. The leading role players in the export of peaches for the past ten years have been the City of Johannesburg and Ekurhuleni metropolitan municipalities. High export values of the leading municipalities were recorded in 2012 (for Ekurhuleni) and 2010 (for the City of Johannesburg). A total value of over R12 million worth of peach exports were recorded by the City of Johannesburg in 2014. The City of Johannesburg was followed by the City of Johannesburg at over R8 million. The City of Tshwane was the third leading exporting region in 2014 with exports worth R2 million. City of Johannesburg continued to be the leading exporter of peaches in Gauteng during 2014, with exports growing from R4 million in 2005 to R12 million in 2014. Values of peach exports by the KwaZulu Natal province are shown in Figure 18.
2005 2006 2007 2008 2009 2010 2011 2012 2013 2014
Gauteng 12413 12432 15373 13899 20780 35138 27125 28494 26109 22486
Sedibeng 1297 0 3078 3489 204 0 0 0 0 0
West Rand 870 0 1714 635 7954 0 0 421 99 306
Ekurhuleni 3304 4972 3618 1517 2190 6638 7806 8859 7491 7148
City of Johannesburg 4817 6541 6478 7010 9946 26940 18058 18214 17614 12224
City of Tshwane 2126 919 484 1248 486 1560 1262 1000 905 2808
0
5000
10000
15000
20000
25000
30000
35000
40000
Val
ue
in R
and
s (R
1 00
0)
Years
Figure 17: Value of peach exports by the Gauteng province, 2005 -2014

21
Source: Quantec Easydata
According to Figure 18, peach exports from the KwaZulu Natal province are mainly from Ethekwini metropolitan municipality. High export value for the leading municipality was recorded in 2005. A total value of R185 000 worth of peach exports were recorded by the eThekwini municipality during 2014. The value was 14% lower than the value exported in 2014. The use of the Durban harbour as an exit point may have played a major role in the metropolitan municipality being a leader in the export of peaches from Kwa-Zulu Natal. Values of peach exports by the Eastern Cape province are shown in Figure 19.
Source: Quantec Easydata
2005 2006 2007 2008 2009 2010 2011 2012 2013 2014
KwaZulu-Natal 1581 926 830 993 87 295 212 96 216 185
Ugu 0 0 0 0 0 0 0 12 71 108
eThekwini 1580 926 830 993 87 295 212 84 145 77
0
200
400
600
800
1000
1200
1400
1600
1800
Val
ue
in R
and
s (R
1 00
0)
Years
Figure 18: Value of peach exports by Kwazulu Natal province, 2005 - 2014
2005 2006 2007 2008 2009 2010 2011 2012 2013 2014
Eastern Cape 0 0 0 0 0 11 16 414 0 4
Cacadu 0 0 0 0 0 11 16 414 0 0
Alfred Nzo 0 0 0 0 0 0 0 0 0 1
Buffalo City 0 0 0 0 0 0 0 0 0 3
050
100150200250300350400450
Val
ue
in R
and
s (R
1 0
00)
Years
Figure 19: Value of peach exports by Eastern Cape province, 2005 - 2014

22
It is clear from Figure 19 that peach exports from the Eastern Cape province are mainly from Cacadu, Amathole and Nelson Mandela municipalities. High export values for the leading municipalities were recorded in 2014 for Cacadu . The export value of Cacadu has dropped drastically from the 2013 peak. No pear export were recorded in the Eastern Cape province during 2013 season. Exports worth R3 000 was recorded by Buffalo City in 2014. Values of peach exports by the Free State province are shown in Figure 20.
Source: Quantec Easydata
In the Free State province the leading role player in peach exports is Thabo Mofutsanyane district municipality. High export value for the leading municipality was recorded in 2014. Values of peach exports by the Limpopo province are shown in Figure 21. It is clear from Figure 21 that peach exports from the Limpopo province are mainly from the Waterberg district municipality. High export values for the leading district municipality were recorded in 2008 (Waterberg). The Mopani district however recorded peach exports worth over R1.9 million in 2010, making it the leading municipality in Limpopo during 2010. Exports from the Mopani districts have however retreated to R136 million in 2011, making the Waterberg district the leading peach exporter in Limpopo with R699 000 during the same year until 2014.
2005 2006 2007 2008 2009 2010 2011 2012 2013 2014
Free State 0 0 0 0 0 0 0 13 46 559
Xhariep 0 0 0 0 0 0 0 13 46 52
Thabo Mofutsanyane 0 0 0 0 0 0 0 0 0 418
Fezile Dabi 0 0 0 0 0 0 0 0 0 67
Mangaung 0 0 0 0 0 0 0 0 0 21
0
100
200
300
400
500
600
Val
ue
in R
and
s (R
1 00
0)
Years
Figure 20: Value of peach exports by Free State province, 2005 - 2014

23
Source: Quantec Easydata
Values of peach exports by the North West province are shown in Figure 22. Peach exports from the North West province are mainly from Bojanala district municipality and were only recorded in 2014 (R374 000).
2005 2006 2007 2008 2009 2010 2011 2012 2013 2014
Limpopo 0 468 1016 3014 1472 2267 839 1052 985 1326
Mopani 0 468 0 0 0 1933 136 0 0 0
Vhembe 0 0 0 0 0 9 20 29 35 8
Capricorn 0 0 0 0 0 1 1 0 0 19
Waterberg 0 0 1016 3014 1472 324 682 1023 950 1299
0
500
1000
1500
2000
2500
3000
3500
Val
ue
in R
and
s (R
1 00
0)
Years
Figure 21: Value of peach exports by Limpopo province, 2005 - 2014

24
Source: Quantec Easydata
Values of peach exports by the Mpumalanga province are shown in Figure 23. It is clear from Figure 23 that peach exports from Mpumalanga province are mainly from Nkangala and Ehlanzeni district municipalities. High export values for the leading municipalities were recorded in 2009 (for Nkangala) and 2011 (for Ehlanzeni). A total value of R164 million worth of peach exports was recorded by the Gert Sibande district during 2014.
Source: Quantec Easydata
2005 2006 2007 2008 2009 2010 2011 2012 2013 2014
North West 0 0 0 0 0 0 0 0 0 347
Bojanala 0 0 0 0 0 0 0 0 0 347
0
50
100
150
200
250
300
350
400
Val
ue
in R
and
s (R
1 00
0)
Years
Figure 22: Value of peach exports by North West province, 2005 - 2014
2005 2006 2007 2008 2009 2010 2011 2012 2013 2014
Mpumalanga 18 0 0 0 16 0 227 4 13 164
Gert Sibande 0 0 0 0 0 0 0 0 0 115
Nkangala 0 0 0 0 0 0 0 0 0 5
Ehlanzeni 18 0 0 0 16 0 227 4 13 44
0
50
100
150
200
250
Val
ue
in R
and
s (R
1 00
0)
Years
Figure 23: Value of peach exports by Mpumalanga province, 2005 - 2014

25
2.4 Share Analysis Table 3 is an illustration of provincial shares towards national peach exports for the years 2005 to 2014. It shows that the Western Cape together with Gauteng province (to a lesser extend) have commanded the greatest share of peach exports for the past ten years. As explained earlier, this means that the leading export provinces (Western Cape and Gauteng) derive their advantage from the fact that the registered exporters are based in their provinces and they also have exit points for peach exports. The Western Cape contributed 93.4% of the total South African peach exports in 2014 while the share of Gauteng decreased from 9.4% to 5.9% between 2013 and 2014. Table 3: Share of provincial peach exports to the total RSA peach exports (%) Year 2005 2006 2007 2008 2009 2010 2011 2012 2013 2014
RSA 100.0 100.0 100.0 100.0 100.0 100.0 100.0 100.0 100.0 100.0
Western Cape 74.2 76.6 77.1 82.6 83.7 79.2 85.1 84.8 90.1 93.4
Eastern Cape 0.0 0.0 0.0 0.0 0.0 0.0 0.0 0.2 0.0 0.0
Northern Cape 0.0 0.0 0.0 0.0 0.0 0.0 0.0 0.0 0.0 0.1
Free State 0.0 0.0 0.0 0.0 0.0 0.0 0.0 0.0 0.0 0.1
Kwazulu-Natal 2.9 1.6 1.1 1.0 0.1 0.2 0.1 0.0 0.1 0.0
North West 0.0 0.0 0.0 0.0 0.0 0.0 0.0 0.0 0.0 0.1
Gauteng 22.8 21.0 20.4 13.5 15.2 19.4 14.2 14.4 9.4 5.9
Mpumalanga 0.0 0.0 0.0 0.0 0.0 0.0 0.0 0.0 0.0 0.0
Limpopo 0.0 0.8 1.4 2.9 1.1 1.3 0.4 0.5 0.4 0.3
Source: Calculated from Quantec Easydata
The accompanying tables (Table 4 to 11) show shares of the various districts‟ peach exports to the various provincial peach exports. Table 4: Share of district peach exports to the total Western Cape provincial peach exports (%) Years District
2005 2006 2007 2008 2009 2010 2011 2012 2013 2014
Western Cape 100.0 100.0 100.0 100.0 100.0 100.0 100.0 100.0 100.0 100.0
City of Cape Town
49.6 52.4 58.4 65.0 63.3 56.4 36.4 31.3 27.9 33.4
West Coast 0.5 2.0 1.0 1.5 0.0 0.0 0.0 0.0 0.2 0.1
Cape Winelands 49.3 45.3 40.1 33.5 36.0 43.2 62.9 68.5 71.8 66.4
Overberg 0.0 0.0 0.2 0.0 0.6 0.2 0.0 0.0 0.1 0.0
Eden 0.6 0.2 0.3 0.1 0.1 0.1 0.7 0.1 0.1 0.0
Source: Calculated from Quantec Easydata
Table 4 presents the shares of district peach exports to the total Western Cape provincial peach exports for the years 2005 to 2014. The leading peach export districts in the Western Cape are the Cape Winelands and the City of Cape Town. Together, the two districts accounted for over 99% to total Western Cape provincial peach exports in 2014. The share of the City of Cape Town increase from 27.9% in 2013 to 33.4% in 2014 while that of the Cape Winelands declined from 71.8% to 66.4% during the same period.

26
Table 5: Share of district peach exports to the total Eastern Cape provincial peach exports (%) Years District
2005 2006 2007 2008 2009 2010 2011 2012 2013 2014
Eastern Cape 0.0 0.0 0.0 0.0 0.0 100.0 100.0 100.0 0.0 100.0
Cacadu 0.0 0.0 0.0 0.0 0.0 100.0 100.0 100.0 0.0 0.0
Alfred Nzo 0.0 0.0 0.0 0.0 0.0 0.0 0.0 0.0 0.0 26.5
Buffalo City 0.0 0.0 0.0 0.0 0.0 0.0 0.0 0.0 0.0 73.5
Source: Calculated from Quantec Easydata
The shares of district peach exports to the total Eastern Cape provincial peach exports are presented in Table 5. No exports of peaches were recorded from the Eastern Cape from 2005 to 2009. All recorded exports of peaches in the Eastern Cape between 2010 and 2012 were from the Cacadu district. During 2014, Buffalo City was the leading contributor to peach export with 73.5% share The shares of district peach exports to the total Mpumalanga provincial peach exports are presented in Table 6. Table 6: Share of district peach exports to the total Mpumalanga provincial peach exports (%) Year 2005 2006 2007 2008 2009 2010 2011 2012 2013 2014
Mpumalanga 100.0 100.0 0.0 0.0 100.0 0.0 100.0 100.0 100.0 100.0
Gert Sibande District municipality
0.0 0.0 0.0 0.0 0.0 0.0 0.0 0.0 0.0 70.2
Nkangala District municipality
0.0 0.0 0.0 0.0 0.0 0.0 0.0 0.0 0.0 3.1
Ehlanzeni District municipality
100.0 100.0 0.0 0.0 100.0 0.0 100.0 100.0 100.0 26.7
Source: Calculated from Quantec Easydata
In 2014 the Gert Sibande district was the leading contributor to all peach exports recorded from the Mpumalanga province with 70.2% (see Table 6). The shares of district peach exports to the total Free State provincial peach exports are presented in Table 7. Table 7: Share of district peach exports to the total Free State provincial peach exports (%) Years District
2005 2006 2007 2008 2009 2010 2011 2012 2013 2014
Free State 0.0 0.0 0.0 0.0 0.0 0.0 0.0 100.0 100.0 100.0
Xhariep 0.0 0.0 0.0 0.0 0.0 0.0 0.0 100.0 100.0 9.4
Thabo Mofutsanyane
0.0 0.0 0.0 0.0 0.0 0.0 0.0 0.0 0.0 74.9
Fezile Dabi 0.0 0.0 0.0 0.0 0.0 0.0 0.0 0.0 0.0 12.0
Mangaung 0.0 0.0 0.0 0.0 0.0 0.0 0.0 0.0 0.0 3.7
Source: Calculated from Quantec Easydata
The Free State province never reported any exports of peaches between 2005 and 2011 (see Table 7). All exports recorded in Free State province in 2012 and 2013, were from Xhariep district. In 2014, Thabo Mofutsane distric was the leading exporter with 74.9% share. It was followed by Fezile Dabi and Xhariep

27
Districts with 12% and 9.4% respectively. The shares of district peach exports to the total Gauteng provincial peach exports are presented in Table 8. Table 8: Share of district peach exports to the total Gauteng provincial peach exports (%) Years District
2005 2006 2007 2008 2009 2010 2011 2012 2013 2014
Gauteng 100.0 100.0 100.0 100.0 100.0 100.0 100.0 100.0 100.0 100.0
Sedibeng 10.4 0.0 20.0 25.1 1.0 0.0 0.0 0.0 0.0 0.0
West Rand 7.0 0.0 11.2 4.6 38.3 0.0 0.0 1.5 0.4 1.4
Ekurhuleni 26.6 40.0 23.5 10.9 10.5 18.9 28.8 31.1 28.7 31.8
City of Johannesburg
38.8 52.6 42.1 50.4 47.9 76.7 66.6 63.9 67.5 54.4
City of Tshwane 17.1 7.4 3.1 9.0 2.3 4.4 4.7 3.5 3.3 12.5
Source: Calculated from Quantec Easydata
In the Gauteng province, the contributions of the various districts to total provincial peach exports are distributed between three main districts (see Table 8). In 2014, the leading district was City of Johannesburg with 54.4% share. It was followed by the Ekurhuleni and City of Tshwane districts at 31.8% and 12.5% respectively. The share of the West Rand increased from 0.4% in 2013 to 1.4% in 2014, making it the fourth largest contributor to the total value of peach exports in Gauteng during 2014. The shares of district peach exports to the total North West provincial peach exports are presented in Table 9. Table 9: Share of district peach exports to the total North West provincial peach exports (%) Years District
2005 2006 2007 2008 2009 2010 2011 2012 2013 2014
North West 0.0 0.0 0.0 0.0 0.0 0.0 0.0 0.0 0.0 100.0
Bojanala 0.0 0.0 0.0 0.0 0.0 0.0 0.0 0.0 0.0 100.0
Source: Calculated from Quantec Easydata
The North West province never reported any exports of peaches between 2005 and 2013 (see Table 9). All exports recorded by North West province came from Southern district. The shares of district peach exports to the total Limpopo provincial peach exports are presented in Table 10. Table 10: Share of district peach exports to the total Limpopo provincial peach exports (%) Years District
2005 2006 2007 2008 2009 2010 2011 2012 2013 2014
Limpopo 0.0 100.0 100.0 100.0 100.0 100.0 100.0 100.0 100.0 100.0
Mopani 0.0 100.0 0.0 0.0 0.0 85.3 16.2 0.0 0.0 0.0
Vhembe 0.0 0.0 0.0 0.0 0.0 0.4 2.4 2.3 3.6 0.6
Waterberg 0.0 0.0 100.0 100.0 100.0 14.3 81.3 97.3 96.4 98.0
Source: Calculated from Quantec Easydata

28
In 2007 until 2009, the Waterberg district was the sole contributor to total peach exports from the Limpopo province. The Share of the Waterberg district has however declined from 100% in 2009 to 14.3% in 2010 before increasing again to 81.3% in 2011. Waterberg district accounted for 98% in 2014 while the Capricorn district contributed the remaining 1.5% during the same year. The shares of district peach exports to the total Kwazulu Natal provincial peach exports are presented in Table 11. Table 11: Share of district peach exports to the total Kwa-Zulu Natal provincial peach exports (%), 2005 – 2014
Year 2005 2006 2007 2008 2009 2010 2011 2012 2013 2014
Kwazulu-Natal 100.0 100.0 100.0 100.0 100.0 100.0 100.0 100.0 100.0 100.0
Ugu 0.0 0.0 0.0 0.0 0.0 0.0 0.0 12.7 32.9 58.4
eThekwini 100.0 100.0 100.0 100.0 100.0 100.0 100.0 87.3 67.1 41.6
Source: Calculated from Quantec Easydata
All recorded exports of peaches in the Kwa-Zulu Natal province in 2014 were from the Ethekwini (41.6%) and Ugu district (58.4%) (see Table 11). 2.5 Imports During 2013 South Africa imported total of 1 058 tons peaches worth approximately R20 million. Approximately 72% (764 tons) of all peaches imported by South Africa during 2014 came from Spain. During the same year South Africa‟s imports of peaches represented 0.08% of world imports and its ranking in the world was 62. 2.6 Processing Volumes of peaches purchased for processing in South Africa during the past ten years are presented in Figure 24. The quantities of peaches purchased for processing have been relatively stable over the past ten years, only peaking at 130 441 tons during the 2004/05 season. The volumes declined from 2008/09 until an increase in 2011/12 marketing seasons, moving from 108 912 tons in 2010/11 to tons125 706 in 2011/12. The volumes declined again to 121 539 in 2012/13. During 2013/14, the volumes declined further to 102 347. This represents a decline of 15% between 2012/13 and 2013/14. On the other hand, prices have been increasing during the past four years before 2009/10. The price however declined by 15% between 2008/09 and 2009/10 before increasing again by 32% between 2009/10 and 2013/14.

29
Source: Statistics and Economic Analysis, DAFF
Peaches can be dried, canned, made into jams, jellies, and preserves, used as filling for desserts, and used as an ingredient in many other dishes, from appetizers to entrees. Fresh peaches are highly perishable. Even when unripe, they spoil easily. Peaches that are greenish in colour were probably picked too early and should be avoided. Sweetness does not increase after picking, so ripe-picked fruit is always the tastiest.
3. GROWTH, VOLATILITY & STABILITY ANALYSIS
Table 12 presents the results of growth and coefficient of variation estimations. They were calculated using yearly statistics and covered the same ten-year period under review beginning in 2005 and ending in 2014. The coefficient of variation is a measure of volatility or stability. When the coefficient of variation is less than one, the variable in question is said to be relatively stable, meaning that there were minimal changes. When the coefficient of variation is more than one, it is said to be volatile, meaning there were major changes during the period under review. Table 12: Peach industry growth rates & variation coefficients (2005 – 2014)
Category Subcategory Growth Rate (%) Coefficient of Variation
Production Gross Value (GV) 8.82 0.30
Volume -1.67 0.06
Sales at NFPMs
GV/Price 9.52 0.26
Volume -1.37 0.98
Export Gross Value 8.45 0.15
Volume 12.04 0.26
Import Gross Value 0.03 0.42
Volume 5.01 0.39
0.00
500.00
1000.00
1500.00
2000.00
2500.00
3000.00
0
20000
40000
60000
80000
100000
120000
140000
2004/05 2005/06 2006/07 2007/08 2008/09 2009/10 2010/11 2011/12 2012/13 2013/14
Ave
rag
e p
rice
s (R
and
/To
n)
Vo
lum
e in
To
ns
Years
Figure 24: Peach purchased for processing, 2004/5 -2013/14
Volume in tons Average price in Rand/Ton

30
Source: Calculated from data from Statistics and Economic Analysis, DAFF and Quantec
As shown in Table 12 above, the peach industry experienced a positive growth rate from 2005 to 2014 in terms of both gross values and volumes with the exception of Volumes of production and quanties sold at the NFPMs over the same period. As mentioned in figure production of peaches have been stable over the past ten years, however declined by 15% 2014. The negative growth of both production and sales at the NFPMs is therefore not a surprising trend. Table 12 also shows various levels of volatility at different levels of the peach industry‟s yearly figures over the same period (2005 to 2014). Low volatility was indicated by the coefficients of variation that were less than one (<1). All variables have values less than 1, which means that on a weighted variance scale, they displayed minimal changes for peach during the ten years under review. 4. MARKET INTELIGENCE 4.1 Competitiveness of South African peach exports
Competitiveness is described as an industry‟s capacity to create superior value for its customers and improved profits for the stakeholders in the value chain. The driving force in sustaining a competitive position is productivity that is output efficiency in relation to specific inputs with regard to human, capital and natural resources. In 2014 South African peach exports represented 1.5% of world exports and its ranking on the world exports was number 11. As depicted in Figure 25 below, South African peach exports are growing faster than the world imports in Mozambique, Zimbabwe, Lesotho, Singapore, United Kingdom, Angola, Hong Kong, China and Mauritius markets. South Africa‟s performance in those markets can be regarded as gains in dynamic markets. South African peach exports are growing while the world imports are declining in Canada and Germany markets. South Africa‟s performance in those markets can be regarded as gains in declining markets and should be viewed as achievement in adversity. South African peach exports are declining while the world imports are growing in Saudi Arabia and United Arab Emirates markets. These markets are dynamic and South Africa‟s performance should be regarded as an underachievement.

31
Figure 25: Growth in demand for the South African peaches in 2014
Source: TradeMap, ITC
32
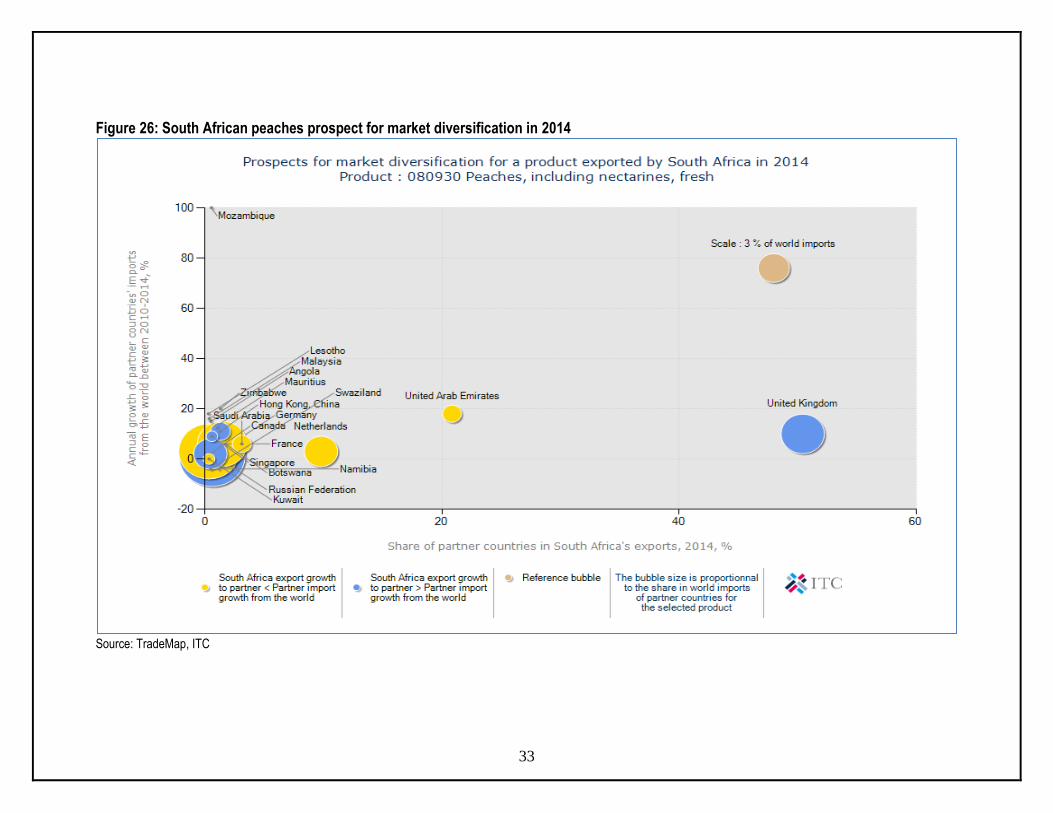
Figure 26 illustrates prospects for market diversification by South African peach exporters during 2014. The UK, United Arab Emirates and Netherlands hold a bigger market share of South African peach exports. In terms of market size, Germany was the largest peach importer in 2014 with just over $356 million ( 285 663 tons) worth of peach imports, or roughly 14.2% of the world peach market. Second was Russia with just over $295 million (225 314 tons) worth of peach imports, or roughly 11.8% market share followed by the France with just over $197 million ( 147 764 tons) worth of peach imports, or roughly 7.9% market share. Whilst three countries dominate world peach imports, it is interesting to note that countries like Mozambique, together with the Zimbabwe and Zambia have experienced higher annual growth rate in terms of peach imports from 2010 – 2014. Mozambique experienced an annual growth rate of 127%. Second was with 20% annual growth rate followed by Lesotho at 18%. It is important to note that growth by all these mentioned countries has been off a relatively low base. These countries represent possible lucrative markets for South African peach producers. It is also important to note that peach imports from the world to countries such as the Swaziland and Namibia have declined from 2010 – 2014 and as a result those countries have recorded a negative growth rate in peach imports.
33
Figure 26: South African peaches prospect for market diversification in 2014
Source: TradeMap, ITC

34
4.2 South Africa vs. southern hemisphere production in 2014 Figure 27 presents southern hemisphere production of peaches and nectarines. The six major producers of peaches in the southern hemisphere produced approximately 1.15 million tons of peaches during 2013. It is clear that South Africa was the fourth largest producer of peaches (15.10% in 2013) in the southern hemisphere after Chile (32.02%), Argentina (25.25%) and Brazil (18.86%). All these countries are vying for the lucrative North American and European markets. The fact that a country can produce a large output does not necessarily mean it will be a big net exporter – this depends on the size of the domestic market and whether excess produce is harvested. In the case of Chile, the largest producer of peaches in the southern hemisphere in 2013, their domestic market is so large that the country exports relatively little. Chile contributed 0.33% to the total southern hemisphere peach exports in 2013 (see Table 13). In the case of Brazil, the third largest producer of peaches in the southern hemisphere, their domestic market is so large that the country exports relatively nothing. Brazil contributed 0% to the total southern hemisphere peach exports in 2013.
Source: FAOSTAT
4.3 South Africa vs. southern hemisphere exports in 2014 Table 13 presents southern hemisphere export of peaches during 2014. South Africa‟s main competitor from the southern hemisphere in the EU market for peaches during the previous years was Chile. Brazil, which is the third producer of peaches in southern hemisphere, exported 0.026% of the total southern hemisphere peach exports. Chile was the largest exporter of peaches in the southern hemisphere during
2004 2005 2006 2007 2008 2009 2010 2011 2012 2013
Argentina 272442 272500 260000 270000 308731 300000 318000 284970 290000 291804
Australia 99489 130171 139570 130916 128000 117188 113700 97547 100462 92283
Brazil 235720 235471 199719 185959 239149 216236 222402 222180 232987 217706
Chile 311000 311000 345000 370000 372000 388000 357000 319919 325000 369786
New Zealand 9261 8602 8700 8200 8100 8000 7764 8000 8100 8126
South Africa 183652 172631 166955 170005 182784 159444 164231 156819 175665 174230
0
50000
100000
150000
200000
250000
300000
350000
400000
450000
Vo
lum
e in
To
ns
Years
Figure 27: Southern hemisphere production of peaches and nectarines, 2004 - 2013

35
2014, contributing 57.9% to total southern hemisphere exports in 2014. More than 43% peach exports from Chile are destined to the USA and Mexico. It was closely followed by South Africa and Australia with 23.17% and 10.24% respectively during the same year. Argentina exports primarily within the South American markets (particularly Brazil and Paraguay). Australia primarily exports to the Far East markets (particularly Hong Kong, Taiwan and Singapore). New Zealand produces primarily for local markets and exports very little. All these countries with the exception of Chile pose no serious threat to South Africa in the European markets. Table 13: Southern hemisphere exports of peaches, 2014
Country Export - Quantity in Metric Tons (MT)
Contribution to Southern Hemisphere Exports (%)
World exports 2 044 362
Southern Hemisphere
83 297 100.00
Chile 48 274 57.95
Peru 3 666 4.40
Argentina 3 209 3.85
Australia 8 536 10.24
South Africa 19 305 23.17
New Zealand 108 0.12 Source: Trade Map, ITC
5. MARKET ACCESS Barriers to trade can be divided into tariff barriers (including quotas, ad valorem tariffs, specific tariffs and entry price systems) and non tariff barriers (sanitary and phyto-sanitary measures, labels, etc). The main markets for fruit (including peaches and nectarines) employ various measures, both tariff and non tariff to protect the domestic industries. Whilst many of the non tariff measures can be justified under the auspices of issues such as health and standards, the tariff measures are increasingly under the scrutiny of the World Trade Organization (WTO), and as such are gradually being phased out. Nevertheless, exporters need to be aware of all the barriers that they may encounter when trying to get their produce onto foreign shelves. 5.1 Tariffs, quotas and the price entry system Tariffs are either designed to earn government revenue from products being imported or to raise the price of imports so as to render local produce more competitive and protect domestic industries. Quotas can be used to protect domestic industries from excessive imports originating from areas with some form of competitive advantage (which can therefore produce lower cost produce). Tariffs and quotas are often combined, allowing the imports to enter at a certain tariff rate up to a specified quantity. Thereafter, imports from that particular region will attract higher tariffs, or will not be allowed at all. This phenomenon is referred to as tariff-rate quotas (TRQs). The entry price system, which is used in many northern hemisphere markets, makes use of multiple tariff rates during different periods when domestic producers are trying to sell their produce, and lower the tariffs
36
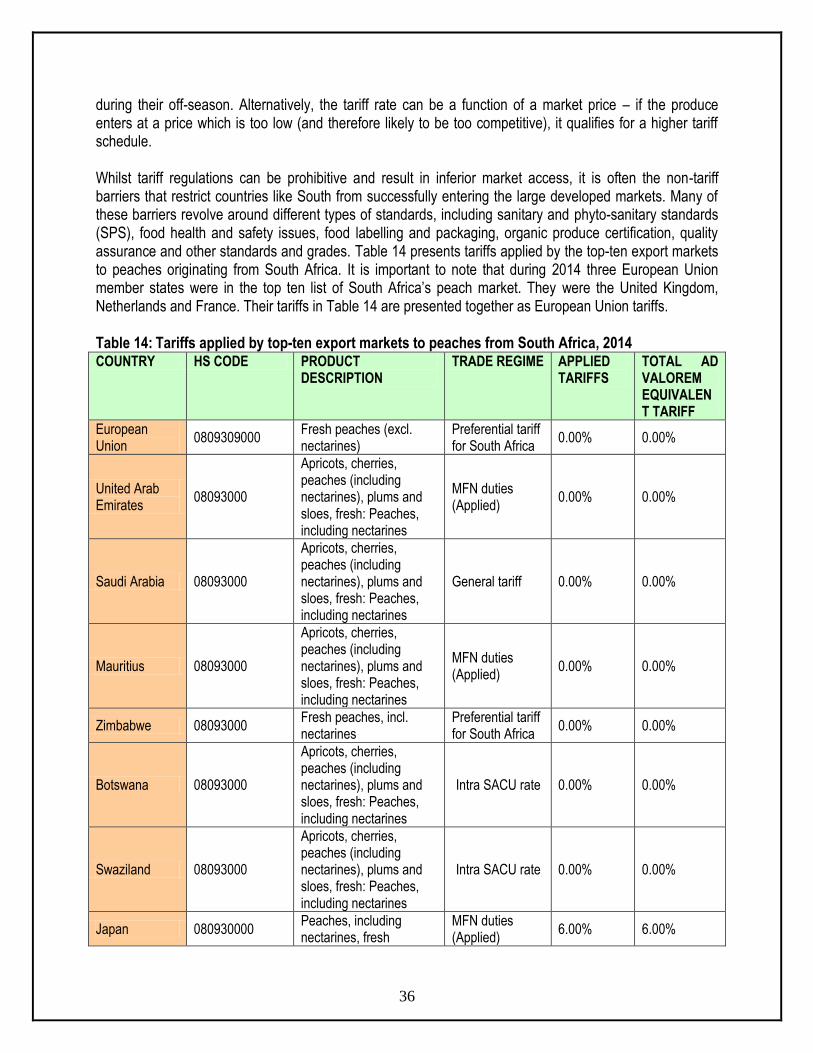
during their off-season. Alternatively, the tariff rate can be a function of a market price – if the produce enters at a price which is too low (and therefore likely to be too competitive), it qualifies for a higher tariff schedule. Whilst tariff regulations can be prohibitive and result in inferior market access, it is often the non-tariff barriers that restrict countries like South from successfully entering the large developed markets. Many of these barriers revolve around different types of standards, including sanitary and phyto-sanitary standards (SPS), food health and safety issues, food labelling and packaging, organic produce certification, quality assurance and other standards and grades. Table 14 presents tariffs applied by the top-ten export markets to peaches originating from South Africa. It is important to note that during 2014 three European Union member states were in the top ten list of South Africa‟s peach market. They were the United Kingdom, Netherlands and France. Their tariffs in Table 14 are presented together as European Union tariffs. Table 14: Tariffs applied by top-ten export markets to peaches from South Africa, 2014 COUNTRY HS CODE PRODUCT
DESCRIPTION TRADE REGIME APPLIED
TARIFFS TOTAL AD VALOREM EQUIVALENT TARIFF
European Union
0809309000 Fresh peaches (excl. nectarines)
Preferential tariff for South Africa
0.00% 0.00%
United Arab Emirates
08093000
Apricots, cherries, peaches (including nectarines), plums and sloes, fresh: Peaches, including nectarines
MFN duties (Applied)
0.00% 0.00%
Saudi Arabia 08093000
Apricots, cherries, peaches (including nectarines), plums and sloes, fresh: Peaches, including nectarines
General tariff 0.00% 0.00%
Mauritius 08093000
Apricots, cherries, peaches (including nectarines), plums and sloes, fresh: Peaches, including nectarines
MFN duties (Applied)
0.00% 0.00%
Zimbabwe 08093000 Fresh peaches, incl. nectarines
Preferential tariff for South Africa
0.00% 0.00%
Botswana 08093000
Apricots, cherries, peaches (including nectarines), plums and sloes, fresh: Peaches, including nectarines
Intra SACU rate 0.00% 0.00%
Swaziland 08093000
Apricots, cherries, peaches (including nectarines), plums and sloes, fresh: Peaches, including nectarines
Intra SACU rate 0.00% 0.00%
Japan 080930000 Peaches, including nectarines, fresh
MFN duties (Applied)
6.00% 6.00%

37
COUNTRY HS CODE PRODUCT DESCRIPTION
TRADE REGIME APPLIED TARIFFS
TOTAL AD VALOREM EQUIVALENT TARIFF
Singapore 08093000 PEACHES INCL NECTARINES FRESH (TNE)
MFN duties (Applied)
0.00% 0.00%
Angola 08093000 Pêssegos, incl. as nectarinas, frescos
MFN duties (Applied)
50.00% 50.00%
Hong Kong 08093000
Apricots, cherries, peaches (including nectarines), plums and sloes, fresh: Peaches, including nectarines
MFN duties (Applied)
0.00% 0.00%
Source: Market Access Map, ITC
South Africa had a preferential trading agreement (PTA) with the European Union (EU) known at the Trade, Development and Cooperation Agreement (TDCA). The TDCA provided for the progressive introduction of a Free Trade Area (FTA). The EU is South Africa‟s main trading and investment partner. The FTA aimed to ensure better access to the Community market for South Africa and access to the South African market for the EU. The agreement covered around 90% of bilateral trade between the two parties and provided for the liberalisation of 95% of the EU‟s imports from South Africa within ten years and 86% of South Africa‟s imports from the EU in twelve years. In order to protect the vulnerable sectors of both parties, certain products were excluded from the FTA and others have been partially liberalised. For the EU, these are mainly agricultural products, while for South Africa, they are industrial products. The EU concluded negotiations on an Economic Partnership Agreement (EPA) in July 2014 with the SADC EPA Group comprising Botswana, Lesotho, Mozambique, Namibia, South Africa and Swaziland which broadened the scope of product coverage under TDCA agreement. In the meantime, tariffs that existed before the lapsing of the agreement are still applicable until the SADC/EPA agreement comes into effect. As can be seen in Table 13, South African peaches had preferential access into the EU market through the TDCA. The United Arab Emirates, Saudi Arabia, Mauritius, Kuwait, Singapore, and Hong Kong impose a 0% tariff for peaches originating from South Africa. South African peaches face the highest tariff in Angola and Zimbabwe. Angola also imposes a 50% tariff on peaches originating from South Africa. In reality, the tariffs are likely to be far lower for South Africa when considering the preferential agreements, but at the same time, most tariff structures are particularly complex, with quotas, seasonal tariffs and specific tariffs (an amount per unit rather than a percentage of value) all contributing to many different tariff lines and often higher duties payable than one might have anticipated initially. One must also bear in mind that most tariffs are designated to protect domestic industries, and as such are likely to discriminate against those attempting to compete with the domestic producers of that country. 5.2 European Union (EU) The EU has seasonal tariff structures which are highest during the European peak harvesting seasons (the price entry system), quotas and specific tariffs, and various policies that allow, amongst other things, government organizations to purchase produce should supply rise too quickly (and thereby maintain prices), and then release this excess back onto the market as and when supply drops again. The immediate implication of these policies for South Africa is that an opportunity exists to supply peaches to
38
the European market in the off season periods, as the produce will not compete directly with the European producers and thus would not be liable to a whole array of tariffs and other protective mechanisms. There are other non-tariff barriers, including the phyto-sanitary and food health regulations laid down by the EU legislation, marketing standards and certificates of conformity, and the ever changing demand patterns of the EU consumers. 5.2.1 Tariff barriers The EU applies a system known as entry price system. With this system, the EU establishes an „entry price‟ at which produce may enter the EU market, which is not only based on the market price for the current year (demand and supply) and for previous years, but also on the prices of the domestic producers (prices they need to maintain profitability). It is calculated by the regulatory authorities so that it can be used in combination with tariffs and quotas to aid EU‟s attempts at protecting its agricultural system. The entry price is the minimum price at which produce may enter the market. If the price of the produce is lower than its calculated price, it is liable to have duties imposed upon it over and above any duties/quotas it might originally attract. Agricultural duties are applied as follows:
When the value of the imported party is between 92% and 94% of the entry price, 8% of the entry price will be added to the normal customs duty.
When the value of the imported party is between 94% and 96% of the entry price, 6% of the entry price will be added to the normal customs duty.
When the value of the imported party is between 96% and 98% of the entry price, 4% of the entry price will be added to the normal customs duty.
When the value of the imported party is between 98% and 100% of the entry price, 2% of the entry price will be added to the normal customs duty.
There are tariffs applicable over and above the entry price tariffs, depending on the produce, where it originates from and whether that country has any preferential trading agreements with the EU. 5.2.2 Non tariff barriers Non tariff barriers can be divided into those that are mandatory and laid out in the EU Commission‟s legislature and those that are a result of consumers, retailers, importers and other distributors‟ preferences. 5.2.2.1 Legal requirements i) Product legislation: quality and marketing There are number of pieces of EU legislation that govern the quality of produce that may be imported, marketed and sold within the EU. They are as follows: General Food Law which covers matters in procedures of food safety and hygiene (micro-biological and chemical), including provisions on the traceability of food (for example, Hazard Analysis and Critical Points, or HACCP), and it is laid out under regulation EC 178/2002.

39
EU Marketing Standards which govern the quality and labelling of fruit are laid out in the Common Agricultural Policy (CAP) framework under regulation EC 2200/96. These regulations include diameter, weight and class specifications, and any produce that does not comply with these standards will not be sold on the EU markets. Certificate of Conformity must be obtained by anyone wishing to export and sell fruits in the EU, if that fruit falls under the jurisdiction of the EU marketing standards. Certificate of Industrial Use must be obtained if the fruit is to be used in further processing. Maximum Residue Limits (MRL) of various pesticides allowed. ii) Product legislation: phyto-sanitary regulations The international standard for phyto-sanitary measures was set up by the International Plant Protection Committee (IPPC) to protect against spreading of diseases or insects through the importation of certain agricultural goods. The EU has its own particular rules formalized under EC 2002/89, which attempts to prevent contact of EU of crops with harmful organisms from elsewhere in the world. The crux of the directive is that it authorizes the Plant Protection Services to inspect large number of fruit products upon arrival in the EU This inspection consist of physical examination of a consignment deemed to have a level of phyto-sanitary risk, identification of any harmful organisms and certification of the validity of any phyto-sanitary certificate covering the consignment. If the consignment does not comply with the requirements, it may not enter the EU although certain organisms can be fumigated at the expense of the exporter. iii) Product legislation: packaging The EU Commission lays down rules for materials that come into contact with food and which may endanger people‟s health or bring about an unacceptable change in the composition of the foodstuffs. The framework legislation for this is EC 1935/2004. Recycling packaging materials are also emphasized under 94/62/EC, whereby member states are required to recycle between 50% and 65% of packaging waste. If exporters do not ship produce in packaging which is reusable, they may be liable for the costs incurred by the importing companies. Wood packaging is subject to phyto-sanitary controls and may need to undergo heat treatment, fumigation, etc. 5.2.2.2 Non-legal requirements To access the market, importers must not only comply with legal requirements set out above, but must also with market requirements and demands. For the most part, these revolve around quality and the perception of European consumers about environmental, social, health and safety aspects of both the products and the production techniques. Whilst supplying fruit that complies with these issues may not be mandatory in the legal sense, they are becoming increasingly important in Europe and cannot be ignored by existing or potential exporters. i) Social accountability is becoming important in the industry, not only amongst consumers, but also for retail outlets and wholesalers. The Social Accountability 8000 (SA 8000) certification is a management
40
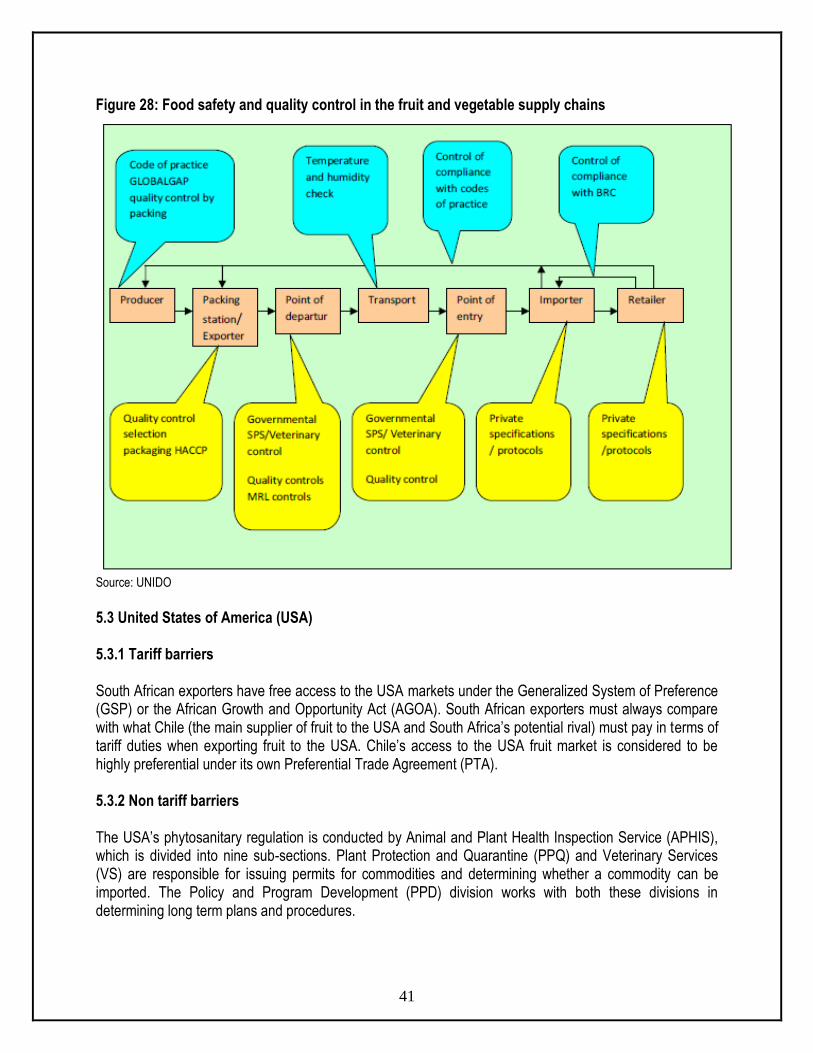
system based on International Labour Organization (ILO) conventions, and deals with issues such as child labour, health and safety, and freedom of association, and requires an on-site audit to be performed annually. The certificate is seen as necessary tool for accessing any European market successfully. ii) Environmental issues are becoming increasingly important with European consumers. Consumer movements are lobbying against purchasing non-environmentally friendly or non-sustainable produce. To this end, both governments and private partners have created standards (such as ISO 14001 and EUREGAP) and labels to ensure that produce adhere to particular specifications. Although eco-labels (for example, the EU Eco-label, the Netherlands Milieukeur, the German Blue Angel and the Scandinavian White Swan) are voluntary, they can afford an exporter a marketing edge, as consumers wishing to purchase environmentally sound produce demand products that are easily recognizable. Another important emerging label is Fairtrade, and includes those labels offered by Max Haavelaar Foundation, TransFair International and the FLO (Fairtrade Labelling Organization). Recently a „universal‟ logo was adopted based on international fair trade standards developed by FLO, which covers amongst other things, minimum quality and price, various processing requirements, compensation of small farmers that covers sustainable production and living standards, and contracts that allow for long term planning and development. 5.2.2.3 Consumer health and safety requirements Increasing consumer conscience about health and safety issues has prompted a number of safety initiatives in Europe, such as EUREPGAP on good agricultural practices (GAP) by the main European retailers, the international management system of HACCP, which is independently certified and required by legislation for European producers as well as food imported into Europe (EC 852/2004), and the ISO 9000 management standards system (for producers and working methods) which is certified by the International Standards Organization (ISO). The development of public and private standards involves interventions at multiple points along the value chain. An illustration of the multiple points and multiple standards that are applied for fresh fruit and vegetables and for fish is shown in Figure 28. There are controls by different agents carried out in different ways at different points along the value chain in response to the requirements of private sector companies, coalitions of private-sector standards setters and public agencies. Standards in agribusiness value chains operate, by definition, at multiple points. They are created, adopted, applied and verified by different actors (enterprises and institutions) at different points in the value chain.
41
Figure 28: Food safety and quality control in the fruit and vegetable supply chains
Source: UNIDO
5.3 United States of America (USA) 5.3.1 Tariff barriers South African exporters have free access to the USA markets under the Generalized System of Preference (GSP) or the African Growth and Opportunity Act (AGOA). South African exporters must always compare with what Chile (the main supplier of fruit to the USA and South Africa‟s potential rival) must pay in terms of tariff duties when exporting fruit to the USA. Chile‟s access to the USA fruit market is considered to be highly preferential under its own Preferential Trade Agreement (PTA). 5.3.2 Non tariff barriers The USA‟s phytosanitary regulation is conducted by Animal and Plant Health Inspection Service (APHIS), which is divided into nine sub-sections. Plant Protection and Quarantine (PPQ) and Veterinary Services (VS) are responsible for issuing permits for commodities and determining whether a commodity can be imported. The Policy and Program Development (PPD) division works with both these divisions in determining long term plans and procedures.

42
Some products can get pre-clearance from international Services (IS) personnel stationed in the country of origin, either at exporting terminals of site inspections. The PPQ‟s main focus is to prevent the spread of diseases and pests into the USA‟s agriculture resources, and it has personnel stationed at all airports, seaports and border stations that check imported cargo and oversee the quarantine process. Exporters or importers must make a request to export/import a commodity, provide as much information as possible on the product, its region of origin and its status that is whether there are restrictions or regulations governing that particular product from that particular region before a permit is issued, along with the conditions of importation (disinfestations treatment) or mitigation measures. Denials can be challenged and governments and companies can request a change in the status of a prohibited commodity (an investigation must be performed by the PPQ scientific team), as long as sufficient conditions have changed or a risk assessment has not been conducted within the last 10 years. Most approved commodities can enter with inspection alone, but some may have to undergo mitigating measures including post-harvest treatments (hot/cold temperature treatments, irradiation or fumigation, depending on the requirements and which particular treatment is least harmful). The establishment of specifically and maintained pest-free areas in a country (which obviously requires extensive co-operation between the country‟s plant health services and APHIS IS division) or systems approaches (field surveys, random inspections or various on site treatments. In addition to phyto-sanitary regulations, the USDA Food Safety Inspection Services (FSIS) regulates sanitary practices in the packing of food products, while the Food and Drug Administration (FDA), which is part of the US Department of Health, regulates packaging and labelling. The HACCP protocol is used extensively. The USDA quality standards for fruits and vegetables provide basis for domestic and international trade and promote efficiency in marketing and procurement. 5.4 Japan Japan‟s agricultural sector is heavily protected, with calculations from the Organization for Economic Co-operation and Development (OECD) estimating that almost 60% of the value of Japan‟s farm production comes from trade barriers or domestic subsidies. Japan uses tariff rate quotas (TRQ) to protect its most sensitive products, and reserves the right for trading many of these products (within the quota) for one or two state trading enterprises. However, these extremely protective measures apply only to some products; others are able to compete more effectively with outside competition, often on the grounds of higher quality. Perhaps the biggest barrier to trade with Japan in fruit markets is its strict phytosanitary requirements, which have often been challenged in the WTO as having little or no scientific justification. Other measures that are being challenged include Japan‟s use of fumigation on agricultural products when cosmopolitan pests (already found in Japan) are detected. Japan is also increasing its labelling requirements. It now requires fresh food, including fruit, to be labelled with the place of origin, whilst new technological („smart‟) labels that have embedded semi-conductors and information on just about everything are being adopted in various agricultural sectors. Food containing genetically modified organisms (GMOs) need to be assessed for environmental food safety by the MAFF or the Ministry of Health, Labour and Welfare (MHLW). At the same time, the MHLW tests food imports for maximum residue levels from pesticides and as of May 2006, any food with pesticides not on approved list, regardless of the residue levels, are not allowed entry.
43
Japanese organic definitions changed in 2001 (they roughly corresponded to world standard definitions), and any foreign producers wishing to enter the Japanese market must be certified under the Japanese standards (not general world standards). 5.5 China China has a massive system of government support for farmers and generally rural dwellers (who are lagging behind urban dwellers). To this end, most of the agricultural sectors are protected and promoted through a series of subsidies, tax cuts and infrastructure spending policies (as well as low cost loans, research, land use protection, market stabilization measures, etc). Part of the protection of its massive farming population, which for most part consists of small farmers not benefiting from economies of scale, necessarily occurs in the form of high tariffs and other restrictions. However China is obliged to reduce tariff levels as a condition of being a member of WTO. It therefore remains to be seen just what policies will be adopted going forward, but the general consensus is that it is a vitally important market to watch, and endeavour to enter. 6. DISTRIBUTION CHANNELS There are roughly three distinct sales channels for exporting fruits. One can sell directly to an importer with or without the assistance of an agent (usually larger, well established commercial operations). One can supply fruits combined, which will then contract out importers/marketers and try to take advantage of economies of scale and increased bargaining power. At the same time combined fruits might also supply large retail chains. One can also be a member of a private or cooperative export organization which will find agents or importers and market the produce collectively. Similar to combined fruits, an export organization can either supply wholesale market or retail chains, depending on particular circumstances. Export organizations will wash, sort and package the produce. They will also market the goods under their own name or on behalf of the member, which includes taking care of labelling, bar-coding, etc. Most of the time, export organizations will enter into collective agreements with freight forwarders, negotiating better prices and services (more regular transport, lower peak season prices, etc). Some countries have institutions that handle all the produce (membership compulsory) and sell only to a restricted number of selected importers. Agents will establish contacts between producers/export organizations and buyers in the importing country, and will usually take between 2% and 3% commission. In contrast, an importer will buy and sell his/her own capacity, assuming the full risk (unless on consignment). They will also be responsible for clearing the produce through customs, packaging and assuring label/quality compliance and distribution of the produce. Their margins lie between 5% and 10%. The contract importers of fruit combines market and distribute the product of the combines, clear it through customs and in some cases treat and package it. Only few exporters have long term contracts with wholesale grocers who deliver directly to retail shops, but with the increasing importance of standards (EurepGap, etc) and the year round availability of fruit, the planning of long term contractual relationship is expected to increase. 7. LOGISTICS

44
7.1 Mode of transport Fruits can be exported mainly through ocean cargo and air cargo. Ocean cargo takes much longer to reach the desired location but costs considerably less. The choice of transportation method depends, for most parts on the fragility of the produce and how long it can remain relatively fresh. With the advent of technology and container improvements, the feasibility, cost and attractiveness of sea transport have improved considerably. With the increased exports by South Africa, the number and the regularity of maritime routes have increased. These economies of scale could benefit South Africa if more producers were to become exporters and take advantage of the various ports which have special capabilities in handling fruit produce (for example Durban new fruit terminal). 7.2 Cold chain management Cold chain management is crucial when handling perishable products, from the initial packing houses to the refrigerated container trucks that transport the produce to the shipping terminals, through to the storage facilities at these terminals, onto actual shipping vessels and containers, and finally on to the importers and distributors that must clear the produce and transport it to the markets/retail outlets. For every 10 Degree Celsius increase above the recommended temperature, the rate of respiration and ripening of produce can increase twice or even thrice. Related to this are increasing important traceability standards which require an efficient controlled supply chain and internationally accepted business standards. 7.3 Packaging Packaging can also play an important role in ensuring safe and efficient transport of a product and conforming to handling requirements, uniformity recyclable material specifications, phytosanitary requirements, proper storage needs and even attractiveness for marketing purposes. The business panel of any carton (including printed carton labels) should comply with the requirements as established by the EU or any other regulations that are specified by a target market. Producers are advised to present their designs to the Perishable Products Export Control Board (PPECB) before they can order any cartons from a manufacturer. The following is normally required:
Class I or II
Fruit type
Carton depth
Country of Origin: “Produce of South Africa”
Complete address of exporter or producer
Name of variety
Content of carton: “14 x punnets or bags”
PUC or PHC code: Registered producer – or Pack House Code with DAFF
Date code
Food safety accreditation number: Global Gap, Nature‟s Choice registration number, etc. 8. ORGANIZATIONAL ANALYSIS 8.1 Producer and associated organizations
45
Grower participation and control of their interests in the industry are structured by means of fruit type producer associations (Section 21 companies), as illustrated in Figure 29. The industry consists of Hortgro Services as its mouthpiece. Hortgro Services is responsible for administrative services and financial administration, as well as operational industry services such as transformation and training, information, communication and social programmes. Hortgro Services comprises of its members, affiliated members and service entities. The members are the South African Apple and Pears Producers Association (SAAPPA), South African Stone Fruit Producers Association (SASPA), Dried Fruit Technical Services (DFTS), Protea Producers of South Africa (PPSA), South African Cherry Growers‟ Association (SACGA), and the South African Olive Industry Association. The affiliated members are Rooibos Tea Producers Association, Pomegranate Producers Association, Cape Flora, South African Honeybush Tea Association (SAHTA), South African Bee Industry Organisation, South African Berry Producers Association. The service entities are Fruitgro Science (DFPT Research), South African Plant Improvement Organisation (SAPO) Trust, Cultivar development Company (CULDEVCO), Sterile Insect Technique (SIT) Africa, Entomon Technologies and the SA Fruit Journal. Fruit South Africa, which was established recently, is another important organization. It is an umbrella organisation in the South African fruit industry. It is a non-profit organisation consisting of Citrus Growers‟ Association of Southern Africa (CGA) representing citrus growers; HORTGRO (representing pome and stone fruit); South African Table Grape Industry (SATI); SUBTROP (representing the avocado, litchi, mango and macadamia industries) and the Fresh Produce Exporters‟ Forum (FPEF).
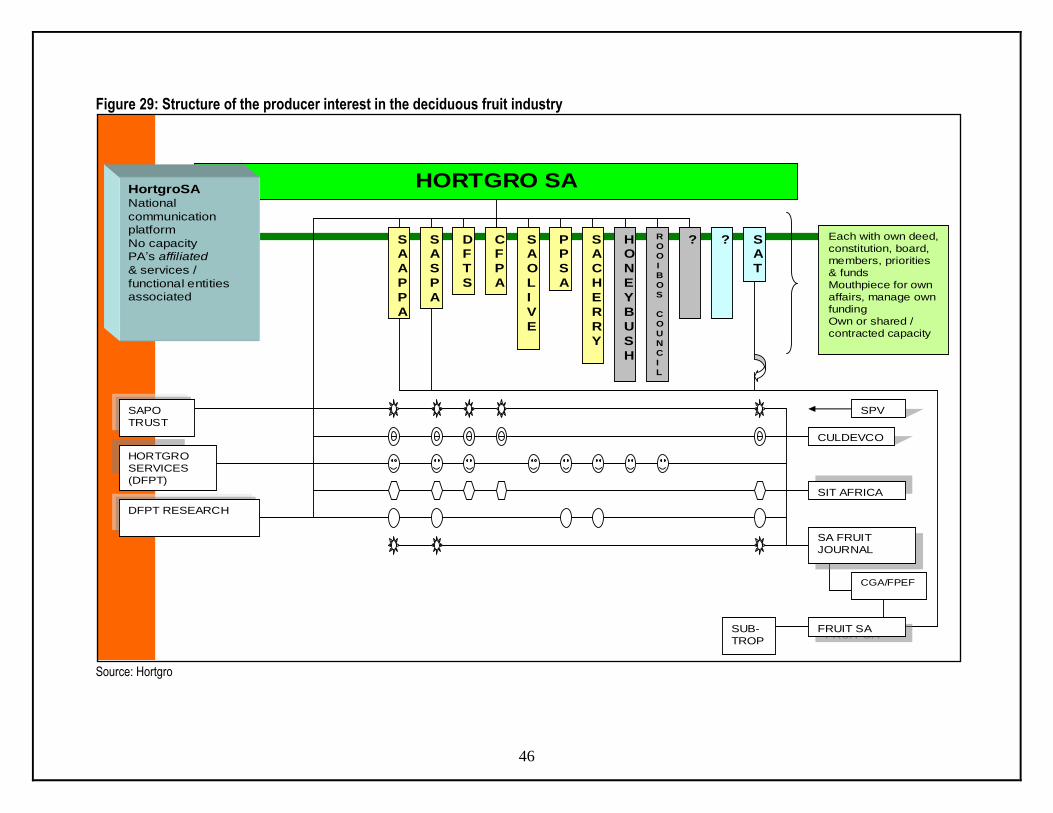
46
Figure 29: Structure of the producer interest in the deciduous fruit industry
Source: Hortgro
HORTGRO SA
SA
A
P
P
A
SA
S
P
A
HO
N
E
Y
B
U
S
H
R
O
O
I
B
O
S
C
O
U
N
C
I
L
? ? SA
T
SA
O
L
I
V
E
CF
P
A
PP
S
A
SA
C
H
E
R
R
Y
DF
T
S
Each with own deed,
constitution, board,
members, priorities
& funds
Mouthpiece for own
affairs, manage own
funding
Own or shared /
contracted capacity
HortgroSANational
communication
platform
No capacity
PA’s affiliated
& services /
functional entities
associated
SAPO
TRUST
HORTGRO
SERVICES
(DFPT)
DFPT RESEARCH
SA FRUIT
JOURNAL
SA FRUIT
JOURNAL
CULDEVCO
SIT AFRICASIT AFRICA
CGA/FPEF
SPV
FRUIT SAFRUIT SASUB-
TROP

47
The main association responsible for the peach industry is the South African Stone Fruit Producers‟ Association (SASPA). It is a Section 21 company and its objectives are as follows:
To promote the common interest and specific needs of the stone fruit producers in South Africa and to act as their official representative.
To rationalize and promote the production and marketing of stone fruits and stone fruit products.
To encourage and pursue constructive dialogue and mutual cooperation with government and other role players.
To foster mutual trust and long term relationships among role players and stakeholders.
To establish and promote a reciprocal information system to enable stakeholders to make informed market decisions.
8.2 Strengths, Weaknesses, Opportunities and Threat analysis Some of the strengths, weaknesses, threats and opportunities of the peach production sector in South Africa are presented in Table 15.

48
Table 15: Strengths, weaknesses, threats and opportunities for the South African peach industry Strengths
Weaknesses
The industry‟s export operations and leading players are well established.
An efficient export infrastructure exists and market access has been improved.
The South African fruit industry is known for excellent overall quality for fruit (strong reputation in major international markets).
Sound communication mechanisms to majority of industrial participants.
High level of investment in current technology within pack houses and cold chain facilities.
Industry has all traceability systems in place, as required by accreditation protocols.
Production is largely dependent on climatic conditions which can only be partially manipulated by man through irrigation.
Deteriorating research infrastructure and capacity may limit new technology development in the future.
Saturation of traditional export markets.
Reliance on the UK and EU as main export market.
Relatively high input and capital costs.
An element of fragmentation in the industry.
Lengthy supply chain beyond the pack house.
Lack of industry control on efficiency and productivity in supply chain beyond farm gate and pack house door.
Poor skills and knowledge of the new entrants.
Delays due to degradation of the supporting infrastructure within the supply chain (handling facilities at ports, roads and energy supply).
Threats
Opportunities
Increased competition from the Southern Hemisphere counterparts like Chile, Brazil, Argentina and Australia.
Oversupply of fruit into established export markets.
Availability and cost of irrigation water.
Impact of climate change especially in the Western Cape.
Inflation rate with regard to cost of labour and farming and also packing prerequisites.
Currency variability.
Market access initiatives to the Middle East, Asia (India, Indonesia) and China.
Increasing demand for fresh apples in Africa.
Potential for increased local market consumption.
8.3 Strategic challenges 8.3.1 Labour markets The critical need for labour at harvest time offers seasonal work to unemployed persons in the immediate vicinity of plantations. In most countries, workers migrate from one region to another as the harvest season progresses from early to late. However, in the local scenario, labourers lack mobility as well as skills to find work outside crop harvesting.

49
A major challenge in terms of labour is the lack of skilled labour. At the same time, farm wage levels do not attract skilled or qualified people to undertake menial and hard work. Smaller producers, who pay comparatively lower wages, are more exposed than the larger producers to the threat of labour shortages. 8.3.2 Infrastructure Some of the infrastructural challenges are as follows:
Lack of storage capacity at certain times of the year, when stone fruit and other fruits are being harvested (mid January until end of February).
Hygiene and micro-bacterial quality of water available for use in pack houses and domestic purposes on farms.
Poor or no communication between the agricultural sector and service providers in terms of planning and future expansion on issues such as energy and transport.
Transport from the pack house to the market – road, ship or rail.
Logistical systems which are not applied at full efficiency.
Inefficient handling operations at South African ports, giving rise to costly delays and breaks in the cold chain.
8.3.3 Other challenges Producers are being confronted with more regulations to control the production from farm to fork. These include regulating soil, air, water, chemical, labelling and safety. On the retailing side pressure mounts to introduce measures for increased traceability of products. The consumer wants a safe product produced with socially acceptable and environmentally friendly production methods. Combined with this many consumers are up in arms about GMO‟s and the USA government is introducing a bio terrorism act that will put even more pressure on exporters to the USA. Competition for scarce natural resources (land and water) is putting continued pressure on good farmland that can otherwise be used for agricultural purposes. There is a threat of climate change particularly in the Western Cape Province. Production of apples and other fruits could be adversely affected by the warming of the winter season due to rising average temperatures and subsequent loss in chilling hours. Lack of winter chilling gives rise to delayed foliation and the problem of small fruit of poor quality. Increased average maximum temperatures in January and February may result in poor colour development. The risk of sunburn is also increased. 8.4 Opportunities The promotion of the consumption of peaches and other fruits should be implemented. Per capita consumption of peaches at 4kg, in comparison to Asia‟s 13.25kg and the EU‟s 17.6kg highlights the scope for possible increase in sales in the local market. 8.5 Empowerment issues and transformation in the sector

50
According to Hortgro Services, transformation in the deciduous fruit industry has four focus areas. These are economic development, the Deciduous Fruit Development Chamber (DFDC), networking and agri-villages. With regards to economic development, Hortgro Services serves as an implementation agent of CASP grants for the Western Cape Department of Agriculture. This provides an opportunity for Hortgro to provide matching funds for the implementation of targeted transformation projects in the province. The main focal point of economic development is the tree project. The tree project aims to increase production or footprint for Black Economic Empowerment (BEE) farmers. To overcome transformation challenges and encourage it, the Deciduous Fruit Development Chamber (DFDC) was established as a national support structure for emerging deciduous fruit farmers. The DFDC provides space for incubator interactions that guide the business and technical assistance to emerging fruit farmers. The DFDC aims to fulfil a dynamic capacity building and advocacy role and to exert pressure in order to mobilise resources from various quarters, including government and the donor community. Networking entails the building of relationships and networks in order to enhance the procurement of funds and other resources to help with the transformation process. This includes building working relations with all commercial banks and other DFIs and parastatals such as the Land Bank, Industrial Development Corporation (IDC), the Agricultural Research Council (ARC), and other industry stakeholders. Agri-villages focus specifically on the provision of housing for farm workers and their families. Hortgro Services has committed itself to participating in organised agricultural initiatives to explore the following options as possible solutions to farm worker housing:
On-farm housing without ownership rights.
Off-farm housing without ownership, e.g. renting.
Off-farm housing with ownership. 9. PEACH SUPPLY VALUE CHAIN The supply value chain is a complex linkage of various production and operational role-players (see Figure 30). Key stakeholders include input suppliers, producers, producer organisations, organised labour, NOGs, financial institutions, government, exporters and other traders. The following discussion focuses on the main segments of the plum value chain.

51
Figure 30: The deciduous fruit and table grape supply value chain
Source: OABS

52
9.1 Suppliers of inputs and farming requisites
Fruit farming is a large user of specialised inputs and sophisticated agricultural chemicals. Input suppliers ensure that all inputs needed by farmers for successful production, including farm equipment, pesticides, insecticides and others, are always available at reasonable prices so as to ensure a competitive fruit industry in South Africa. 9.2 Producers The core business of producers is to produce a high quality crop within “Good Agricultural Practice” protocols. Consistency, reliability of supply and producing varieties as demanded by the markets at affordable prices are also important facets of the producer‟s responsibility and business activities. 9.3 Fresh produce markets FPMs are the dominant player and form of wholesaling in the South African peach and fresh fruit and vegetable (FFV) sector. However other wholesale forms do exist including independent wholesalers, contract buyers, supermarkets, wholesaling subsidiaries, as well as farmer sales direct to retailers and to consumers. Being the largest wholesalers, the FPMs have emerged as the FFV price-setters or, as nicknamed, the “fresh produce stock exchange”. The prices at the FPMs are arrived at through a bargaining process mediated by market agents who have a dual objective to collect the best prices (and hence commission) for sales while ensuring that the highly perishable stocks are cleared. These prices are then used as reference prices even in private transactions outside the FPMs. 9.4 Retailers South African peach retailers exist in both the formal and informal sectors. In the former this includes formally registered retail chains, supermarkets and neighbourhood stores. The latter covers tuck shops (sphaza), and hawkers. In this environments peaches sales are at predetermined prices and are typically individually or in small packages. 9.5 Processors As explained earlier, the processing of peaches consists of canning, drying and juice manufacturing There is also a set of further processors not captured in the group above. These entities use peaches (and peach products) in food preparations. This includes caterers, hospitality and other institutions such as corporates, government institutions like hospitals, prisons, etc. 9.6 Cold storage operators and transporters Cold storage operators are responsible for receiving, handling, cooling the peaches to the required temperature and for ensuring that the correct fruit is loaded out according to the exporter‟s specifications into a truck or container that has been approved or registered by Perishable Produce Export Control Board (PPECB). A flat bed truck or other non-approved vehicle may be used in journeys shorter than two hours in total.
53
Transporters perform a key link in the fresh fruit supply chain by facilitating the physical transfer of the products between parties such as the producer, cold store and terminal operator. Transporters are responsible for maintaining the cold chain during transit. 9.7 Exporters The core business of exporters is to market and sell the fruit of primary producers at the best market price that they are able to negotiate. In order to realize this, the exporter needs to communicate with many of the role players in the logistics chain (cold stores, transporters, shipping lines, port terminals, clearing and forwarding agents, PPECB, regional producers associations and special market inspectors, etc). It is the exporters‟ responsibility to manage the cold chain, handle the fruit in an acceptable manner and, they are accountable for the quality of fruit that reaches the destination market. The main organisation that handles the export of fruits in South Africa is the Fresh Produce Exporters‟ Forum (FPEF). The FPEF was registered in 1998 as a non-profit organisation and its membership is voluntary and open to all companies that export fresh fruit from South Africa. The FPEF‟s mission is to create, within free market principles and a deregulated environment, a prosperous but disciplined fruit export sector. It was established mainly to provide leadership and services to its members and the international buying community. The forum sees itself as the international community‟s gateway to providing South Africa‟s finest quality produce from highly reputable South African exporters. 9.8 PPECB In terms of the PPECB Act (Act 9 of 1983) the PPECB is responsible for the “control of perishable products intended for export from the Republic of South Africa”. This mainly involves the control of the cold chain (including the shipping process). PPECB also acts as a government “assignee” in terms of the APS (Agricultural Products Standards) Act (Act 119 of 1990) and is responsible for the “control over sale and export of agricultural and related products”. PPECB controls (and certifies) that the quality standards of these products are met. The National Department of Agriculture, Forestry and Fisheries (DAFF) issues the phytosanitary certificates. All PPECB and other inspection regulations, protocols or requirements must be met and adhered to. The Information and Communication Procedure (ICP) must therefore be seen in conjunction with the PPECB Act and its regulations, the APS Act, as well as those temperature and other specialized handling protocols and procedures as established by PPECB in conjunction with the industry. As more emphasis is placed on food safety and customers are demanding higher standards of quality, PPECB and other inspection bodies play an increasingly important role in the export of fresh produce from South Africa. PPECB may make the following information available to exporters and producers on request:
Packed volumes Inspected and approved for export Inspected and rejected for export
Product quality Reasons for rejection
Shipped volumes
54
This information is available on a product and destination region level
Cold chain information Vessel carrying instructions (temperature letter, vessel temperature log, statements of
facts, deviations, etc. The information outlined above is available in varying degrees of detail. 9.9 Terminal and port operators Terminal operators must inform exporters, PPECB and other relevant parties in the supply chain such as transporters, producer associations, producers and cold stores about port related delays such as labour strikes, wind delays, plug-in congestion and other traffic congestion in the port that will impact on the flow of fresh produce into and out of the harbour. The South African Port Operations (SAPO) container terminal reports to shipping lines. 10. ACKNOWLEDGEMENTS The following industries/organizations are acknowledged. 10.1 Deciduous Fruit Producers Trust (DFPT)/ Fruitgro Science/ Hortgro Services P. O. Box 163 Paarl 7622 Tel: (021) 870 2900 Fax: (021)870 2915 www.hortgro.co.za 10.2 National Department of Agriculture, Forestry and Fisheries Directorate: Statistics and Economic Analysis Private X 246 Pretoria 0001 Tel (012) 319 84 54 Fax (012) 319 8031 www.daff.za 10.3 Optimal Agricultural Business Systems (OABS) P. O. Box 163 Paarl 7622 Tel: (021) 890 2953 Fax: (021) 890 2915 www.oabs.co.za 10.4 Trade and Industrial Policy Strategies (TIPS) P. O. Box 11214 Hatfield

55
0028 Tel (012) 431 7900 Fax (012) 431 7910 www.tips.org.za 10.5 National Agricultural Marketing Council (NAMC) Private Bag X 935 Pretoria 0001 Tel (012) 341 1115 Fax: (086) 626 4769 www.namc.co.za 10.6 International Trade Centre www.trademap.org/www.macmap.org 10.7 Food and Agriculture Organisation www.faostat.fao.org Disclaimer: This document and its contents have been compiled by the Department of Agriculture, Forestry and Fisheries for the purpose of detailing the peach industry. Anyone who uses this information does so at his/her own risk. The views expressed in this document are those of the Department of Agriculture, Forestry and Fisheries with regard to agricultural industry, unless otherwise stated. The Department of Agriculture, Forestry and Fisheries therefore, accepts no liability that can be incurred resulting from the use of this information.