a profile of the south african maize market value …
TRANSCRIPT
A PROFILE OF THE SOUTH AFRICAN MAIZE MARKET VALUE CHAIN
2019
Directorate Marketing Tel: 012 319 8456 Private Bag X 15 Fax: 012 319 8131 Arcadia E-mail:[email protected] 0007 www.daff.gov.za
TABLE OF CONTENTS
1. DESCRIPTION OF THE INDUSTRY................................................................................ 1
1.1. Production areas ............................................................................................................2
1.2. Production trends ..........................................................................................................3 2 MARKET STRUCTURE .................................................................................................. 4
2.1. Domestic Market ............................................................................................................4 2.2. Exports .............................................................................................................................7 2.3. Share Analysis .............................................................................................................. 19
2.4. Imports ........................................................................................................................... 25 2.5. Market Value chain ........................................................................................................ 29
2.5.1. Seed suppliers as inputs ................................................................................. 30 2.5.2. Handling and Storage ..................................................................................... 30 2.5.3. Maize milling .................................................................................................. 31
2.5.4. The animal feed industry ................................................................................. 31 2.5.5. Traders ......................................................................................................... 32
2.5.6. Retailing ........................................................................................................ 32
2.5.7. Transport....................................................................................................... 32
2.6 Maize Value Chain Tree ................................................................................................ 33 3. MARKET INTELLIGENCE ............................................................................................ 35
3.1. Tariffs ............................................................................................................................. 35 3.2. Performance of the South African maize industry in 2015 ........................................ 37
4. ORGANIZATIONAL ANALYSIS ..................................................................................... 44
4.1. Strengths and Weaknesses .......................................................................................... 44 4.2. Strategic challenges and Opportunities ...................................................................... 44
5. EMPOWERMENT AND TRANSFORMATION ISSUES ................................................... 45
6. GRAIN TRADERS IN SOUTH AFRICA .......................................................................... 46
6.1. International Traders..................................................................................................... 46 6.2. Local Traders ................................................................................................................. 46
7. ACKNOWLEDGEMENTS ............................................................................................. 48

1
1. DESCRIPTION OF THE INDUSTRY Maize is the most important grain crop in South Africa, being both the major feed grain and the staple food for the majority of the South African population. About 60% of maize produced in South Africa is white and the other 40% is yellow maize. Yellow maize is mostly used for animal feed production while white maize is primarily produced for human consumption. Maize is the second largest produced crop in South Africa after sugar cane. The maize industry is important to the economy both as an employer and earner of foreign currency because of its multiplier effects. This is because maize also serves as a raw material for manufactured products such as paper, paint, textiles, medicine and food. The industry is divided into commercial and developing agriculture. Commercial maize farmers are estimated at 9,000 and the number of developing agricultural farmers is unknown. The gross value of maize production is dependent on the quantity produced and prices received by producers. The trend in the maize production gross value follows the pattern of prices and production since the industry is characterized by volatile prices as shown in figure 1. The period under analysis opened with moderate gross value of maize production in 2008/09 production season and this was followed by a decrease in gross value during 2009/10 season. Even though maize producer prices begin at a moderate level during 2008/09 season, the contribution to gross value followed similar trends as result of a moderate production volumes attained during that period.
Source: Statistics and Economic Analysis
The contribution of the maize industry to the gross value of South African agricultural production (GVP) was moderate at the beginning of the season during 2008/09 production year. However, the GVP later experienced a substantial decrease to a level below 15 billion Rands during the 2009/10 production season. This was mainly due to a decline in the average producer prices for maize which fell to the lowest levels during the same period. However, the contribution of maize industry to the GVP increased sharply during 2010/2011 season due to increased producer prices, despite a slight
5 000 000
10 000 000
15 000 000
20 000 000
25 000 000
30 000 000
35 000 000
2008/09 2009/10 2010/11 2011/12 2012/13 2013/14 2014/15 2015/16 2016/17 2017/18
Gro
ss V
alu
e (R
'000
)
Production Years
Figure 1: Gross value of maize production
2
decrease in production volumes. This was followed by a continuous increasing trend of the gross value of maize production until the year 2013/14. The figure further indicates that the gross value of maize production slightly decreased during 2014/15 and later increased until the highest values were attained during 2016/17. This may be explained by dramatic increases in production volumes and prices during that particular period. The period under review closed with declining gross value of agricultural production during the 2017/18 marketing season.
1.1. Production areas
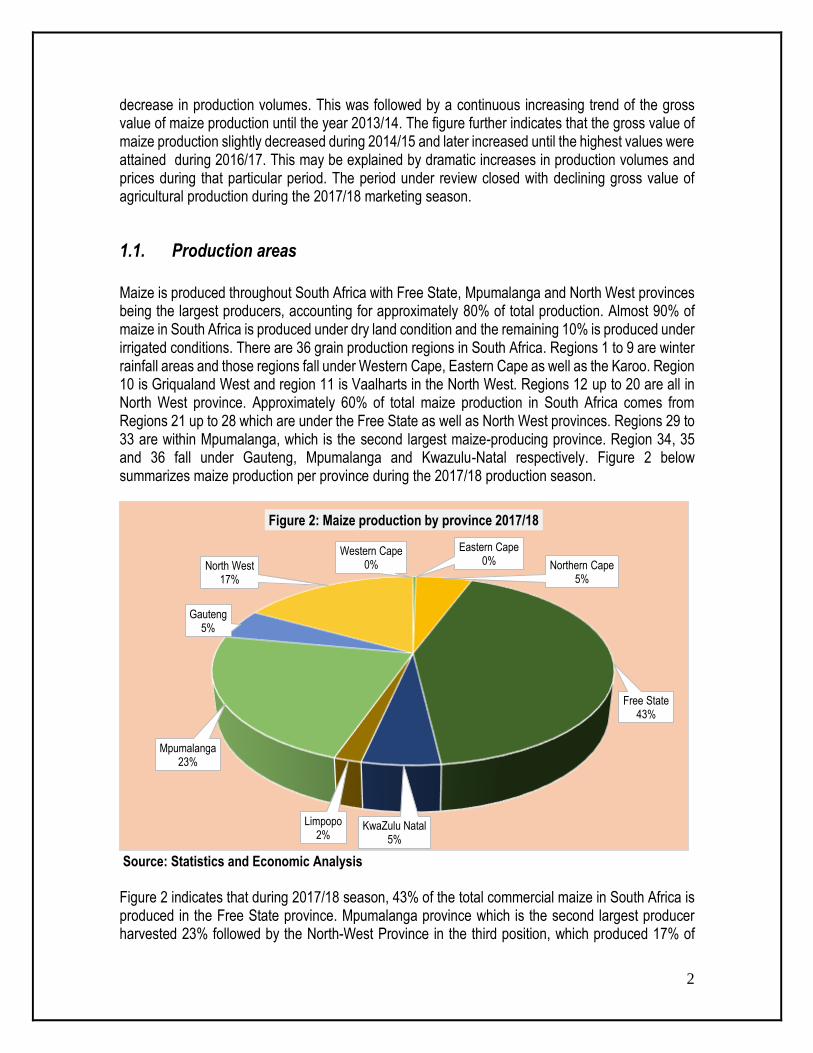
Maize is produced throughout South Africa with Free State, Mpumalanga and North West provinces being the largest producers, accounting for approximately 80% of total production. Almost 90% of maize in South Africa is produced under dry land condition and the remaining 10% is produced under irrigated conditions. There are 36 grain production regions in South Africa. Regions 1 to 9 are winter rainfall areas and those regions fall under Western Cape, Eastern Cape as well as the Karoo. Region 10 is Griqualand West and region 11 is Vaalharts in the North West. Regions 12 up to 20 are all in North West province. Approximately 60% of total maize production in South Africa comes from Regions 21 up to 28 which are under the Free State as well as North West provinces. Regions 29 to 33 are within Mpumalanga, which is the second largest maize-producing province. Region 34, 35 and 36 fall under Gauteng, Mpumalanga and Kwazulu-Natal respectively. Figure 2 below summarizes maize production per province during the 2017/18 production season.
Source: Statistics and Economic Analysis Figure 2 indicates that during 2017/18 season, 43% of the total commercial maize in South Africa is produced in the Free State province. Mpumalanga province which is the second largest producer harvested 23% followed by the North-West Province in the third position, which produced 17% of
Western Cape0%
Eastern Cape0% Northern Cape
5%
Free State43%
KwaZulu Natal5%
Limpopo2%
Mpumalanga23%
Gauteng5%
North West17%
Figure 2: Maize production by province 2017/18

3
total commercial maize production. Northern Cape, Gauteng and Kwazulu Natal Provinces produced 5% respectively, while the remaining provinces account for less than 3% of the country’s total maize production. Table 1: Maize production by provinces from 2012/13 to 2017/18 production season (Tons)
Season 2012/13 2013/14 2014/15 2015/16 2016/17 2017/18
PROVINCE
Western Cape 33 000 33 000 45 000 45 000 22 000 34 000
Eastern Cape 107 000 111 000 70 000 76 000 97 000 0
Northern Cape 601 000 664 000 712 000 710 000 712 000 668 000
Free State 5334 000 6247 000 2264 000 2214 000 7362 000 5 275 000
KwaZulu-Natal 519 000 559 000 454 000 522 000 740 000 660 000
Limpopo 300 000 307 000 248 000 310 000 492 000 232 000
Mpumalanga 2666 000 2783 000 2108 000 2319 000 3431 000 2 817 000
Gauteng 617 000 648 000 441 000 442 000 804 000 632 000
North-West 2226 000 2898 000 914 000 1141 000 3160 000 2 099 000
Source Statistics and Economic Analys
During the past six years, the total production of maize has experienced substantial fluctuations in all maize producing provinces as indicated in Table 1 above. The Free State, North West and Mpumalanga provinces have consistently been the major producers of maize in the country. It is also clear that Western Cape, Eastern Cape and Limpopo Provinces produced low volumes of maize as compared to other provinces. The table further shows that the 2017/18 production season has shown a significant decrease in maize production by most provinces as compared to the previous season, except for the Western Cape Province which recorded an increase in production. This can be attributed to high carry-over stocks in the market which resulted in most maize farmers shifting to the production of other profitable crops such as oilseeds during 2017/18 marketing season.
1.2. Production trends
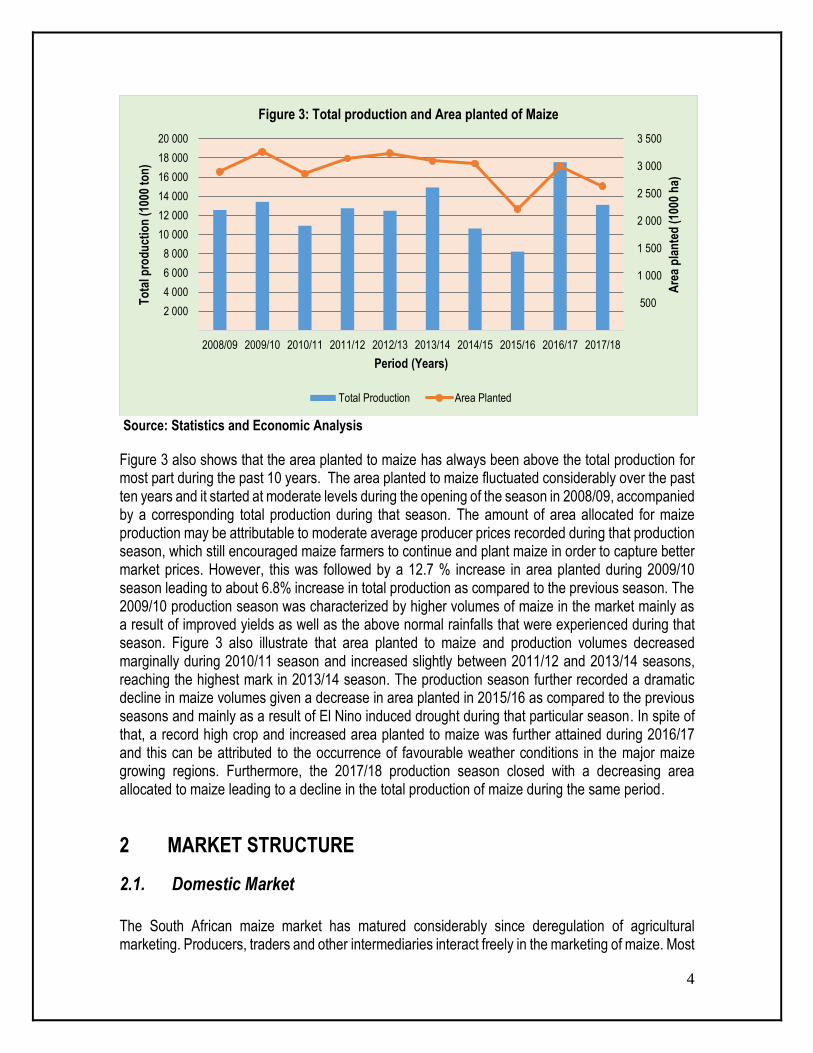
The composition of maize supply consists of maize harvested during that particular season, imports as well as carryover stocks from the previous seasons. Commercial agriculture supplies about 98% of maize in South Africa, while the remaining 2% is produced by the developing agriculture. Over the past ten years, total production of maize has significantly fluctuated, with the lowest production experienced during the 2015/16 and the highest record crop attained in the 2016/17 production seasons.
4
Source: Statistics and Economic Analysis
Figure 3 also shows that the area planted to maize has always been above the total production for most part during the past 10 years. The area planted to maize fluctuated considerably over the past ten years and it started at moderate levels during the opening of the season in 2008/09, accompanied by a corresponding total production during that season. The amount of area allocated for maize production may be attributable to moderate average producer prices recorded during that production season, which still encouraged maize farmers to continue and plant maize in order to capture better market prices. However, this was followed by a 12.7 % increase in area planted during 2009/10 season leading to about 6.8% increase in total production as compared to the previous season. The 2009/10 production season was characterized by higher volumes of maize in the market mainly as a result of improved yields as well as the above normal rainfalls that were experienced during that season. Figure 3 also illustrate that area planted to maize and production volumes decreased marginally during 2010/11 season and increased slightly between 2011/12 and 2013/14 seasons, reaching the highest mark in 2013/14 season. The production season further recorded a dramatic decline in maize volumes given a decrease in area planted in 2015/16 as compared to the previous seasons and mainly as a result of El Nino induced drought during that particular season. In spite of that, a record high crop and increased area planted to maize was further attained during 2016/17 and this can be attributed to the occurrence of favourable weather conditions in the major maize growing regions. Furthermore, the 2017/18 production season closed with a decreasing area allocated to maize leading to a decline in the total production of maize during the same period.
2 MARKET STRUCTURE
2.1. Domestic Market
The South African maize market has matured considerably since deregulation of agricultural marketing. Producers, traders and other intermediaries interact freely in the marketing of maize. Most
500
1 000
1 500
2 000
2 500
3 000
3 500
2 000
4 000
6 000
8 000
10 000
12 000
14 000
16 000
18 000
20 000
2008/09 2009/10 2010/11 2011/12 2012/13 2013/14 2014/15 2015/16 2016/17 2017/18
Are
a p
lan
ted
(10
00 h
a)
To
tal p
rod
uct
ion
(10
00 t
on
)
Period (Years)
Figure 3: Total production and Area planted of Maize
Total Production Area Planted
5
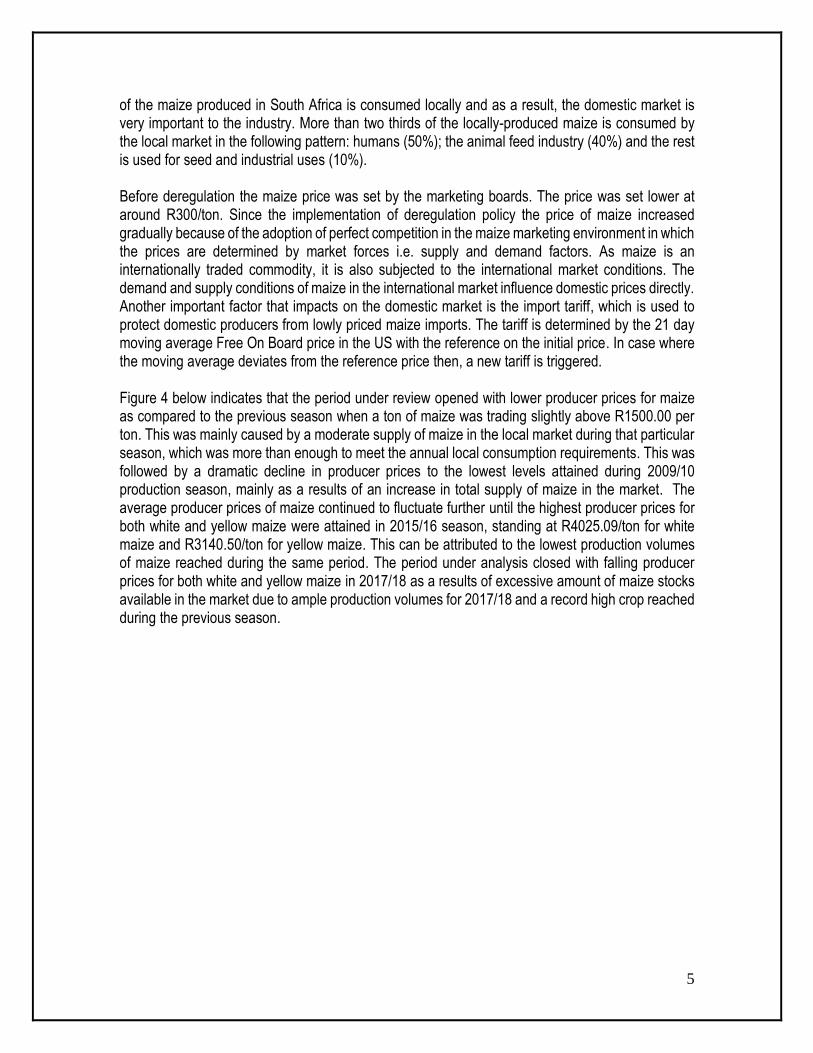
of the maize produced in South Africa is consumed locally and as a result, the domestic market is very important to the industry. More than two thirds of the locally-produced maize is consumed by the local market in the following pattern: humans (50%); the animal feed industry (40%) and the rest is used for seed and industrial uses (10%). Before deregulation the maize price was set by the marketing boards. The price was set lower at around R300/ton. Since the implementation of deregulation policy the price of maize increased gradually because of the adoption of perfect competition in the maize marketing environment in which the prices are determined by market forces i.e. supply and demand factors. As maize is an internationally traded commodity, it is also subjected to the international market conditions. The demand and supply conditions of maize in the international market influence domestic prices directly. Another important factor that impacts on the domestic market is the import tariff, which is used to protect domestic producers from lowly priced maize imports. The tariff is determined by the 21 day moving average Free On Board price in the US with the reference on the initial price. In case where the moving average deviates from the reference price then, a new tariff is triggered. Figure 4 below indicates that the period under review opened with lower producer prices for maize as compared to the previous season when a ton of maize was trading slightly above R1500.00 per ton. This was mainly caused by a moderate supply of maize in the local market during that particular season, which was more than enough to meet the annual local consumption requirements. This was followed by a dramatic decline in producer prices to the lowest levels attained during 2009/10 production season, mainly as a results of an increase in total supply of maize in the market. The average producer prices of maize continued to fluctuate further until the highest producer prices for both white and yellow maize were attained in 2015/16 season, standing at R4025.09/ton for white maize and R3140.50/ton for yellow maize. This can be attributed to the lowest production volumes of maize reached during the same period. The period under analysis closed with falling producer prices for both white and yellow maize in 2017/18 as a results of excessive amount of maize stocks available in the market due to ample production volumes for 2017/18 and a record high crop reached during the previous season.
6
Source: Statistics and Economic Analysis
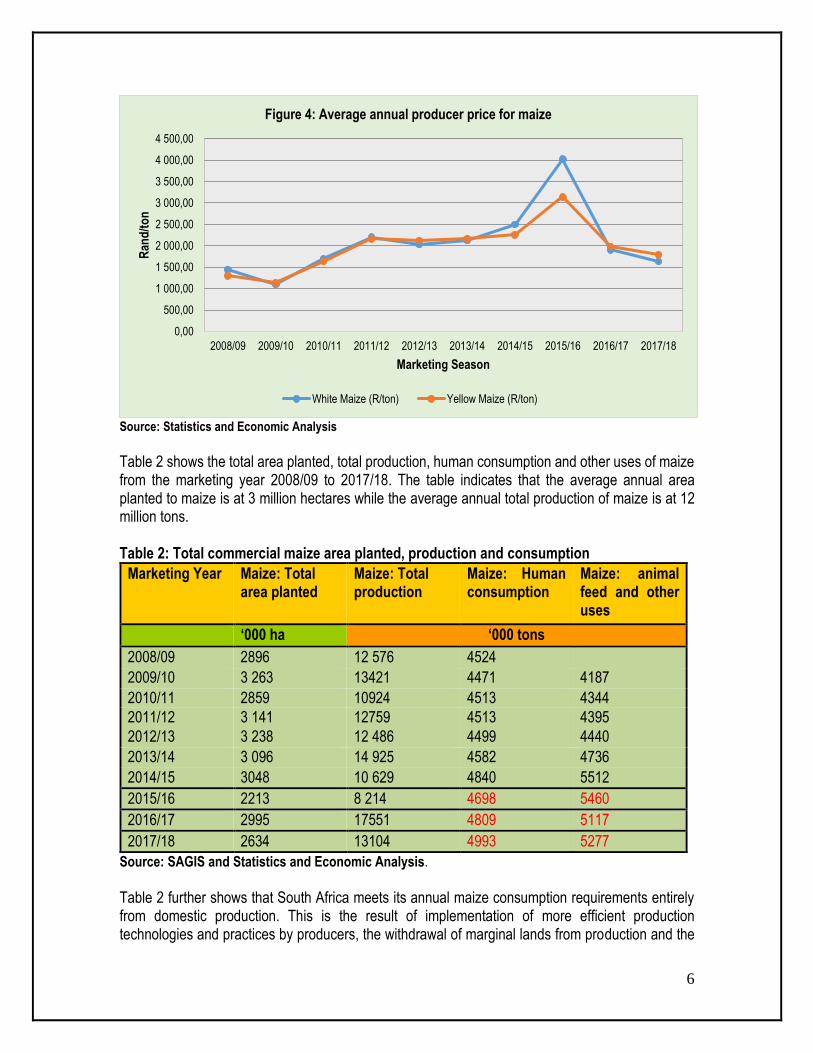
Table 2 shows the total area planted, total production, human consumption and other uses of maize from the marketing year 2008/09 to 2017/18. The table indicates that the average annual area planted to maize is at 3 million hectares while the average annual total production of maize is at 12 million tons. Table 2: Total commercial maize area planted, production and consumption
Marketing Year Maize: Total area planted
Maize: Total production
Maize: Human consumption
Maize: animal feed and other uses
‘000 ha ‘000 tons
2008/09 2896 12 576 4524
2009/10 3 263 13421 4471 4187
2010/11 2859 10924 4513 4344
2011/12 3 141 12759 4513 4395
2012/13 3 238 12 486 4499 4440
2013/14 3 096 14 925 4582 4736
2014/15 3048 10 629 4840 5512
2015/16 2213 8 214 4698 5460
2016/17 2995 17551 4809 5117
2017/18 2634 13104 4993 5277
Source: SAGIS and Statistics and Economic Analysis.
Table 2 further shows that South Africa meets its annual maize consumption requirements entirely from domestic production. This is the result of implementation of more efficient production technologies and practices by producers, the withdrawal of marginal lands from production and the
0,00
500,00
1 000,00
1 500,00
2 000,00
2 500,00
3 000,00
3 500,00
4 000,00
4 500,00
2008/09 2009/10 2010/11 2011/12 2012/13 2013/14 2014/15 2015/16 2016/17 2017/18
Ran
d/t
on
Marketing Season
Figure 4: Average annual producer price for maize
White Maize (R/ton) Yellow Maize (R/ton)
7
development of high yielding maize cultivars. On a good season, South Africa produces enough maize such that it still remains with surplus to export to other countries. On average, especially with regards to consumption, Human consumption takes more than half of the maize consumed domestically while the remainder is processed for animal consumption and industrial uses.
2.2. Exports
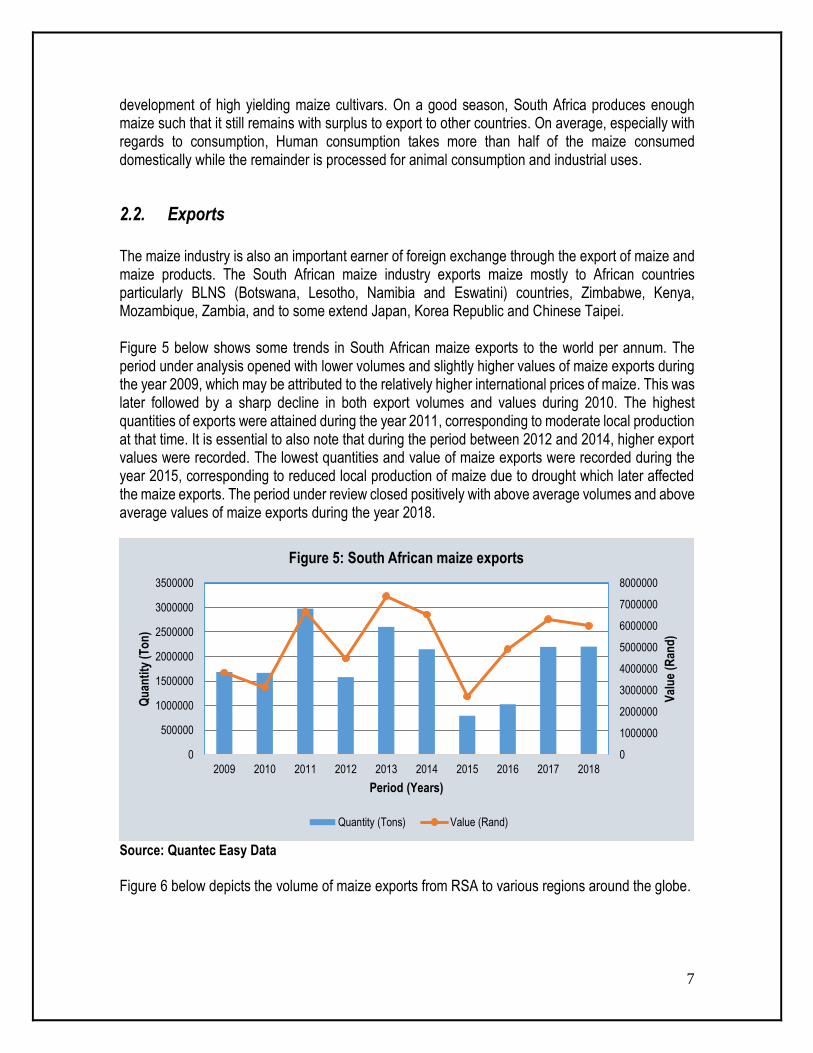
The maize industry is also an important earner of foreign exchange through the export of maize and maize products. The South African maize industry exports maize mostly to African countries particularly BLNS (Botswana, Lesotho, Namibia and Eswatini) countries, Zimbabwe, Kenya, Mozambique, Zambia, and to some extend Japan, Korea Republic and Chinese Taipei. Figure 5 below shows some trends in South African maize exports to the world per annum. The period under analysis opened with lower volumes and slightly higher values of maize exports during the year 2009, which may be attributed to the relatively higher international prices of maize. This was later followed by a sharp decline in both export volumes and values during 2010. The highest quantities of exports were attained during the year 2011, corresponding to moderate local production at that time. It is essential to also note that during the period between 2012 and 2014, higher export values were recorded. The lowest quantities and value of maize exports were recorded during the year 2015, corresponding to reduced local production of maize due to drought which later affected the maize exports. The period under review closed positively with above average volumes and above average values of maize exports during the year 2018.
Source: Quantec Easy Data
Figure 6 below depicts the volume of maize exports from RSA to various regions around the globe.
0
1000000
2000000
3000000
4000000
5000000
6000000
7000000
8000000
0
500000
1000000
1500000
2000000
2500000
3000000
3500000
2009 2010 2011 2012 2013 2014 2015 2016 2017 2018
Val
ue
(Ran
d)
Qu
anti
ty (
To
n)
Period (Years)
Figure 5: South African maize exports
Quantity (Tons) Value (Rand)
8
Source: Quantec Easy Data
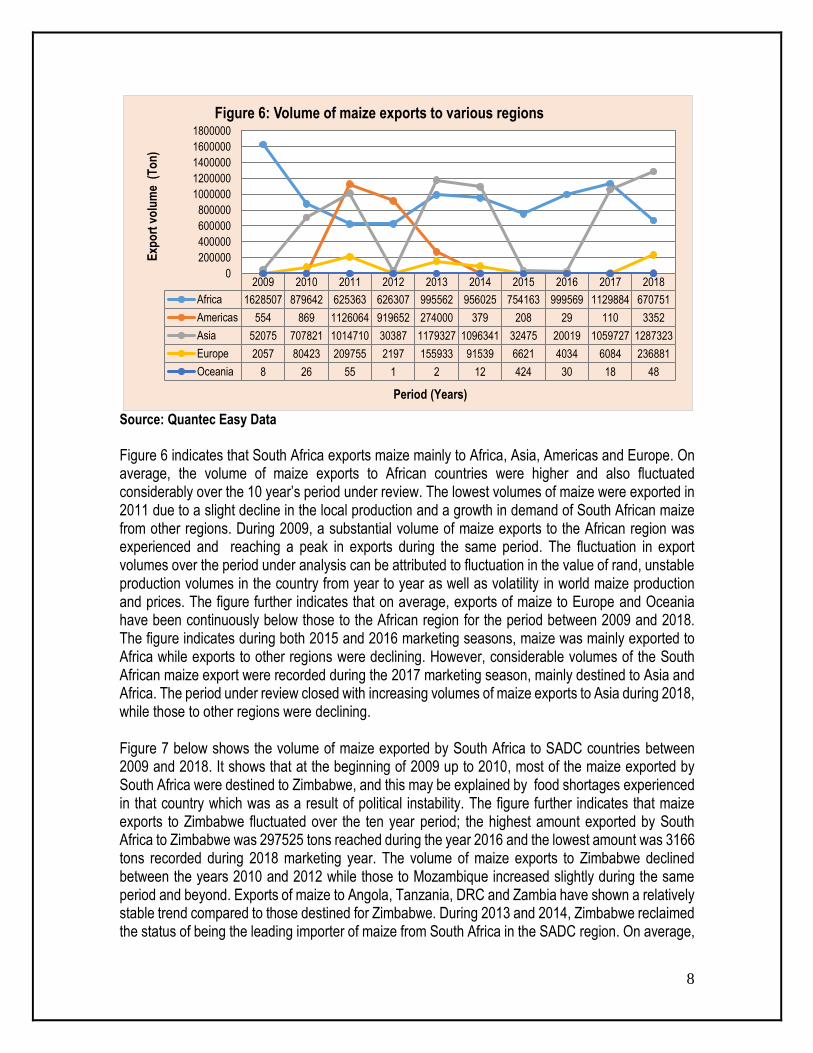
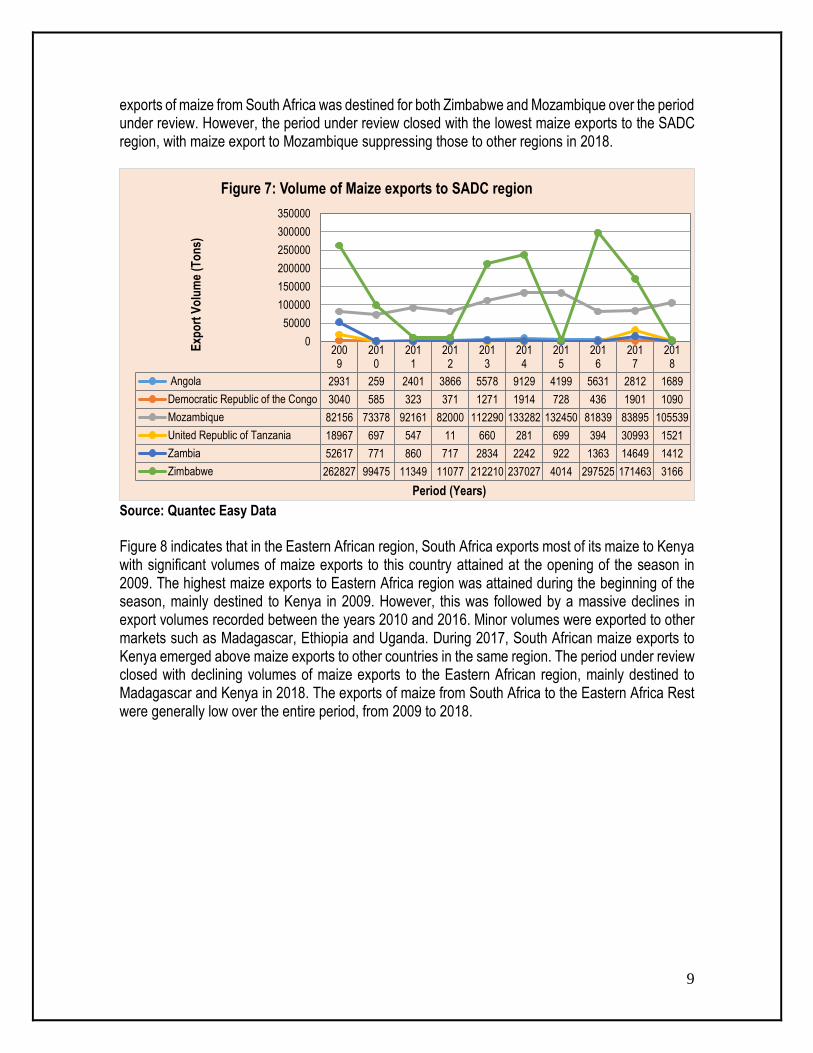
Figure 6 indicates that South Africa exports maize mainly to Africa, Asia, Americas and Europe. On average, the volume of maize exports to African countries were higher and also fluctuated considerably over the 10 year’s period under review. The lowest volumes of maize were exported in 2011 due to a slight decline in the local production and a growth in demand of South African maize from other regions. During 2009, a substantial volume of maize exports to the African region was experienced and reaching a peak in exports during the same period. The fluctuation in export volumes over the period under analysis can be attributed to fluctuation in the value of rand, unstable production volumes in the country from year to year as well as volatility in world maize production and prices. The figure further indicates that on average, exports of maize to Europe and Oceania have been continuously below those to the African region for the period between 2009 and 2018. The figure indicates during both 2015 and 2016 marketing seasons, maize was mainly exported to Africa while exports to other regions were declining. However, considerable volumes of the South African maize export were recorded during the 2017 marketing season, mainly destined to Asia and Africa. The period under review closed with increasing volumes of maize exports to Asia during 2018, while those to other regions were declining. Figure 7 below shows the volume of maize exported by South Africa to SADC countries between 2009 and 2018. It shows that at the beginning of 2009 up to 2010, most of the maize exported by South Africa were destined to Zimbabwe, and this may be explained by food shortages experienced in that country which was as a result of political instability. The figure further indicates that maize exports to Zimbabwe fluctuated over the ten year period; the highest amount exported by South Africa to Zimbabwe was 297525 tons reached during the year 2016 and the lowest amount was 3166 tons recorded during 2018 marketing year. The volume of maize exports to Zimbabwe declined between the years 2010 and 2012 while those to Mozambique increased slightly during the same period and beyond. Exports of maize to Angola, Tanzania, DRC and Zambia have shown a relatively stable trend compared to those destined for Zimbabwe. During 2013 and 2014, Zimbabwe reclaimed the status of being the leading importer of maize from South Africa in the SADC region. On average,
2009 2010 2011 2012 2013 2014 2015 2016 2017 2018
Africa 1628507 879642 625363 626307 995562 956025 754163 999569 1129884 670751
Americas 554 869 1126064 919652 274000 379 208 29 110 3352
Asia 52075 707821 1014710 30387 1179327 1096341 32475 20019 1059727 1287323
Europe 2057 80423 209755 2197 155933 91539 6621 4034 6084 236881
Oceania 8 26 55 1 2 12 424 30 18 48
0
200000
400000
600000
800000
1000000
1200000
1400000
1600000
1800000
Exp
ort
vo
lum
e (
To
n)
Period (Years)
Figure 6: Volume of maize exports to various regions
9
exports of maize from South Africa was destined for both Zimbabwe and Mozambique over the period under review. However, the period under review closed with the lowest maize exports to the SADC region, with maize export to Mozambique suppressing those to other regions in 2018.
Source: Quantec Easy Data
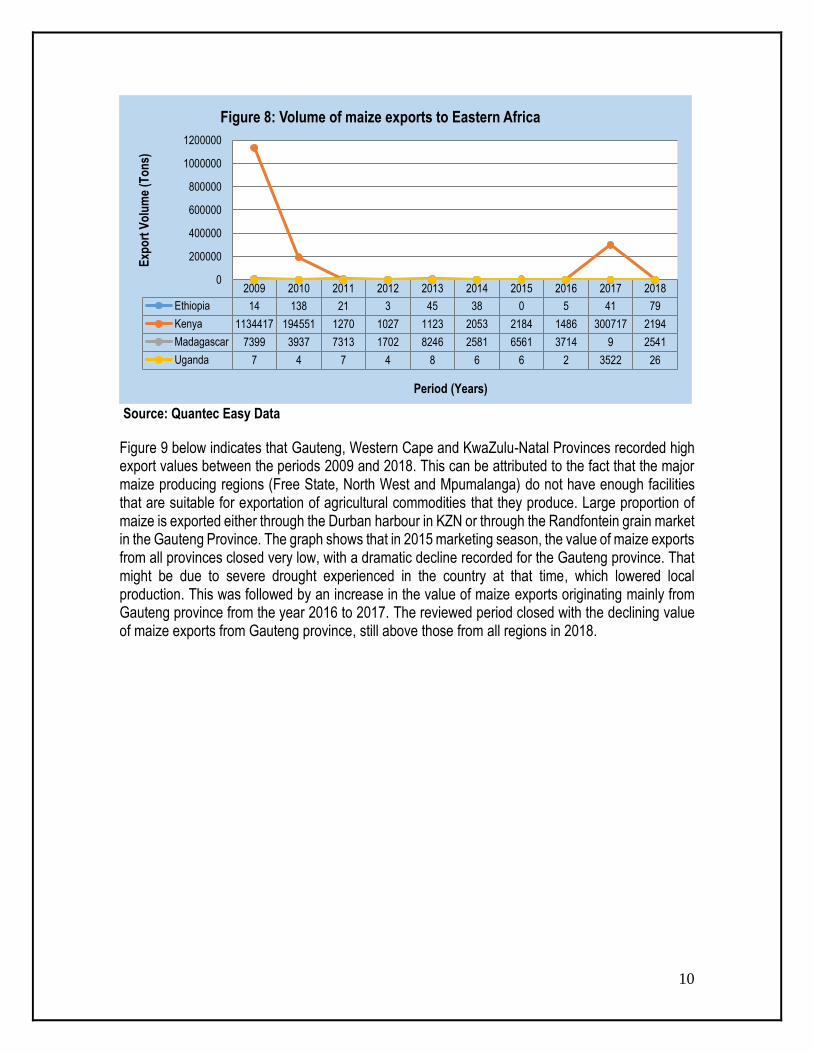
Figure 8 indicates that in the Eastern African region, South Africa exports most of its maize to Kenya with significant volumes of maize exports to this country attained at the opening of the season in 2009. The highest maize exports to Eastern Africa region was attained during the beginning of the season, mainly destined to Kenya in 2009. However, this was followed by a massive declines in export volumes recorded between the years 2010 and 2016. Minor volumes were exported to other markets such as Madagascar, Ethiopia and Uganda. During 2017, South African maize exports to Kenya emerged above maize exports to other countries in the same region. The period under review closed with declining volumes of maize exports to the Eastern African region, mainly destined to Madagascar and Kenya in 2018. The exports of maize from South Africa to the Eastern Africa Rest were generally low over the entire period, from 2009 to 2018.
2009
2010
2011
2012
2013
2014
2015
2016
2017
2018
Angola 2931 259 2401 3866 5578 9129 4199 5631 2812 1689
Democratic Republic of the Congo 3040 585 323 371 1271 1914 728 436 1901 1090
Mozambique 82156 73378 92161 82000 112290 133282 132450 81839 83895 105539
United Republic of Tanzania 18967 697 547 11 660 281 699 394 30993 1521
Zambia 52617 771 860 717 2834 2242 922 1363 14649 1412
Zimbabwe 262827 99475 11349 11077 212210 237027 4014 297525 171463 3166
0
50000
100000
150000
200000
250000
300000
350000
Exp
ort
Vo
lum
e (T
on
s)
Period (Years)
Figure 7: Volume of Maize exports to SADC region
10
Source: Quantec Easy Data
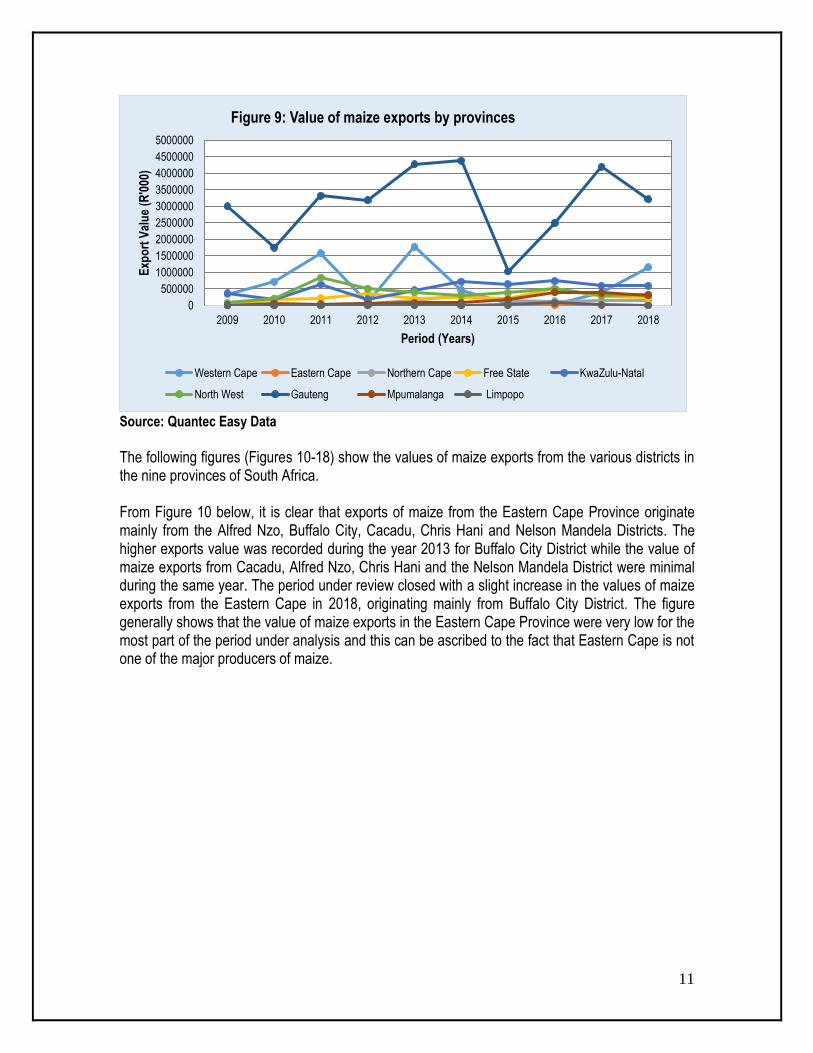
Figure 9 below indicates that Gauteng, Western Cape and KwaZulu-Natal Provinces recorded high export values between the periods 2009 and 2018. This can be attributed to the fact that the major maize producing regions (Free State, North West and Mpumalanga) do not have enough facilities that are suitable for exportation of agricultural commodities that they produce. Large proportion of maize is exported either through the Durban harbour in KZN or through the Randfontein grain market in the Gauteng Province. The graph shows that in 2015 marketing season, the value of maize exports from all provinces closed very low, with a dramatic decline recorded for the Gauteng province. That might be due to severe drought experienced in the country at that time, which lowered local production. This was followed by an increase in the value of maize exports originating mainly from Gauteng province from the year 2016 to 2017. The reviewed period closed with the declining value of maize exports from Gauteng province, still above those from all regions in 2018.
2009 2010 2011 2012 2013 2014 2015 2016 2017 2018
Ethiopia 14 138 21 3 45 38 0 5 41 79
Kenya 1134417 194551 1270 1027 1123 2053 2184 1486 300717 2194
Madagascar 7399 3937 7313 1702 8246 2581 6561 3714 9 2541
Uganda 7 4 7 4 8 6 6 2 3522 26
0
200000
400000
600000
800000
1000000
1200000E
xpo
rt V
olu
me
(To
ns)
Period (Years)
Figure 8: Volume of maize exports to Eastern Africa
11
Source: Quantec Easy Data
The following figures (Figures 10-18) show the values of maize exports from the various districts in the nine provinces of South Africa. From Figure 10 below, it is clear that exports of maize from the Eastern Cape Province originate mainly from the Alfred Nzo, Buffalo City, Cacadu, Chris Hani and Nelson Mandela Districts. The higher exports value was recorded during the year 2013 for Buffalo City District while the value of maize exports from Cacadu, Alfred Nzo, Chris Hani and the Nelson Mandela District were minimal during the same year. The period under review closed with a slight increase in the values of maize exports from the Eastern Cape in 2018, originating mainly from Buffalo City District. The figure generally shows that the value of maize exports in the Eastern Cape Province were very low for the most part of the period under analysis and this can be ascribed to the fact that Eastern Cape is not one of the major producers of maize.
0
500000
1000000
1500000
2000000
2500000
3000000
3500000
4000000
4500000
5000000
2009 2010 2011 2012 2013 2014 2015 2016 2017 2018
Exp
ort
Val
ue
(R'0
00)
Period (Years)
Figure 9: Value of maize exports by provinces
Western Cape Eastern Cape Northern Cape Free State KwaZulu-Natal
North West Gauteng Mpumalanga Limpopo

12
Source: Quantec Easy Data
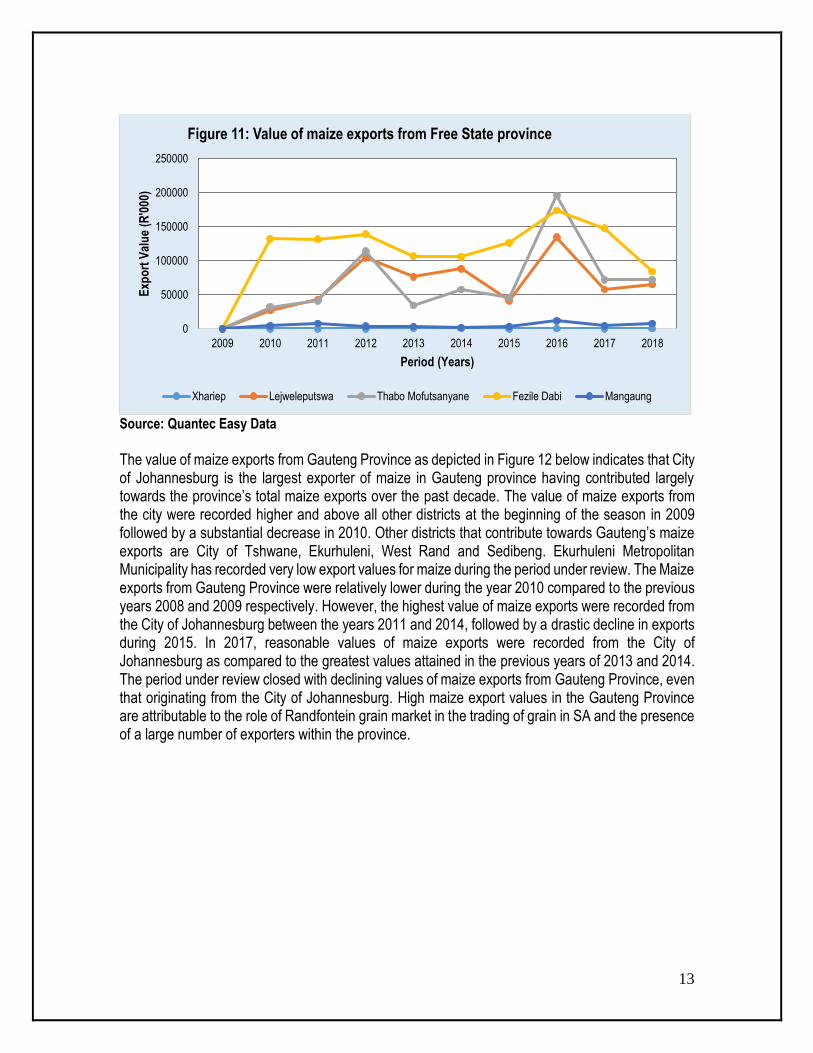
The lowest values of maize exports from the Eastern Cape Province were recorded between the years 2009 and 2012. This phenomenon can be attributed to the fact that the Port Elizabeth harbour is increasingly being used to handle imports and exports of vehicle parts which displaced agricultural products from the harbour over time. The fact that Eastern Cape produces, on average, about 1% of the total South Africa’s maize production also contributes towards lower levels of maize exports by the province. There was very minimal maize exported through the Eastern Cape Province between 2010 and 2012. The highest values of maize exports were recorded from Buffalo City and Alfred Nzo, with very minimal values of maize exports recorded from Nelson Mandela Bay and Chris Hani districts during the year 2013. However, in 2015 relatively high value of maize exports were recorded from Alfred Nzo and Nelson Mandela Bay, respectively. In the respective year 2016, greatest value of maize exports originating mainly from the Alfred Nzo District were recorded, which was the main exporter of maize from the Eastern Cape during that period. Figure 11 below indicates that Free State province recorded less exports of maize during 2009 marketing period. However, during the year 2010, Fezile Dabi emerged to be the main exporting district for maize in the Free State province while exports from the other districts were very minimal during the same year. Maize exports in the province originate mainly from five district municipalities with high values recorded during the year 2016 from Thabo Mofutsanyane district municipality. During 2015, all districts recorded some level of maize exports, with Fezile Dabi District recording the highest exports. The value of maize exports increased marginally with the highest attained from Thabo Mofutsanyane followed by Fezile Dabi and Lejweleputswa Districts in 2016. Generally, maize exports from the Free State Province originate mainly from Fezile Dabi district municipality, which on average remained the leading exporter from all the districts during the entire period under review. In 2018, the marketing season closed with declining values of maize exports recorded for Thabo Mofutsanyane District, while those originating from Fezile Dabi and Lejweleputswa increased marginally.
0
500
1000
1500
2000
2500
3000
3500
4000
4500
5000
2009 2010 2011 2012 2013 2014 2015 2016 2017 2018
Exp
ort
Val
ue
(R'0
00)
Period(Years)
Figure 10: Value of maize exports from Eastern Cape
Cacadu Chris Hani Alfred Nzo Nelson Mandela Bay Buffalo City
13
Source: Quantec Easy Data The value of maize exports from Gauteng Province as depicted in Figure 12 below indicates that City of Johannesburg is the largest exporter of maize in Gauteng province having contributed largely towards the province’s total maize exports over the past decade. The value of maize exports from the city were recorded higher and above all other districts at the beginning of the season in 2009 followed by a substantial decrease in 2010. Other districts that contribute towards Gauteng’s maize exports are City of Tshwane, Ekurhuleni, West Rand and Sedibeng. Ekurhuleni Metropolitan Municipality has recorded very low export values for maize during the period under review. The Maize exports from Gauteng Province were relatively lower during the year 2010 compared to the previous years 2008 and 2009 respectively. However, the highest value of maize exports were recorded from the City of Johannesburg between the years 2011 and 2014, followed by a drastic decline in exports during 2015. In 2017, reasonable values of maize exports were recorded from the City of Johannesburg as compared to the greatest values attained in the previous years of 2013 and 2014. The period under review closed with declining values of maize exports from Gauteng Province, even that originating from the City of Johannesburg. High maize export values in the Gauteng Province are attributable to the role of Randfontein grain market in the trading of grain in SA and the presence of a large number of exporters within the province.
0
50000
100000
150000
200000
250000
2009 2010 2011 2012 2013 2014 2015 2016 2017 2018
Exp
ort
Val
ue
(R'0
00)
Period (Years)
Figure 11: Value of maize exports from Free State province
Xhariep Lejweleputswa Thabo Mofutsanyane Fezile Dabi Mangaung

14
Source: Quantec Easy Data
In KwaZulu-Natal province, it is recorded that EThekwini and UMzinyathi Districts are important role-players in the exportation of maize. It is clear from Figure 13 below that eThekwini is the largest exporter of maize in KwaZulu-Natal followed by UMzinyathi District. The period under review begin with moderate values of maize exports originating from eThekwini in 2009. However, this was followed by an increase in 2010. The figure further shows that the value of maize exports through eThekwini and UMzinyathi showed an increasing trend from year 2013 to 2014. This trend continued to increase positively for both eThekwini and UMzinyathi until the year 2015. The use of the Durban harbour as an exit point plays a major role in the increase in maize export values from the KwaZulu-Natal province. The marketing period closed with moderate and stable values of maize exports in 2018, and this originated mainly from the eThekwini Metropolitan Municipality, followed by marginal exports from UMzinyathi District. The figure indicates that maize exports from UThukela, iLembe and UMgungundlovu districts remained minimal throughout the period under analysis.
0
500000
1000000
1500000
2000000
2500000
3000000
3500000
4000000
4500000
2009 2010 2011 2012 2013 2014 2015 2016 2017 2018
Exp
ort
Val
ue
(R'0
00)
Period (Years)
Figure 12: Value of maize exports from Gauteng province
Sedibeng West Rand Ekurhuleni City of Johannesburg City of Tshwane

15
Source: Quantec Easy Data
Figure 14 below shows the values of maize exports from Limpopo Province between the years 2009 and 2018. Exports of maize in the Province originate mainly from Mopani, Capricorn, Vhembe, Greater Sekhukhune and Waterberg districts. The figure further indicates that during 2009, values of maize exports from Limpopo Province were recorded mainly from the Greater Sekhukhune district. The value of maize exports from the province fluctuated considerably over the period under analysis. It is also clear from Figure 14 that Limpopo is not a major exporter of maize and that the value of maize exported from this province has been very low and erratic over the period under analysis. Furthermore, maize exports from Limpopo Province declined to lower levels from the years 2010 up to 2014. The greatest values of maize exports from Limpopo Province were recorded from Waterberg Districts during the respective years 2015, 2016 and 2017, while exports from other districts were very low. The period under analysis closed with declining values of maize exports from the province originating mainly from Waterberg Districts during 2018.
0
100000
200000
300000
400000
500000
600000
700000
2009 2010 2011 2012 2013 2014 2015 2016 2017 2018
Exp
oer
Val
ue
(R'0
00)
Period (Years)
Figure 22: Volume of maize imports from NAFTA
UMgungundlovu Uthukela Umzinyathi iLembe eThekwini

16
Source: Quantec Easy Data
Figure 15 below indicates that the major exporting regions for maize in Mpumalanga Province are Gert Sibande, Ehlanzeni and Nkangala Districts. Gert Sibande District recorded the largest value of maize exports from the beginning of the season in 2009 and between the years 2011 and 2018, respectively. In general, the value of maize exports from Mpumalanga Province was very low during the years 2009 and 2011. Figure 15 further indicates that Gert Sibande district is the largest exporting district in Mpumalanga followed by Nkangala district although the latter only recorded very minimal exports of maize during the entire period under review. In 2016, great amount of maize export values from Gert Sibande district were attained, contributing immensely to the total maize exports in value terms from Mpumalanga province. The period under review closed with a minimal values of maize exports from Mpumalanga province, with declining values of maize exports originating mainly from Gert Sibande district and increasing exports values coming from Nkangala district in 2018.
0
10000
20000
30000
40000
50000
60000
70000
80000
90000
2009 2010 2011 2012 2013 2014 2015 2016 2017 2018
Exp
ort
Val
ue
(R'0
00)
Period (Years)
Figure 14: Value of maize exports from Limpopo provnce
Mopani Vhembe Capricorn Waterberg Greater Sekhukhune

17
Source: Quantec Easy Data
Source: Quantec Easy Data Figure 16 above shows maize exports from the Northern Cape and also highlights that only Pixley ka Seme district has been the major exporter of maize out of the five districts available in the province from the year 2009 to 2018. During 2013 Siyanda District exported minimal volumes of maize, which later decreased in 2014 as shown in the figure. The values of maize exports from Siyanda district further increased between the years 2015 and 2018 respectively. The figure further shows that maize exports were fluctuating throughout the period under analysis and in 2014 a peak was reached on values of maize exports originating from Pixley Ka Seme District. Exports of maize from Northern Cape Province begin at lower levels during the year 2009 and this was followed by a minimal increase
0
50000
100000
150000
200000
250000
300000
350000
400000
450000
2009 2010 2011 2012 2013 2014 2015 2016 2017 2018
Exp
ort
Val
ue
(R'0
00)
Period (Years )
Figure 15: Value of maize exports from Mpumalanga province
Gert Sibande Nkangala Ehlanzeni
0
50000
100000
150000
200000
250000
300000
350000
2009 2010 2011 2012 2013 2014 2015 2016 2017 2018
Exp
ort
Val
ue
(R'0
00)
Period (Years)
Figure 16: Value of maize exports from Northern Cape province
Pixley ka Seme Siyanda
18
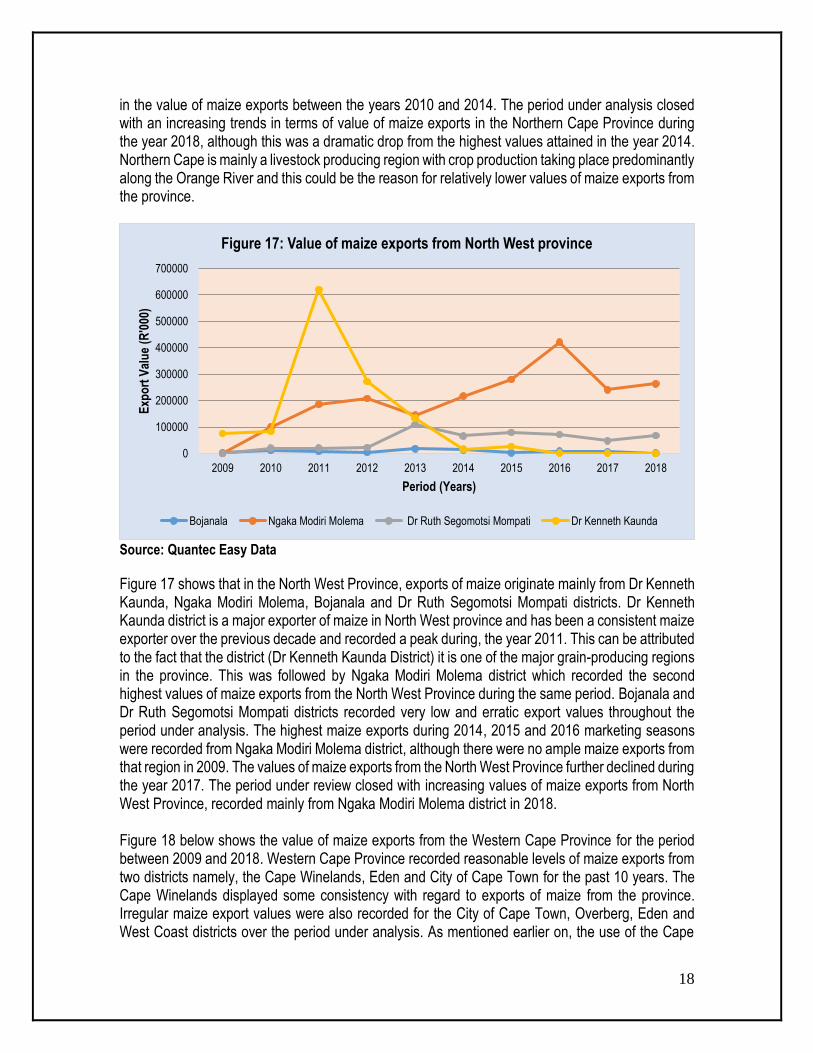
in the value of maize exports between the years 2010 and 2014. The period under analysis closed with an increasing trends in terms of value of maize exports in the Northern Cape Province during the year 2018, although this was a dramatic drop from the highest values attained in the year 2014. Northern Cape is mainly a livestock producing region with crop production taking place predominantly along the Orange River and this could be the reason for relatively lower values of maize exports from the province.
Source: Quantec Easy Data
Figure 17 shows that in the North West Province, exports of maize originate mainly from Dr Kenneth Kaunda, Ngaka Modiri Molema, Bojanala and Dr Ruth Segomotsi Mompati districts. Dr Kenneth Kaunda district is a major exporter of maize in North West province and has been a consistent maize exporter over the previous decade and recorded a peak during, the year 2011. This can be attributed to the fact that the district (Dr Kenneth Kaunda District) it is one of the major grain-producing regions in the province. This was followed by Ngaka Modiri Molema district which recorded the second highest values of maize exports from the North West Province during the same period. Bojanala and Dr Ruth Segomotsi Mompati districts recorded very low and erratic export values throughout the period under analysis. The highest maize exports during 2014, 2015 and 2016 marketing seasons were recorded from Ngaka Modiri Molema district, although there were no ample maize exports from that region in 2009. The values of maize exports from the North West Province further declined during the year 2017. The period under review closed with increasing values of maize exports from North West Province, recorded mainly from Ngaka Modiri Molema district in 2018. Figure 18 below shows the value of maize exports from the Western Cape Province for the period between 2009 and 2018. Western Cape Province recorded reasonable levels of maize exports from two districts namely, the Cape Winelands, Eden and City of Cape Town for the past 10 years. The Cape Winelands displayed some consistency with regard to exports of maize from the province. Irregular maize export values were also recorded for the City of Cape Town, Overberg, Eden and West Coast districts over the period under analysis. As mentioned earlier on, the use of the Cape
0
100000
200000
300000
400000
500000
600000
700000
2009 2010 2011 2012 2013 2014 2015 2016 2017 2018
Exp
ort
Val
ue
(R'0
00)
Period (Years)
Figure 17: Value of maize exports from North West province
Bojanala Ngaka Modiri Molema Dr Ruth Segomotsi Mompati Dr Kenneth Kaunda
19
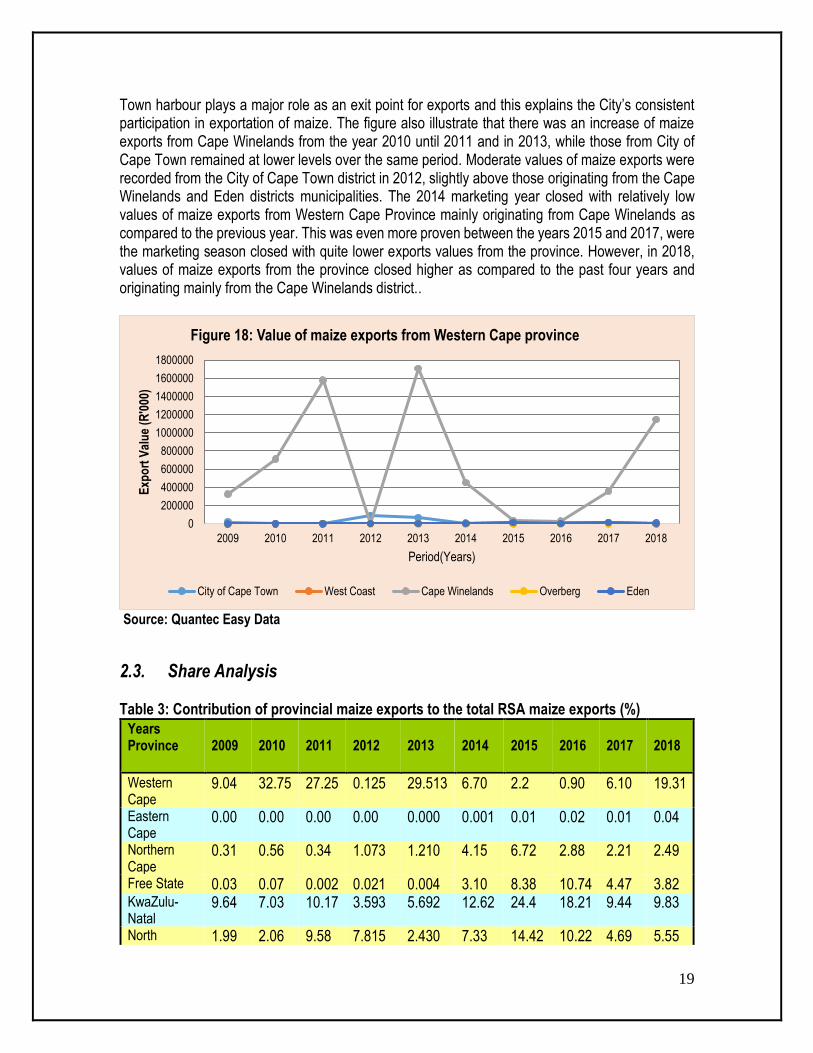
Town harbour plays a major role as an exit point for exports and this explains the City’s consistent participation in exportation of maize. The figure also illustrate that there was an increase of maize exports from Cape Winelands from the year 2010 until 2011 and in 2013, while those from City of Cape Town remained at lower levels over the same period. Moderate values of maize exports were recorded from the City of Cape Town district in 2012, slightly above those originating from the Cape Winelands and Eden districts municipalities. The 2014 marketing year closed with relatively low values of maize exports from Western Cape Province mainly originating from Cape Winelands as compared to the previous year. This was even more proven between the years 2015 and 2017, were the marketing season closed with quite lower exports values from the province. However, in 2018, values of maize exports from the province closed higher as compared to the past four years and originating mainly from the Cape Winelands district..
Source: Quantec Easy Data
2.3. Share Analysis Table 3: Contribution of provincial maize exports to the total RSA maize exports (%)
Years Province
2009
2010
2011
2012
2013
2014
2015
2016
2017
2018
Western Cape
9.04 32.75 27.25 0.125 29.513 6.70 2.2 0.90 6.10 19.31
Eastern Cape
0.00 0.00 0.00 0.00 0.000 0.001 0.01 0.02 0.01 0.04
Northern Cape
0.31 0.56 0.34 1.073 1.210 4.15 6.72 2.88 2.21 2.49
Free State 0.03 0.07 0.002 0.021 0.004 3.10 8.38 10.74 4.47 3.82 KwaZulu- Natal
9.64 7.03 10.17 3.593 5.692 12.62 24.4 18.21 9.44 9.83
North 1.99 2.06 9.58 7.815 2.430 7.33 14.42 10.22 4.69 5.55
0
200000
400000
600000
800000
1000000
1200000
1400000
1600000
1800000
2009 2010 2011 2012 2013 2014 2015 2016 2017 2018
Exp
ort
Val
ue
(R'0
00)
Period(Years)
Figure 18: Value of maize exports from Western Cape province
City of Cape Town West Coast Cape Winelands Overberg Eden
20
Years Province
2009
2010
2011
2012
2013
2014
2015
2016
2017
2018
West Gauteng 78.67 57.45 52.65 87.302 60.861 63.63 37.06 47.63 66.64 53.71 Mpumalanga 0.21 0.04 0.004 0.025 0.202 1.44 6.03 7.67 6.05 5.23 Limpopo 0.11 0.04 0.002 0.046 0.089 0.15 0.72 1.73 0.37 0.03
Source: Calculated from Quantec Easy Data
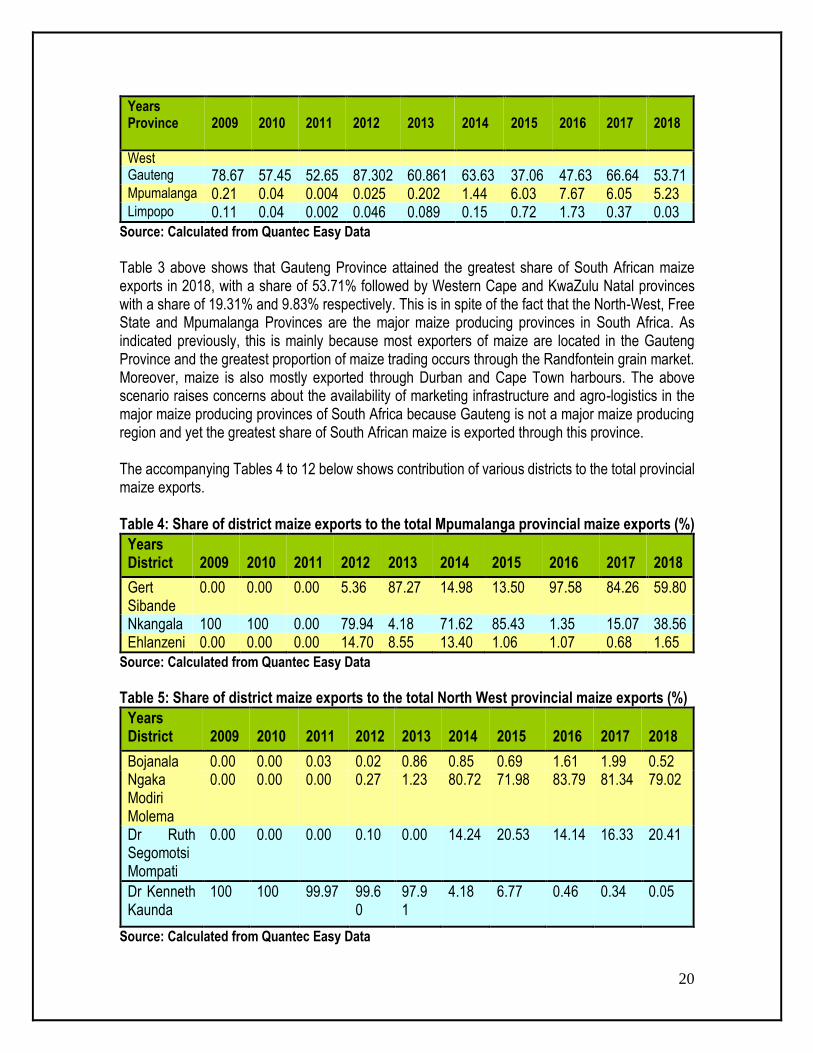
Table 3 above shows that Gauteng Province attained the greatest share of South African maize exports in 2018, with a share of 53.71% followed by Western Cape and KwaZulu Natal provinces with a share of 19.31% and 9.83% respectively. This is in spite of the fact that the North-West, Free State and Mpumalanga Provinces are the major maize producing provinces in South Africa. As indicated previously, this is mainly because most exporters of maize are located in the Gauteng Province and the greatest proportion of maize trading occurs through the Randfontein grain market. Moreover, maize is also mostly exported through Durban and Cape Town harbours. The above scenario raises concerns about the availability of marketing infrastructure and agro-logistics in the major maize producing provinces of South Africa because Gauteng is not a major maize producing region and yet the greatest share of South African maize is exported through this province. The accompanying Tables 4 to 12 below shows contribution of various districts to the total provincial maize exports. Table 4: Share of district maize exports to the total Mpumalanga provincial maize exports (%)
Years District
2009
2010
2011
2012
2013
2014
2015
2016
2017
2018
Gert Sibande
0.00 0.00 0.00 5.36 87.27 14.98 13.50 97.58 84.26 59.80
Nkangala 100 100 0.00 79.94 4.18 71.62 85.43 1.35 15.07 38.56 Ehlanzeni 0.00 0.00 0.00 14.70 8.55 13.40 1.06 1.07 0.68 1.65
Source: Calculated from Quantec Easy Data
Table 5: Share of district maize exports to the total North West provincial maize exports (%)
Years District
2009
2010
2011
2012
2013
2014
2015
2016
2017
2018
Bojanala 0.00 0.00 0.03 0.02 0.86 0.85 0.69 1.61 1.99 0.52 Ngaka Modiri Molema
0.00 0.00 0.00 0.27 1.23 80.72 71.98 83.79 81.34 79.02
Dr Ruth Segomotsi Mompati
0.00 0.00 0.00 0.10 0.00 14.24 20.53 14.14 16.33 20.41
Dr Kenneth Kaunda
100 100 99.97 99.60
97.91
4.18 6.77 0.46 0.34 0.05
Source: Calculated from Quantec Easy Data
21
Table 6: Share of district maize exports to the total Free State provincial maize exports (%)
Years District
2009 2010 2011 2012 2013 2014 2015 2016 2017 2018
Xhariep 0.00 0.00 0.00 0.00 38.36 0.48 0.02 0.05 0.00 0.11
Lejweleputswa 58.73
17.16 0.00 0.00 0.00 15.01 22.81 27.66
20.40
28.31
Thabo Mofutsanyane
0.00 0.00 100 13.88 61.64 65.03 38.62 37.13
25.60
31.49
Fezile Dabi 41.27
82.84 0.00 0.00 0.00 9.04 37.28 32.94
52.41
36.72
Mangaung 0.00 0.00 0.00 86.12 0.00 10.44 1.26 2.22 1.59 3.37
Source: Calculated from Quantec Easy Data
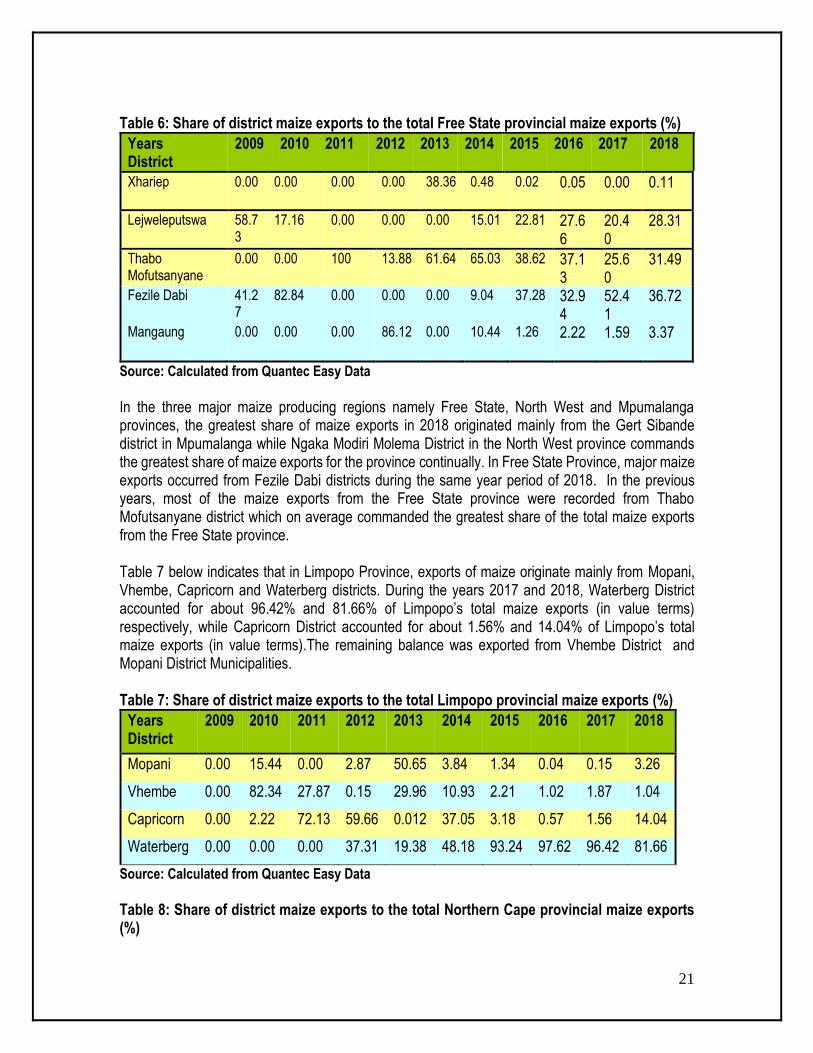
In the three major maize producing regions namely Free State, North West and Mpumalanga provinces, the greatest share of maize exports in 2018 originated mainly from the Gert Sibande district in Mpumalanga while Ngaka Modiri Molema District in the North West province commands the greatest share of maize exports for the province continually. In Free State Province, major maize exports occurred from Fezile Dabi districts during the same year period of 2018. In the previous years, most of the maize exports from the Free State province were recorded from Thabo Mofutsanyane district which on average commanded the greatest share of the total maize exports from the Free State province. Table 7 below indicates that in Limpopo Province, exports of maize originate mainly from Mopani, Vhembe, Capricorn and Waterberg districts. During the years 2017 and 2018, Waterberg District accounted for about 96.42% and 81.66% of Limpopo’s total maize exports (in value terms) respectively, while Capricorn District accounted for about 1.56% and 14.04% of Limpopo’s total maize exports (in value terms).The remaining balance was exported from Vhembe District and Mopani District Municipalities. Table 7: Share of district maize exports to the total Limpopo provincial maize exports (%)
Years District
2009 2010 2011 2012 2013 2014 2015 2016 2017 2018
Mopani 0.00 15.44 0.00 2.87 50.65 3.84 1.34 0.04 0.15 3.26
Vhembe 0.00 82.34 27.87 0.15 29.96 10.93 2.21 1.02 1.87 1.04
Capricorn 0.00 2.22 72.13 59.66 0.012 37.05 3.18 0.57 1.56 14.04
Waterberg 0.00 0.00 0.00 37.31 19.38 48.18 93.24 97.62 96.42 81.66
Source: Calculated from Quantec Easy Data
Table 8: Share of district maize exports to the total Northern Cape provincial maize exports (%)

22
Years District
2009 2010 2011 2012 2013 2014 2015 2016 2017 2018
Pixley Ka Seme
100 100 100 99.95 94.30 94.48 87.98
87.83 93.97
93.61
Siyanda 0.00 0.00 0.00 0.05 5.70 5.52 12.01
12.05 6.03 6.39
Source: Calculated from Quantec Easy Data
Table 9: Share of district maize exports to the total Eastern Cape provincial maize exports (%)
Years
2009
2010
2011
2012
2013
2014
2015
2016
2017
2018
District
Cacadu 0.00 100.00 0.00 100.00 0.00 0.00 1.45 0.04 0.05 0.04
Nelson Mandela
0.00 0.00 0.00 0.00 0.00 1.11 43.76 0.02 1.44 0.00
Chris Hani
0.00 0.00 0.00 0.00 0.00 0.00 0.00 1.41 0.00 0.00
Alfred Nzo
0.00 0.00 0.00 0.00 0.00 83.87 54.79 98.53 98.52 19.88
Buffalo City
0.00
26.46 100.00 0.00 81.91 55.49 0.00 0.00 0.00 80.08
Source: Calculated from Quantec Easy Data
During the period under review Pixley Ka Seme district commanded 100% share of all maize exports originating from the Northern Cape Province except in years 2012, up until 2018, where there was a minimal maize exports recorded from Siyanda District. In the Eastern Cape Province intermittent exports of maize were recorded from the Cacadu and Nelson Mandela districts but no maize exports were recorded from Nelson Mandela District between the years 2009 and 2013. During the year 2010, Cacadu District contributed 100% to Eastern Cape’s total maize exports. During the year 2012, Cacadu was the only exporter of maize in the Eastern Cape Province. However, from the 2014, up until 2018, most exports of maize from the Eastern Cape were recorded from Alfred Nzo District. In the Eastern Cape, the period under analysis ended with 80.08%, 19.88% and 0.04% of exports originating from Buffalo City, Alfred Nzo and Cacadu Districts respectively. Table 10: Share of district maize exports to the total Western Cape provincial maize exports (%)
Years District
2009
2010
2011
2012
2013
2014
2015
2016
2017
2018
City of Cape Town
5.71 0.35 0.86 50.20 0.16 1.41 20.23 24.67 3.07 0.46
West Coast
0.00 0.00 0.00 0.006 0.00 0.45 1.76 1.76 0.19 0.03
Cape Winelands
94.28 99.64 99.14 16.87 99.79 97.74 59.62 65.17 93.28 99.04
23
Years District
2009
2010
2011
2012
2013
2014
2015
2016
2017
2018
Overberg 0.01 0.00 0.00 0.00 0.00 0.00 0.00 0.28 0.00 0.08 Eden District
0.003 0.01 0.00 32.93 0.048 0.39 18.38 8.11 3.46 0.39
Source: Calculated from Quantec Easy Data
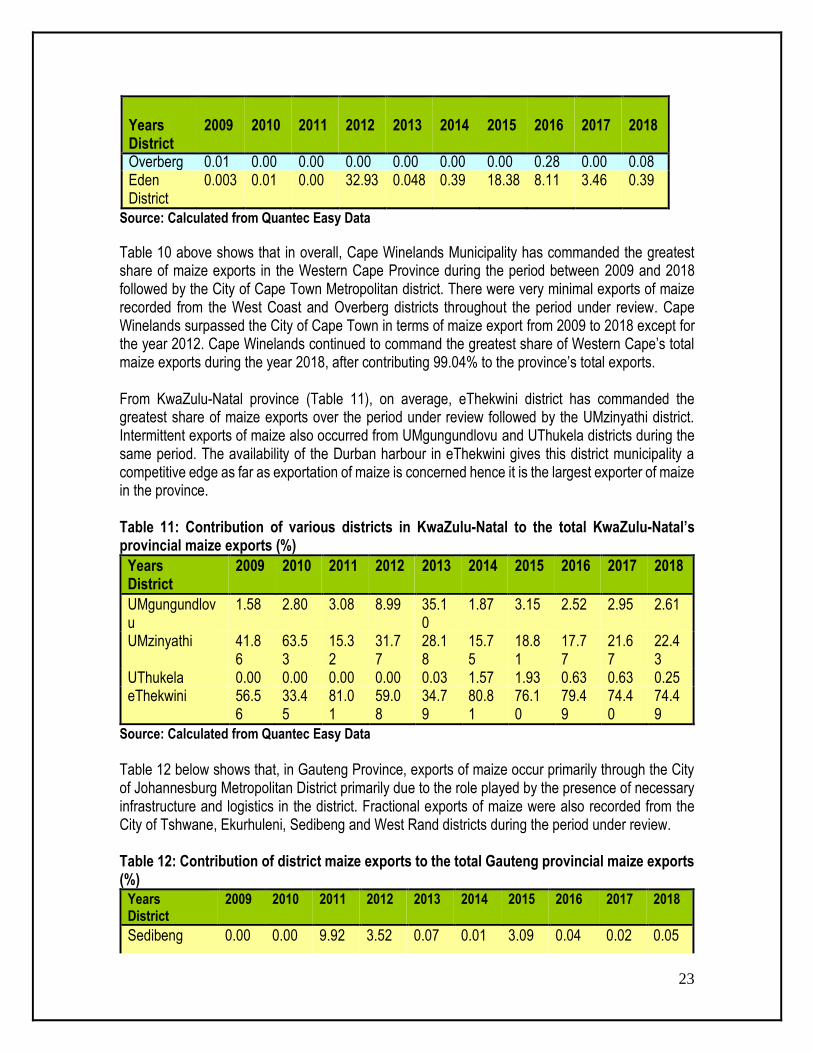
Table 10 above shows that in overall, Cape Winelands Municipality has commanded the greatest share of maize exports in the Western Cape Province during the period between 2009 and 2018 followed by the City of Cape Town Metropolitan district. There were very minimal exports of maize recorded from the West Coast and Overberg districts throughout the period under review. Cape Winelands surpassed the City of Cape Town in terms of maize export from 2009 to 2018 except for the year 2012. Cape Winelands continued to command the greatest share of Western Cape’s total maize exports during the year 2018, after contributing 99.04% to the province’s total exports. From KwaZulu-Natal province (Table 11), on average, eThekwini district has commanded the greatest share of maize exports over the period under review followed by the UMzinyathi district. Intermittent exports of maize also occurred from UMgungundlovu and UThukela districts during the same period. The availability of the Durban harbour in eThekwini gives this district municipality a competitive edge as far as exportation of maize is concerned hence it is the largest exporter of maize in the province. Table 11: Contribution of various districts in KwaZulu-Natal to the total KwaZulu-Natal’s provincial maize exports (%)
Years District
2009 2010 2011 2012 2013 2014 2015 2016 2017 2018
UMgungundlovu
1.58 2.80 3.08 8.99 35.10
1.87 3.15 2.52 2.95 2.61
UMzinyathi 41.86
63.53
15.32
31.77
28.18
15.75
18.81
17.77
21.67
22.43
UThukela 0.00 0.00 0.00 0.00 0.03 1.57 1.93 0.63 0.63 0.25 eThekwini 56.5
6 33.45
81.01
59.08
34.79
80.81
76.10
79.49
74.40
74.49
Source: Calculated from Quantec Easy Data
Table 12 below shows that, in Gauteng Province, exports of maize occur primarily through the City of Johannesburg Metropolitan District primarily due to the role played by the presence of necessary infrastructure and logistics in the district. Fractional exports of maize were also recorded from the City of Tshwane, Ekurhuleni, Sedibeng and West Rand districts during the period under review. Table 12: Contribution of district maize exports to the total Gauteng provincial maize exports (%)
Years District
2009 2010 2011 2012 2013 2014 2015 2016 2017 2018
Sedibeng 0.00 0.00 9.92 3.52 0.07 0.01 3.09 0.04 0.02 0.05

24
Years District
2009 2010 2011 2012 2013 2014 2015 2016 2017 2018
West Rand 0.62 0.31 0.28 1.82 3.34 4.11 11.48 0.00 0.02 0.03
Ekurhuleni 4.18 0.53 0.14 0.09 0.14 0.88 1.36 0.65 0.34 0.39
City of
Johannesburg
81.48 76.12 95.13 90.44 93.68 90.04 74.36 88.78 91.04 95.12
City of
Tshwane
13.72 23.04 4.44 7.65 2.78 4.97 12.78 10.53 8.58 4.41
Source: Calculated from Quantec Easy Data
25
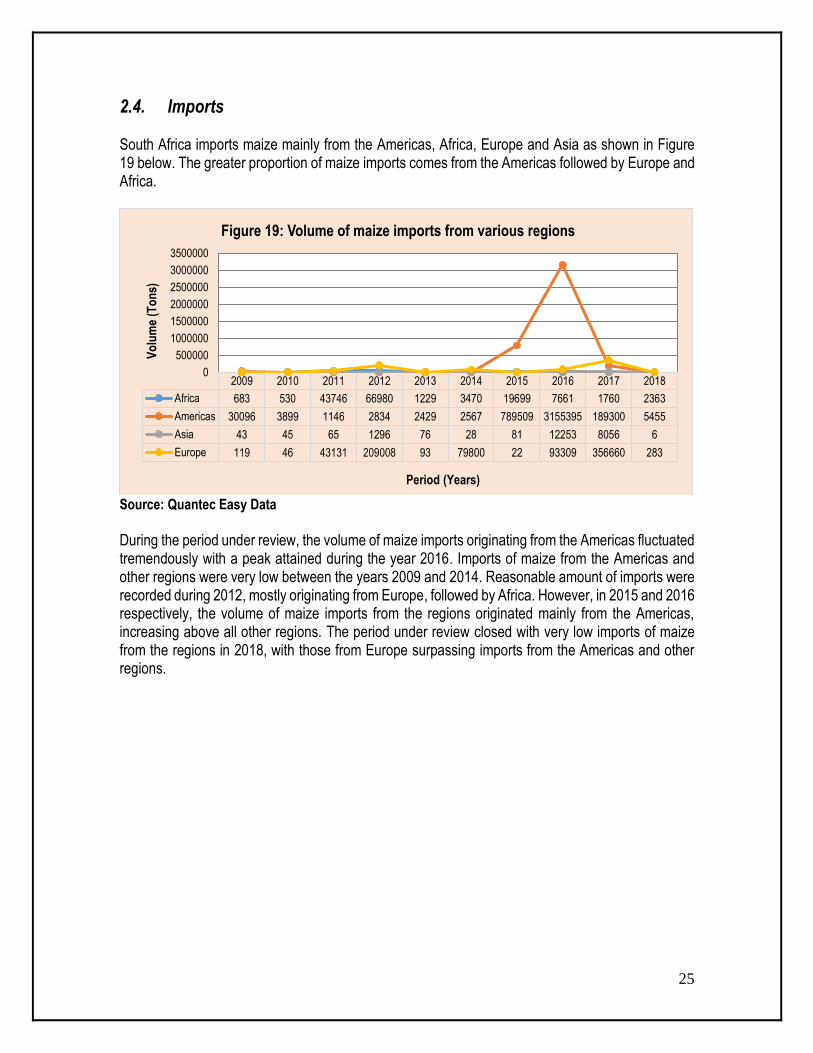
2.4. Imports South Africa imports maize mainly from the Americas, Africa, Europe and Asia as shown in Figure 19 below. The greater proportion of maize imports comes from the Americas followed by Europe and Africa.
Source: Quantec Easy Data
During the period under review, the volume of maize imports originating from the Americas fluctuated tremendously with a peak attained during the year 2016. Imports of maize from the Americas and other regions were very low between the years 2009 and 2014. Reasonable amount of imports were recorded during 2012, mostly originating from Europe, followed by Africa. However, in 2015 and 2016 respectively, the volume of maize imports from the regions originated mainly from the Americas, increasing above all other regions. The period under review closed with very low imports of maize from the regions in 2018, with those from Europe surpassing imports from the Americas and other regions.
2009 2010 2011 2012 2013 2014 2015 2016 2017 2018
Africa 683 530 43746 66980 1229 3470 19699 7661 1760 2363
Americas 30096 3899 1146 2834 2429 2567 789509 3155395 189300 5455
Asia 43 45 65 1296 76 28 81 12253 8056 6
Europe 119 46 43131 209008 93 79800 22 93309 356660 283
0
500000
1000000
1500000
2000000
2500000
3000000
3500000
Vo
lum
e (T
on
s)
Period (Years)
Figure 19: Volume of maize imports from various regions

26
Source: Quantec Easy Data
As indicated in the previous figure (Figure 19) and in Figure 20, maize imports from the Americas originate mainly from South America and NAFTA (North American Free Trade Area). In recent years, imports of maize from both NAFTA and South America have shown significant declines from 2009 until 2014 while maize imports originating from NAFTA opened very low in 2009. In 2015, the volume of maize imports increased slightly with the majority originating from South America and very minimal from NAFTA. This trend continued into 2016 when the volumes of maize imports from South America reached the highest point, which corresponded largely to the levels of imports from the Americas at that particular year. The maize imports from the South Americas closed very low during 2018 marketing season, with less than 6 thousand tons recorded from the region. Figure 21 below shows the volume of maize imports from South America for the period 2009 to 2018.
2009 2010 2011 2012 2013 2014 2015 2016 2017 2018
South America 29219 3264 439 1330 957 982 734577 2278299 2769 3184
NAFTA 877 635 708 1503 1472 1585 54932 877097 186530 2271
0
500000
1000000
1500000
2000000
2500000V
olu
me
(To
ns)
Years
Figure 20: Volume of maize imports from Americas
27
Source: Quantec Easy Data
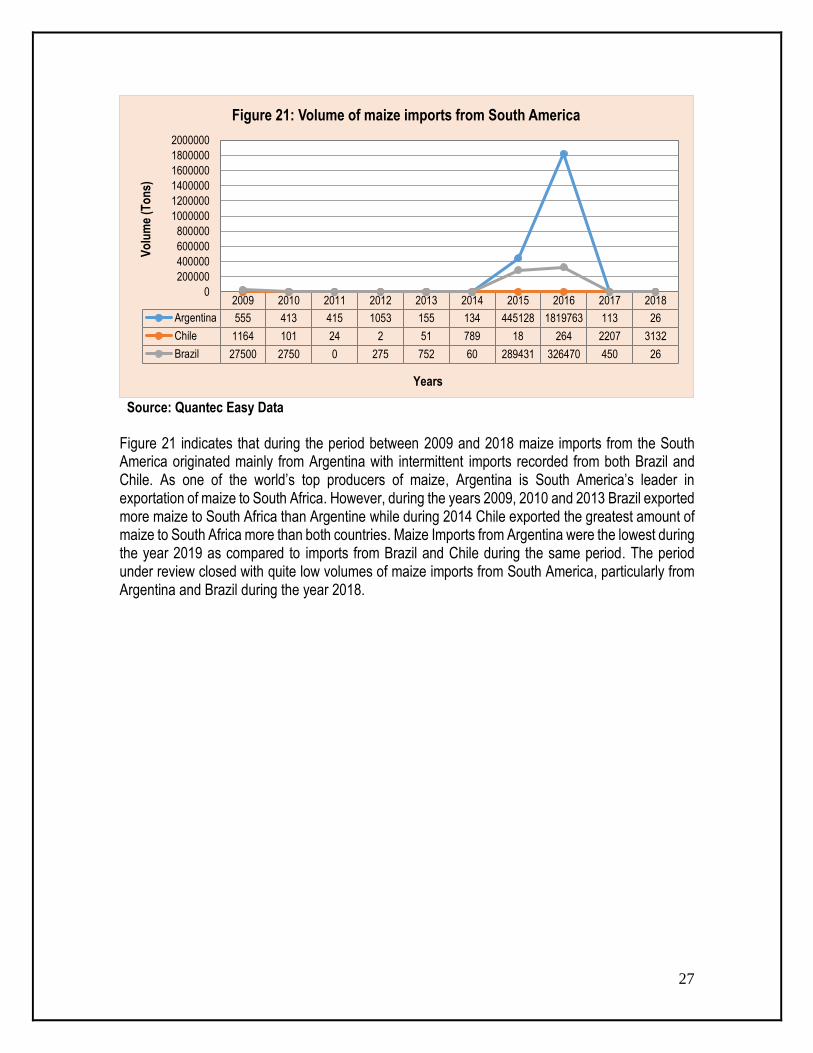
Figure 21 indicates that during the period between 2009 and 2018 maize imports from the South America originated mainly from Argentina with intermittent imports recorded from both Brazil and Chile. As one of the world’s top producers of maize, Argentina is South America’s leader in exportation of maize to South Africa. However, during the years 2009, 2010 and 2013 Brazil exported more maize to South Africa than Argentine while during 2014 Chile exported the greatest amount of maize to South Africa more than both countries. Maize Imports from Argentina were the lowest during the year 2019 as compared to imports from Brazil and Chile during the same period. The period under review closed with quite low volumes of maize imports from South America, particularly from Argentina and Brazil during the year 2018.
2009 2010 2011 2012 2013 2014 2015 2016 2017 2018
Argentina 555 413 415 1053 155 134 445128 1819763 113 26
Chile 1164 101 24 2 51 789 18 264 2207 3132
Brazil 27500 2750 0 275 752 60 289431 326470 450 26
0
200000
400000
600000
800000
1000000
1200000
1400000
1600000
1800000
2000000V
olu
me
(To
ns)
Years
Figure 21: Volume of maize imports from South America
28
Source: Quantec Easy Data
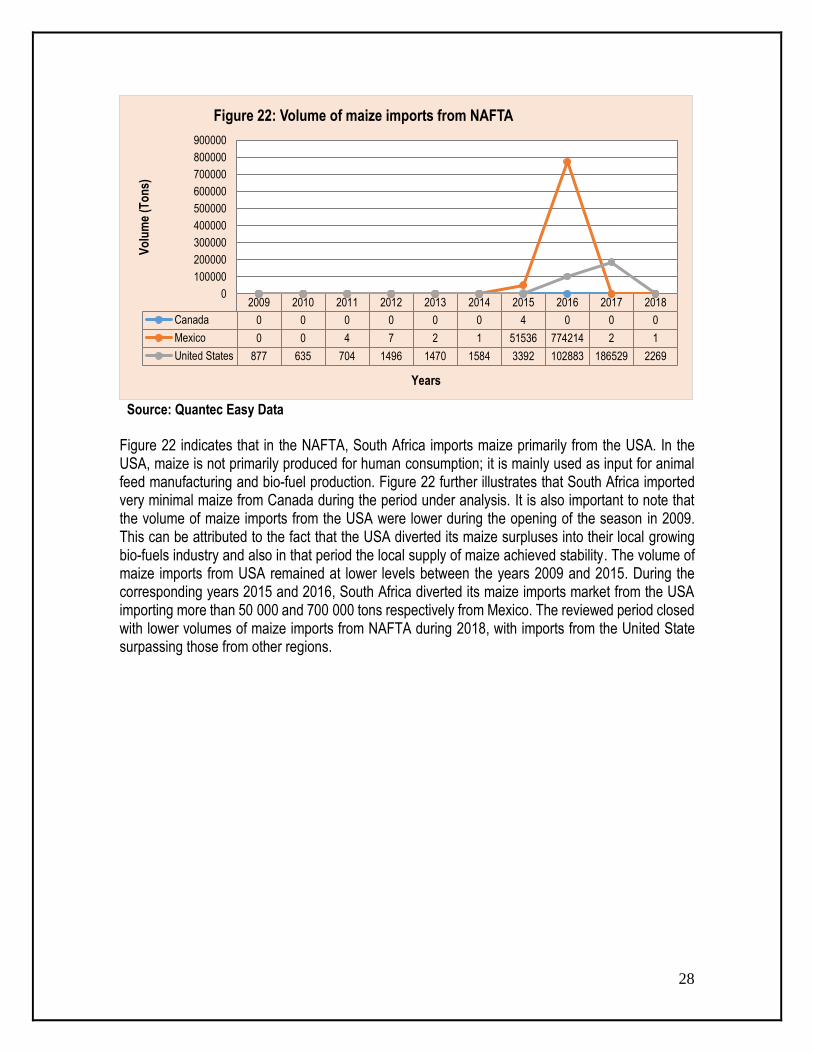
Figure 22 indicates that in the NAFTA, South Africa imports maize primarily from the USA. In the USA, maize is not primarily produced for human consumption; it is mainly used as input for animal feed manufacturing and bio-fuel production. Figure 22 further illustrates that South Africa imported very minimal maize from Canada during the period under analysis. It is also important to note that the volume of maize imports from the USA were lower during the opening of the season in 2009. This can be attributed to the fact that the USA diverted its maize surpluses into their local growing bio-fuels industry and also in that period the local supply of maize achieved stability. The volume of maize imports from USA remained at lower levels between the years 2009 and 2015. During the corresponding years 2015 and 2016, South Africa diverted its maize imports market from the USA importing more than 50 000 and 700 000 tons respectively from Mexico. The reviewed period closed with lower volumes of maize imports from NAFTA during 2018, with imports from the United State surpassing those from other regions.
2009 2010 2011 2012 2013 2014 2015 2016 2017 2018
Canada 0 0 0 0 0 0 4 0 0 0
Mexico 0 0 4 7 2 1 51536 774214 2 1
United States 877 635 704 1496 1470 1584 3392 102883 186529 2269
0
100000
200000
300000
400000
500000
600000
700000
800000
900000V
olu
me
(To
ns)
Years
Figure 22: Volume of maize imports from NAFTA
29
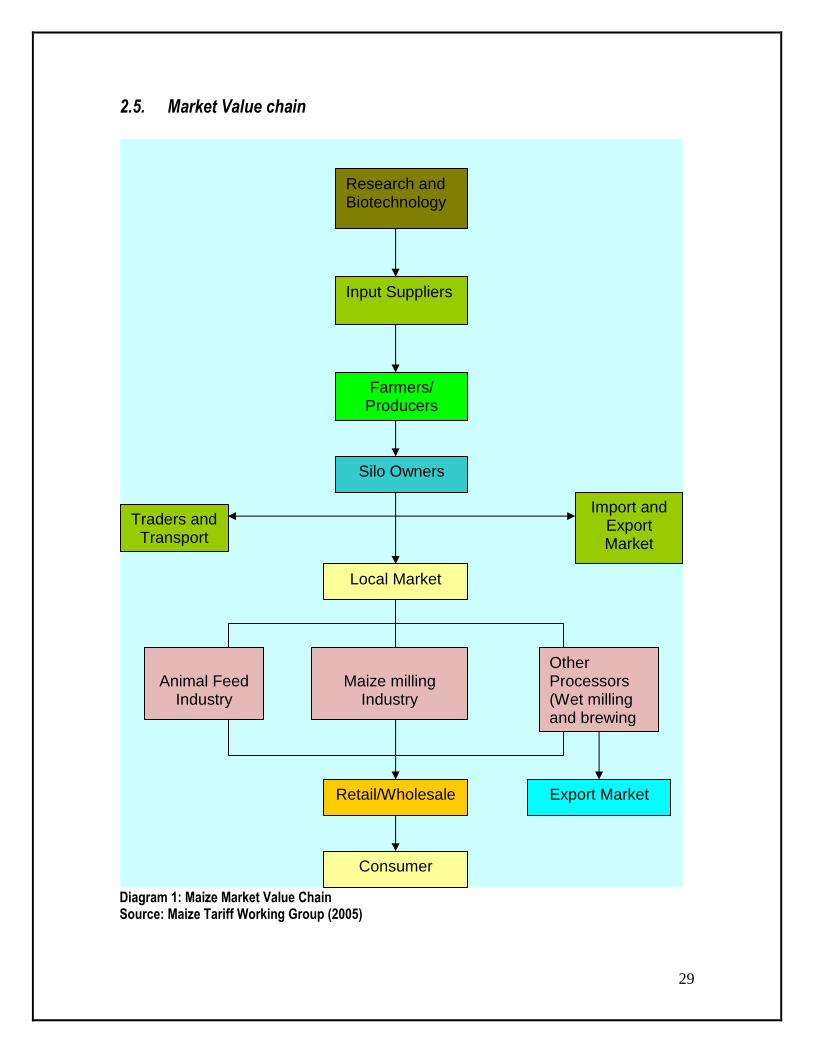
2.5. Market Value chain
Diagram 1: Maize Market Value Chain Source: Maize Tariff Working Group (2005)
Farmers/ Producers
Silo Owners
Traders and Transport
Import and Export Market
Local Market
Animal Feed Industry
Other Processors (Wet milling and brewing industry
Maize milling Industry
Retail/Wholesale
Consumer
Export Market
Input Suppliers
Research and Biotechnology
30
The maize market value chain can be broken down into the following levels: producers of maize (farmers); silo owners (who store maize for their own account and on behalf of others); traders in maize (who market and sell maize); millers of maize (who convert it into usable form); and end users. The primary sector consists of input suppliers, producers and silo owners. Silo owners provide storage facilities to handle the crops, to store maize safely and to supply it to buyers on a continuous basis throughout the year. The secondary sector consists of millers and animal feed manufacturers. Millers convert maize to maize meal for human consumption while animal feed manufacturers use yellow maize for the manufacture of broiler and layer feed rations. Maize products in the form of hominy chop (white maize by-product) are used in feedlots. The tertiary sector consists of traders, retailers and transporters. Traders move the produce to the domestic or export market. There are three types of traders in the maize industry: hedgers who use futures and options to protect an existing portfolio against possible adverse market movements; arbitrageurs who profit from price differentials of maize in different markets; and speculators who use futures and options in the hopes of making a profit on short-term movements in prices. The retail sector provides infrastructure and services for the distribution of maize products from the miller to the final consumer. Transport helps to move the maize from the farmers to the silo owner, from the silo owner to the miller and from the intermediaries to the final consumers.
2.5.1. Seed suppliers as inputs
Monsanto is currently the largest seed company in South Africa after purchasing shares in Sensako and Carnia. Other major players in this market include companies such as Pannar and Pioneer Hybrid International.
2.5.2. Handling and Storage
The farmer has the following maize storage options: He/she can deliver the maize immediately to a miller; He/she can make use of the new storage method in the form of silo bags; He/she can erect his/her own silos; The most common method is to make use of commercial silos off-farm. When the maize industry was deregulated, 90% of the co-operatives converted to private companies. These private companies own 85% of the total maize storage capacity, which is currently 16.3 million tons. There are 432 silos, of which 172 are on-farm and 260 commercial. The commercial silos, owned by 17 silo owners, account for 94% of the available silo capacity. In South Africa there are three major commercial silo owners, namely AFGRI, NWK and SENWES Group, they own 73% of the available storage capacity within the national grain storage market. Most of this storage capacity is located in provinces situated in the northern parts of the country.
31
2.5.3. Maize milling
The maize kernel is processed by two industries namely the Wet and Dry Milling Industries. During the dry milling process the maize kernels are refined to maize meal. The products derived are samp, maize grits and maize rice, unsifted, sifted, coarse, super and special maize meal. Wet milling is a process carried out in water during which pure starch is obtained from maize. After the steeping process of 36 hours the kernel can easily be separated into its various components, namely the husk, starch, gluten and the germ. Since deregulation of markets, the number of informal millers increased sharply from 111 to 296. Business forms within the milling industry include private and public companies. Major players within the milling industry include Pioneer Food Group (Pty) Ltd, Premier Foods Ltd, Pride Milling Company (Pty) Ltd, Ruto Mills (Pty) Ltd and Tiger Brands Ltd, as well as some silo owners such as NTK.
Source: Statistics and Economic Analysis
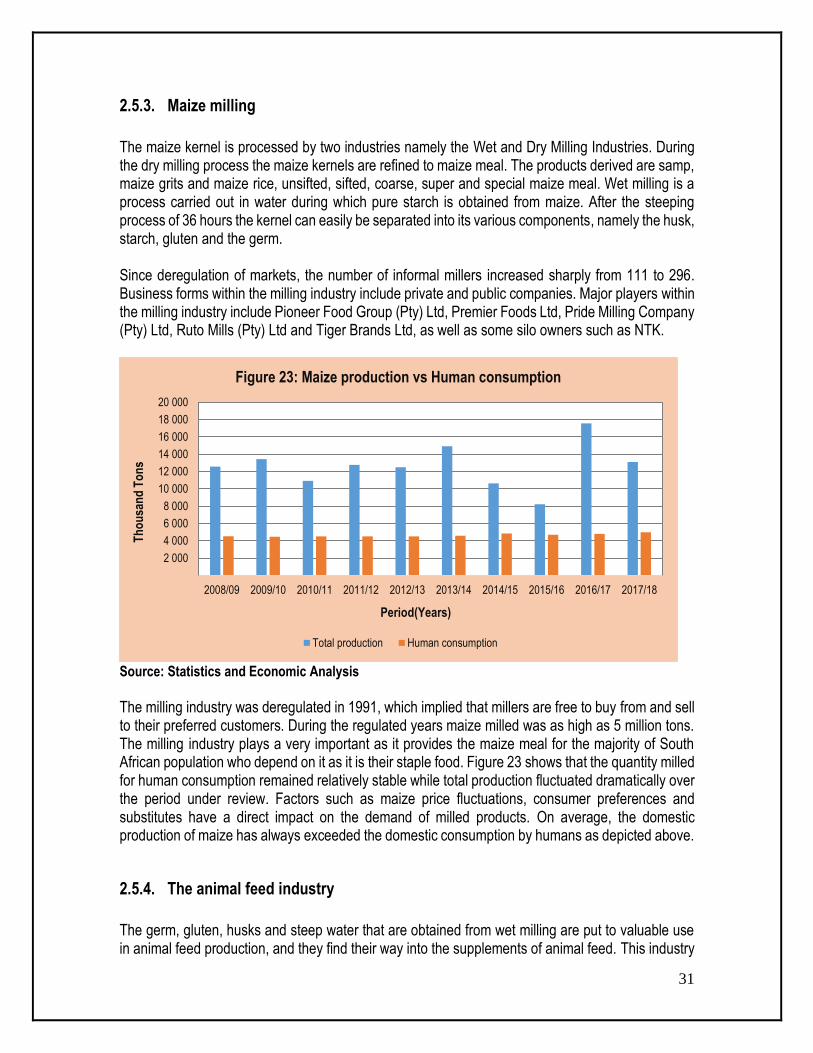
The milling industry was deregulated in 1991, which implied that millers are free to buy from and sell to their preferred customers. During the regulated years maize milled was as high as 5 million tons. The milling industry plays a very important as it provides the maize meal for the majority of South African population who depend on it as it is their staple food. Figure 23 shows that the quantity milled for human consumption remained relatively stable while total production fluctuated dramatically over the period under review. Factors such as maize price fluctuations, consumer preferences and substitutes have a direct impact on the demand of milled products. On average, the domestic production of maize has always exceeded the domestic consumption by humans as depicted above.
2.5.4. The animal feed industry
The germ, gluten, husks and steep water that are obtained from wet milling are put to valuable use in animal feed production, and they find their way into the supplements of animal feed. This industry
2 000
4 000
6 000
8 000
10 000
12 000
14 000
16 000
18 000
20 000
2008/09 2009/10 2010/11 2011/12 2012/13 2013/14 2014/15 2015/16 2016/17 2017/18
Th
ou
san
d T
on
s
Period(Years)
Figure 23: Maize production vs Human consumption
Total production Human consumption

32
supplies feed to all farmed animals in the country and some are exported to BLNS countries. The industry is divided into the formal feed industry (members of the Animal Feed Manufacturers Association) and the other includes feedlots, smaller feed mills and home mixers. The feed industry consists of about 100 – 150 feed millers of different sizes. The formal feed industry is responsible for about 60% of all feeds produced in South Africa. The poultry industry consumes most of the yellow maize for feeds, and other animal feeds are the combination of most of the grain commodities. According to the Animal Feed Manufacturers Association (AFMA), maize constitutes approximately 55% of the 4.2 million tons of feed produced by its members. Business forms within the animal feeds industry consists largely of private companies, co-operatives and converted co-operatives. The top animal feed manufacturers are AFGRI, Bokomo Voere, Epol, KK Animal Nutrition, Meadow Feeds, Noordwes Voere, and Senwesko Voere.
2.5.5. Traders
Traders perform a fundamental and core function in a free trade environment by moving the farmer’s produce to domestic or export markets. During times of shortage the traders source goods externally and bring products to the processor or the consumer in the domestic market. Grain traders take positions (forward buying and selling), assume risk, establish value and provide the real cash market for grain. Traders include local grain traders, international grain houses and financial institutions that provide credit facilities. With the conversion of co-operatives to public companies, many entities expanded their operations to also include other services such as the trading of grain. National players in the marketing and trading level of the maize supply chain include local traders, international houses and financial institutions that provide credit facilities. The large traders include Rand Merchant Bank, Senwes, Afgri, Cargill, Louis Dreyfus and Verus Farms. The smaller competitors are amongst others, Brisen, Bester Feed Exchanges, CTH, Farmwise, Unigrain and Free State Maize. Table 18 below provides an indication of the level of concentration in this market.
2.5.6. Retailing
The formal retail market is relatively concentrated, with some national chain stores dominating the market. The seven major players in the formal retail industry include Pick ’n pay, Shoprite, Metcash, Spar, Massmart, Fruit & Veg City and Woolworths.
2.5.7. Transport
Historically, rail transport dominated the maize market however, the free market system led to the development of a huge expansion in road transport and a reduction in the quantities transported by rail. The reason behind this is that in a deregulated market transport requirements are more complex as participants’ source products independently, creating diversifies transport demands. In general, the ratio of rail and road transport used within the maize value chain has changed from 80% rail and 20% road to 50% rail and 50% road. The rail transport industry comprises a monopoly, Spoornet.
33
Players in the road transport sector include companies such as Unitrans, Imperial Logistics and Bidfreight.
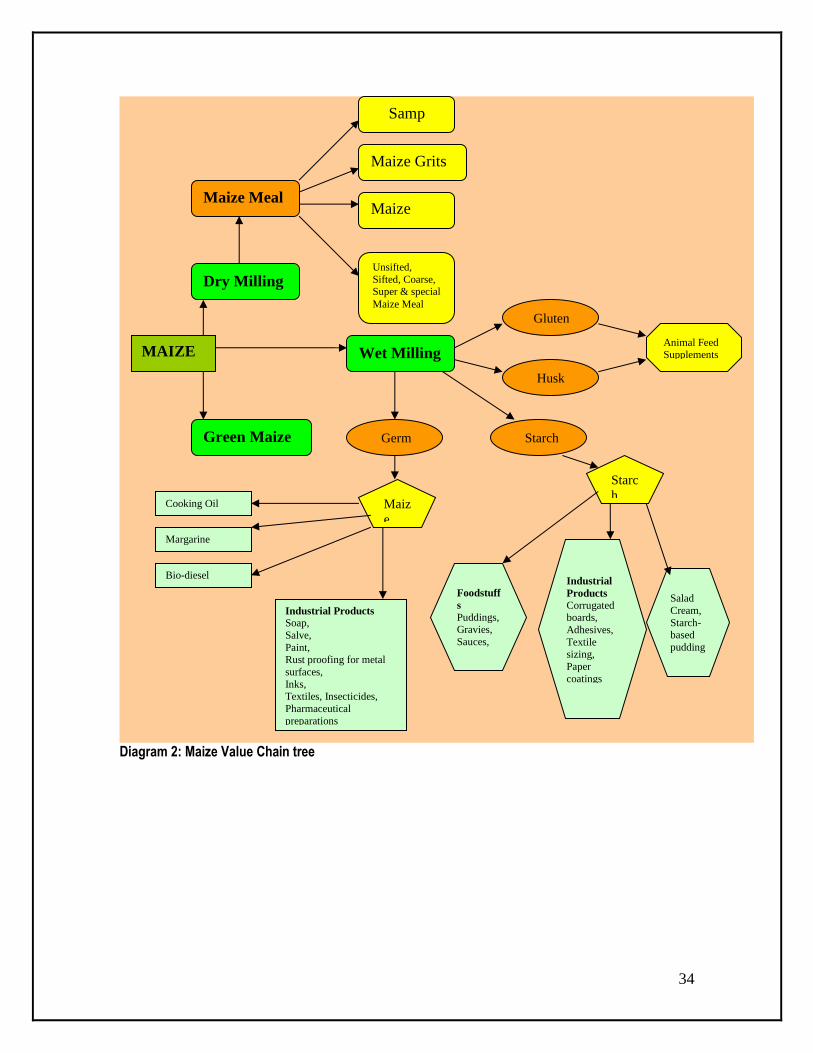
2.6 Maize Value Chain Tree
The following diagram (Diagram 2) represents the various products and by-products that can be derived from maize. Maize can be consumed as green maize or it can be milled. During the milling process the maize kernel is processed by two industries namely, the wet and dry milling industries. During the dry milling process the maize kernels are refined to maize meal and, the products that can be derived from this process are samp, maize grits, and maize rice, unsifted, sifted, coarse, super and special maize meal. Wet milling is a process that is carried out in water during which pure starch is obtained from maize. The kernel is separated into its components namely, the husk, starch, gluten and the germ. When the Starch from the wet milling process is heated in water, its amylase and amylo-pectin hydrates form a paste which allows food technologists to create foodstuffs such as puddings, gravies, sauces and pie fillings. The starch pastes from maize can be allowed to cool, thicken and congeal into a gel that provides starch-based puddings, salad creams and some adhesives. Industrial uses include paper coating and sizing, textile sizing, the manufacture of corrugated boards and adhesives. The germ and the gluten that are obtained from the wet milling process are used to manufacture maize oil and animal feed supplements. The maize oil can be used in cooking, where its high smoke point makes it valuable frying oil. It is also a key ingredient in some margarine. Maize oil is also used as one source of bio-diesel. Other industrial uses for maize oil include soap, salve, paint, rust proofing for metal surfaces, inks, textiles, and insecticides. It is sometimes used as a carrier for drug molecules in pharmaceutical preparations.
34
Diagram 2: Maize Value Chain tree
MAIZE
Dry Milling
Wet Milling
Green Maize
Maize Meal
Samp
Maize Grits
Maize
Rice
Unsifted,
Sifted, Coarse, Super & special
Maize Meal
Gluten
Husk
Starch Germ
Starc
h Maiz
e
Animal Feed Supplements
Foodstuff
s
Puddings, Gravies,
Sauces,
Pie
Industrial
Products
Corrugated boards,
Adhesives,
Textile sizing,
Paper
coatings
Salad
Cream,
Starch-based
pudding
s
Cooking Oil
Margarine
Bio-diesel
Industrial Products
Soap,
Salve,
Paint, Rust proofing for metal
surfaces,
Inks, Textiles, Insecticides,
Pharmaceutical
preparations
35
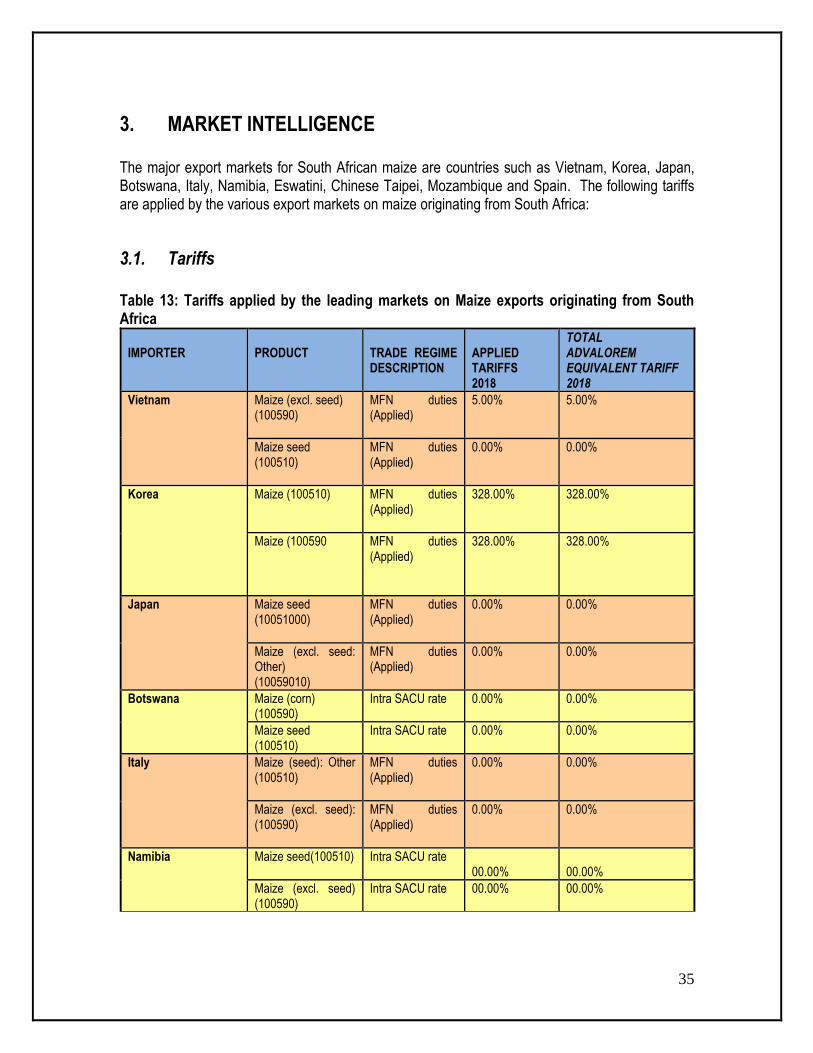
3. MARKET INTELLIGENCE The major export markets for South African maize are countries such as Vietnam, Korea, Japan, Botswana, Italy, Namibia, Eswatini, Chinese Taipei, Mozambique and Spain. The following tariffs are applied by the various export markets on maize originating from South Africa:
3.1. Tariffs
Table 13: Tariffs applied by the leading markets on Maize exports originating from South Africa
IMPORTER
PRODUCT
TRADE REGIME DESCRIPTION
APPLIED TARIFFS 2018
TOTAL ADVALOREM EQUIVALENT TARIFF 2018
Vietnam Maize (excl. seed) (100590)
MFN duties (Applied)
5.00% 5.00%
Maize seed (100510)
MFN duties (Applied)
0.00% 0.00%
Korea Maize (100510) MFN duties (Applied)
328.00%
328.00%
Maize (100590
MFN duties (Applied)
328.00%
328.00%
Japan Maize seed (10051000)
MFN duties (Applied)
0.00%
0.00%
Maize (excl. seed: Other) (10059010)
MFN duties (Applied)
0.00%
0.00%
Botswana Maize (corn) (100590)
Intra SACU rate
0.00% 0.00%
Maize seed (100510)
Intra SACU rate
0.00% 0.00%
Italy Maize (seed): Other (100510)
MFN duties (Applied)
0.00% 0.00%
Maize (excl. seed): (100590)
MFN duties (Applied)
0.00% 0.00%
Namibia Maize seed(100510) Intra SACU rate
00.00%
00.00%
Maize (excl. seed) (100590)
Intra SACU rate
00.00% 00.00%
36
IMPORTER
PRODUCT
TRADE REGIME DESCRIPTION
APPLIED TARIFFS 2018
TOTAL ADVALOREM EQUIVALENT TARIFF 2018
Eswatini Maize seed (100510)
Intra SACU rate
0.00%
0.00%
Maize (excl. seed) (100590)
Intra SACU rate
0.00% 0.00%
Chinese Taipei Maize: Seed (100510)
MFN duties (Applied)
0.00% 0.00%
Maize: Seed (100510)
MFN duties (Applied)
0.00% 0.00%
Spain Maize seed (100510)
MFN duties (Applied)
0.00% 0.000%
Maize (excl. seed) (100590)
MFN duties (Applied)
0.00%
0.00%
Source: ITC Market Access Map
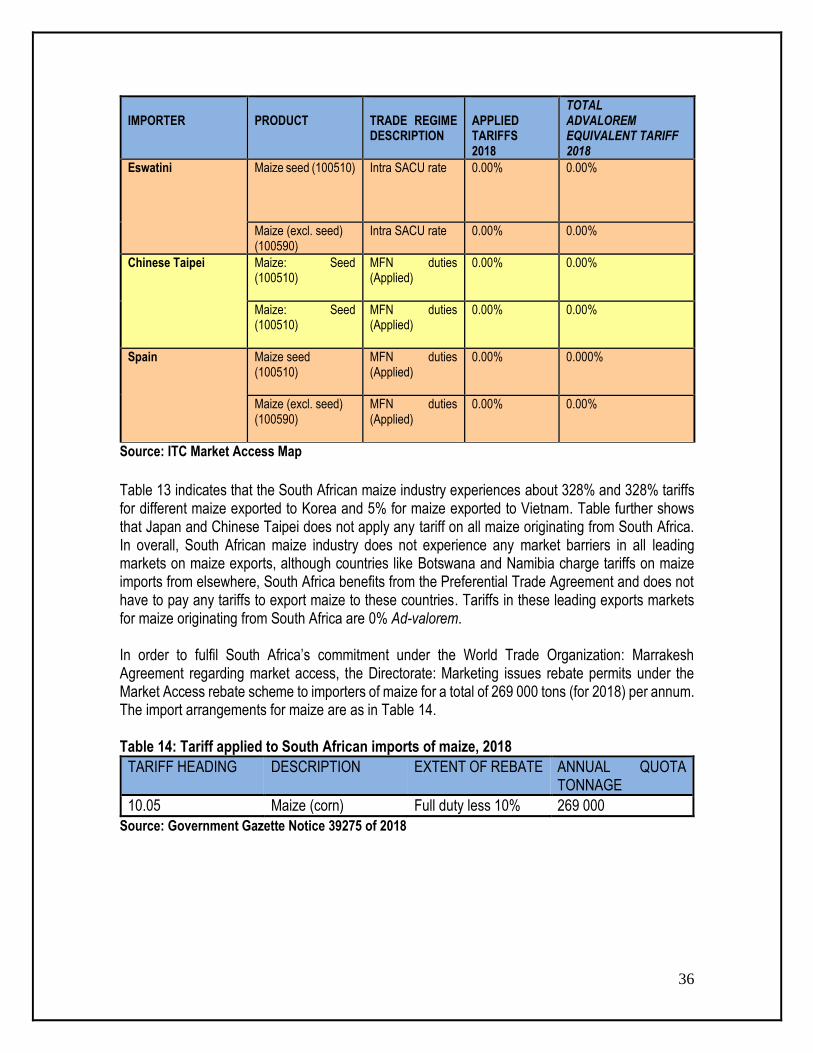
Table 13 indicates that the South African maize industry experiences about 328% and 328% tariffs for different maize exported to Korea and 5% for maize exported to Vietnam. Table further shows that Japan and Chinese Taipei does not apply any tariff on all maize originating from South Africa. In overall, South African maize industry does not experience any market barriers in all leading markets on maize exports, although countries like Botswana and Namibia charge tariffs on maize imports from elsewhere, South Africa benefits from the Preferential Trade Agreement and does not have to pay any tariffs to export maize to these countries. Tariffs in these leading exports markets for maize originating from South Africa are 0% Ad-valorem. In order to fulfil South Africa’s commitment under the World Trade Organization: Marrakesh Agreement regarding market access, the Directorate: Marketing issues rebate permits under the Market Access rebate scheme to importers of maize for a total of 269 000 tons (for 2018) per annum. The import arrangements for maize are as in Table 14. Table 14: Tariff applied to South African imports of maize, 2018
TARIFF HEADING DESCRIPTION EXTENT OF REBATE ANNUAL QUOTA TONNAGE
10.05 Maize (corn) Full duty less 10% 269 000
Source: Government Gazette Notice 39275 of 2018
37
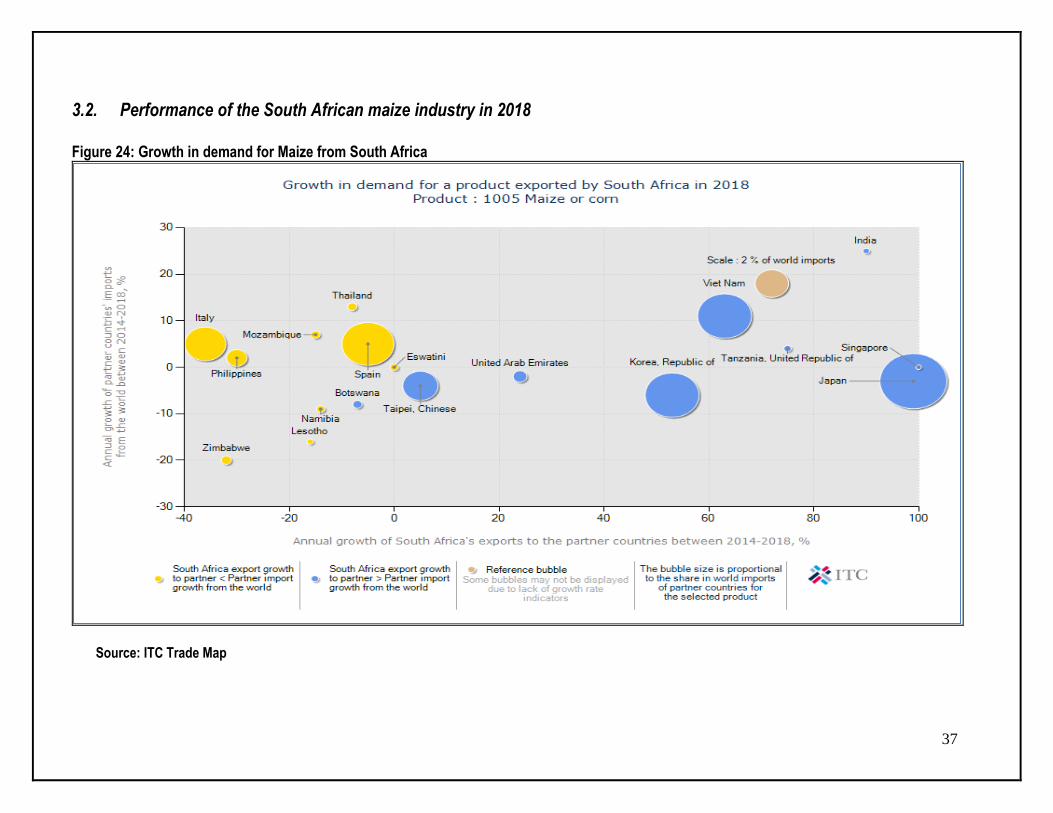
3.2. Performance of the South African maize industry in 2018
Figure 24: Growth in demand for Maize from South Africa
Source: ITC Trade Map
38
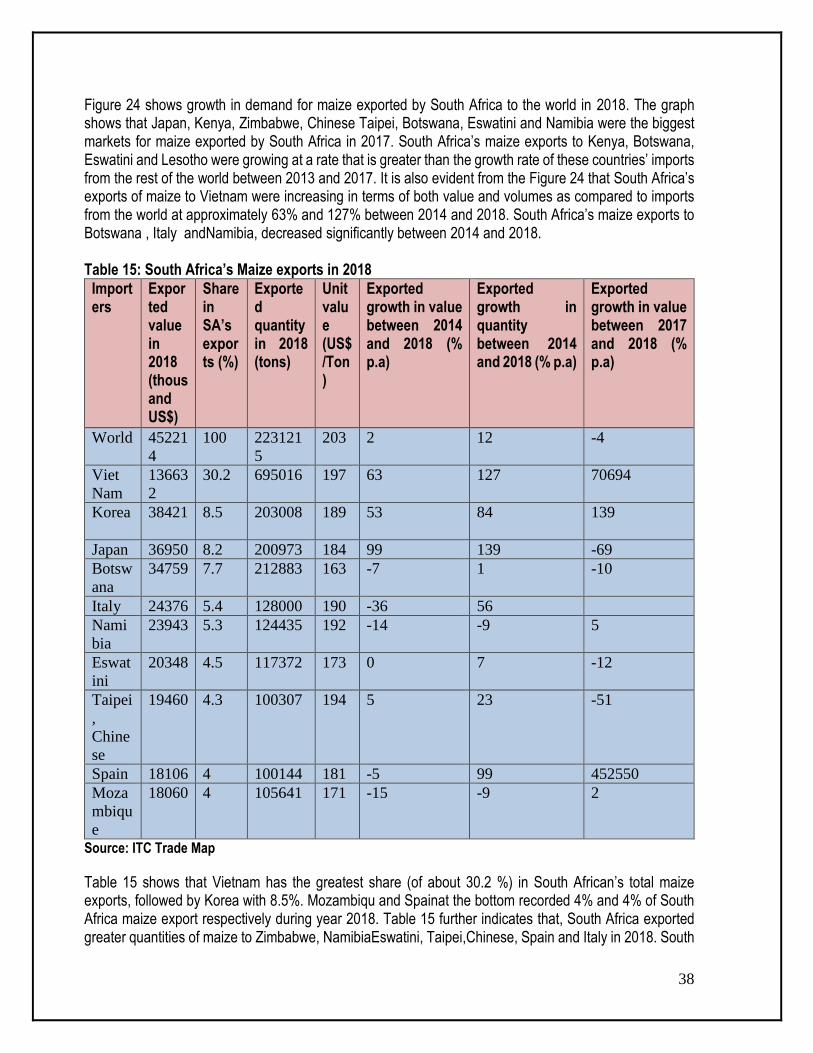
Figure 24 shows growth in demand for maize exported by South Africa to the world in 2018. The graph shows that Japan, Kenya, Zimbabwe, Chinese Taipei, Botswana, Eswatini and Namibia were the biggest markets for maize exported by South Africa in 2017. South Africa’s maize exports to Kenya, Botswana, Eswatini and Lesotho were growing at a rate that is greater than the growth rate of these countries’ imports from the rest of the world between 2013 and 2017. It is also evident from the Figure 24 that South Africa’s exports of maize to Vietnam were increasing in terms of both value and volumes as compared to imports from the world at approximately 63% and 127% between 2014 and 2018. South Africa’s maize exports to Botswana , Italy andNamibia, decreased significantly between 2014 and 2018. Table 15: South Africa’s Maize exports in 2018
Importers
Exported value in 2018 (thousand US$)
Share in SA’s exports (%)
Exported quantity in 2018 (tons)
Unit value (US$/Ton)
Exported growth in value between 2014 and 2018 (% p.a)
Exported growth in quantity between 2014 and 2018 (% p.a)
Exported growth in value between 2017 and 2018 (% p.a)
World 45221
4 100 223121
5 203 2 12 -4
Viet
Nam 13663
2 30.2 695016 197 63 127 70694
Korea
38421 8.5 203008 189 53 84 139
Japan 36950 8.2 200973 184 99 139 -69
Botsw
ana 34759 7.7 212883 163 -7 1 -10
Italy 24376 5.4 128000 190 -36 56
Nami
bia 23943 5.3 124435 192 -14 -9 5
Eswat
ini 20348 4.5 117372 173 0 7 -12
Taipei
,
Chine
se
19460 4.3 100307 194 5 23 -51
Spain 18106 4 100144 181 -5 99 452550
Moza
mbiqu
e
18060 4 105641 171 -15 -9 2
Source: ITC Trade Map
Table 15 shows that Vietnam has the greatest share (of about 30.2 %) in South African’s total maize exports, followed by Korea with 8.5%. Mozambiqu and Spainat the bottom recorded 4% and 4% of South Africa maize export respectively during year 2018. Table 15 further indicates that, South Africa exported greater quantities of maize to Zimbabwe, NamibiaEswatini, Taipei,Chinese, Spain and Italy in 2018. South
39
African maize exports to the world Increased by2% value terms over the period 2014to 2018. On the other hand, the value of maize exports from South Africa to the world decreased by 4% in between 2017 and 2018.

40
Figure 25: Prospects for market diversification for Maize exported by South Africa in 2018
Note: The area of the circles corresponds to the share in world imports of target markets for the selected products.
Source: ITC Trade Map

41
Figure 25 indicates prospects for market diversification for raw maize exported by South Africa to the world in 2018. The bubble graph illustrate that in world terms Japan, Kenya, Zimbabwe, Botswana, Chinese Taipei and Korea Republic were the biggest markets of maize from South Africa to the world over the period between 2014 and 2018. The figure further indicates that if South Africa has to diversify its markets of maize, small and attractive markets exist in Mozambique, Tanzania, Philippines, Lesotho and United Arab Emirates. Zimbabwe, Kenya and Botswana remain a traditional market for South Africa’s maize exports in 2018 because of the size of the bubble graph. Table 16: South Africa’s Maize imports during 2018
Exporters Imported value in 2018 (thousand US$)
Share in SA’s imports (%)
Imported quantity in 2018 (tons)
Unit value (US$/unit)
Imported growth in value between 2014 and 2018 (% p.a.)
Imported growth in quantity between 2014 and 2018 (% p.a.)
Imported growth in value between 2017 and 2018 (% p.a.)
World 43449 100 8737 4973 2 -39 -68
Chile 23644 54.4 3132 7549 145 113 44
United
States of
America
16560 38.1 2269 7298 30 60 -66
Zambia 1187 2.7 542 2190 -21 -37 -1
Malawi 1062 2.4 650 1634 251 28 2695
New
Zealand
246 0.6 38 6474 720
Australia 202 0.5 13 15538 106 -53 80
France 128 0.3 267 479 63 334 -51
Area Nes 116 0.3 576 201 0 0 0
Lesotho 108 0.2 554 195 73 90 83
Source: ITC Trade Map
Table 16 depicts the list of supplying markets for maize imported by South Africa from various countries in 2018. As shown in the table above, South Africa’s maize imports originated mainly from Chile, USA, Zambia, Malawi, New Zealand and Australia. It is clear from table 16 and figure 26, that Chile was the largest supplier of maize to South Africa during the year 2018 after accounting for about 54.4% of South Africa’s total maize imports during the same year. On average, imports of maize into South Africa from the world increased by 2% in value and decreased by 39% in quantity between the years 2014 and 2018. Furthermore, South Africa’s maize imports from the world decreased by 68%, in value terms, between the years 2017 and 2018. It is also important to note that South African imports growth in value between 2014 and 2018 was the highest in Malawi,
42
France, Chile and Australia, meanwhile a zero percent growth was recorded in Ukraine as well as United Arab Emirates.
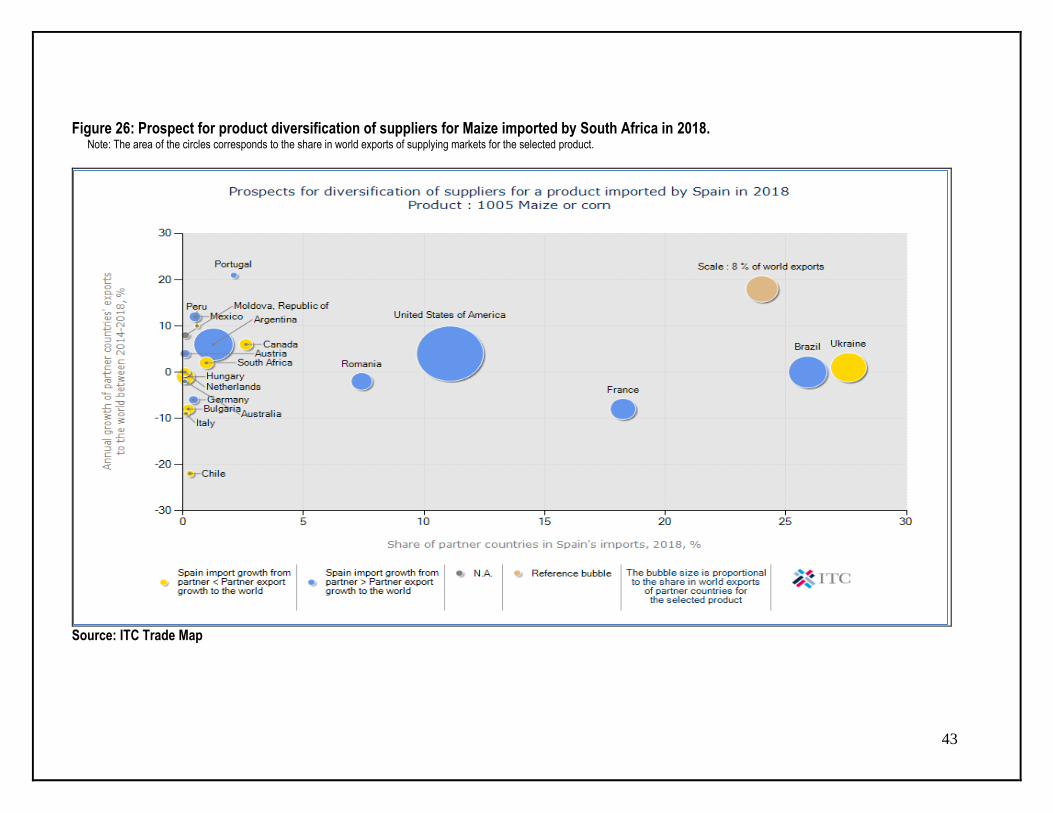
43
Figure 26: Prospect for product diversification of suppliers for Maize imported by South Africa in 2018. Note: The area of the circles corresponds to the share in world exports of supplying markets for the selected product.
Source: ITC Trade Map
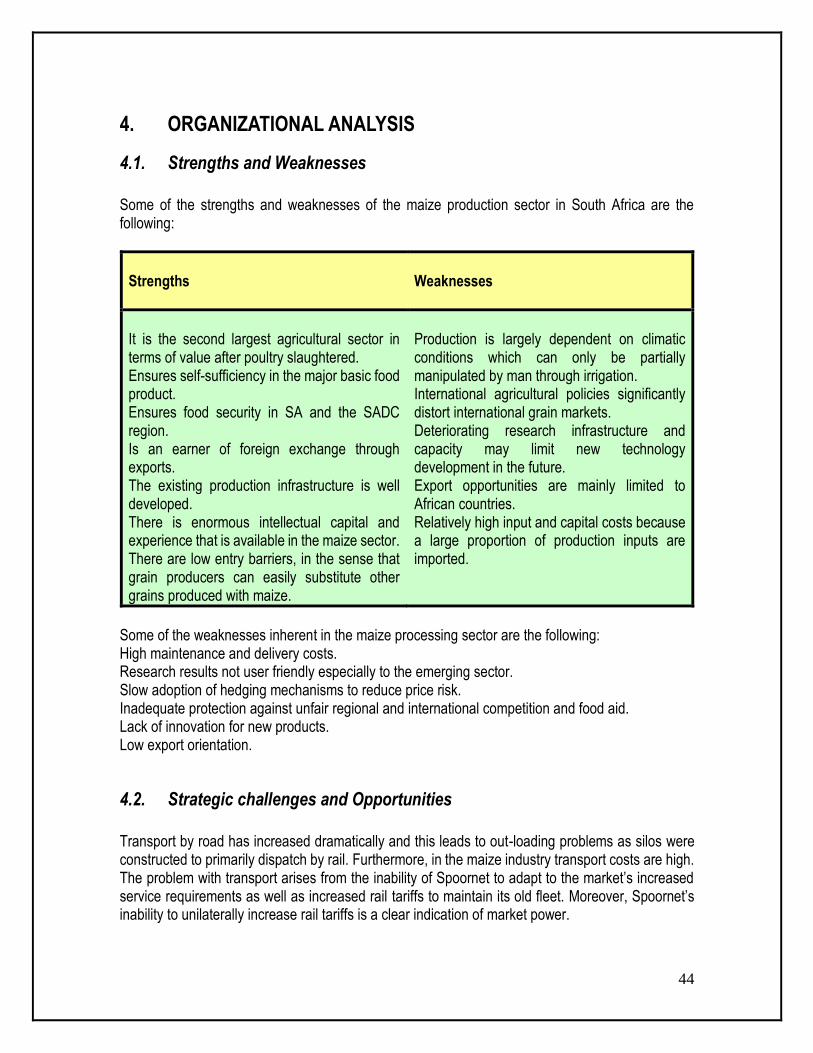
44
4. ORGANIZATIONAL ANALYSIS
4.1. Strengths and Weaknesses
Some of the strengths and weaknesses of the maize production sector in South Africa are the following:
Strengths
Weaknesses
It is the second largest agricultural sector in terms of value after poultry slaughtered. Ensures self-sufficiency in the major basic food product. Ensures food security in SA and the SADC region. Is an earner of foreign exchange through exports. The existing production infrastructure is well developed. There is enormous intellectual capital and experience that is available in the maize sector. There are low entry barriers, in the sense that grain producers can easily substitute other grains produced with maize.
Production is largely dependent on climatic conditions which can only be partially manipulated by man through irrigation. International agricultural policies significantly distort international grain markets. Deteriorating research infrastructure and capacity may limit new technology development in the future. Export opportunities are mainly limited to African countries. Relatively high input and capital costs because a large proportion of production inputs are imported.
Some of the weaknesses inherent in the maize processing sector are the following: High maintenance and delivery costs. Research results not user friendly especially to the emerging sector. Slow adoption of hedging mechanisms to reduce price risk. Inadequate protection against unfair regional and international competition and food aid. Lack of innovation for new products. Low export orientation.
4.2. Strategic challenges and Opportunities
Transport by road has increased dramatically and this leads to out-loading problems as silos were constructed to primarily dispatch by rail. Furthermore, in the maize industry transport costs are high. The problem with transport arises from the inability of Spoornet to adapt to the market’s increased service requirements as well as increased rail tariffs to maintain its old fleet. Moreover, Spoornet’s inability to unilaterally increase rail tariffs is a clear indication of market power.
45
It is expected that the demand for maize for animal feed will increase as the domestic poultry industry expands and, the domestic demand for maize may be increased by approximately 30% in the medium term if the production of bio-ethanol from maize is commenced. The importation of GMO maize is also threatening the domestic markets. According to the Competition Commission there is evidence of vertical integration in the South African maize market. Vertical integration occurs when a firm has interests in more than one level of the supply chain, linking producers, silos, traders and millers to final consumers. In SA there are dominant silo owners such as NWK, AFGRI and Senwes who in addition to supplying production inputs, also own trading companies as well as animal feed manufacturing companies.
5. EMPOWERMENT AND TRANSFORMATION ISSUES As mentioned above there are a significant number of maize producers in South Africa. As a result there is increased competition in the industry. Grain South Africa has established a Farmer Development Programme which aims to empower developing grain producers to become sustainable and commercial farmers. The programme helps the grain producers to establish study groups, arranging coordinated training during farmer’s days, training courses, and advising through telephones. The study groups are people with same interest to work together more effectively. Individual farmers are welcome to subscribe to Grain South Africa, or groups from 2 to 25 people may subscribe as group by registering their group with the organization. In terms of black economic empowerment in the milling industry, it is known that two companies namely, Foodcorp and Premier Foods have black empowerment companies as the majority shareholders.
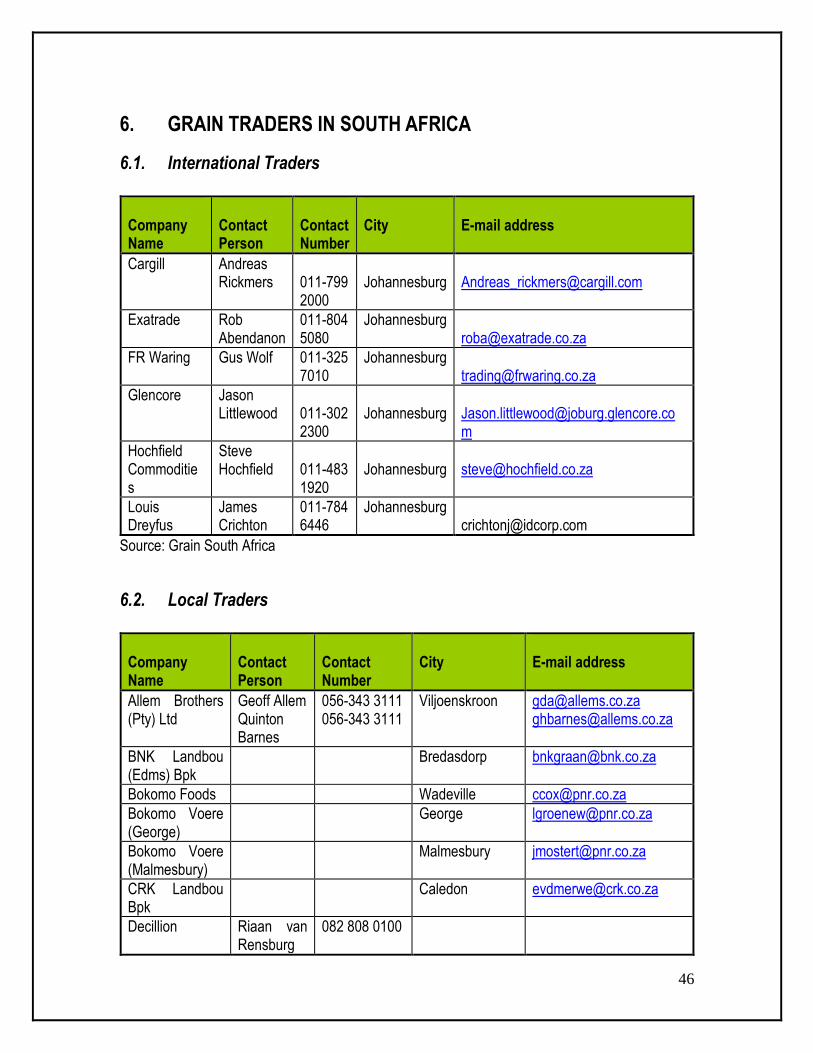
46
6. GRAIN TRADERS IN SOUTH AFRICA
6.1. International Traders
Company Name
Contact Person
Contact Number
City
E-mail address
Cargill Andreas Rickmers
011-799 2000
Johannesburg
Exatrade Rob Abendanon
011-804 5080
Johannesburg [email protected]
FR Waring Gus Wolf 011-325 7010
Johannesburg [email protected]
Glencore Jason Littlewood
011-302 2300
Johannesburg
Hochfield Commodities
Steve Hochfield
011-483 1920
Johannesburg
Louis Dreyfus
James Crichton
011-784 6446
Johannesburg [email protected]
Source: Grain South Africa
6.2. Local Traders
Company Name
Contact Person
Contact Number
City
E-mail address
Allem Brothers (Pty) Ltd
Geoff Allem Quinton Barnes
056-343 3111 056-343 3111
Viljoenskroon [email protected] [email protected]
BNK Landbou (Edms) Bpk
Bredasdorp [email protected]
Bokomo Foods Wadeville [email protected]
Bokomo Voere (George)
George [email protected]
Bokomo Voere (Malmesbury)
Malmesbury [email protected]
CRK Landbou Bpk
Caledon [email protected]
Decillion Riaan van Rensburg
082 808 0100
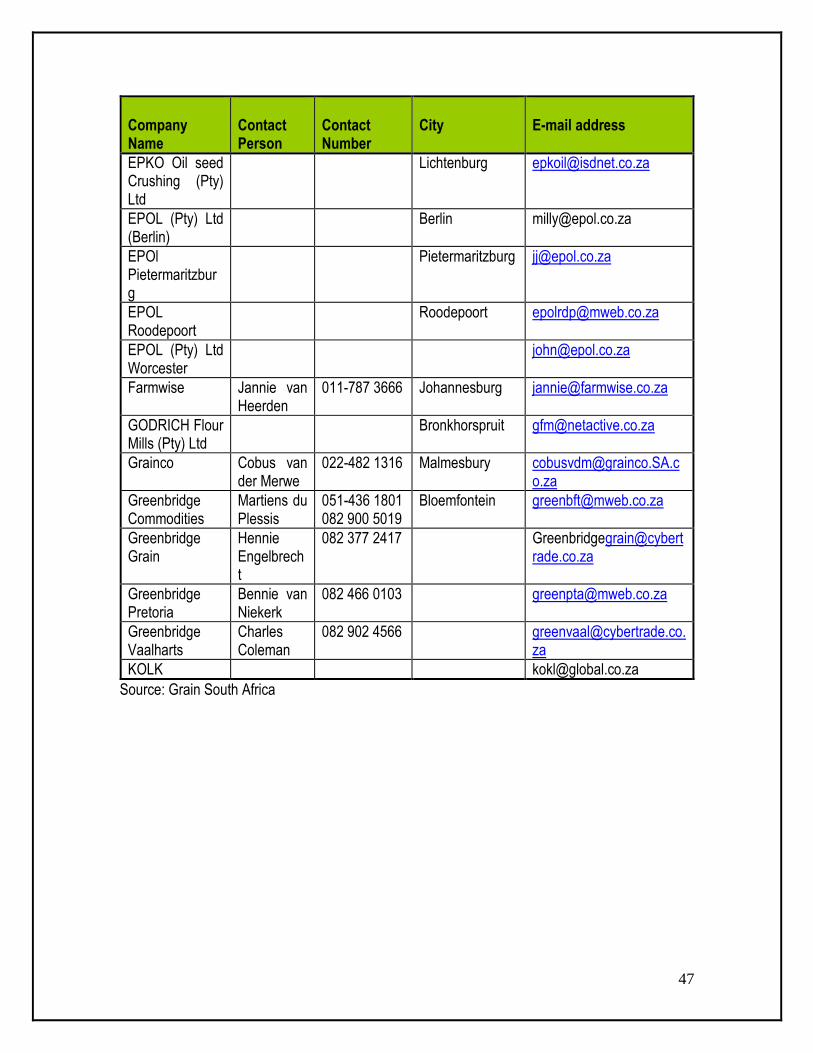
47
Company Name
Contact Person
Contact Number
City
E-mail address
EPKO Oil seed Crushing (Pty) Ltd
Lichtenburg [email protected]
EPOL (Pty) Ltd (Berlin)
Berlin [email protected]
EPOl Pietermaritzburg
Pietermaritzburg [email protected]
EPOL Roodepoort
Roodepoort [email protected]
EPOL (Pty) Ltd Worcester
Farmwise Jannie van Heerden
011-787 3666 Johannesburg [email protected]
GODRICH Flour Mills (Pty) Ltd
Bronkhorspruit [email protected]
Grainco Cobus van der Merwe
022-482 1316 Malmesbury [email protected]
Greenbridge Commodities
Martiens du Plessis
051-436 1801 082 900 5019
Bloemfontein [email protected]
Greenbridge Grain
Hennie Engelbrecht
082 377 2417 [email protected]
Greenbridge Pretoria
Bennie van Niekerk
082 466 0103 [email protected]
Greenbridge Vaalharts
Charles Coleman
082 902 4566 [email protected]
KOLK [email protected]
Source: Grain South Africa

48
7. ACKNOWLEDGEMENTS The following organizations are acknowledged: Grain South Africa Tel: (056) 515 0918 Fax: (056) 515 1517 www.grainsa.co.za National Chamber of Milling P.O. Box 7262 Centurion 0046 Tel: (012) 663 1660 Fax: (012) 663 3109 www.grainmilling.org.za South African Grain Information System Tel: (012) 523 1400 Fax: (012) 349 9200 www.sagis.org.za Grain Silo Industry Tel: (012) 348 3044 Tel: (012) 348 2980 [email protected] Statistics & Economic Analysis: Department of Agriculture, Forestry & Fisheries Tel: (012) 319 8453 Fax: (012) 319 8031 www.daff.gov.za Competition Commission of South Africa Private Bag X 23 Lynwood Ridge 0040 Tel: 012 394 3200 Website: www.compcom.co.za Quantec Research P.O.Box 35466 Menlo Park Pretoria 0102
49
Tel: 012 361 5154 Fax: 012 348 5874 Website: www.quantec.co.za ITC Market Access Map Website: http://www.macmap.org/South Africa ITC Trade Map Website: http://www.trademap.org Disclaimer: This document and its contents have been compiled by the Department of Agriculture, Forestry and Fisheries for the purpose of detailing the maize industry. Anyone who uses the information as contained in this document does so at his/her own risk. The views expressed in this document are those of the Department of Agriculture, Forestry and Fisheries with regard to the industry, unless otherwise stated. The Department of Agriculture, Forestry and Fisheries therefore accepts no liability that can be incurred resulting from the use of this information.