a probabilistic seismic loss assessment of advanced · pdf filea probabilistic seismic loss...
TRANSCRIPT

Paper Number 30
A Probabilistic Seismic Loss Assessment of Advanced
Post-Tensioned Precast Bridge Systems
2009 NZSEE Conference
D.J. Marriott, S. Pampanin & D. Bull
University of Canterbury, Christchurch, New Zealand.
A. Palermo
Technical University of Milan, Italy.
ABSTRACT: Post-tensioned precast rocking systems have emerged as the next
generation seismic resisting systems; however, they are not yet widely accepted and are
seldom considered in practice, particularly for bridge systems, due to a combination of
lack of understanding and the fallacy that such a system may not be cost effective when
compared to traditional monolithic or emulation of cast-in-place construction.
The results of a seismic loss assessment confirm that a traditional hybrid bridge system
provides a significant financial benefit when compared to a monolithic precast system.
Reasons for this relate to the reduced level of physical damage at each structural limit
state and a greater displacement capacity for post-tensioned bridge piers. When
combining viscous and hysteretic dampers within a post-tensioned bridge system
(defining an advanced flag-shape system) a superior level of protection can be achieved
for either far-field or near-field earthquake events. However, the initial cost of installing
fluid viscous dampers (based on current market costs) can undermine the potential
financial benefit of such a system.
1 INTRODUCTION
This paper examines the performance of three post-tensioned (PT) reinforced concrete (RC) case study
bridges and compares them to a conventional monolithic bridge. The four bridges are identical in
terms of geometry and design objectives; however, they differ in terms of lateral capacity and
mechanical damping. A seismic loss assessment is carried out for each bridge. The seismic loss
assessment provides a means of directly comparing the performance of each system in terms of
Expected Annual Loss (EAL) and the annual frequency of exceeding a specified level of loss (loss-
hazard).
This paper first introduces the prototype bridge systems and then provides a brief overview of seismic
loss assessment, concluding with the results of the analysis.
2 PROTOTYPE BRIDGE
A symmetric, six-span, reinforced concrete prototype bridge is illustrated in Figure 1. The bridge is
symmetric about pier 3 with internal spans of 50m and end spans of 40m. A segmented, precast
concrete box girder deck system is seated on bearings located on top of the cap beam and abutments.
Each pier and abutment is founded on shallow soil (NZS1170.5 [2004] soil category C) with piled
foundations to the bedrock. Dimensions of the box girder deck and pier assembly are illustrated in
Figure 2.
One ductile monolithic bridge and three post-tensioned hybrid equivalents are investigated. To aid in a
direct comparison, each bridge is identical in geometry (pier heights and cross-section dimensions in
Figure 2). Three variations of a post-tensioned, rocking bridge system are considered.
Bridge 1. A precast (or an emulation of cast in-situ) bridge with monolithic ductile flexural hinging at
the base of the piers, designed to satisfy the requirements of NZS3101 [2006]. This ductile system is
termed benchmark monolithic.

2
Bridge 2. A precast bridge with post-tensioned rocking piers and internally grouted mild steel
reinforcement. This system represents a traditional hybrid, post-tensioned solution. This system is
termed hybrid.
Bridge 3. A precast bridge with post-tensioned rocking piers, internally grouted mild steel
reinforcement and externally mounted non-linear fluid viscous dampers (FVD). This hybrid bridge is
termed the Advanced Flag-Shape 1 Bridge (AFS1), after Kam et al. [2007].
Bridge 4. A precast bridge with post-tensioned rocking piers, externally mounted mild steel Tension-
Compression-Yielding (TCY) dampers and externally mounted non-linear Fluid-Viscous Dampers
(FVD). This hybrid bridge is termed the Advanced Flag-Shape 2 Bridge (AFS2).
Each bridge system is designed according to a Direct Displacement-Based Design (DDBD)
methodology (Priestley et al. [2007]). The design of the two AFS bridge systems follows a viscous-
extension to DDBD developed as part of the research carried out at the University of Canterbury.
Further details of the viscous-DDBD can be found in a publication by Marriott [2009].
Figure 1 Longitudinal elevation of the prototype bridge – symmetric about pier 3.
Figure 2 Geometry of the bridge piers and precast box girder bridge deck.
3 LOSS ASSESSMENT WITHIN A PERFORMANCE-BASED SEISMIC ASSESSMENT
FRAMEWORK
Seismic risk, quantified in the form of economic measures, is a conceptually simple way of expressing
liability (financial) to a client (or stakeholder) based on the expected performance of a particular
structure throughout its operating life. The assessment is based on the anticipated seismic hazard
(ground motion) and structural response. The structural performance (maximum displacements and/or
accelerations) is related to damage and converted to monetary loss.
While the detailed theory behind performance-based seismic loss assessment is outside the scope of
this paper, the key tasks involved are illustrated in Figure 3 and briefly discussed below. Further
details can be found in the following publications: Cornell and Krawinkler [2000]; Vamvatsikos and
Cornell [2002]; Deierlein et al. [2003]; Aslani [2005]; Zareian and Krawinkler [2007].
3
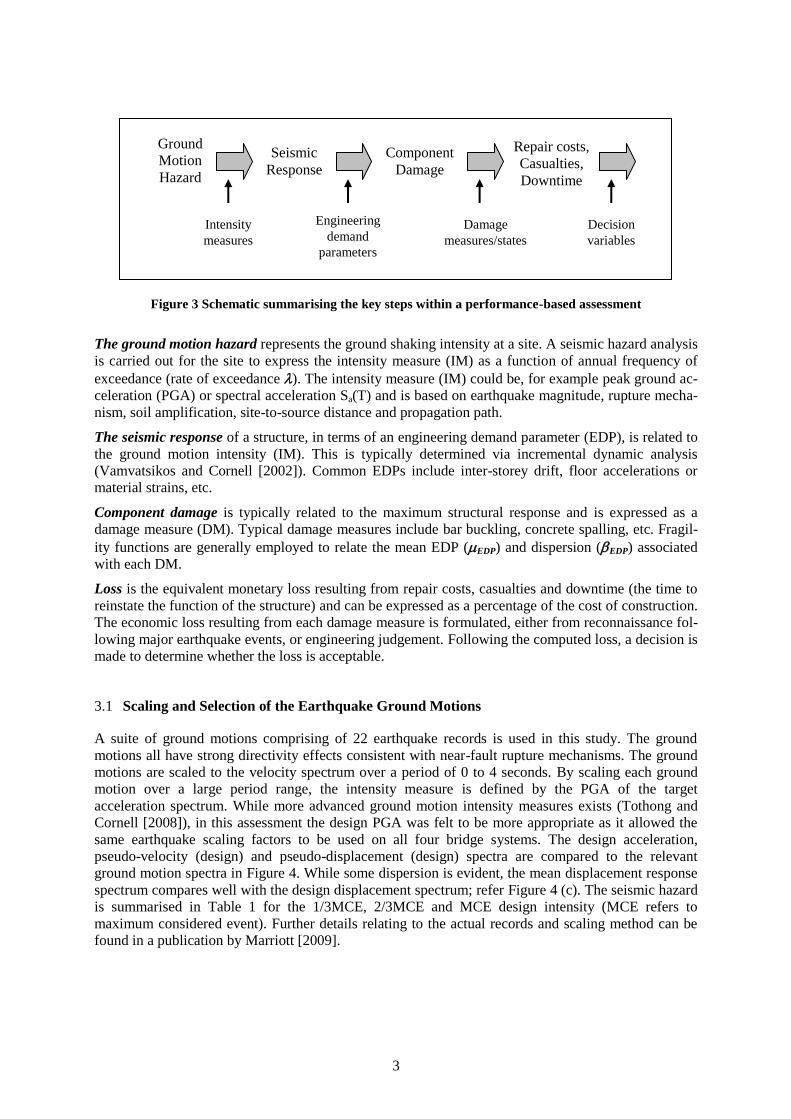
Figure 3 Schematic summarising the key steps within a performance-based assessment
The ground motion hazard represents the ground shaking intensity at a site. A seismic hazard analysis
is carried out for the site to express the intensity measure (IM) as a function of annual frequency of
exceedance (rate of exceedance ). The intensity measure (IM) could be, for example peak ground ac-
celeration (PGA) or spectral acceleration Sa(T) and is based on earthquake magnitude, rupture mecha-
nism, soil amplification, site-to-source distance and propagation path.
The seismic response of a structure, in terms of an engineering demand parameter (EDP), is related to
the ground motion intensity (IM). This is typically determined via incremental dynamic analysis
(Vamvatsikos and Cornell [2002]). Common EDPs include inter-storey drift, floor accelerations or
material strains, etc.
Component damage is typically related to the maximum structural response and is expressed as a
damage measure (DM). Typical damage measures include bar buckling, concrete spalling, etc. Fragil-
ity functions are generally employed to relate the mean EDP (EDP) and dispersion (EDP) associated
with each DM.
Loss is the equivalent monetary loss resulting from repair costs, casualties and downtime (the time to
reinstate the function of the structure) and can be expressed as a percentage of the cost of construction.
The economic loss resulting from each damage measure is formulated, either from reconnaissance fol-
lowing major earthquake events, or engineering judgement. Following the computed loss, a decision is
made to determine whether the loss is acceptable.
3.1 Scaling and Selection of the Earthquake Ground Motions
A suite of ground motions comprising of 22 earthquake records is used in this study. The ground
motions all have strong directivity effects consistent with near-fault rupture mechanisms. The ground
motions are scaled to the velocity spectrum over a period of 0 to 4 seconds. By scaling each ground
motion over a large period range, the intensity measure is defined by the PGA of the target
acceleration spectrum. While more advanced ground motion intensity measures exists (Tothong and
Cornell [2008]), in this assessment the design PGA was felt to be more appropriate as it allowed the
same earthquake scaling factors to be used on all four bridge systems. The design acceleration,
pseudo-velocity (design) and pseudo-displacement (design) spectra are compared to the relevant
ground motion spectra in Figure 4. While some dispersion is evident, the mean displacement response
spectrum compares well with the design displacement spectrum; refer Figure 4 (c). The seismic hazard
is summarised in Table 1 for the 1/3MCE, 2/3MCE and MCE design intensity (MCE refers to
maximum considered event). Further details relating to the actual records and scaling method can be
found in a publication by Marriott [2009].
Ground
Motion
Hazard
Seismic
Response
Component
Damage
Repair costs,
Casualties,
Downtime
Intensity
measures
Engineering
demand
parameters
Damage
measures/states
Decision
variables

4
Figure 4 Scaled earthquake response spectra (5% damped) and the elastic design spectrum
Table 1 Probability of exceedance and PGA for bridge design according to TransitNZ [2003]
1/3 MCE 2/3MCE MCE
Return period (100year working life)1 410 yrs 2500 yrs 7296 yrs
Probability of exceedance in 100 years 21.7% 3.9% 1.4%
Equivalent NZS1170.5 return period
factor for a 50 year working life, Ru 0.703 1.405 2.108
Design PGA3 0.374g 0.747g 1.121g
1 Following TransitNZ [2003]
3.2 Damage States and Structural Limit States of Post-Tensioned Bridge Piers
Six structural performance limit states specific to a post-tensioned hybrid bridge pier are illustrated in
Figure 5 from the elastic limit state to the collapse state. These performance limits correspond to
specific material limit states within the connection. Table 2 lists five Damage States (DS), which lie
within the structural (performance) limit states illustrated in Figure 5. The individual material strain
limit states and performance objectives are also listed in Table 2.
Figure 5 Structural performance limit states and performance objectives for a post-tensioned pier
Each DS in Table 2 is also associated with a mean loss ratio (loss expressed as a percentage of the cost
to construct the monolithic benchmark bridge system), representing the cost of repair. The mean loss
ratio at each damage state is specific to each bridge system (monolithic ductile or post-tensioned). A
post-tensioned system is expected to have a reduction in damage when compared to a monolithic
ductile section under the same damage state: this is reflected in the loss-ratio at each damage state.
Table 3 summarises the loss ratios for each of the four bridges. Because each damage state is

5
associated with a number of material limit states, the monolithic ductile pier is associated with the
largest repair cost. Damage to the cover concrete can be prevented by steel armouring at the rocking
toe of a post-tensioned bridge pier. Furthermore, if the mild steel within a post-tensioned system
ruptures, a significant contribution of lateral resistance is provided by the post-tensioned tendons,
hence the cost to reinstate the lost strength reduces. Loss ratios are very subjective as they are case and
scenario specific and are dependant on many structural, economic and geographical factors.
Furthermore, these loss ratios do not consider loss associated with downtime as it is difficult to
quantify. Downtime is the economic loss resulting from loss of function during the time of repair/re-
construction. In fact, Krawinkler and Miranda [2004] noted “…even if downtime could be quantified
with confidence, the associated losses will be highly uncertain and strongly case and scenario
specific”.
Table 2 Damage states and loss ratios for a hybrid post-tensioned bridge system
Damage
state Local pier damage
Material
Strain
Structural
limit state
Performance
objectives
Mean loss
ratio (LR)
DS1:
None Pre-yield
c = 0.002
s = y Elastic limit - -
DS2:
Minor
Spalling negligible with limited yielding
of reinforcement. Crack controlled due to
post-tensioning.
c = 0.004
s = 0.015 Nominal yield
Immediate
occupancy 0.01
DS3:
Minor
Spalling minimal if cover concrete is
protected and relatively localised if
unprotected.
c = c,dc
s = 0.6su
pt = 0.9pt,y
Design limit Damage
control
0.02 (protected)
0.03
(unprotected)1
DS4:
Moderate
Spalling minimal if cover concrete is
protected, extensive localised spalling if
unprotected. Extensive elongation of
longitudinal and/or transverse
reinforcement. Reduction in tendon
force.
c = 1.5c,dc
s = 0.9su
pt = 0.9ptu
Ultimate limit Collapse
prevention
0.08 (governed
by steel strain)
0.20 (governed
by concrete
strain)
DS5:
Collapse
Rupture of transverse reinforcement,
failure of core concrete, rupture of
tendons
c > 1.5c,dc
s > su
pt > ptu
Collapse
Not
considered for
design
1.0
1 “Protected” refers to protection of the rocking toe region such as cast-in steel angles (or polymer confinement wrapping),
fibre reinforced concrete etc. “Unprotected” refers to unconfined cover concrete.
Table 3 Loss ratios at each damage state (DS1 to DS5) for each of the prototype bridges
Monolithic Hybrid (traditional)1 Hybrid (AFS1)
1 Hybrid (AFS2)
1
DS1 None - None - None - None -
DS2 Minor 0.03 Minor 0.01 Minor 0.01 Minor 0.01
DS3 Moderate 0.08 Minor 0.02/0.03 Minor 0.02/0.03 Minor 0.02/0.03
DS4 Extensive 0.25 Moderate 0.08/0.20 Moderate 0.07/0.20 Moderate 0.05/0.20
DS5 Collapse 1.0 Collapse 1.0 Collapse 1.0 Collapse 1.0
1 Two loss ratios are indicated depending on the level of protection to the cover concrete adopted as per Table 2.
4 CONSTRUCTION DETAILS OF THE BRIDGE SYSTEMS
A summary of each pier system is illustrated in Figure 8 showing the general layout of the pier and the
reinforcement details. It should be recognised that the precast reinforcement within the post-tensioned
piers, which is identical to that of the ductile pier, does not pass the rocking interface. Also listed in
the table of Figure 8 is the additional cost of construction, over and above the benchmark bridge
system, for each pier. The additional cost to construct the post-tensioned piers includes post-tensioning
(including materials and stressing operations), fluid viscous dampers (FVDs) and an additional
allowance (“misc”) for damper connections and special detailing of the rocking toe region. While the
6
current market costs of the FVDs1,2
add a considerable amount to the construction cost of the AFS
bridges, a reduction in the amount of post-tensioning is possible within each pier element. In Figure 8,
four structural limit state displacements are listed for each pier from the elastic to collapse limit state.
The displacement capacity of each post-tensioned bridge pier is significantly greater than the
corresponding ductile monolithic bridge pier. For comparison purposes, the design of each bridge
system targets a common design displacement at the 2/3MCE design intensity. That is, the system
design displacement was defined by a lateral drift ratio for pier 1&5 equal to 3.65% for all four
bridges.
5 RESULTS OF THE SEISMIC LOSS ASSESSMENT
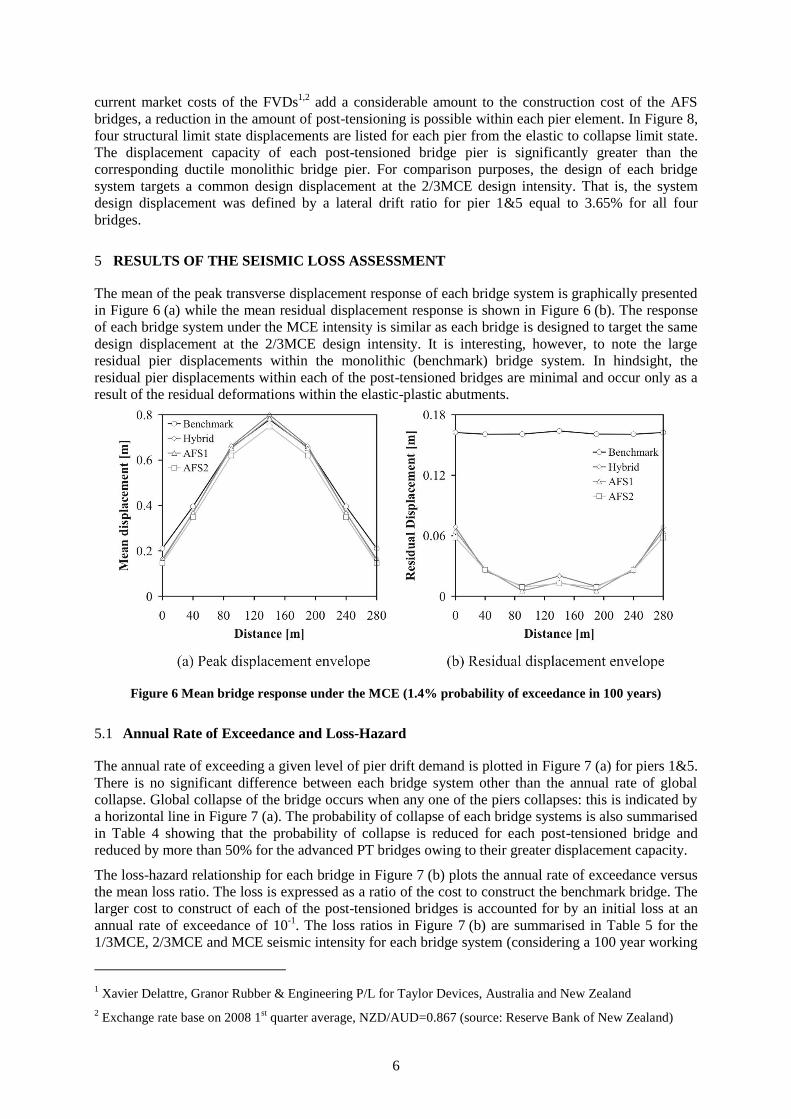
The mean of the peak transverse displacement response of each bridge system is graphically presented
in Figure 6 (a) while the mean residual displacement response is shown in Figure 6 (b). The response
of each bridge system under the MCE intensity is similar as each bridge is designed to target the same
design displacement at the 2/3MCE design intensity. It is interesting, however, to note the large
residual pier displacements within the monolithic (benchmark) bridge system. In hindsight, the
residual pier displacements within each of the post-tensioned bridges are minimal and occur only as a
result of the residual deformations within the elastic-plastic abutments.
Figure 6 Mean bridge response under the MCE (1.4% probability of exceedance in 100 years)
5.1 Annual Rate of Exceedance and Loss-Hazard
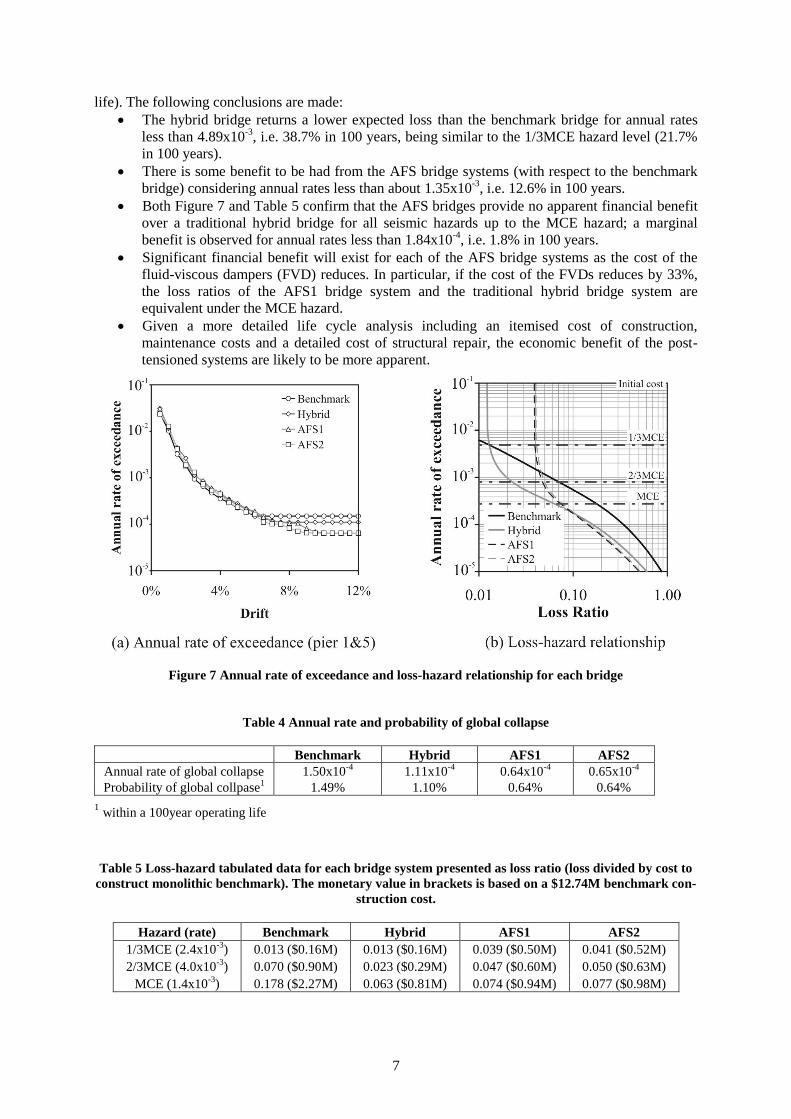
The annual rate of exceeding a given level of pier drift demand is plotted in Figure 7 (a) for piers 1&5.
There is no significant difference between each bridge system other than the annual rate of global
collapse. Global collapse of the bridge occurs when any one of the piers collapses: this is indicated by
a horizontal line in Figure 7 (a). The probability of collapse of each bridge systems is also summarised
in Table 4 showing that the probability of collapse is reduced for each post-tensioned bridge and
reduced by more than 50% for the advanced PT bridges owing to their greater displacement capacity.
The loss-hazard relationship for each bridge in Figure 7 (b) plots the annual rate of exceedance versus
the mean loss ratio. The loss is expressed as a ratio of the cost to construct the benchmark bridge. The
larger cost to construct of each of the post-tensioned bridges is accounted for by an initial loss at an
annual rate of exceedance of 10-1
. The loss ratios in Figure 7 (b) are summarised in Table 5 for the
1/3MCE, 2/3MCE and MCE seismic intensity for each bridge system (considering a 100 year working
1 Xavier Delattre, Granor Rubber & Engineering P/L for Taylor Devices, Australia and New Zealand
2 Exchange rate base on 2008 1
st quarter average, NZD/AUD=0.867 (source: Reserve Bank of New Zealand)
7
life). The following conclusions are made:
The hybrid bridge returns a lower expected loss than the benchmark bridge for annual rates
less than 4.89x10⁻³
, i.e. 38.7% in 100 years, being similar to the 1/3MCE hazard level (21.7%
in 100 years).
There is some benefit to be had from the AFS bridge systems (with respect to the benchmark
bridge) considering annual rates less than about 1.35x10⁻³
, i.e. 12.6% in 100 years.
Both Figure 7 and Table 5 confirm that the AFS bridges provide no apparent financial benefit
over a traditional hybrid bridge for all seismic hazards up to the MCE hazard; a marginal
benefit is observed for annual rates less than 1.84x10⁻⁴
, i.e. 1.8% in 100 years.
Significant financial benefit will exist for each of the AFS bridge systems as the cost of the
fluid-viscous dampers (FVD) reduces. In particular, if the cost of the FVDs reduces by 33%,
the loss ratios of the AFS1 bridge system and the traditional hybrid bridge system are
equivalent under the MCE hazard.
Given a more detailed life cycle analysis including an itemised cost of construction,
maintenance costs and a detailed cost of structural repair, the economic benefit of the post-
tensioned systems are likely to be more apparent.
Figure 7 Annual rate of exceedance and loss-hazard relationship for each bridge
Table 4 Annual rate and probability of global collapse
Benchmark Hybrid AFS1 AFS2
Annual rate of global collapse 1.50x10⁻⁴
1.11x10⁻⁴
0.64x10⁻⁴
0.65x10⁻⁴
Probability of global collpase1 1.49% 1.10% 0.64% 0.64%
1 within a 100year operating life
Table 5 Loss-hazard tabulated data for each bridge system presented as loss ratio (loss divided by cost to
construct monolithic benchmark). The monetary value in brackets is based on a $12.74M benchmark con-
struction cost.
Hazard (rate) Benchmark Hybrid AFS1 AFS2
1/3MCE (2.4x10⁻³
) 0.013 ($0.16M) 0.013 ($0.16M) 0.039 ($0.50M) 0.041 ($0.52M)
2/3MCE (4.0x10⁻³
) 0.070 ($0.90M) 0.023 ($0.29M) 0.047 ($0.60M) 0.050 ($0.63M)
MCE (1.4x10⁻³
) 0.178 ($2.27M) 0.063 ($0.81M) 0.074 ($0.94M) 0.077 ($0.98M)

8
Fig
ure
8 B
rid
ge
pie
r co
nfi
gu
rati
on
, se
cti
on
det
ail
s, r
ein
forc
emen
t co
nte
nt,
co
stin
g a
nd
per
form
an
ce l
imit
sta
tes

9
5.2 Expected annual loss
Integration of the loss-hazard curve in Figure 7 (b) defines the Expected Annual Loss (EAL). The
EAL considers the loss associated with each point on the loss-hazard curve and is the summation of
loss multiplied by the probability of that loss occurring in one year (annual rate of occurrence). The
EAL of each bridge is summarised in Table 6. It is expressed as a loss ratio (with respect to the
benchmark construction cost), where the monetary value in brackets expresses the loss based on a
$12.74M asset value. There is a significant reduction in the EAL for each of the post-tensioned bridges
due to a greater displacement capacity and the reduction in loss associated with each damage state. It
is more interesting to study the disaggregated EAL by PGA intensity in Figure 9 (b). A majority of
loss for the benchmark bridge is associated with the frequent events; that is, events having a lower
intensity but occurring more often. A majority of the loss for each of the post-tensioned bridges is
associated with the intensive, very rare events, causing significant structural damage and/or collapse.
By mitigating the damage associated with low-moderate seismic hazard (which occur more
frequently), the EAL for each of the post-tensioned systems is significantly reduced.
The EAL can be forecasted over the intended operating life of the structure accounting for the time
value of money (discount rate of 6% used) in Figure 9 (a). L in Figure 9 (a) represents the maximum
difference between the initial cost of the benchmark bridge and the post-tensioned bridges before the
bridge in question becomes uneconomical (strictly from an EAL point of view). Considering the
hybrid bridge, L = 0.64%; if the cost to construct the hybrid bridge is greater than 0.64% of the cost
to construct the benchmark bridge, the hybrid bridge is not a feasible option. This issue is further
exasperated for the AFS bridges having an even larger initial cost associated with the installation of
fluid-viscous dampers. However, in light of these conclusions, individual stakeholders are less
concerned with the EAL as being a primary measure of loss. With reference to the loss-hazard curve in
Figure 7 (b), for almost any event, the loss far exceeds the computed EAL. This is the high-
consequence-low-probability nature of seismic risk. In such situations, decision makers are generally
risk averse and consult other forms of financial risk tools over and above the EAL computation such
as the loss-hazard relationship in Figure 7 (b).
Figure 9 Expected annual loss and disaggregation into PGA intensity
Table 6 Expected annual loss: comparison between four bridge systems
EAL
Benchmark, monolithic bridge 0.049% ($6263)
Post-tensioned hybrid 0.018% ($2254)
Post-tensioned AFS1 0.011% ($1406)
Post-tensioned AFS2 0.012% ($1555)

10
6 CONCLUSIONS
A seismic loss assessment was carried out for three post-tensioned bridges and one ductile benchmark
bridge to investigate the feasibility of a traditional post-tensioned hybrid bridge system and two
advanced hybrid bridge systems (AFS) with fluid-viscous dampers. Considering the loss-hazard
relationship, all three PT bridges returned a lower loss than the benchmark monolithic bridge system.
No apparent reduction in loss was observed for the advanced (AFS) bridges with respect to the hybrid
bridge, suggesting the hybrid bridge was the most feasible option in this case. However, given a more
detailed life cycle analysis based on itemised cost of construction, maintenance, cost of repair, and as
the cost of fluid-viscous dampers reduces, the benefit of the AFS bridges will be more apparent. The
reduction in loss is attributed to a greater displacement capacity and the reduction in physical damage
inherent of a controlled rocking system. The decision to use advanced technology comes down to the
engineer’s ability to convey the benefits to the client and the client’s risk adversity to the type of
investment the structure represents. It was concluded that decision makers are generally risk averse
with respect to seismic hazard due to the low-probability-high-consequence stakes involved. It is to
this end that decisions should be based on the loss-hazard relationship as apposed to the EAL
7 AKNOWLEDGEMENTS
The financial support provided by FRST is greatly appreciated.
8 REFERENCES
Aslani, H. (2005). "Probabilistic earthquake loss estimation and loss disaggregation in buildings," Stanford
University, Stanford.
Cornell, A. C. and Krawinkler, H. (2000). "Progress and challenges in seismic performance assessment." PEER
Center News, 3.
Deierlein, G. G., Krawinkler, H. and Cornell, A. C. "A framework for performance-based earthquake
engineering." Pacific Conference on Earthquake Engineering, Christchurch, New Zealand.
Kam, W. Y., Pampanin, S., Carr, A. J. and Palermo, A. "Advanced Flag-Shape Systems for High Seismic
Performance including Near-Fault Effects." NZSEE 2007, Palermston North.
Krawinkler, H. and Miranda, E. (2004). Performance-based earthquake engineering CRC Press, Boca Raton,
FL.
Marriott, D. (2009). "The development of high-performance, post-tensioned rocking systems for the seismic
design of structures," University of Canterbury, Christchurch.
NZS1170.5. (2004). "Structural Design Actions, Part 5: Earthquake actions." Standards New Zealand,
Wellington.
NZS3101. (2006). "Concrete Structures Standard: Part 1-The Design of Concrete Structures." Standards New
Zealand, Wellington.
Priestley, M. J. N., Calvi, G. M. and Kowalsky, M. J. (2007). Displacement-Based Seismic Design of Structures,
IUSS, Pavia.
Tothong, P. and Cornell, A. (2008). "Structural performance assessment under near-source pulse-like ground
motions using advanced ground motion intensity measures." Earthquake Engineering and Structural Dynamics,
37, 1013-1037.
TransitNZ. (2003). "Bridge Manual Second Edition." ISBN 0-477-01697-9, New Zealand.
Vamvatsikos, D. and Cornell, A. C. (2002). "Incremental dynamic analysis." Earthquake Engineering &
Structural Dynamics, 31, 491-514.
Zareian, F. and Krawinkler, H. (2007). "Assessment of probability of collapse and design for collapse safety."
Earthquake Engineering & Structural Dynamics, 36, 1901-1914.