advancing seismic probabilistic risk assessment to …
TRANSCRIPT
Transactions, SMiRT-24 BEXCO, Busan, Korea - August 20-25, 2017
Division VII
ADVANCING SEISMIC PROBABILISTIC RISK ASSESSMENT TO INCLUDE NONLINEAR SOIL-STRUCTURE INTERACTION
Chandrakanth Bolisetti1, Mohamed M. Talaat2, Justin Coleman3, and Philip S. Hashimoto4 1 Research Scientist, Seismic Research Group, Idaho National Laboratory, USA 2 Senior Staff Engineer, Simpson Gumpertz & Heger, USA | Adjunct Assistant Professor, Cairo
University, Egypt 3 Lead, Seismic Research Group, Idaho National Laboratory, USA 4 Senior Principal, Simpson Gumpertz & Heger, USA
ABSTRACT Soil-structure interaction (SSI) analysis for the probabilistic risk assessment of nuclear structures
is typically performed in the current state of practice using linear analyses, assuming that the in-structure response increases linearly with the ground motion intensity. Nonlinear SSI effects, which can be significant in beyond-design basis events, are mostly ignored in these calculations. Estimates of seismic hazard at nuclear facility sites have been increasing in recent years as more data is gathered on seismic sources and events, leading to more intense ground motions used for performance assessment. Nonlinear SSI effects therefore become more relevant in the seismic probabilistic risk assessment (SPRA) of nuclear structures.
This study involves performing SPRA of a sample nuclear power plant (NPP) structure using traditional (linear SSI) and advanced (nonlinear SSI approaches and comparing the results to examine the effect of accounting for nonlinear SSI on seismic risk. The nonlinear SSI effects included in this study are limited to at the foundation-soil interface, i.e., gapping and sliding. One NPP structure is chosen along with an idealized soil profile and seismic hazard representative of a western United States (WUS) site. Realistic probabilistic distributions are assumed for the properties of soil, structure, and the foundation-soil interface. Linear SSI analyses are performed using the computer program CLASSI, and nonlinear analyses are performed using the commercial finite-element code LS-DYNA. The results showed a significant decrease in the conditional probabilities of failure of the components in comparison with those calculated using the traditional approach and a consequent reduction in risk due to including nonlinear SSI in the seismic response analysis.
INTRODUCTION Seismic demands in nuclear structures have traditionally been calculated using linear soil-structure
interaction analysis tools such as CLASSI (Wong, 1979) and SASSI (Ostadan and Deng, 2011), which perform dynamic response calculations in the frequency domain and have been in use since the early 1980s. These tools can approximate the nonlinear material response through equivalent-linear algorithms but cannot account for geometric nonlinearities. Nonlinear time-domain methods are available but are rarely used due to the lack of guidance for analysts and regulators alike. Recent studies (Bolisetti and Whittaker, 2015; Bolisetti et al., 2017b) have shown that the linear frequency-domain tools and nonlinear time-domain tools can result in very different seismic responses for intense ground motions and at high frequencies, both of which are crucial for nuclear applications. However, it is currently unknown if these differences have a decisive effect on seismic risk estimates.
The goal of this study is to explore the effect of including nonlinear SSI on the estimation of seismic risk. For simplicity, only the effects of geometric nonlinearities at the foundation-soil interface are considered for this study. An idealized surface-founded NPP containment structure is chosen for seismic

24th Conference on Structural Mechanics in Reactor Technology
BEXCO, Busan, Korea - August 20-25, 2017 Division VII
response analysis and is populated with generic components and a safety system with simple event tree and fault tree. Probabilistic risk assessment is first performed using the traditional approach, which assumes that the soil-structure system is linear. Seismic demands in this approach are calculated using the computer program CLASSI. An advanced response analysis, which includes nonlinear soil-structure interaction (NLSSI) is then performed. The seismic demands in the latter approach are calculated using the commercial finite-element code, LS-DYNA. The risk estimates calculated using the two approaches are compared. The effect of the slope of the hazard curve on the differences between the two estimates is also examined.
DESCRIPTION OF THE FACILITY
Soil site and nuclear power plant structure This study uses a soil profile representative of the site on which the Advanced Test Reactor (ATR)
at Idaho National Laboratory (INL) is built. This soil profile is idealized as uniform and semi-infinite, and the soil material is modelled as linear elastic with viscous damping. The soil material is assigned a median unit weight of 0.159 kcf, shear-wave velocity of 3720 ft/sec, shear modulus of 68,320 ksf, Poisson’s ratio of 0.35 and a damping ratio of 2%. The shear-wave velocity, shear modulus and damping ratio are assumed to be lognormally distributed with lognormal standard deviations of 0.27, 0.55 and 0.4, respectively.
The selected NPP structure is adopted from the SASSI2000 user manual. It consists of a reinforced concrete containment structure and an internal structure, both of which are idealized in the numerical models using lumped mass stick models as shown in Figure 1. The lumped masses and section properties of the stick models are presented in the right panel of this figure. These lumped masses include the masses of the stick elements, as well as the masses of the structural and non-structural components at each level. Therefore, a mass density of zero is assigned for the concrete material in the internal and containment structures. A median Young’s modulus of 6.9x10⁵ ksf and a median shear modulus of 2.7x10⁵ ksf are assigned to the concrete material. However, the concrete elastic modulus for the internal structure is multiplied by a factor of 0.5 to account for expected cracking. The frequencies and percentage mass participation of the first few significant modes of the containment and internal structure are calculated using SAP2000 (Computers and Structures Inc., 2011) and verified using LS-DYNA. The internal structure has its first horizontal mode at 8.46 Hz and the containment has its first mode at 5.27 Hz. The frequencies and percentages of mass participation of the NPP structure are presented in (Bolisetti et al., 2015).
Figure 1: Representative NPP structure model geometry and properties (Ostadan, 2006)

24th Conference on Structural Mechanics in Reactor Technology
BEXCO, Busan, Korea - August 20-25, 2017 Division VII
Seismic hazard The earthquake ground motions for response history analyses are based on the seismic hazard at
the site of a WUS NPP site. Panel a of Figure 2 presents the seismic hazard curve used for this study in terms of the horizontal peak ground acceleration (PGA) and associated mean annual frequency of exceedance (MAFE). A reference earthquake is defined for the seismic fragility evaluation in the SPRA process. This earthquake is defined as the uniform hazard spectrum (UHS) with a 10,000-year return period (MAFE of 1.0E-04), which corresponds to a horizontal PGA of 0.4g. Panel b of Figure 3 presents the 5% damped UHS corresponding to the horizontal and vertical directions. As a simplification for this study, the shape of the UHS is considered to be invariant within the MAFE range of interest. A suite of thirty sets of ground motion records (three components each) spectrally matched to the reference earthquake UHS are selected for this study. The horizontal ground motion records account for variability of the spectral acceleration in any arbitrary direction about the geometric mean of the two horizontal components.
a. Seismic hazard curve for horizontal PGA b. Reference earthquake response spectra Figure 2: Seismic hazard curve and reference earthquake used for SPRA
Plant system considered for risk assessment The NPP structure presented in Figure 1 is populated with a representative plant system for the
purpose of this study. This plant system is the emergency cooling pump adopted from an existing safety-related nuclear facility at INL. The emergency cooling pump system has a battery-powered electric motor that is started by associated control logic. The system consists of the (1) pump, (2) battery, (3) distribution panel including the circuit breakers, and (4) a medium voltage switchgear, which is the primary pump relay. Additionally, a concrete block wall is situated by the distribution panel and poses an interaction risk to the distribution panel if it collapses during an earthquake. The plant system components are all located on the internal structure. The battery and the medium voltage switchgear are located at elevation 22 ft, and the other system components are located at elevation 61 ft. The failure event considered for this study is the failure of the emergency cooling pump system, which can lead to core damage. A fault tree and event tree are assumed for this system, and are presented in Bolisetti et al. (2015).
CONVENTIONAL SEISMIC PROBABILISTIC RISK ASSESSMENT Probabilistic risk assessment is performed by integrating (i.e., convolving) the seismic hazard curve
with the component fragilities for the failure events of interest, i.e., the accident sequences that lead to core damage in this study. Component fragilities are conditional probabilities of failure given the seismic input demand parameter. In the nuclear industry, this has been traditionally performed using component fragilities expressed in terms of seismic input ground motion parameters such as PGA or spectral acceleration at a certain spectral frequency. However, component failures have much better correlation with seismic response parameters, such as floor spectral acceleration or story drift, that directly affect component
24th Conference on Structural Mechanics in Reactor Technology
BEXCO, Busan, Korea - August 20-25, 2017 Division VII
response during an earthquake. In the traditional approach, the response is considered to scale linearly with the input motion, however, this is not valid for the NLSSI analysis. As such, the advanced SPRA approach uses component fragilities that are expressed in terms of floor response parameters.
Probabilistic seismic response analysis is performed using a Latin Hypercube Sampling (LHS) approach. Uncertainties in the material properties of the soil and structure, as well as the randomness in the input ground motion, are modelled in the probabilistic simulation. The probabilistic demand distributions at the locations of the components are calculated from the results of these simulations in the form of in-structure response spectra (ISRS). The CLASSI simulations are performed in the following steps: 1. A fixed-base Eigen solution and mass matrix are calculated for the NPP structure with median properties
using computer program SAP2000. The Eigen values, namely, the natural frequencies of the NPP structure are presented in Bolisetti et al. (2015) and Bolisetti et al. (2017a), and are not listed here.
2. The structure properties (frequency and damping) and the soil properties (shear modulus, shear-wave velocity and damping) are sampled using LHS from lognormal probability distributions. Thirty sets of material properties are calculated and randomly paired. The randomized property multipliers are presented in Bolisetti et al. (2015) and Bolisetti et al. (2017a), and are not presented here.
3. Foundation impedances are calculated for the basemat of the NPP using CLASSI. The basemat is assumed to be rigid.
4. The thirty ground motions sets developed as described above are used as input for the NPP soil-structure system and assigned at random to the randomized material property pairs.
5. Thirty SSI response simulations are then performed using CLASSI. 6. The seismic demands at the component locations are calculated in terms of the median and the 84th
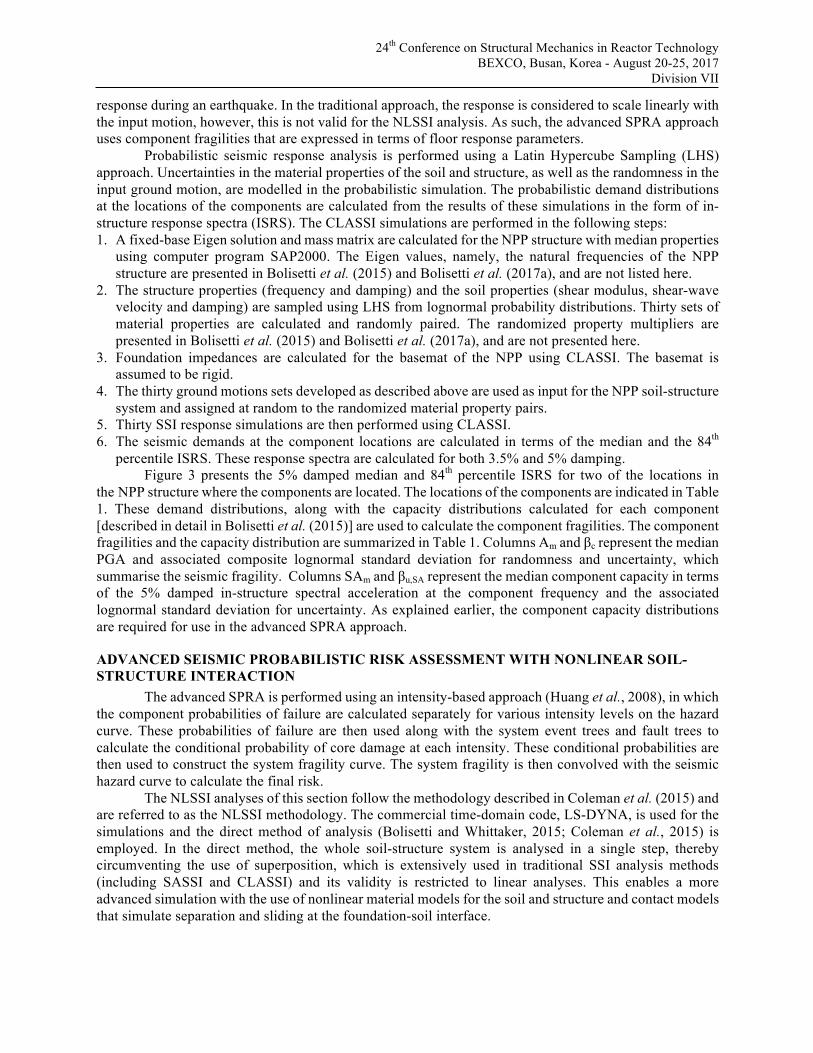
percentile ISRS. These response spectra are calculated for both 3.5% and 5% damping. Figure 3 presents the 5% damped median and 84th percentile ISRS for two of the locations in
the NPP structure where the components are located. The locations of the components are indicated in Table 1. These demand distributions, along with the capacity distributions calculated for each component [described in detail in Bolisetti et al. (2015)] are used to calculate the component fragilities. The component fragilities and the capacity distribution are summarized in Table 1. Columns Am and βc represent the median PGA and associated composite lognormal standard deviation for randomness and uncertainty, which summarise the seismic fragility. Columns SAm and βu,SA represent the median component capacity in terms of the 5% damped in-structure spectral acceleration at the component frequency and the associated lognormal standard deviation for uncertainty. As explained earlier, the component capacity distributions are required for use in the advanced SPRA approach.
ADVANCED SEISMIC PROBABILISTIC RISK ASSESSMENT WITH NONLINEAR SOIL-STRUCTURE INTERACTION
The advanced SPRA is performed using an intensity-based approach (Huang et al., 2008), in which the component probabilities of failure are calculated separately for various intensity levels on the hazard curve. These probabilities of failure are then used along with the system event trees and fault trees to calculate the conditional probability of core damage at each intensity. These conditional probabilities are then used to construct the system fragility curve. The system fragility is then convolved with the seismic hazard curve to calculate the final risk.
The NLSSI analyses of this section follow the methodology described in Coleman et al. (2015) and are referred to as the NLSSI methodology. The commercial time-domain code, LS-DYNA, is used for the simulations and the direct method of analysis (Bolisetti and Whittaker, 2015; Coleman et al., 2015) is employed. In the direct method, the whole soil-structure system is analysed in a single step, thereby circumventing the use of superposition, which is extensively used in traditional SSI analysis methods (including SASSI and CLASSI) and its validity is restricted to linear analyses. This enables a more advanced simulation with the use of nonlinear material models for the soil and structure and contact models that simulate separation and sliding at the foundation-soil interface.
24th Conference on Structural Mechanics in Reactor Technology
BEXCO, Busan, Korea - August 20-25, 2017 Division VII
a. Elevation 22’ - Y direction b.Elevation61’-Xdirection
Figure 3: Probabilistic in-structure response spectra calculated using linear analysis in CLASSI Table 1: Component fragilities calculated using linear analysis in CLASSI, and the component capacities
Component Floor Direction Frequency (Hz)
Am βc HCLPF SAm βu,SA
Pump EL 61’ X 20 3.40g 0.41 1.31g 7.46g 0.16
Battery EL 22’ Y 8.3 1.14g 0.28 0.59g 3.10g 0.10
Distribution Panel EL 61’ X 7.5 1.60g 0.59 0.40g 6.24g 0.42
Switchgear EL 61’ Y 5 - 10 1.90g 0.47 0.64g 4.80g 0.17
Block Wall EL 22’ Y 0.89 0.60g 0.28 0.31g 0.73g 0.42
Structure modelling The superstructure of the NPP is built using the Belytschko-Schwer resultant beam elements
available in LS-DYNA (Beam Element Type 2), and the cross-section properties and lumped masses presented in Figure 1. The basemat, which is 10 ft thick and 131 ft in diameter, is modelled as a rigid body using solid elements and the rigid material model available in LS-DYNA. The LS-DYNA fixed-base model is benchmarked through both modal analyses and response-history analyses. The results of the modal analyses are almost identical to those calculated using SAP2000, and are presented in Bolisetti et al. (2015). In spite of producing identical modal analysis results, preliminary response history analyses of the fixed-base structure revealed consistent deviation from the CLASSI results. A detailed investigation revealed some practical issues in the resultant beam element formulation and the Rayleigh damping formulation in LS-DYNA. These issues are described in Bolisetti et al. (2015). In order to resolve these issues while optimizing the LS-DYNA run time, the explicit integration time step in LS-DYNA is scaled up to a value beyond the critical time step: an approach that is not recommended in most cases. In order to avoid possible numerical instabilities, a sensitivity analysis for the time-step is performed and the analysis results are closely monitored through energy balance results. Figure 4 presents the fixed-base analysis results calculated using CLASSI, LS-DYNA default time step (labelled as LS-DYNA), and the LS-DYNA scaled time step [labelled as LS-DYNA (tstep)]. The figure shows minor differences between the CLASSI and LS-DYNA results at higher frequencies. These differences can be attributed to the differences in damping formulations of CLASSI and LS-DYNA. The figure also shows that the response spectra calculated using the default time step and scaled time step in LS-DYNA are overlapping and the results are identical.

24th Conference on Structural Mechanics in Reactor Technology
BEXCO, Busan, Korea - August 20-25, 2017 Division VII
a. Elevation 22’ - Y direction b. Elevation 61’ - X direction
Figure 4: CLASSI and LS-DYNA in-structure response spectra of the fixed-base NPP structure
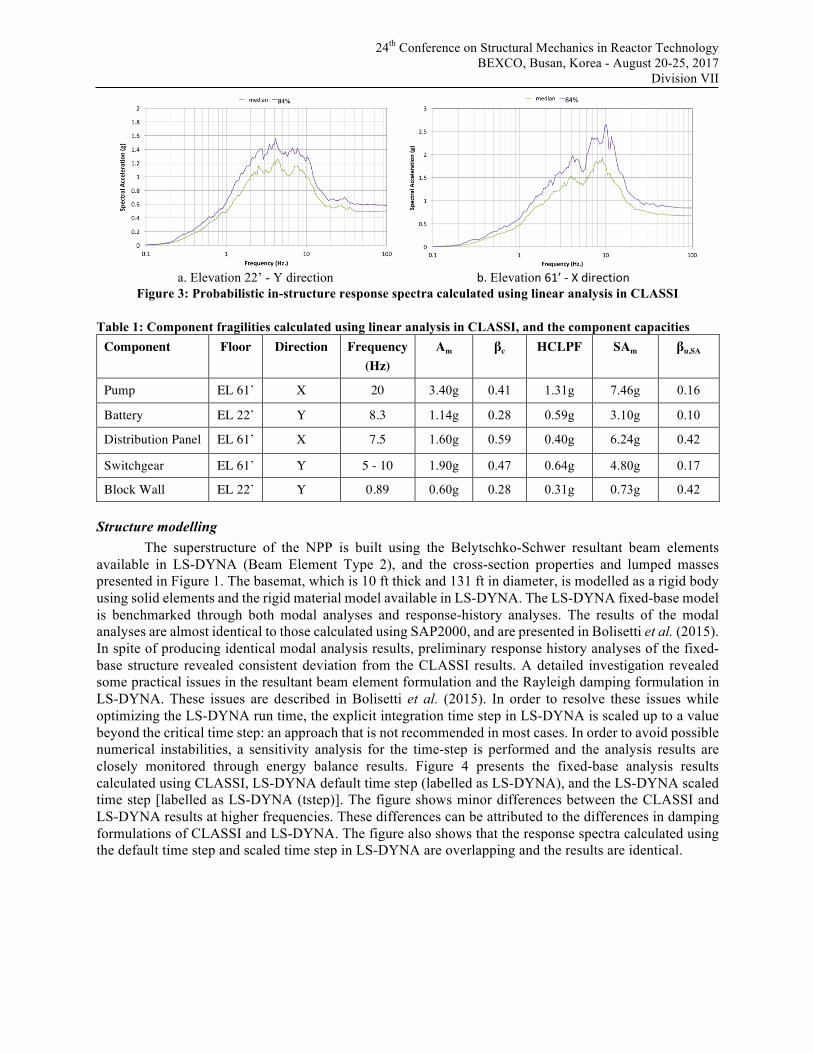
Soil domain modelling and ground motion input Soil domain modelling in the direct method involves building a rectangular soil box around the
structure and constraining the lateral boundaries of the box such that they respond in pure shear to a horizontal base excitation. A soil domain of size 665 ft x 665 ft in plan (about five times the size of the basemat, which is 131 ft in diameter), and 214 ft deep is built for the NLSSI analysis of the NPP (Figure 5, Panel a). The dimensions of the soil domain are chosen from a convergence study involving three different domain sizes. The soil domain is built with about 192,000 solid elements that use an almost uniform size of 8 ft in all directions. This element size allows the propagation of frequencies up to about 40 Hz, assuming ten elements per wavelength (Coleman et al., 2015). The base of the soil domain is modelled as a transmitting boundary using the *BOUNDARY_NON_REFLECTING option in LS-DYNA. The ground motion input is provided as an outcrop to the LS-DYNA soil domain at the base, in order to achieve the same free-field ground motion as CLASSI. The outcrop input is applied as a shear force history as illustrated in Panel b of Figure 5. The method of input excitation is verified by comparing the free-field response calculated using LS-DYNA with the input provided for the CLASSI analyses. These comparisons, and a more detailed description of the soil domain and ground motion input modelling are presented in Bolisetti et al. (2015).
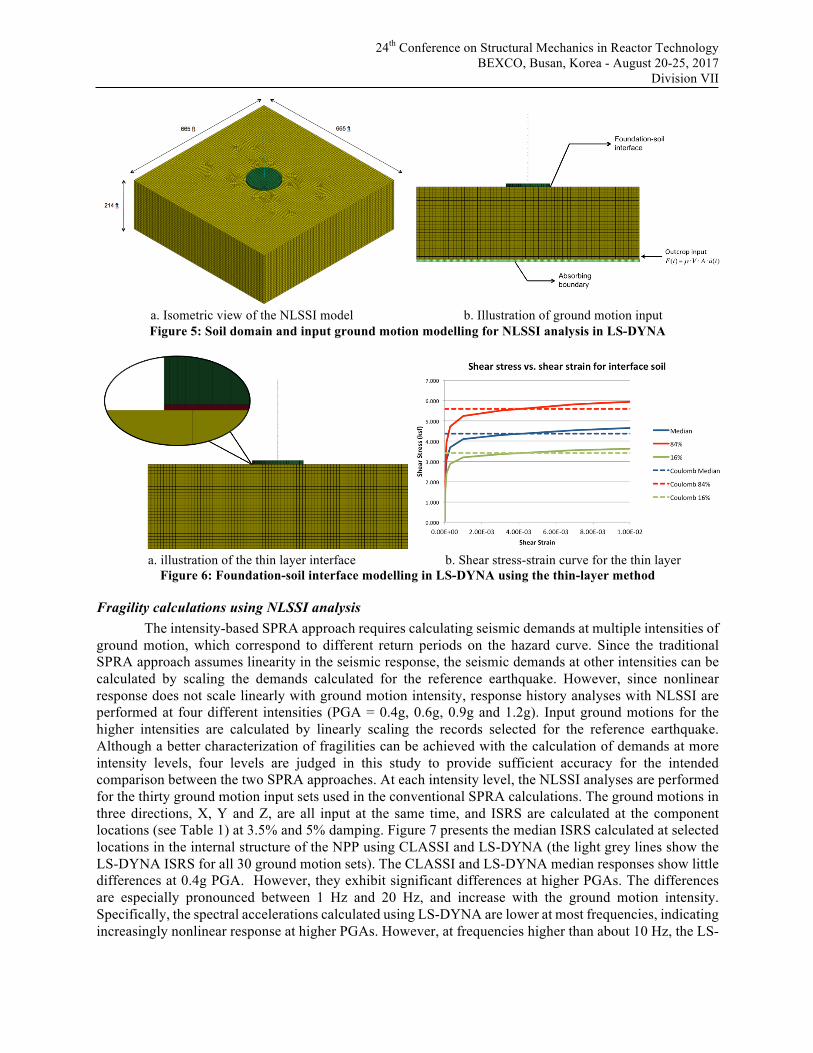
Foundation-soil interface modelling The NPP structure of this study is assumed to be founded on the surface and is highly susceptible
to gapping and sliding, thereby resulting in a complex response. Simulating the foundation-soil interface is challenging in these cases and multiple approaches were tested for interface modelling. The final approach involved modelling a thin interface layer of soil between the basemat and the soil, as illustrated in Panel a of Figure 6. The material properties of this soil layer are chosen to simulate Coulomb friction behaviour, namely, (1) the shear strength of the layer is equal to the maximum friction force for the given coefficient of friction and the weight of the structure, and (2) the soil material model has zero strength in tension. A limitation to the modelling approach in the context of Coulomb-type behaviour is the invariability of the shear strength of the interface soil layer with normal stress, so it had to be calibrated instead to the normal stress due to gravity. However, this is not expected to significantly affect the conclusions of this study. Panel b of Figure 6 presents the shear stress-strain curves corresponding to friction coefficients of 0.7, 0.55 and 0.90, which correspond to the median, 16th percentile, and 84th percentile values, respectively. The figure also presents the corresponding stress-strain curves required for the layer to represent pure friction. As shown in the figure, a small post-yielding stiffness is provided for the interface layer to avoid numerical instabilities.
24th Conference on Structural Mechanics in Reactor Technology
BEXCO, Busan, Korea - August 20-25, 2017 Division VII
a. Isometric view of the NLSSI model b. Illustration of ground motion input Figure 5: Soil domain and input ground motion modelling for NLSSI analysis in LS-DYNA
a. illustration of the thin layer interface b. Shear stress-strain curve for the thin layer
Figure 6: Foundation-soil interface modelling in LS-DYNA using the thin-layer method
Fragility calculations using NLSSI analysis The intensity-based SPRA approach requires calculating seismic demands at multiple intensities of
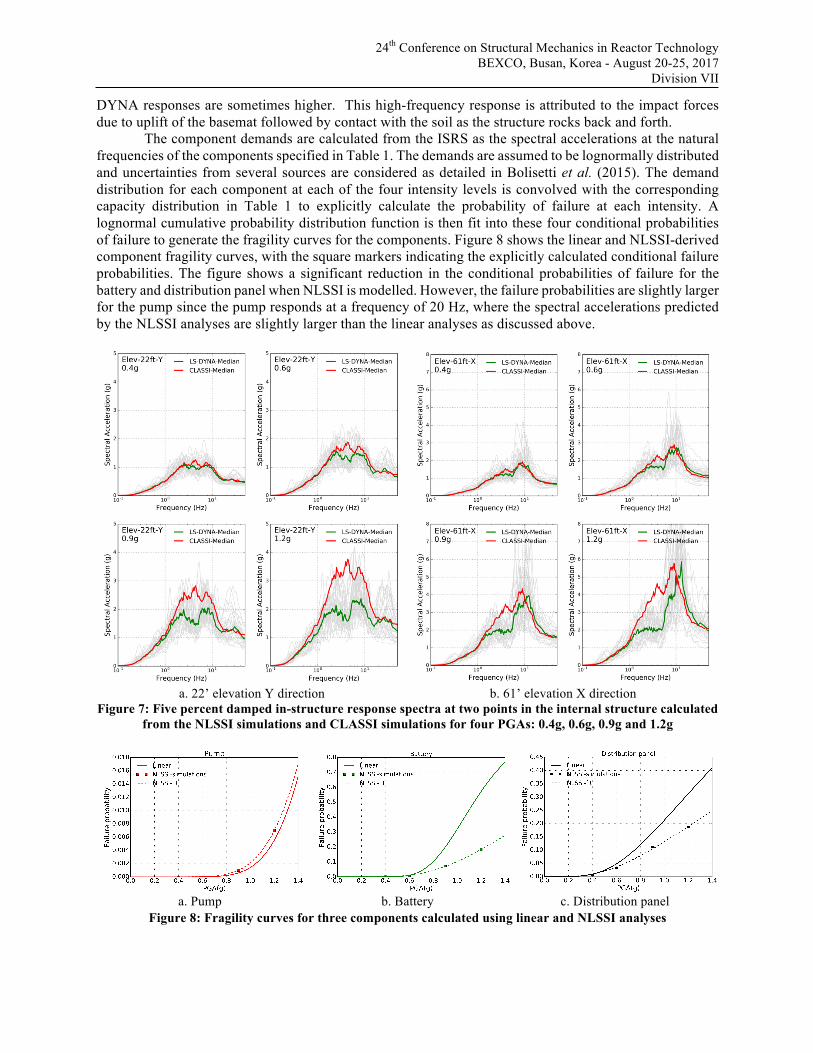
ground motion, which correspond to different return periods on the hazard curve. Since the traditional SPRA approach assumes linearity in the seismic response, the seismic demands at other intensities can be calculated by scaling the demands calculated for the reference earthquake. However, since nonlinear response does not scale linearly with ground motion intensity, response history analyses with NLSSI are performed at four different intensities (PGA = 0.4g, 0.6g, 0.9g and 1.2g). Input ground motions for the higher intensities are calculated by linearly scaling the records selected for the reference earthquake. Although a better characterization of fragilities can be achieved with the calculation of demands at more intensity levels, four levels are judged in this study to provide sufficient accuracy for the intended comparison between the two SPRA approaches. At each intensity level, the NLSSI analyses are performed for the thirty ground motion input sets used in the conventional SPRA calculations. The ground motions in three directions, X, Y and Z, are all input at the same time, and ISRS are calculated at the component locations (see Table 1) at 3.5% and 5% damping. Figure 7 presents the median ISRS calculated at selected locations in the internal structure of the NPP using CLASSI and LS-DYNA (the light grey lines show the LS-DYNA ISRS for all 30 ground motion sets). The CLASSI and LS-DYNA median responses show little differences at 0.4g PGA. However, they exhibit significant differences at higher PGAs. The differences are especially pronounced between 1 Hz and 20 Hz, and increase with the ground motion intensity. Specifically, the spectral accelerations calculated using LS-DYNA are lower at most frequencies, indicating increasingly nonlinear response at higher PGAs. However, at frequencies higher than about 10 Hz, the LS-
24th Conference on Structural Mechanics in Reactor Technology
BEXCO, Busan, Korea - August 20-25, 2017 Division VII
DYNA responses are sometimes higher. This high-frequency response is attributed to the impact forces due to uplift of the basemat followed by contact with the soil as the structure rocks back and forth.
The component demands are calculated from the ISRS as the spectral accelerations at the natural frequencies of the components specified in Table 1. The demands are assumed to be lognormally distributed and uncertainties from several sources are considered as detailed in Bolisetti et al. (2015). The demand distribution for each component at each of the four intensity levels is convolved with the corresponding capacity distribution in Table 1 to explicitly calculate the probability of failure at each intensity. A lognormal cumulative probability distribution function is then fit into these four conditional probabilities of failure to generate the fragility curves for the components. Figure 8 shows the linear and NLSSI-derived component fragility curves, with the square markers indicating the explicitly calculated conditional failure probabilities. The figure shows a significant reduction in the conditional probabilities of failure for the battery and distribution panel when NLSSI is modelled. However, the failure probabilities are slightly larger for the pump since the pump responds at a frequency of 20 Hz, where the spectral accelerations predicted by the NLSSI analyses are slightly larger than the linear analyses as discussed above.
a. 22’ elevation Y direction b. 61’ elevation X direction
Figure 7: Five percent damped in-structure response spectra at two points in the internal structure calculated from the NLSSI simulations and CLASSI simulations for four PGAs: 0.4g, 0.6g, 0.9g and 1.2g
a. Pump b. Battery c. Distribution panel
Figure 8: Fragility curves for three components calculated using linear and NLSSI analyses
24th Conference on Structural Mechanics in Reactor Technology
BEXCO, Busan, Korea - August 20-25, 2017 Division VII
SYSTEMS ANALYSIS AND RISK QUANTIFICATION To implement this risk quantification, the component fragility curves and the seismic hazard curve
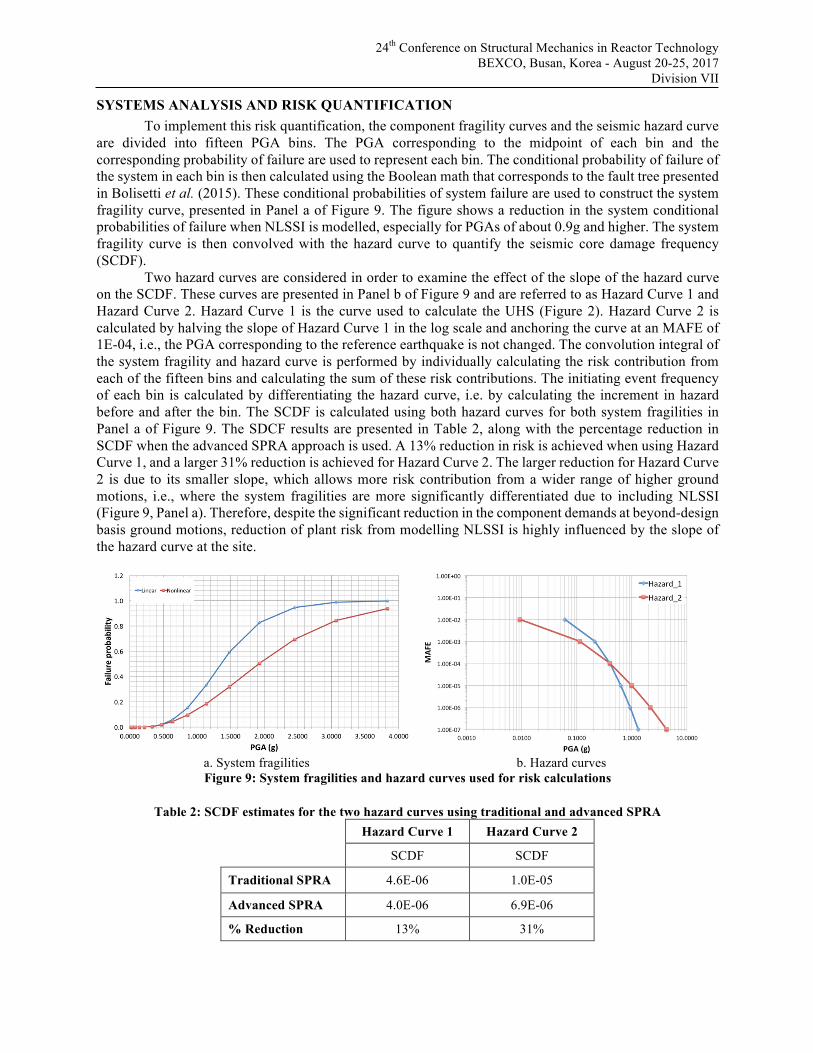
are divided into fifteen PGA bins. The PGA corresponding to the midpoint of each bin and the corresponding probability of failure are used to represent each bin. The conditional probability of failure of the system in each bin is then calculated using the Boolean math that corresponds to the fault tree presented in Bolisetti et al. (2015). These conditional probabilities of system failure are used to construct the system fragility curve, presented in Panel a of Figure 9. The figure shows a reduction in the system conditional probabilities of failure when NLSSI is modelled, especially for PGAs of about 0.9g and higher. The system fragility curve is then convolved with the hazard curve to quantify the seismic core damage frequency (SCDF).
Two hazard curves are considered in order to examine the effect of the slope of the hazard curve on the SCDF. These curves are presented in Panel b of Figure 9 and are referred to as Hazard Curve 1 and Hazard Curve 2. Hazard Curve 1 is the curve used to calculate the UHS (Figure 2). Hazard Curve 2 is calculated by halving the slope of Hazard Curve 1 in the log scale and anchoring the curve at an MAFE of 1E-04, i.e., the PGA corresponding to the reference earthquake is not changed. The convolution integral of the system fragility and hazard curve is performed by individually calculating the risk contribution from each of the fifteen bins and calculating the sum of these risk contributions. The initiating event frequency of each bin is calculated by differentiating the hazard curve, i.e. by calculating the increment in hazard before and after the bin. The SCDF is calculated using both hazard curves for both system fragilities in Panel a of Figure 9. The SDCF results are presented in Table 2, along with the percentage reduction in SCDF when the advanced SPRA approach is used. A 13% reduction in risk is achieved when using Hazard Curve 1, and a larger 31% reduction is achieved for Hazard Curve 2. The larger reduction for Hazard Curve 2 is due to its smaller slope, which allows more risk contribution from a wider range of higher ground motions, i.e., where the system fragilities are more significantly differentiated due to including NLSSI (Figure 9, Panel a). Therefore, despite the significant reduction in the component demands at beyond-design basis ground motions, reduction of plant risk from modelling NLSSI is highly influenced by the slope of the hazard curve at the site.
a. System fragilities b. Hazard curves Figure 9: System fragilities and hazard curves used for risk calculations
Table 2: SCDF estimates for the two hazard curves using traditional and advanced SPRA
Hazard Curve 1 Hazard Curve 2
SCDF SCDF
Traditional SPRA 4.6E-06 1.0E-05
Advanced SPRA 4.0E-06 6.9E-06
% Reduction 13% 31%
24th Conference on Structural Mechanics in Reactor Technology
BEXCO, Busan, Korea - August 20-25, 2017 Division VII
CONCLUSIONS AND FUTURE WORK This paper briefly describes a study that examines the effect of modelling local nonlinearities in
the soil-structure system on the estimate of seismic risk in terms of SCDF. Specifically, the study considers geometric nonlinearities (uplift and sliding) in a surface-founded NPP structure. A traditional SPRA approach that uses CLASSI for SSI analyses and an advanced SPRA approach that uses LS-DYNA for NLSSI simulations are used to calculate the probability distributions of component demands. The resulting component-level and system-level fragilities and the system risk assessment results are compared.
A primary observation from the study is the reduction in seismic in-structure demands at the component locations (with a few exceptions at high frequency) and system-level fragility at higher ground motions when NLSSI is modelled. This results in a reduction in the SCDF. The magnitude and significance of the reduction in SCDF are highly dependent on the slope of the hazard curve. The reduction in SCDF in this simplified case, i.e., 13% for the reference hazard curve used, is not significant enough to affect decision making given the magnitude of other uncertainties involved in a typical SPRA. However, the reduction can be significant if the slope of the hazard curve is smaller. In addition, additional reduction may be realized if a more complete modelling of nonlinearities in the soil, structure, and foundation is considered. This will be considered in a future study.
ACKNOWLEDGMENTS This study was funded by the Office of Nuclear Energy of the U. S. Department of Energy under
the Light Water Reactor Sustainability Program. The authors are grateful for this financial support.
REFERENCES Bolisetti, C., Coleman, J. L., Talaat, M. M., and Hashimoto, P. S. (2015). "Advanced Seismic Fragility Modeling Using Nonlinear Soil-Structure Interaction Analysis." INL/EXT-15-36375, Idaho National Laboratory, Idaho Falls, Idaho. Bolisetti, C., and Whittaker, A. S. (2015). "Site Response, Soil-Structure Interaction and Structure-Soil-Structure Interaction for Performance Assessment of Buildings and Nuclear Structures." MCEER-15-0002, Multidisciplinary Center for Earthquake Engineering Research, University at Buffalo, The State University of New York, Buffalo, NY. Bolisetti, C., Talaat, M. M., Coleman, J. L., and Hashimoto, P. S. (2017a). "Advancing Seismic Probabilistic Risk Assessment to Include Nonlinear Soil-Structure Interaction." Manuscript under review. Bolisetti, C., Whittaker, A. S., and Coleman, J. L. (2017b). "Linear and Nonlinear Soil-Structure Interaction Analysis of Safety-Related Nuclear Structures." Manuscript under review. Coleman, J. L., Bolisetti, C., and Whittaker, A. S. (2015). "Time-Domain Soil-Structure Interaction Analysis of Nuclear Facilities." Nuclear Engineering and Design, 298, 264-270. Computers and Structures Inc. (2011). Computer Program: SAP2000 - Structural Analysis Program, Version 11.0.0. Computers and Structures, Inc., Berkeley, California. Huang, Y.-N., Whittaker, A. S., and Luco, N. (2008). "Performance Assessment of Conventional and Base-Isolated Nuclear Power Plants for Earthquake and Blast Loadings." MCEER-08-0019, Multidisciplinary Center for Earthquake Engineering Research, University at Buffalo, The State University of New York, Buffalo, NY. Ostadan, F. (2006). "SASSI2000: A System for Analysis of Soil Structure Interaction - User's Manual." University of California, Berkeley, California. Ostadan, F., and Deng, N. (2011). Computer Program: SASSI2010 - A System for Analysis of Soil-Structure Interaction, Version 1.1. Geotechnical and Hydraulic Engineering Services, Bechtel National Inc., San Francisco, California. Wong, H. L. (1979). "Soil-Structure Interaction: A Linear Continuum Mechanics Approach (CLASSI User’s Manual)." University of Southern California, Los Angeles, California.