a novel method for the separation of hydrocarbons …
TRANSCRIPT
The Pennsylvania State University
The Graduate School of Earth and Mineral Science
Department of Materials Science and Engineering
A NOVEL METHOD FOR THE SEPARATION OF HYDROCARBONS FROM TAR
SANDS AND OTHER SAND CONTAINING MATERIALS USING IONIC LIQUIDS
A Thesis in
Materials Science and Engineering
by
Phillip S. Williams
2010 Phillip S. Williams
Submitted in Partial Fulfillment of the Requirements
for the Degree of
Master of Science
May 2010

ii
The thesis of Phillip S. Williams was reviewed and approved* by the following:
Paul C. Painter Professor of Polymer Science Thesis Advisor
James Runt Professor of Polymer Science and Bioengineering
Harold Schobert Professor of Fuel Science
Gary L. Messing Distinguished Professor of Materials Science and Engineering Head of the Department of Materials Science and Engineering
*Signatures are on file in the Graduate School
iii
ABSTRACT
Bitumen is a complex hydrocarbon with components that have a broad range of
molecular weight, from low to polymeric. The extraction and separation of bitumen from tar
sands for the purpose of processing fuels is relatively expensive and poses several environmental
challenges. Roughly two tons of tar sands are required to produce a barrel of oil and the
separation of the bitumen from sand and clay requires significant amounts of energy and the use
of large quantities of water. It is shown that bitumen from samples of Canadian and Utah tar
sands can be recovered using ionic liquids (ILs) and an organic solvent. Essentially, a multiphase
system—consisting of a sand and clay slurry, an ionic liquid layer, and an organic layer
containing the bitumen—can be formed by simply mixing the components at ambient (~25°C)
temperature. Effectively all of the bitumen is released from the sand. Water is not used in this
stage of the separation, but relatively small amounts are used to separate entrained IL from the
sand and clays. Because both the IL and water can be recycled through the system and used
repeatedly, this process has the potential to ameliorate many of the environmental problems
associated with current extraction methods.
This technology can also be employed to solve many other drilling and refinery issues.
Crude oil recovered from drilling wells often contains what is referred to as sand, but more
specifically is a mixture of various minerals and silt. This oil-coated sand must be cleaned before
disposal. In another drilling operation, large amounts of rock or drill-cuttings are produced and
are similarly contaminated with oil, particularly if oil based “muds” have been used in drilling.
Another example is the treatment and disposal of large amount of so-called oily sludge generated
in refinery operations. Finally, this same idea can be employed directly to the clean-up and
removal of crude oil which would wash up on beaches after disastrous oil spills like the Exxon
Valdez incident.
iv
TABLE OF CONTENTS
LIST OF FIGURES .................................................................................................................v
LIST OF TABLES...................................................................................................................vii
ACKNOWLEDGEMENTS.....................................................................................................viii
Chapter 1 Introduction ............................................................................................................1
Ionic Liquids ....................................................................................................................3 Bitumen and Other Impure Hydrocarbon Mixtures .........................................................4
Tar Sand ...................................................................................................................5 Drill Cuttings............................................................................................................6
Purpose.............................................................................................................................7
Chapter 2 Extraction of Bitumen from Tar Sand...................................................................8
Current Methods and Drawbacks.....................................................................................8 Surface Charge Regulation ..............................................................................................9 Using Ionic Liquids..........................................................................................................11
Medium-grade Canadian Tar Sand...........................................................................11 Low-grade Canadian Tar Sand.................................................................................20 Utah Tar Sand ..........................................................................................................23
Summary and Industrial Application Considerations ......................................................34
Chapter 3 Extraction of Bitumen from Other Oil/Sand Mixtures..........................................37
Drill Cuttings/Drilling Muds and Refinery Waste ...........................................................37 Oil Spill Simulation .........................................................................................................40 Summary ..........................................................................................................................44
REFERENCES ........................................................................................................................46
APPENDIX..............................................................................................................................48
v
LIST OF FIGURES
Figure 1-1:Growth in the demand for oil. .................................................................................2
Figure 1-2: Products made from a barrel of crude oil.............................................................4
Figure 1-3: Drill cuttings viewed under a microscope and a sample of drilling mud obtained from the Energy and Environmental Engineering department of Penn State....6
Figure 2-1:. The electric double layer of a charged particle showing the Stern layer and Gouy-Chapman layer .......................................................................................................11
Figure 2-2: The structure of the ionic liquids: 1-butyl-3-methylimidazolium trifluoromethanesulfonate, [bmim][CF3SO3]; and 1-butyl-2,3-dimethylimidazolium tetrafluoroborate, [bmmim][BF4] .....................................................................................12
Figure 2-3: The agglomerates that were formed by mixing tar sands with [bmim][CF3SO3], after removal of ionic liquid by rinsing with water.............................13
Figure 2-4: The phases formed by mixing medium-grade and low-grade Canadian tar sands with [bmmim][ BF4] and toluene in the proportions 1:2:3 at room temperature. ..14
Figure 2-5: Infrared spectra of the original medium-grade tar sand, the bitumen obtained by extraction (using [bmmim][ BF4]), and the sand/clay mixture obtained after removal of residual IL with water. ...................................................................................17
Figure 2-6: Infrared spectrum of the bitumen layer from an extraction of medium-grade tar sand with toluene. .......................................................................................................18
Figure 2-7: Infrared spectra of the ionic liquid [bmmim][BF4] and residual sand and clays. ................................................................................................................................19
Figure 2-8: Pictures of low-grade Canadian tar sand, with and without flash, illustrating the heterogeneity of components and variation of bitumen content. ...............................21
Figure 2-9: Infrared spectra of the original low-grade tar sand, the bitumen obtained by extraction (using [bmmim][ BF4]), and the sand/clay mixture obtained after removal of residual IL with water. .................................................................................................22
Figure 2-10: Infrared spectrum of the bitumen layer from an extraction of low-grade tar sand with toluene. ............................................................................................................23
Figure 2-11: Infrared spectra comparing the original Utah tar sand and the residual minerals obtained after separating the majority of bitumen.............................................25
Figure 2-12: Infrared spectra of the bitumen obtained from an extraction of tar sand with [bmmim][BF4]/toluene and using just toluene .................................................................26
vi
Figure 2-13: Picture of Utah tar sand mixed with [bmmim][BF4] overnight, and additions of toluene drop-wise after 5 minutes, each picture showing successive additions (DW1). .............................................................................................................................27
Figure 2-14: Infrared spectra of the bitumen obtained from an initial extraction (first) of tar sands with [bmmim][BF4]/toluene and a second extraction using the same solvents (DW1). ...............................................................................................................29
Figure 2-15: Infrared spectrum of the residual sand obtained after extraction of bitumen with [bmmim][BF4]/toluene (DW1).................................................................................30
Figure 2-16: Infrared spectra of the bitumen obtained from successive extractions of a ground sample of tar sands with [bmmim][BF4]/toluene.................................................31
Figure 2-17: Infrared spectra of the bitumen obtained from DW2-2, re-stirring with additional [bmmim][BF4] (DW2-2 + IL), and that result re-stirred with distilled water (ReIL + H2O)..........................................................................................................32
Figure 2-18: Infrared spectra of the bitumen obtained from successive extractions of a chunk of tar sands with [bmmim][BF4]/toluene...............................................................33
Figure 2-19: Simple schematic plot of a possible separation process.....................................35
Figure 3-1: Pictures of drilling mud reacted with [emim][Ac] and toluene. The structure of [emim][Ac] ..................................................................................................................38
Figure 3-2: Infrared spectra of a sample of drilling mud, the oil obtained after extraction using IL and toluene, and the spectrum of the residual minerals after rinsing with water.................................................................................................................................40
Figure 3-3: Picture showing the difference between virgin sand, contaminated sand after extraction, and sand contaminated with 14% oil. The phases formed by mixing oil impregnated sand with [bmmim][ BF4] and toluene in the proportions 1:2:3 at room temperature.......................................................................................................................41
Figure 3-4: Infrared spectra of beach sand before contamination, after contamination, and sand impregnated with oil. ........................................................................................42
Figure 3-5: Infrared spectra of the original oil and the oil extracted from the contaminated sand............................................................................................................44
vii
LIST OF TABLES
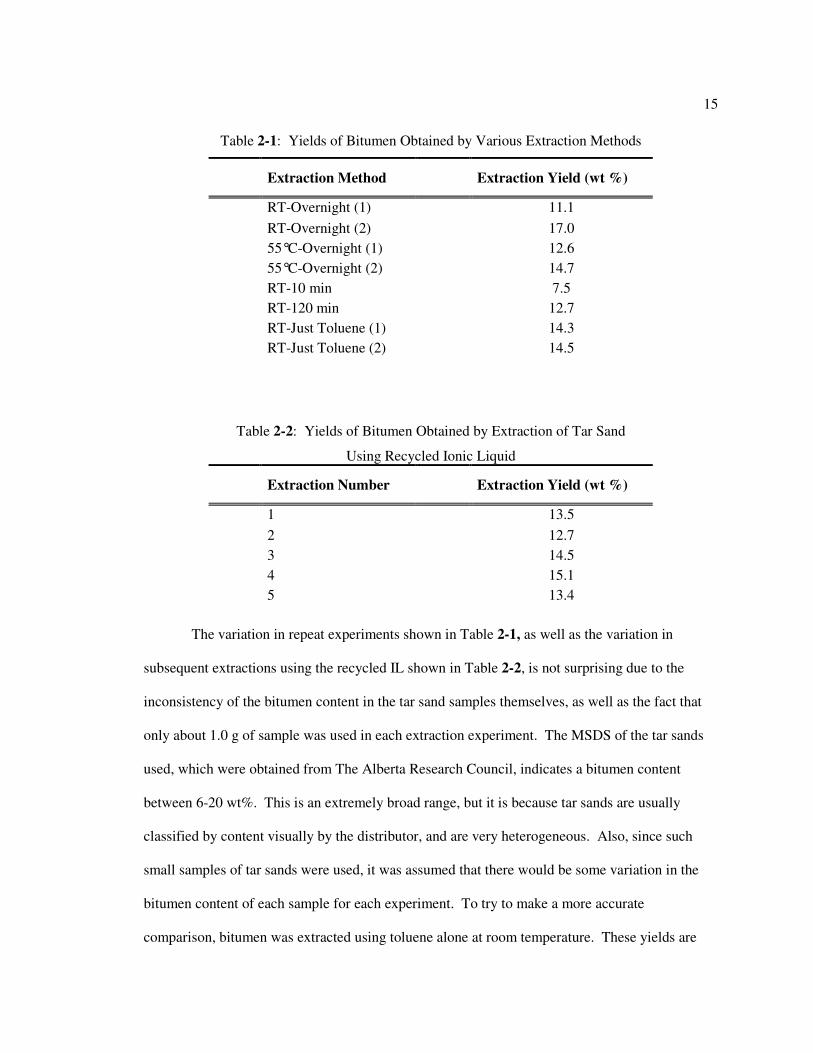
Table 2-1: Yields of Bitumen Obtained by Various Extraction Methods...............................15
Table 2-2: Yields of Bitumen Obtained by Extraction of Tar Sand Using Recycled Ionic Liquid. ..............................................................................................................................15
Table 2-3: Yields of Bitumen Obtained by the Extraction of Low-Grade Tar Sand. .............20
Table 2-4: Yields of Bitumen Obtained by Various Extraction Methods...............................34

viii
ACKNOWLEDGEMENTS
The author gratefully acknowledges the support of the National Science Foundation,
Polymers Program, under grant DMR-0901180 and DMR-0851897. The author would also like
to thank his advisor Paul Painter for all of his help and support, and his undergraduate student
whom he mentored, Aron Lupinsky for his assistance with taking some of the FTIR spectra. The
author would also like to thank The Alberta Research Council for the donation of tar sand
samples and Mark Klima of the Energy and Mineral Engineering department of Penn State for the
donation of a drilling mud sample.

1
Chapter 1
Introduction
While working on a previous project to disperse nanoparticles into flexible polymers, as
this would be beneficial for opto-electronic applications, the idea of using ionic liquids as a
dispersing medium was considered. The idea was, that in order to disperse these nanoparticles
properly, some type of novel method was needed that would be able to control the surface charge
regulation of particles. This particular project was only advancing slowly and other colleagues
were tackling problems associated with extracting bitumen from shale and other rock. As these
two distinct research problems converged, the focus became what natural resource was available
for energy that was not being exploited to its fullest extent—tar sands. As the processing
problems associated with tar sands were considered, it became apparent that current methods
were also seriously affecting the environment. Once the full breadth of the situation regarding tar
sands was discovered, the focus turned to why current processing methods were so problematic.
Like the dispersion of nanoparticles into polymers, tar sand processing had a similar problem—
surface charge regulation. It was decided that using ionic liquids to process tar sands and other
bitumen-containing materials was both novel and practical.
It is widely accepted that the progress of civilization and economic prosperity are closely
tied to energy and energy consumption, respectively. About 100 years ago there was a shift, and
the major source of energy became oil and natural gas—since then there has been a steady
increase in our need for more and more hydrocarbon based fuels. According to the U.S. National
Commission on Energy Policy in 2004, the worldwide global demand for oil has grown 150%
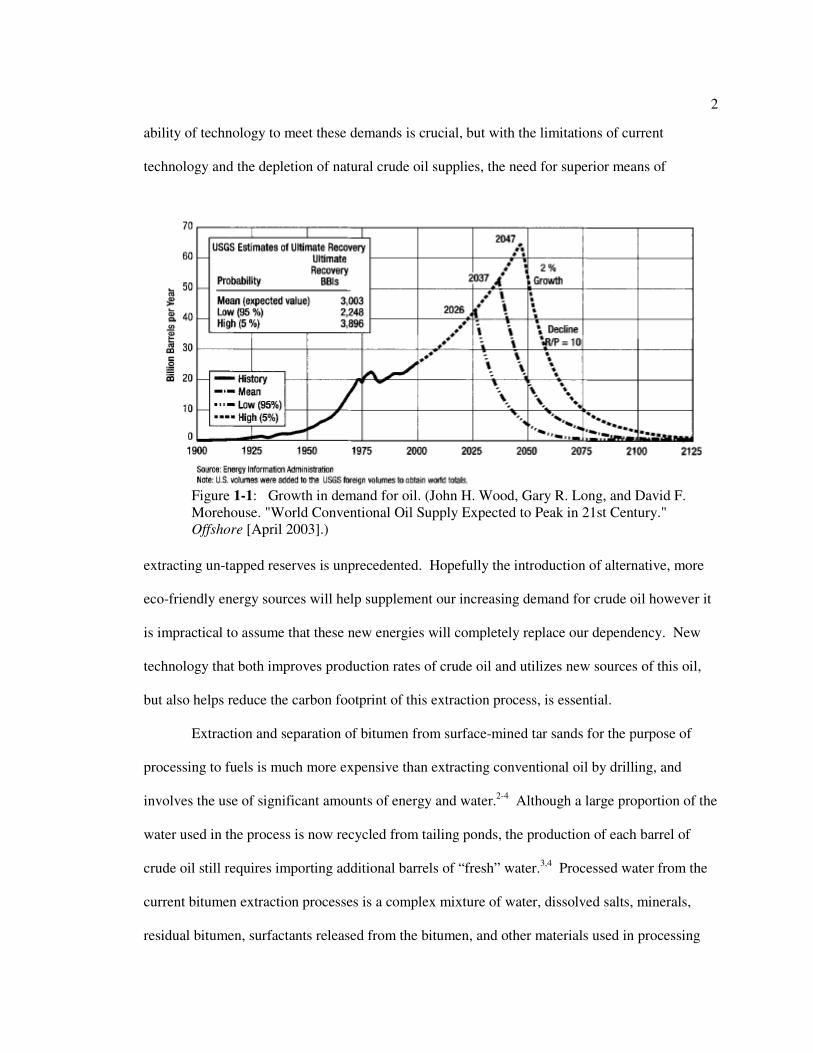
since 1965 and was projected to grow by 50% more over the next 20 years1. Figure 1-1 shows a
chart for previous and postulated growth in the demand of oil in billions of barrels per year. The
2
ability of technology to meet these demands is crucial, but with the limitations of current
technology and the depletion of natural crude oil supplies, the need for superior means of
extracting un-tapped reserves is unprecedented. Hopefully the introduction of alternative, more
eco-friendly energy sources will help supplement our increasing demand for crude oil however it
is impractical to assume that these new energies will completely replace our dependency. New
technology that both improves production rates of crude oil and utilizes new sources of this oil,
but also helps reduce the carbon footprint of this extraction process, is essential.
Extraction and separation of bitumen from surface-mined tar sands for the purpose of
processing to fuels is much more expensive than extracting conventional oil by drilling, and
involves the use of significant amounts of energy and water.2-4 Although a large proportion of the
water used in the process is now recycled from tailing ponds, the production of each barrel of
crude oil still requires importing additional barrels of “fresh” water.3,4 Processed water from the
current bitumen extraction processes is a complex mixture of water, dissolved salts, minerals,
residual bitumen, surfactants released from the bitumen, and other materials used in processing
Figure 1-1: Growth in demand for oil. (John H. Wood, Gary R. Long, and David F. Morehouse. "World Conventional Oil Supply Expected to Peak in 21st Century." Offshore [April 2003].)
3
(like NaOH). This processed water is stored in vast tailing ponds and is highly toxic to aquatic
life.2-5 As mentioned above, large quantities of tailing pond water are now recycled through the
process, but this can lead to scaling and corrosion problems, and can adversely affect bitumen
recovery. In addition, very fine mineral particles and emulsified salty water are co-extracted with
the bitumen, and these can also lead to problems in subsequent processing.6-8
Ionic Liquids
Ionic liquids (ILs) are salts in the liquid state that consist entirely of ionic species.
Typically, these salts are defined as having a melting temperature below 100°C. The actual term
“ionic liquid” has been around since 1943,9 but it was not until the last decade, or less, that they
became very popular in the research field. This is probably a consequence of their distinctive
properties and their potential for use in various industrial processes. ILs have outstanding
chemical and thermal stability; they are nonflammable (below the degradation point) and have
essentially zero vapor pressure (non-volatile).10,11 Ionic liquids have a wide array of structures,
although the most common are variations of the pyridinium and imidazolium rings. ILs can also
have various counterions both anionic and cationic. Depending on the particular anion and the
side chain length for cationically stabilized ionic liquids, the miscibility of ILs with water and
organic solvents varies.
Ionic liquids have been considered as having a low impact on the environment and thus
deemed suitable solvents for green chemistry. This is probably due to their low volatility, but this
is somewhat misleading. Most ILs tend to be toxic and if released into the environment could be
very detrimental, particularly to aquatic life.12 Some review papers have been published on this
issue,13,14 but as ionic liquids become more and more utilized by industry, only time will tell how
“environmentally friendly” these new solvents will really be.
4
Bitumen and Other Impure Hydrocarbon Mixtures
WordNet,15 a searchable word database designed by Princeton University, defines
bitumen as any of various naturally occurring impure mixtures of hydrocarbons. These naturally
occurring hydrocarbons are formed from the remains of microscopic algae and other dead
organisms that become buried in the sand and mud beneath lakes and oceans, some of which are
lost over time. Due to the heat and pressure associated with being buried deep in the earth, these
remains are transformed in bitumen, kerogen (which comprises a portion of organic compounds
found in rock), and crude oil. Bitumen can also be found in bituminous rocks, which are simply
sedimentary rocks like shale, sandstone and limestone, with bitumen in them. Bitumen is a very
viscous, “heavy” oil, but unlike kerogen, is completely soluble in organic solvents. The soluble
portion of kerogen is referred to as bitumen. Bitumen differs from petroleum because petroleum
is defined as naturally occurring crude oil, while crude bitumen must be refined into crude oil.
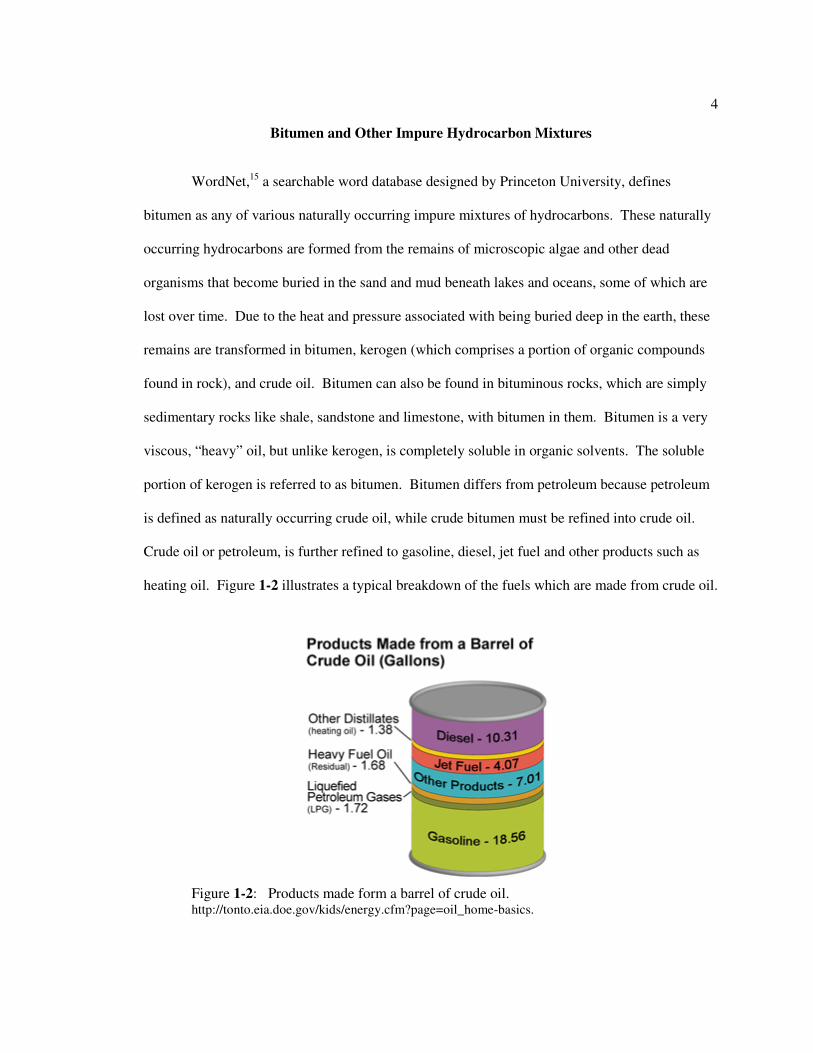
Crude oil or petroleum, is further refined to gasoline, diesel, jet fuel and other products such as
heating oil. Figure 1-2 illustrates a typical breakdown of the fuels which are made from crude oil.
Figure 1-2: Products made form a barrel of crude oil. http://tonto.eia.doe.gov/kids/energy.cfm?page=oil_home-basics.

5
Tar Sand
Tar sands, also known as oil sands, are naturally occurring, complex mixtures of sand,
clays, water and the highly viscous oil, crude bitumen. The largest quantities of tar sands are
found in Venezuela and in Canada, the so-called Athabasca Oil Sands located in northeastern
Alberta.16 Combined, these two oil sand reserves are estimated to be equal to the world’s total
reserves of conventional crude oil.5 The Athabasca deposit is the largest reservoir of crude
bitumen in the world. Combined with two other deposits in Alberta, the Peace River and Cold
Lake deposits, these three bitumen reservoirs lie under 54,000 square miles of forest and peat
bogs and contain roughly 1.7 trillion barrels of bitumen—that is at least 85% of the world’s
reserves of crude bitumen. The Alberta government estimates that about 10% of this bitumen, or
173 billion barrels, is recoverable using current technology at current prices. This is about 97%
of Canadian oil reserves and 75% of total North American petroleum reserves.16 From 2000-
2008, an estimated $87 billion was invested in tar sands projects in Alberta alone, and more than
$136 billion in tar sands projects are currently underway or proposed. The production of crude
oil from the Canadian Province of Alberta averaged about 1.8 million barrels per day of which
1.3 million barrels were from tar sands.17 Given the application of new technologies and current
projects under development, this production is expected to rise to 3 million barrels per day by
2020.
Significant quantities of tar sands (estimated to be 32 billion barrels of oil) can also be
found in eastern Utah in the US,5 although currently crude oil is not produced from tar sands on a
significant commercial level in the US. According to the Utah Division of Oil, Gas and Mining,
in 2008 Utah produced 22 million barrels of crude oil although the amount of oil produced from
tar sands alone is unclear, as no specific statistics are given by the Utah’s Energy Advisor’s
Office or by the US Department of Energy.
6
Drill Cuttings
Schlumberger’s oilfield glossary18 defines drill cuttings as any material (typically called
solids) removed from a borehole during the process of drilling in petroleum wells. During
drilling, a complex system of liquid muds are pumped down the well to help facilitate drilling by
cooling and lubricating the drill bit, and by helping to clean the hole bottom and carry drill
cuttings to the surface. These muds are comprised of various components including organic
solvents, water and surfactants, and the type of mud used depends on the specific requirements
needed for drilling. A complete source for information about these drilling muds can be found in
this book.19 Cuttings are often screened out of the liquid mud system and monitored for
composition, size shape and color.18 Depending on the location, a number of different
compositions can be encountered, although generally speaking sand and shale make up the
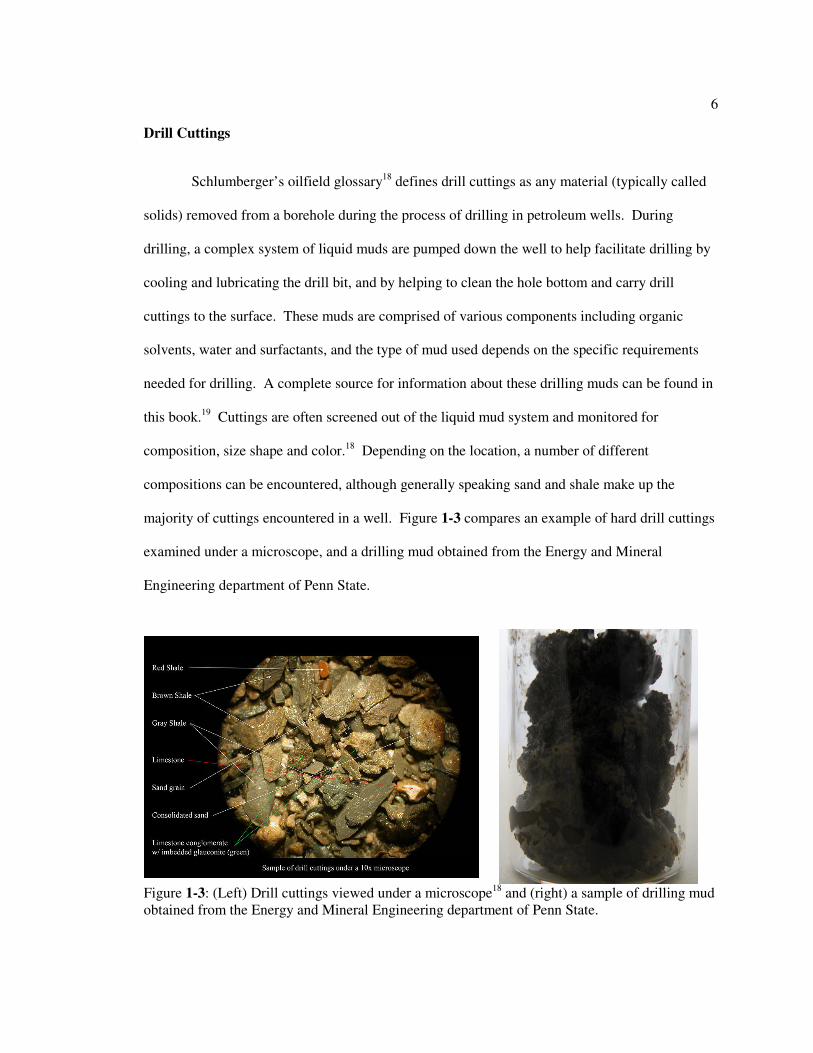
majority of cuttings encountered in a well. Figure 1-3 compares an example of hard drill cuttings
examined under a microscope, and a drilling mud obtained from the Energy and Mineral
Engineering department of Penn State.
Figure 1-3: (Left) Drill cuttings viewed under a microscope18 and (right) a sample of drilling mud obtained from the Energy and Mineral Engineering department of Penn State.

7
Purpose
The intent of thesis is to relate the various problems encountered when trying to obtain
hydrocarbons of various forms from sand and other mineral media, and solve these problems
using a simple extraction method. It will be shown that by pairing ionic liquids with an organic
solvent, hydrocarbons can be extracted from various media, including those that possess sub-
micron sized mineral fines. Not only does this extraction method eliminate many processing
concerns across the board, it also addresses various environmental issues. Through spectroscopic
studies, it will be shown that this method is potentially superior to other extraction methods,
because it releases practically all of the trapped hydrocarbons in a system at ambient
temperatures, with no mineral fines found in the hydrocarbon, and no contamination left in the
minerals. This will be shown through the laboratory extraction of tar sands from various regions
and of various grades, a drilling mud, and oil contaminated beach sand.
8
Chapter 2
Extraction of Bitumen from Tar Sand
Athabasca tar sands are complex and heterogeneous, consisting of sand, fines (mainly
clays, defined as particles less than 44 µm in size), bitumen, and water. Medium-grade ores
usually have higher bitumen contents and lower fines contents than low-grade ores and are more
easily processed to give a high yield of bitumen, although factors such as weathering and
oxidation are also important.20-34
Current Methods and Drawbacks
The separation of bitumen from sand is accomplished on an industrial scale by a water-
based process in which the bitumen is first detached from the sand and then aerated to allow for
recovery as a froth. Small amounts of mineral fines apparently benefit bitumen recovery,22 but in
general, bitumen yield decreases with fines content, because a layer of these particles becomes
attached to bitumen droplets, forming a so-called slime coating that hinders the formation of a
froth. The presence of mineral fines can also lead to problems in subsequent processing.
There is rich and deep literature describing the study of the interactions between the
components of tar sands and the variables affecting bitumen recovery in hot or warm water
processes (temperature, pH, the presence of clays, such as montmorillonite, divalent cations, etc.),
this work is described, reviewed, and cited in references 19-33. In terms of this study, the most
important observations concern the electrostatic forces that play a key role in mediating
interactions between bitumen and sand and clay particles, as indicated by the work of Liu et al.24
9
Silica particles have a negative surface charge and an isoelectric point near a pH of 3. Clay
particles also have a negative charge on their face but can have positive charges at their edge.
Because of the presence of carboxylic acids (and possibly sulfate groups) on their surface,
bitumen particles can also have a negative surface charge. At neutral or slightly alkaline pH, the
dominant force is a repulsion between electrostatic double layers of the mineral particles and
bitumen. This repulsion weakens as the pH of the medium is decreased and adhesion forces then
play a larger role. As a result acidic tar sands show poor processability. This is also why
caustics, in particular NaOH, are used in water processing, and part of the reason why processing
water is so harmful to the environment. To compound all of this, unlike the hydrophilic fines
found in medium-grade tar sands, the fines in low-grade tar sands are to some extent
hydrophobic, resulting in an adhesive force and stronger attachment to the surface of bitumen
particles.
Surface Charge Regulation
Surface charge regulation is of the utmost importance in colloidal type systems where
small spherical-like particles are interacting with one another while dispersed in a medium. This
medium can be any solvent, organic or inorganic, but water (hydrocolloid) or another polar
medium are frequently used. A colloidal system is defined as a mixture of two distinct phases: a
dispersed phase, or internal phase, and a continuous phase (referred to as the dispersion medium).
There are many different types of interactions that may be present in a colloidal system.
The simplest type of interactions is intermolecular forces like entropic forces and van der Waals
forces. More complex interactions include electrostatic and steric forces. As mentioned
previously, the electrostatic forces between bitumen and sand and clay particles are thought to be
crucial in the separation of bitumen from these components. Electrostatic forces are only present
10
where charged particles are interacting through a polar medium, like water, and in general are
stronger and longer range than all other surface forces, and therefore often dominate.35 The
surface reaction that leads to surface charge, in the case of silicates and/or phyllosilicates, is the
dissociation of the surface to yield an ion. This can happen on an amphoteric surface, where
protons are lost only via a monoprotic surface charging reaction, in the case of silica, from silanol
surface groups.36 This surface charge is then compensated by adsorbed ions which are chemically
bonded to surface sites directly next to the surface, in what is known as the Stern layer, and by
electrostatically accumulating counterions (oppositely charged) from the outer edge of the Stern
plane to the bulk solution where the electrical potential becomes zero.35 The Gouy-Chapman
layer is the counterion layer that forms at the Stern plane and extends into the bulk solution.
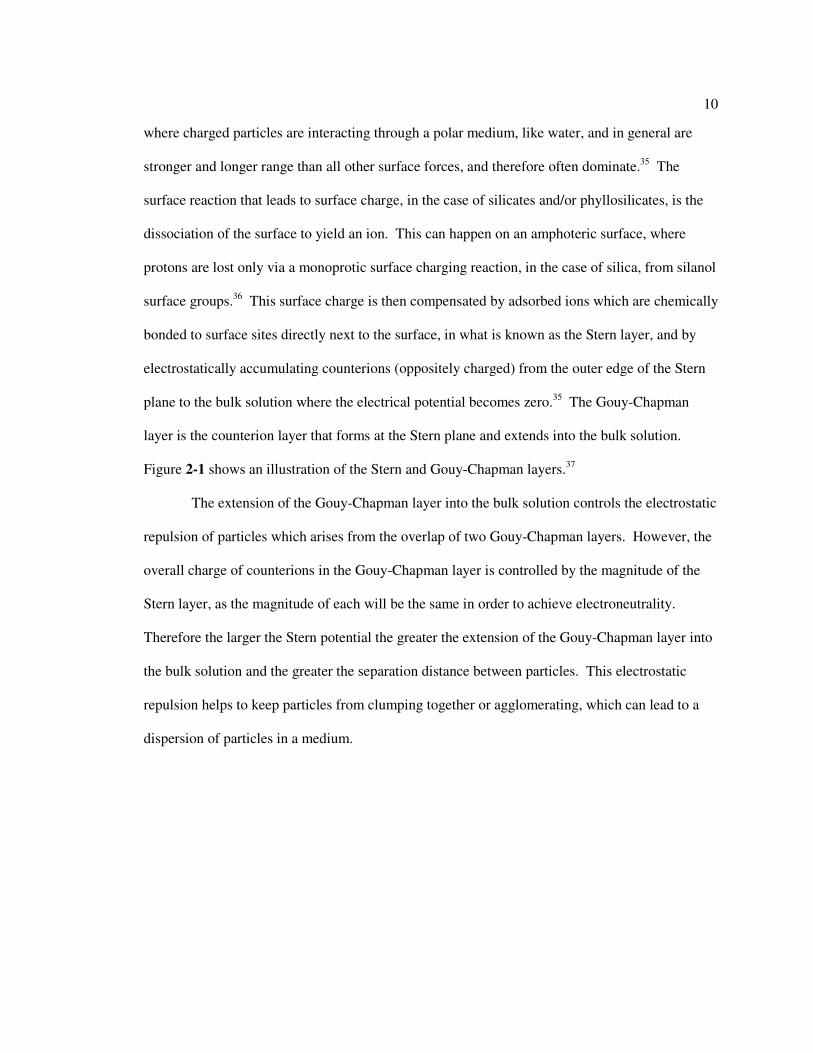
Figure 2-1 shows an illustration of the Stern and Gouy-Chapman layers.37
The extension of the Gouy-Chapman layer into the bulk solution controls the electrostatic
repulsion of particles which arises from the overlap of two Gouy-Chapman layers. However, the
overall charge of counterions in the Gouy-Chapman layer is controlled by the magnitude of the
Stern layer, as the magnitude of each will be the same in order to achieve electroneutrality.
Therefore the larger the Stern potential the greater the extension of the Gouy-Chapman layer into
the bulk solution and the greater the separation distance between particles. This electrostatic
repulsion helps to keep particles from clumping together or agglomerating, which can lead to a
dispersion of particles in a medium.
11
Using Ionic Liquids
Medium-grade Canadian Tar Sand
Since electrostatic repulsion and charge regulation seem to play an important role in
bitumen extraction, it would seem advantageous to use an ionic liquid to extract bitumen from tar
sands. Initially, it was not completely understood which ionic liquid would be the most
favorable, but ILs based on imidazolium cations were chosen. The properties of these solvents
can be “tuned” by varying the substituent groups on the imidazolium ring, and by varying the
Figure 2-1: The electric double layer of a charged particle showing the Stern layer and Gouy-Chapman layer (in this picture defined as the diffuse layer of counterions). http://www.waterworld.com/index/display/article-display/357438/articles/water-wastewater-international/volume-24/issue-1/features/korea-explores-sludge-amp-odor-control-alternatives.html
12
nature of the anion. Typically the solubility of different species in imidazolium ILs depends on
polarity and the ability of hydrogen bonds to form. Aldehydes can be completely miscible in
ionic liquids, while saturated aliphatic compounds tend to be only sparingly soluble, and olefins
somewhat more soluble, but not completely.38 Because of these “tunable” properties, unusual
combinations of reagents can be brought into the same phase, or multiphase processes can be
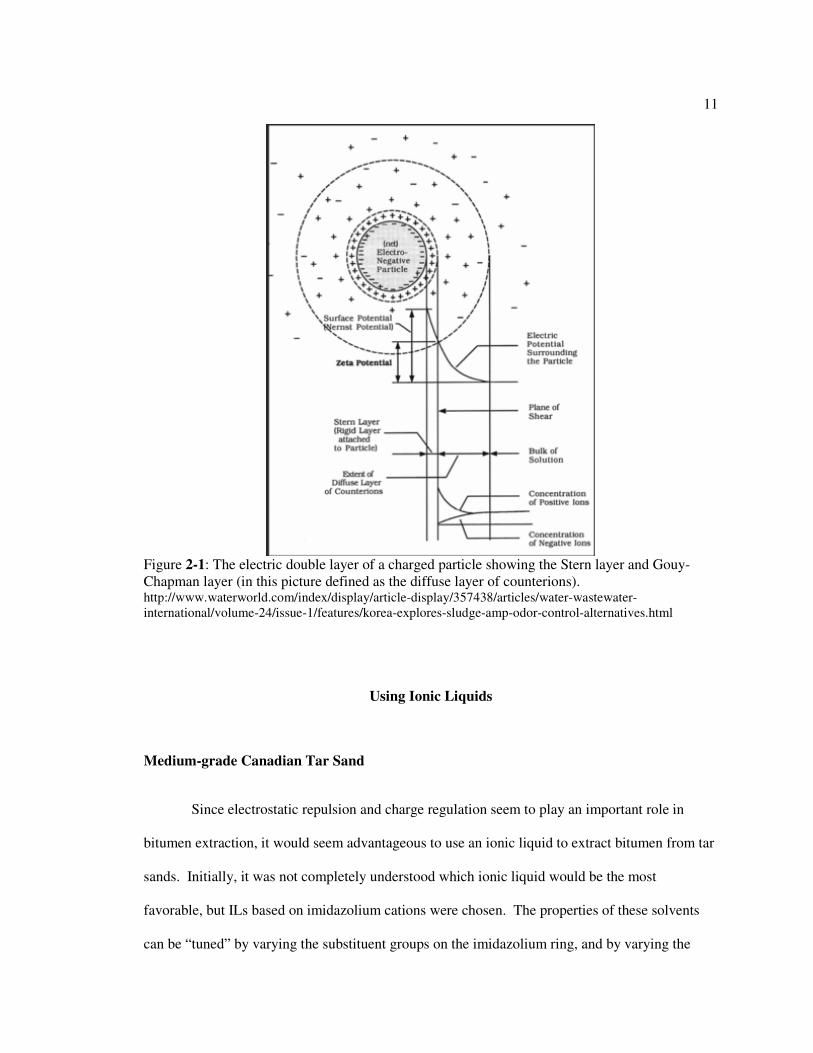
designed. Figure 2-2 show shows an illustration of the ILs used in this part of the study.
The first attempt in extraction was to use the trifluoromethanesulfonate stabilized ionic
liquid. This was accomplished by taking about 1.0 g of Canadian tar sand, 2.0 g of ionic liquid,
3.0 g of toluene, and stirring in a 25 mL glass vial at ambient temperature. The ionic liquid was
added to the tar sands first, followed by toluene and allowed to stir overnight. This experiment
however, ended in complete failure. Instead of separating bitumen from the sand, spherical
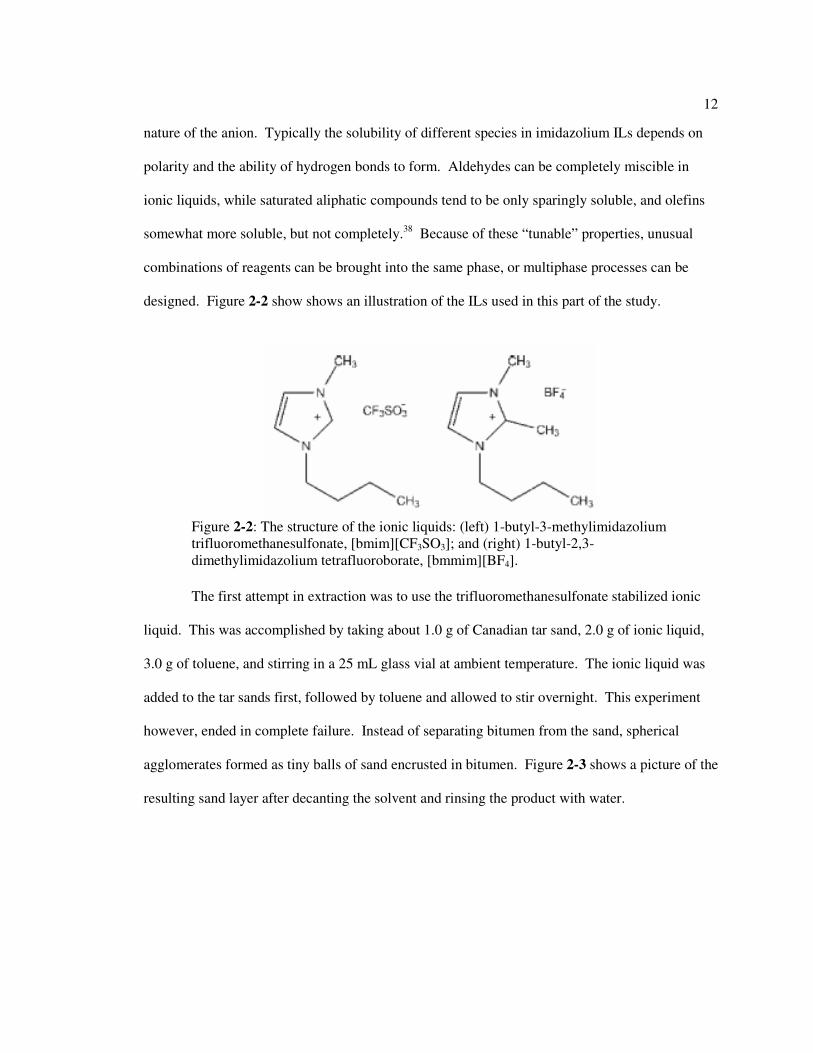
agglomerates formed as tiny balls of sand encrusted in bitumen. Figure 2-3 shows a picture of the
resulting sand layer after decanting the solvent and rinsing the product with water.
Figure 2-2: The structure of the ionic liquids: (left) 1-butyl-3-methylimidazolium trifluoromethanesulfonate, [bmim][CF3SO3]; and (right) 1-butyl-2,3-dimethylimidazolium tetrafluoroborate, [bmmim][BF4].
13
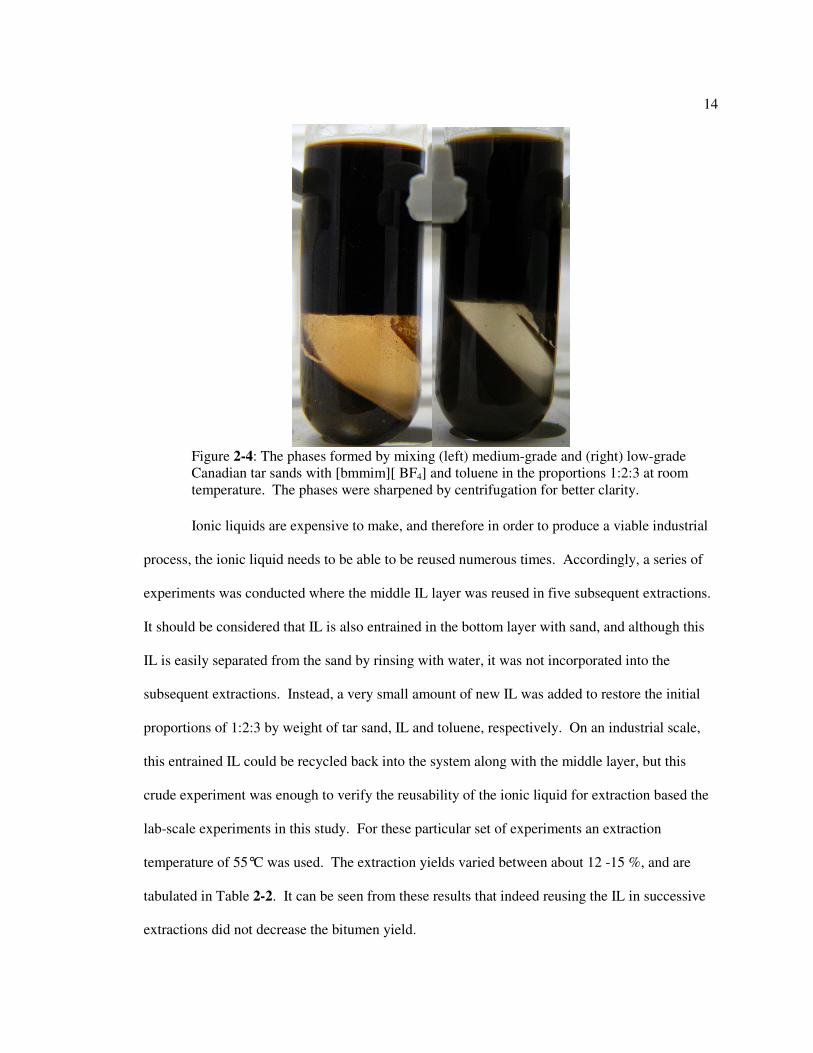
Next, the tetrafluoroborate ionic liquid was used. The same proportions as before were
used, 1:2:3 by weight, and the same procedure was followed. This experiment yielded a nice
three-phase system, shown in Figure 2-4. The bottom layer consisted of sand and clays
suspended in the IL, the middle layer contained the IL with a small amount of dissolved or
suspended bitumen particles and some mineral fines, and the top layer a mixture of toluene and
bitumen. The top layer of organics was carefully removed from the other layers using a pipette.
It was crucial to get close enough to the interface to measure an accurate bitumen yield, but not
too close as to entrain IL which may later contaminate spectroscopic studies, and also give an
error in the yield. The toluene was evaporated in a separate glass vial in a vacuum oven and the
weight taken to determine yield. This experiment was repeated at elevated temperature (55°C),
with stirring for only 10 min and 2 hours at room temperature, and at room temperature without
the inclusion of ionic liquid (toluene-only extraction). Table 2-1 shows the yields achieved for
these various extractions.
Figure 2-3: The agglomerates that were formed by mixing tar sands with [bmim][CF3SO3], after removal of ionic liquid by rinsing with water.
14
Ionic liquids are expensive to make, and therefore in order to produce a viable industrial
process, the ionic liquid needs to be able to be reused numerous times. Accordingly, a series of
experiments was conducted where the middle IL layer was reused in five subsequent extractions.
It should be considered that IL is also entrained in the bottom layer with sand, and although this
IL is easily separated from the sand by rinsing with water, it was not incorporated into the
subsequent extractions. Instead, a very small amount of new IL was added to restore the initial
proportions of 1:2:3 by weight of tar sand, IL and toluene, respectively. On an industrial scale,
this entrained IL could be recycled back into the system along with the middle layer, but this
crude experiment was enough to verify the reusability of the ionic liquid for extraction based the
lab-scale experiments in this study. For these particular set of experiments an extraction
temperature of 55°C was used. The extraction yields varied between about 12 -15 %, and are
tabulated in Table 2-2. It can be seen from these results that indeed reusing the IL in successive
extractions did not decrease the bitumen yield.
Figure 2-4: The phases formed by mixing (left) medium-grade and (right) low-grade Canadian tar sands with [bmmim][ BF4] and toluene in the proportions 1:2:3 at room temperature. The phases were sharpened by centrifugation for better clarity.
15
The variation in repeat experiments shown in Table 2-1, as well as the variation in
subsequent extractions using the recycled IL shown in Table 2-2, is not surprising due to the
inconsistency of the bitumen content in the tar sand samples themselves, as well as the fact that
only about 1.0 g of sample was used in each extraction experiment. The MSDS of the tar sands
used, which were obtained from The Alberta Research Council, indicates a bitumen content
between 6-20 wt%. This is an extremely broad range, but it is because tar sands are usually
classified by content visually by the distributor, and are very heterogeneous. Also, since such
small samples of tar sands were used, it was assumed that there would be some variation in the
bitumen content of each sample for each experiment. To try to make a more accurate
comparison, bitumen was extracted using toluene alone at room temperature. These yields are
Table 2-1: Yields of Bitumen Obtained by Various Extraction Methods
Extraction Method Extraction Yield (wt %)
RT-Overnight (1) 11.1
RT-Overnight (2) 17.0
55°C-Overnight (1) 12.6
55°C-Overnight (2) 14.7
RT-10 min 7.5
RT-120 min 12.7
RT-Just Toluene (1) 14.3
RT-Just Toluene (2) 14.5
Table 2-2: Yields of Bitumen Obtained by Extraction of Tar Sand
Using Recycled Ionic Liquid
Extraction Number Extraction Yield (wt %)
1 13.5
2 12.7
3 14.5
4 15.1
5 13.4
16
shown in Table 2-1, and were 14.3 and 14.5%. Considering that some of this yield is due to the
weight of clay fines that contaminate the toluene (as shown below), the extractions with toluene
alone are about the average of most of the extractions with ionic liquid.
The ionic liquid used in this study is hydrophilic and can be easily removed from the
bottom mineral layer by rinsing with cold (i.e., room temperature) water. After the organic layer
was separated by pipetting, the middle IL layer was removed in the same manner. About 20 mL
of cold water was added to the sand layer, agitated, and the minerals allowed to settle. The
resulting water was decanted or drawn off with a pipette. The resulting sand was then rinsed with
two additional 20 mL portions of deionized water during vacuum filtration, and allowed to dry in
a vacuum oven.
A Fourier transform infrared (FTIR) spectroscopic study was performed in order to
determine if all of the bitumen and ionic liquid was removed from the minerals, and if any
mineral fines were present in the bitumen extracts. FTIR diffuse-reflectance samples were
prepared according to the procedures presented in Appendix A. Not only were no minerals
detected in the bitumen extracts using IL, it was also shown that all bitumen was extracted from
the tar sands, and that no residual IL was left in the minerals. Figure 2-5 compare infrared spectra
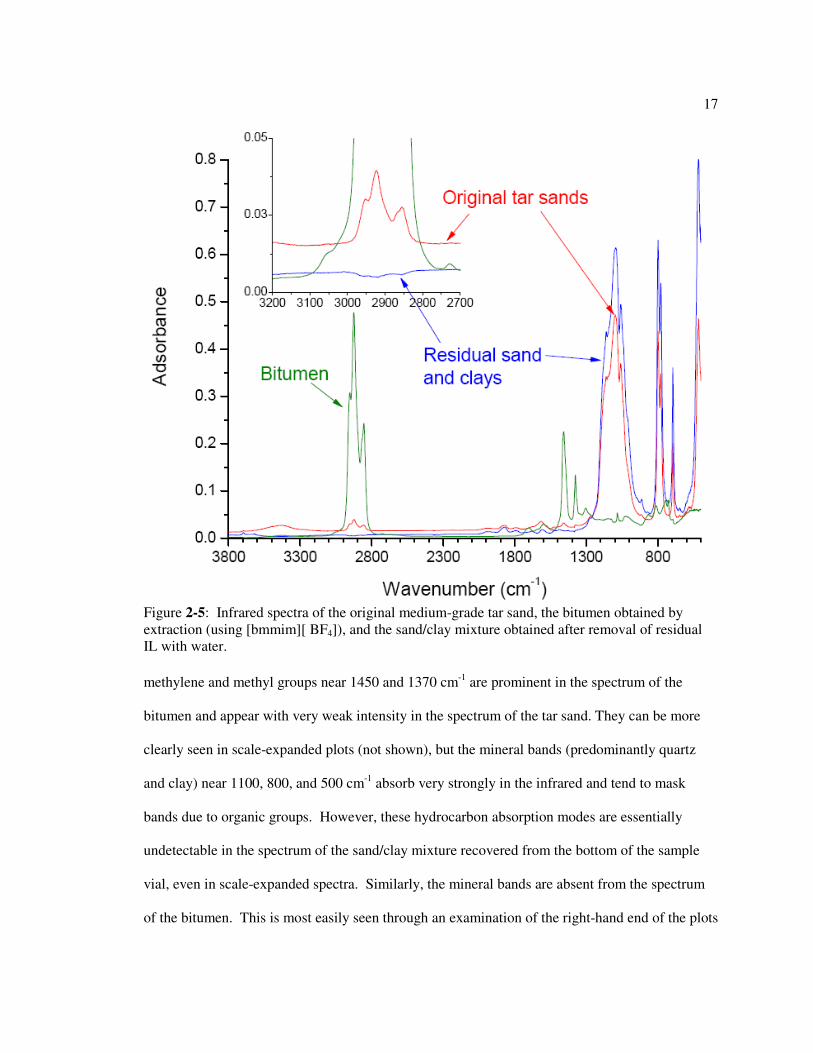
of the as-received sample, extracted bitumen, and resulting mineral layer. Bands due to
17
methylene and methyl groups near 1450 and 1370 cm-1 are prominent in the spectrum of the
bitumen and appear with very weak intensity in the spectrum of the tar sand. They can be more
clearly seen in scale-expanded plots (not shown), but the mineral bands (predominantly quartz
and clay) near 1100, 800, and 500 cm-1 absorb very strongly in the infrared and tend to mask
bands due to organic groups. However, these hydrocarbon absorption modes are essentially
undetectable in the spectrum of the sand/clay mixture recovered from the bottom of the sample
vial, even in scale-expanded spectra. Similarly, the mineral bands are absent from the spectrum
of the bitumen. This is most easily seen through an examination of the right-hand end of the plots
Figure 2-5: Infrared spectra of the original medium-grade tar sand, the bitumen obtained by extraction (using [bmmim][ BF4]), and the sand/clay mixture obtained after removal of residual IL with water.
18
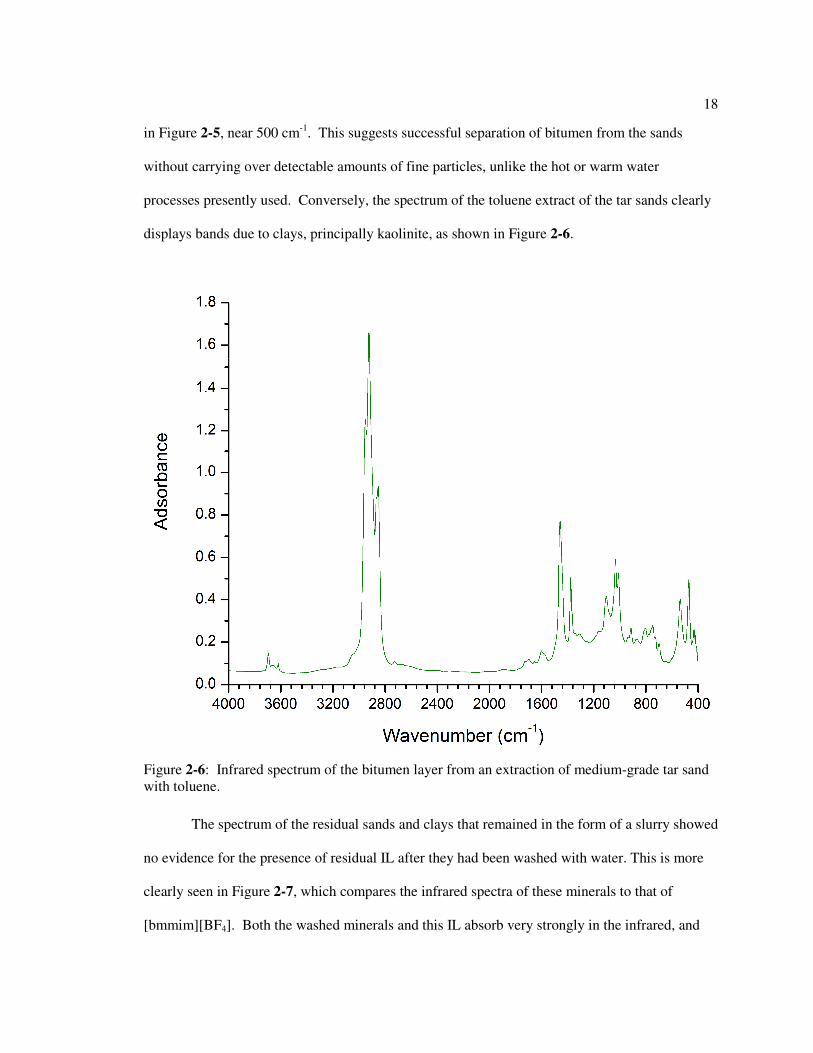
in Figure 2-5, near 500 cm-1. This suggests successful separation of bitumen from the sands
without carrying over detectable amounts of fine particles, unlike the hot or warm water
processes presently used. Conversely, the spectrum of the toluene extract of the tar sands clearly
displays bands due to clays, principally kaolinite, as shown in Figure 2-6.
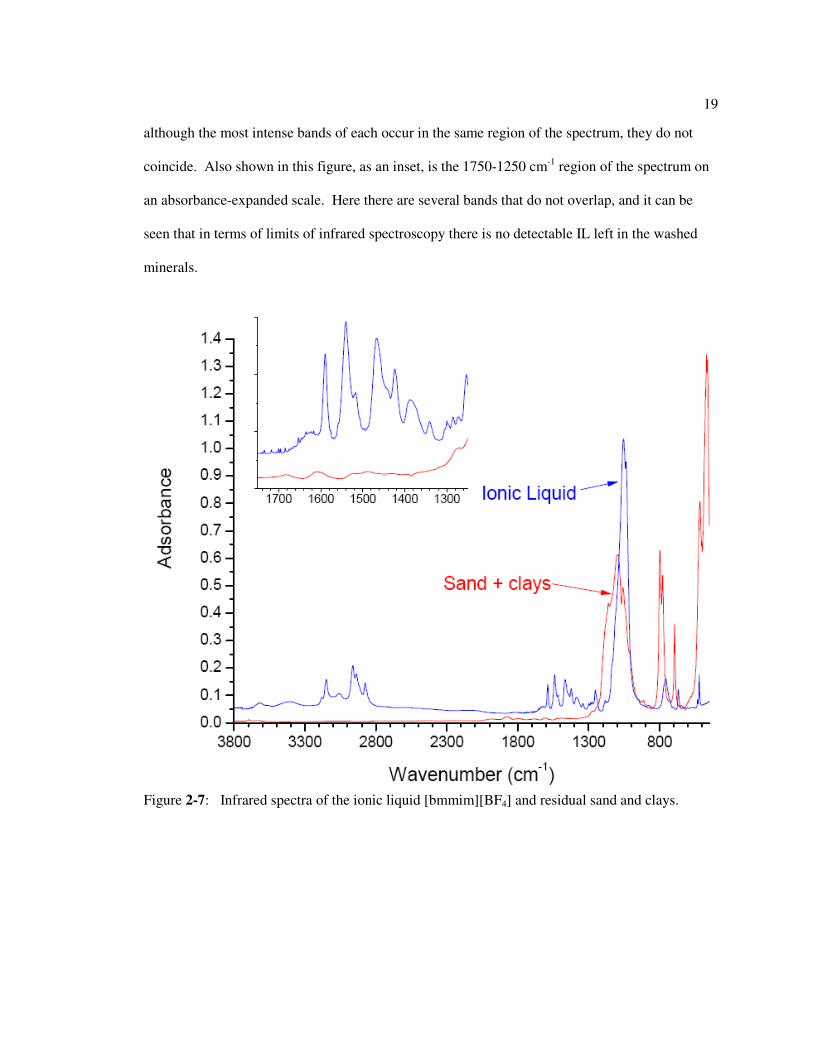
The spectrum of the residual sands and clays that remained in the form of a slurry showed
no evidence for the presence of residual IL after they had been washed with water. This is more
clearly seen in Figure 2-7, which compares the infrared spectra of these minerals to that of
[bmmim][BF4]. Both the washed minerals and this IL absorb very strongly in the infrared, and
Figure 2-6: Infrared spectrum of the bitumen layer from an extraction of medium-grade tar sand with toluene.
19
although the most intense bands of each occur in the same region of the spectrum, they do not
coincide. Also shown in this figure, as an inset, is the 1750-1250 cm-1 region of the spectrum on
an absorbance-expanded scale. Here there are several bands that do not overlap, and it can be
seen that in terms of limits of infrared spectroscopy there is no detectable IL left in the washed
minerals.
Figure 2-7: Infrared spectra of the ionic liquid [bmmim][BF4] and residual sand and clays.

20
Low-grade Canadian Tar Sand
Since the [bmmim][ BF4] ionic liquid seemed to work well extracting bitumen from the
medium-grade Canadian tar sands, a sample of low-grade Canadian tar sands was obtained from
The Alberta Research Council. This particular grade of tar sands poses more problems for
current processing methods because not only does it have a much lower bitumen content, there
are considerably more fines overall and as mentioned previously these fines can be partly
hydrophobic. Nonetheless, the same experimental procedure that was used for the medium-grade
tar sands was employed, and a similar result was obtained. Figure 2-4 shows a comparison of the
three-phase systems obtained using the same experimental procedures. This experiment was
repeated four times in order to compare yields, as well as one time using only toluene as a
comparison, as done before. The resulting yields are tabulated in Table 2-3. Again, there is a
considerable amount of variability in the yields, and also the toluene-only extraction is much
higher due to the weight of mineral fines. The variability in yield can again be attributed to the
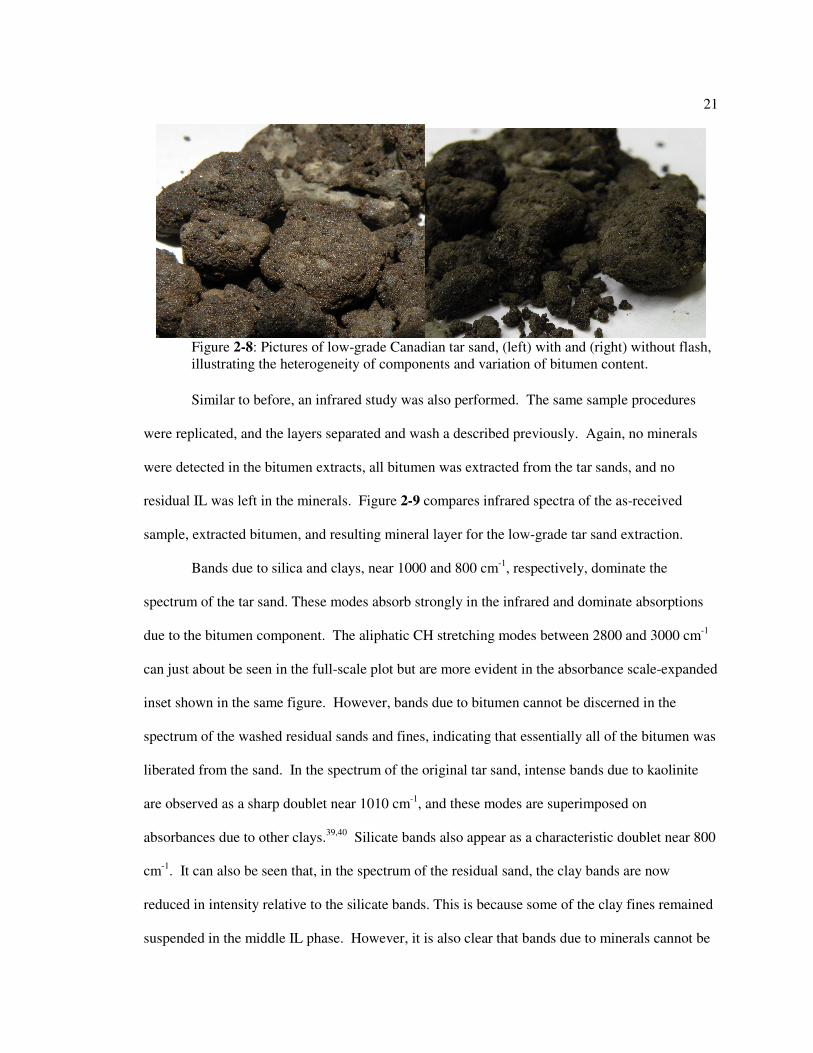
small sample size and the heterogeneity of the tar sand. Figure 2-8 illustrates the heterogeneity of
the low-grade Canadian tar sands, and why the bitumen content of each 1.0 g sample could vary
so much.
Table 2-3: Yields of Bitumen Obtained by the
Extraction of Low-Grade Tar Sand
Extraction Number Extraction Yield (wt %)
1 7.5
2 5.5
3 4.4
4 6.0
Toluene only 12.9
21
Similar to before, an infrared study was also performed. The same sample procedures
were replicated, and the layers separated and wash a described previously. Again, no minerals
were detected in the bitumen extracts, all bitumen was extracted from the tar sands, and no
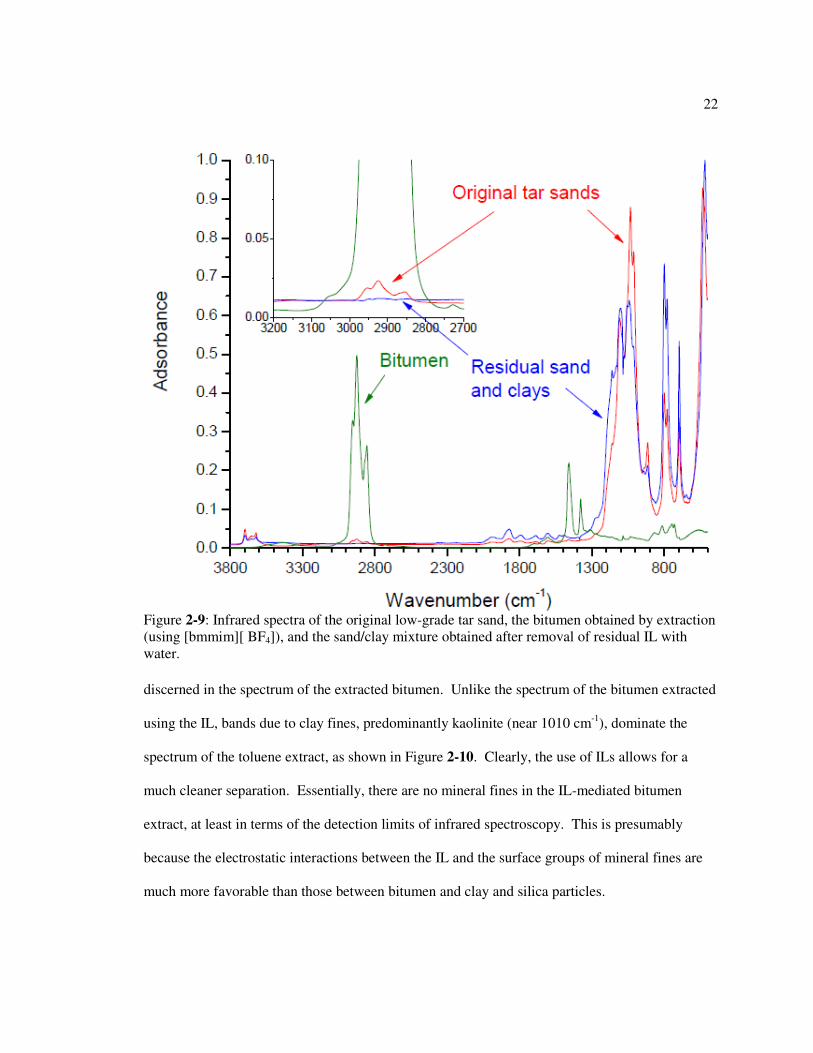
residual IL was left in the minerals. Figure 2-9 compares infrared spectra of the as-received
sample, extracted bitumen, and resulting mineral layer for the low-grade tar sand extraction.
Bands due to silica and clays, near 1000 and 800 cm-1, respectively, dominate the
spectrum of the tar sand. These modes absorb strongly in the infrared and dominate absorptions
due to the bitumen component. The aliphatic CH stretching modes between 2800 and 3000 cm-1
can just about be seen in the full-scale plot but are more evident in the absorbance scale-expanded
inset shown in the same figure. However, bands due to bitumen cannot be discerned in the
spectrum of the washed residual sands and fines, indicating that essentially all of the bitumen was
liberated from the sand. In the spectrum of the original tar sand, intense bands due to kaolinite
are observed as a sharp doublet near 1010 cm-1, and these modes are superimposed on
absorbances due to other clays.39,40 Silicate bands also appear as a characteristic doublet near 800
cm-1. It can also be seen that, in the spectrum of the residual sand, the clay bands are now
reduced in intensity relative to the silicate bands. This is because some of the clay fines remained
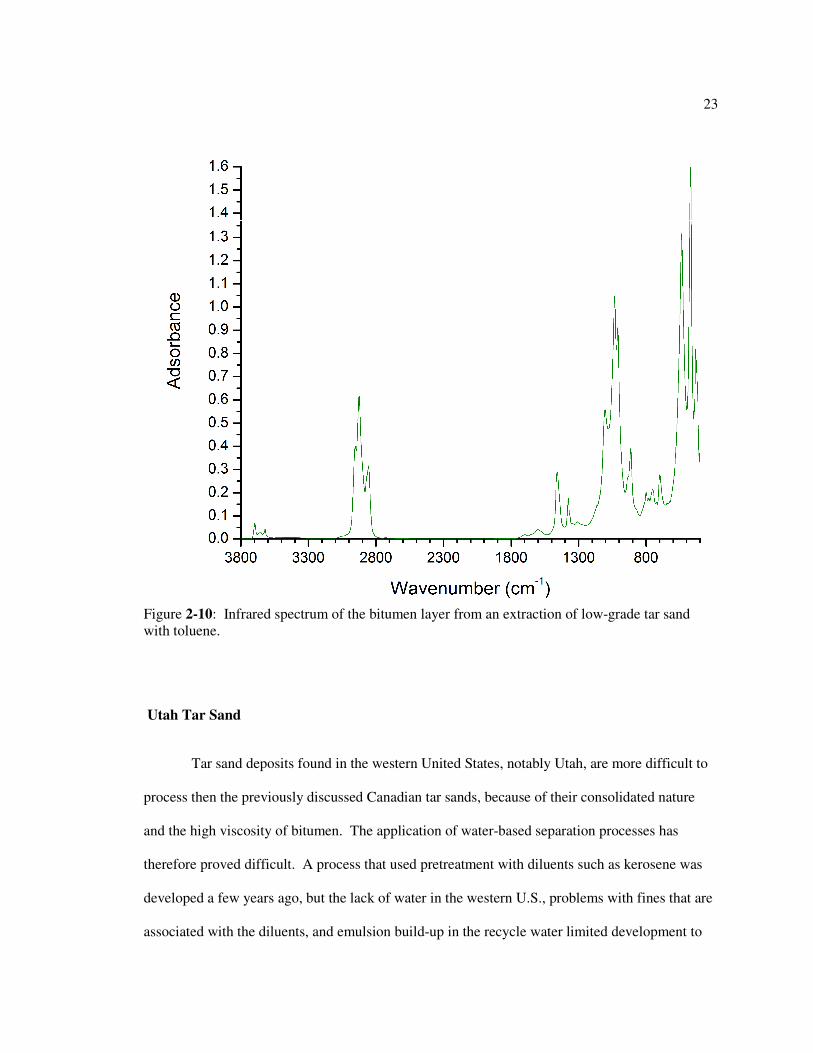
suspended in the middle IL phase. However, it is also clear that bands due to minerals cannot be
Figure 2-8: Pictures of low-grade Canadian tar sand, (left) with and (right) without flash, illustrating the heterogeneity of components and variation of bitumen content.
22
discerned in the spectrum of the extracted bitumen. Unlike the spectrum of the bitumen extracted
using the IL, bands due to clay fines, predominantly kaolinite (near 1010 cm-1), dominate the
spectrum of the toluene extract, as shown in Figure 2-10. Clearly, the use of ILs allows for a
much cleaner separation. Essentially, there are no mineral fines in the IL-mediated bitumen
extract, at least in terms of the detection limits of infrared spectroscopy. This is presumably
because the electrostatic interactions between the IL and the surface groups of mineral fines are
much more favorable than those between bitumen and clay and silica particles.
Figure 2-9: Infrared spectra of the original low-grade tar sand, the bitumen obtained by extraction (using [bmmim][ BF4]), and the sand/clay mixture obtained after removal of residual IL with water.
23
Utah Tar Sand
Tar sand deposits found in the western United States, notably Utah, are more difficult to
process then the previously discussed Canadian tar sands, because of their consolidated nature
and the high viscosity of bitumen. The application of water-based separation processes has
therefore proved difficult. A process that used pretreatment with diluents such as kerosene was
developed a few years ago, but the lack of water in the western U.S., problems with fines that are
associated with the diluents, and emulsion build-up in the recycle water limited development to
Figure 2-10: Infrared spectrum of the bitumen layer from an extraction of low-grade tar sand with toluene.
24
the pilot-plant scale.41,42 More recently, it has been shown that a water–based extraction process
can be used,43 but this requires higher temperatures and higher mechanical energy levels than
those used in processing Canadian tar sands.
Employing a similar method as with the Canadian tar sands, bitumen can also be
extracted from Utah tar sand. Using an ionic liquid and a non-polar organic solvent, in this case
[bmmim][ BF4] and toluene, respectively, a three-phase system was attempted as done
previously. At first, the method described previously for the Canadian tar sands was used. Ionic
liquid was added to about 1.0 g of Utah tar sands, then toluene added and allowed to stir
overnight. The ratio used was 1:2.5:4, tar sand, ionic liquid and toluene, respectively.
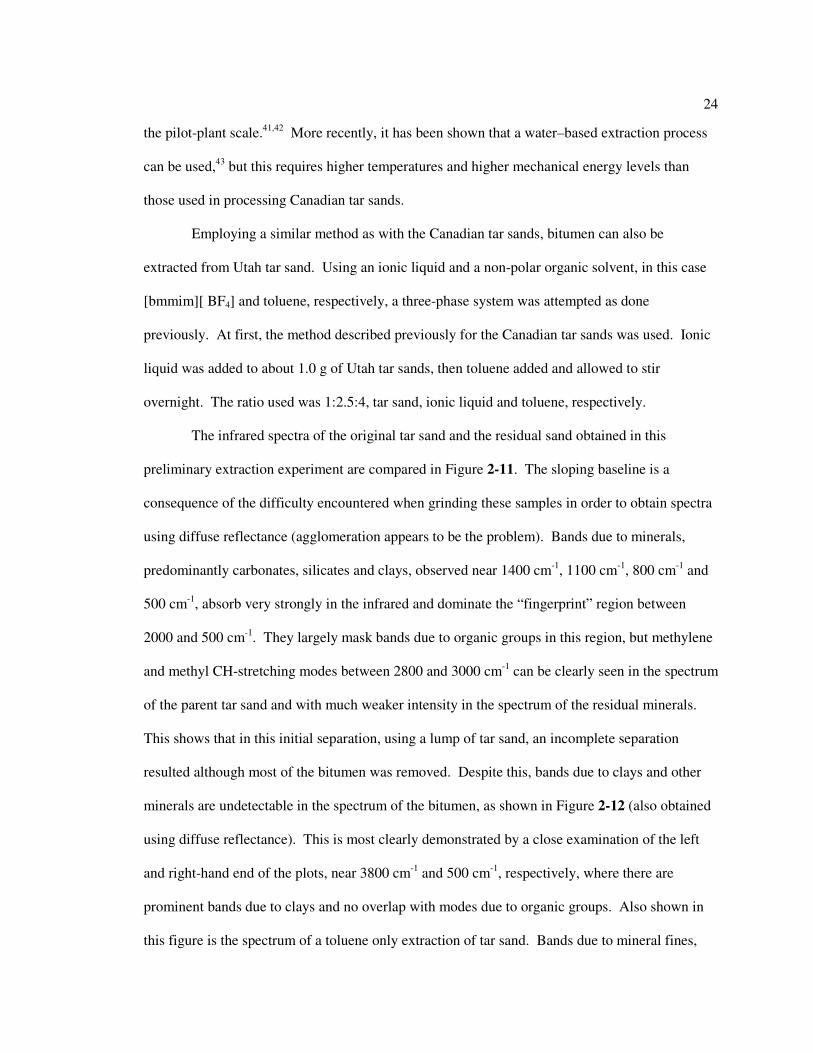
The infrared spectra of the original tar sand and the residual sand obtained in this
preliminary extraction experiment are compared in Figure 2-11. The sloping baseline is a
consequence of the difficulty encountered when grinding these samples in order to obtain spectra
using diffuse reflectance (agglomeration appears to be the problem). Bands due to minerals,
predominantly carbonates, silicates and clays, observed near 1400 cm-1, 1100 cm-1, 800 cm-1 and
500 cm-1, absorb very strongly in the infrared and dominate the “fingerprint” region between
2000 and 500 cm-1. They largely mask bands due to organic groups in this region, but methylene
and methyl CH-stretching modes between 2800 and 3000 cm-1 can be clearly seen in the spectrum
of the parent tar sand and with much weaker intensity in the spectrum of the residual minerals.
This shows that in this initial separation, using a lump of tar sand, an incomplete separation
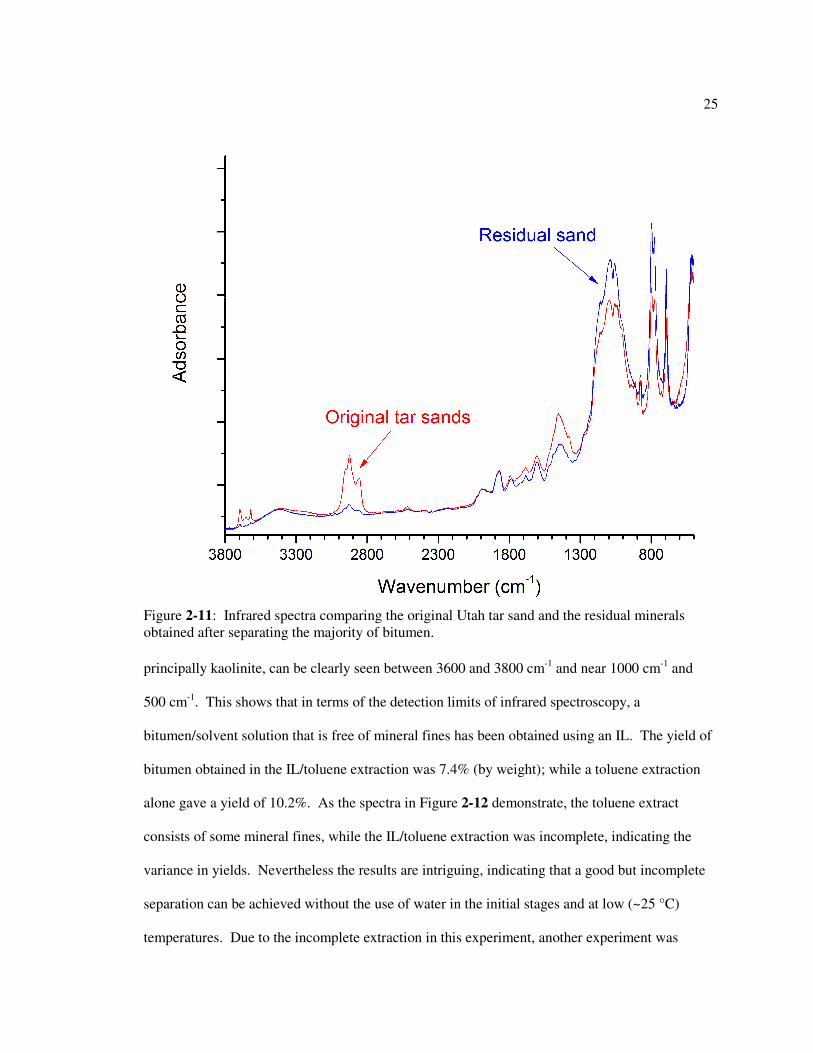
resulted although most of the bitumen was removed. Despite this, bands due to clays and other
minerals are undetectable in the spectrum of the bitumen, as shown in Figure 2-12 (also obtained
using diffuse reflectance). This is most clearly demonstrated by a close examination of the left
and right-hand end of the plots, near 3800 cm-1 and 500 cm-1, respectively, where there are
prominent bands due to clays and no overlap with modes due to organic groups. Also shown in
this figure is the spectrum of a toluene only extraction of tar sand. Bands due to mineral fines,
25
principally kaolinite, can be clearly seen between 3600 and 3800 cm-1 and near 1000 cm-1 and
500 cm-1. This shows that in terms of the detection limits of infrared spectroscopy, a
bitumen/solvent solution that is free of mineral fines has been obtained using an IL. The yield of
bitumen obtained in the IL/toluene extraction was 7.4% (by weight); while a toluene extraction
alone gave a yield of 10.2%. As the spectra in Figure 2-12 demonstrate, the toluene extract
consists of some mineral fines, while the IL/toluene extraction was incomplete, indicating the
variance in yields. Nevertheless the results are intriguing, indicating that a good but incomplete
separation can be achieved without the use of water in the initial stages and at low (~25 °C)
temperatures. Due to the incomplete extraction in this experiment, another experiment was
Figure 2-11: Infrared spectra comparing the original Utah tar sand and the residual minerals obtained after separating the majority of bitumen.
26
repeated, but using a slightly different protocol.
A small chunk of Utah tar sand approximately 1.0 g was placed in a vial and ionic liquid
added. This mixture was allowed to stir overnight, but as shown in Figure 2-13 ionic liquid alone
was not enough to cause the chunk of tar sands to break apart. It can be seen that under these
conditions the tar sand does not break apart, and the IL remains optically clear indicating that
only a small amount of bitumen, if any, was extracted. This is in contrast to the Canadian tar
sands as it was shown that certain IL’s did react with bitumen on their own.44 In this case,
Figure 2-12: Infrared spectra of the bitumen obtained from an extraction of tar sand with [bmmim][BF4]/toluene and using just toluene.
27
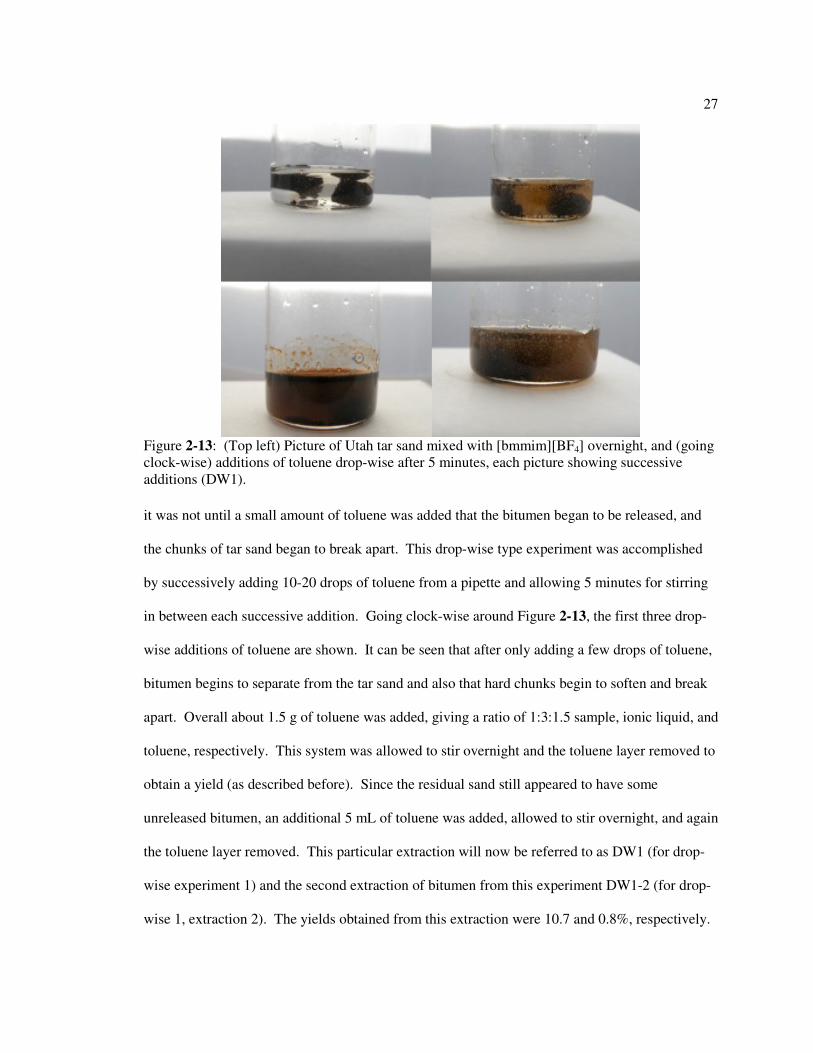
it was not until a small amount of toluene was added that the bitumen began to be released, and
the chunks of tar sand began to break apart. This drop-wise type experiment was accomplished
by successively adding 10-20 drops of toluene from a pipette and allowing 5 minutes for stirring
in between each successive addition. Going clock-wise around Figure 2-13, the first three drop-
wise additions of toluene are shown. It can be seen that after only adding a few drops of toluene,
bitumen begins to separate from the tar sand and also that hard chunks begin to soften and break
apart. Overall about 1.5 g of toluene was added, giving a ratio of 1:3:1.5 sample, ionic liquid, and
toluene, respectively. This system was allowed to stir overnight and the toluene layer removed to
obtain a yield (as described before). Since the residual sand still appeared to have some
unreleased bitumen, an additional 5 mL of toluene was added, allowed to stir overnight, and again
the toluene layer removed. This particular extraction will now be referred to as DW1 (for drop-
wise experiment 1) and the second extraction of bitumen from this experiment DW1-2 (for drop-
wise 1, extraction 2). The yields obtained from this extraction were 10.7 and 0.8%, respectively.
Figure 2-13: (Top left) Picture of Utah tar sand mixed with [bmmim][BF4] overnight, and (going clock-wise) additions of toluene drop-wise after 5 minutes, each picture showing successive additions (DW1).

28
Interestingly, the structure of the more difficult to remove bitumen, the second extraction,
appeared to be different to the material that came off initially. The infrared spectra of cast films
of the two bitumen samples are compared in Figures 2-14 (DW1 and DW1-2). It can be seen that
both spectra are dominated by aliphatic CH-stretching modes near 2900 cm-1, but there are clear
differences in the 1700 cm-1 region of the spectra and the second extract also has a weak band
near 878 cm-1, that can be assigned to carbonates. A scale-expanded plot of the region between
1800 cm-1 to 1200 cm-1 is shown in the inset of Figure 2-14. The bands near 1705 cm-1 can be
assigned to carboxylic acid groups, while the band near 1730 cm-1 can be assigned to esters. The
latter is much more intense in the spectrum of the final, more difficult to remove extract (DW1-
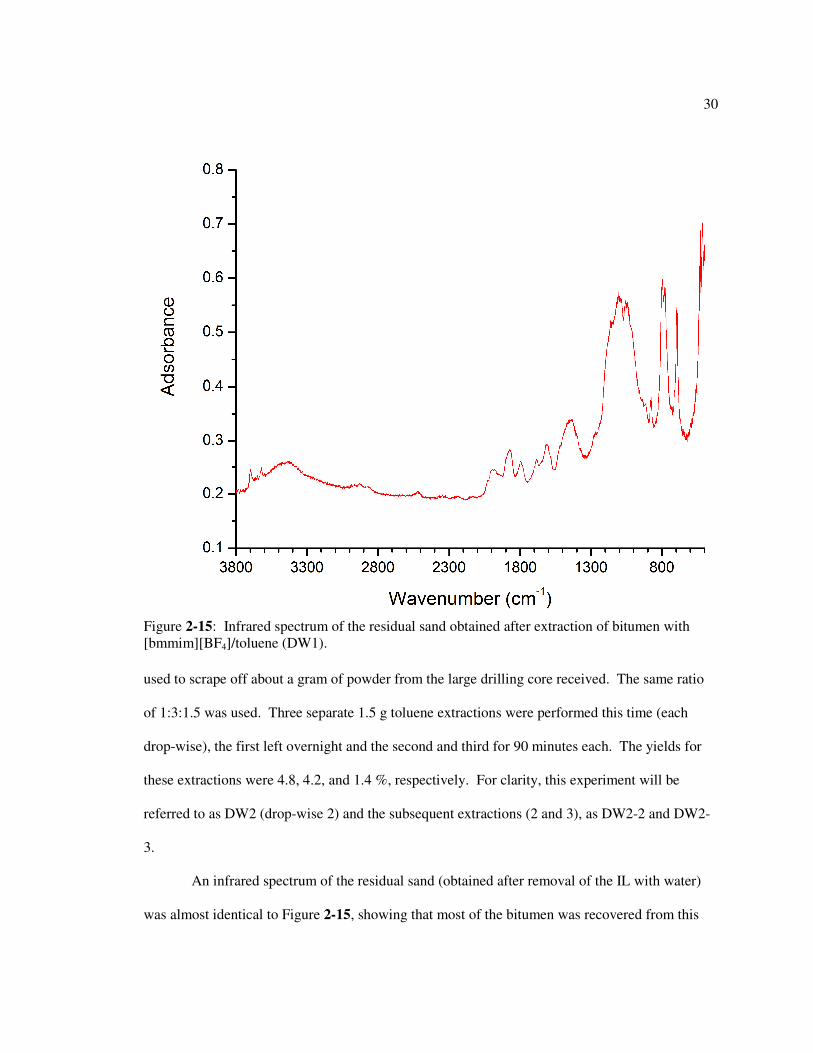
2). The origin of this band will be considered shortly, but first the spectrum of the residual sand,
shown in Figure 2-15 (obtained after removal of the IL with water), will be discussed. It can be
seen that there is some weak residual absorption near 2900 cm-1 due to organic groups, but this is
practically in the noise level, indicating that well over 90% of the bitumen has been extracted.
Although shoulders near 1730 cm-1 can be clearly seen in the spectra of both the IL/toluene and
toluene-extracted bitumen shown in Figure 2-12, they are much less intense and other bands, such
as those near 1288 cm-1 and 1273 cm-1 (C–O single bond stretch of esters?), are not as apparent.
In addition, although it would not be surprising that some mineral matter becomes entrained as a
result of this relatively crude laboratory separation, why would this be limited to carbonates? An
examination of the spectrum of the original tar sand (Figure 2-11) indicates that silicates and
clays (intense bands between 1100 – 1000 cm-1, and near 800 cm-1 and 500 cm-1) comprise a
larger proportion of the mineral matter in this sample. In addition, in the extraction with toluene
alone, clays, predominantly kaolinite, were extracted with the bitumen (Figure 2-12). It will be
suggested below that esters are actually being formed in a condensation reaction mediated by
carbonates and the ionic liquid. Although more than 75% of the bitumen appears to be released
quickly from the tar sands, the extraction of residual bitumen depends on the sequential
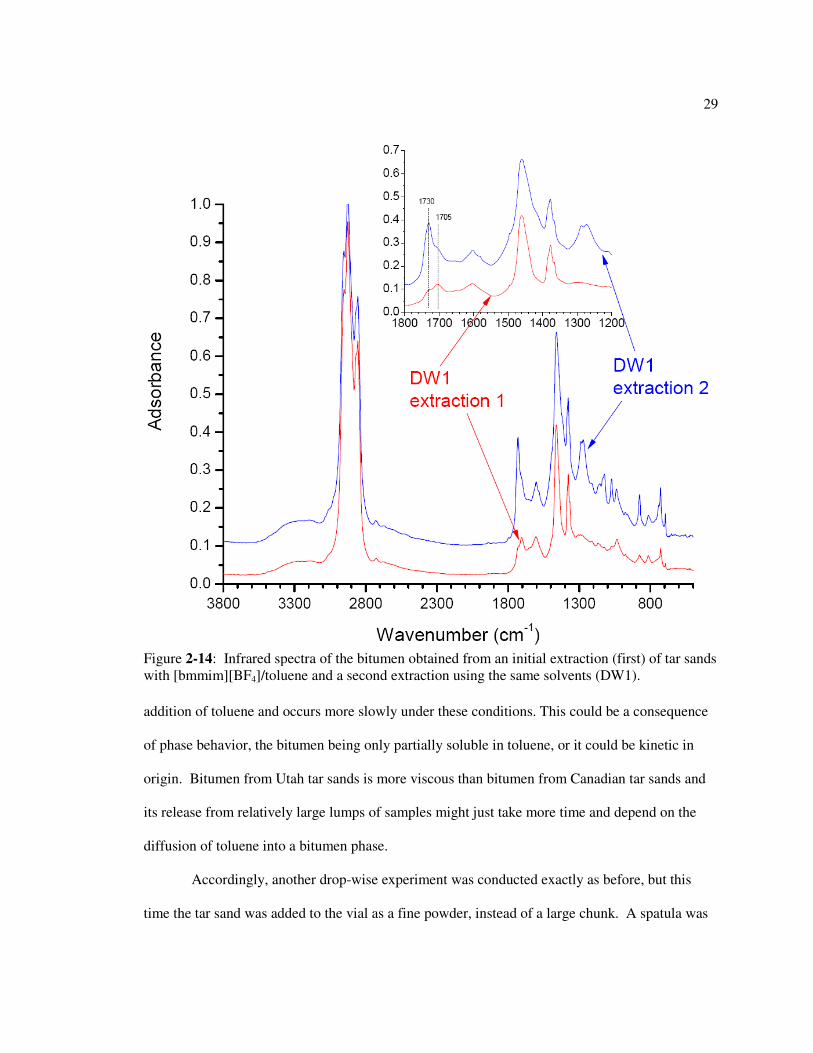
29
addition of toluene and occurs more slowly under these conditions. This could be a consequence
of phase behavior, the bitumen being only partially soluble in toluene, or it could be kinetic in
origin. Bitumen from Utah tar sands is more viscous than bitumen from Canadian tar sands and
its release from relatively large lumps of samples might just take more time and depend on the
diffusion of toluene into a bitumen phase.
Accordingly, another drop-wise experiment was conducted exactly as before, but this
time the tar sand was added to the vial as a fine powder, instead of a large chunk. A spatula was
Figure 2-14: Infrared spectra of the bitumen obtained from an initial extraction (first) of tar sands with [bmmim][BF4]/toluene and a second extraction using the same solvents (DW1).
30
used to scrape off about a gram of powder from the large drilling core received. The same ratio
of 1:3:1.5 was used. Three separate 1.5 g toluene extractions were performed this time (each
drop-wise), the first left overnight and the second and third for 90 minutes each. The yields for
these extractions were 4.8, 4.2, and 1.4 %, respectively. For clarity, this experiment will be
referred to as DW2 (drop-wise 2) and the subsequent extractions (2 and 3), as DW2-2 and DW2-
3.
An infrared spectrum of the residual sand (obtained after removal of the IL with water)
was almost identical to Figure 2-15, showing that most of the bitumen was recovered from this
Figure 2-15: Infrared spectrum of the residual sand obtained after extraction of bitumen with [bmmim][BF4]/toluene (DW1).
31
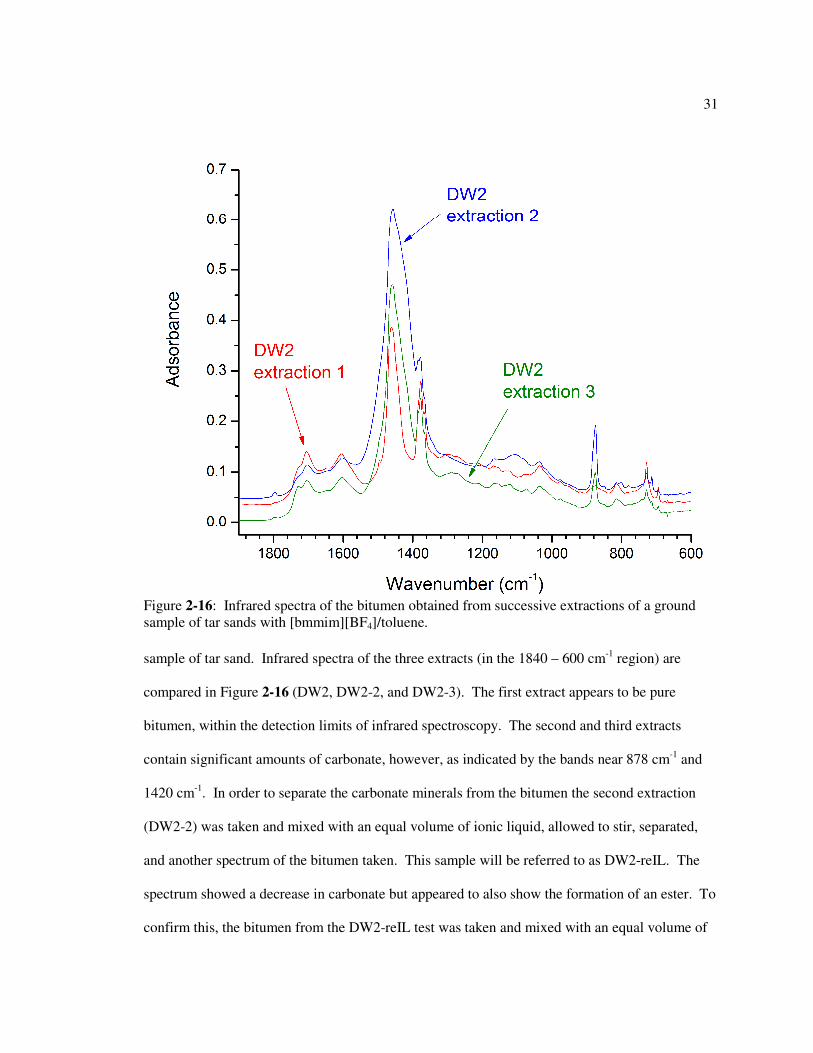
sample of tar sand. Infrared spectra of the three extracts (in the 1840 – 600 cm-1 region) are
compared in Figure 2-16 (DW2, DW2-2, and DW2-3). The first extract appears to be pure
bitumen, within the detection limits of infrared spectroscopy. The second and third extracts
contain significant amounts of carbonate, however, as indicated by the bands near 878 cm-1 and
1420 cm-1. In order to separate the carbonate minerals from the bitumen the second extraction
(DW2-2) was taken and mixed with an equal volume of ionic liquid, allowed to stir, separated,
and another spectrum of the bitumen taken. This sample will be referred to as DW2-reIL. The
spectrum showed a decrease in carbonate but appeared to also show the formation of an ester. To
confirm this, the bitumen from the DW2-reIL test was taken and mixed with an equal volume of
Figure 2-16: Infrared spectra of the bitumen obtained from successive extractions of a ground sample of tar sands with [bmmim][BF4]/toluene.
32
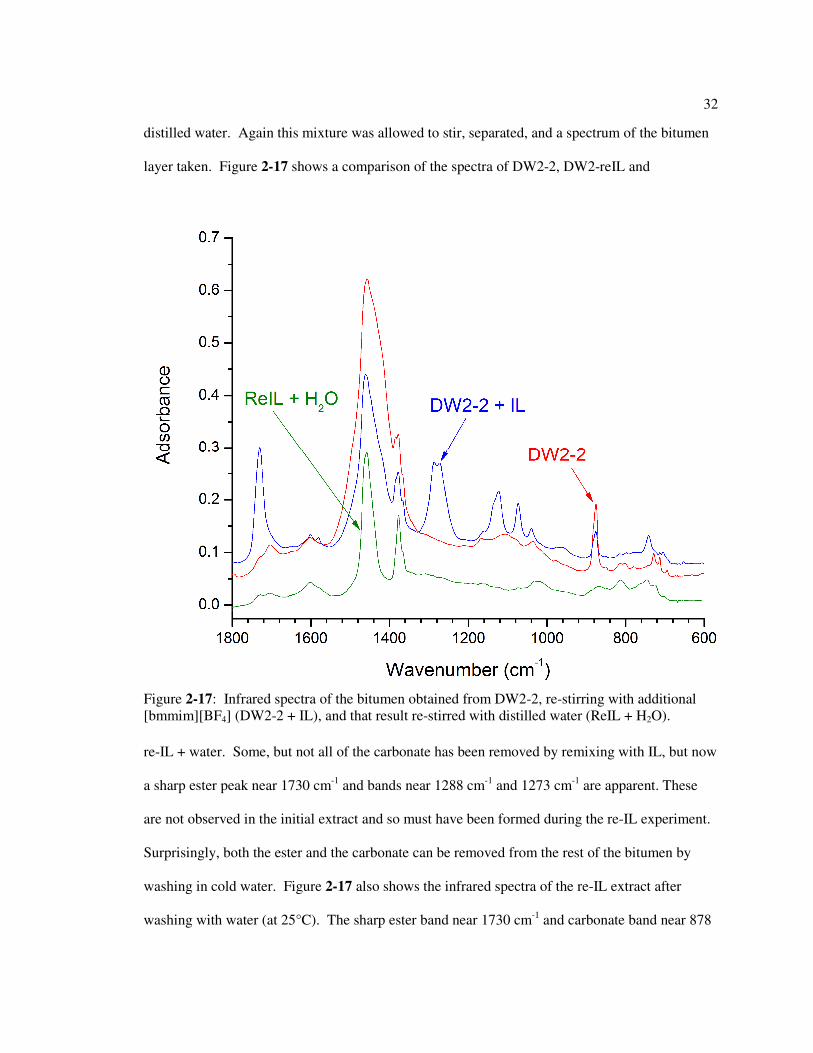
distilled water. Again this mixture was allowed to stir, separated, and a spectrum of the bitumen
layer taken. Figure 2-17 shows a comparison of the spectra of DW2-2, DW2-reIL and
re-IL + water. Some, but not all of the carbonate has been removed by remixing with IL, but now
a sharp ester peak near 1730 cm-1 and bands near 1288 cm-1 and 1273 cm-1 are apparent. These
are not observed in the initial extract and so must have been formed during the re-IL experiment.
Surprisingly, both the ester and the carbonate can be removed from the rest of the bitumen by
washing in cold water. Figure 2-17 also shows the infrared spectra of the re-IL extract after
washing with water (at 25°C). The sharp ester band near 1730 cm-1 and carbonate band near 878
Figure 2-17: Infrared spectra of the bitumen obtained from DW2-2, re-stirring with additional [bmmim][BF4] (DW2-2 + IL), and that result re-stirred with distilled water (ReIL + H2O).
33
cm-1 have now been removed (along with other bands such as those near 1280 cm-1) leaving broad
underlying absorptions that are characteristic of the bitumen obtained in the first IL extraction.
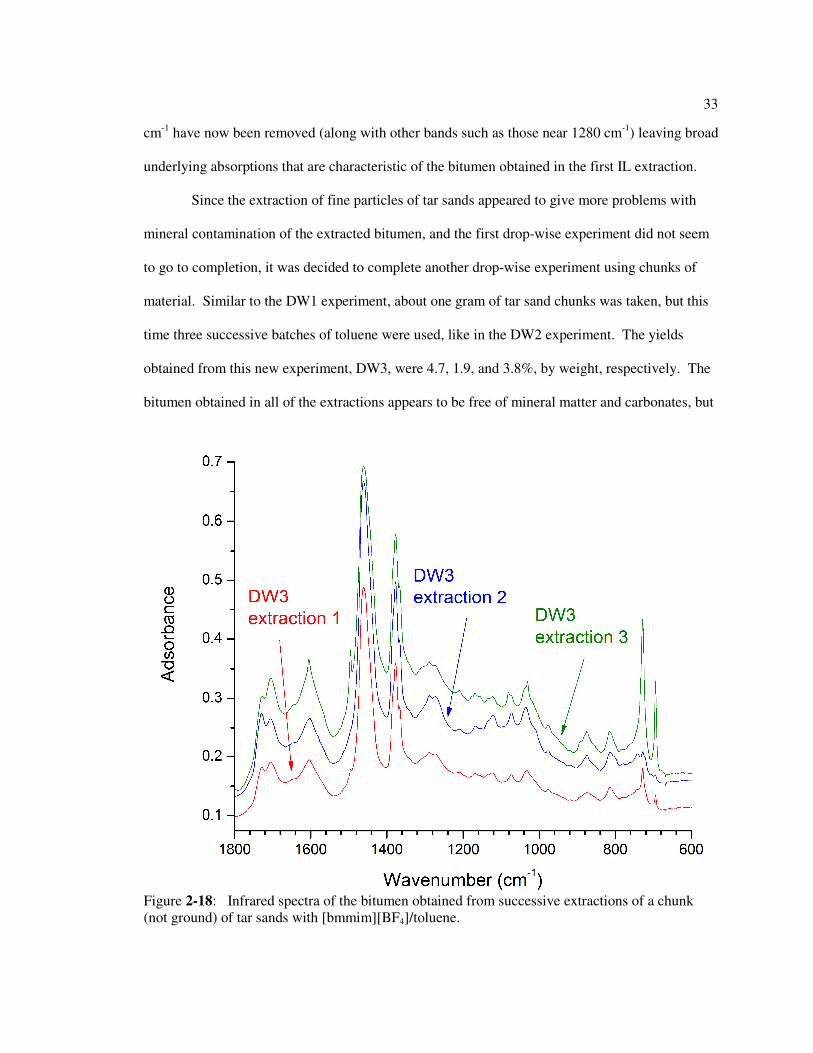
Since the extraction of fine particles of tar sands appeared to give more problems with
mineral contamination of the extracted bitumen, and the first drop-wise experiment did not seem
to go to completion, it was decided to complete another drop-wise experiment using chunks of
material. Similar to the DW1 experiment, about one gram of tar sand chunks was taken, but this
time three successive batches of toluene were used, like in the DW2 experiment. The yields
obtained from this new experiment, DW3, were 4.7, 1.9, and 3.8%, by weight, respectively. The
bitumen obtained in all of the extractions appears to be free of mineral matter and carbonates, but
Figure 2-18: Infrared spectra of the bitumen obtained from successive extractions of a chunk (not ground) of tar sands with [bmmim][BF4]/toluene.
34
some sharp bands were observed in the infrared spectrum of the third extract, as shown in Figure
2-18. These bands turned out to be due to residual toluene that had been incompletely removed
from the cast films during drying. The spectrum of the residual sand showed no C-H stretch at
2900 cm-1, indicating that this extraction had gone to almost 100% completion. Comparing the
DW2 and DW3 experiments it can be concluded that, in terms of a clean extraction, it is more
advantageous to use chunks of Utah tar sands opposed to grinding the sample prior to extraction.
The IL/toluene mixture is enough to break apart these chunks without a mechanical process, and
in fact the act of mechanical grinding could introduce unwanted carbonates into the extracted
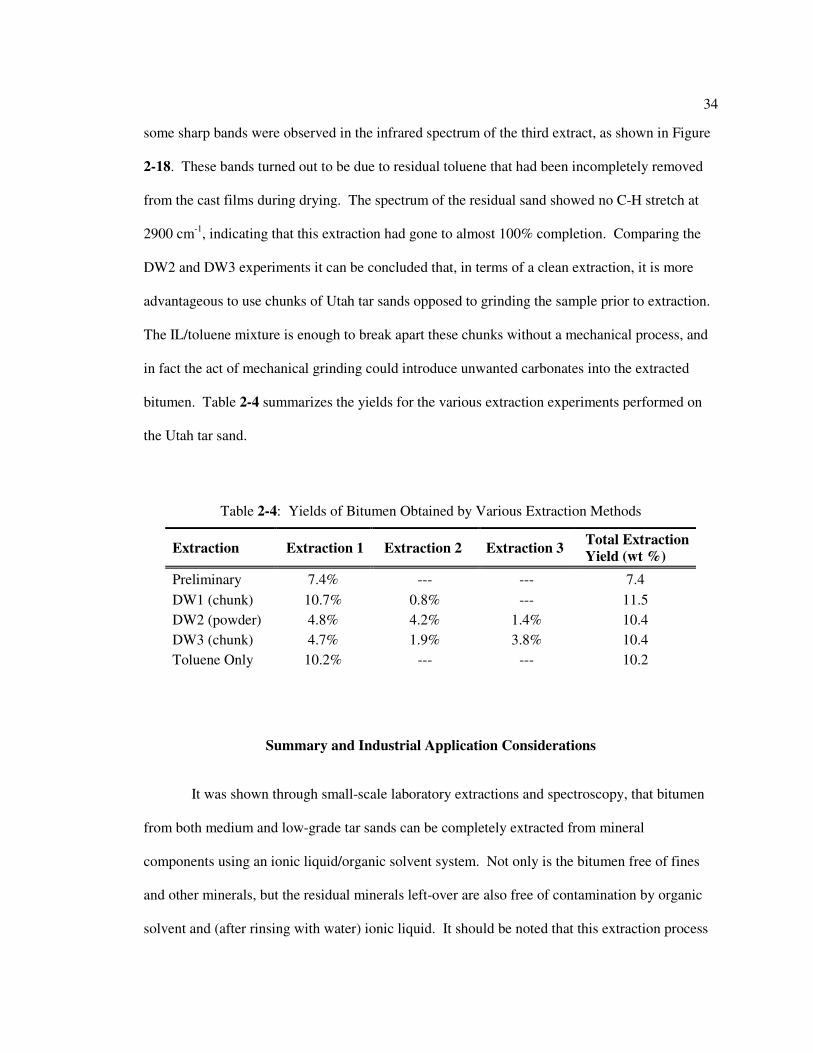
bitumen. Table 2-4 summarizes the yields for the various extraction experiments performed on
the Utah tar sand.
Summary and Industrial Application Considerations
It was shown through small-scale laboratory extractions and spectroscopy, that bitumen
from both medium and low-grade tar sands can be completely extracted from mineral
components using an ionic liquid/organic solvent system. Not only is the bitumen free of fines
and other minerals, but the residual minerals left-over are also free of contamination by organic
solvent and (after rinsing with water) ionic liquid. It should be noted that this extraction process
Table 2-4: Yields of Bitumen Obtained by Various Extraction Methods
Extraction Extraction 1 Extraction 2 Extraction 3 Total Extraction
Yield (wt %)
Preliminary 7.4% --- --- 7.4
DW1 (chunk) 10.7% 0.8% --- 11.5
DW2 (powder) 4.8% 4.2% 1.4% 10.4
DW3 (chunk) 4.7% 1.9% 3.8% 10.4
Toluene Only 10.2% --- --- 10.2
35
did not seem to work as well with [bmim][BF4] as the ionic liquid. This particular IL only has
one methyl-group instead of two. This would indicate that the functionalization of the
imidazolium ring plays an important role in addition to the composition of the anion itself.
Additionally, it was shown that the IL layer can be recycled at least five times through
the system with no decrease in bitumen yield. This could be very advantageous in an industrial-
scale process, as IL could be rinsed from the residual minerals, distilled, and recombined in the
system. This means that there would be a very low loss of IL, which would be the main expense
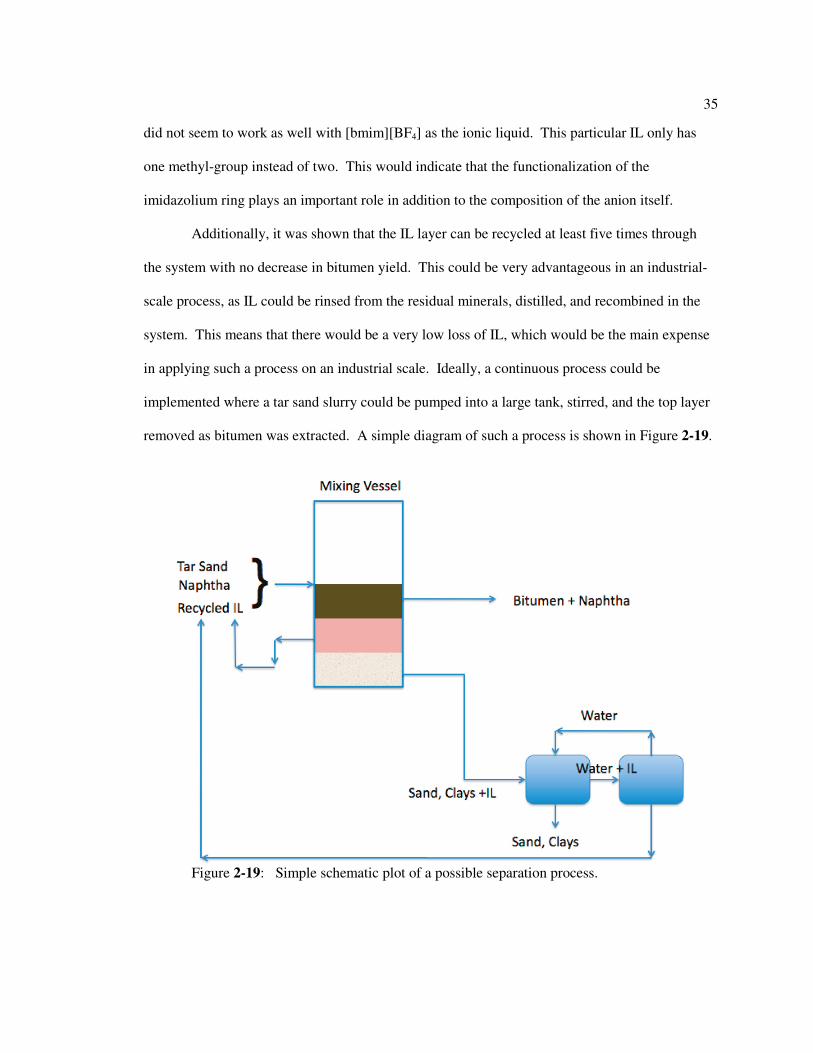
in applying such a process on an industrial scale. Ideally, a continuous process could be
implemented where a tar sand slurry could be pumped into a large tank, stirred, and the top layer
removed as bitumen was extracted. A simple diagram of such a process is shown in Figure 2-19.
Figure 2-19: Simple schematic plot of a possible separation process.
36
It was also shown that Utah tar sands can be extracted using an IL/organic solvent
system. These tar sands are much harder to process, but it was shown that this system is able to
break apart large chunks of hard tar sand, and that in fact it is better to not have a ground powder.
Part of the difficulty in extracting the bitumen appeared to be related to its limited solubility in
toluene. A saturation effect was observed, such that fresh quantities of toluene or a significant
excess of solvent was necessary to extract most of the bitumen. Toluene may not be the best
solvent to use in the extraction of bitumen from Utah tar sands, and other polar or relatively non-
polar solvents should be investigated in future work.
Finally, it was indicated that the last bitumen extraction is harder to separate from the
residual minerals, and can contain esters. The presence of carbonates accounts for the formation
of these esters. Lapis et al. showed that transesterification of vegetable oils occurs in an IL in the
presence of K2CO3 at 70°C.45 It is suggested here that a condensation reaction between hydroxyl
and carboxylic acid groups present in the bitumen also occurs, and is similarly mediated by the
IL/carbonate mixture. In this work a condensation appears to have occurred at much lower
temperatures (~25°C) and this is an interesting observation that will be pursued in future work.
Finally, it should be noted that if mineral fines do end up in the bitumen extract, the bitumen is
not ruined, but rather can be re-processed and the minerals removed with additional ionic liquid.
37
Chapter 3
Extraction of Bitumen from Other Oil/Sand Mixtures
Various methods for separating oil from sand or other mineral-containing materials such as
drill cuttings or oil sludge have been described over the years.46-59 These methods include
incineration, distillation, washing with detergents or extraction using organic solvents. Some of
these methods have proven to be uneconomic because of their energy requirements, others do not
completely remove the oil from the sand, or the chemicals used may also pose unacceptable
environmental concerns. As a result, oil field or refinery wastes are often stored in pits or land-
filled46 and long-term storage of such materials is a major concern. Consequently, the treatment
and disposal of large amounts of so-called oily sludge generated in refinery operations is a major
problem.
Another important environmental concern is the treatment of oil-contaminated sand and soil
after oil spills, either accidental as in the Exxon Valdez incident, or as a result of a deliberate act
of war, as in Kuwait, where large areas of the desert remain contaminated with residual oil that
has now aged and become difficult to remove. New technologies are vital to helping solve these
problems, as current technologies are inadequate or pose even worse environmental hazards.
Drill Cuttings/Drilling Muds and Refinery Waste
In addition to extracting bitumen from tar sands, ionic liquids can also be used to extract usable
oil form drilling muds and other waste generated when dealing with petroleum mining and
processing. To demonstrate this, a sample of drilling mud was obtained from the Energy and
Mineral Engineering department of Penn State. As explained earlier these muds can be a
complex mixture of various different solvents and/or surfactants as well as the oil and minerals
38
they contain. As before, a similar procedure was followed using the ionic liquid [bmmim][ BF4]
with a ratio of 1:2:3 with toluene. The preliminary results were similar to those with tar sands,
but the extraction did not show the stereotypical three-phase system shown previously, as the
phases seemed to be more mixed and less defined. After some experimentation and research, it
was decided that a different ionic liquid may work better with this system, as well as a different
ratio of components. The ionic liquid 1-ethyl-3-methylimidazolium acetate [emim][Ac] was
chosen because of its more basic nature, proved in a study by MacFarlane et al.60 Also, a ratio of
1:3:3.5 sample, ionic liquid and toluene, respectively, seemed to provide a better separation of
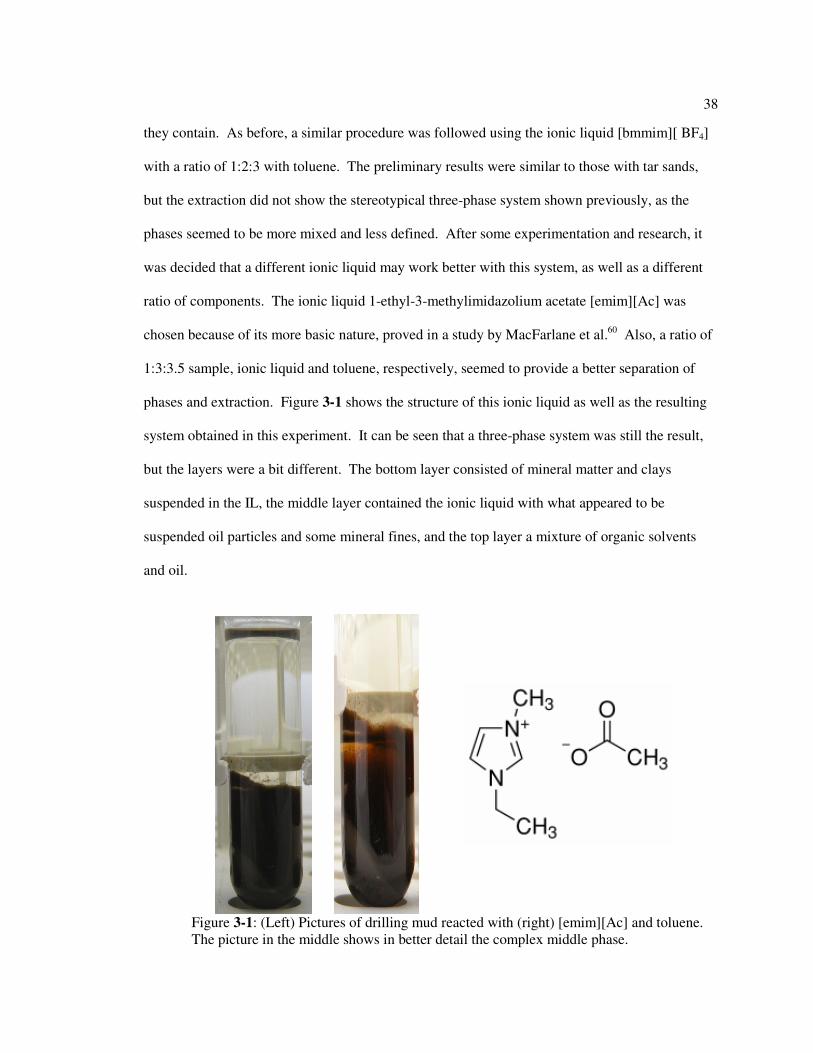
phases and extraction. Figure 3-1 shows the structure of this ionic liquid as well as the resulting
system obtained in this experiment. It can be seen that a three-phase system was still the result,
but the layers were a bit different. The bottom layer consisted of mineral matter and clays
suspended in the IL, the middle layer contained the ionic liquid with what appeared to be
suspended oil particles and some mineral fines, and the top layer a mixture of organic solvents
and oil.
Figure 3-1: (Left) Pictures of drilling mud reacted with (right) [emim][Ac] and toluene. The picture in the middle shows in better detail the complex middle phase.
39
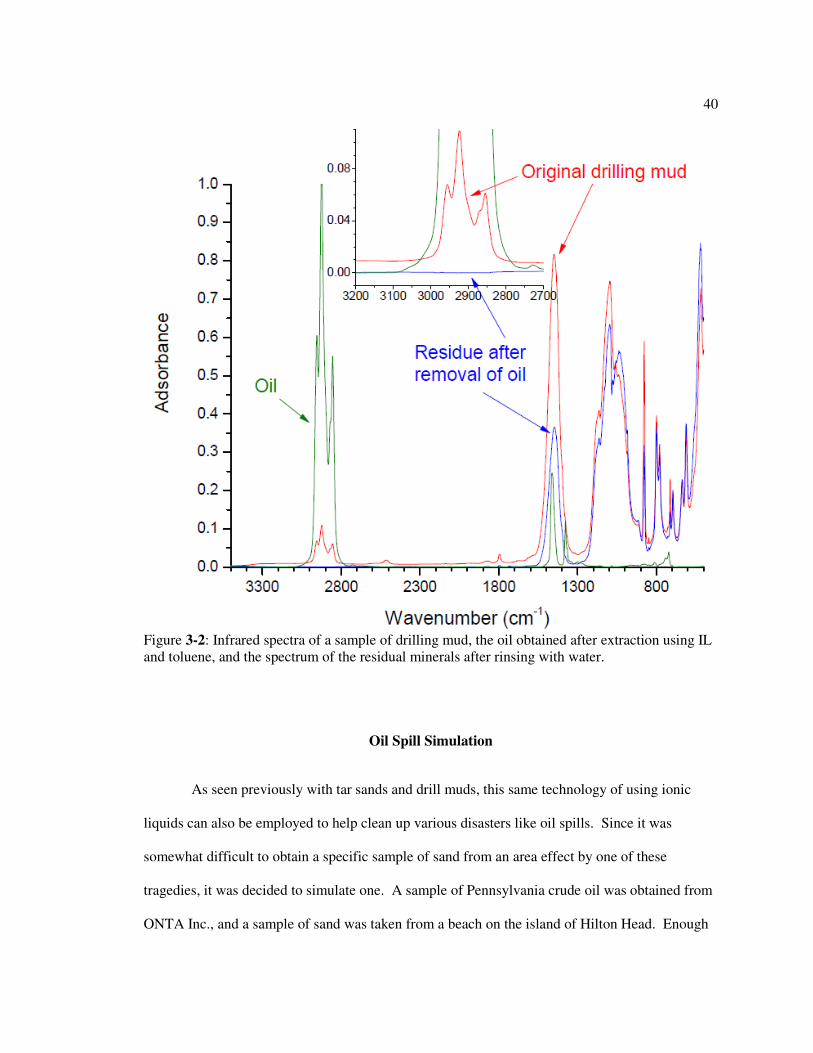
A spectroscopic study using infrared was used to confirm the identification of layers, and
to determine the success of extracting oil from the minerals in the drilling mud. Spectroscopy
samples were prepared the same way as those described in Chapter 2 and Appendix A. Figure 3-
2 shows a comparison of the spectra of the original drilling mud, the oil extracted from the mud,
and the residual minerals that were left over. The spectrum of the original drill mud is dominated
by silicate (sand) absorption bands between 1100 and 1000 cm-1. In addition, there is a strong
absorption due to carbonates near 1450 cm-1, similar to what is observed in the spectrum of chalk.
The minerals absorb infrared radiation far more strongly than oil, but bands due to the latter can
be observed as weakly absorbing modes between 2800 cm-1 and 3000 cm-1. An absorption scale-
expanded inset is also shown in the figure, revealing the bands due to the oil in the spectrum of
the drill cuttings more clearly, while the same modes in the spectrum of the separated oil are now
“off-scale”. However, these absorptions are absent from the spectrum of the residual minerals,
showing that in terms of the detection limits of infrared spectroscopy these minerals are now free
from oil contamination. It can also be seen that the spectrum of the oil is free of bands due to
minerals and has been recovered in a “clean” form.
40
Oil Spill Simulation
As seen previously with tar sands and drill muds, this same technology of using ionic
liquids can also be employed to help clean up various disasters like oil spills. Since it was
somewhat difficult to obtain a specific sample of sand from an area effect by one of these
tragedies, it was decided to simulate one. A sample of Pennsylvania crude oil was obtained from
ONTA Inc., and a sample of sand was taken from a beach on the island of Hilton Head. Enough
Figure 3-2: Infrared spectra of a sample of drilling mud, the oil obtained after extraction using IL and toluene, and the spectrum of the residual minerals after rinsing with water.
41
beach sand was used to fill up a 25 mL glass vial about half-way. To this, a few drops of water
was added and the vial shaken. This was done to simulate a moist sand that would come into
contact with the water, and also to help the oil adhere more to the sand (the beach sand was
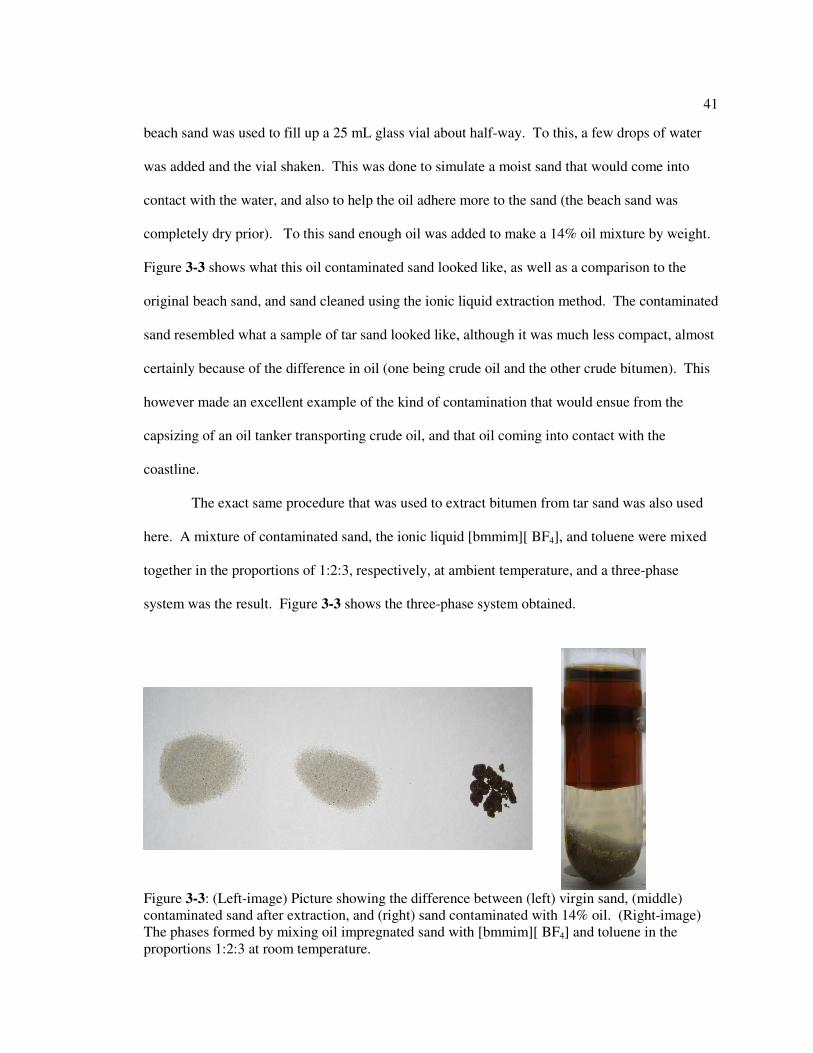
completely dry prior). To this sand enough oil was added to make a 14% oil mixture by weight.
Figure 3-3 shows what this oil contaminated sand looked like, as well as a comparison to the
original beach sand, and sand cleaned using the ionic liquid extraction method. The contaminated
sand resembled what a sample of tar sand looked like, although it was much less compact, almost
certainly because of the difference in oil (one being crude oil and the other crude bitumen). This
however made an excellent example of the kind of contamination that would ensue from the
capsizing of an oil tanker transporting crude oil, and that oil coming into contact with the
coastline.
The exact same procedure that was used to extract bitumen from tar sand was also used
here. A mixture of contaminated sand, the ionic liquid [bmmim][ BF4], and toluene were mixed
together in the proportions of 1:2:3, respectively, at ambient temperature, and a three-phase
system was the result. Figure 3-3 shows the three-phase system obtained.
Figure 3-3: (Left-image) Picture showing the difference between (left) virgin sand, (middle) contaminated sand after extraction, and (right) sand contaminated with 14% oil. (Right-image) The phases formed by mixing oil impregnated sand with [bmmim][ BF4] and toluene in the proportions 1:2:3 at room temperature.
42
The extracted oil appears at the top, the middle consists of the IL with some dissolved mineral
fines, and the bottom layer a mixture of oil-free sand and entrained ionic liquid.
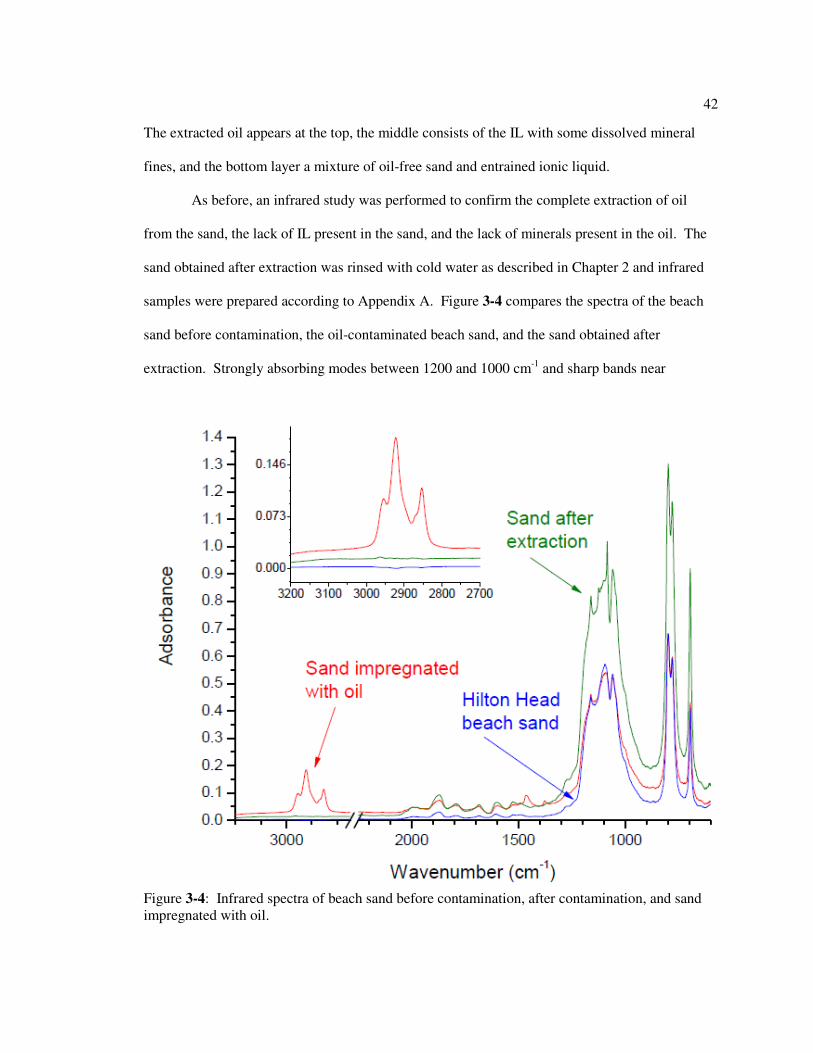
As before, an infrared study was performed to confirm the complete extraction of oil
from the sand, the lack of IL present in the sand, and the lack of minerals present in the oil. The
sand obtained after extraction was rinsed with cold water as described in Chapter 2 and infrared
samples were prepared according to Appendix A. Figure 3-4 compares the spectra of the beach
sand before contamination, the oil-contaminated beach sand, and the sand obtained after
extraction. Strongly absorbing modes between 1200 and 1000 cm-1 and sharp bands near
Figure 3-4: Infrared spectra of beach sand before contamination, after contamination, and sand impregnated with oil.
43
800 cm-1 and 700 cm-1 characteristic of silicates dominate the spectrum of the sand, as in the
drilling mud presented above. The oil-contaminated sand has a barely detectable band due to
aliphatic C-H groups near 1450 cm-1. However, hydrocarbons such as this absorb infrared
radiation far more strongly in the C-H stretching region between 3000 and 2800 cm-1, as shown in
an inset in this figure, but no peak is seen for the sand obtained after extraction. The oil-
contaminated sand (14% oil by weight) has clearly discernable bands due to C-H stretching
vibrations. These bands are absent in the spectrum of the original sand and also cannot be seen in
the spectrum of the cleaned sand. Toluene also has infrared bands in this region of the spectrum,
so these results demonstrate that within the detection limits of infrared spectroscopy the cleaned
sand has no residual contamination by oil or hydrocarbon solvent. In addition, this IL has a very
strong absorption band near 1000 cm-1 (as shown in Figure 2-7), that cannot be detected in the
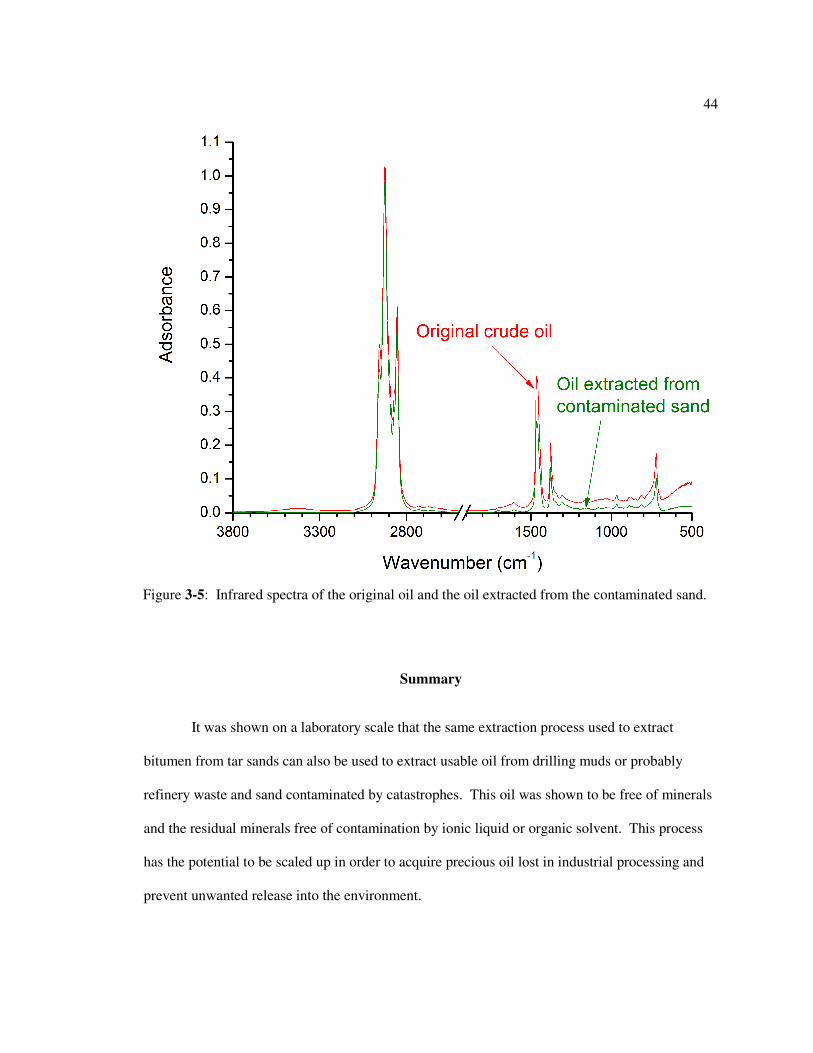
spectrum of the cleaned sand. Contamination with mineral fines can be a particular problem
when using conventional extraction procedures in similar applications. The oil that is obtained
after separation from the solvent (toluene in this example) is also free of mineral matter, as can be
seen from Figure 3-5, which compares the spectra of the original oil and the oil extracted from the
sand.
44
Summary
It was shown on a laboratory scale that the same extraction process used to extract
bitumen from tar sands can also be used to extract usable oil from drilling muds or probably
refinery waste and sand contaminated by catastrophes. This oil was shown to be free of minerals
and the residual minerals free of contamination by ionic liquid or organic solvent. This process
has the potential to be scaled up in order to acquire precious oil lost in industrial processing and
prevent unwanted release into the environment.
Figure 3-5: Infrared spectra of the original oil and the oil extracted from the contaminated sand.

45
Conclusion and Proposed Work
It was shown through infrared studies that an ionic liquid/toluene mixture can be used to
successfully extract crude bitumen from various tar sand samples and also usable oil from
contaminated sand and mineral materials. Infrared spectroscopy showed that the extracted
hydrocarbons were free of mineral fines, which are detrimental in later processing steps, and that
the residual minerals were free of contamination by hydrocarbons, ionic liquid and organic
solvent. This was all proven within the detection limits of infrared spectroscopy, which can
detect about 1% contamination of polar (highly adsorbing) materials in a sample. Because of
this, if it is found that ionic liquids could be toxic at levels lower than this detection limit, further
studies including more sensitive methods of spectroscopy, would be needed to confirm the
absence of contaminates in the residual minerals. All though this is the case, the author is
confident about the findings and because of the high miscibility of ionic liquids in water, is also
confident that negligible amounts of ionic liquid would remain in the residual sand layer after
excessive rinsing with water.
As stated at the end of Chapter 2, it was noted during this study that toluene may not be
the best solvent of choice, particularly when extracting bitumen from Utah tar sands. Given these
results it would seem crucial to test additional solvents in future work. Also it would seem
beneficial to test additional ionic liquids, using the findings of this thesis as a guide to which ionic
liquids may perform similarly or better.
Finally, future work should also consider the use of water in the ionic liquid layer.
Although the recent mass production of ionic liquids will help drive down the price of these
solvents, using a mixture of ionic liquids with water may prove a more cost effective means of
extraction, and may in fact have profound effects on the separation process.
46
REFERENCES
1 U.S. National Commission on Energy Policy, Ending the Energy Stalemate–A Bipartisan Strategy to Meet America’s Energy Challenge, “http://www.energycomission.org,” December 2004. 2 Heinberg, R. The Party’s Over: Oil, War and the Fate of Industrial
Societies; New Society Publishers: Gabriola Island, BC, Canada, 2005. 3 Allen, E. W. J. Environ. Eng. Sci. 2008, 7, 123–138. 4 Allen, E. W. J. Environ. Eng. Sci. 2008, 7, 499–524. 5 Canada’s Oil Sands - Opportunities and Challenges to 2015: An Update - June 2006; National Energy Board: 2006. http://www.neb.gc.ca/clf-nsi/rnrgynfmtn/nrgyrprt/lsnd/lsnd-eng.html. 6 Masliyah, J.; Zhou, Z.; Xu, Z.; Czarnecki, J.; Hamza, H. Can. J. Chem. Eng. 2004, 82, 628–654. 7 Trong, D-V; Jha, R.; Wu, S.-Y.; Tannant,D. D.; Masliyah, J.; Xu, Z. Energy Fuels 2009, 23, 2628–2636. 8 Budziak, C. J.; Vargha-Butler, E. I.; Hancock, R. G. V.; Neumann, A. W. Fuel 1988, 67, 1633–1638. 9 R. M. Barrer (1943). "The Viscosity of Pure Liquids. II. Polymerised Ionic Melts.". Trans. Faraday Soc. 39: 59–67. 10 Weingartner, W. Angew. Chem., Int. Ed. 2008, 47, 654–670. 11 Plechkova, N. V.; Seddon, K. R. Chem. Soc. Rev. 2008, 37, 123–150. 12 C Pretti, C Chiappe, D Pieraccini, M Gregori, F Abramo, G Monni and L Intorre (2006). "Acute toxicity of ionic liquids to the zebrafish (Danio rerio)". Green Chem. 8: 238–240. 13 D. Zhao, Y. Liao and Z. Zhang (2007). "Toxicity of Ionic Liquids". CLEAN - Soil, Air, Water 35 (1): 42–48. 14 J Ranke, S Stolte, R Störmann, J Arning and B Jastorff (2007). "Design of sustainable chemical products - the example of ionic liquids". Chem. Rev. 107 (6): 2183–2206. 15 Miller, George A. "WordNet - About Us." WordNet. Princeton University. 2009. "http://wordnet.princeton.edu" 16 (PDF) Alberta's Oil Sands: Opportunity, Balance, Government of Alberta, March 2008, ISBN 978-07785-7348-7, retrieved 2010-02-15. “http://www.environment.alberta.ca/documents/Oil_Sands_Opportunity_Balance.pdf.” 17 (PDF) Alberta’s Oil Sands: The Resource, Government of Alberta, December 2009, retrieved 2010-02-15. “http://www.oilsands.alberta.ca/documents/The_resource.pdf.” 18 Gillis, Gretchen, Ed., Schlumberger Oilfield Glossary, “http://www.glossary.oilfield.slb.com/Display.cfm?Term=cuttings.” 19 Fink, Johannes Karl Oil Field Chemicals.. Elsevier. Online version available at: “http://knovel.com/web/portal/browse/display?_EXT_KNOVEL_DISPLAY_bookid=1271&VerticalID=0” 20 Sanford, E. C. Can. J. Chem. Eng. 1983, 61, 554–567. 21 Masliyah, J.; Zhou, Z.; Xu, Z.; Czarnecki, J.; Hamza, H. Can. J. Chem. Eng. 2004, 82, 628–654. 22 Dai, Q.; Chung, K. H. Fuel 1995, 74, 1858–1864. 23 Chong, J.; Ng, S.; Chung, K.; Sparks, B.; Kotlyar, L. Fuel 2003, 82, 425–438. 24 Liu, J.; Xu, Z.; Masliyah, J. Langmuir 2003, 19, 3911–3920. 25 Liu, J.; Xu, Z.; Masliyah, J. Energy Fuels 2005, 19, 2056–2063. 26 Long, J.; Xu, Z.; Masliyah, J. Energy Fuels 2005, 19, 1440–1446. 27 Zhao, H.; Long, J.; Masliyah, J.; Xu, Z. Ind. Eng. Chem. Res. 2006, 45, 7482–7490. 28 Czarnecki, J.; Radoev, B.; Schramm, L.; Slavchev, R. Adv. Colloid Interface Sci. 2005, 114-115, 53–60. 29 Liu, J.; Xu, Z.; Masliyah, J. J. Colloid Interface Sci. 2005, 287, 507–520. 30 Sparks, B. D.; Kotlyar, L. S.; O’Carroll, J. B.; Chung, K. H. J. Pet. Sci. Eng. 2003, 39, 417–430. 31 Moran, K. Langmuir 2007, 23, 4167–4177. 32 Drelich, J. Miner. Met. Proc. 2008, 25, 1–12.
47
33 Trong, D.-V.; Jha, R.; Wu, S.-Y.; Tannant, D. D.; Masliyah, J.; Xu, Z. Energy Fuel 2009, 23, 2628–2636. 34 Trong, D.-V.; Jha, R.; Wu, S.-Y.; Tannant, D. D.; Masliyah, J.; Xu, Z. Colloids Surf. 2009, 337, 80–90. 35 Adair, J. H.; Suvaci, E.; Sindel, J. “Surface and Colloid Chemistry.” Ency. Matl. Sci. Tech. 2001, 8996-9006. 36 Hunter, R. J. “Zeta Potential in Colloid Science: Principles and Applications.” Academic Press. 1981. 37 Israelachvili, J. N. “Intermolecular and Surface Forces.” Academic Press 1992. 38 Wassercheid, P.; Keim, W. Angew. Chem. Int. Ed. Engl. 2000, 39, 3772-3773. 39 Painter, P.; Coleman, M.; Jenkins, R.; Whang, P.; Walker, P. Fuel 1978, 57, 337-344. 40 Painter, P.; Rimmer, S.; Snyder, R.; Davis, A. Appl. Spectrosc. 1981, 35, 102-106. 41 Hupka, J.; Miller, J. D.; Drelich, J. Can. J. Chem. Eng. 2004, 82, 978-985. 42 Drelich, J. Minerals and Metallurgical Processing 2008, 25, 1-12. 43 Mikula, R. J.; Munoz, V. A.; Omotoso, O. J. Can. Petroleum Technol. 2007, 46, 50-56. 44 Painter, P; Williams, P.; Mannebach, E. US Patent Application # 61236405, 2009. 45 Lapis, A. A. M.; de Oliveira, L. F.; Neto, B. A. D.; Dupont, J. Chemsuschem 2008, 1, 759-762 46 Veil, J. A. “Innovative Technologies for managing Oil Field Waste.” Journal of Energy Resources
Technology 2003, 125, 238-248. 47 Childs, J. D.; Acosta, E.; Scamehorn, J. F.; Sabatini, D. A. “Surfactant-Enhanced Treatment of Oil-Based Drill Cuttings.” Journal of Energy Resources Technology 2005, 127, 153-162. 48 Fernandez, L. C.; Zegarra, H.; Baca, G.; Torres, L. G. “Characterization and Surfactant-Enhanced Washing Treatability of Drilling Fluids Stored for More than 20 Years.” J. Surfact. Deterg. 2008, 11, 307-314. 49 Eldridge, R. B. “Oil Contaminant Removal from Drill Cuttings by Supercritical Extraction.” Ind. Eng.
Chem. Res. 1996, 35, 1901-1905. 50 Robinson, J. P.; Kingman, S. W.; Onobrakpeya, O. Journal of Environmental Management 2008, 88, 211-218. 51 Abramov, O. V.; Abramov, V. O.; Myasnikov. S. K.; Mullakaev, M. S. “Extraction of Bitumen, Crude Oil and its Products from tar Sand and Contaminated Sandy Soil under Effect of Ultrasound.” Ultrasonics
Sonochemistry 2009, 16, 408-416. 52 Boyd, P. A.; Stolhand, J. E. “Oil Solvation Process for the Treatment of Oil Contaminated Sand.” U.S.
Patent 4444260 1984. 53 Storey, D.; Lundie, K. “Treatment of Oil-Contaminated Particulate materials.” U.S. Patent 5882524 1999. 54 Hodson, J. E.; Chalmers, M. D. “Method of Separating Oil, Water, Sand and gas from Produced Fluids.” U.S. Patent 4948393 1990. 55 Barclay, T. C. “Oil-Sand Separation.” U.S. Patent 6315837 2001. 56 Pappa, R.; Cova, U.; Sisto, R.; Marcotullio, A. “Method for the Removal and Recovery of the Oil Component from Drill Cuttings.” U.S. Patent 6550552 2003. 57 Chaillan, F.; Chaineau, C. H.; Point, V.; Saliot, A. Oudot, J. “Factors Inhibiting Bioremediation of Soil Contaminated with Weathered Oils and Drill Cuttings.” Environmental Pollution 2006, 144, 255-265. 58 Joseph, P. J.; Joseph, M. “Microbial Enhanced Separation of Oil from Petroleum Refinery Sludge.” Journal of Hazardous Materials 2009, 161, 522-525. 59 Liu, W.; Luo, W.; Teng, Y.; Li, Z.; Christie, P. “Prepared Bed Bioremediation of Oily Sludge in an Oilfield in Northern China.” Journal of Hazardous Materials 2009, 161, 479-484. 60 MacFarlane, D. R.; Pringle, J. M.; Johansson, K. M.; Forsyth S. A.; Forsyth, M. “Lewis Base Ionic Liquids.” Chem. Commun. 2006, 1905. 61 Williams, P.; Lupinsky, A.; Painter P. C. Energy Fuels 2009 Articles ASAP.
48
APPENDIX
Materials and Spectroscopy
This appendix details the materials obtained for experimentation, the specific methods
used for the spectroscopic studies presented in this thesis, and any specific instrumentation or
apparatuses used.
Materials
Medium grade and low grade Canadian tar sands were obtained from The Alberta
Research Council. The Pennsylvania crude oil used to contaminate sand in the “oil spill”
experiment was obtained from ONTA Inc., and originated from the Appalachian Basin. Sand
used in the “oil spill” experiment was obtained from a beach on Hilton Head Island, South
Carolina and was used as-is. A sample of drilling mud was obtained from Mark Klima of the
Energy and Mineral Engineering department at The Pennsylvania State University. The Utah tar
sand sample was provided by the Utah Geological Survey and obtained from the Asphalt Ridge
Area of Uintah County Utah (AF Hole No. 1, 44-54 ft., Box 3).
The ionic liquids: 1-butyl-3-methyl-imidazolium trifluoromethanesulfonate,
[bmim][CF3SO3]; 1-butyl-2,3-dimethyl-imidazolium tetrafluoroborate, [bmmim][BF4]; and 1-
ethyl-3-methylimidazolium acetate [emim][Ac], were purchased from Sigma-Aldrich. All other
chemicals used were regent grade or better and were also obtained from Sigma-Aldrich.
49
Fourier-Transform Infrared Spectroscopy
Fourier transform infrared (FTIR) spectra were obtained using either a BioRad FTS-6000 or a
Thermo Scientific Nicolet 6700 spectrometer. In both instruments a resolution of 2 cm-1 and
sensitivity of 1.0 was used, and 100 scans were signal averaged. Dry air, obtained from a purge
gas generator system, was used to purge the sample chamber in all cases.
For samples conducted using diffuse reflectance infrared Fourier transform (D.R.I.F.T), a few
milligrams of sample was combined with KBr, and ground into a powder using a Wig-L-Bug in a
stainless steel cup. A background scan of pure KBr was taken for D.R.I.F.T samples.
Samples in solution form were cast onto a KBr window and the solvent evaporated in a
vacuum oven, forming a thin film for analysis. For these, a background scan of the empty
chamber was taken before sampling.