a n t e l o p e v a l l e y t r a n s i t a u t h o … · a n t e l o p e v a l l e y t r a n s i...
TRANSCRIPT
A N T E L O P E V A L L E Y T R A N S I T A U T H O R I T Y
L A N C A S T E R, C A L I F O R N I A
C O M P R E H E N S I V E A N N U A L F I N A N C I A L R E P O R T
FOR THE FISCAL YEARS ENDED JUNE 30, 2014 AND 2013
P R E P A R E D B Y T H E A V T A F I N A N C E D E P A R T M E N T
A n t e l o p e V a l l e y T r a n s i t A u t h o r i t y F i s c a l Y e a r 2 0 1 4 C o m p r e h e n s i v e A n n u a l F i n a n c i a l R e p o r t
T A B L E O F C O N T E N T S I N T R O D U C T O R Y S E C T I O N L e t t e r o f T r a n s m i t t a l 3 P r o f i l e o f t h e A n t e l o p e V a l l e y T r a n s i t A u t h o r i t y 4 E c o n o m i c O u t l o o k 6 M a j o r I n i t i a t i v e s i n 2 0 1 4 9 F i s c a l Y e a r 2 0 1 4 I n i t i a t i v e s 7 B o a r d o f D i r e c t o r s 1 2 O r g a n i z a t i o n a l C h a r t 1 3 F i n a n c i a l I n f o r m a t i o n 1 4 A w a r d s , A p p l i c a t i o n s a n d A c k n o w l e d g e m e n t s 1 5 C e r t i f i c a t e o f A c h i e v e m e n t i n F i n a n c i a l R e p o r t i n g ( F i s c a l Y e a r 2 0 1 3 ) 1 7
F I N A N C I A L S E C T I O N I n d e p e n d e n t A u d i t o r s ’ R e p o r t 1 9 M a n a g e m e n t ’ s D i s c u s s i o n a n d A n a l y s i s M a n a g e m e n t ’ s D i s c u s s i o n & A n a l y s i s 2 3 ( R e q u i r e d S u p p l e m e n t a r y I n f o r m a t i o n ) F o r w a r d a n d F i n a n c i a l H i g h l i g h t s 2 3 F i n a n c i a l S t a t e m e n t O v e r v i e w 2 3 F i n a n c i a l S t a t e m e n t A n a l y s i s 2 5 S t a t e m e n t o f N e t P o s i t i o n 2 5 R e v e n u e & E x p e n s e s : C h a n g e s i n N e t P o s i t i o n 2 6 C a p i t a l A s s e t s 3 1 B a s i c F i n a n c i a l S t a t e m e n t s S t a t e m e n t s o f N e t P o s i t i o n 3 3 S t a t e m e n t s o f R e v e n u e s , E x p e n s e s a n d C h a n g e s i n N e t P o s i t i o n 3 4 S t a t e m e n t s o f C a s h F l o w s 3 5 N o t e s t o B a s i c F i n a n c i a l S t a t e m e n t s 3 7
S T A T I S T I C A L S E C T I O N F i n a n c i a l T r e n d s N e t P o s i t i o n b y C o m p o n e n t 5 4 C h a n g e s i n N e t P o s i t i o n 5 5 R e v e n u e C a p a c i t y R e v e n u e S o u r c e s 5 6 D e m o g r a p h i c a n d E c o n o m i c I n f o r m a t i o n D e m o g r a p h i c s a n d S t a t i s t i c s o f t h e A n t e l o p e V a l l e y 5 7 P r i n c i p a l E m p l o y e r s i n t h e A n t e l o p e V a l l e y 5 8 O p e r a t i n g I n f o r m a t i o n R i d e r s h i p b y M o d e 5 9 S e r v i c e : F i x e d R o u t e S t a t i s t i c s 6 0 S e r v i c e : D e m a n d R e s p o n s e S t a t i s t i c s 6 1 A V T A H e a d c o u n t s b y Y e a r 6 2 C a p i t a l A s s e t S t a t i s t i c s – R e v e n u e F l e e t 6 3 A V T A R o u t e M a p F o l d o u t

INTRODUCTORY SECTION
November 25, 2014
Honorable Chairman and Members of the Board of Directors :
California Government Code sections 25250 and 25253 require that every general-purpose local government publish a complete set of audited financial statements within six months of the close of each fiscal year. This report for the Antelope Valley Transit Authority (Authority or AVTA) is published in fulfillment of that requirement for the fiscal year which ended June 30, 2014. The Comprehensive Annual Financial Report (CAFR) is an important management tool. It enables AVTA officials, governmental funding providers, vendors and other interested parties to make sound financial decisions. This report provides an independently audited account of the financial condition of the Authority. The financial statements, supplemental schedules and statistical information are the representations of AVTA’s management; consequently, management assumes full responsibility for their accuracy, completeness and fairness. To provide a reasonable basis for making these representations, management has established comprehensive internal control policies designed both to protect the Authority’s assets from loss, theft or misuse, and to ensure the preservation of reliable information for the preparation of the Authority’s financial statements in conformity with generally accepted accounting principles (GAAP). Because the cost of internal controls should not exceed anticipated benefits, AVTA’s comprehensive framework of internal controls has been designed to provide reasonable rather than absolute assurance that the financial statements are free from material misstatement. The Antelope Valley Transit Authority uses the accrual basis of accounting, and is treated as a single enterprise fund. Windes Inc., Certified Public Accountants, audited Antelope Valley Transit Authority’s financial statements. The goal of the independent audit is to provide reasonable assurance that the financial statements of AVTA for the fiscal year ended June 30, 2014 are free of material misstatement. The independent audit involves examining, on a test basis, evidence supporting the amounts and disclosures in the financial statements; assessing the accounting principles, policies and principles used and significant estimates made by management; and evaluating the overall financial statement presentation. Based upon the audit, the independent auditor concluded that there was a reasonable basis for rendering an unmodified opinion that AVTA’s financial statements for the fiscal year ending June 30, 2014 are fairly presented in conformity with GAAP. All disclosures necessary to enable the reader to gain an understanding of AVTA’s financial affairs have been included. The Independent Auditors’ Report is presented as the first component of the financial section of this report.
A n t e l o p e V a l l e y T r a n s i t A u t h o r i t y F i s c a l Y e a r 2 0 1 4 C o m p r e h e n s i v e A n n u a l F i n a n c i a l R e p o r t
P a g e | 4
Management’s Discussion and Analysis (MD&A) immediately follows the independent auditor’s report and provides a narrative introduction, overview and analysis of the basic financial statements. The MD&A complements this letter of transmittal and should be read in conjunction with one another. The independent audit of the financial statements of AVTA was part of a broader, federally mandated “Single Audit” designed to the meet special requirements of the federal grantor agencies. The standards governing Single Audit engagements require the independent auditor to report not only on the fair presentation of the financial statements in accordance with GAAP, but also on the Authority’s internal control and compliance with legal requirements involving the administration of federal awards in accordance with Government Auditing Standards issued by the Comptroller General of the United States. The independent auditor concluded that AVTA complied in all material respects with the internal control and compliance requirements, and was free of any adverse findings. These reports are available in AVTA’s separately issued Single Audit Reports.
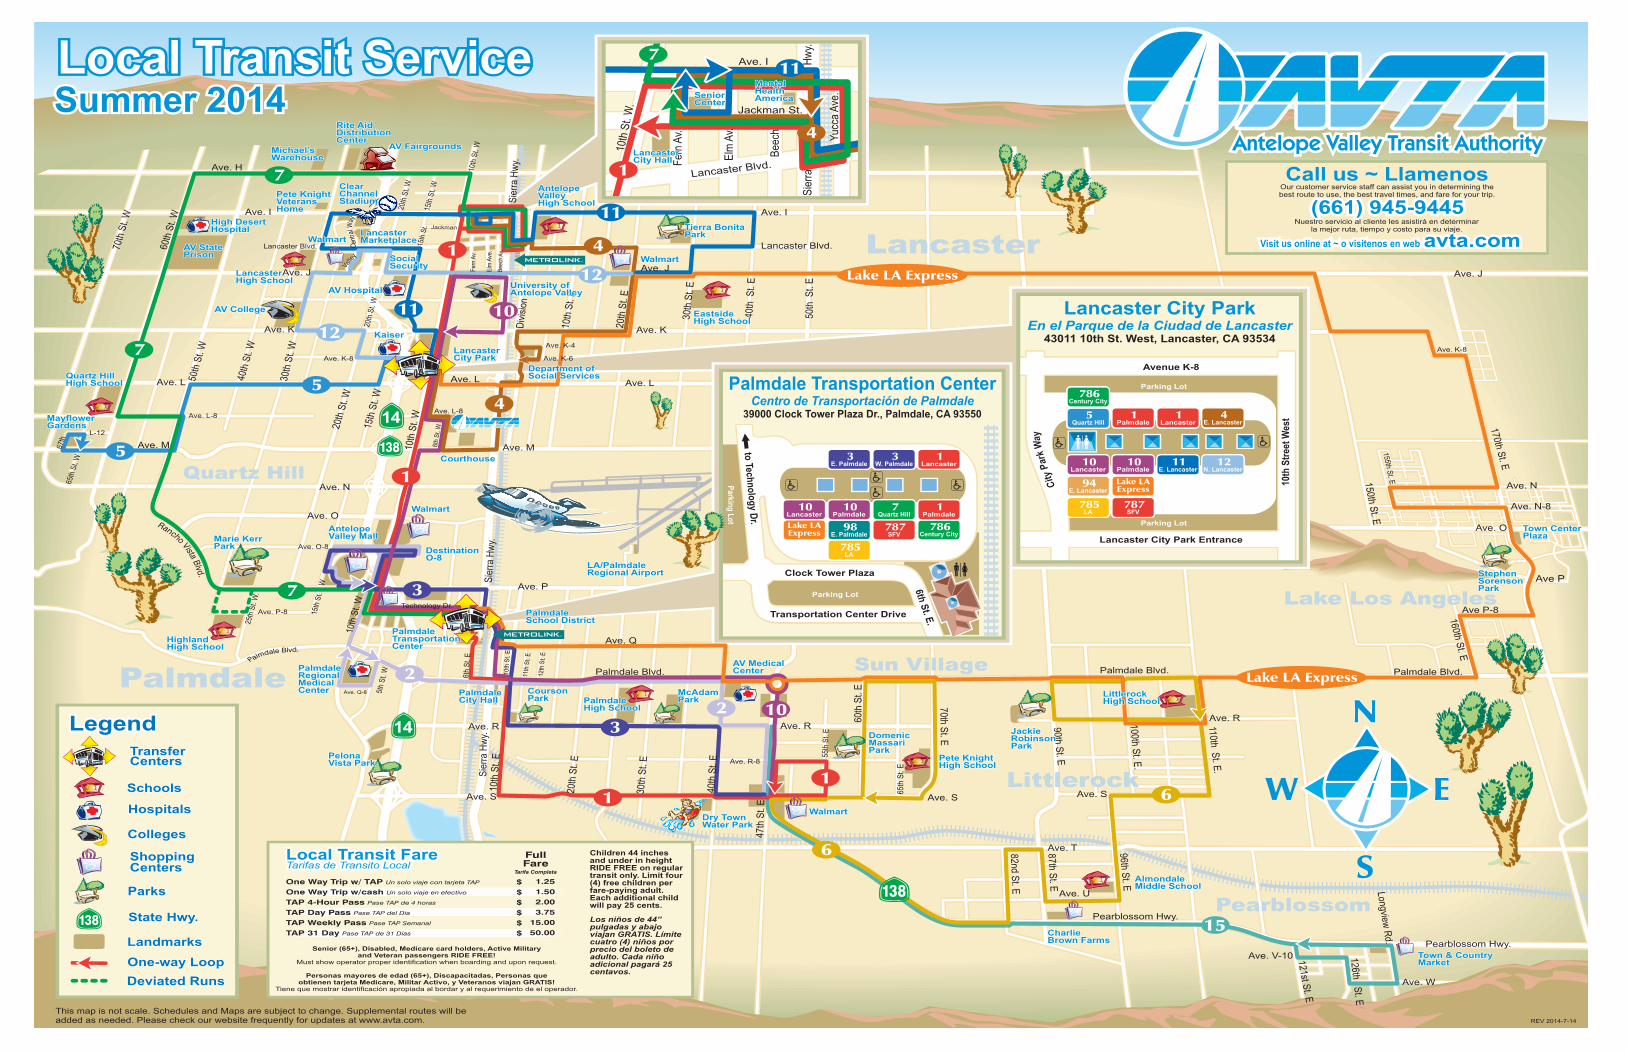
Profi le of the Antelope Val ley Transit Authority The Antelope Valley Transit Authority (AVTA) is located in the Antelope Valley of Southern California, approximately 70 miles north of Los Angeles. Its principal office and facility for its active fleet of 71 buses is situated in the City of Lancaster. AVTA was formed to provide and administer public transportation services for the citizens of Lancaster, Palmdale and certain unincorporated sections of the County of Los Angeles in the Antelope Valley area. The Greater Antelope Valley area encompasses over 3,000 square miles and includes both Northern Los Angeles County and Eastern Kern County and is home to approximately 500,000 residents. The Antelope Valley provides a thriving environment for economic growth and offers a wide range of benefits to businesses seeking to relocate or expand their operations. S e r v i c e s The AVTA provides the following transportation services: ` L o c a l F i x e d R o u t e – There are 11 local fixed routes and 5 supplemental routes that coordinate with school schedules. In FY 2014, the farebox recovery ratio was 13.2% for local transit fixed route service. AVTA served 3.3 million passengers, an increase of 2.2% over FY2013. C o m m u t e r – AVTA provides commuter service from the Antelope Valley to downtown Los Angeles, West Los Angeles/Century City and the San Fernando Valley. In the current year, the farebox recovery ratio for commuter services was 81.8%. AVTA provided services to 330,000 commuters, an increase of 12.5% over FY2013. N o r t h C o u n t y T R A N S p o r t e r – This specialized commuter service provides connecting bus service to the Metrolink train schedule between the Antelope and Santa Clarita Valleys.

A n t e l o p e V a l l e y T r a n s i t A u t h o r i t y F i s c a l Y e a r 2 0 1 4 C o m p r e h e n s i v e A n n u a l F i n a n c i a l R e p o r t
P a g e | 5
Inaugural service commenced In August 2012, and provided services to 37,000 riders during FY2014. D i a l - A - R i d e – Supplemental demand response service is provided by AVTA to Antelope Valley Residents. In FY2014, the farebox recovery ratio was 7.5%. For the first 10 months of FY14, the service was provided by American Logistics Services (ALC), and was replaced by IntelliRide, a division of TransDev Corporation, for the last 2 months. The contract went to bid in September 2014 for a new 5-year contract to be effective January 2015. The contract calls for the number of rides not to exceed 33,000 for each calendar year. During FY 2014, 26,000 rides took place. S e r v i c e C h a n g e s – The AVTA Operations staff continuously analyzes routes to address issues of passenger loading, frequency, on-time performance, local detours and other factors in an attempt maximize service. Standardized service changes are developed and presented to the Board of Directors for their review and approval every six months. AVTA’s total service area covers 1,200 square miles and is bounded by the Kern County line to the north, the San Bernardino County line to the east, the Angeles National Forest to the south, and Interstate 5 to the West. R e p o r t i n g E n t i t y The Antelope Valley Transit Authority (AVTA), a public entity, was created on July 1, 1992 pursuant to Section 6506 of the Government Code of the State of California. AVTA was formed under a Joint Exercise of Powers Agreement (JPA). Its members consist of the County of Los Angeles and the cities of Lancaster and Palmdale. The JPA members jointly contribute operating and capital funds to AVTA each year to assist in the provision of transit services to the Antelope Valley area.
AVTA is governed by a six-member Board of Directors with governance responsibilities over all related activities. The Board is comprised of two directors from each jurisdiction. An Executive Director manages the day to day operations and implements Board policy in accordance with the duties specified in the California Government Code and the Joint Powers Authority Agreement.
A n t e l o p e V a l l e y T r a n s i t A u t h o r i t y F i s c a l Y e a r 2 0 1 4 C o m p r e h e n s i v e A n n u a l F i n a n c i a l R e p o r t
P a g e | 6
Economic Outlook S tate and Regional Economy AVTA used the information presented in the 2014-2015 Annual Economic Forecast and Industry Outlook, prepared by the Kyser Center for Economic Research of the Los Angeles County Economic Development Corporation (LAEDC) to assess economic conditions in the region. The California State economy is recovering steadily, but being slowed by the ongoing drought conditions in the state. Agricultural production from the San Joaquin valley is at record lows and the total costs, said to be in the billions to-date, have yet to calculated. There are some indications by the U.S. Weather Service that the coming 2014-2015 winter season will bring a recurrence of El Niño and a wetter winter that could help mitigate the drought conditions to some degree. During 2013, California lost over a million jobs in the general payroll, farm and self-employed categories; though the summer of 2014 has gotten many of them back, mostly in the payroll categories. Statistics show that the most of the new jobs have been created in communities along the coast, while inland unemployment rates continue above pre-recession levels. Total employment growth is expected to reach 1.5% for 2014, and rising to 2.0% for 2015. The state unemployment rate, which finished 2013 at 8.9%, is expected to drop to 8.25% for 2014 and continue falling to 7.3% for 2015. Personal Income growth continues to improve as well; 2013 continued the previous period’s slow growth at 0.6%, but is expected to improve by 3.2% and 3.1% in 2014 and 2015, respectively. Los Angeles County entered 2014 with momentum from a county labor market that, contrary to previous forecasts, slowed during the second half of 2013. The first few months of 2013 were a continuation from 2012 with some growth, but sluggish national conditions made for less than satisfactory job growth from summer through year-end. The unemployment rate is expected to fall from 8.7% in 2014 to 7.8% in 2015; a normal unemployment rate of 7.5% may still be several years away. Most private industry sectors are expected to grow 1.6% in 2014, with another 1.2% gain to come in 2015. The largest gains for 2014 are expected in healthcare, social assistance, leisure, hospitality, professional and scientific technical services, administrative and support services and construction. Manufacturing is expected to rise slightly over the next few years, while government employment will be flat or trending downward slightly in 2014 and 2015. Barring unforeseen shocks to the national economy, Los Angeles County’s economy will continue to move forward for the remainder of 2014 and 2015. Nonfarm employment will continue to grow modestly at about 1% per year, but it will probably be 2016 or 2017 before it exceeds the peak of 4.12 million reached in 2007. Personal income and taxable sales are
A n t e l o p e V a l l e y T r a n s i t A u t h o r i t y F i s c a l Y e a r 2 0 1 4 C o m p r e h e n s i v e A n n u a l F i n a n c i a l R e p o r t
P a g e | 7
improving in parallel with the employment gains through 2014 and are expecting to increase 5.3% in 2014 and 6.1% in 2015, a signal that the consumer sector is improving. Since July 2012, transit’s primary funding program has been MAP-21 (Moving Ahead for Progress in the 21st Century Act), a two-year funding authorization bill that funded $10.5 billion in transportation programs for federal fiscal years 2013 and 2014. AVTA receives the majority of its federal funding from MAP-21 via the Federal Transit Administration’s Section 5307 Urbanized Area Formula Grants Program. There was some concern about the relatively short funding life of MAP-21, since the formal end of the program was just three months after the end of the current audit period. On August 8, 2014, President Obama signed into law H.R. 5021, the Highway and Transportation Funding Act of 2014; this stopgap strategy transfers $10.8 billion into the Highway Trust Fund and extends the surface transportation funding authorizations and policies of MAP-21 from October 1, 2014 to May 31, 2015. It is reasonable to expect that as with the SAFETEA-LU program before it, another extension of MAP-21 will be passed to prolong the Highway Trust Fund. While it is widely hoped that a new, longer term and more robust funding bill such as the Obama Administration’s GROW AMERCIA ACT will be passed in 2015, it is more likely that Congress will not take action to approve a long-term highway/transit bill until after the next president is inaugurated in 2017. As AVTA prepares its budget for the upcoming 2016 fiscal year, the prevailing economic conditions will be factored into the budget process. New funding sources and cost savings are a constant consideration while striving to maintain the same level of exceptional transit services in the most efficient and effective manner.
The Gr eater Antelope Va l ley Economy T h e L o c a l e The Greater Antelope Valley Economic Alliance (GAVEA) provides valuable information for businesses and organizations in the Antelope Valley in their efforts to attract, retain and grow business. AVTA is a member of GAVEA. The Antelope Valley connects with the Los Angeles Metropolitan Area via State Highway 14 about 60 miles to the north, and is located near the border of Los Angeles County and Kern County, to the immediate north. This modern freeway climbs to an elevation of 2,500 feet, where the Antelope Valley begins. State Highway 138 links the region to the Inland Empire and California’s Central Valley, providing an ideal location for businesses seeking to access both Southern and Central California. The region consists of five dynamic cities: Lancaster, Palmdale, Ridgecrest, Tehachapi and California City. The area is served by Los Angeles County’s Metrolink train service, daily local transit and commuter bus services and a number of private transportation companies.
A n t e l o p e V a l l e y T r a n s i t A u t h o r i t y F i s c a l Y e a r 2 0 1 4 C o m p r e h e n s i v e A n n u a l F i n a n c i a l R e p o r t
P a g e | 8
Planning has progressed regarding the California High Speed Rail system, which has designated the City of Palmdale as a stop. Other major projects in the Antelope Valley include the establishment of commercial airline service at the Palmdale and Inyokern Airports, continued expansion of State Highways 14, 58 and 138 and the planned east/west High Desert Corridor which will connect the Antelope Valley with the Victor Valley to the east. The median income for a household in the Antelope Valley (AV) in mid-year 2014 was $66,022, about 3.1% higher than the California median of $60,190. Unemployment in the AV is about 9.8%, higher than the California average of 8.9%. As the Antelope Valley emerges from the 2008 recession, the area is starting to rebound with increased employment, retail sales, home values and a generally lower cost of living than areas closer to the Los Angeles Basin. The Antelope Valley is a recognized leader in the aerospace industry; Northrup Grumman, Lockheed Martin and Boeing all have significant presences at Palmdale’s Air Force Plant 42 and at Edwards Air Force Base, about 40 miles to the northeast in southern Kern County. Additionally, the Antelope Valley is benefitting from the ongoing surge in renewable energy with the investment occurring in solar and wind energy production and “go green” initiatives for sustainable building practices. P o p u l a t i o n G r o w t h GAVEA’s 2014 forecast is projecting that the Antelope Valley population will grow about 26% in the next 7 years and by 50% between 2013 and 2035, as shown in the table below:
F i g u r e 1 – A n t e l o p e V a l l e y P o p u l a t i o n F o r e c a s t
2013 2020 2035
Lancaster 159,523 174,807 201,310
Palmdale 157,161 179,274 206,143
Unincorporated L.A. County/Other 106,125 134,000 172,173
Greater California City/Mojave 20,052 32,509 39,641
Greater Ridgecrest 28,600 39,442 41,737
Greater Rosamond/Edwards 22,831 31,805 40,245
Greater Tehachapi 13,258 47,691 57,632
Total Antelope Valley 507,550 639,528 758,881
A n t e l o p e V a l l e y T r a n s i t A u t h o r i t y F i s c a l Y e a r 2 0 1 4 C o m p r e h e n s i v e A n n u a l F i n a n c i a l R e p o r t
P a g e | 9
Major Init iatives in 201 4 2 0 1 4 A n n u a l B u d g e t P r o c e s s Beginning in January 2013, AVTA management developed its staffing, operating and capital plans for the coming fiscal year. The effort produced the FY 2014 Business Plan, which includes operating and capital spending plans as well as detailed funding sources and uses, further emphasizing the Authority’s commitment to transit projects and services for its ridership. The final Business Plan was presented to the Board of Directors for their review and approval during the June 2013 Board Meeting.
S trategic Planning
During the AVTA’s Strategic Planning Meeting in January 2013, the Board of Directors established goals in six areas for the FY 2014 budget cycle: S a f e t y - Increase the public confidence regarding safety on buses o Conducted 2nd Annual Bus Roadeo with winner attending International Bus Roadeo in Kansas City o Improved the safety in the AVTA lobby o Increased law enforcement presence o Reduced fare evasion on AVTA buses
E f f e c t i v e n e s s - Improve communication o Secured local funding and ordered two electric buses o Initiated monthly comprehensive financial reporting to the Board o Clean Comprehensive Annual Financial Report (CAFR) and Single Audit Report on Federal Awards
for Fiscal Year 2014
O u t s t a n d i n g C u s t o m e r S e r v i c e - Restructure service in a way that is responsive to customer concerns while living within our means o Issued Fare Restructuring RFP and developed fare restructuring scenarios o Intelligent Transportation System implementation substantially underway o Caller hold times averaging below target of 1:10 o Increased social media presence o Improved the website to be a more effective communications tool for the riding public o Conducted ridership satisfaction surveys
O r g a n i z a t i o n a l L e a d e r s h i p - Be proud to tell the AVTA story – create talking points to take out to the community o Hired government relations firm to represent federal interests in Washington, D.C. o Two First Place AdWheel Awards from APTA, including Grand Prize for commercial video
A n t e l o p e V a l l e y T r a n s i t A u t h o r i t y F i s c a l Y e a r 2 0 1 4 C o m p r e h e n s i v e A n n u a l F i n a n c i a l R e p o r t
P a g e | 10
E f f i c i e n c y - Develop a long-term plan that ensures a sustainable organization o Launched comprehensive operational analysis, “Road to Success” o Facilities reduced water consumption by 38% o Reduced AVTA’s carbon emissions by 400 metric tons by using hybrid buses o Recalculated jurisdictional contributions o Completed Classification and Compensation Study
F i n a n c i a l H e a l t h a n d S t i m u l u s AVTA produced a budget surplus of $3.9 million for the year, improving its financial health while producing its 3rd consecutive set of audited financial statements issued with clean, unmodified opinions. In February 2014, AVTA engaged the services of Van Scoyoc Associates Inc., a full-service federal government lobbying company in Washington, D.C. with considerable experience in transit funding. The increase in grant funds-seeking activity accompanies the Authority’s efforts to move local transit operations towards battery electric buses. Staff set key performance indicator goals that were tied to the FY 2014 Business Plan goals, and reported the results to the Board of Directors on a quarterly basis. Eight of the nine established goals were met outright, and the ninth goal underperformed by a statistically small amount. O t h e r A c c o m p l i s h m e n t s AVTA began the installation of Avail Corporation’s Intelligent Transportation System (ITS) to its fixed route fleet. It is an efficient computerized system allowing centralized control of fleet management and status, vehicle operations data collection and analysis, automatic ADA stop announcements, fare collection and dispatch services. The $2.5 million project was about 50% completed through the end of FY2014, and is expected to finish in the 3rd quarter of FY2015.
TRANSporter Service grew during FY14, carrying 37,000 passengers. The 2-year funding assistance from the Los Angeles County Board of Supervisors ceased June 30, 2014; this successful service will continue in FY2015, funded in total by AVTA.
A n t e l o p e V a l l e y T r a n s i t A u t h o r i t y F i s c a l Y e a r 2 0 1 4 C o m p r e h e n s i v e A n n u a l F i n a n c i a l R e p o r t
P a g e | 11
Fiscal Year 2015 Initiatives The goals approved by the Board of Directors for FY15 are organized into the following areas:
O P E R A T E A S A F E T R A N S I T S Y S T E M
o Increase Sheriff patrol by one day each week o Continue Volunteers on Patrol program
P R O V I D E O U T S T A N D I N G C U S T O M E R S E R V I C E
o Increase AVTA profile nationwide o Implement JARC Employment Voucher program o Improve graphics production with new equipment
O P E R A T E A N E F F E C T I V E T R A N S I T S Y S T E M
o Integrate electric bus technology into local fleet o Expand commuter service by 3,500 service hours o Add two commuter expansion coaches o Conduct preliminary BRT studies o Develop and implement marketing campaign supporting electric bus demonstration
O P E R A T E A N E F F I C I E N T T R A N S I T S Y S T E M
o Implement Board-approved recommendations from Route to Success Study o Implement ITS recommendations and use data collected to improve decision-making o Implement Document Management System o Implement Procurement Management System o Improve financial reporting and increase investment income o Implement new fare structure per Board-approved study o Implement classification and compensation study recommendations as approved by the Board
●●●

A n t e l o p e V a l l e y T r a n s i t A u t h o r i t y F i s c a l Y e a r 2 0 1 4 C o m p r e h e n s i v e A n n u a l F i n a n c i a l R e p o r t
P a g e | 12
A n t e l o p e V a l l e y T r a n s i t A u t h o r i t y F i s c a l Y e a r 2 0 1 4 C o m p r e h e n s i v e A n n u a l F i n a n c i a l R e p o r t
P a g e | 13
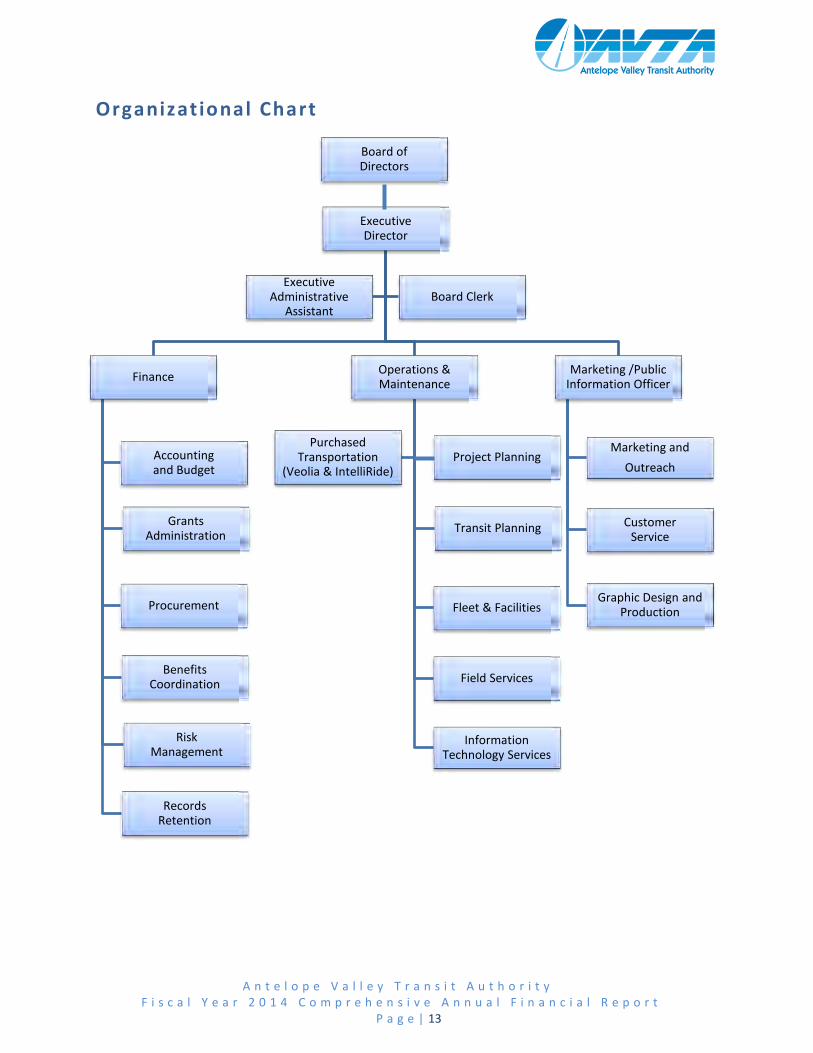
Organizational Chart
Board of Directors
Executive Director
Finance
Accounting and Budget
Grants Administration
Procurement
Benefits Coordination
Risk Management
Records Retention
Operations & Maintenance
Transit Planning
Fleet & Facilities
Field Services
Information Technology Services
Purchased Transportation
(Veolia & IntelliRide)
Marketing /Public Information Officer
Marketing and
Outreach
Customer Service
Graphic Design and Production
Executive Administrative
Assistant Board Clerk
Project Planning
A n t e l o p e V a l l e y T r a n s i t A u t h o r i t y F i s c a l Y e a r 2 0 1 4 C o m p r e h e n s i v e A n n u a l F i n a n c i a l R e p o r t
P a g e | 14
Financial Information A c c o u n t i n g S y s t e m s a n d B u d g e t a r y C o n t r o l In developing AVTA’s accounting system, consideration was given to the adequacy of internal accounting controls that are designed to provide reasonable, but not absolute, assurance in connection with 1) the safeguarding of assets against loss from unauthorized use or disposition, and 2) the reliability of financial records to be used for preparing financial statements and maintaining accountability for assets. The concept of reasonable assurances recognizes that 1) the cost of control should not exceed the benefits likely to be derived, and 2) the evaluation of costs and benefits requires estimates and judgments by management. All internal control evaluations occur within the framework described above. Management believes that the Authority’s internal accounting controls adequately safeguard assets and provide reasonable assurance of the proper recording of financial transactions. AVTA maintains budgetary controls to ensure compliance with the provisions embodied in the annual budget approved by the Board of Directors. In accordance with the Joint Powers Agreement, the Executive Director is authorized to transfer budgeted amounts within and between funds as deemed necessary in order to meet the Authority’s needs; any revisions that exceed the approved budget must be authorized by the Board of Directors. L o n g - T e r m F i n a n c i a l P l a n n i n g a n d M a j o r I n i t i a t i v e s AVTA maintains a 5-Year Capital Improvement Plan to ensure that its facilities, equipment and infrastructure are well maintained and operating in peak condition. This gives the Authority the ability to plan for its capital needs and budget resources accordingly. AVTA’s major capital acquisitions for FY 2015 include the continued Fleet Replacement Program and associated major bus components; the acquisition of facilities-, maintenance- and computer-related equipment; the continuation of the Regional Partnership Project, a long-term program that funds transit-related projects and improvements in the Authority’s service area; and the completion of the implementation of the Intelligent Transportation System (ITS) that will enhance bus operations and improve service to the public. The Authority put budgeted local fleet replacement capital plans on hold while working through the issues of acquiring the first 2 battery electric buses from BYD of Lancaster as part of a demonstration project. $1.9 million in funding was received from the Los Angeles Board of Supervisors to pay for the two demonstrators. These buses were delivered to AVTA in September 2014. A total of 5 commuter buses were ordered, 3 replacements and 2 JARC- funded expansion units; delivery is expected by June 2015, due to significant lead times.
A n t e l o p e V a l l e y T r a n s i t A u t h o r i t y F i s c a l Y e a r 2 0 1 4 C o m p r e h e n s i v e A n n u a l F i n a n c i a l R e p o r t
P a g e | 15
The planned Fare Study was conducted to ensure that AVTA’s services are priced reasonably, meets customer needs and increase the recovery of operational costs. The findings and recommendations will be presented to the Board of Directors in November 2014.
The Comprehensive Operational Analysis and Ten Year Plan, renamed “Route to Success”, was launched at nearly the same time as the Fare Study. The results will provide valuable decision-making data for many ongoing issues, such as the electric bus deployment and the consideration of the Bus Rapid Transit Project that would serve the high-density ridership corridor between the cities of Palmdale and Lancaster. The final recommendations will be presented to the Board of Directors in January 2015. Awards and Acknowledgements The Antelope Valley Transit Authority (AVTA) has been the recipient of several prestigious industry awards. AVTA was honored with two first place AdWheel Awards during the 2014 APTA Expo in Houston for work completed in FY 14. The AdWheel awards celebrate creativity in marketing and communications in the transit industry. Both entries competed in the transit group with four million or fewer passenger trips per year. The agency received top honors in two categories. A “Power On” ad designed to promote AVTA’s new electric bus, was awarded first place in the category of Advertisement – Advocacy/Awareness. The second entry was a transit card developed to promote the “Take AVTA to the Fair!” campaign. AVTA received a first place award in the category of Best Transit Card. The agency also received recognition in June when it was honored by Desert Haven Enterprises as the “Employer of the Year”. Since 2010, AVTA has employed four workers through Desert Haven, a vocational training center for disabled adults. The Government Finance Officers Association of the United States and Canada (GFOA) awarded a Certificate of Achievement for Excellence in Financial Reporting to the Antelope Valley Transit Authority for its comprehensive annual financial report for the fiscal year ended June 30, 2013. In order to be awarded a Certificate of Achievement, a government must publish an easily readable and efficiently organized comprehensive annual financial report. This report must satisfy both generally accepted accounting principles and applicable legal requirements. A Certificate of Achievement is valid for a period of one year only. We believe that our current comprehensive annual financial report continues to meet the Certificate of Achievement Program's requirements and we are submitting it to the GFOA to determine its eligibility for another certificate.


FINANCIAL SECTION

A n t e l o p e V a l l e y T r a n s i t A u t h o r i t y F i s c a l Y e a r 2 0 1 4 C o m p r e h e n s i v e A n n u a l F i n a n c i a l R e p o r t
P a g e | 19
INDEPENDENT AUDITORS’ REPORT To the Board of Directors of Antelope Valley Transit Authority Report on the Financial Statements We have audited the accompanying financial statements of Antelope Valley Transit Authority (AVTA), which comprise the statement of net position as of June 30, 2014 and 2013, and the related statements of revenues, expenses, and changes in net position, and cash flows for the years then ended, and the related notes to the financial statements. Management’s Responsibility for the Financial Statements Management is responsible for the preparation and fair presentation of these financial statements in accordance with accounting principles generally accepted in the United States of America; this includes the design, implementation, and maintenance of internal control relevant to the preparation and fair presentation of financial statements that are free from material misstatement, whether due to fraud or error. Auditors’ Responsibility Our responsibility is to express an opinion on these financial statements based on our audits. We conducted our audits in accordance with auditing standards generally accepted in the United States of America and the standards applicable to financial audits contained in Government Auditing Standards, issued by the Comptroller General of the United States. Those standards require that we plan and perform the audit to obtain reasonable assurance about whether the financial statements are free from material misstatement. An audit involves performing procedures to obtain audit evidence about the amounts and disclosures in the financial statements. The procedures selected depend on the auditors’ judgment, including the assessment of the risks of material misstatement of the financial statements, whether due to fraud or error. In making those risk assessments, the auditors consider internal control relevant to the entity’s preparation and fair presentation of the financial statements in order to design audit procedures that are appropriate in the circumstances, but not for the purpose of expressing an opinion on the effectiveness of the entity’s internal control. Accordingly, we express no such opinion. An audit also includes evaluating the appropriateness of accounting policies used and the reasonableness of significant accounting estimates made by management, as well as evaluating the overall presentation of the financial statements.
111 West Ocean Blvd. Twenty-Second Floor Long Beach, CA 90802
562.435.1191
18201 Von Karman Ave. Suite 1060 Irvine, CA 92612
949.271.2600
601 South Figueroa St. Suite 4950 Los Angeles, CA 90017
213.239.9745
www.windes.com
A n t e l o p e V a l l e y T r a n s i t A u t h o r i t y F i s c a l Y e a r 2 0 1 4 C o m p r e h e n s i v e A n n u a l F i n a n c i a l R e p o r t
P a g e | 20
We believe that the audit evidence we have obtained is sufficient and appropriate to provide a basis for our audit opinion. Opinion In our opinion, the financial statements referred to above present fairly, in all material respects, the financial position of Antelope Valley Transit Authority as of June 30, 2014 and 2013, and the changes in its net position and its cash flows for the years then ended in accordance with accounting principles generally accepted in the United States of America. Other Matters Required Supplementary Information Accounting principles generally accepted in the United States of America require that the Management’s Discussion and Analysis (MD&A) on pages 23-32 be presented to supplement the basic financial statements. Such information, although not a part of the basic financial statements, is required by the Governmental Accounting Standards Board who considers it to be an essential part of financial reporting for placing the basic financial statements in an appropriate operational, economic, or historical context. We have applied certain limited procedures to the required supplementary information in accordance with auditing standards generally accepted in the United States of America, which consisted of inquiries of management about the methods of preparing the information and comparing the information for consistency with management’s responses to our inquiries, the basic financial statements, and other knowledge we obtained during our audit of the basic financial statements. We do not express an opinion or provide any assurance on the information because the limited procedures do not provide us with sufficient evidence to express on opinion or provide any assurance. Other Information Our audit was conducted for the purpose of forming opinions on the financial statements as a whole. The introductory and statistical sections are presented for purposes of additional analysis and are not a required part of the basic financial statements. The introductory and statistical sections have not been subjected to the auditing procedures applied in the audit of the basic financial statements and, accordingly, we do not express an opinion or provide any assurance on them.

A n t e l o p e V a l l e y T r a n s i t A u t h o r i t y F i s c a l Y e a r 2 0 1 4 C o m p r e h e n s i v e A n n u a l F i n a n c i a l R e p o r t
P a g e | 21
Other Reporting Required by Government Auditing Standards
In accordance with Government Auditing Standards, we have also issued our report dated November 25, 2014 on our consideration of Antelope Valley Transit Authority’s internal control over financial reporting and on our tests of its compliance with certain provisions of laws, regulations, contracts, and grant agreements and other matters. The purpose of that report is to describe the scope of our testing of internal control over financial reporting and compliance and the results of that testing, and not to provide an opinion on internal control over financial reporting or on compliance. That report is an integral part of an audit performed in accordance with Government Auditing Standards in considering Antelope Valley Transit Authority’s internal control over financial reporting and compliance. Long Beach, California November 25, 2014

This page left intentionally blank.
A n t e l o p e V a l l e y T r a n s i t A u t h o r i t y F i s c a l Y e a r 2 0 1 4 C o m p r e h e n s i v e A n n u a l F i n a n c i a l R e p o r t
P a g e | 22
MANAGEMENT’S DISCUSSION AND ANALYSIS
F o r w a r d
The management of the Antelope Valley Transit Authority (AVTA or Authority) offers the readers of AVTA’s financial statements this narrative overview and analysis of the financial activities of AVTA for the fiscal year ended June 30, 2014. We encourage readers to consider the information presented here in conjunction with the accompanying the basic financial statements.
F I n a n c i a l H i g h l i g h t s
• AVTA’s cash and cash equivalents at fiscal year-end June 30, 2014 were $25,275,465.
• The net position of AVTA’s assets exceeded its liabilities at the close of the fiscal year by $70,780,480. Of this amount, $17,081,594 may be used to meet AVTA’s ongoing financial obligations.
• After recording the value of AVTA’s capital assets net of accumulated depreciation, the increase from the prior year in net position resulting from the most recent fiscal year’s activities was $3,941,100.
• Total revenues from all sources were $30,077,455, reflecting a decrease of $13,067,754 or 30.3%. The previous year included $16 million in capital grants, two times the amount that the Authority usually receives.
• The total cost of AVTA’s transit services, expenses and projects was $26,136,355, an increase of $1,195,015 or 4.8% more than the last fiscal year.
• The operating loss from providing transit services for FY14 was ($20,917,995), an increased loss of $1,207,136, or 6.1% over the previous year.
• Member jurisdictions contributed $3,505,896 in operational support of transit services and $460,896 for AVTA’s capital reserves.
• Non-depreciable capital assets were $3,031,688 as of June 30, 2014, and net depreciable capital assets were $45,749,781.
• At the end of the fiscal year, the unrestricted net assets of AVTA were $17,081,594. This amount does not include restricted jurisdiction contributions to a capital reserve totaling $4,917,417 as of June 30, 2014.
F i n a n c I a l S t a t e m e n t O v e r v I e w
The annual financial report consists of two parts: Management Discussion and Analysis and the basic financial statements, including explanatory notes to the financial statements.
The AVTA is a government funded entity that follows enterprise fund accounting and presents its financial statements on the accrual basis of accounting. The enterprise fund concept is similar to how private business enterprises are financed and operated. These statements provide a top-level view of the Authority’s financial picture in a format similar to that of private-sector companies. The Authority, like local and state governments, uses fund accounting to ensure and demonstrate compliance with finance-related legal requirements.
A n t e l o p e V a l l e y T r a n s i t A u t h o r i t y F i s c a l Y e a r 2 0 1 4 C o m p r e h e n s i v e A n n u a l F i n a n c i a l R e p o r t
P a g e | 23
MANAGEMENT’S DISCUSSION AND ANALYSIS
The following reports comprise AVTA’s financial statements:
Statement of Net Position - Presents information on all of the Authority’s assets and liabilities for the last two fiscal years, with the difference between the two reported as net position. Over time, increases or decreases in net position may serve as a useful indicator of whether the financial position of the Authority is improving or deteriorating, though it is important to consider other non-financial factors in accurately assessing the overall health of AVTA, such as the ridership, volatility of fuel cost, etc.
Statement of Revenues, Expenses and Changes in Net Position - The information presented in this report shows how AVTA’s net position changed during the two most recent fiscal years. All changes in net position are reported as soon as the underlying event giving rise to the change occurs, regardless of the timing of related cash flows. Thus, revenues and expenditures are reported in this statement for some items that may result in cash flows in future fiscal periods.
Statement of Cash Flows - This report presents the sources and uses of funds of AVTA for the past two fiscal years. It shows the inflow and outflow of cash from AVTA’s operating activities, non-capital financing activities, capital and non-related financing activities, and investing activities.
Notes to the Basic Financial Statements - The notes provide additional information essential to a full understanding of the data provided in the basic financial statements.
Other Audits – There were other audits that were, or are planned to be, conducted by relevant authorities. During fiscal year 2014, there were two such audits.
The Los Angeles Metropolitan Transportation Authority commissions an annual audit of the Proposition A Discretionary Incentive Grant (Schedule of Expenditures). The audit field work was completed in the latter part of October 2014, and the final audited statements will be issued upon review by LA Metro. No exceptions were included in the statement drafts prepared by the audit firm of Simpson & Simpson.
AVTA underwent a Triennial Review for the fiscal years 2011–2014. The review is one of the Federal Transit Administration’s (FTA) management tools for examining grantee performance and adherence to current FTA requirements and policies. In particular, it examines how recipients of Section 5307 Urbanized Area Formula Funding meet statutory and administrative requirements. In addition to evaluating grantees, the review gives the FTA an opportunity to provide technical assistance to grantees and aids the FTA in reporting to the Secretary of Transportation, Congress, other oversight agencies and the transit community on the Urbanized Area Formula Program.
The Philadelphia firm of Milligan and Company conducted the AVTA review on behalf of FTA Region 9, reviewing 17 areas over a 4 month period. The final results totaled 9 findings, 2 in the area of the Americans with Disabilities Act (ADA) and 7 in Procurement. All of the findings were addressed with the Los Angeles Office of FTA Region 9. The ADA findings were common to all transit agencies offering paratransit services provided by American Logistics Corporation (ALC) as the designated provider in Los Angeles County. FTA and ALC are scheduled to settle the issues no later than March 2015. The procurement findings were cleared when AVTA staff updated its internal Procurement Policies and Procedures document and was found to be in conformance by the FTA.
A n t e l o p e V a l l e y T r a n s i t A u t h o r i t y F i s c a l Y e a r 2 0 1 4 C o m p r e h e n s i v e A n n u a l F i n a n c i a l R e p o r t
P a g e | 24
MANAGEMENT’S DISCUSSION AND ANALYSIS
F i n a n c I a l S t a t e m e n t A n a l y s I s
S t a t e m e n t o f i n N e t P o s i t i o n
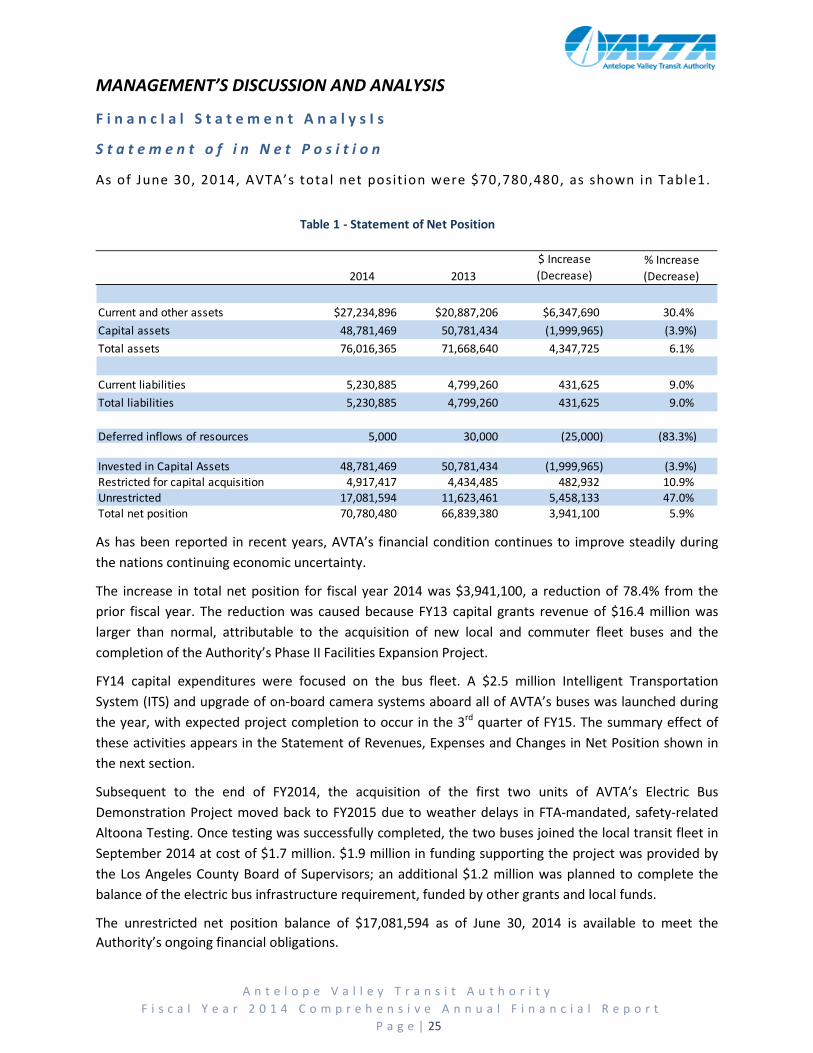
As of June 30, 2014, AVTA’s total net posit ion were $70,780,480, as shown in Table1.
As has been reported in recent years, AVTA’s financial condition continues to improve steadily during the nations continuing economic uncertainty.
The increase in total net position for fiscal year 2014 was $3,941,100, a reduction of 78.4% from the prior fiscal year. The reduction was caused because FY13 capital grants revenue of $16.4 million was larger than normal, attributable to the acquisition of new local and commuter fleet buses and the completion of the Authority’s Phase II Facilities Expansion Project.
FY14 capital expenditures were focused on the bus fleet. A $2.5 million Intelligent Transportation System (ITS) and upgrade of on-board camera systems aboard all of AVTA’s buses was launched during the year, with expected project completion to occur in the 3rd quarter of FY15. The summary effect of these activities appears in the Statement of Revenues, Expenses and Changes in Net Position shown in the next section.
Subsequent to the end of FY2014, the acquisition of the first two units of AVTA’s Electric Bus Demonstration Project moved back to FY2015 due to weather delays in FTA-mandated, safety-related Altoona Testing. Once testing was successfully completed, the two buses joined the local transit fleet in September 2014 at cost of $1.7 million. $1.9 million in funding supporting the project was provided by the Los Angeles County Board of Supervisors; an additional $1.2 million was planned to complete the balance of the electric bus infrastructure requirement, funded by other grants and local funds.
The unrestricted net position balance of $17,081,594 as of June 30, 2014 is available to meet the Authority’s ongoing financial obligations.
2014 2013$ Increase (Decrease)
Current and other assets $27,234,896 $20,887,206 $6,347,690 30.4% Capital assets 48,781,469 50,781,434 (1,999,965) (3.9%)Total assets 76,016,365 71,668,640 4,347,725 6.1%
Current liabilities 5,230,885 4,799,260 431,625 9.0% Total liabilities 5,230,885 4,799,260 431,625 9.0%
Deferred inflows of resources 5,000 30,000 (25,000) (83.3%)
Invested in Capital Assets 48,781,469 50,781,434 (1,999,965) (3.9%)Restricted for capital acquisition 4,917,417 4,434,485 482,932 10.9% Unrestricted 17,081,594 11,623,461 5,458,133 47.0% Total net position 70,780,480 66,839,380 3,941,100 5.9%
Table 1 - Statement of Net Position
% Increase (Decrease)
A n t e l o p e V a l l e y T r a n s i t A u t h o r i t y F i s c a l Y e a r 2 0 1 4 C o m p r e h e n s i v e A n n u a l F i n a n c i a l R e p o r t
P a g e | 25

MANAGEMENT’S DISCUSSION AND ANALYSIS
F i n a n c I a l S t a t e m e n t A n a l y s I s
R e v e n u e s a n d E x p e n s e s : C h a n g e s I n N e t P o s i t i o n
As of June 30, 2014, AVTA’s change in net posit ion was $3,941,100, as shown in Table2:
R e v e n u e s
For the fiscal year ended June 30, 2014, AVTA’s total revenues from all sources were $30.1 million, down $13.1 million from fiscal year 2013. Fare revenue increased $81K, or 1.7%, but was outpaced by a 3.1% increase in ridership for the year. Non-capital grants and contributions decreased by $1.6 million or (7.3%), as the decrease in 5307 Formula Funds tasked for preventive maintenance and operating support were only partially offset by budgeted Job Access Reverse Commute (JARC) funds activity that was delayed and carried over in the FY2015 budget. Capital grants revenue decreased by $14 million as the pace of capital expenditures slowed from the previous fiscal year (2013), as described previously in the discussion of the change of net position in FY2014. This was partially offset by the resumption in FY2014 of jurisdictional capital reserve payments of $461,000, which had been temporarily halted by the Board of Directors for FY2013. Other revenues increased by $1.9 million, based on a receipt of funds from the Los Angeles County Board of Supervisors in support of AVTA’s Electric bus Demonstration project. Other sources included advertising expense and contributions that were passed through to local charitable organizations during the holiday season.
2014 2013 $ Increase
Revenues:Passenger fares $4,913,641 $4,832,800 $80,841 1.7% Non-capital grants and contributions 19,973,201 21,535,855 (1,562,654) (7.3%)Capital grants and contributions 2,905,113 16,444,223 (13,539,110) (82.3%)Other non-rransportation revenues 2,285,500 370,793 1,914,707 516.4% Total Revenues 30,077,455 43,183,671 (13,106,216) (30.3%)
Expenses:Purchased transportation 12,799,002 12,318,390 480,612 3.9% Fuel 2,768,552 2,819,513 (50,961) (1.8%)Other operating costs 628,458 824,123 (195,665) (23.7%)General and administrative expense 4,503,687 4,062,048 441,639 10.9% Depreciation 5,131,937 4,519,585 612,352 13.5% Non-operating grantable expenses 304,719 397,681 (92,962) (23.4%)Loss on sale of asset 38,462 (38,462) (100.0%)Total Expenses 26,136,355 24,979,802 1,156,553 4.6%
Change in Net Position 3,941,100 18,203,869 (14,262,769) (78.4%)
Net Position, beginning of the year 66,839,380 48,635,511 18,203,869 37.4% Net Position, end of the year 70,780,480 66,839,380 3,941,100 5.9%
Table 2 - Statement of Revenues, Expenses and Changes in Net Position
% Increase
A n t e l o p e V a l l e y T r a n s i t A u t h o r i t y F i s c a l Y e a r 2 0 1 4 C o m p r e h e n s i v e A n n u a l F i n a n c i a l R e p o r t
P a g e | 26
MANAGEMENT’S DISCUSSION AND ANALYSIS
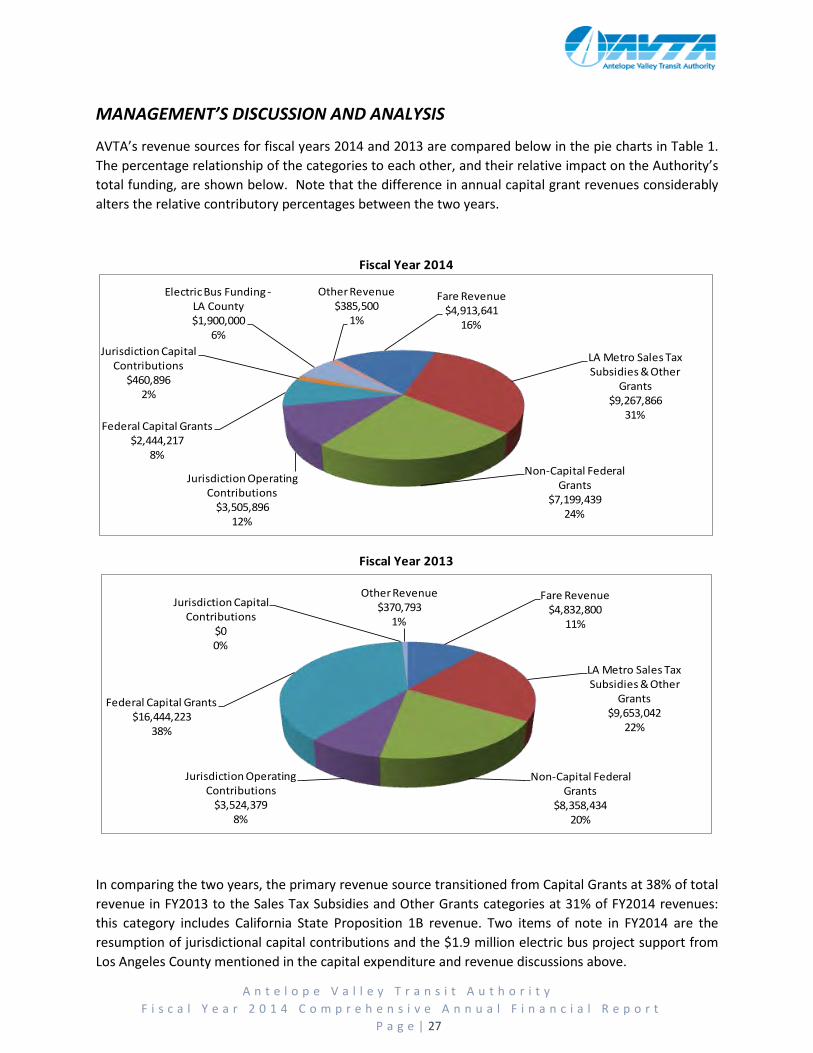
AVTA’s revenue sources for fiscal years 2014 and 2013 are compared below in the pie charts in Table 1. The percentage relationship of the categories to each other, and their relative impact on the Authority’s total funding, are shown below. Note that the difference in annual capital grant revenues considerably alters the relative contributory percentages between the two years.
In comparing the two years, the primary revenue source transitioned from Capital Grants at 38% of total revenue in FY2013 to the Sales Tax Subsidies and Other Grants categories at 31% of FY2014 revenues: this category includes California State Proposition 1B revenue. Two items of note in FY2014 are the resumption of jurisdictional capital contributions and the $1.9 million electric bus project support from Los Angeles County mentioned in the capital expenditure and revenue discussions above.
Fiscal Year 2013
Fiscal Year 2014
Fare Revenue$4,832,800
11%
LA Metro Sales Tax Subsidies & Other
Grants$9,653,042
22%
Non-Capital Federal Grants
$8,358,434 20%
Jurisdiction Operating Contributions
$3,524,379 8%
Federal Capital Grants$16,444,223
38%
Jurisdiction Capital Contributions
$0 0%
Other Revenue$370,793
1%
Fare Revenue$4,913,641
16%
LA Metro Sales Tax Subsidies & Other
Grants$9,267,866
31%
Non-Capital Federal Grants
$7,199,439 24%
Jurisdiction Operating Contributions
$3,505,896 12%
Federal Capital Grants$2,444,217
8%
Jurisdiction Capital Contributions
$460,896 2%
Electric Bus Funding -LA County$1,900,000
6%
Other Revenue$385,500
1%
A n t e l o p e V a l l e y T r a n s i t A u t h o r i t y F i s c a l Y e a r 2 0 1 4 C o m p r e h e n s i v e A n n u a l F i n a n c i a l R e p o r t
P a g e | 27
MANAGEMENT’S DISCUSSION AND ANALYSIS
F a r e R e v e n u e s
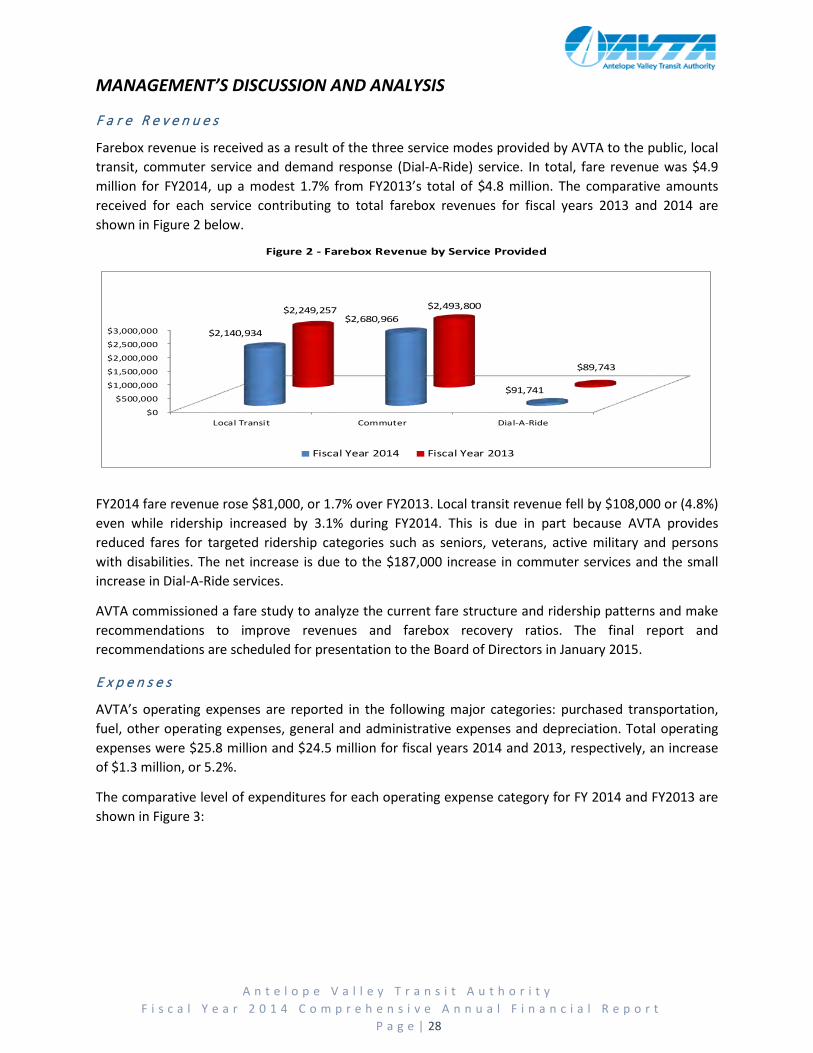
Farebox revenue is received as a result of the three service modes provided by AVTA to the public, local transit, commuter service and demand response (Dial-A-Ride) service. In total, fare revenue was $4.9 million for FY2014, up a modest 1.7% from FY2013’s total of $4.8 million. The comparative amounts received for each service contributing to total farebox revenues for fiscal years 2013 and 2014 are shown in Figure 2 below.
FY2014 fare revenue rose $81,000, or 1.7% over FY2013. Local transit revenue fell by $108,000 or (4.8%) even while ridership increased by 3.1% during FY2014. This is due in part because AVTA provides reduced fares for targeted ridership categories such as seniors, veterans, active military and persons with disabilities. The net increase is due to the $187,000 increase in commuter services and the small increase in Dial-A-Ride services.
AVTA commissioned a fare study to analyze the current fare structure and ridership patterns and make recommendations to improve revenues and farebox recovery ratios. The final report and recommendations are scheduled for presentation to the Board of Directors in January 2015.
E x p e n s e s
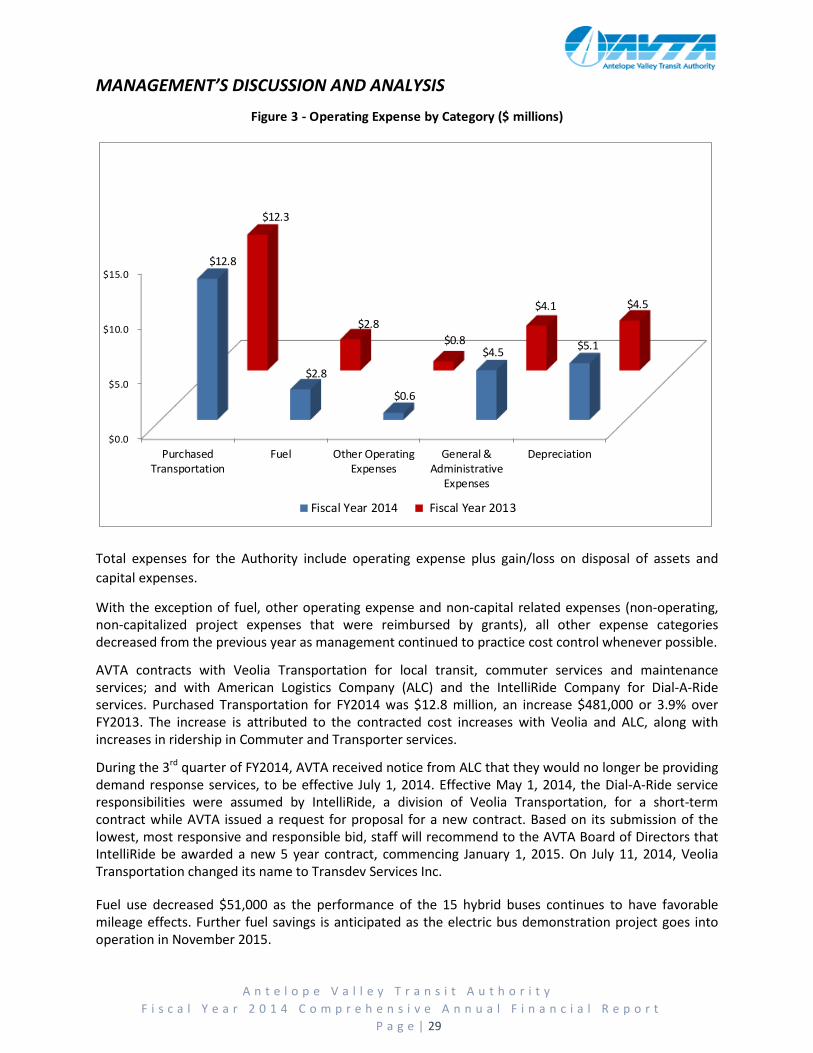
AVTA’s operating expenses are reported in the following major categories: purchased transportation, fuel, other operating expenses, general and administrative expenses and depreciation. Total operating expenses were $25.8 million and $24.5 million for fiscal years 2014 and 2013, respectively, an increase of $1.3 million, or 5.2%.
The comparative level of expenditures for each operating expense category for FY 2014 and FY2013 are shown in Figure 3:
Figure 2 - Farebox Revenue by Service Provided
$0
$500,000
$1,000,000
$1,500,000
$2,000,000
$2,500,000
$3,000,000
Local Transit Commuter Dial-A-Ride
$2,140,934 $2,680,966
$91,741
$2,249,257 $2,493,800
$89,743
Fiscal Year 2014 Fiscal Year 2013
A n t e l o p e V a l l e y T r a n s i t A u t h o r i t y F i s c a l Y e a r 2 0 1 4 C o m p r e h e n s i v e A n n u a l F i n a n c i a l R e p o r t
P a g e | 28
MANAGEMENT’S DISCUSSION AND ANALYSIS
Total expenses for the Authority include operating expense plus gain/loss on disposal of assets and capital expenses.
With the exception of fuel, other operating expense and non-capital related expenses (non-operating, non-capitalized project expenses that were reimbursed by grants), all other expense categories decreased from the previous year as management continued to practice cost control whenever possible.
AVTA contracts with Veolia Transportation for local transit, commuter services and maintenance services; and with American Logistics Company (ALC) and the IntelliRide Company for Dial-A-Ride services. Purchased Transportation for FY2014 was $12.8 million, an increase $481,000 or 3.9% over FY2013. The increase is attributed to the contracted cost increases with Veolia and ALC, along with increases in ridership in Commuter and Transporter services.
During the 3rd quarter of FY2014, AVTA received notice from ALC that they would no longer be providing demand response services, to be effective July 1, 2014. Effective May 1, 2014, the Dial-A-Ride service responsibilities were assumed by IntelliRide, a division of Veolia Transportation, for a short-term contract while AVTA issued a request for proposal for a new contract. Based on its submission of the lowest, most responsive and responsible bid, staff will recommend to the AVTA Board of Directors that IntelliRide be awarded a new 5 year contract, commencing January 1, 2015. On July 11, 2014, Veolia Transportation changed its name to Transdev Services Inc.
Fuel use decreased $51,000 as the performance of the 15 hybrid buses continues to have favorable mileage effects. Further fuel savings is anticipated as the electric bus demonstration project goes into operation in November 2015.
Figure 3 - Operating Expense by Category ($ millions)
$0.0
$5.0
$10.0
$15.0
PurchasedTransportation
Fuel Other OperatingExpenses
General &Administrative
Expenses
Depreciation
$12.8
$2.8
$0.6
$4.5 $5.1
$12.3
$2.8 $0.8
$4.1 $4.5
Fiscal Year 2014 Fiscal Year 2013
A n t e l o p e V a l l e y T r a n s i t A u t h o r i t y F i s c a l Y e a r 2 0 1 4 C o m p r e h e n s i v e A n n u a l F i n a n c i a l R e p o r t
P a g e | 29
MANAGEMENT’S DISCUSSION AND ANALYSIS
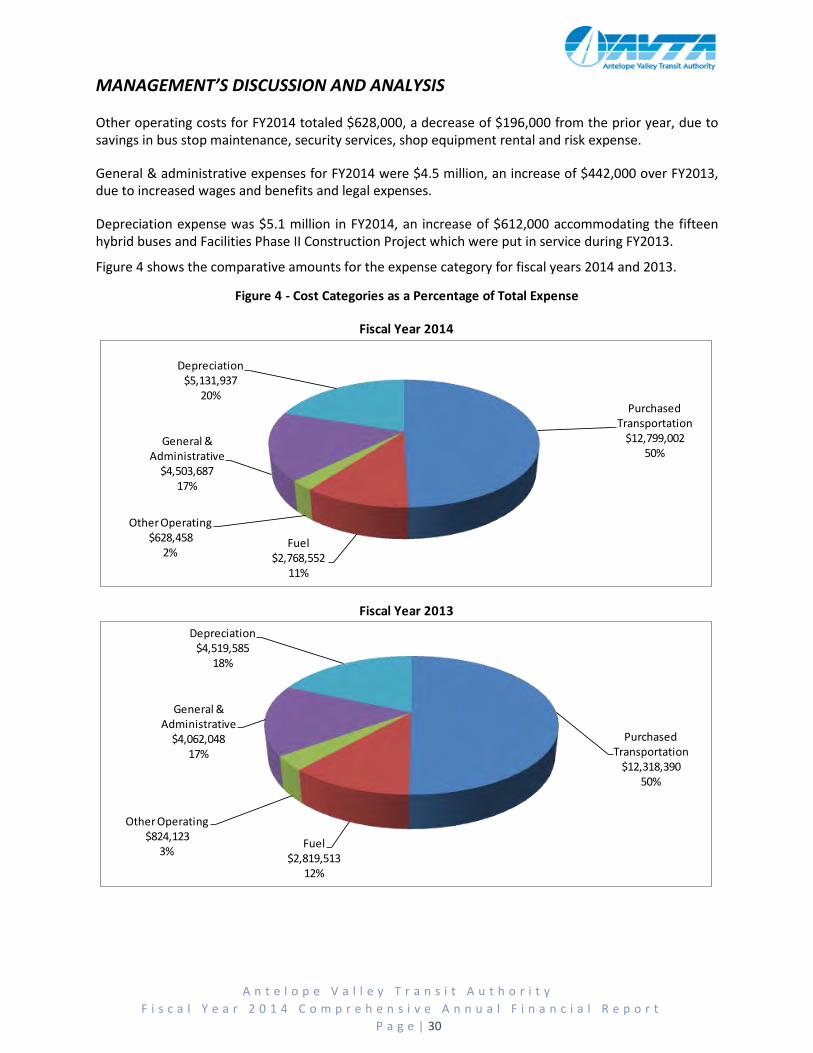
Other operating costs for FY2014 totaled $628,000, a decrease of $196,000 from the prior year, due to savings in bus stop maintenance, security services, shop equipment rental and risk expense.
General & administrative expenses for FY2014 were $4.5 million, an increase of $442,000 over FY2013, due to increased wages and benefits and legal expenses.
Depreciation expense was $5.1 million in FY2014, an increase of $612,000 accommodating the fifteen hybrid buses and Facilities Phase II Construction Project which were put in service during FY2013.
Figure 4 shows the comparative amounts for the expense category for fiscal years 2014 and 2013.
Fiscal Year 2013
Figure 4 - Cost Categories as a Percentage of Total Expense
Fiscal Year 2014
Purchased Transportation
$12,318,390 50%
Fuel$2,819,513
12%
Other Operating $824,123
3%
General & Administrative
$4,062,048 17%
Depreciation$4,519,585
18%
Purchased Transportation
$12,799,002 50%
Fuel$2,768,552
11%
Other Operating $628,458
2%
General & Administrative
$4,503,687 17%
Depreciation$5,131,937
20%
A n t e l o p e V a l l e y T r a n s i t A u t h o r i t y F i s c a l Y e a r 2 0 1 4 C o m p r e h e n s i v e A n n u a l F i n a n c i a l R e p o r t
P a g e | 30
MANAGEMENT’S DISCUSSION AND ANALYSIS
A n a l y s i s o f M a j o r F u n d s
AVTA uses fund accounting to ensure and demonstrate compliance with finance-related reporting requirements. The general fund is the chief operating fund of AVTA. The focus of the general fund is to provide information on inflows, outflows and the balances of spendable resources. Fund accounting facilitates tracking the funding and expenses associated with specific projects, required for reporting whenever federal funds are used.
As of June 30, 2014, unrestricted net position is $17.1 million, an increase of $5.5 million over the prior year. Restricted funds are $4.9 million, representing the jurisdictional members’ capital reserve contributions balance.
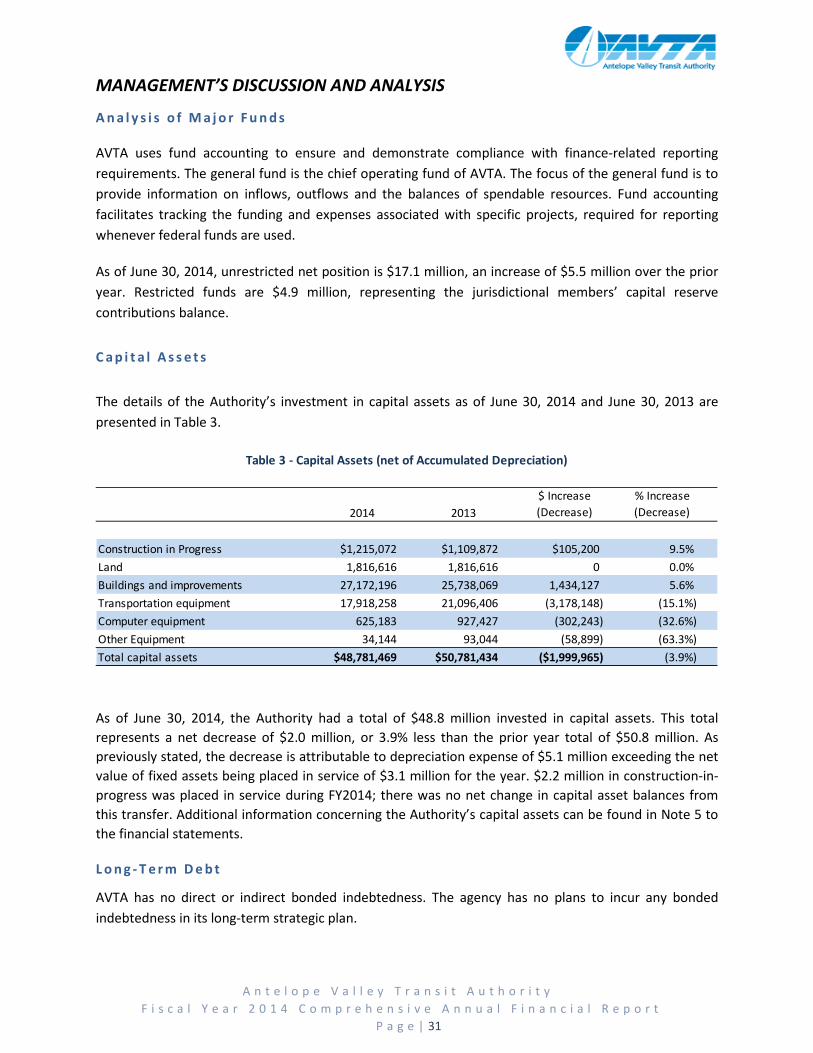
C a p i t a l A s s e t s
The details of the Authority’s investment in capital assets as of June 30, 2014 and June 30, 2013 are presented in Table 3.
As of June 30, 2014, the Authority had a total of $48.8 million invested in capital assets. This total represents a net decrease of $2.0 million, or 3.9% less than the prior year total of $50.8 million. As previously stated, the decrease is attributable to depreciation expense of $5.1 million exceeding the net value of fixed assets being placed in service of $3.1 million for the year. $2.2 million in construction-in-progress was placed in service during FY2014; there was no net change in capital asset balances from this transfer. Additional information concerning the Authority’s capital assets can be found in Note 5 to the financial statements.
L o n g - T e r m D e b t
AVTA has no direct or indirect bonded indebtedness. The agency has no plans to incur any bonded indebtedness in its long-term strategic plan.
2014 2013$ Increase (Decrease)
% Increase (Decrease)
Construction in Progress $1,215,072 $1,109,872 $105,200 9.5% Land 1,816,616 1,816,616 0 0.0% Buildings and improvements 27,172,196 25,738,069 1,434,127 5.6% Transportation equipment 17,918,258 21,096,406 (3,178,148) (15.1%)Computer equipment 625,183 927,427 (302,243) (32.6%)Other Equipment 34,144 93,044 (58,899) (63.3%)Total capital assets $48,781,469 $50,781,434 ($1,999,965) (3.9%)
Table 3 - Capital Assets (net of Accumulated Depreciation)
A n t e l o p e V a l l e y T r a n s i t A u t h o r i t y F i s c a l Y e a r 2 0 1 4 C o m p r e h e n s i v e A n n u a l F i n a n c i a l R e p o r t
P a g e | 31
MANAGEMENT’S DISCUSSION AND ANALYSIS
N e x t Y e a r ’ s B u d g e t G o a l s
Goals approved by the Board of Directors for FY15 are organized into the following areas:
• OPERATE A SAFE TRANSIT SYSTEM o Increase Sheriff’s Department patrol by one day each week o Continue Volunteers on Patrol program
• PROVIDE OUTSTANDING CUSTOMER SERVICE
o Increase AVTA profile nationwide o Implement JARC Employment Voucher program o Improve graphics production with new equipment
• OPERATE AN EFFECTIVE TRANSIT SYSTEM
o Integrate electric bus technology into local fleet o Expand commuter service by 3,500 service hours o Add two commuter expansion coaches o Conduct preliminary BRT studies o Develop and implement marketing campaign supporting electric bus demonstration
• OPERATE AN EFFICIENT TRANSIT SYSTEM o Implement Board-approved recommendations from Route to Success Study o Implement ITS recommendations and use data collected to improve decision-making o Implement Document Management System o Implement Procurement Management System o Improve financial reporting and increase investment income o Implement new fare structure per Board-approved study o Implement classification and compensation study recommendations as approved by the Board
R e q u e s t s f o r I n f o r m a t i o n
This Comprehensive Annual Financial Report is designed to provide our customers, stakeholders, and other interested parties with an overview of the Authority’s financial operations and condition. If the reader has any questions about this report or needs additional information, you may contact the Authority’s Director of Finance at:
Antelope Valley Transit Authority 42210 6th Street West Lancaster, CA 93534
* * * * * *
A n t e l o p e V a l l e y T r a n s i t A u t h o r i t y F i s c a l Y e a r 2 0 1 4 C o m p r e h e n s i v e A n n u a l F i n a n c i a l R e p o r t
P a g e | 32
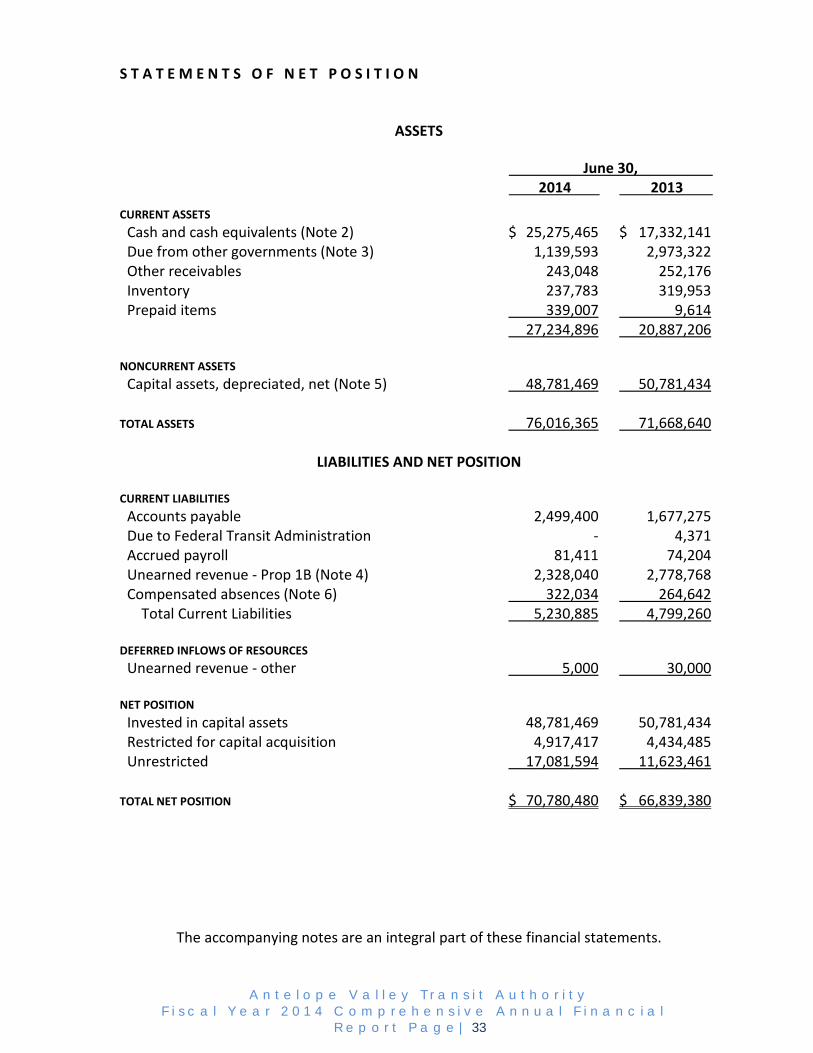
S T A T E M E N T S O F N E T P O S I T I O N
ASSETS June 30, 2014 2013
CURRENT ASSETS Cash and cash equivalents (Note 2) $ 25,275,465 $ 17,332,141 Due from other governments (Note 3) 1,139,593 2,973,322 Other receivables 243,048 252,176 Inventory 237,783 319,953 Prepaid items 339,007 9,614 27,234,896 20,887,206 NONCURRENT ASSETS Capital assets, depreciated, net (Note 5) 48,781,469 50,781,434 TOTAL ASSETS 76,016,365 71,668,640
LIABILITIES AND NET POSITION CURRENT LIABILITIES Accounts payable 2,499,400 1,677,275 Due to Federal Transit Administration - 4,371 Accrued payroll 81,411 74,204 Unearned revenue - Prop 1B (Note 4) 2,328,040 2,778,768 Compensated absences (Note 6) 322,034 264,642 Total Current Liabilities 5,230,885 4,799,260 DEFERRED INFLOWS OF RESOURCES Unearned revenue - other 5,000 30,000 NET POSITION Invested in capital assets 48,781,469 50,781,434 Restricted for capital acquisition 4,917,417 4,434,485 Unrestricted 17,081,594 11,623,461 TOTAL NET POSITION $ 70,780,480 $ 66,839,380
The accompanying notes are an integral part of these financial statements.
A n t e l o p e V a l l e y T r a n s i t A u t h o r i t y F i s c a l Y e a r 2 0 1 4 C o m p r e h e n s i v e A n n u a l F i n a n c i a l
R e p o r t P a g e | 33
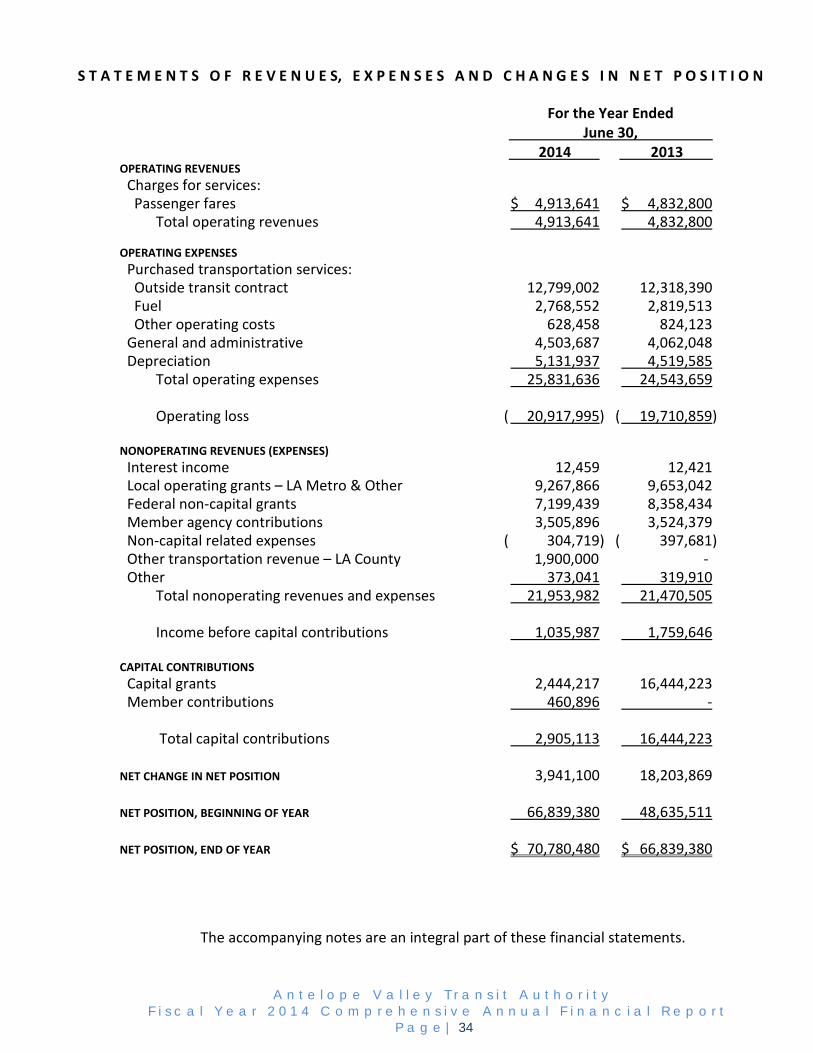
S T A T E M E N T S O F R E V E N U E S, E X P E N S E S A N D C H A N G E S I N N E T P O S I T I O N
For the Year Ended June 30, 2014 2013 OPERATING REVENUES Charges for services: Passenger fares $ 4,913,641 $ 4,832,800 Total operating revenues 4,913,641 4,832,800 OPERATING EXPENSES Purchased transportation services: Outside transit contract 12,799,002 12,318,390 Fuel 2,768,552 2,819,513 Other operating costs 628,458 824,123 General and administrative 4,503,687 4,062,048 Depreciation 5,131,937 4,519,585 Total operating expenses 25,831,636 24,543,659 Operating loss ( 20,917,995) ( 19,710,859) NONOPERATING REVENUES (EXPENSES) Interest income 12,459 12,421 Local operating grants – LA Metro & Other 9,267,866 9,653,042 Federal non-capital grants 7,199,439 8,358,434 Member agency contributions 3,505,896 3,524,379 Non-capital related expenses ( 304,719) ( 397,681) Other transportation revenue – LA County 1,900,000 - Other 373,041 319,910 Total nonoperating revenues and expenses 21,953,982 21,470,505 Income before capital contributions 1,035,987 1,759,646 CAPITAL CONTRIBUTIONS Capital grants 2,444,217 16,444,223 Member contributions 460,896 - Total capital contributions 2,905,113 16,444,223 NET CHANGE IN NET POSITION 3,941,100 18,203,869 NET POSITION, BEGINNING OF YEAR 66,839,380 48,635,511 NET POSITION, END OF YEAR $ 70,780,480 $ 66,839,380
The accompanying notes are an integral part of these financial statements.
A n t e l o p e V a l l e y T r a n s i t A u t h o r i t y F i s c a l Y e a r 2 0 1 4 C o m p r e h e n s i v e A n n u a l F i n a n c i a l R e p o r t
P a g e | 34
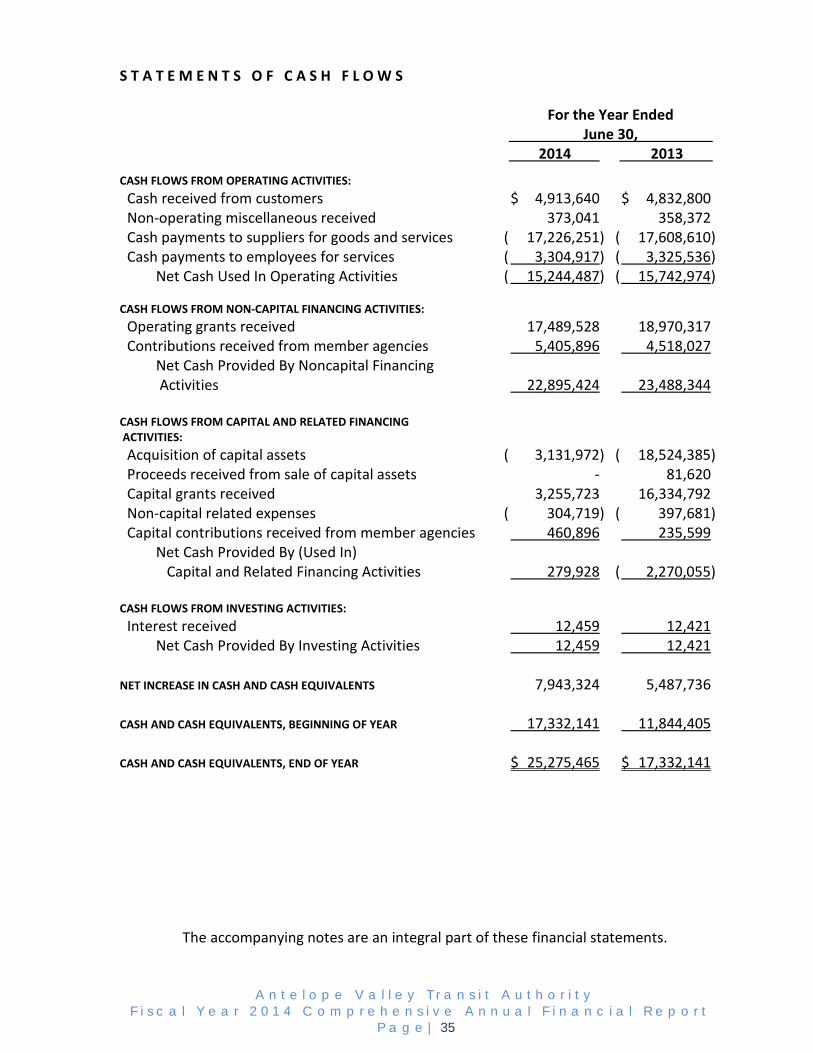
S T A T E M E N T S O F C A S H F L O W S For the Year Ended June 30, 2014 2013
CASH FLOWS FROM OPERATING ACTIVITIES: Cash received from customers $ 4,913,640 $ 4,832,800 Non-operating miscellaneous received 373,041 358,372 Cash payments to suppliers for goods and services ( 17,226,251) ( 17,608,610) Cash payments to employees for services ( 3,304,917) ( 3,325,536) Net Cash Used In Operating Activities ( 15,244,487) ( 15,742,974) CASH FLOWS FROM NON-CAPITAL FINANCING ACTIVITIES: Operating grants received 17,489,528 18,970,317 Contributions received from member agencies 5,405,896 4,518,027 Net Cash Provided By Noncapital Financing Activities 22,895,424 23,488,344 CASH FLOWS FROM CAPITAL AND RELATED FINANCING ACTIVITIES: Acquisition of capital assets ( 3,131,972) ( 18,524,385) Proceeds received from sale of capital assets - 81,620 Capital grants received 3,255,723 16,334,792 Non-capital related expenses ( 304,719) ( 397,681) Capital contributions received from member agencies 460,896 235,599 Net Cash Provided By (Used In) Capital and Related Financing Activities 279,928 ( 2,270,055) CASH FLOWS FROM INVESTING ACTIVITIES: Interest received 12,459 12,421 Net Cash Provided By Investing Activities 12,459 12,421 NET INCREASE IN CASH AND CASH EQUIVALENTS 7,943,324 5,487,736 CASH AND CASH EQUIVALENTS, BEGINNING OF YEAR 17,332,141 11,844,405 CASH AND CASH EQUIVALENTS, END OF YEAR $ 25,275,465 $ 17,332,141
The accompanying notes are an integral part of these financial statements.
A n t e l o p e V a l l e y T r a n s i t A u t h o r i t y F i s c a l Y e a r 2 0 1 4 C o m p r e h e n s i v e A n n u a l F i n a n c i a l R e p o r t
P a g e | 35
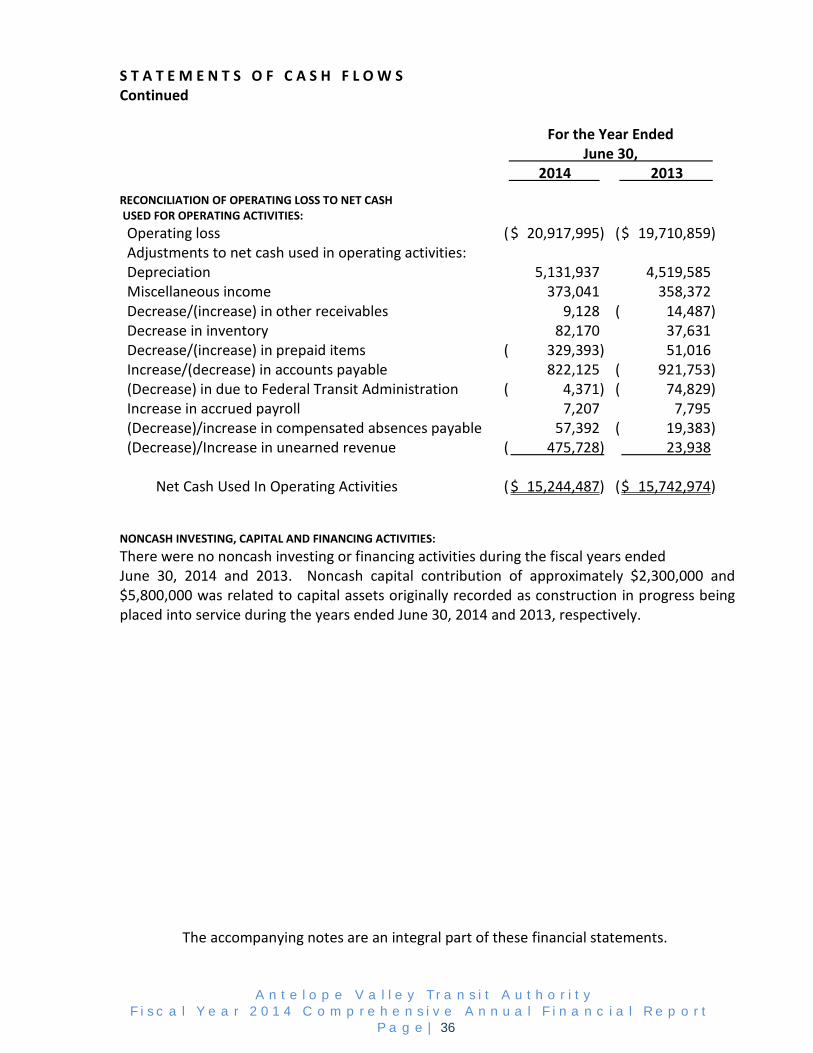
S T A T E M E N T S O F C A S H F L O W S Continued For the Year Ended June 30, 2014 2013
RECONCILIATION OF OPERATING LOSS TO NET CASH USED FOR OPERATING ACTIVITIES: Operating loss ( $ 20,917,995) ( $ 19,710,859) Adjustments to net cash used in operating activities: Depreciation 5,131,937 4,519,585 Miscellaneous income 373,041 358,372 Decrease/(increase) in other receivables 9,128 ( 14,487) Decrease in inventory 82,170 37,631 Decrease/(increase) in prepaid items ( 329,393) 51,016 Increase/(decrease) in accounts payable 822,125 ( 921,753) (Decrease) in due to Federal Transit Administration ( 4,371) ( 74,829) Increase in accrued payroll 7,207 7,795 (Decrease)/increase in compensated absences payable 57,392 ( 19,383) (Decrease)/Increase in unearned revenue ( 475,728) 23,938 Net Cash Used In Operating Activities ( $ 15,244,487) ( $ 15,742,974) NONCASH INVESTING, CAPITAL AND FINANCING ACTIVITIES: There were no noncash investing or financing activities during the fiscal years ended June 30, 2014 and 2013. Noncash capital contribution of approximately $2,300,000 and $5,800,000 was related to capital assets originally recorded as construction in progress being placed into service during the years ended June 30, 2014 and 2013, respectively.
The accompanying notes are an integral part of these financial statements.
A n t e l o p e V a l l e y T r a n s i t A u t h o r i t y F i s c a l Y e a r 2 0 1 4 C o m p r e h e n s i v e A n n u a l F i n a n c i a l R e p o r t
P a g e | 36

N O T E S T O T H E F I N A N C I A L S T A T E M E N T S J U N E 3 0, 2 0 1 4 A N D 2 0 1 3
NOTE 1 – Summary of Significant Accounting Policies The Reporting Entity The Antelope Valley Transit Authority (AVTA) is located in southern California approximately 70 miles northeast of Los Angeles. AVTA was formed to provide and administer public transportation services in the Antelope Valley, including local passenger bus service, a commuter bus service, and a Paratransit service. AVTA is a public entity organized on July 1, 1992 pursuant to Section 6506 of the Government Code of the State of California. AVTA is governed by a Joint Powers Agreement (JPA) whose members consist of the County of Los Angeles (a political subdivision of the State of California), the City of Palmdale, and the City of Lancaster (each a municipal corporation of the State of California). The JPA provides a cost sharing agreement among its members who jointly fund their jurisdictional share of transportation services provided to the Antelope Valley. AVTA operates under a Board of Directors/Manager form of government, with the Board being comprised of two Directors appointed from each participating member’s jurisdiction. AVTA accounts for its financial transactions in accordance with the policies and procedures of the State of California - Uniform System of Accounts for Special Districts. The accounting policies of AVTA conform to accounting principles generally accepted in the United States of America as prescribed by the Government Accounting Standards Board and the American Institute of Certified Public Accountants. AVTA, for financial purposes, includes all operations of AVTA. The Board of Directors has governance responsibilities over all activities related to AVTA. AVTA receives funding from local, county, state and federal government sources and must comply with requirements of these entities.
A n t e l o p e V a l l e y T r a n s i t A u t h o r i t y
F i s c a l Y e a r 2 0 1 4 C o m p r e h e n s i v e A n n u a l F i n a n c i a l R e p o r t P a g e | 37
N O T E S T O T H E F I N A N C I A L S T A T E M E N T S J U N E 3 0, 2 0 1 4 A N D 2 0 1 3
NOTE 1 – Summary of Significant Accounting Policies (Continued) Basis of Accounting AVTA is accounted for as an enterprise fund (proprietary fund type) using the economic resources measurement focus and the accrual basis of accounting. A fund is an accounting entity with a self-balancing set of accounts established to record the financial position and results of operations of a specific governmental activity. The activities of enterprise funds closely resemble those of ongoing businesses in which the purpose is to conserve and add to basic resources while meeting operating expenses from current revenues. Enterprise funds account for operations that provide services on a continuous basis and are substantially financed by revenues derived from user charges. Revenues are recognized when earned and expenses are recognized as they are incurred. During the year ended June 30, 2013, AVTA implemented Statement No. 63 of the Government Accounting Standards Board (GASB), “Financial Reporting of Deferred Outflows of Resources, Deferred Inflows of Resources, and Net Position.” The accompanying financial statements reflect certain changes that have been made with respect to the reporting of the financial statements as a result of implementing GASB No. 63. Statement No. 63 requires public entities to no longer report net assets and to replace with net position. Accordingly, AVTA has reported a Statement of Net Position in lieu of a Statement of Net Assets, with net position being equal to assets, less liabilities, and less deferred inflows of resources. Classification of Revenues and Expenses Enterprise funds distinguish operating revenues and expenses from nonoperating items. Operating revenues and expenses generally result from providing services and producing and delivering goods in connection with an enterprise fund’s principal operations. The principal operating revenues of AVTA consist of transit fees. Nonoperating revenues consist of federal, state and county operating grants, investment income, and jurisdictional member contributions designated for use for operating and capital purposes. Operating expenses include outside transit contracts, which provide transportation and maintenance services, fuel expenses, administrative expenses and depreciation on capital assets. Expenses not meeting this definition are reported as nonoperating expenses. When both restricted and unrestricted resources are available for use, it is AVTA’s policy to use restricted resources first, and then unrestricted resources as they are needed.
A n t e l o p e V a l l e y T r a n s i t A u t h o r i t y
F i s c a l Y e a r 2 0 1 4 C o m p r e h e n s i v e A n n u a l F i n a n c i a l R e p o r t P a g e | 38
N O T E S T O T H E F I N A N C I A L S T A T E M E N T S J U N E 3 0, 2 0 1 4 A N D 2 0 1 3
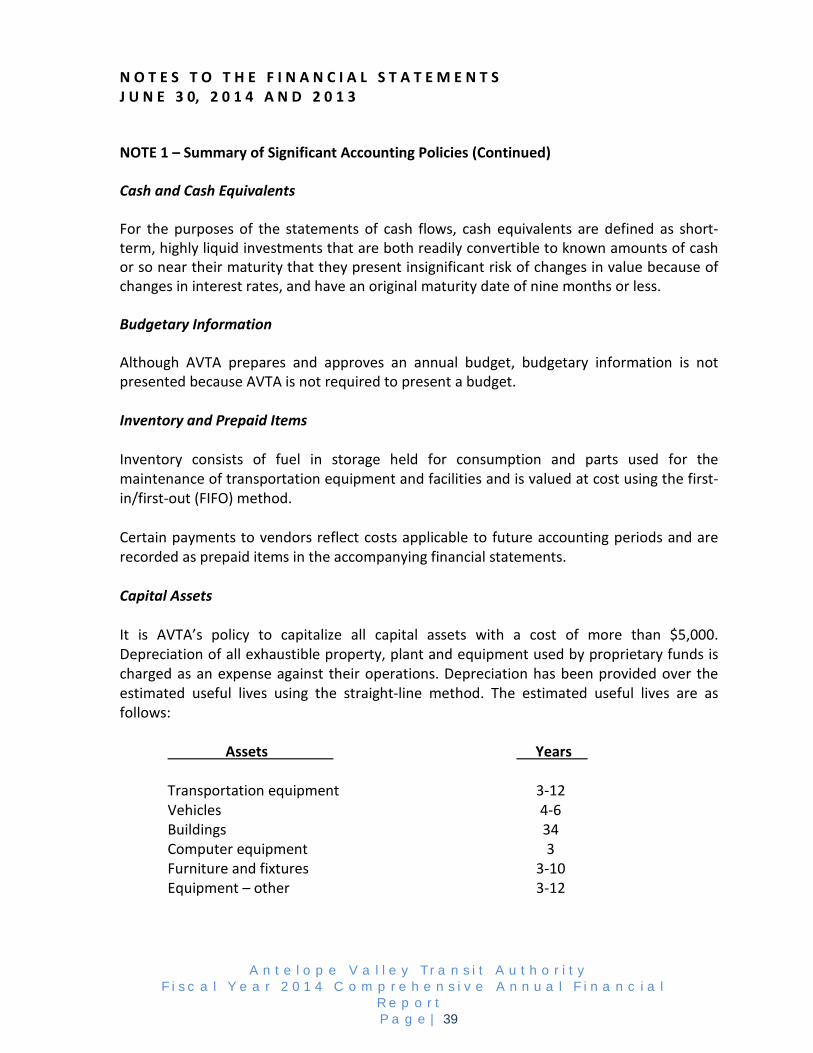
NOTE 1 – Summary of Significant Accounting Policies (Continued) Cash and Cash Equivalents For the purposes of the statements of cash flows, cash equivalents are defined as short-term, highly liquid investments that are both readily convertible to known amounts of cash or so near their maturity that they present insignificant risk of changes in value because of changes in interest rates, and have an original maturity date of nine months or less. Budgetary Information Although AVTA prepares and approves an annual budget, budgetary information is not presented because AVTA is not required to present a budget. Inventory and Prepaid Items Inventory consists of fuel in storage held for consumption and parts used for the maintenance of transportation equipment and facilities and is valued at cost using the first-in/first-out (FIFO) method. Certain payments to vendors reflect costs applicable to future accounting periods and are recorded as prepaid items in the accompanying financial statements. Capital Assets It is AVTA’s policy to capitalize all capital assets with a cost of more than $5,000. Depreciation of all exhaustible property, plant and equipment used by proprietary funds is charged as an expense against their operations. Depreciation has been provided over the estimated useful lives using the straight-line method. The estimated useful lives are as follows: Assets Years Transportation equipment 3-12 Vehicles 4-6 Buildings 34 Computer equipment 3 Furniture and fixtures 3-10 Equipment – other 3-12
A n t e l o p e V a l l e y T r a n s i t A u t h o r i t y
F i s c a l Y e a r 2 0 1 4 C o m p r e h e n s i v e A n n u a l F i n a n c i a l R e p o r t P a g e | 39

N O T E S T O T H E F I N A N C I A L S T A T E M E N T S J U N E 3 0, 2 0 1 4 A N D 2 0 1 3
NOTE 1 – Summary of Significant Accounting Policies (Continued) Federal, State and Local Grants Federal, state and local governments have made various grants available to AVTA for operating assistance and acquisition of capital assets. Grants for operating assistance, or for the acquisition of equipment or other capital outlays, are not formally recognized as revenue until the grant becomes a valid receivable. This occurs as a result of AVTA complying with appropriate grant requirements. Operating assistance grants are included in non-operating revenues in the year in which the grant is applicable. Revenues earned under capital grants are included in capital contributions when the related expenses are incurred. Compensated Absences It is AVTA’s policy to permit employees to accumulate earned but unused vacation and sick pay benefits. Vacation pay is payable to employees at the time a vacation is taken or upon termination of employment. Upon termination, an employee will be paid for any unused vacation. Sick leave is payable when an employee is unable to work because of illness. Upon termination, AVTA employees are not paid for unused sick pay. Accumulated unpaid vacation and vested sick leave pay is recorded as an expense and a liability at the time the benefit is earned. Deferred Inflows of Resources In addition to liabilities, the Statement of Net Position includes a separate section for deferred inflows. This separate financial statement element represents an acquisition of net position that applies to future periods and will not be recognized as revenue until that time. Use of Estimates The preparation of the accompanying basic financial statements in conformity with generally accepted accounting principles in the United States of America (“GAAP”) requires management to make estimates and assumptions that affect the reported amounts of certain assets, liabilities, revenues, and expenditures, as well as to make disclosures of contingent assets and liabilities at the date of the financial statements. Actual results could differ from those estimates. The principal area requiring the use of estimates includes the determination of the useful lives of capital assets.
A n t e l o p e V a l l e y T r a n s i t A u t h o r i t y
F i s c a l Y e a r 2 0 1 4 C o m p r e h e n s i v e A n n u a l F i n a n c i a l R e p o r t P a g e | 40
N O T E S T O T H E F I N A N C I A L S T A T E M E N T S J U N E 3 0, 2 0 1 4 A N D 2 0 1 3
New Accounting Pronouncements The Government Account Standards Board (GASB) issued GASB Statement No. 68, Accounting and Financial Reporting for Pensions; an amendment of GASB Statement No. 27. This statement replaces the requirement of Statement No. 27 and No. 50 related to pensions plans that are administered through trusts or equivalent arrangements. The provisions of this statement are effective for financial statement for fiscal year beginning after June 15, 2014. AVTA is currently evaluating the impact of adopting Statement No. 68 on the financial statements. The Government Account Standards Board (GASB) issued GASB Statement No. 69, Government Combinations and Disposals of Government Operations. This statement establishes accounting and financial reporting standards for mergers, acquisitions, and transfers of operations. The provisions of this statement are effective for financial statement for fiscal year beginning after December 15, 2013. AVTA has reviewed Statement No. 69 and believes it will not have a material impact on the financial statements. The Government Account Standards Board (GASB) issued GASB Statement No. 70, Accounting and Financial Reporting for Non-exchange Financial Guarantees. This statement establishes accounting and financial reporting standards for situations where the entity acts as a guarantor and agrees to indemnify a third party obligation under specified conditions (i.e. non-exchange financial statements). The provisions of this statement are effective for financial statement for fiscal year beginning after June 15, 2013. AVTA has reviewed Statement No. 70 and believes it will not have a material impact on the financial statements. The Government Account Standards Board (GASB) issued GASB Statement No. 71, Pension Transition for Contributions Made Subsequent to the Measurement Date – An Amendment of GASB 68. This statement address an issue regarding the application of the transition provisions associated with contributions, if any, made to a defined benefit pension plan after the measurement date of the beginning net pension liability. The provisions of this statement are required to be applied simultaneously with the provisions of Statement No. 68. AVTA is currently evaluating the impact of adopting Statement No. 71 on the financial statements.
A n t e l o p e V a l l e y T r a n s i t A u t h o r i t y
F i s c a l Y e a r 2 0 1 4 C o m p r e h e n s i v e A n n u a l F i n a n c i a l R e p o r t P a g e | 41

N O T E S T O T H E F I N A N C I A L S T A T E M E N T S J U N E 3 0, 2 0 1 4 A N D 2 0 1 3
NOTE 2 – Cash and Cash Equivalents Cash and cash equivalents consisted of the following: June 30, 2014 2013 Cash on hand $ 750 $ 750 Deposits with financial institutions 20,323,661 13,742,914 Local Agency Investment Fund (LAIF) 4,951,054 3,588,477 Total cash and cash equivalents $ 25,275,465 $ 17,332,141 The table below identifies the investment types that are authorized for AVTA by the California Government Code (or AVTA’s investment policy, whichever is more restrictive). The table also identifies certain provisions of the California Government Code (or AVTA’s investment policy, whichever is more restrictive) that address interest rate risk, credit risk, and concentration of credit risk. Authorized By Maximum Maximum Authorized Investment Maximum Percentage Investment in Investment Type Policy Maturity of Portfolio* One Issuer* Local Agency Bonds No N/A N/A N/A U.S. Treasury Obligations Yes 1 year 50% None U.S. Agency Securities No N/A N/A N/A Banker’s Acceptances Yes 180 days 15% 30% Commercial Paper Yes 180 days 10% 10% Negotiable Certificates of Deposit Yes 1 year 25-50% None Repurchase Agreements Yes 1 year None None Reverse Repurchase Agreements No N/A N/A N/A Medium-Term Notes No N/A N/A N/A Mutual Funds No N/A N/A N/A Money Market Mutual Funds Yes N/A 15% 10% Mortgage Pass-through Securities No N/A N/A N/A County Pooled Investment Funds No N/A N/A N/A Local Agency Investment Fund (LAIF) Yes N/A None None * Based on State law requirements or investment policy requirements, whichever is more restrictive.
A n t e l o p e V a l l e y T r a n s i t A u t h o r i t y
F i s c a l Y e a r 2 0 1 4 C o m p r e h e n s i v e A n n u a l F i n a n c i a l R e p o r t P a g e | 42
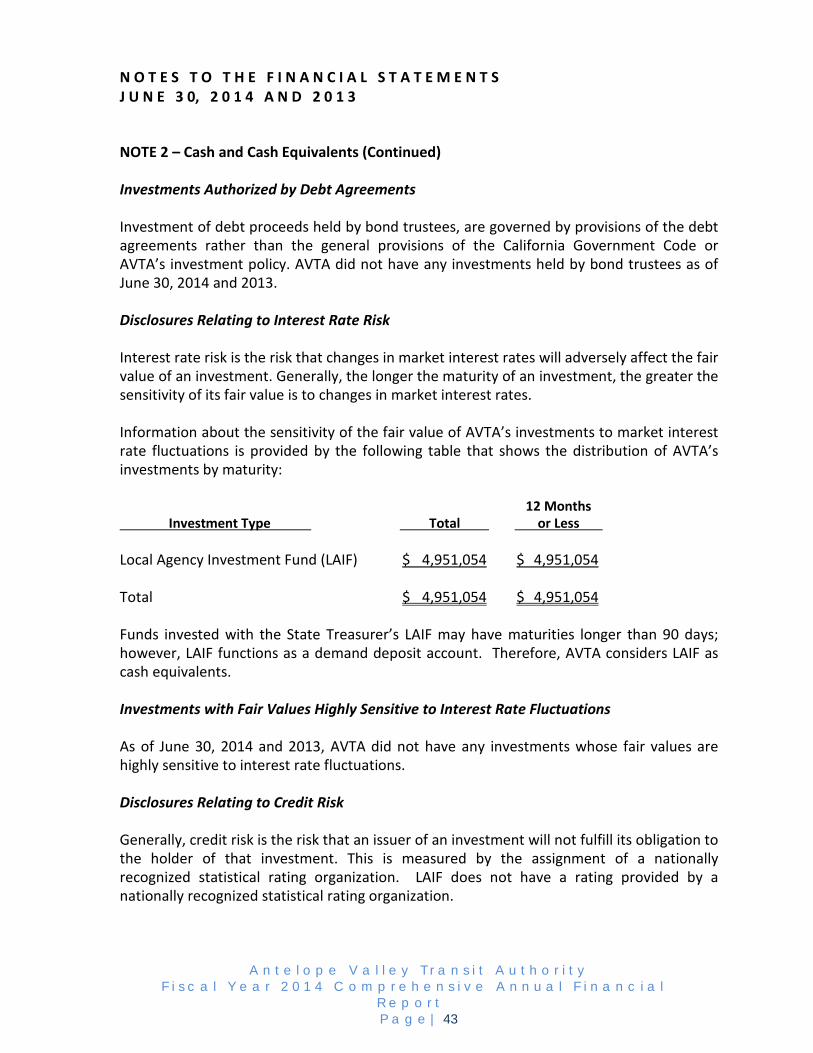
N O T E S T O T H E F I N A N C I A L S T A T E M E N T S J U N E 3 0, 2 0 1 4 A N D 2 0 1 3
NOTE 2 – Cash and Cash Equivalents (Continued) Investments Authorized by Debt Agreements Investment of debt proceeds held by bond trustees, are governed by provisions of the debt agreements rather than the general provisions of the California Government Code or AVTA’s investment policy. AVTA did not have any investments held by bond trustees as of June 30, 2014 and 2013. Disclosures Relating to Interest Rate Risk Interest rate risk is the risk that changes in market interest rates will adversely affect the fair value of an investment. Generally, the longer the maturity of an investment, the greater the sensitivity of its fair value is to changes in market interest rates. Information about the sensitivity of the fair value of AVTA’s investments to market interest rate fluctuations is provided by the following table that shows the distribution of AVTA’s investments by maturity: 12 Months Investment Type Total or Less Local Agency Investment Fund (LAIF) $ 4,951,054 $ 4,951,054 Total $ 4,951,054 $ 4,951,054 Funds invested with the State Treasurer’s LAIF may have maturities longer than 90 days; however, LAIF functions as a demand deposit account. Therefore, AVTA considers LAIF as cash equivalents. Investments with Fair Values Highly Sensitive to Interest Rate Fluctuations As of June 30, 2014 and 2013, AVTA did not have any investments whose fair values are highly sensitive to interest rate fluctuations. Disclosures Relating to Credit Risk Generally, credit risk is the risk that an issuer of an investment will not fulfill its obligation to the holder of that investment. This is measured by the assignment of a nationally recognized statistical rating organization. LAIF does not have a rating provided by a nationally recognized statistical rating organization.
A n t e l o p e V a l l e y T r a n s i t A u t h o r i t y
F i s c a l Y e a r 2 0 1 4 C o m p r e h e n s i v e A n n u a l F i n a n c i a l R e p o r t P a g e | 43

N O T E S T O T H E F I N A N C I A L S T A T E M E N T S J U N E 3 0, 2 0 1 4 A N D 2 0 1 3
NOTE 2 – Cash and Cash Equivalents (Continued) Concentration of Credit Risk Concentration of credit risk is the risk of loss attributed to the magnitude to AVTA’s investment in a single issue or instrument. AVTA’s investment policy contains no limitations on the amount that can be invested in any one issuer beyond that stipulated by the California Government Code. As of June 30, 2014 and 2013, except for its investment in LAIF, AVTA did not have any investments in any one issuer that represented 5% or more of its total investment portfolio. Custodial Credit Risk Custodial credit risk for deposits is the risk that, in the event of the failure of a depository financial institution, a government will not be able to recover its deposits or will not be able to recover collateral securities that are in the possession of an outside party. Custodial credit risk for investments is the risk that, in the event of the failure of the counterparty (e.g., broker-dealer) to a transaction, a government will not be able to recover the value of its investment or collateral securities that are in the possession of another party. The California Government Code and AVTA’s investment policy do not contain legal or policy requirements that would limit the exposure to custodial credit risk for deposits or investment, other than for the following provision for deposits: The California Government Code requires that a financial institution secure deposits made by state or local governmental units by pledging securities in an undivided collateral pool held by a depository regulated under state law (unless so waived by the governmental unit). The market value of the pledged securities in the collateral pool must equal at least 110% of the total amount deposited by the local government unit. California law also allows financial institutions to secure deposits by pledging first trust deed mortgage notes having a value of 150% of the secured public deposits.
A n t e l o p e V a l l e y T r a n s i t A u t h o r i t y
F i s c a l Y e a r 2 0 1 4 C o m p r e h e n s i v e A n n u a l F i n a n c i a l R e p o r t P a g e | 44
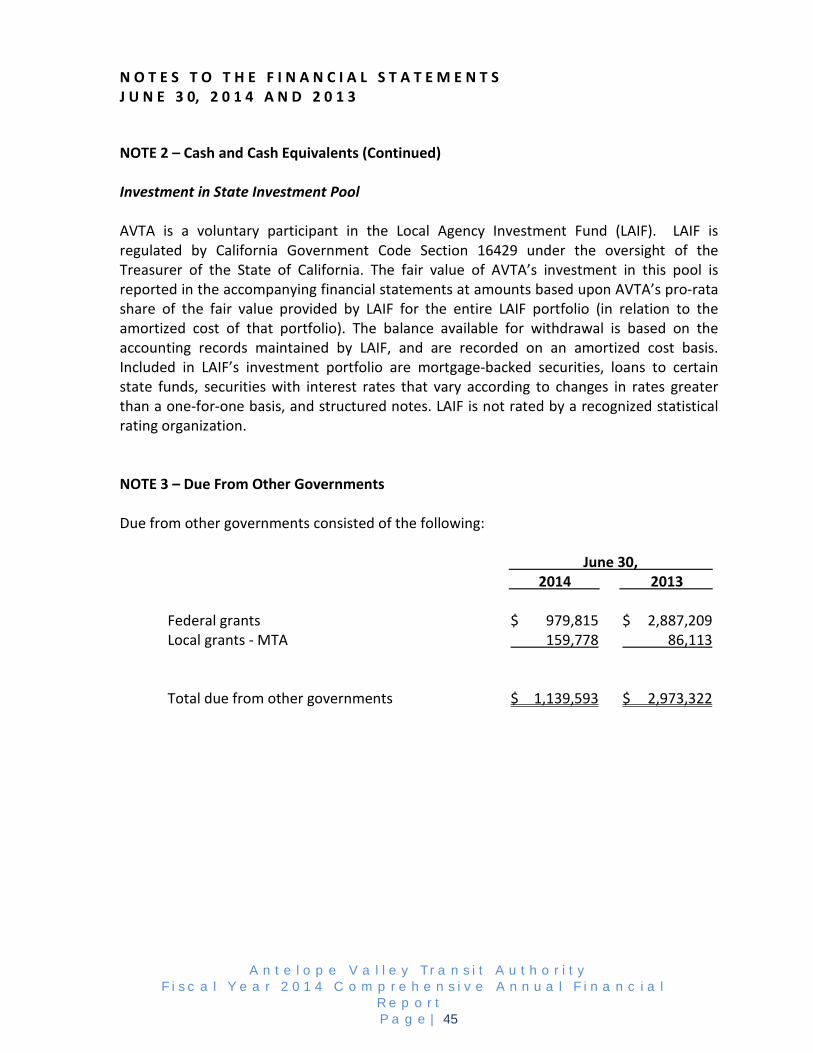
N O T E S T O T H E F I N A N C I A L S T A T E M E N T S J U N E 3 0, 2 0 1 4 A N D 2 0 1 3
NOTE 2 – Cash and Cash Equivalents (Continued) Investment in State Investment Pool AVTA is a voluntary participant in the Local Agency Investment Fund (LAIF). LAIF is regulated by California Government Code Section 16429 under the oversight of the Treasurer of the State of California. The fair value of AVTA’s investment in this pool is reported in the accompanying financial statements at amounts based upon AVTA’s pro-rata share of the fair value provided by LAIF for the entire LAIF portfolio (in relation to the amortized cost of that portfolio). The balance available for withdrawal is based on the accounting records maintained by LAIF, and are recorded on an amortized cost basis. Included in LAIF’s investment portfolio are mortgage-backed securities, loans to certain state funds, securities with interest rates that vary according to changes in rates greater than a one-for-one basis, and structured notes. LAIF is not rated by a recognized statistical rating organization. NOTE 3 – Due From Other Governments Due from other governments consisted of the following: June 30, 2014 2013 Federal grants $ 979,815 $ 2,887,209 Local grants - MTA 159,778 86,113 Total due from other governments $ 1,139,593 $ 2,973,322
A n t e l o p e V a l l e y T r a n s i t A u t h o r i t y
F i s c a l Y e a r 2 0 1 4 C o m p r e h e n s i v e A n n u a l F i n a n c i a l R e p o r t P a g e | 45
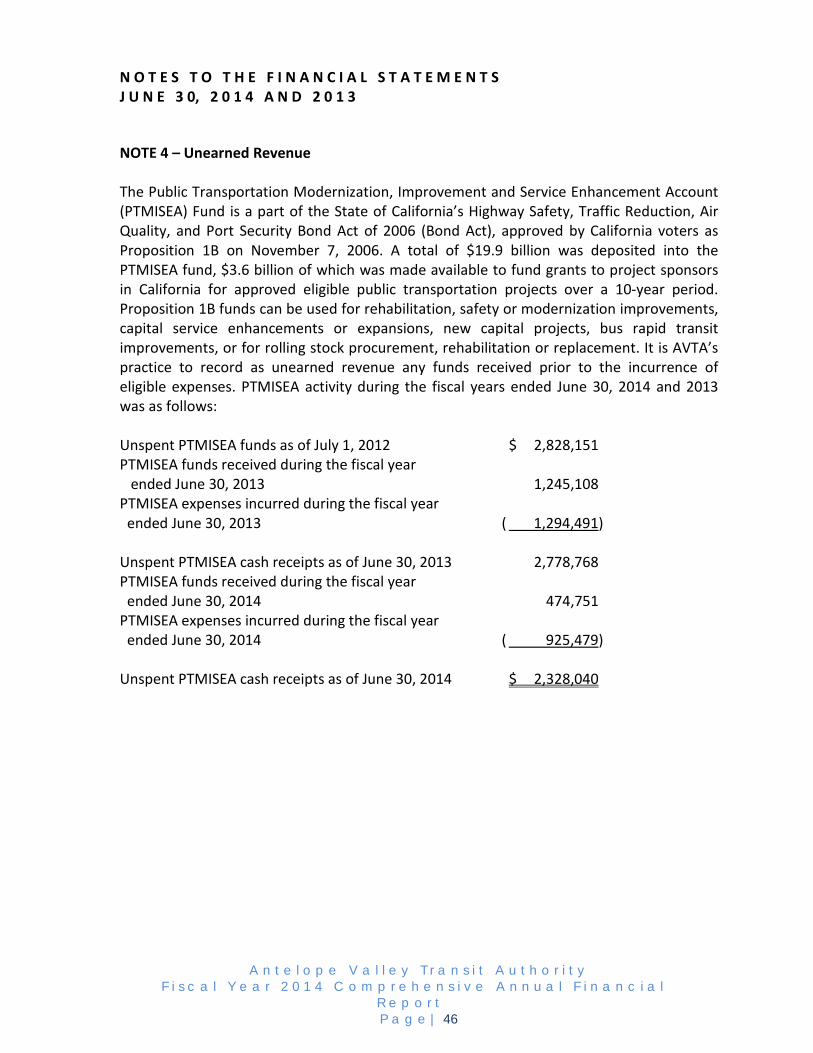
N O T E S T O T H E F I N A N C I A L S T A T E M E N T S J U N E 3 0, 2 0 1 4 A N D 2 0 1 3
NOTE 4 – Unearned Revenue The Public Transportation Modernization, Improvement and Service Enhancement Account (PTMISEA) Fund is a part of the State of California’s Highway Safety, Traffic Reduction, Air Quality, and Port Security Bond Act of 2006 (Bond Act), approved by California voters as Proposition 1B on November 7, 2006. A total of $19.9 billion was deposited into the PTMISEA fund, $3.6 billion of which was made available to fund grants to project sponsors in California for approved eligible public transportation projects over a 10-year period. Proposition 1B funds can be used for rehabilitation, safety or modernization improvements, capital service enhancements or expansions, new capital projects, bus rapid transit improvements, or for rolling stock procurement, rehabilitation or replacement. It is AVTA’s practice to record as unearned revenue any funds received prior to the incurrence of eligible expenses. PTMISEA activity during the fiscal years ended June 30, 2014 and 2013 was as follows: Unspent PTMISEA funds as of July 1, 2012 $ 2,828,151 PTMISEA funds received during the fiscal year ended June 30, 2013 1,245,108 PTMISEA expenses incurred during the fiscal year ended June 30, 2013 ( 1,294,491) Unspent PTMISEA cash receipts as of June 30, 2013 2,778,768 PTMISEA funds received during the fiscal year ended June 30, 2014 474,751 PTMISEA expenses incurred during the fiscal year ended June 30, 2014 ( 925,479) Unspent PTMISEA cash receipts as of June 30, 2014 $ 2,328,040
A n t e l o p e V a l l e y T r a n s i t A u t h o r i t y
F i s c a l Y e a r 2 0 1 4 C o m p r e h e n s i v e A n n u a l F i n a n c i a l R e p o r t P a g e | 46
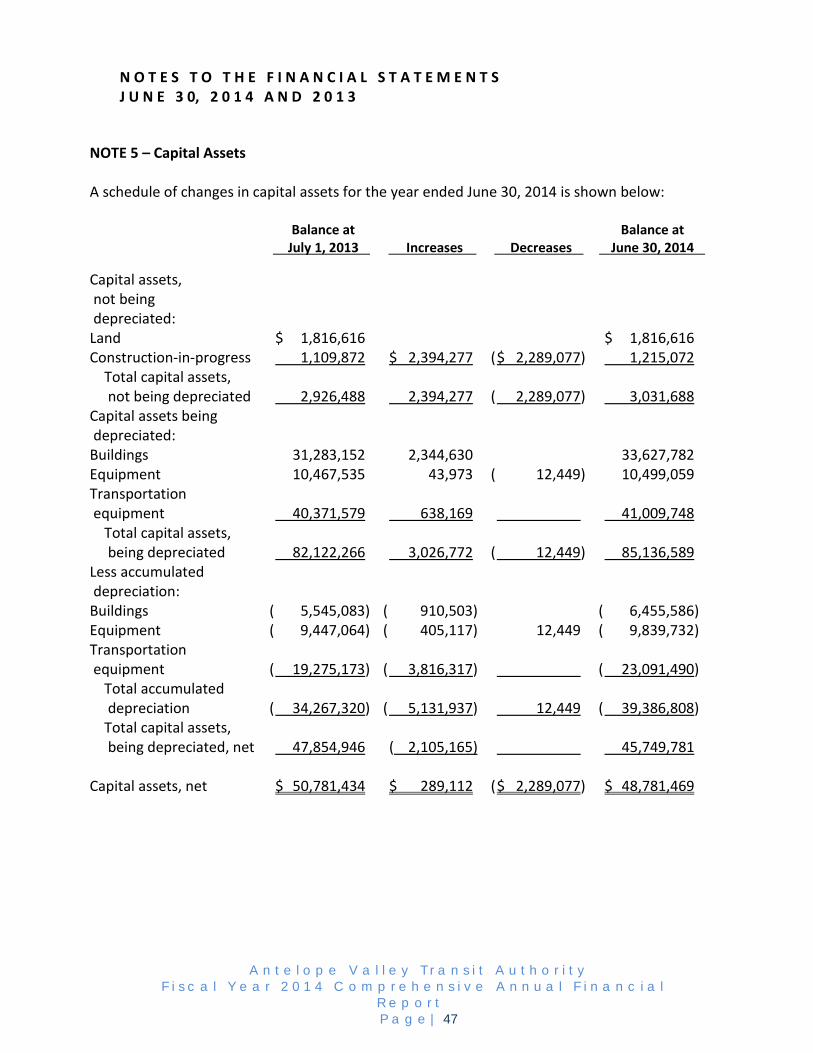
N O T E S T O T H E F I N A N C I A L S T A T E M E N T S J U N E 3 0, 2 0 1 4 A N D 2 0 1 3
NOTE 5 – Capital Assets A schedule of changes in capital assets for the year ended June 30, 2014 is shown below: Balance at Balance at July 1, 2013 Increases Decreases June 30, 2014
Capital assets, not being depreciated: Land $ 1,816,616 $ 1,816,616 Construction-in-progress 1,109,872 $ 2,394,277 ( $ 2,289,077) 1,215,072 Total capital assets, not being depreciated 2,926,488 2,394,277 ( 2,289,077) 3,031,688 Capital assets being depreciated: Buildings 31,283,152 2,344,630 33,627,782 Equipment 10,467,535 43,973 ( 12,449) 10,499,059 Transportation equipment 40,371,579 638,169 41,009,748 Total capital assets, being depreciated 82,122,266 3,026,772 ( 12,449) 85,136,589 Less accumulated depreciation: Buildings ( 5,545,083) ( 910,503) ( 6,455,586) Equipment ( 9,447,064) ( 405,117) 12,449 ( 9,839,732) Transportation equipment ( 19,275,173) ( 3,816,317) ( 23,091,490) Total accumulated depreciation ( 34,267,320) ( 5,131,937) 12,449 ( 39,386,808) Total capital assets, being depreciated, net 47,854,946 ( 2,105,165) 45,749,781 Capital assets, net $ 50,781,434 $ 289,112 ( $ 2,289,077) $ 48,781,469
A n t e l o p e V a l l e y T r a n s i t A u t h o r i t y
F i s c a l Y e a r 2 0 1 4 C o m p r e h e n s i v e A n n u a l F i n a n c i a l R e p o r t P a g e | 47
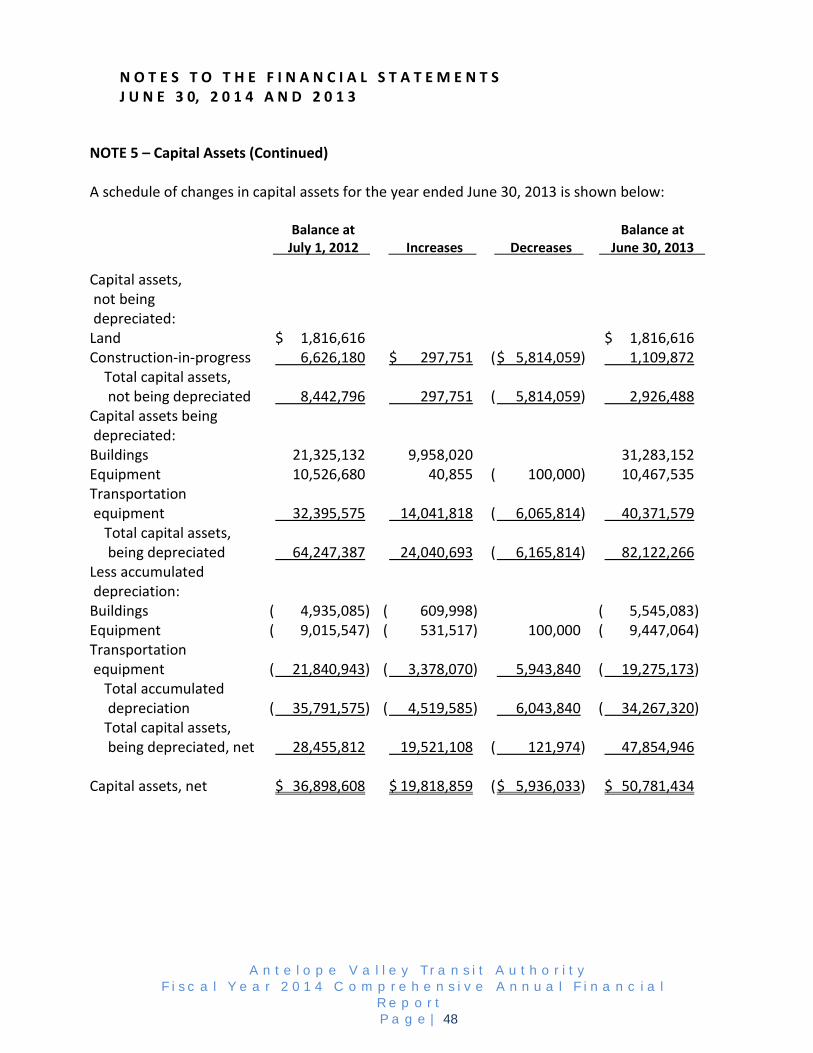
N O T E S T O T H E F I N A N C I A L S T A T E M E N T S J U N E 3 0, 2 0 1 4 A N D 2 0 1 3
NOTE 5 – Capital Assets (Continued) A schedule of changes in capital assets for the year ended June 30, 2013 is shown below: Balance at Balance at July 1, 2012 Increases Decreases June 30, 2013
Capital assets, not being depreciated: Land $ 1,816,616 $ 1,816,616 Construction-in-progress 6,626,180 $ 297,751 ( $ 5,814,059) 1,109,872 Total capital assets, not being depreciated 8,442,796 297,751 ( 5,814,059) 2,926,488 Capital assets being depreciated: Buildings 21,325,132 9,958,020 31,283,152 Equipment 10,526,680 40,855 ( 100,000) 10,467,535 Transportation equipment 32,395,575 14,041,818 ( 6,065,814) 40,371,579 Total capital assets, being depreciated 64,247,387 24,040,693 ( 6,165,814) 82,122,266 Less accumulated depreciation: Buildings ( 4,935,085) ( 609,998) ( 5,545,083) Equipment ( 9,015,547) ( 531,517) 100,000 ( 9,447,064) Transportation equipment ( 21,840,943) ( 3,378,070) 5,943,840 ( 19,275,173) Total accumulated depreciation ( 35,791,575) ( 4,519,585) 6,043,840 ( 34,267,320) Total capital assets, being depreciated, net 28,455,812 19,521,108 ( 121,974) 47,854,946 Capital assets, net $ 36,898,608 $ 19,818,859 ( $ 5,936,033) $ 50,781,434
A n t e l o p e V a l l e y T r a n s i t A u t h o r i t y
F i s c a l Y e a r 2 0 1 4 C o m p r e h e n s i v e A n n u a l F i n a n c i a l R e p o r t P a g e | 48
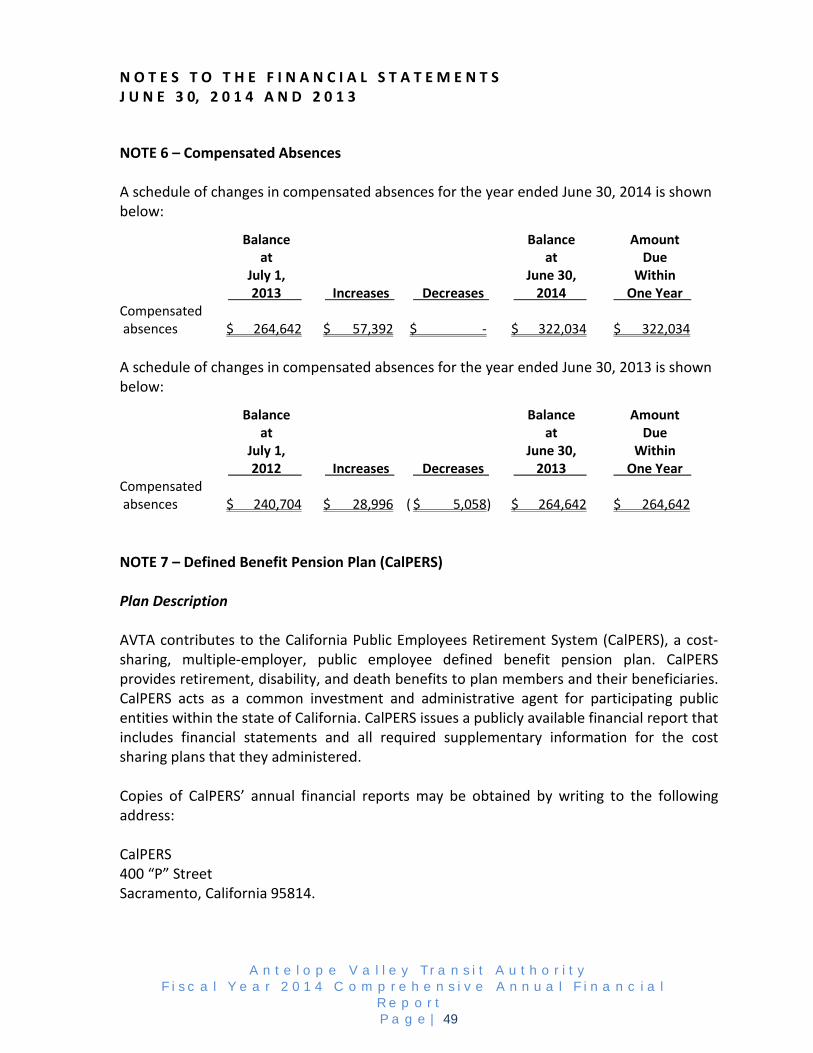
N O T E S T O T H E F I N A N C I A L S T A T E M E N T S J U N E 3 0, 2 0 1 4 A N D 2 0 1 3
NOTE 6 – Compensated Absences A schedule of changes in compensated absences for the year ended June 30, 2014 is shown below:
Balance Balance Amount at at Due July 1, June 30, Within 2013 Increases Decreases 2014 One Year Compensated absences $ 264,642 $ 57,392 $ - $ 322,034 $ 322,034 A schedule of changes in compensated absences for the year ended June 30, 2013 is shown below:
Balance Balance Amount at at Due July 1, June 30, Within 2012 Increases Decreases 2013 One Year Compensated absences $ 240,704 $ 28,996 ( $ 5,058) $ 264,642 $ 264,642 NOTE 7 – Defined Benefit Pension Plan (CalPERS) Plan Description AVTA contributes to the California Public Employees Retirement System (CalPERS), a cost-sharing, multiple-employer, public employee defined benefit pension plan. CalPERS provides retirement, disability, and death benefits to plan members and their beneficiaries. CalPERS acts as a common investment and administrative agent for participating public entities within the state of California. CalPERS issues a publicly available financial report that includes financial statements and all required supplementary information for the cost sharing plans that they administered. Copies of CalPERS’ annual financial reports may be obtained by writing to the following address: CalPERS 400 “P” Street Sacramento, California 95814.
A n t e l o p e V a l l e y T r a n s i t A u t h o r i t y
F i s c a l Y e a r 2 0 1 4 C o m p r e h e n s i v e A n n u a l F i n a n c i a l R e p o r t P a g e | 49

N O T E S T O T H E F I N A N C I A L S T A T E M E N T S J U N E 3 0, 2 0 1 4 A N D 2 0 1 3
NOTE 7 – Defined Benefit Pension Plan (CalPERS) (Continued) Contributions and Funding Policy AVTA contributes 7% of participants’ annual covered salary. AVTA is required to contribute at an actuarially determined rate. The rate for the year ended June 30, 2014 is 10.282% of annual covered payroll. The contribution requirements of plan members and AVTA are established and may be amended by the Board of Directors. AVTA’s contributions to the plan for the years ending June 30, 2012, 2013, and 2014 were $337,481, $354,549, and $393,069 respectively, and were equal to the required contributions for each year. NOTE 8 – Risk Management AVTA is exposed to various risks of loss related to torts; theft of, damage to, or destruction of assets; errors or omissions; and natural disasters. AVTA protects itself against such losses by a balanced program of risk retention, risk transfers and the purchase of commercial insurance. Loss exposures retained by AVTA are treated as normal expenditures and include any loss contingency not covered by AVTA’s purchased insurance policies. Liabilities are reported when it is probable that a loss has occurred and the amount of the loss can be reasonably estimated. Liabilities include an amount for claims that have been incurred but not reported (IBNR). The result of the process to estimate the claims liability is not an exact amount as it depends on many complex factors, such as inflation, changes in legal doctrines and damage awards. Accordingly, claims are reevaluated periodically to consider the effects of inflation, recent claim settlement trends (including frequency and amount of pay-outs) and other economic and social factors. The estimate of the claims liability also includes amounts for incremental claim adjustment expenses related to specific claims and other claim adjustment expenses regardless of whether allocated to specific claims. Estimated recoveries, for example from salvage or subrogation, are another component of the claims liability estimate. AVTA maintains workers’ compensation insurance policies covering claims up to $5,000,000. An excess coverage insurance policy covers individual claims in excess of $5,000,000. AVTA does not have any liabilities for unpaid claims as of June 30, 2014. Settled claims have not exceeded insurance coverage limits during the fiscal years ended June 30, 2014 and 2013.
A n t e l o p e V a l l e y T r a n s i t A u t h o r i t y
F i s c a l Y e a r 2 0 1 4 C o m p r e h e n s i v e A n n u a l F i n a n c i a l R e p o r t P a g e | 50
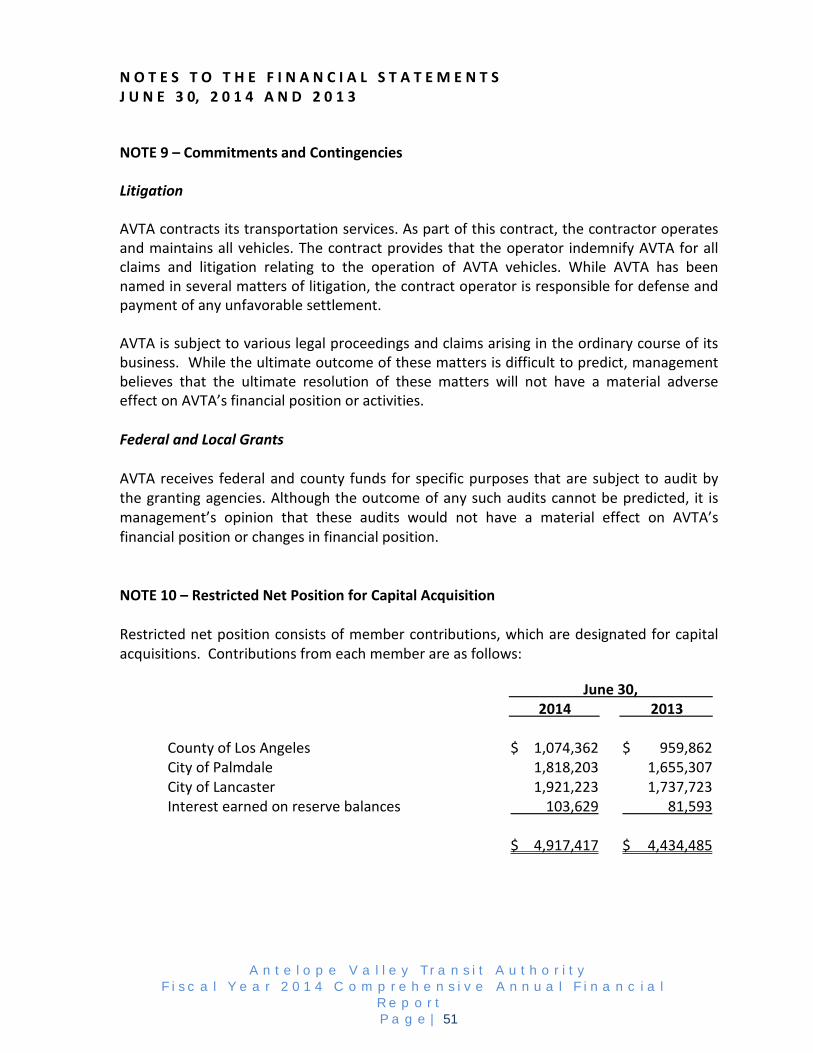
N O T E S T O T H E F I N A N C I A L S T A T E M E N T S J U N E 3 0, 2 0 1 4 A N D 2 0 1 3
NOTE 9 – Commitments and Contingencies Litigation AVTA contracts its transportation services. As part of this contract, the contractor operates and maintains all vehicles. The contract provides that the operator indemnify AVTA for all claims and litigation relating to the operation of AVTA vehicles. While AVTA has been named in several matters of litigation, the contract operator is responsible for defense and payment of any unfavorable settlement. AVTA is subject to various legal proceedings and claims arising in the ordinary course of its business. While the ultimate outcome of these matters is difficult to predict, management believes that the ultimate resolution of these matters will not have a material adverse effect on AVTA’s financial position or activities. Federal and Local Grants AVTA receives federal and county funds for specific purposes that are subject to audit by the granting agencies. Although the outcome of any such audits cannot be predicted, it is management’s opinion that these audits would not have a material effect on AVTA’s financial position or changes in financial position. NOTE 10 – Restricted Net Position for Capital Acquisition Restricted net position consists of member contributions, which are designated for capital acquisitions. Contributions from each member are as follows: June 30, 2014 2013 County of Los Angeles $ 1,074,362 $ 959,862 City of Palmdale 1,818,203 1,655,307 City of Lancaster 1,921,223 1,737,723 Interest earned on reserve balances 103,629 81,593 $ 4,917,417 $ 4,434,485
A n t e l o p e V a l l e y T r a n s i t A u t h o r i t y
F i s c a l Y e a r 2 0 1 4 C o m p r e h e n s i v e A n n u a l F i n a n c i a l R e p o r t P a g e | 51

N O T E S T O T H E F I N A N C I A L S T A T E M E N T S J U N E 3 0, 2 0 1 4 A N D 2 0 1 3
This page left intentionally blank.
A n t e l o p e V a l l e y T r a n s i t A u t h o r i t y
F i s c a l Y e a r 2 0 1 4 C o m p r e h e n s i v e A n n u a l F i n a n c i a l R e p o r t P a g e | 52

STATISTICAL SECTION

S T A T I S T I C A L S E C T I O N The section of the Antelope Valley Transit Authority’s Comprehensive Annual Financial Report presents detailed information as a context for understanding what the information in the financial statements, note disclosures, and required supplementary information about AVTA’s overall financial health. This information has not been audited by the independent auditors.
F INANCIAL TREND S 54
These schedules contain trend information to help the reader understand how AVTA’s financial performance and well-being has changed over time.
REVENUE CAPACITY 56
These schedules contain information to help the reader assess AVTA’s most significant local revenue source, passenger fares.
DEMOGRAPHIC AND ECONOMIC INF ORMATION 57
These schedules offer demographic and economic indicators to help the reader understand the environment where AVTA’s financial activities occur.
OPERATING INFORMATION 59
These schedules contain service and infrastructure data to help the reader understand how the information in AVTA’s financial report relates to the services that AVTA provides and the activities it performs. Sources: Unless otherwise noted, the information in these schedules is derived from the Audited Financial Statements and Comprehensive Annual Financial Reports for the relevant years.
A n t e l o p e V a l l e y T r a n s i t A u t h o r i t y
F i s c a l Y e a r 2 0 1 4 C o m p r e h e n s i v e A n n u a l F i n a n c i a l R e p o r t P a g e | 53
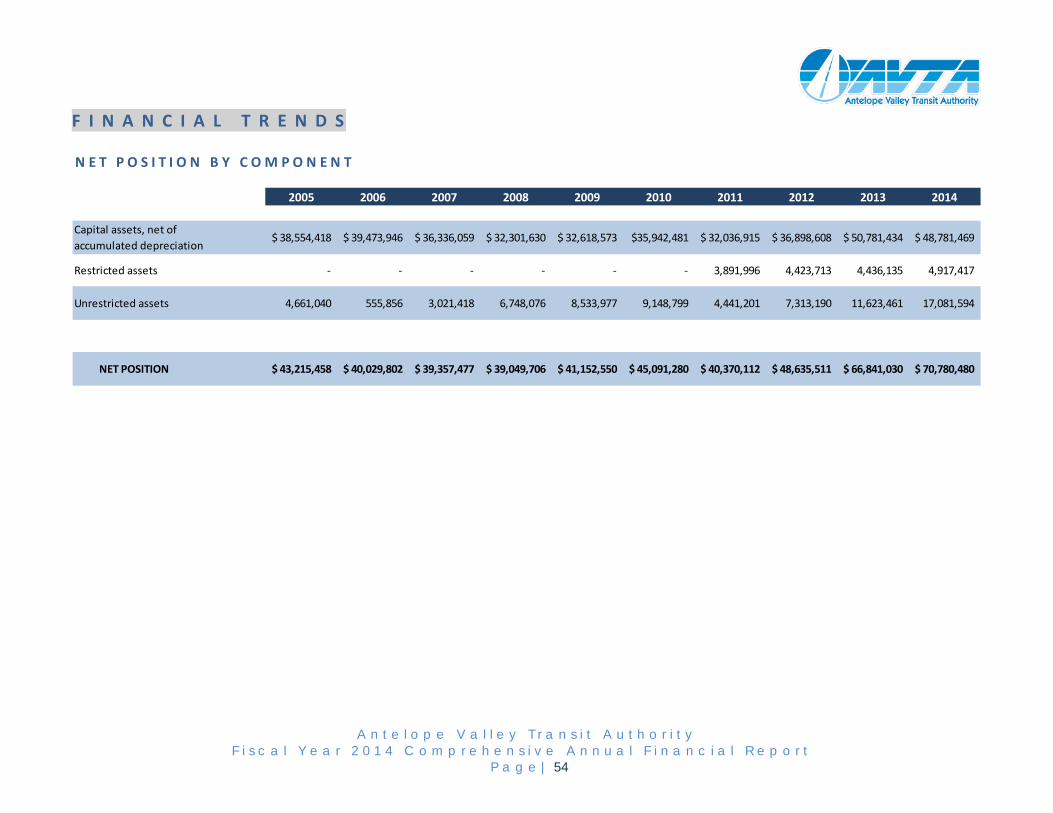
F I N A N C I A L T R E N D S
N E T P O S I T I O N B Y C O M P O N E N T
2005 2006 2007 2008 2009 2010 2011 2012 2013 2014
38,554,418$ 39,473,946$ 36,336,059$ 32,301,630$ 32,618,573$ $35,942,481 32,036,915$ 36,898,608$ 50,781,434$ 48,781,469$
Restricted assets - - - - - - 3,891,996 4,423,713 4,436,135 4,917,417
Unrestricted assets 4,661,040 555,856 3,021,418 6,748,076 8,533,977 9,148,799 4,441,201 7,313,190 11,623,461 17,081,594
NET POSITION 43,215,458$ 40,029,802$ 39,357,477$ 39,049,706$ 41,152,550$ 45,091,280$ 40,370,112$ 48,635,511$ 66,841,030$ 70,780,480$
Capital assets, net of accumulated depreciation
A n t e l o p e V a l l e y T r a n s i t A u t h o r i t y
F i s c a l Y e a r 2 0 1 4 C o m p r e h e n s i v e A n n u a l F i n a n c i a l R e p o r t P a g e | 54
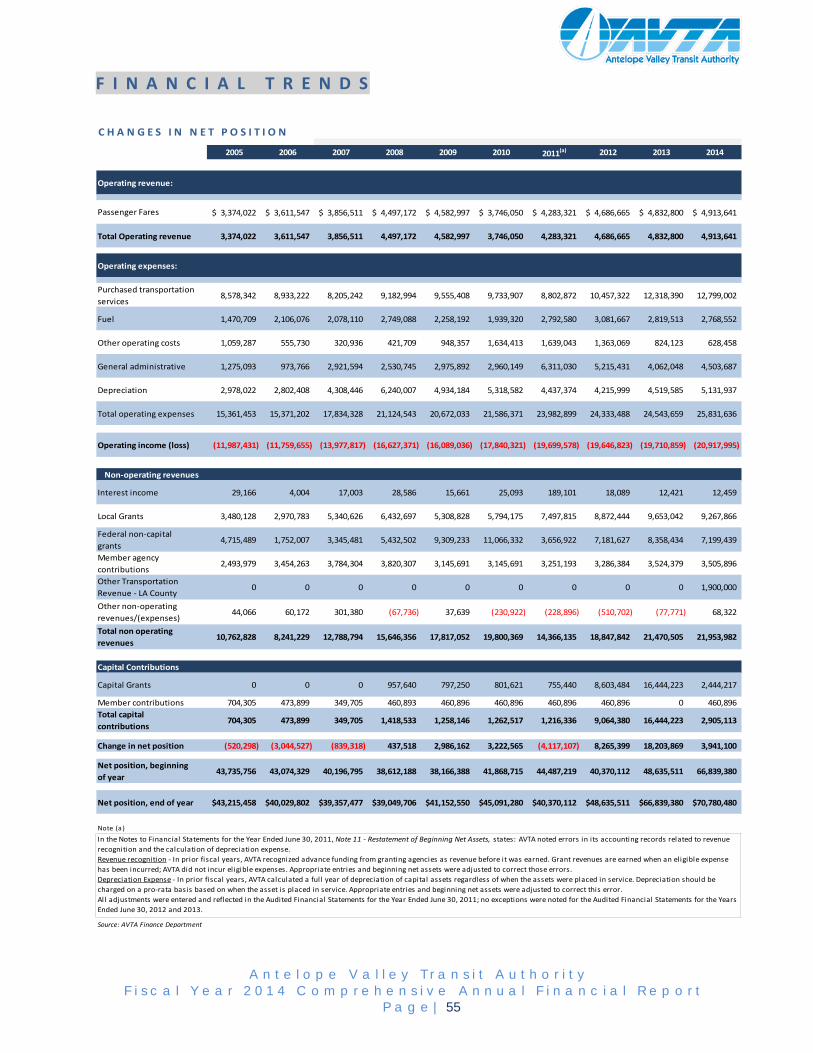
F I N A N C I A L T R E N D S
C H A N G E S I N N E T P O S I T I O N
2005 2006 2007 2008 2009 2010 2011(a) 2012 2013 2014
Operating revenue:
3,374,022$ 3,611,547$ 3,856,511$ 4,497,172$ 4,582,997$ 3,746,050$ 4,283,321$ 4,686,665$ 4,832,800$ 4,913,641$
Total Operating revenue 3,374,022 3,611,547 3,856,511 4,497,172 4,582,997 3,746,050 4,283,321 4,686,665 4,832,800 4,913,641
Operating expenses:
Purchased transportation services
8,578,342 8,933,222 8,205,242 9,182,994 9,555,408 9,733,907 8,802,872 10,457,322 12,318,390 12,799,002
Fuel 1,470,709 2,106,076 2,078,110 2,749,088 2,258,192 1,939,320 2,792,580 3,081,667 2,819,513 2,768,552
Other operating costs 1,059,287 555,730 320,936 421,709 948,357 1,634,413 1,639,043 1,363,069 824,123 628,458
General administrative 1,275,093 973,766 2,921,594 2,530,745 2,975,892 2,960,149 6,311,030 5,215,431 4,062,048 4,503,687
Depreciation 2,978,022 2,802,408 4,308,446 6,240,007 4,934,184 5,318,582 4,437,374 4,215,999 4,519,585 5,131,937
Total operating expenses 15,361,453 15,371,202 17,834,328 21,124,543 20,672,033 21,586,371 23,982,899 24,333,488 24,543,659 25,831,636
Operating income (loss) (11,987,431) (11,759,655) (13,977,817) (16,627,371) (16,089,036) (17,840,321) (19,699,578) (19,646,823) (19,710,859) (20,917,995)
Interest income 29,166 4,004 17,003 28,586 15,661 25,093 189,101 18,089 12,421 12,459
Local Grants 3,480,128 2,970,783 5,340,626 6,432,697 5,308,828 5,794,175 7,497,815 8,872,444 9,653,042 9,267,866
Federal non-capital grants
4,715,489 1,752,007 3,345,481 5,432,502 9,309,233 11,066,332 3,656,922 7,181,627 8,358,434 7,199,439
Member agency contributions
2,493,979 3,454,263 3,784,304 3,820,307 3,145,691 3,145,691 3,251,193 3,286,384 3,524,379 3,505,896
Other Transportation Revenue - LA County
0 0 0 0 0 0 0 0 0 1,900,000
Other non-operating revenues/(expenses)
44,066 60,172 301,380 (67,736) 37,639 (230,922) (228,896) (510,702) (77,771) 68,322
Total non operating revenues
10,762,828 8,241,229 12,788,794 15,646,356 17,817,052 19,800,369 14,366,135 18,847,842 21,470,505 21,953,982
Capital Contributions
Capital Grants 0 0 0 957,640 797,250 801,621 755,440 8,603,484 16,444,223 2,444,217
Member contributions 704,305 473,899 349,705 460,893 460,896 460,896 460,896 460,896 0 460,896Total capital contributions
704,305 473,899 349,705 1,418,533 1,258,146 1,262,517 1,216,336 9,064,380 16,444,223 2,905,113
Change in net position (520,298) (3,044,527) (839,318) 437,518 2,986,162 3,222,565 (4,117,107) 8,265,399 18,203,869 3,941,100
Net position, beginning of year
43,735,756 43,074,329 40,196,795 38,612,188 38,166,388 41,868,715 44,487,219 40,370,112 48,635,511 66,839,380
Net position, end of year $43,215,458 $40,029,802 $39,357,477 $39,049,706 $41,152,550 $45,091,280 $40,370,112 $48,635,511 $66,839,380 $70,780,480
Note (a)
Source: AVTA Finance Department
Passenger Fares
Non-operating revenues
In the Notes to Financial Statements for the Year Ended June 30, 2011, Note 11 - Restatement of Beginning Net Assets, states: AVTA noted errors in its accounting records related to revenue recognition and the calculation of depreciation expense. Revenue recognition - In prior fiscal years, AVTA recognized advance funding from granting agencies as revenue before it was earned. Grant revenues are earned when an eligible expense has been incurred; AVTA did not incur eligible expenses. Appropriate entries and beginning net assets were adjusted to correct those errors. Depreciation Expense - In prior fiscal years, AVTA calculated a full year of depreciation of capital assets regardless of when the assets were placed in service. Depreciation should be charged on a pro-rata basis based on when the asset is placed in service. Appropriate entries and beginning net assets were adjusted to correct this error. All adjustments were entered and reflected in the Audited Financial Statements for the Year Ended June 30, 2011; no exceptions were noted for the Audited Financial Statements for the Years Ended June 30, 2012 and 2013.
A n t e l o p e V a l l e y T r a n s i t A u t h o r i t y
F i s c a l Y e a r 2 0 1 4 C o m p r e h e n s i v e A n n u a l F i n a n c i a l R e p o r t P a g e | 55
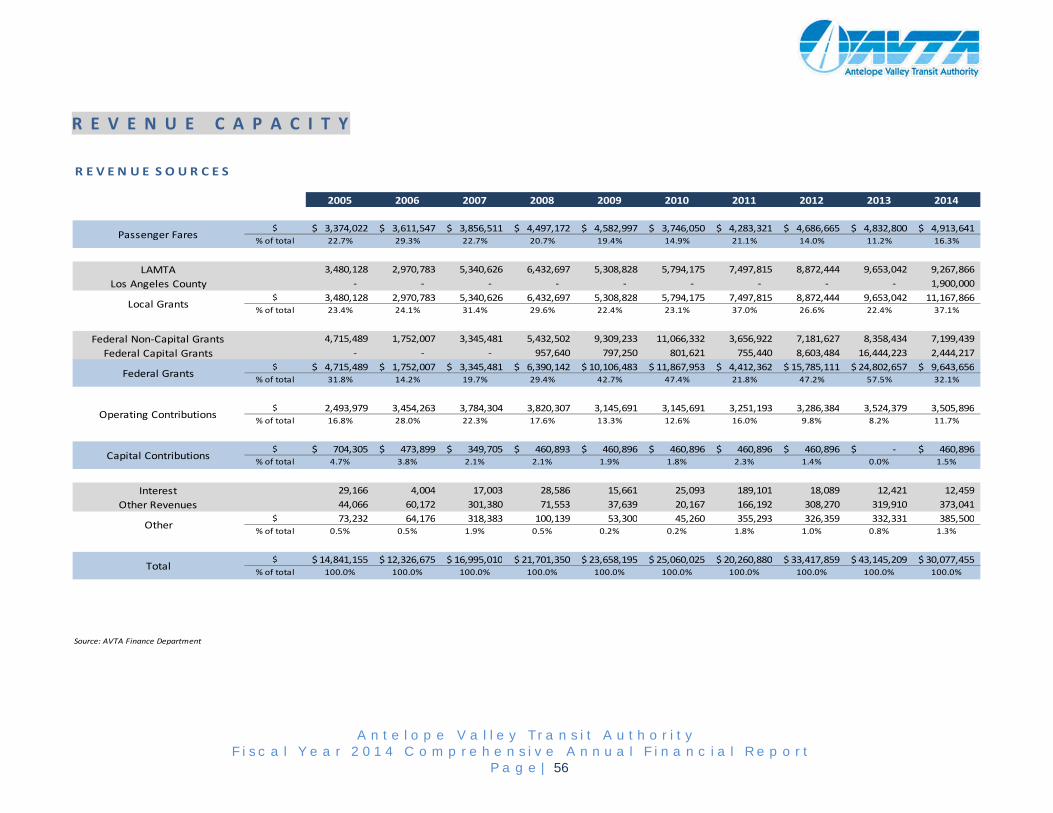
A n t e l o p e V a l l e y T r a n s i t A u t h o r i t y
F i s c a l Y e a r 2 0 1 4 C o m p r e h e n s i v e A n n u a l F i n a n c i a l R e p o r t P a g e | 56
R E V E N U E C A P A C I T Y
R E V E N U E S O U R C E S
2005 2006 2007 2008 2009 2010 2011 2012 2013 2014
$ 3,374,022$ 3,611,547$ 3,856,511$ 4,497,172$ 4,582,997$ 3,746,050$ 4,283,321$ 4,686,665$ 4,832,800$ 4,913,641$ % of total 22.7% 29.3% 22.7% 20.7% 19.4% 14.9% 21.1% 14.0% 11.2% 16.3%
LAMTA 3,480,128 2,970,783 5,340,626 6,432,697 5,308,828 5,794,175 7,497,815 8,872,444 9,653,042 9,267,866 Los Angeles County ‐ ‐ ‐ ‐ ‐ ‐ ‐ ‐ ‐ 1,900,000
$ 3,480,128 2,970,783 5,340,626 6,432,697 5,308,828 5,794,175 7,497,815 8,872,444 9,653,042 11,167,866% of total 23.4% 24.1% 31.4% 29.6% 22.4% 23.1% 37.0% 26.6% 22.4% 37.1%
Federal Non‐Capital Grants 4,715,489 1,752,007 3,345,481 5,432,502 9,309,233 11,066,332 3,656,922 7,181,627 8,358,434 7,199,439 Federal Capital Grants ‐ ‐ ‐ 957,640 797,250 801,621 755,440 8,603,484 16,444,223 2,444,217
$ 4,715,489$ 1,752,007$ 3,345,481$ 6,390,142$ 10,106,483$ 11,867,953$ 4,412,362$ 15,785,111$ 24,802,657$ 9,643,656$ % of total 31.8% 14.2% 19.7% 29.4% 42.7% 47.4% 21.8% 47.2% 57.5% 32.1%
$ 2,493,979 3,454,263 3,784,304 3,820,307 3,145,691 3,145,691 3,251,193 3,286,384 3,524,379 3,505,896% of total 16.8% 28.0% 22.3% 17.6% 13.3% 12.6% 16.0% 9.8% 8.2% 11.7%
$ 704,305$ 473,899$ 349,705$ 460,893$ 460,896$ 460,896$ 460,896$ 460,896$ ‐$ 460,896$ % of total 4.7% 3.8% 2.1% 2.1% 1.9% 1.8% 2.3% 1.4% 0.0% 1.5%
Interest 29,166 4,004 17,003 28,586 15,661 25,093 189,101 18,089 12,421 12,459 Other Revenues 44,066 60,172 301,380 71,553 37,639 20,167 166,192 308,270 319,910 373,041
$ 73,232 64,176 318,383 100,139 53,300 45,260 355,293 326,359 332,331 385,500% of total 0.5% 0.5% 1.9% 0.5% 0.2% 0.2% 1.8% 1.0% 0.8% 1.3%
$ 14,841,155$ 12,326,675$ 16,995,010$ 21,701,350$ 23,658,195$ 25,060,025$ 20,260,880$ 33,417,859$ 43,145,209$ 30,077,455$ % of total 100.0% 100.0% 100.0% 100.0% 100.0% 100.0% 100.0% 100.0% 100.0% 100.0%
Source: AVTA Finance Department
Capital Contributions
Other
Total
Passenger Fares
Local Grants
Federal Grants
Operating Contributions

D E M O G R A P H I C A N D E C O N O M I C I N F O R M A T I O N
D E M O G R A P H I C A N D S T A T I S T I C A L I N F O R M A T I O N O F T H E A N T E L O P E V A L L E Y
Index Change 2013 2014 2008 20122004 188.90 2.7% $69,637 $71,320 220.3% 229.5%2005 195.30 3.4% $83,188 $81,689 170.9% 168.3%2006 201.60 3.2% $99,124 $96,665 135.0% 134.4%2007 207.30 2.8% $74,235 $71,022 148.1% 131.3%2008 215.30 3.9% $68,837 $66,390 127.6% 121.6%2009 214.50 -0.4% $66,423 $69,885 119.3% 113.7%2010 218.10 1.7% $63,100 $61,996 120.5% 105.2%2011 224.90 3.1% $59,732 $60,710 103.7% 99.5%2012 229.60 2.1% $57,311 $58,464 106.3% 98.3%2013 232.96 1.5% $55,823 $59,167 104.4% 92.7%
2013 2014Las Vegas 585,440 595,195 Caucasian 54.5%Tucson 527,018 524,264 Black/African American 14.0%Antelope Valley 513,547 520,690 American Indian/Alaska Native 1.0%Atlanta 443,261 455,895 Asian 3.6%Miami 418,387 425,944 Native Hawaiian/Pacific Islander 0.3%St. Louis 316,452 317,322 Other Races 21.1%Cincinnati 294,894 296,859 Two or More Races 5.5%Reno 226,638 231,619
Sources:
(1) Source: Bureau of Labor Statistic annual average data
(2) US Census Data
(3) Greater Antelope Valley Economic Alliance (GAVEA) Mid Year 2014 Report, ACCRA Cost of Living Index (www.aveconomy.org/index).
Consumer Price Index (1) Comparative Average Household Income(3) Comparative Cost of Living Index(3)
1982 - 1984 = 100 US Index = 100
United States New YorkCalifornia San FranciscoSanta Clarita San DiegoLos Angeles Los Angeles/Long BeachPalmdale Palm SpringsRidgecrest RiversideLancaster FresnoRosamond BakersfieldTehachapi Las Vegas
Antelope Valley
Comparative Populations (2) Antelope Valley Population by Race - 2013 (3)
California City
A n t e l o p e V a l l e y T r a n s i t A u t h o r i t y
F i s c a l Y e a r 2 0 1 4 C o m p r e h e n s i v e A n n u a l F i n a n c i a l R e p o r t P a g e | 57
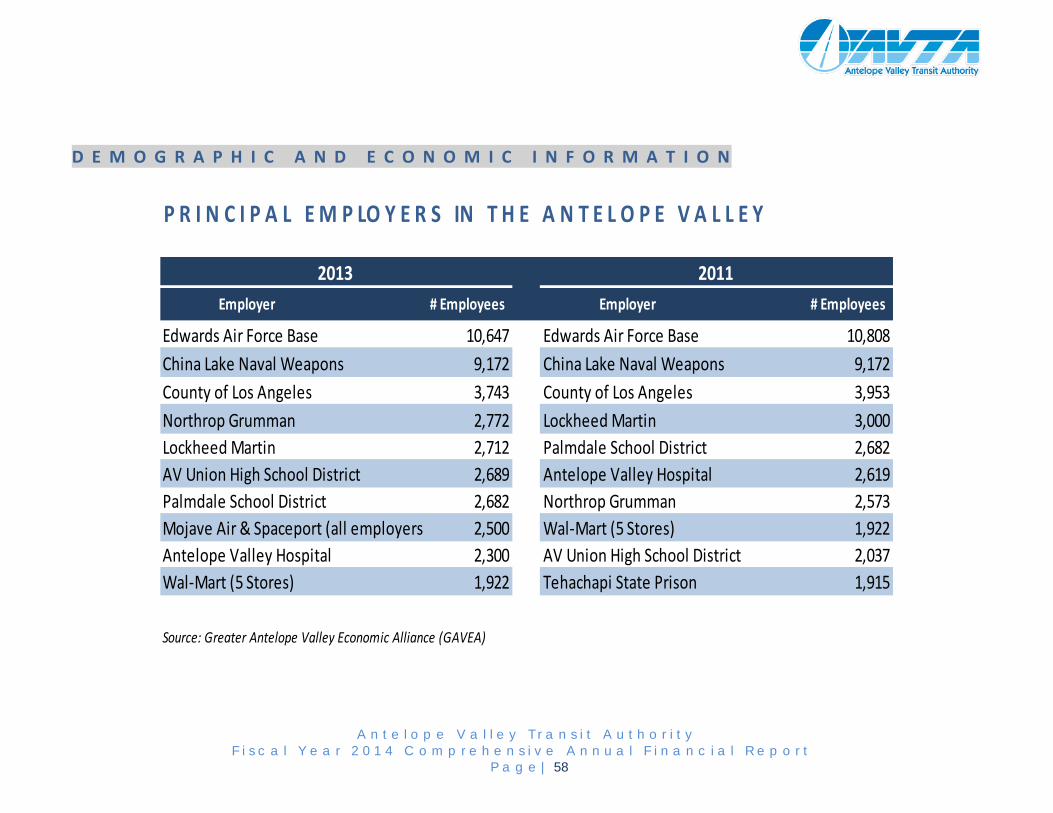
D E M O G R A P H I C A N D E C O N O M I C I N F O R M A T I O N
P R I N C I P A L E M P LO Y E R S IN T H E A N T E L O P E V A L L E Y
# Employees # Employees
Edwards Air Force Base 10,647 Edwards Air Force Base 10,808China Lake Naval Weapons 9,172 China Lake Naval Weapons 9,172County of Los Angeles 3,743 County of Los Angeles 3,953Northrop Grumman 2,772 Lockheed Martin 3,000Lockheed Martin 2,712 Palmdale School District 2,682AV Union High School District 2,689 Antelope Valley Hospital 2,619Palmdale School District 2,682 Northrop Grumman 2,573Mojave Air & Spaceport (all employers 2,500 Wal-Mart (5 Stores) 1,922Antelope Valley Hospital 2,300 AV Union High School District 2,037Wal-Mart (5 Stores) 1,922 Tehachapi State Prison 1,915
Source: Greater Antelope Valley Economic Alliance (GAVEA)
2013 2011Employer Employer
A n t e l o p e V a l l e y T r a n s i t A u t h o r i t y
F i s c a l Y e a r 2 0 1 4 C o m p r e h e n s i v e A n n u a l F i n a n c i a l R e p o r t P a g e | 58
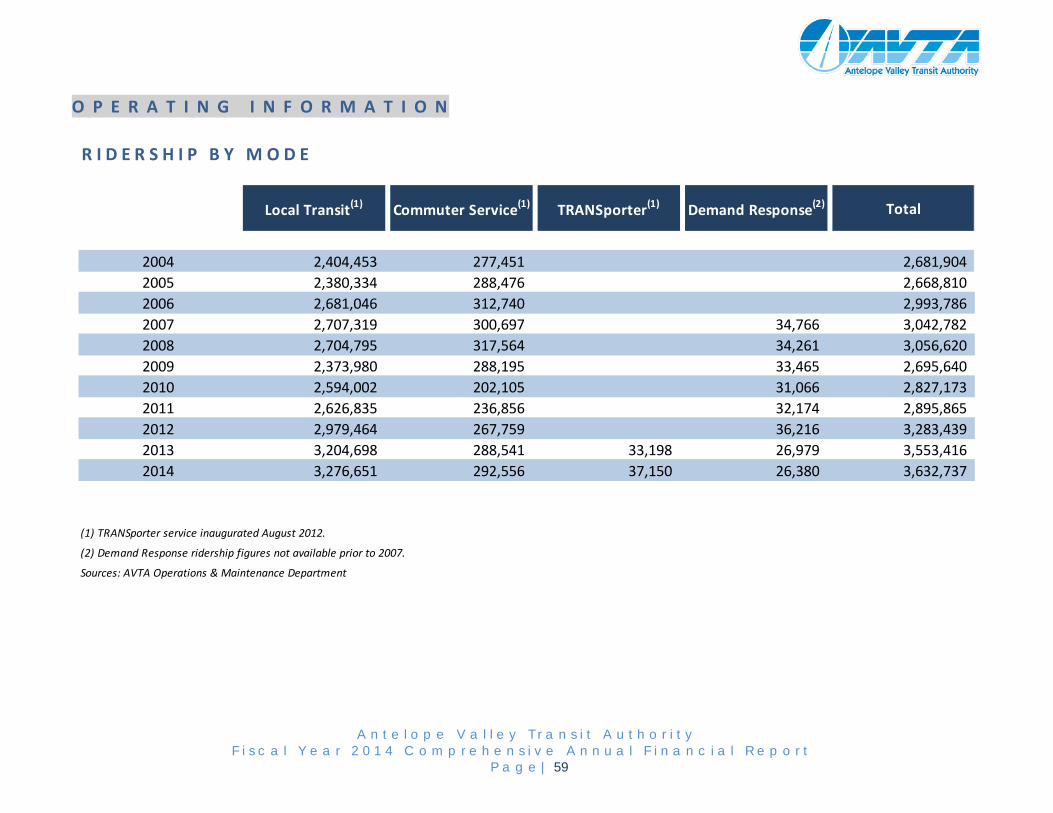
O P E R A T I N G I N F O R M A T I O N
R I D E R S H I P B Y M O D E
Local Transit(1) Commuter Service(1) TRANSporter(1) Demand Response(2) Total
2004 2,404,453 277,451 2,681,904 2005 2,380,334 288,476 2,668,810 2006 2,681,046 312,740 2,993,786 2007 2,707,319 300,697 34,766 3,042,782 2008 2,704,795 317,564 34,261 3,056,620 2009 2,373,980 288,195 33,465 2,695,640 2010 2,594,002 202,105 31,066 2,827,173 2011 2,626,835 236,856 32,174 2,895,865 2012 2,979,464 267,759 36,216 3,283,439 2013 3,204,698 288,541 33,198 26,979 3,553,416 2014 3,276,651 292,556 37,150 26,380 3,632,737
(1) TRANSporter service inaugurated August 2012.
(2) Demand Response ridership figures not available prior to 2007.
Sources: AVTA Operations & Maintenance Department
A n t e l o p e V a l l e y T r a n s i t A u t h o r i t y
F i s c a l Y e a r 2 0 1 4 C o m p r e h e n s i v e A n n u a l F i n a n c i a l R e p o r t P a g e | 59
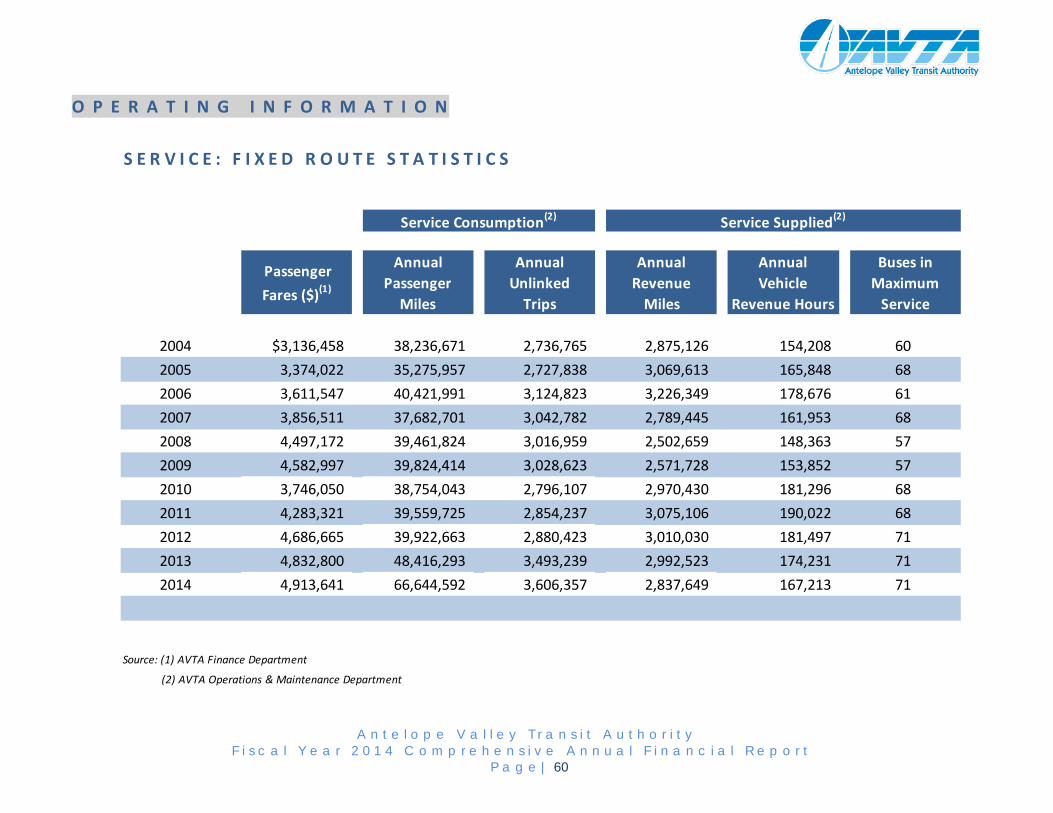
O P E R A T I N G I N F O R M A T I O N
S E R V I C E : F I X E D R O U T E S T A T I S T I C S
Passenger Fares ($)(1)
Annual Passenger
Miles
Annual Unlinked
Trips
Annual Revenue
Miles
Annual Vehicle
Revenue Hours
Buses in Maximum
Service
2004 $3,136,458 38,236,671 2,736,765 2,875,126 154,208 602005 3,374,022 35,275,957 2,727,838 3,069,613 165,848 682006 3,611,547 40,421,991 3,124,823 3,226,349 178,676 612007 3,856,511 37,682,701 3,042,782 2,789,445 161,953 682008 4,497,172 39,461,824 3,016,959 2,502,659 148,363 572009 4,582,997 39,824,414 3,028,623 2,571,728 153,852 572010 3,746,050 38,754,043 2,796,107 2,970,430 181,296 682011 4,283,321 39,559,725 2,854,237 3,075,106 190,022 682012 4,686,665 39,922,663 2,880,423 3,010,030 181,497 712013 4,832,800 48,416,293 3,493,239 2,992,523 174,231 712014 4,913,641 66,644,592 3,606,357 2,837,649 167,213 71
Source: (1) AVTA Finance Department
(2) AVTA Operations & Maintenance Department
Service Consumption(2) Service Supplied(2)
A n t e l o p e V a l l e y T r a n s i t A u t h o r i t y
F i s c a l Y e a r 2 0 1 4 C o m p r e h e n s i v e A n n u a l F i n a n c i a l R e p o r t P a g e | 60
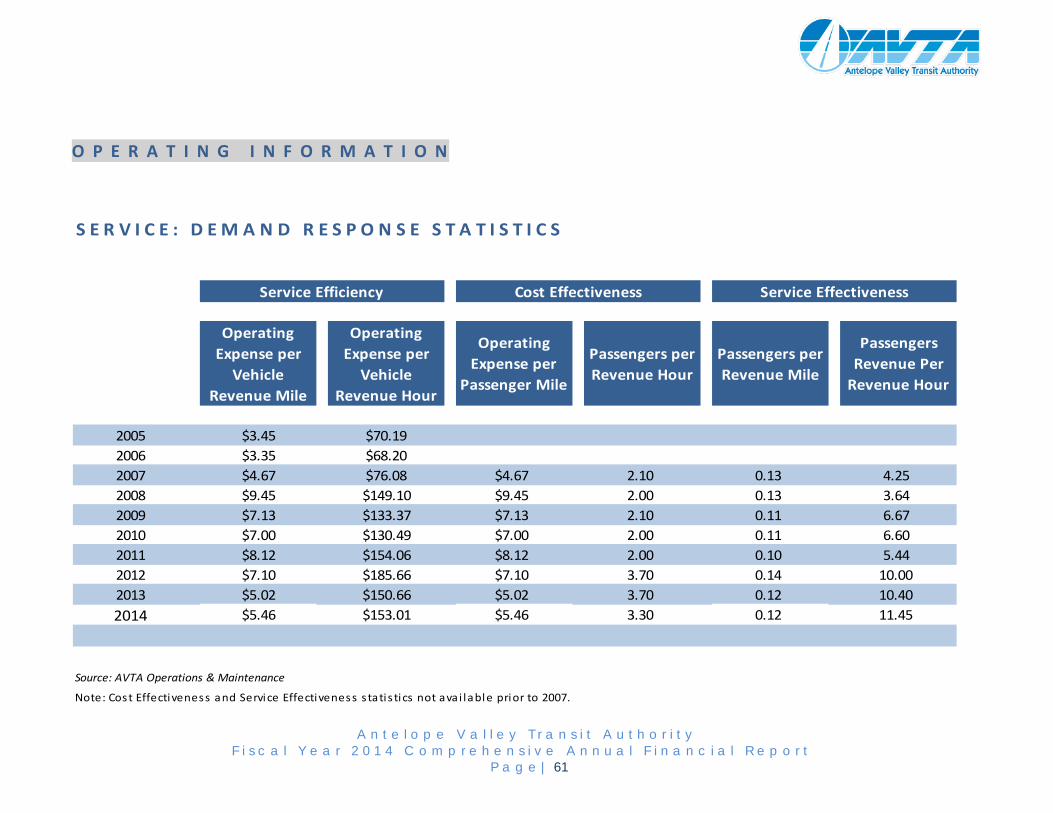
O P E R A T I N G I N F O R M A T I O N
S E R V I C E : D E M A N D R E S P O N S E S T A T I S T I C S
Operating Expense per
Vehicle Revenue Mile
Operating Expense per
Vehicle Revenue Hour
Operating Expense per
Passenger Mile
Passengers per Revenue Hour
Passengers per Revenue Mile
Passengers Revenue Per
Revenue Hour
2005 $3.45 $70.192006 $3.35 $68.202007 $4.67 $76.08 $4.67 2.10 0.13 4.252008 $9.45 $149.10 $9.45 2.00 0.13 3.642009 $7.13 $133.37 $7.13 2.10 0.11 6.672010 $7.00 $130.49 $7.00 2.00 0.11 6.602011 $8.12 $154.06 $8.12 2.00 0.10 5.442012 $7.10 $185.66 $7.10 3.70 0.14 10.002013 $5.02 $150.66 $5.02 3.70 0.12 10.402014 $5.46 $153.01 $5.46 3.30 0.12 11.45
Source: AVTA Operations & Maintenance
Note: Cost Effectiveness and Service Effectiveness s tati s tics not ava i lable prior to 2007.
Service Efficiency Cost Effectiveness Service Effectiveness
A n t e l o p e V a l l e y T r a n s i t A u t h o r i t y
F i s c a l Y e a r 2 0 1 4 C o m p r e h e n s i v e A n n u a l F i n a n c i a l R e p o r t P a g e | 61
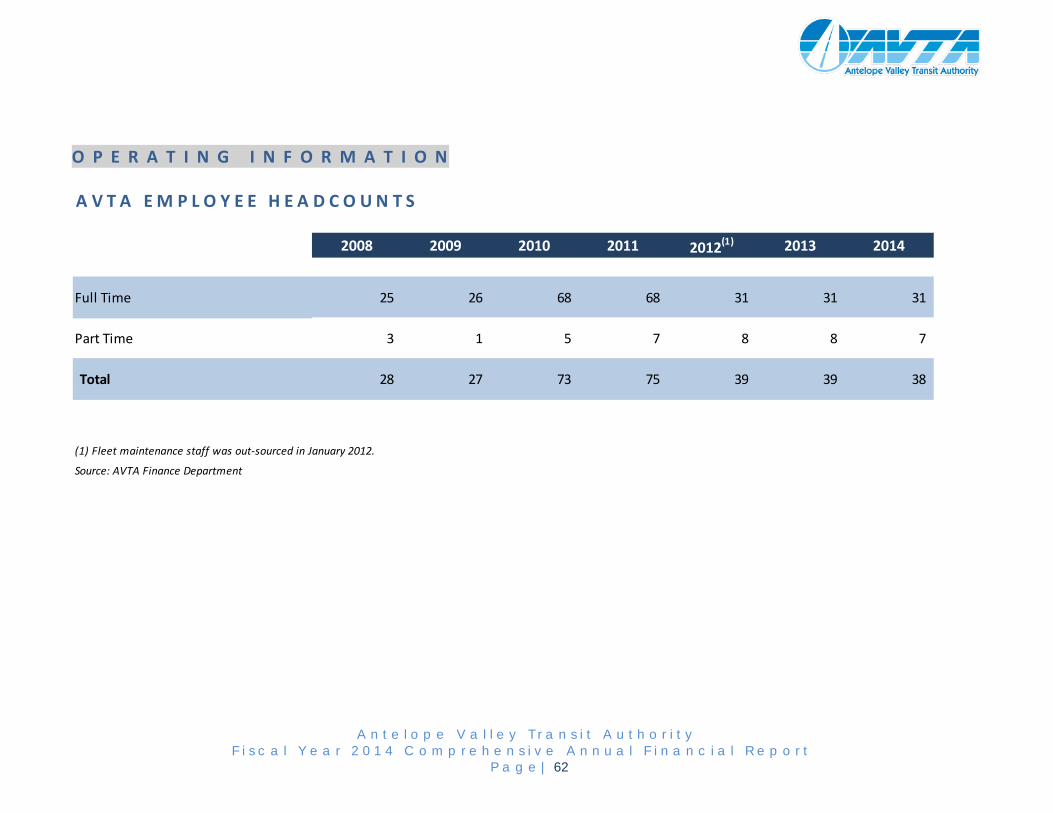
O P E R A T I N G I N F O R M A T I O N
A V T A E M P L O Y E E H E A D C O U N T S
2008 2009 2010 2011 2012(1) 2013 2014
Full Time 25 26 68 68 31 31 31
Part Time 3 1 5 7 8 8 7
Total 28 27 73 75 39 39 38
(1) Fleet maintenance staff was out-sourced in January 2012.
Source: AVTA Finance Department
A n t e l o p e V a l l e y T r a n s i t A u t h o r i t y
F i s c a l Y e a r 2 0 1 4 C o m p r e h e n s i v e A n n u a l F i n a n c i a l R e p o r t P a g e | 62
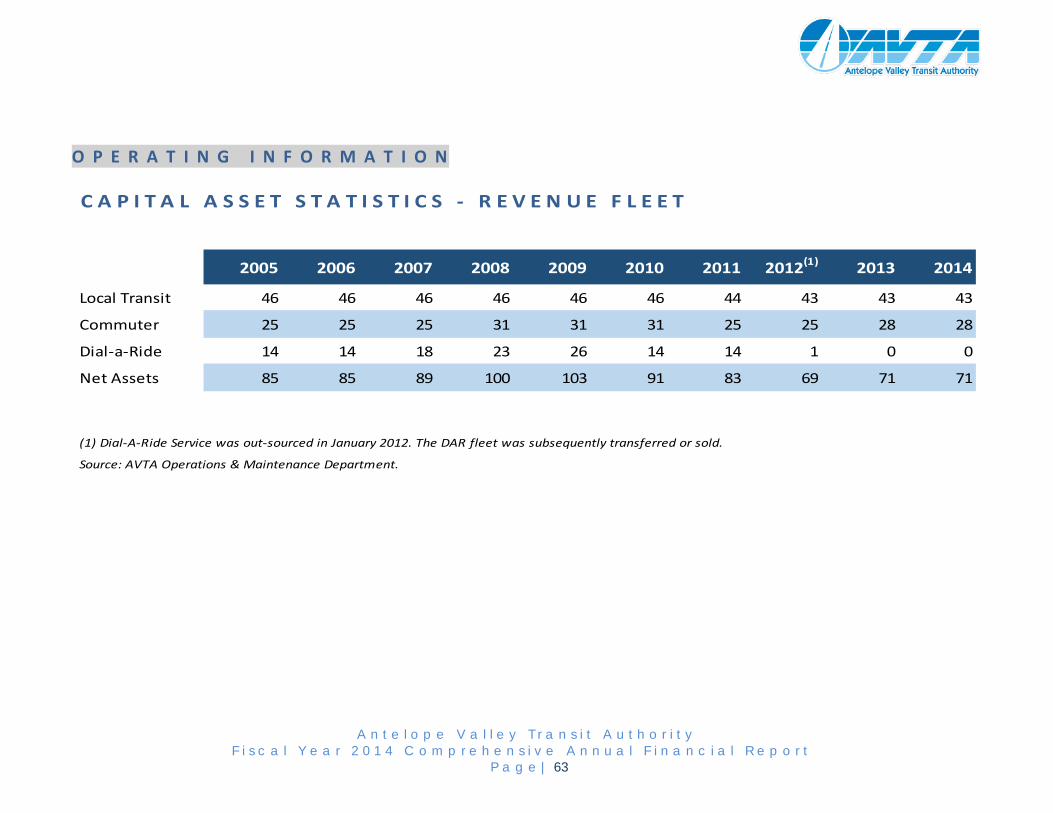
O P E R A T I N G I N F O R M A T I O N
C A P I T A L A S S E T S T A T I S T I C S - R E V E N U E F L E E T
2005 2006 2007 2008 2009 2010 2011 2012(1) 2013 2014
Local Transit 46 46 46 46 46 46 44 43 43 43
Commuter 25 25 25 31 31 31 25 25 28 28
Dial-a-Ride 14 14 18 23 26 14 14 1 0 0
Net Assets 85 85 89 100 103 91 83 69 71 71
(1) Dial-A-Ride Service was out-sourced in January 2012. The DAR fleet was subsequently transferred or sold.
Source: AVTA Operations & Maintenance Department.
A n t e l o p e V a l l e y T r a n s i t A u t h o r i t y
F i s c a l Y e a r 2 0 1 4 C o m p r e h e n s i v e A n n u a l F i n a n c i a l R e p o r t P a g e | 63