a multi-objective optimization framework for the design of offshore wind farms
TRANSCRIPT

1 Background
2 Multi-ObjectiveOptimizationFramework
3 Case Study
4 Conclusions
A Multi-Objective OptimizationFramework for the Design of
Offshore Wind Farms
Sılvio Rodrigues
DCE&S GroupDelft University of Technology
Delft, The [email protected]
June 10, 2016

1 Background
2 Multi-ObjectiveOptimizationFramework
3 Case Study
4 Conclusions
Outline
Background
Multi-Objective Optimization Framework
Case Study
Conclusions
1 Background
2 Multi-ObjectiveOptimizationFramework
3 Case Study
4 Conclusions
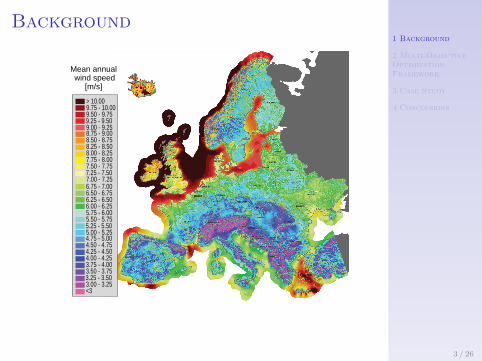
Background
<33.00 - 3.253.25 - 3.503.50 - 3.753.75 - 4.004.00 - 4.254.25 - 4.504.50 - 4.754.75 - 5.005.00 - 5.255.25 - 5.505.50 - 5.755.75 - 6.006.00 - 6.256.25 - 6.506.50 - 6.756.75 - 7.007.00 - 7.257.25 - 7.507.50 - 7.757.75 - 8.008.00 - 8.258.25 - 8.508.50 - 8.758.75 - 9.009.00 - 9.259.25 - 9.509.50 - 9.759.75 - 10.00> 10.00
Mean annual wind speed
[m/s]
3 / 26

1 Background
2 Multi-ObjectiveOptimizationFramework
3 Case Study
4 Conclusions
Background
3 / 26

1 Background
2 Multi-ObjectiveOptimizationFramework
3 Case Study
4 Conclusions
Background
1990 1995 2000 2005 2010 20150123456789
1011
Commission year
Ca
pa
city [
GW
]
5 2 5 17 3 15 50 160 273 90 90 201 210 149 577
1087
245
1166
2118
1296
3198
Yearly commissioned capacity [MW]
Cumulative commissioned capacity
mk 050 0040030020010100
10.0 ° W 7.5 ° W 5.0 ° W 2.5 ° W 0.0 ° 2.5 ° E 5.0 ° E 7.5° E 10.0° E 12.5° E 15.0° E 17.5° E
50.0 ° N
52.5 ° N
55.0 ° N
57.5 ° N
60.0 ° N
I 2006
I ≈ 1 GW
I Denmark 1st,UK 2nd
4 / 26

1 Background
2 Multi-ObjectiveOptimizationFramework
3 Case Study
4 Conclusions
Background
1990 1995 2000 2005 2010 20150123456789
1011
Commission year
Ca
pa
city [
GW
]
5 2 5 17 3 15 50 160 273 90 90 201 210 149 577
1087
245
1166
2118
1296
3198
Yearly commissioned capacity [MW]
Cumulative commissioned capacity
mk 050 0040030020010100
10.0 ° W 7.5 ° W 5.0 ° W 2.5 ° W 0.0 ° 2.5 ° E 5.0 ° E 7.5° E 10.0° E 12.5° E 15.0° E 17.5° E
50.0 ° N
52.5 ° N
55.0 ° N
57.5 ° N
60.0 ° N
I 2015
I ≈ 11 GW
I UK 1st,Germany andthen Denmark
5 / 26
1 Background
2 Multi-ObjectiveOptimizationFramework
3 Case Study
4 Conclusions
Background
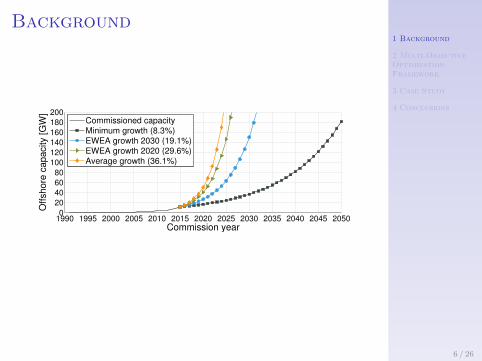
1990 1995 2000 2005 2010 2015 2020 2025 2030 2035 2040 2045 20500
20
40
60
80
100
120
140
160
180
200
Commission year
Offshore
capacity [G
W]
Commissioned capacityMinimum growth (8.3%)EWEA growth 2030 (19.1%)EWEA growth 2020 (29.6%)Average growth (36.1%)
6 / 26

1 Background
2 Multi-ObjectiveOptimizationFramework
3 Case Study
4 Conclusions
The challenge
TurbinesOnshore substationMeteorological mastArray cable connectionsExport cable routeOnshore cable route
Lolland
Sweden
Norway
Denmark
Germany
Netherlands
0 1 km
Conwy
Llandudno
Colwyn BayLlanddulas
Abergele
Rhyl
Prestatyn
Mostyn
Turbines
Onshore substationMeteorological mastArray cable connectionsExport cable routeOnshore cable routeProject areaTurbine area
O�shore substations
0 10 km
7 / 26
1 Background
2 Multi-ObjectiveOptimizationFramework
3 Case Study
4 Conclusions
The challenge
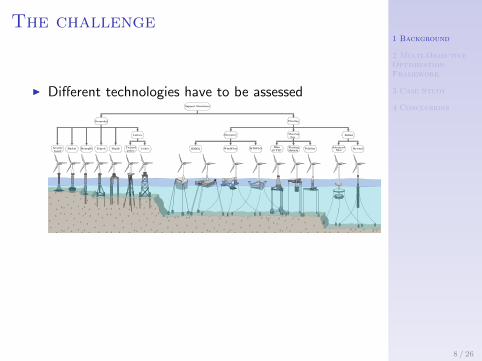
I Different technologies have to be assessed
CR
Support Structures
Grounded
Gravitybased
Bucket Monopile Tripod Tripile Twistedjacket
Lattice
Jacket IDEOL WindFloat
Buoyancy
WINFLO
Mooringline
BlueH TLP
Floating PelaStar Advanced Hywind
Ballast
Floating
Haliade Spar
I The problem is too complex to be tackled at oncewith current design techniques
8 / 26

1 Background
2 Multi-ObjectiveOptimizationFramework
3 Case Study
4 Conclusions
The challenge
I Different technologies have to be assessed
CR
Support Structures
Grounded
Gravitybased
Bucket Monopile Tripod Tripile Twistedjacket
Lattice
Jacket IDEOL WindFloat
Buoyancy
WINFLO
Mooringline
BlueH TLP
Floating PelaStar Advanced Hywind
Ballast
Floating
Haliade Spar
I The problem is too complex to be tackled at oncewith current design techniques
8 / 26

1 Background
2 Multi-ObjectiveOptimizationFramework
3 Case Study
4 Conclusions
Current Optimization Frameworks
Single-
Objective
Optimizer
Wind farm
designer
Final wind
farm layout
Economic
assumptions
Optimization and decision phases
Database
High-level
constraints
AED
CAPEX
OPEX
NPV = (AED · pMWh − OPEX ) a− CAPEX
9 / 26

1 Background
2 Multi-ObjectiveOptimizationFramework
3 Case Study
4 Conclusions
Trade-offs
Energy production [MWh]
Investment
cost [€]
NPV = (AED · pMWh − OPEX ) a− CAPEX
10 / 26

1 Background
2 Multi-ObjectiveOptimizationFramework
3 Case Study
4 Conclusions
Objectives
Optimize
Integrate Automate
11 / 26

1 Background
2 Multi-ObjectiveOptimizationFramework
3 Case Study
4 Conclusions
Proposed Multi-Obj. Framework
Optimized trade-offs
Multi-
Objective
Optimizer
AED
OPEX
CAPEXDatabase
Optimized wind
farm layout
Wind farm
designer
End
design?
Final wind
farm layout
Economic
assumptions
High-level
constraints
Yes
No
Optimization phase
Decision phase
12 / 26

1 Background
2 Multi-ObjectiveOptimizationFramework
3 Case Study
4 Conclusions
Wind farm components
a
b
cd
e
f
g
13 / 26
1 Background
2 Multi-ObjectiveOptimizationFramework
3 Case Study
4 Conclusions
Dutch Offshore Wind Farms
I
IIIII
IV "
"
h h
e
f
g
g
i
i
10-mile zone≈ 18.5 km
12-mile zone≈ 22 km
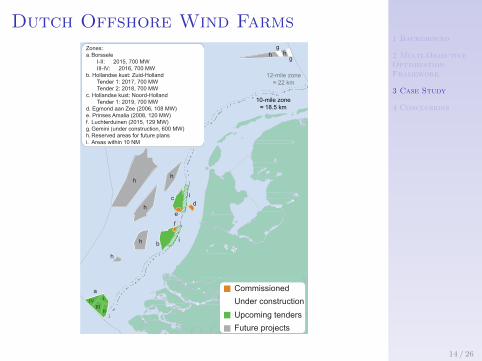
Zones:a. Borssele I-II: 2015, 700 MW III-IV: 2016, 700 MWb. Hollandse kust: Zuid-Holland Tender 1: 2017, 700 MW Tender 2: 2018, 700 MWc. Hollandse kust: Noord-Holland Tender 1: 2019, 700 MWd. Egmond aan Zee (2006, 108 MW)e. Prinses Amalia (2008, 120 MW)f. Luchterduinen (2015, 129 MW)g. Gemini (under construction, 600 MW)h. Reserved areas for future plansi. Areas within 10 NM
h
h
h
h
h
a
b
cd
CommissionedUnder constructionUpcoming tendersFuture projects
14 / 26
1 Background
2 Multi-ObjectiveOptimizationFramework
3 Case Study
4 Conclusions
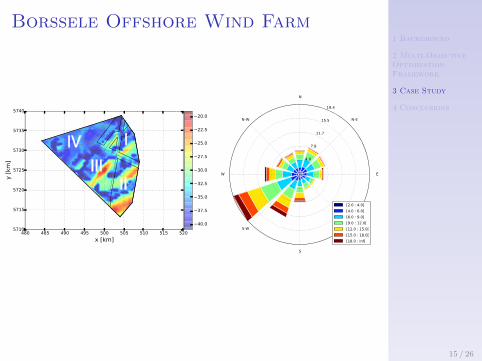
Borssele Offshore Wind Farm
I
IIIII
IV
E
N-E
N
N-W
W
S-W
S
S-E
4.0
7.8
11.7
15.5
19.4
[2.0 : 4.0[[4.0 : 6.0[[6.0 : 9.0[[9.0 : 12.0[[12.0 : 15.0[[15.0 : 18.0[[18.0 : inf[
15 / 26
1 Background
2 Multi-ObjectiveOptimizationFramework
3 Case Study
4 Conclusions
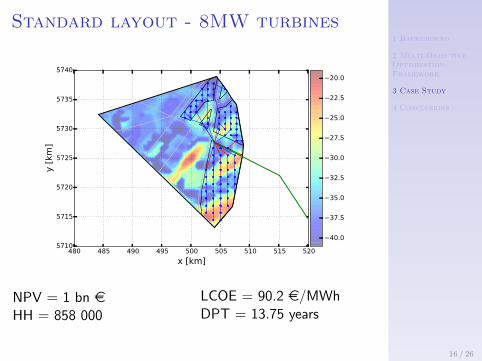
Standard layout - 8MW turbines
480 485 490 495 500 505 510 515 520x [km]
5710
5715
5720
5725
5730
5735
5740
y [k
m]
40.0
37.5
35.0
32.5
30.0
27.5
25.0
22.5
20.0
NPV = 1 bn eHH = 858 000
LCOE = 90.2 e/MWhDPT = 13.75 years
16 / 26

1 Background
2 Multi-ObjectiveOptimizationFramework
3 Case Study
4 Conclusions
Optimized Trade-off
0 1000 2000 3000 4000 5000 6000 7000 8000AED [GWh]
0
2
4
6
8
10
12
CAPE
X [b
n EU
R]
MVac 66 kVHVdc 320 kVHVac 220 kVStd 8 MWStd 5 MW
17 / 26

1 Background
2 Multi-ObjectiveOptimizationFramework
3 Case Study
4 Conclusions
Net Present Value
0 1000 2000 3000 4000 5000 6000 7000 8000AED [GWh]
3
2
1
0
1
2
NPV
[bn
EUR]
Standard layouts do not present the best economic values!
18 / 26

1 Background
2 Multi-ObjectiveOptimizationFramework
3 Case Study
4 Conclusions
Net Present Value
480 485 490 495 500 505 510 515 520x [km]
5710
5715
5720
5725
5730
5735
5740
y [k
m]
40.0
37.5
35.0
32.5
30.0
27.5
25.0
22.5
20.0
NPV = 1.73 bn eHH = 1 780 000
LCOE = 96.2 e/MWhDPT = 14.8 years
19 / 26

1 Background
2 Multi-ObjectiveOptimizationFramework
3 Case Study
4 Conclusions
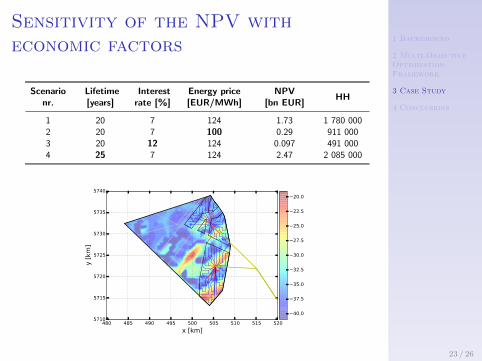
Sensitivity of the NPV witheconomic factorsNPV = (AED · pMWh − OPEX ) a− CAPEX
Scenarionr.
Lifetime[years]
Interestrate [%]
Energy price[EUR/MWh]
NPV[bn EUR]
HH
1 20 7 124 1.73 1 780 000
0 1000 2000 3000 4000 5000 6000 7000 8000AED [GWh]
6
5
4
3
2
1
0
1
2
3
NPV
[bn
EUR]
Scenario 1Scenario 2Scenario 3Scenario 4Best layouts
20 / 26

1 Background
2 Multi-ObjectiveOptimizationFramework
3 Case Study
4 Conclusions
Sensitivity of the NPV witheconomic factors
Scenarionr.
Lifetime[years]
Interestrate [%]
Energy price[EUR/MWh]
NPV[bn EUR]
HH
1 20 7 124 1.73 1 780 0002 20 7 100 0.29 911 000
480 485 490 495 500 505 510 515 520x [km]
5710
5715
5720
5725
5730
5735
5740
y [k
m]
40.0
37.5
35.0
32.5
30.0
27.5
25.0
22.5
20.0
21 / 26

1 Background
2 Multi-ObjectiveOptimizationFramework
3 Case Study
4 Conclusions
Sensitivity of the NPV witheconomic factors
Scenarionr.
Lifetime[years]
Interestrate [%]
Energy price[EUR/MWh]
NPV[bn EUR]
HH
1 20 7 124 1.73 1 780 0002 20 7 100 0.29 911 0003 20 12 124 0.097 491 000
480 485 490 495 500 505 510 515 520x [km]
5710
5715
5720
5725
5730
5735
5740
y [k
m]
40.0
37.5
35.0
32.5
30.0
27.5
25.0
22.5
20.0
22 / 26
1 Background
2 Multi-ObjectiveOptimizationFramework
3 Case Study
4 Conclusions
Sensitivity of the NPV witheconomic factors
Scenarionr.
Lifetime[years]
Interestrate [%]
Energy price[EUR/MWh]
NPV[bn EUR]
HH
1 20 7 124 1.73 1 780 0002 20 7 100 0.29 911 0003 20 12 124 0.097 491 0004 25 7 124 2.47 2 085 000
480 485 490 495 500 505 510 515 520x [km]
5710
5715
5720
5725
5730
5735
5740
y [k
m]
40.0
37.5
35.0
32.5
30.0
27.5
25.0
22.5
20.0
23 / 26
1 Background
2 Multi-ObjectiveOptimizationFramework
3 Case Study
4 Conclusions
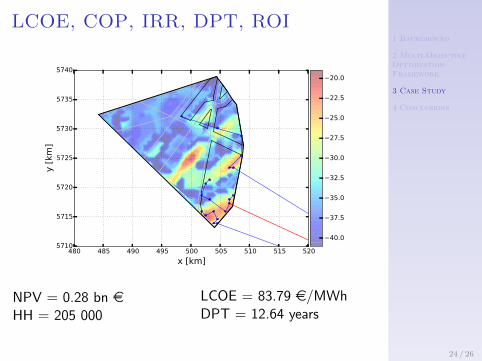
LCOE, COP, IRR, DPT, ROI
480 485 490 495 500 505 510 515 520x [km]
5710
5715
5720
5725
5730
5735
5740
y [k
m]
40.0
37.5
35.0
32.5
30.0
27.5
25.0
22.5
20.0
NPV = 0.28 bn eHH = 205 000
LCOE = 83.79 e/MWhDPT = 12.64 years
24 / 26

1 Background
2 Multi-ObjectiveOptimizationFramework
3 Case Study
4 Conclusions
Highest Energy Delivered
480 485 490 495 500 505 510 515 520x [km]
5710
5715
5720
5725
5730
5735
5740
y [k
m]
40.0
37.5
35.0
32.5
30.0
27.5
25.0
22.5
20.0
NPV = -2.86 bn eHH = 2 200 000
LCOE = 161.2 e/MWhDPT = 27.8 years
25 / 26

1 Background
2 Multi-ObjectiveOptimizationFramework
3 Case Study
4 Conclusions
Conclusions
I Review of the existing optimization approaches
I Only single-objective optimizationI Do not cover all revelant design aspects
I Multi-Objective Optimization FrameworkI Integrated, automated and optimized designs
I Models tailored for this problem
I MMC, cables, transformers, collection system design
I Choosing the final layout is a difficult task!
I Presenting the trade-offs to the designers
I Cost savings during planning and operation phases!
26 / 26