a monte carlo test of load calculation methods, lake - hydroikos
TRANSCRIPT

ABSTRACT: The sampling of streams and estimation of total loadsof nitrogen, phosphorus, and suspended sediment play an impor-tant role in efforts to control the eutrophication of Lake Tahoe. Weused a Monte Carlo procedure to test the precision and bias of fourmethods of calculating total constituent loads for nitrate-nitrogen,soluble reactive phosphorus, particulate phosphorus, total phospho-rus, and suspended sediment in one major tributary of the lake.The methods tested were two forms of the Beale’s Ratio Estimator,the Period Weighted Sample, and the Rating Curve. Intensive sam-pling in 1985 (a dry year) and 1986 (a wet year) provided a basis forestimating loads by the “worked record” method for comparisonwith estimates based on resampling actual data at the lower inten-sity that characterizes the present monitoring program. The resultsshow that: (1) the Period Weighted Sample method was superior tothe other methods for all constituents for 1985; and (2) for totalphosphorus, particulate phosphorus, and suspended sediment, theRating Curve gave the best results in1986. Modification of the pre-sent sampling program and load calculation methods may be neces-sary to improve the precision and reduce the bias of estimates oftotal phosphorus loads in basin streams.(KEY TERMS: aquatic ecosystems; statistical analysis; water quali-ty; watershed management; Lake Tahoe; eutrophication; load calcu-lation).
INTRODUCTION
Since 1980, the Lake Tahoe Interagency Monitor-ing Program (LTIMP) has been measuring stream dis-charge and concentrations of nutrients and sedimentin up to ten tributary streams in the Lake TahoeBasin, California-Nevada. The objectives of theLTIMP are “to acquire and disseminate the water-quality information necessary to support science-based environmental planning and decision makingin the basin” (Boughton et al., 1997). The LTIMP is a
cooperative program with support from 12 federal andstate agencies with interests in the Tahoe Basin. TheLTIMP data set is comprised of greater than 15,000samples representing about 250 station-years ofrecord for up to six water quality constituents. Itspotential for research and decision-making has barelybeen tapped.
Concern about water quality in the Tahoe Basin isdriven by the progressive eutrophication of the lake,which has been studied intensively since the early1960s (Goldman, 2000). In spite of increased land-usecontrols and export of treated sewage effluent fromthe basin, primary productivity of the lake is increas-ing by more than 5 percent annually, and its clarity(measured by Secchi disk) is decreasing at an averagerate of 0.25 m/yr. Until the early 1980s, nutrient limi-tation studies showed that primary productivity inthe lake was nitrogen-limited. Now, after a half-century of accelerated nitrogen input (much of it from direct atmospheric deposition), the lake is phos-phorus-limited (Chang et al., 1992; Goldman et al.,1993; Jassby et al., 1995). Because the volume of thelake is so large (156 km3) and its hydraulic residencetime so long (about 700 y; Jassby et al., 1995), itseutrophication may be virtually irreversible. Sinceland use policies and water quality control programsin the basin are aimed largely at controlling or reduc-ing the loads of nitrogen and phosphorus to the lake,it is important that tributary nutrient loads be accu-rately estimated (Reuter et al., 1999).
Conceptually, the calculation of tributary massloads requires evaluating an integral. The load in agiven time interval between ta and tb is given by
1Paper No. 01138 of the Journal of the American Water Resources Association. Discussions are open until February 1, 2003.2Respectively, Principal, Hydroikos Associates, 2175 East Francisco Blvd., Suite A, San Rafael, California 94901; Graduate Student,
INSTAAR and Department of Geography, University of Colorado, Boulder, Colorado 80309; and Professor, Department of Environmental Sci-ence and Policy, University of California, Davis, California 95616 (E-Mail/Coats: [email protected]).
JOURNAL OF THE AMERICAN WATER RESOURCES ASSOCIATION 719 JAWRA
JOURNAL OF THE AMERICAN WATER RESOURCES ASSOCIATIONVOL. 38, NO. 3 AMERICAN WATER RESOURCES ASSOCIATION JUNE 2002
A MONTE CARLO TEST OF LOAD CALCULATION METHODS,LAKE TAHOE BASIN, CALIFORNIA-NEVADA1
Robert Coats, Fengjing Liu, and Charles R. Goldman2

where L is the total load in the time interval ta to tb;K is a unit conversion factor; Qt is the instantaneousdischarge at time t; and Ct is the instantaneous con-centration at time t.
The instantaneous discharge can be measured bystandard stream gaging techniques at the time ofsampling, and continuous (or at least mean daily) dis-charge data are often readily available. The problemis that concentration of most constituents cannot bemeasured continuously, but has to be sampled anddetermined by chemical methods.
A number of methods and various refinementshave been developed for estimating loads. These fallinto three categories: averaging estimators, ratio esti-mators, and regression estimators (Preston et al.,1989). Averaging estimators use averages of concen-tration and discharge for different time intervals, andsum the results over the water year. This approachmay give biased results, if the sampling does not ade-quately characterize the extremes of flow and concen-tration during the entire year (Dolan et al., 1981;Ferguson, 1987). The period-weighted sample method(PWS) (Dann et al., 1986) is a type of averaging esti-mator. In this method, each two successive concentra-tions are averaged, multiplied by the cumulativedischarge between sampling times, and the resultingload increments summed over the water year. ThePWS has been used at Hubbard Brook to calculatetotal ion loads leaving the watersheds (Likens et al.,1977).
The method of the worked record may also bethought of as an averaging method. In this method,the time trace of discharge and concentration are plot-ted together, and the mean daily concentration isinterpolated for days on which samples were not col-lected. This allows the technician to adjust concentra-tions up or down to take account of dischargevariation. With a good database and relatively lowintradaily variability in concentrations, the method isaccurate in the hands of a skillful technician, but theresults may not be reproducible, and it does not lenditself to an estimate of sampling error (Cohn, 1995).Since mean daily concentration must be estimatedfrom instantaneous concentration, errors may beintroduced for constituents that vary widely over thecourse of a day.
Ratio estimators assume a constant ratio betweentwo variables, usually concentration and discharge, orload and discharge (Cohn, 1995). A ratio estimator isa best linear unbiased estimator provided that: (a)samples are collected at random; (b) the relation
between yi and xi is a straight line through the origin;and (c) the variance of yi about this line is proportion-al to xi, where yi is the dependent variable and xi isthe independent variable. This condition is often metwith instantaneous load as the dependent variableand instantaneous discharge as the independent variable (Preston et al., 1989). An example of thisapproach is the Beale’s Ratio Estimator (BRE,described in detail below).
Regression estimators have long been used to esti-mate loads of suspended sediment, usually in a log-log form, since both concentration and discharge areassumed to be log-normally distributed. Log of instan-taneous concentration (Ci) is regressed against log ofinstantaneous discharge (Qi), and the resulting rela-tionship can be used to predict daily concentration(Cd) from daily discharge (Qd), provided that a correc-tion factor for retransformation bias is introduced(Ferguson, 1986; Cohn, 1995).
A variant of the rating curve method has been usedby the University of California-Davis Tahoe ResearchGroup (TRG) to calculate total nutrient loads for theTahoe Basin (Byron et al., 1989). Instead of log Ci vs.log Qi , instantaneous load (Li ) is calculated as theproduct Ci · Qi , and regressed against log Qi . Theresulting relationship (with appropriate correction forretransformation bias) is used to estimate Ld from Qd,and the estimates are summed over days for thewater year. The load estimates by this variant, howev-er, are mathematically identical to those obtained bya regression of log Ci vs. log Qi. The apparent highcorrelation between log Li and log Qi is a “spuriousself-correlation” (Galat, 1990).
Stratification of discharge and concentration databy flow class, month or season can appreciablyimprove the accuracy of load estimates (Richards andHolloway, 1987; Preston et al., 1989). It can be appliedto any of the main load calculation methods. Hill(1986), for example, developed separate nitrate-N rat-ing curves for the November to April and May toOctober periods for Ontario streams, where nitrate-Nconcentrations are typically two orders of magnitudehigher than in Tahoe Basin streams. In a Monte Carlostudy of load calculation methods for calculating TPloads in a tributary of the Great Lakes, Dolan et al.(1981) showed that applying the BRE separately tojust two flow classes significantly improved themethod’s accuracy.
Thomas (1985) developed a variable-probabilitysampling method for suspended sediment load esti-mation, in which the probability of collecting a sampleis proportional to its estimated contribution to totalsuspended sediment discharge. This method was latercompared with time-stratified sampling and flow-stratified sampling (Thomas and Lewis, 1993). Suchsampling designs allow for unbiased estimates of total
JAWRA 720 JOURNAL OF THE AMERICAN WATER RESOURCES ASSOCIATION
Coats, Liu, and Goldman
L K Q C dtt tt
t
a
b
= ⋅ ⋅∫ (1)

load, as well as estimation of sampling error; theirimplementation may be facilitated with automatedand preprogrammed sampling equipment.
Using data for three large river basins in Ohio,Richards and Holloway (1987) simulated concentra-tions at six-hour intervals for nitrate, total phospho-rus (TP), soluble reactive phosphorus (SRP),suspended solids (SS), and conductivity for 1,000years. They then sampled the synthetic data sets toevaluate both sampling and load calculation methods.They found that the bias and precision of load esti-mates are affected by frequency and pattern of sam-pling, calculation approach, watershed size, and thebehavior of the chemical species being monitored. Ofthe strategies evaluated, the BRE with flow-stratifiedsampling provided the best results.
The purpose of this study was to evaluate and com-pare four alternative methods for estimating tribu-tary mass loads of different forms of nitrogen andphosphorus, and of suspended sediment, for the givensampling program of the LTIMP. It was hoped thatthe results would: (1) provide guidance to the LTIMPin the choice of methods for estimating total loadsfrom existing data; (2) provide guidance on possiblemodification to the sampling program; and (3) provideinsights that may be useful to other monitoring pro-grams that are attempting to measure nutrient loadsin mountain streams.
METHODS
It is common in water quality sampling programsfor samples to be collected nonrandomly. This compli-cates the estimation of the bias and precision of loadestimates. A Monte Carlo test in which a large dataset is resampled many times is one way around theproblem of lack of random sampling.
In the Monte Carlo test, we resampled water quali-ty data sets (with replacement) from 1985 (89 sam-ples) and 1986 (136 samples) for Blackwood Creek, amajor tributary in the Tahoe basin. For each test wecreated 200 data subsets with samples sizes (n) of 20,40, 60, and 80 samples for both years, and additional-ly of 100 and 120 samples for 1986. We thus had 800data subsets for 1985 and 1,200 subsets for 1986.These subsets were then used to calculate total annu-al loads of total phosphorus (TP), particulate phospho-rus (PP), soluble reactive phosphorus (SRP),nitrate-nitrogen and suspended sediment (SS), byfour methods, as described below. These load esti-mates were then compared with load estimatesderived by the worked record method.
The Blackwood water quality samples were collect-ed by the Lake Tahoe Interagency Monitoring Pro-gram (LTIMP). The LTIMP stream sampling networkwas setup in 1979, to monitor seven tributary streamsfor nutrients and sediment. By 1987, the network hadbeen cut back to four streams. It was then expandedto include four small tributaries on the Nevada side.By 1993, the network included 32 sites in 14 basins,with a total of 20 stream gaging stations (Boughtonet al., 1997). Figure 1 shows the tributaries sampledin the program.
Samples for nutrient and sediment analysis arecollected and handled according to protocols estab-lished by the U.S. Geological Survey, which maintainsthe gaging stations and discharge records. Through-out the program, stream sampling has beenconcentrated during periods of high flow; samplingcrews often work at night, and on weekends and holi-days. Until the mid-1990s, typically greater than 100samples were collected per year at the major stations
JOURNAL OF THE AMERICAN WATER RESOURCES ASSOCIATION 721 JAWRA
A Monte Carlo Test of Load Calculation Methods, Lake Tahoe Basin, California-Nevada
Figure 1. The Lake Tahoe Basin, Showingthe LTIMP Sampling Tributaries.

at tributary mouths. During spring snowmelt, sam-ples were usually collected at least daily at the majorstations. Since the mid-1990s, the sampling intensityhas been reduced, but the number of stations hasbeen maintained. In WY 1998, the LTIMP collectedan average of 29 samples at each of the ten tributarymouth stations.
Samples are stored on ice and sent either to alaboratory in the Tahoe basin, at the University ofCalifornia-Davis or (for suspended sediment) to theUSGS laboratory in Salinas, California. Constituentsanalyzed include nitrate-nitrogen, ammonia-nitrogen,Total Kjeldahl Nitrogen (TKN, since 1989), solublereactive phosphorus (SRP), total phosphorus (TP),biologically-available iron, and suspended sediment.In some years, a limited set of samples has been fil-tered (0.45 µm), allowing calculation of particulate(PP) and dissolved (DP) phosphorus, and particulate(PON) and dissolved organic nitrogen (DON) by dif-ference. The chemical methods have been describedin detail elsewhere (Goldman et al., 1993). Qualityassurance/quality control procedures (use of fieldblanks, spike recovery, duplicate samples, etc.) con-form to USGS protocols.
Blackwood Creek, the source of our data, drains anarea of 29 km2 on the west side of the Lake Tahoebasin. Its mean annual runoff is 114 cm, most ofwhich occurs during spring snowmelt. There is a widerange in discharge over the water year; the meanannual maximum daily discharge is 342 times themean annual minimum daily discharge. There is littledevelopment in the basin, but it was subjected toheavy logging and grazing up to the early 1960s. Theannual runoff for Blackwood Creek in 1985 was 30percent below the mean for 1961 to 1998, and in 1986it was 45 percent above the long-term mean. Thesetwo water years thus represent a wide range of runoffconditions.
The mean daily discharge, measured concentra-tions and worked record concentration estimates ofTP, PP, and SS are shown in Figure 2a; SRP andnitrate-N are shown in Figure 2b. The points repre-sent the sample concentrations that were resampledin the Monte Carlo experiment. Ammonia-N datawere not used, since the concentrations of that formare generally very low in basin streams and con-tribute a negligible amount to total nitrogen load(Coats and Goldman, 2001). Table 1 shows the coeffi-cient of variation (standard deviation as percent ofmean) of instantaneous loads sampled by the LTIMPin 1985 and 1986.
For these two years, the TRG staff had estimatedthe average daily concentration, by the “workedrecord” method, for nitrate-N, SRP, total hydrolyzablephosphorus (THP), and suspended sediment. These
average daily concentration estimates were multipliedby the mean daily discharge (from the USGS record)to give the average daily loads, which were thensummed over each water year. The resulting esti-mates of total annual load are taken as the “true”loads against which the estimates by the four testmethods are compared. We recognize that the workedrecord method may introduce its own bias, especiallyfor particulate constituents, but at this point it seemsto provide the best available standard against whichto judge estimates based on a smaller sample size. Fornitrate-N, a discharge-concentration model may alsobe used to generate a trace of Cd (Coats and Goldman,2001), but for the other constituents, we do not have amodel for simulating Cd or Ci that would not incorpo-rate the same assumptions as the load calculationmodels we are trying to test.
The THP analysis, since replaced with a differentdigestion procedure, gives results that are somewhatless than but linearly related to total phosphorus(TP). To maintain comparability with the currentmethods, the 1985 and 1986 THP data and workedrecord estimates were converted by regression to TP(Hatch, 1997). Particulate phosphorus (PP) for Black-wood Creek was estimated by regression with sus-pended sediment (R2 = 0.85, n = 124), but constrainedso that the PP value for each water sample in thedata sets never exceeded (TP)-(SRP).
The sampling program of the LTIMP does not use arigorous random or periodic sampling scheme; rathersampling decisions are based on the professional judg-ment of field crews, who must deal with access duringsevere storms as well as budget limitations. Weassumed that the bias toward high discharge that isbuilt into the LTIMP sampling effort would be pre-served in a random subsample of the original data.The sampling was constrained by the requirementthat each annual quartile of mean daily discharge berepresented by at least three samples in each dataset. This is equivalent to assuming that the fieldcrews will sample a range of discharges, even thoughtheir efforts are concentrated at high discharge. It ispossible, however, that the field crews could do a bet-ter job of distributing their sampling efforts over flowclass than that represented by our constrained ran-dom sampling.
Using the 800 data subsets for 1985 and 1,200 sub-sets for 1986, we then calculated the total load for thetwo water years, by four different methods.
The Beale’s Ratio Estimator (BRE)
In this method, the discharge-weighted mean con-centration is multiplied by total discharge in the
JAWRA 722 JOURNAL OF THE AMERICAN WATER RESOURCES ASSOCIATION
Coats, Liu, and Goldman

JOURNAL OF THE AMERICAN WATER RESOURCES ASSOCIATION 723 JAWRA
A Monte Carlo Test of Load Calculation Methods, Lake Tahoe Basin, California-Nevada
(a)
Figure 2. Mean Daily Discharge, and Constituent Concentrations,Blackwood Creek, Water Years 1985 and 1986. Figure 2a shows
mean daily discharge, total P, particulate P, and suspendedsediment; Figure 2b shows nitrate-N and soluble reactive P.
Points represent the actual water quality samples (usedin the Monte Carlo tests), and the lines represent theworked record estimates of mean daily concentration.
(b)
TABLE 1. Coefficients of Variation of Instantaneous Load,for the Data Sets Used in the Monte Carlo Test.
C.V.(percent)
1985 1986
Nitrate-N 103 114
Soluble Reactive P 082 176
Particulate P 119 409
Total P 086 379
Suspended Sediment 251 383

defined time interval, and the result adjusted using afactor that incorporates the ratio of the covariance ofload with discharge to the variance of discharge. TheBRE was chosen for this study because it has beenused successfully to estimate total phosphorus loadsin other areas.
The equation used from Cohn (1995) is
where
Q–
= the average water discharge during the de- fined time period;
Li = the instantaneous load QiCi
N = the number of samples in the defined time period
The Stratified Beale’s Ratio Estimator (SBRE)Method
We stratified the data (a posteriori) according tothe four quartiles of mean daily discharge, calculatedthe load separately for each quartile, and summed theresults.
The Period Weighted Sample Method
In this method, the concentration in each two suc-cessive samples in the water year were averaged andthe mean multiplied by the cumulative dischargebetween sampling times. Discharge was taken from
the USGS record of mean daily discharge, subdividedfor days on which one or more samples were taken.The resulting increments of load were then summedover each of the water years.
The Rating Curve Method
The log of instantaneous concentration (log Ci) wasregressed against log of instantaneous discharge (logQi). For each day in the water year, mean daily dis-charge was then used to estimate mean daily concen-tration, according to the equation:
Cd = k·10a · Qdb · e2.65·MSE
where Cd is the mean daily concentration; k is a unitcorrection factor; a is the regression constant; b is theregression coefficient; and MSE is the mean squareerror from the regression of log Ci vs. log Qi.
This is essentially the method used by the TahoeResearch Group to calculate total constituent loads inbasin streams, except that the regression they use islog(QiCi) vs. log Qi. The factor e2.65MSE is a correctionfactor for retransformation bias (Ferguson, 1986).
Using the 200 total load estimates for each method,year and sample size, we calculated means, standarddeviations, and expressions for bias and imprecision.Bias for a method is defined as the deviation of themean of load estimates from the worked record esti-mate (as percent of the latter); imprecision is definedas the Coefficient of Variation of a method (standarddeviation as percent of method mean). We also calcu-lated the standard deviations as percent of theworked record estimates.
A useful statistic for expressing both the bias andimprecision of an estimate is the root mean squareerror (RMSE), defined as
where B is the deviation from the worked record esti-mate, and S is the standard deviation of the sample(Dolan et al., 1981). This statistic was calculated forall constituents, methods and sample sizes.
RESULTS
Table 2 shows the results of the Monte Carlo exper-iment for n = 40, a somewhat larger sample size thanpresently used by the LTIMP. The standard deviationfor each set of 200 load calculations is shown as both
JAWRA 724 JOURNAL OF THE AMERICAN WATER RESOURCES ASSOCIATION
Coats, Liu, and Goldman
L QLQ
S
N L QS
N Q
LQ
Q= ⋅ ⋅
+⋅ ⋅
+⋅
*
*
* *
*
1
12
2
(2)
LN
L
QN
Q
SN
Q Q L L
SN
Q Q
iiN
iiN
LQ iiN
i
Q iiN
*
*
* *
* ;
=
=
=−
−( ) ⋅ −( )
=−
−( )
=
=
=
=
∑
∑
∑
∑
1
1
11
11
1
1
1
1
22 and
(3)
RMSE B S= +2 2 (4)

percent of the method mean (Coefficient of Variation)and as percent of the worked record estimate. Thebias for each method is shown as the departure of themean for each set of load calculations from theworked record estimate (as percent of the latter).Table 2 also shows the RMSE for each constituentand method, combining the effect of both bias andimprecision. Table 3 summarizes the regressionresults for the rating curve method, for n = 40.
For nitrate-nitrogen, the Period Weighted Sample(PWS) method is clearly superior to the other meth-ods, both in its precision and lack of bias. For 1985,the SBRE was less biased than the BRE, but for 1986,it was more biased. The Rating Curve (RC) methodwas biased and imprecise in both years, with higher
RMSE than the BRE or SBRE. Note that in 1986 (thewet year), only 66.5 percent of the nitrate-N regres-sions were significant at the 95 percent level, with anaverage R2 of 0.14 (Table 3).
For SRP, all of the methods appeared to work rea-sonably well in 1985, but the Beale’s Ratio Estimatorswere highly biased (on the high side) in 1986. ThePWS method performed about the same as the ratingcurve method in terms of precision, but was superiorin terms of bias. Note in Table 3, however, that therating curve regressions for SRP were mostly insignif-icant.
For TP, the PWS was the least biased of the meth-ods in 1985, but slightly less precise than the othermethods. The RC estimates in 1985, however, are
JOURNAL OF THE AMERICAN WATER RESOURCES ASSOCIATION 725 JAWRA
A Monte Carlo Test of Load Calculation Methods, Lake Tahoe Basin, California-Nevada
TABLE 2. Imprecision and Bias of Four Load Calculation Methods, From a Monte Carlo Test of 40 Samples Drawn200 Times With Replacement From Water Quality Data Sets of 89 Samples (1985) and 136 Samples (1986).
1985 1986S.D. as S.D. as Bias as RMSE as S.D. as S.D. as Bias as RMSE as
Percent Percent Percent Percent Percent Percent Percent PercentMethod Worked Worked Worked Method Worked Worked WorkedMean Record Record Record Mean Record Record Record
Nitrate-N
BRE 9.5 11.9 25.0 27.7 8.0 8.9 12.0 15.0SBRE 8.8 9.9 11.3 15.4 8.6 10.2 18.3 20.9PWS 4.3 4.2 -2.3 4.8 8.3 8.3 -0.6 8.3RC 10.8 14.4 33.3 36.3 12.6 14.7 16.4 22.0
Soluble Reactive P
BRE 5.5 5.7 3.0 6.4 9.5 11.6 21.8 24.7SBRE 5.1 5.4 4.6 7.0 7.7 9.2 19.3 21.4PWS 5.1 5.2 1.3 5.3 5.5 5.7 3.0 6.5RC 4.8 5.2 8.7 10.2 6.0 6.5 7.1 9.6
Particulate P
BRE 11.1 16.8 51.8 54.4 48.6 161 231 282SBRE 10.5 13.8 31.2 34.1 47.2 132 178 222PWS 14.1 15.1 7.3 16.8 48.9 56.2 14.9 58.1RC 10.3 12.5 21.3 24.7 23.5 19.4 -17.6 26.2
Total P
BRE 7.2 8.6 20.4 22.1 43.6 138 216 256SBRE 6.7 8.1 19.8 21.4 40.9 112 174 207PWS 7.4 8.0 8.7 11.9 38.6 48.6 26.0 88.1RC 6.8 8.3 21.5 23.0 22.8 24.2 7.5 25.6
Suspended Sediment
BRE 30.0 74.3 150 168 43.4 149 244 286SBRE 29.1 61.0 109 125 42.3 121 186 222PWS 23.5 28.3 20.2 34.8 43.5 53.8 23.6 58.8RC 21.4 33.3 55.3 64.6 22.8 22.2 -3.1 22.4
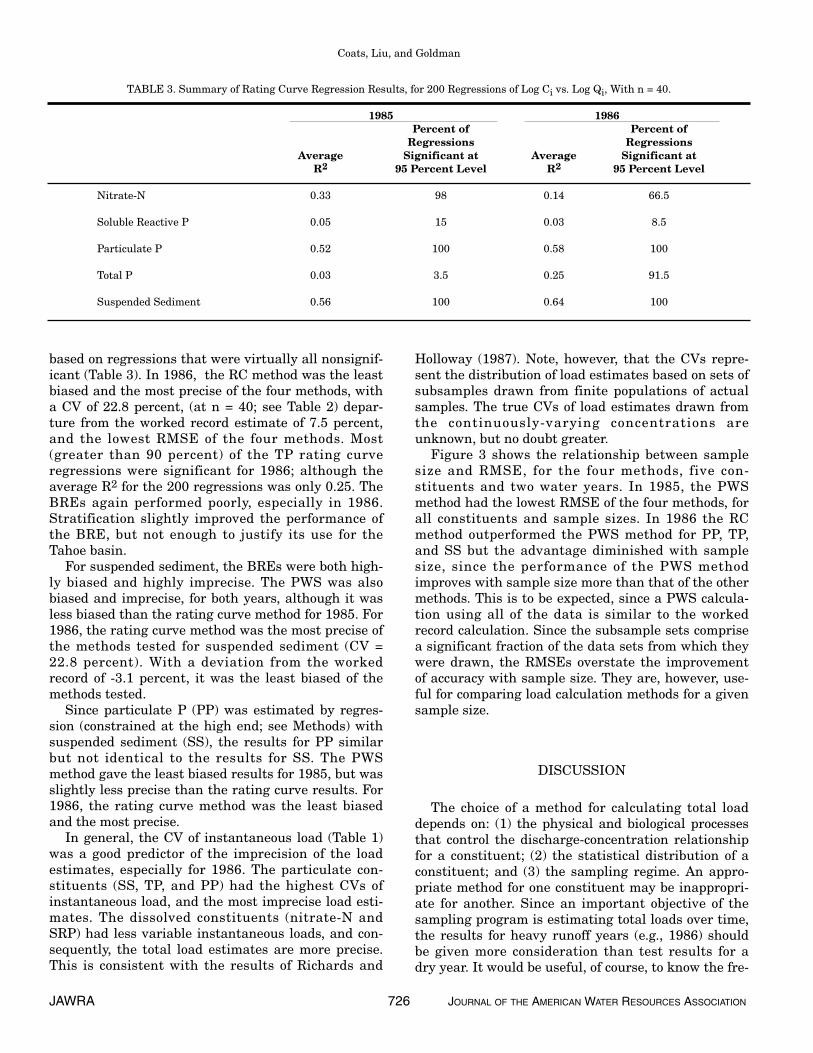
based on regressions that were virtually all nonsignif-icant (Table 3). In 1986, the RC method was the leastbiased and the most precise of the four methods, witha CV of 22.8 percent, (at n = 40; see Table 2) depar-ture from the worked record estimate of 7.5 percent,and the lowest RMSE of the four methods. Most(greater than 90 percent) of the TP rating curveregressions were significant for 1986; although theaverage R2 for the 200 regressions was only 0.25. TheBREs again performed poorly, especially in 1986.Stratification slightly improved the performance ofthe BRE, but not enough to justify its use for theTahoe basin.
For suspended sediment, the BREs were both high-ly biased and highly imprecise. The PWS was alsobiased and imprecise, for both years, although it wasless biased than the rating curve method for 1985. For1986, the rating curve method was the most precise ofthe methods tested for suspended sediment (CV =22.8 percent). With a deviation from the workedrecord of -3.1 percent, it was the least biased of themethods tested.
Since particulate P (PP) was estimated by regres-sion (constrained at the high end; see Methods) withsuspended sediment (SS), the results for PP similarbut not identical to the results for SS. The PWSmethod gave the least biased results for 1985, but wasslightly less precise than the rating curve results. For1986, the rating curve method was the least biasedand the most precise.
In general, the CV of instantaneous load (Table 1)was a good predictor of the imprecision of the loadestimates, especially for 1986. The particulate con-stituents (SS, TP, and PP) had the highest CVs ofinstantaneous load, and the most imprecise load esti-mates. The dissolved constituents (nitrate-N andSRP) had less variable instantaneous loads, and con-sequently, the total load estimates are more precise.This is consistent with the results of Richards and
Holloway (1987). Note, however, that the CVs repre-sent the distribution of load estimates based on sets ofsubsamples drawn from finite populations of actualsamples. The true CVs of load estimates drawn fromthe continuously-varying concentrations areunknown, but no doubt greater.
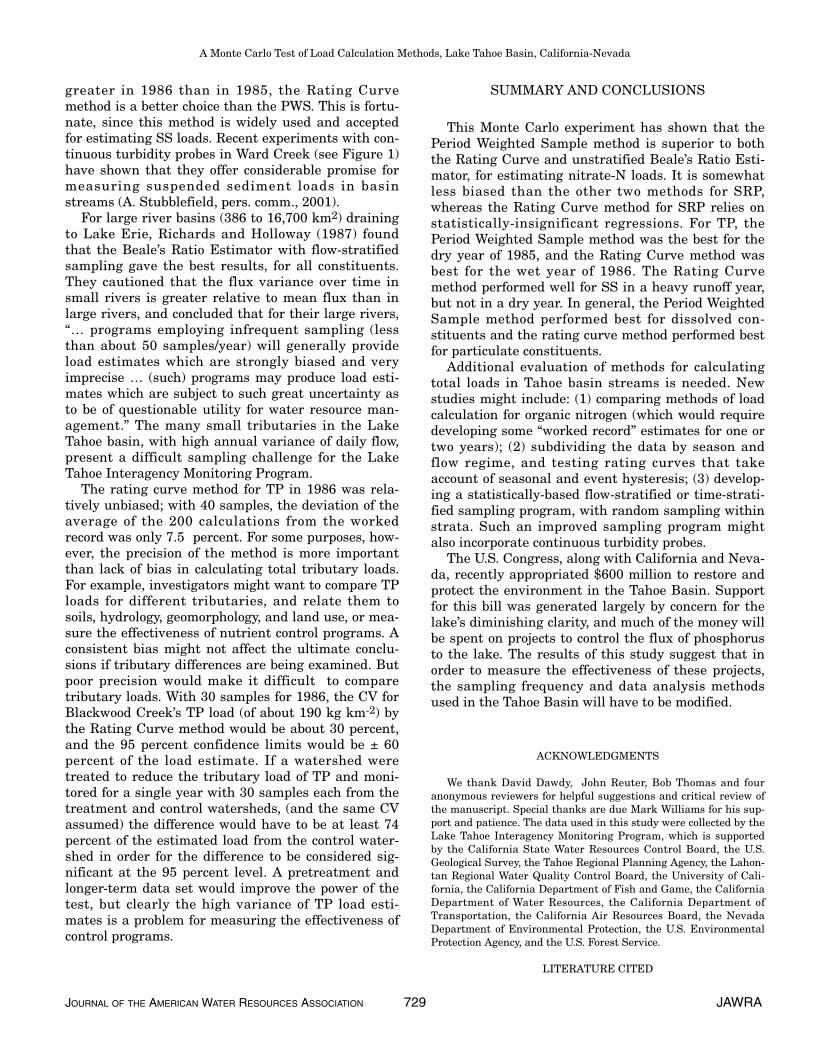
Figure 3 shows the relationship between samplesize and RMSE, for the four methods, five con-stituents and two water years. In 1985, the PWSmethod had the lowest RMSE of the four methods, forall constituents and sample sizes. In 1986 the RCmethod outperformed the PWS method for PP, TP,and SS but the advantage diminished with samplesize, since the performance of the PWS methodimproves with sample size more than that of the othermethods. This is to be expected, since a PWS calcula-tion using all of the data is similar to the workedrecord calculation. Since the subsample sets comprisea significant fraction of the data sets from which theywere drawn, the RMSEs overstate the improvementof accuracy with sample size. They are, however, use-ful for comparing load calculation methods for a givensample size.
DISCUSSION
The choice of a method for calculating total loaddepends on: (1) the physical and biological processesthat control the discharge-concentration relationshipfor a constituent; (2) the statistical distribution of aconstituent; and (3) the sampling regime. An appro-priate method for one constituent may be inappropri-ate for another. Since an important objective of thesampling program is estimating total loads over time,the results for heavy runoff years (e.g., 1986) shouldbe given more consideration than test results for adry year. It would be useful, of course, to know the fre-
JAWRA 726 JOURNAL OF THE AMERICAN WATER RESOURCES ASSOCIATION
Coats, Liu, and Goldman
TABLE 3. Summary of Rating Curve Regression Results, for 200 Regressions of Log Ci vs. Log Qi, With n = 40.
1985 1986Percent of Percent of
Regressions RegressionsAverage Significant at Average Significant at
R2 95 Percent Level R2 95 Percent Level
Nitrate-N 0.33 98 0.14 66.5
Soluble Reactive P 0.05 15 0.03 8.5
Particulate P 0.52 100 0.58 100
Total P 0.03 3.5 0.25 91.5
Suspended Sediment 0.56 100 0.64 100

JOURNAL OF THE AMERICAN WATER RESOURCES ASSOCIATION 727 JAWRA
A Monte Carlo Test of Load Calculation Methods, Lake Tahoe Basin, California-Nevada
Figure 3. Relationships Between Sample Size and Root Mean Square Error for Total Phosphorus, Particulate Phosphorus,Suspended Sediment, Soluble Reactive Phosphorus, and Nitrate-Nitrogen. ◆ Rating Curve; ■ Period-Weighted Sample;
▲ Beale’s Ratio Estimator; and ● Stratified Beale’s Ratio Estimator.

quency of the annual runoff that accounts for most ofthe load in the long run, and compare methods forsuch a year.
Nitrate-nitrogen concentrations in basin streamsare influenced by microbial release, plant uptake (inboth the terrestrial and lotic systems), precipitationand snowmelt input, and washout during winter rain-storms and early snowmelt (Coats and Goldman,2001). The discharge-concentration relationship inbasin streams typically shifts from fall to late spring.The sampling program is designed to sample highflows more intensively than low flows, but there is noassurance that sampling frequency is proportional todischarge. Since high flows during the snowmeltrecession period are typically very low in nitrate-Nand are not sampled as intensively as the earlysnowmelt period, there is a possibility of bias towardhigh concentrations, and the Rating Curve resultsseem to reflect this. We recommend the PWS methodfor calculating nitrate-N loads. This conclusion is con-sistent with a comparison of the PWS with RC meth-ods on the basis of simulated daily nitrate-Nconcentration (Coats and Goldman, 2001).
Load estimates based on the PWS for basinstreams, however, have shown that nitrate-Naccounts for only 10 to 15 percent of the nitrogen load.Organic-N (about 55 percent of which is dissolved, onaverage), accounts for almost all of the rest; ammoni-um loads are negligible (Coats and Goldman, 2001). Itwould be useful to run a similar Monte Carlo test fororganic-N, but it was not measured effectively until1989. Like nitrate-N, however, it is strongly influ-enced by microbial release and wash-out during fallstorms and early snowmelt. In some basin streams,dissolved organic nitrogen (DON) increases again atlow-flow, probably due to periphyton growth anddecay. We consider the PWS method to be tentativelyappropriate for organic-N as well as nitrate-N, butsince organic-N has an important particulate compo-nent, the rating curve method may deserve more con-sideration.
Soluble reactive phosphorus (SRP) is strongly con-trolled by adsorption onto fine sediment particles,mostly oxides of Fe and Al (Froelich, 1988). Althoughthe sorption-desorption process is complex, it isapparently rapid enough that the SRP concentrationis virtually independent of discharge. Both the PWSand Rating Curve methods produced satisfactoryresults. Even the Beale’s Ratio Estimators were satis-factory for 1985, but not for 1986. Most of the ratingcurve regressions, however, were not statistically sig-nificant (Table 2). There is no theoretical justificationfor using the Rating Curve method for SRP, whichbases regression predictions on statistically-insignificant relationships. Of course, if Li is used asthe dependent variable and Qi as the independent
variable, the regressions will look better, but theresults – and lack of theoretical justification, in thecase of SRP – are the same. We recommend using thePWS method for SRP.
Our results for SRP contrast with those of Johnson(1979), who found a strong linear relationshipbetween discharge and SRP concentration in FallCreek, New York, with concentrations as high as 80µg/l. The linear rating curve was found in that case togive a better load estimate than averaging methodsusing sampling proportional to discharge or flowduration. The best estimate, however, was obtained bya multiple regression of concentration versus dis-charge (Q) and rate of change of discharge (dQ/dt).
In Tahoe basin streams, most of the total phospho-rus load is bound to particles, either by adsorption oras part of an organic particle or primary mineral. Thesize of the particles has a strong influence on the wayin which particulate phosphorus (PP) responds tochanges in discharge. Hatch et al. (1999) measuredPP separately for the sand fraction (greater than 0.63µm) and silt plus clay fraction (greater than 0.45 µm,less than 0.63 µm) during spring runoff in InclineCreek, on the northeast side of the Tahoe basin. Theyfound that the sand-sized PP was depleted during thedaily snowmelt flood, but that the silt plus clay PPconcentration increased with falling discharge, sug-gesting a groundwater (or shallow soil-water) source.Note that in Blackwood Creek, the TP and PP concen-tration fluctuated widely and rapidly, (Figure 2a)especially in 1986, when the CVs of instantaneousload were 379 and 409 percent, respectively.
Since primary productivity in the lake is apparent-ly phosphorus-limited, the choice of a method for esti-mating TP loads is important. For TP, the RMSE in1985 was lowest for the PWS method, and in 1986 forthe RC method. Based on these results, we recom-mend using the rating curve method for years inwhich the logCi versus logQi regression for TP is sta-tistically significant. For years in which it is not, thePWS method should be used.
Our results for TP contrast somewhat with those ofDolan et al. (1981). Using a similar Monte Carloapproach, those authors compared ratio estimatorand regression methods for estimating TP loads in alarge Michigan river basin with stable flow and largefertilizer inputs of phosphorus. They found that theSBRE (with two flow strata) was superior to theregression methods tested. They noted, however, thatthe ratio estimator methods “would probably not beappropriate for excessively variable streams in whichdaily flows vary by a factor of 100 or more.” We agree.
For suspended sediment (SS), the Rating Curvemethod was remarkably unbiased for 1986, but over-predicted by 55 percent for 1985. Since the estimatedSS loads were more than an order of magnitude
JAWRA 728 JOURNAL OF THE AMERICAN WATER RESOURCES ASSOCIATION
Coats, Liu, and Goldman
greater in 1986 than in 1985, the Rating Curvemethod is a better choice than the PWS. This is fortu-nate, since this method is widely used and acceptedfor estimating SS loads. Recent experiments with con-tinuous turbidity probes in Ward Creek (see Figure 1)have shown that they offer considerable promise formeasuring suspended sediment loads in basinstreams (A. Stubblefield, pers. comm., 2001).
For large river basins (386 to 16,700 km2) drainingto Lake Erie, Richards and Holloway (1987) foundthat the Beale’s Ratio Estimator with flow-stratifiedsampling gave the best results, for all constituents.They cautioned that the flux variance over time insmall rivers is greater relative to mean flux than inlarge rivers, and concluded that for their large rivers,“… programs employing infrequent sampling (lessthan about 50 samples/year) will generally provideload estimates which are strongly biased and veryimprecise … (such) programs may produce load esti-mates which are subject to such great uncertainty asto be of questionable utility for water resource man-agement.” The many small tributaries in the LakeTahoe basin, with high annual variance of daily flow,present a difficult sampling challenge for the LakeTahoe Interagency Monitoring Program.
The rating curve method for TP in 1986 was rela-tively unbiased; with 40 samples, the deviation of theaverage of the 200 calculations from the workedrecord was only 7.5 percent. For some purposes, how-ever, the precision of the method is more importantthan lack of bias in calculating total tributary loads.For example, investigators might want to compare TPloads for different tributaries, and relate them tosoils, hydrology, geomorphology, and land use, or mea-sure the effectiveness of nutrient control programs. Aconsistent bias might not affect the ultimate conclu-sions if tributary differences are being examined. Butpoor precision would make it difficult to comparetributary loads. With 30 samples for 1986, the CV forBlackwood Creek’s TP load (of about 190 kg km-2) bythe Rating Curve method would be about 30 percent,and the 95 percent confidence limits would be ± 60percent of the load estimate. If a watershed weretreated to reduce the tributary load of TP and moni-tored for a single year with 30 samples each from thetreatment and control watersheds, (and the same CVassumed) the difference would have to be at least 74percent of the estimated load from the control water-shed in order for the difference to be considered sig-nificant at the 95 percent level. A pretreatment andlonger-term data set would improve the power of thetest, but clearly the high variance of TP load esti-mates is a problem for measuring the effectiveness ofcontrol programs.
SUMMARY AND CONCLUSIONS
This Monte Carlo experiment has shown that thePeriod Weighted Sample method is superior to boththe Rating Curve and unstratified Beale’s Ratio Esti-mator, for estimating nitrate-N loads. It is somewhatless biased than the other two methods for SRP,whereas the Rating Curve method for SRP relies onstatistically-insignificant regressions. For TP, thePeriod Weighted Sample method was the best for thedry year of 1985, and the Rating Curve method wasbest for the wet year of 1986. The Rating Curvemethod performed well for SS in a heavy runoff year,but not in a dry year. In general, the Period WeightedSample method performed best for dissolved con-stituents and the rating curve method performed bestfor particulate constituents.
Additional evaluation of methods for calculatingtotal loads in Tahoe basin streams is needed. Newstudies might include: (1) comparing methods of loadcalculation for organic nitrogen (which would requiredeveloping some “worked record” estimates for one ortwo years); (2) subdividing the data by season andflow regime, and testing rating curves that takeaccount of seasonal and event hysteresis; (3) develop-ing a statistically-based flow-stratified or time-strati-fied sampling program, with random sampling withinstrata. Such an improved sampling program mightalso incorporate continuous turbidity probes.
The U.S. Congress, along with California and Neva-da, recently appropriated $600 million to restore andprotect the environment in the Tahoe Basin. Supportfor this bill was generated largely by concern for thelake’s diminishing clarity, and much of the money willbe spent on projects to control the flux of phosphorusto the lake. The results of this study suggest that inorder to measure the effectiveness of these projects,the sampling frequency and data analysis methodsused in the Tahoe Basin will have to be modified.
ACKNOWLEDGMENTS
We thank David Dawdy, John Reuter, Bob Thomas and fouranonymous reviewers for helpful suggestions and critical review ofthe manuscript. Special thanks are due Mark Williams for his sup-port and patience. The data used in this study were collected by theLake Tahoe Interagency Monitoring Program, which is supportedby the California State Water Resources Control Board, the U.S.Geological Survey, the Tahoe Regional Planning Agency, the Lahon-tan Regional Water Quality Control Board, the University of Cali-fornia, the California Department of Fish and Game, the CaliforniaDepartment of Water Resources, the California Department ofTransportation, the California Air Resources Board, the NevadaDepartment of Environmental Protection, the U.S. EnvironmentalProtection Agency, and the U.S. Forest Service.
LITERATURE CITED
JOURNAL OF THE AMERICAN WATER RESOURCES ASSOCIATION 729 JAWRA
A Monte Carlo Test of Load Calculation Methods, Lake Tahoe Basin, California-Nevada

Boughton, D. J., T. G. Rowe, K. K. Allander, and A. R. Robledo,1997. Stream and Ground-Water Monitoring Program, LakeTahoe Basin, Nevada and California. FS-100-97, U.S. GeologicalSurvey, Carson City, Nevada, 6 pp.
Byron, E. R., C. R. Goldman, and S. H. Hackley, 1989. Lake TahoeInteragency Monitoring Program Ninth Annual Report, WaterYear 1988. Tahoe Research Group Institute of Ecology. Univ. ofCalif. at Davis, Davis, California, 62 pp.
Chang, C. C. Y., J. S. Kuwabara, and S. P Pasilis, 1992. Phosphateand Iron Limitation of Phytoplankton Biomass in Lake Tahoe.Canadian Journal of Fisheries and Aquatic Sciences 49(6):1206-1215.
Coats, R. N. and C. R. Goldman, 2001. Patterns of Nitrogen Trans-port in Streams of the Lake Tahoe Basin, California-Nevada.Water Resources Research 37(2):405-416.
Cohn, T. A., 1995. Recent Advances in Statistical Methods for theEstimation of Sediment and Nutrient Transport in Rivers.Reviews of Geophysics, Supplement: 1117-1123.
Dann, M. S., J. A. Lynch, and E. S. Corbett, 1986. Comparison ofMethods for Estimating Sulfate Export From a Forested Water-shed. Journal of Environmental Quality 15(2):140-145.
Dolan, D. M., A. K. Yui, and R. D. Geist, 1981. Evaluation of RiverLoad Estimation Methods of Total Phosphorus. Journal of GreatLakes Research 7(3):207-214.
Ferguson, R. I., 1986. River Loads Underestimated by RatingCurves. Water Resources Research 22(1):74-76.
Ferguson, R. I., 1987. Accuracy and Precision of Methods for Esti-mating River Loads. Earth Surface Processes and Landforms12(1):95-104.
Froelich, P. N., 1988. Kinetic Control of Dissolved Phosphate inNatural Rivers and Estuaries: A Primer on the PhosphateBuffer Mechanism. Limnology and Oceanography 33:649-668.
Galat, D. L., 1990. Estimating Fluvial Mass Transport to Lakes andReservoirs: Avoiding Spurious Self-Correlations. Lake andReservoir Management 6(2):153-163.
Goldman, C. R., 2000. Baldi Lecture. Four Decades of Change inTwo Subalpine Lakes. Verhandlungen der Internationale Vere-inigung für Theoretische und Angewandte Limnologie 27:7-26.
Goldman, C. R., A. D. Jassby, and S. H. Hackley, 1993. Decadal,Interannual, and Seasonal Variability in Enrichment Bioassaysat Lake Tahoe, California-Nevada, USA. Canadian Journal ofFisheries and Aquatic Sciences 50:1489-1495.
Hatch, L. K., 1997. The Generation, Transport, and Fate of Phos-phorus in the Lake Tahoe Ecosystem. Ph.D. thesis, Univ. ofCalif., Davis, California, 212 pp.
Hatch, L. K., J. E. Reuter, and C. R. Goldman, 1999. Daily Phospho-rus Variation in a Mountain Stream. Water Resources Research35(12):3783-3791.
Hill, A. R., 1986. Stream Nitrate-N Loads in Relation to Variationsin Annual and Seasonal Runoff Regimes. Water Resources Bul-letin 22(5):829-839.
Jassby, A. D., C. R. Goldman, and J. E. Reuter, 1995. Long-TermChange in Lake Tahoe (California-Nevada, U.S.A.) and Its Rela-tion to Atmospheric Deposition of Algal Nutrients. Archive fürHydrobiologie 135:1-21.
Johnson, A. H., 1979. Estimating Solute Transport in StreamsFrom Grab Samples. Water Resources Research 15(5):1224-1228.
Likens, G. E., F. E. Bormann, R. S. Pierce, J. S. Eaton, and N. M.Johnson, 1977. Biogeochemistry of a Forested Ecosystem.Springer-Verlag, New York, New York, 159 pp.
Preston, S. D., V. J. Bierman, Jr., and S. E. Silliman, 1989. An Eval-uation of Methods for the Estimation of Tributary Mass Loads.Water Resources Research 25(6):1379-1389.
Reuter, J. E., C. R. Goldman, T. A. Cahill, S. S. Cliff, A. C. Heyvaert,
A. D. Jassby, S. Lindstrom, and D. M. Rizzo, 1999. An IntegratedWatershed Approach to Studying Ecosystem Health at LakeTahoe, California-Nevada, USA, International Congress onEcosystem Health, Sacramento, California (in press).
Richards, R. P. and J. Holloway, 1987. Monte Carlo Studies of Sam-pling Strategies for Estimating Tributary Loads. WaterResources Research 23(10):1939-1948.
Thomas, R. B., 1985. Estimating Total Suspended Sediment Yieldwith Probability Sampling. Water Resources Research21(9):1381-1388.
Thomas, R. B. and J. Lewis, 1993. A Comparison of Selection at ListTime and Time-Stratified Sampling for Estimating SuspendedSediment Loads. Water Resources Research 29(4):1247-1256.
JAWRA 730 JOURNAL OF THE AMERICAN WATER RESOURCES ASSOCIATION
Coats, Liu, and Goldman