a logistic regression of risk factors for disease ... · pdf filea logistic regression of risk...
TRANSCRIPT

Vol. 41: 65-76,2000 l DISEASES OF AQUATIC ORGANISMS Dis Aquat Org I Publlshed May 25
A logistic regression of risk factors for disease occurrence on Asian shrimp farms*
PingSun ~eung''**, Liem T. ran^, Arlo W. ~ a s t ~
'Department of Biosystems Engineering, University of Hawaii at Manoa. 3050 Maile Way, Honolulu, Hawaii 96822, USA 2Center for Integrated Regional Assessment, Pennsylvania State University. 513 Deike Building, University Park,
Pennsylvania 16803, USA
3Hawaii Institute of Marine Biology, University of Hawaii at Manoa. Coconut Island, Kaneohe. Hawaii 96744, USA
ABSTRACT: Serious shrimp-disease outbreaks have reduced shrimp production and slowed industry growth since 1991. This paper tests factors such as farm siting and design, and farm-management prac- tices for relationships with disease occurrence. Logistic regression is used to analyze farm-level data from 3951 shrimp farms in 13 Asian countries. Disease occurrence is modeled as a 0-1 variable where 1 = disease loss of 220% to any 1 crop, and 0 = losses of <20%. Logistic regression is performed for each of 3 levels of shrimp culture intensity, i.e. extensive, semi-intensive, and intensive. Attempts to apply logistic regression models to each country were not successful due to insufficient data for most coun- tries. Factors affecting disease occurrences were quite different for different farming intensities. Farms that had larger pond production areas, with larger number of farms discharging effluent into their water supply canals, and removed silt had greater disease occurrence. On the other hand, farms that practiced polyculture and took water from the sea through a canal had lower disease occurrence.
KEY WORDS: Shrimp disease . Logistic regresson
INTRODUCTION
Globally, the shrimp-farming industry enjoyed phe- nomenal growth during the 1980s, mainly due to tech- nological breakthroughs (such as hatchery seed and improved feed), high profit from farmed shrimp, and public support. Farmed shrimp production was 660200 metric tons (mt) in 1997, which was about 22 % of total world shrimp production. The eastern and western hemispheres produced 70 and 30% of farmed shrimp respectively. Thailand was the leading pro- ducer during 1997, followed by Ecuador, Indonesia, China, India, Bangladesh. Vietnam, Taiwan, and the Philippines. Black tiger shrimp Penaeus monodon was the most important species farmed in the eastern hemi- sphere, while the western white shrimp Penaeus van- nanlei dominated western hemisphere production (Rosenbery 1997).
'An earlier version of this paper was presented at the Fifth Asian Fisheries Forum, November 11-14, 1998. Chiangmai, Thailand. Senior authorship is not assigned
"E-mail: [email protected]
Diseases have emerged as a major constraint to shrimp-aquaculture sustainability. Serious outbreaks of shrimp diseases have occurred in most of the major producing countries. Especially since 1991, shrimp viral diseases have reduced production and slowed industry growth. Many diseases are linked to environ- mental deterioration and stress associated with shrimp- culture intensification. High profits from shrimp farm- ing and increasing coastal land prices pushed shrimp farmers towards more intensive operation (first in Taiwan followed by Thailand and other countries). Conditions associated with intensification included: in- creased farm densities in shrimp-culture areas, greatly increased feed and other inputs per unit of pond area, increased effluent waste loads, and increased disease occurrences resulting from various causes. Frequent disease outbreaks often resulted in widespread crop failures. Shrimp-culture industry collapses in Taiwan during 1988 and in China in 1993 are 2 dramatic exain- ples.
A solution to disease problenls will involve both pre- vention and cure. However, because treatment options for many shrimp diseases are either non-existent or
O Inter-Research 2000 Resale of full article not permittea
Dis Aquat Org 41. 65-76, 2000
ineffective, current emphasis is on prevention. Disease prevention now focuses on use of specific-pathogen- free (SPF) or specific-pathogen-resista.nt (SPR) seed stock, seed stock pre-screened for specific pathogens, appropriate site selection and farm design, and appli- cation of sustainable farm-management practices. While many of these practices have been widely adopted and are believed to be beneficial for disease prevention, few studies have documented these bene- fits.
To better understand disease problems faced by Asian shrimp culturists, a regional study was con- ducted during 1994 and 1995 by the ADB (Asian Development Bank) and NACA (Network of Aquacul- ture Centres in Asia-Pacific). This study was a result of a recommendaiion by a previous ADB/NACA rey iondl study (1990) which concluded that aquatic plant and animal diseases are closely linked to environmental issues. Specific objectives of the 1994 study were to assist governments in assessing policy options and in formulating policies to improve aquaculture sustain- ability. The study included in-depth surveys of 11 000 shrimp and carp farms in 16 Asian countries and terri- tories. The shrimp farm portion of the survey included 2898 extensive. 1022 semi-intensive, and 870 intensive farms.
The 1994 survey documented that shrimp disease caused significant monetary losses to shrimp farmers. Conservative estimates indicated $332.2 million per year total losses caused by shrimp diseases, including $143.3 million for intensive farms, $111.8 million for semi-intensive farms, and $77.1 million for extensive farms. All countries surveyed suffered in various degrees from shrimp disease problems. For example, the percentage of intensive farms affected by disease losses 220% of at least 1 crop ranged from 12% in Malaysia, to loo'%, in China. Semi-intensive and ex- tensive farms also reported significant disease losses (ADB/NACA 1996).
The ADB/NACA survey also found that virtually all countries reported 'unknown' as the main cause of shrimp diseases (a clear indication that shrimp dis- eases are poorly identified). Research and improved extension activities are needed to properly identify shrimp diseases, a necessary step leading to preven- tion and cure.
With the above in mind, we attempted to identify factors affecting shrimp disease occurrence through further analysis of the ADB/NACA farm survey data. We evaluated logistic-regression m.odels for predicting disease occurrence from a set of 31 variables, including site characteristics, farming systems, and farming prac- tices. Logistic regression was performed separately for extensive, semi-intensive, and intensive shrimp farms for all countries.
METHODOLOGY
The logistic regression model has emerged as the technique of choice for predicting dichotomous med- ical outcomes (Tu 1996). Recently, Johnson-Ifearulun- du & Kaneene (1998) used a logistic regression model to identify management practices that posed risk fac- tors for M. paratuberculosis infection of dairy herds in Michigan. While disease-prediction models are widely used to predict incidence of either pests or pathogens m the field for crop protection and disease of land ani- mals, application of disease prediction models in aqua- culture is non-existent.
Logistic regression. A dichotomous outcome, y (for example, y = 1 if disease loss 220 % of crop, or y = 0 if t20"-/oj1, hds d11 expected vdiue, E(y) , dssullleci iu be P (P = the probability that the outcome occurs). One can usually assume that P is related to a set of potential explanatory variables in the form:
where p. is the intercept, p,, ... , p, are the coefficients associated with each explanatory variable X,, . . . ,X, and e is an error term. Regressing y on X'S u.sing ordinary least squares will lead to 3 problems. First, e is obvi- ously not normally distributed as is generally assumed, and more importantly, estimated probabilities can lie outside the range (0 , l ) . Furthermore, the error vari- ance is not constant across levels of the xi's. However, one can assume that Pfollo~us a logistic distribution:
Rearranging terms, Eq. (2) can be expressed as:
where P/(1 - P) is the 'odds' of the outcome such as the occurrence of disease. It is clear from Eq. (3) that the logarithm of the odds, or simply log odds, is a linear function of the explanatory variables, X'S, as follows:
Since P is assumed to follow a logistic distribution, m.aximum-likelihood methods can be used to estimate the coefficients p,, . . . , p n . The logistic-regression pro- cedure in the SPSS package was used in this analysis (SPSS 1992).
Data and variables. Data for our analyses came from the 1994-1995 ADB/NACA farm survey mentioned previously. Of the 4855 shrimp farms surveyed by
'The NACA survey defined serious disease outbreaks as those causing more than 20':#, of stock loss in any one crop. This might underestimate the true total Impact of disease be- cause this definition excludes the long-term effects of dis- ease which may cause low-level losses and reduced harvests

Leung et al.. Disease occur^ -ence on Asian shrimp farms 67
ADB/NACA, we used only 3951 farms in our analyses due to incomplete observations, as well as observa- tions with large outliers with 904 farms. Of the 3951 farms analyzed, 779 farms were intensive, 910 were semi-intensive, and 2262 were extensive (Table 1). Thirty-one variables including 13 continuous and 18 nominal (categorical) variables describing the site, farming system and farming practice were used as potential factors in explaining disease occurrence. A list of the 31 variables is shown in Appendix 1, and summary statistics of these variables are presented in Appendix 2.
The choice of the 31 explanatory variables was based partly on existing theory and 'hunches' about explanations of shrimp disease occurrences. In gen- eral. 2 approaches can be found in the literature regarding the choice of variables to be included in a model (Hosmer & Lemeshow 1989). One approach is to include all scientifically relevant variables into the model and the other approach is to use a stepwise pro- cedure in which variables are selected either for inclu- sion in or removal from a model in a sequential manner based on statistical criteria only. Proponents of the stepwise procedure argue that the parsimonious model is generally more stable numerically and is more easily generalized. On the other hand, others, particularly econometricians, criticize the stepwise procedure as an admission of ignorance about the phenomenon being studied (Studenmund & Cassidy 1987). Menard (1995, p. 54) sums it up very nicely as follows: 'Without going too deeply into the arguments about the use of step- wise procedures, there appears to be general agree- ment that the use of computer-controlled stepwise pro- cedures to select variables is inappropriate for theory testing because it capitalizes on random variations in the data and produces results that tend to be idiosyn- cratic and difficult to replicate in any sample other than the sample in which they were originally ob- tained.'
It is well known in the econometric literature that pre-test estimators resulting from step-wise proce- dures yield worse estimators than least-squares esti- mators derived from an accurate prior specification (Charemza & Deadman 1997). Because the sample size is relatively large in our study, we chose to use the first approach by including all 31 variables for which we have data and which we believe might be relevant in our model estimations. Besides not running into pre- test bias as in stepwise procedures, this approach also provides complete control of confounding. However, the major problem with this approach is that of the pos- sibility of an overfitted model producing numerically unstable estimates with large standard errors. We will elaborate on this aspect in the results and discussion section below and also in Footnote 3 ('Results and dis-
Table 1. Sample distribution used in analyses by country and by culture intensity
Country Intensive Semi-intensive Extensive Total
Bangladesh 0 13 93 106 Cambodia 29 0 1 30 China 33 63 83 l79 India 6 142 734 882 Indonesia 147 353 884 1384 Korea 9 0 0 9 Malaysia 4 0 4 0 0 80 Myanmar 0 0 68 68 Philippines 3 1 101 113 24 5 Sri Lanka 35 124 17 l76 Taiwan 62 0 0 62 Thailand 387 0 2 389 Vietnam 0 74 267 34 1
Total 779 910 2262 3951
cussion'). Finally, the choice of approach in variable selection varies by disciplines and is usually driven by the analytic philosophy of the analysts and the prob- lems at hand.
RESULTS AND DISCUSSION
Logistic regression models were fitted for each level of shrimp culture intensity (using all 31 variables described a b ~ v e ) . ~ The X' values of all 3 models are statistically significant (p = 0.0000), implying that the fitted models (containing the constant and the explanatory variables) fit the data quite well. In other words, there is a significant relationship between the log of odds of a disease occurrence with the explana- tory variables.
Table 2 shows the estimated ps for the logistic regressions and their significance levels (p- value^).^
'We have also fitted a model combining all farms and with an additional variable representing culture intensity. However, it became apparent from resulting statistical analyses that factors affecting shrimp disease occurrence as well as their levels vary with different culture intensity. Thus, such a for- mulation is not deemed appropriate and we decided to fit separate models for each culture intensity
3Given the insignificance of some important variables, collinearity checks among explanatory variables were con- ducted. While presence of multicollinearity does not affect the unbiasedness of the estimates, high collinearity may cause the estimates to be extremely imprecise and unstable (Greene 1990). Bivariate correlation and variance inflation factors among the explanatory variables indicated that there is no serious multicollinearity. This is also supported by the robustness of the estimates from both forward and backward stepwise estimations. These led us to believe that no strong presence of multicollinearity exists in the sample

Dis Aquat Org 41: 65-76, 2000
Table 2. Fitted logistic-regression models for intensive, semi-intensive and extensive shrimp farms, all countries combined. Level of significance (p-value) was also presented for each nominal variable as a group
Variable Intensive Semi-intensive B P B P pExtensive P
Site characteristics 1. No. of years of shrimp farming at site 0.04 0.01 -0.004 0.84 -0.03 0.00
2. Inter-tidal zone (mangrove land as base) 0.00 0.05 0.00 Wetland -0.04 0.91 0.77 0.03 - 1.69 0.00 Salt pan 1.03 0.02 1.03 0.04 -0.47 0.19 Other 0.90 0.00 0.19 0.49 -1.15 0.00
3. Supra-tidal zone (mangrove land as base) 0.00 0.27 0.00 Rice farming 0.46 0.17 0.01 0.99 -1.04 0.01 Coconut -0.74 0.08 1 .OO 0.12 -6.38 0.21 Upland crops 0.05 0.95 1.05 0.15 -0.92 0.07 Other -0.03 0.93 0.46 0.28 0.36 0.30
4. Soil (clay soil as base) 0.30 0.00 0.00 Acid-sulphate soil 0.61 0.07 0.05 -0.04 0.91 Sandy soils 0.42 0.12 0.00 -0.02 0.90 PeaVorganic rich soil 0.02 0.96 0.53 -0.85 0.11 Loam sod 0.38 0.13 0.24 -0.45 0.01 Other -0.03 0.94 0.00 1.11 0.00
5. Farm operator (owner operator as base) 0.35 0.01 0.07 Cooperative -0.53 0.28 0.07 -0.19 0.71 Lesseekenant 0.15 0 55 0.71 0.23 0.34 Share/contract farmer 0 . 7 0 0.14 0.07 0.85 0.04 Manager -0.32 0.36 0.00 -0.84 0.08
6 Area of production ponds 0.004 0.81 0.01 0.03 0.00
7. Salt/brackish water (saltwater creek as base) 0.00 0.00 0.00 Estuary/river 0.28 0.41 0.10 -0.76 0.00 Direct from sea 1.03 0.00 0.49 -0.13 0.71 Canal from sea -0.52 0.04 0.00 0.05 0.75 Other -6.78 0 45 0.61 -1.18 0.00
8. Wet-season salinity of intake water -0.05 0.80 0.29 0.30 0.04
9. Dry-season salinity of intake water -0.28 0.17 0.37 -0.07 0.64
10. No. of farms within 3 km -0.01 0.05 0.19 -0.0002 0.74
11. No. of farms share water supply 0.003 0.58 0.05 -0.01 0.10
12. No. of farms discharge effluent into water 0.003 0.50 0.01 0.02 0.00 supply canal
13. Measures taken to reduce env~ronmental lrnpacts -0.13 0.07 -0.08 0.37
These estimated coefficients (bs) reflect the effects of could be told if the lmplied change across the range of corresponding explanatory variables on the log odds of values of the risk factor is relatively large. Had we a disease occurrence. A negative coefficient indicates been able to confirm that our coding met the underly- a positive (decreased) effect on disease occurrence (i.e. ing assumptions, the interpretation would have been, an increase in the level of that variable will reduce dis- for example, with intensive shrimp culture, for each ease occurrence, ceteris paribus). Conversely, a posi- additional year shrimp farming occurs at the same site, tive coefficient suggests that an increase in the corre- the log odds of disease occurrence increases by 0.04. sponding variable will increase disease occurrence (aqain qiven that all other variables remain the same). . v - Because we cannot confirm that the linearity assump- 4As pointed out by one reviewer, the log odds is assumed to be
is m e t 4 , our odds ratios for continuous' variables linear across the observed ranges of the continuous variables in our formulation. We dld not test this assumption because of
not be interpreted literally' Rather' they can be the exploratory nature of this analysis and the fact that with used to tell the direction of the association and perhaps the larae number of continuous variables the testinq and the
v
to see if the association is likely to be strong. This latter subsequent remedies can become exceedingly tedious
Leung et al.: Disease occurrence on Asian shrimp farms 69
Table 2 (continued)
Variable B Intensive
Semi-intensive P rr P II Izxtensive P
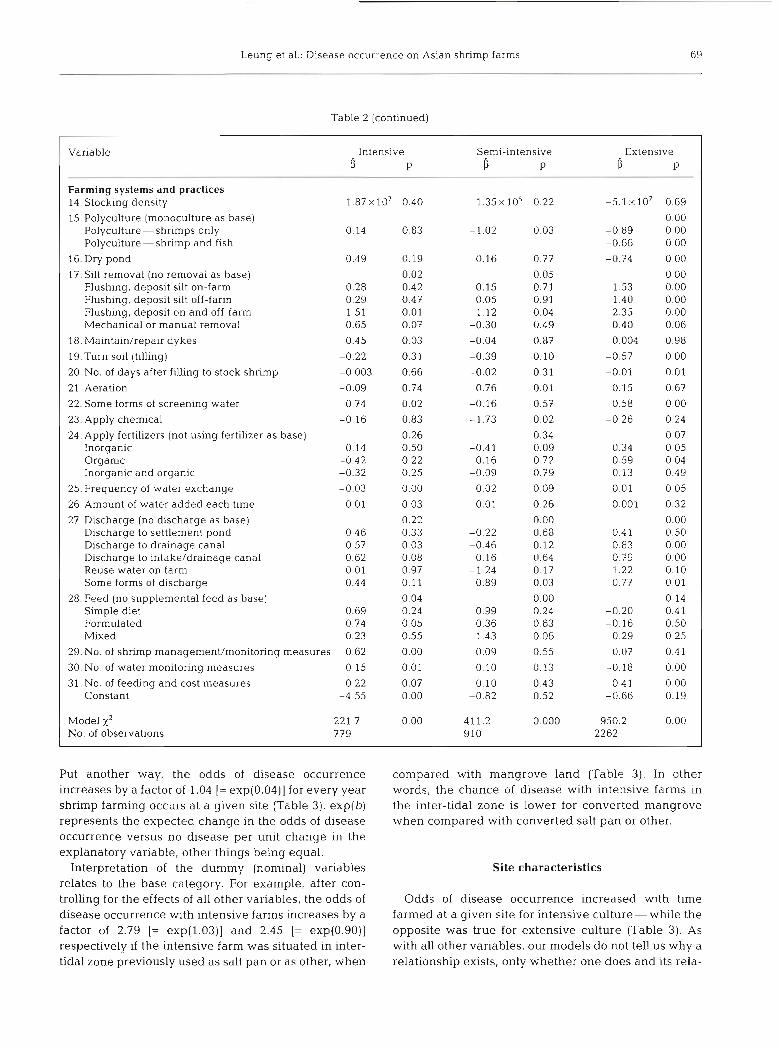
Farming systems and practices 14. Stocking density 1.87 X 10' 0.40 1.35 X 10".2? -5.1 X 10' 0.69
15. Polyculture (monoculture as base) 0.00 Polyculture - shrimps only 0.14 0.83 1 . 0 2 0.03 -0.89 0.00 Polyculture - shrimp and fish 0 . 6 6 0.00
16. Dry pond 0.49 0.19 0.16 0.77 -0.74 0.00
17. Silt removal (no removal as base) 0.02 0.05 0.00 Flushing, deposit silt on-farm 0.28 0.42 0.15 0.71 1.53 0.00 Flushing, deposit silt off-farm 0.29 0.47 0.05 0.91 1.40 0.00 Flushing, deposit on and off-farm 1.51 0.01 1.12 0.04 2.35 0.00 Mechanical or manual removal 0.65 0.07 -0.30 0.49 0 40 0.06
18. Maintaidrepair dykes 0.45 0.03 -0.04 0.87 0.004 0.98
19. Turn soil (tilling) -0.22 0.31 -0.39 0.10 -0.57 0.00
20. No. of days after filling to stock shnrnp -0.003 0.66 -0.02 0.31 -0.01 0.01
21. Aeration -0.09 0.74 0.76 0.01 0.15 0.67
22. Some forms of screening water 0.74 0.02 -0.16 0.57 0.58 0.00
23. Apply chemical -0.16 0.83 -1.73 0.02 -0.26 0.24
24. Apply fertilizers (not using fertilizer as base) 0.26 0.34 0.07 Inorganic 0.14 0.50 -0.41 0.09 0.34 0.05 Organic -0.42 0.22 0.16 0.72 0.59 0.04 Inorganic and organic -0.32 0.25 -0.09 0.79 0.13 0.49
25. Frequency of water exchange -0.03 0.00 0.02 0.09 0.01 0.05
26. Amount of water added each time -0.01 0.03 0.01 0.26 0.001 0.32
27. Discharge (no discharge as base) 0.22 0.00 0.00 Discharge to settlement pond 0.46 0.33 -0.22 0.68 0.4 1 0.50 Discharge to drainage canal 0.57 0.03 -0.46 0.12 0.83 0.00 Discharge to intake/drainage canal 0.62 0.08 0.16 0.64 0.79 0.00 Reuse water on farm 0.01 0.97 -1.24 0. l 7 1.22 0.10 Some forms of discharge 0.44 0.11 0.89 0.03 0.77 0.01
28. Feed (no supplemental feed as base) 0.04 0.00 0.14 Simple diet 0.69 0.24 0.99 0.24 -0.20 0.41 Formulated 0.74 0.05 0.36 0.63 -0.16 0.50 Mixed 0.23 0.55 1.43 0.06 0.29 0.25
29. No. of shrimp management/monitoring measures 0.62 0.00 0.09 0.55 0.07 0.41
30. No. of water monitoring measures 0.15 0.01 0.10 0.13 -0.18 0.00
31. No. of feeding and cost measures -0.22 0.07 0.10 0.43 0.4 1 0.00 Constant -4.55 0.00 -0.82 0.52 -0.66 0.19
Model x2 221 .7 0 00 411.2 0.000 950.2 0.00 No. of observations 779 910 2262
Put another way, the odds of disease occurrence increases by a factor of 1.04 [= exp(0.04)] for every year shrimp farming occurs at a given site (Table 3). exp(b) represents the expected change in the odds of disease occurrence versus no disease per unit change in the explanatory variable, other things being equal.
Interpretation of the dummy (nominal) variables relates to the base category. For example, after con- trolling for the effects of all other variables, the odds of disease occurrence with intensive farms increases by a factor of 2.79 [= exp(l.03)] and 2.45 [= exp(0.90)] respectively if the intensive farm was situated in inter- tidal zone previously used as salt pan or as other, when
compared with mangrove land (Table 3). In other words, the chance of disease with intensive farms in the inter-tidal zone is lower for converted mangrove when compared with converted salt pan or other.
Site characteristics
Odds of disease occurrence increased with time farmed at a given site for intensive culture - while the opposite was true for extensive culture (Table 3). As with all other variables, our models do not tell us why a relationship exists, only whether one does and its rela-

Dis Aquat Org 41: 65-76, 2000
Table 3. Factors with significant positive (less disease; odds ratio <1.0) and negative (greater disease; odds ratio >1.0) effects on disease occurrences (only values significant at the 5 % are shown). Values for the individual items of each nominal variable are
not shown if the significance level for the nominal variable as a group is not significant at the 5 % level
Vanable Intensive Semi-intensive Extensive
Site characteristics 1. No. of years of shrimp farming at site
2. Inter-tldal zone (mangrove land as base) Wetland Salt pan Other
1 3. Supra-tidal zone (mangrove land as base) Rice farming Coconut Upland crops Other
4. Soil (clay soil as base) Acid-sulphate soil Sandy soils Peat/organic nch soil Loam soil Other
5. Farm operator (owner operator as base) Cooperative Lessee/tenant Share/contract farmer
I Manager
1 6. Area of production ponds
1 7 Salt/brackish water (saltwater creek as base) Estuarylriver Direct from sea Canal from sea Other
8. Wet-season salinity of intake water
9. Dry-season salinity of intake water
10. No. of farms within 3 km
11. No. of farms share water supply
12. No. of farms discharge effluent into water supply canal
13. Measures taken to reduce environmental impacts
tive magnitude and direction of impact on disease. Per- haps old, intensive farms were more susceptible to dis- ease because they were built in areas where shrimp farms already existed.
While converted mangrove in the inter-tidal zone had lower odds of disease occurrence compared to other previous land use for intensive and semi-inten- sive farms, the reverse was true for extensive farms.
For intensive and semi-intensive farms situated in supra-tidal zone, prior land use did not seem to affect disease occurrence (Table 3). For extensive farms, odds were lower for farms that were previously used for rice farming and upland crops, compared to con- verted mangrove.
No overall pattern can be discerned for soil types versus disease occurrence; although of 15 soil compar-
isons with clay as the base, only one showed less chance of disease compared with clay. This indicated that, overall, clay may be a desirable soil type.
There was no difference in odds of disease occur- rence with different types of operators for intensive farms (Table 3). With semi-intensive and extensive farms, manager had lower odds of disease compared with owner operator, while lesseehenant (semi-inten- sive) or share/contract farmer (extensive) had higher odds.
Farms with larger total pond production areas had greater chance of disease with semi-intensive and extensive cultures (Table 3).
Intensive and semi-intensive farms that took salt and brackish water through a canal from the sea tended to have lower odds of disease. Extensive farms that took

Leung et al.: Disease occurrence on Asian shrimp farms 7 1
Table 3 (continued)
Variable Intensive Semi-intensive Extensive -p-
Farming systems and practices 14. Stocking density - - - 15. Polyculture (monoculture as base)
Polyculture-shrimps only - 0.36 0.41 Polyculture - shrimp and fish - - 0.52
16. Dry pond - 0.48
17. Silt removal (no removal as base) - - Flushing, deposit sdt on-farm - 4.60 Flushing, deposit silt off-farm - - 4.07 Flushing, deposit on and off-farm 4.52 3.06 10.53 Mechanical or manual removal p - -
18. Maintaidrepair dykes 1 .S? - - 19.Turn soil (tilling) - 0.57
20. No.of days after filling to stock shrimp P - 0.99
21. Aeration 2.13 - 22. Some forms of screening water 2.09 1.78
23. Apply chemical - 0.18 - 24. Apply fertilizers (not using fertilizer as base)
Inorganic - - Organic - 1.80 Inorganic and organic - -
25. Frequency of water exchange 0.97 1.01
26. Amount of water added each tinle 0.99
27. Discharge (no discharge as base) Discharge to settlement pond - - - Discharge to drainage canal - - 2.29 Discharge to intake/drainage canal - - 2.20 Reuse water on farm - - - Some forms of discharge - 2.15
28. Feed (no supplemental feed as base) Simple diet - - - Formulated 2 11 - Mixed - -
29. No. of shrimp management/monitoring measures 1.85 - - 30. No. of water monitonng measures 1 1 6 - 0.83
31. No. of feeding and cost measures 0 80 P 1 .SO
water from estuaryhver and other sources tended to have lower odds of disease.
Intake-water salinity during both the wet and dry seasons showed no association with disease for all cul- ture intensities (Table 3). (The salinity variable as used here is a dummy variable which takes on a value of 1 if salinity is between 5 to 35 ppt [generally considered to be the desirable range] and 0 for salinity outside this range.)
We expected that farm density would increase odds of disease occurrence. However, the number of farms within 3 km did not show any effect for semi-intensive and extensive, and a positive effect for intensive farms (Table 3). In other words, for intensive operations, more farms within the vicinity can lead to less disease occurrence. Similarly, one might expect that more
farms sharing a given water supply might lead to higher disease occurrence. However, this did not appear so. On the other hand (as we expected), the number of farms discharging effluent into a common water supply canal led to higher odds of disease occur- rence for both semi-intensive and extensive farms.
Finally, semi-intensive farms that took more mea- sures during design and planning to reduce impacts on the adjacent environment had lower odds of disease but these measures had no effect on intensive and extensive farms (Table 3). These measures include en- vironmental-impact assessment, site selection to avoid impacts on other users, site selection to avoid impacts of other users, design of separate water supply/drai- nage system, retention of mangrove buffer zone, and use of an effluent treatment pond.
Dis Aquat Org 41: 65-76, 2000
Farming systems and practices
Stocking densities within each farm type did not have sigmficant associations with dsease occurrence (Table 3). However, polyculture in semi-intensive and extensive cultures was protective.
Pond preparation and water management. Extensive farms that dried pond soils between crops were found to be less prone to disease, while pond drying had no effect on disease with intensive and semi-intensive culture (Table 3).
The association of silt removal with disease was one of the most revealing analyses: in no cases was silt removal beneficial (Table 3). This finding suggests several possi- ble relationships. First, silt removal either exposes dis- ease-probuciny secliments, or perhaps newiy exposed sediments somehow stress shrimp (thus leading to dis- ease problems). Second, farms located in areas with low sediment loads in source waters have less disease po- tential~.
Contrary to our expectation, intensive farms that main- tainedhepaired dykes had greater odds of disease (Table 3).
As expected, extensive farms that turned soil between crops showed lower odds of disease (Table 3) , presum- ably due to the sterilization of soils by UV light. The longer extensive farmers waited to stock shrimp after fill- ing the pond, the lower the odds of disease. Contrary to our expectation, aeration increased odds of disease oc- currence in semi-intensive operations, while some form of screening influent waters increased disease occur- rence with intensive and extensive operations. Perhaps what we observed with aeration and screening were the results of disease, rather than the cause. Farms with dis- ease problems might be more likely to use aerators, in- take screens, and/or other remediations compared with farms without disease problems.
Semi-intensive farms which applied chemicals had lower odds of disease compared with no chemical appli- cations. Again, chemical applications might have been a response to disease problems by the farmers. Fertilizer application with extensive farms increased the odds of disease compared to no fertilizer application. Perhaps fertilizers were more likely used in ponds with water quality problems related to inability to establish healthy algal blooms.
Although water exchange frequency during the last month of crop growout might lower odds of disease with intensive culture, the reverse was found with semi-intensive and extensive culture. Similarly, al- though amount of water added during each water exchange might lower the odds with intensive culture, no association was found with extensive culture. As with sediment removal, the nature of water discharge had only negative or no association with disease com-
pared with the no-discharge option (Table 3). These relationships suggest that disease organisms are per- haps recycled or transferred between farms more readily when farms discharge more. This suggests that use of SPF or SPR shrimp coupled with minimal dis- charge may reduce disease.
Feed. Intensive farms that used only formulated diet had greater odds of disease compared to farms with no supplementary feed. However, supplemental feeding in any form did not increase the odds of disease with semi-intensive and extensive farms.
Regular management activities. Most shrimp-culture practitioners might assume that increased management activities on a farm ~vould decrease the chance of dis- ease occurrence. Shrimp management and monitoring inciuded regular mon~toring of stock survival, daily monitoring of shrimp behavior, and on-farm and off- farm shrimp-health checks. Pond water-quality moni- toring parameters included pH/alkalinity, salinity, dis- solved oxygen, nutrients (N and/or P), water color and turbidity, sediment condition, and quality of influent and effluent waters. Feeding and cost measures in- cluded use of feeding tray to check feed consumption, regular feed conversion ratio (FCR) calculations, and regular production/operating cost analyses. More shrimp-management and -monitoring measures, and more water-monitoring measures increased odds of dis- ease occurrence in intensive farms (Table 3). Farms with disease problems might have performed more of these measures in an effort to reduce disease problems. Thus, these measures may be a direct result of disease rather than a cause of disease. Also, contrary to expec- tation, more feeding and cost measures were associated with increased disease occurrence with extensive farms. However, more water-monitoring measures in exten- sive farms, and more feeding and cost measures in in- tensive farms were associated with reduced disease odds. None of these management activities seemed to affect disease occurrence in semi-intensive farms.
CONCLUDING REMARKS
Common factors associated with higher odds of dis- ease occurrence with at least 2 of the 3 levels of culture intensity were: silt removal between crops versus no removal; larger area of production ponds; and larger number of farms discharging pond effluents into water supply canals.
Common factors associated with lower odds of dis- ease occurrence for at least 2 of the 3 levels of culture intensity were: used polyculture; and took water from the sea through a canal versus from a saltwater creek.
While most disease-related factors identified here were perhaps intuitive, others were not so apparent. It
Leung et al.- Disease occurrence on Aslan shrimp farms
is also interesting to note that factors associated with disease occurrence were often different for the 3 levels of shrimp culture intensity. Logistic regression analy- ses as used herein can provide meaningful insights into causal relationships between shrimp disease prob- lems and shrimp culture practices. These analyses are unable to establish cause and effect relationships, but they are able to draw attention to certain culture prac-
tices which need further evaluation. Some of our find- ings could be artifacts of data collection techniques, interviewer or farmer biases, or the way questions were worded. However, we are convinced that most of the significant relationships that we identified have some underlying biological, physical or chemical basis, and that the nature of these relationships can be dis- covered through further analysis. Logistic regression
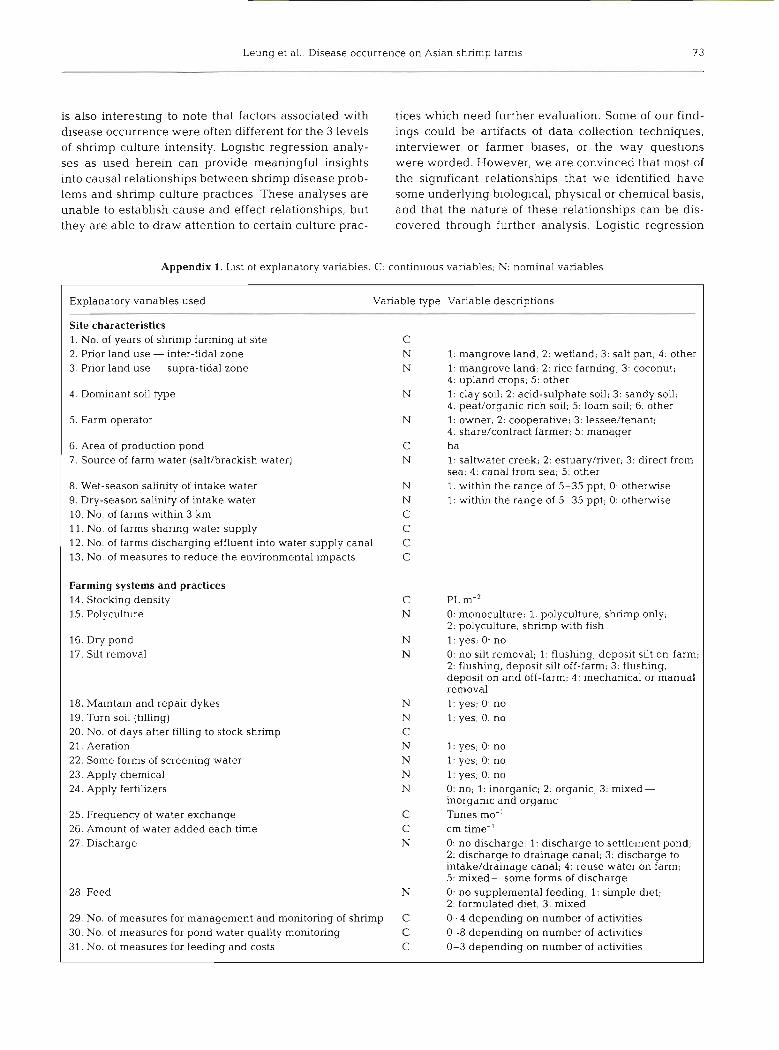
Appendix 1. L~st of explanatory variables. C: continuous variables; N: nominal variables
Explanatory vanables used Variable type Variable descript~ons -
Site characteristics 1. No. of years of shrimp farming at site C 2. Prior land use - inter-tidal zone N 1: mangrove land, 2: wetland; 3: salt pan; 4: other 3. Prior land use - supra-tidal zone N 1: mangrove land; 2: rice farming; 3: coconut;
4: upland crops, 5: other 4 Dom~nant soil type N 1. clay sod; 2: acid-sulphate soil; 3: sandy soil;
4: peaWorganic rich soil; 5 : loam sod; 6: other 5. Farm operator N 1: owner, 2: cooperative; 3. lessee/tenant;
4 , share/contract farmer; 5: manager 6. Area of production pond C ha 7. Source of farm water (salWbrackish water) N 1. saltwater creek; 2: es tuaryhver; 3: direct from
sea; 4: canal from sea; 5: other 8 . Wet-season salinity of intake water N 1 within the range of 5-35 ppt; 0. otherwise 9. Dry-season salinity of intake water N 1. within the range of 5-35 ppt; 0: otherwise 10. No. of farms within 3 km C 11. No. of farms sharing water supply C 12. No. of farms discharging effluent into water supply canal C 13. No. of measures to reduce the environmental ~mpacts C
Farming systems and practices 14 Stocking density C PL m-' 15. Polyculture N 0: monoculture; 1. polyculture, shrimp only;
2: polyculture, shrimp with fish 16. Dry pond N 1: yes; 0: no l ? . Silt removal N 0: no silt removal; 1, flushing, deposit silt on-farm;
2: flushing, deposit silt off-farm; 3: flushing. deposit on and off-farm; 4: mechanical or manual removal
18. Mainta~n and repair dykes N l : yes; 0: no 19. Turn soil (tilling) N 1: yes; 0: no 20. No. of days after filling to stock shrimp C 21. Aeration N 1: yes, 0: no 22. Some forms of screening water N 1: yes; 0: no 23. Apply chemical N 1: yes; 0: no 24. Apply fert~lizers N 0: no; l : inorganic; 2: organic; 3: mixed-
inorgamc and organlc 25. Frequency of water exchange C Times mo-' 26. Amount of water added each time C cm hme-' 27. Discharge N 0: no discharge, 1: discharge to settlement pond;
2: discharge to drainage canal; 3: discharge to intake/drainage canal; 4: reuse water on farm; 5: mlxed-some forms of discharge
28. Feed N 0: no supplemental feeding; 1: simple diet; 2: formulated dlet; 3: mixed
29. No, of measures for management and monitoring of shrimp C 0-4 depending on number of activities 30. No, of measures for pond water quality monitoring C 0-8 depending on number of activities 31. No. of measures for feeding and costs C 0-3 depending on number of activities

Dis Aquat Org 4 1: 65-76, 2000
analyses can therefore be of considerable value to future farm surveys and thereby provide even greater shrimp researchers, policy makers, and commercial insights into causes of shrimp diseases on shrimp venturists alike. Our findings should also help refine farms.
Appendix 2. Summary statistics of variables used in logistic regression models for intensive, semi-intensive and extensive shrimp farms, all countries
Variable Intensive (n = 779) Semi-intensive (n = 910) Extensive (n = 2262) 5th Median 95th 5th Median 95th 5th Median 95th per- or % in per- per- or % in per- per- or % in per-
centile categorya centile centile categorya centile centile categoryd centile
Site characteristics 1. No. of years of shrimp 0.0 3.0 95.0 1 .O 4.5 17.5 1 .O 7.0 25.0
farming at site 2. Inter-tidal zone
Mangrove land 34 Wetland 16 Salt pan 4 Other 46
3. Super-tidal zone Mangrove land 3 Rice farming 2 1 Coconut 2 Upland crops 2 Other 7 1
4. Soil Clay 39 Acid-sulphate soil 4 Sandy soil 15 PeaWorganic rich soil 1 Loam soil 22 Other 18
5. Farming operator Owner 86 Cooperative 2 LesseeAenant 6 Share/contract farmer 3 Manager 2
6. Area of production 2.0 16.0 ponds (ha)
7. SalWbraclush water Saltwater creek 38 Estuary/river 27 Direct from sea 3 Canal from sea 26 Other 6
8. Wet-season s a h i t y of 36 intake water
9. Dry-season salinity of 4 1 intake water
10. No. of farms within 20 300 3 km
11 No. of farms share 12 95 water supply
12. No. of farms dis- 10 90 charging effluent into water supply canal
13. Measures taken to reduce environmental impacts

Leung et al.: Disease occurrence on Aslan shrimp farms 75
Appendix 2 (continued)
Variable Intensive (n = 779) Semi-intensive (n = 910) Extensive (n = 2262)
5th Median 95th 5th Median 95th 5th Median 95th per- or % in per- per- or % in per- per- or % in per-
centile categoryd centile centile categoryn centile centile categorya centile
Farming systems and practices 14. Stocking density 129
(1000 PL ha-') 15. Polyculture
Mono Poly -shrimp only Poly - shrimp and fish
16. Dry pond 17. Silt removal
No silt removal Flushing, deposit silt on-farm
Flushing, deposit silt off-farm
Flushing, deposit silt on and off-farm
Mechanical or manual removal
18. Maintainlrepair dykes 19. Turn soil (tilling) 20. No. of days after f~lling 0
to stock shrimp 21. Aeration 22. Some forms of screening
water 23. Apply chemicals 24. Apply fertilizers
No use of ferthzer Inorganic Orgamc Mix some forms of inorganic and organic
25. Frequency of water 0 exchange (times mo-')
26. Amount of water added 0 each time (cm time-')
27. Discharge No discharge Discharge to settlement pond Discharge to drainage canal Discharge to intake/ drainage canal
Reuse of water on farm Mix some forms of discharge
28. Feed No. supplement feed Simple diet Formulated Mixed
29. No. of shrimp manage- 1 mentlmonitoring measures
30. No. of water monitoring 2 measures
31. No. of feeding and cost 0 measures
'This column shows the median for continuous variables or % in each category for nominal variables

76 Dis Aquat Org 41: 65-76, 2000
Acknowledgements. We greatly appreciate and acknowledge NACA for use of all farm data in our analyses. We are also grateful to the 4 anonymous journal reviewers and Dr Tim Flegel for their constructive comments on an earlier version of this manuscript. The usual caveats apply.
LITERATURE CITED
ADB/NACA (1990) Regional study of fish diseases and fish health management. Asian Development Bank and Net- work of Aquaculture Centres in Asia-Pacific, Bangkok
ADB/NACA (1996) Aquaculture sustainability and the envi- ronment. Report on a regional study and workshop on aquaculture sustainability and the environment. ADB Series. Asian Development Bank and Network of Aqua- culture Centres in Asia-Pacific, Bangkok
Charemza WW, Deadman DF (1997) New dlrectlons in econo-
Editorial responsibility: Timothy Flegel, Bangkok, Thailand
metric practice. Edward Elgar Publishing, Cheltenham Greene WH (1990) Econometric analysis. Macmillan Publish-
ing Company, New York Hosmer DW, Lemeshow S (1989) Applied loglstic regression.
John-Wiley and Sons, New York Johnson-Iferulundu YJ, Kaneene JB (1998) Management-
related risk factors for M. paratuberculosis infection in Michigan, USA, dairy herds. Prev Vet Med 37:41-55
Menard S (1995) Applied loglstlc regression analysis. Sage Publications, Thousand Oaks
Rosenbery B (1997) World shrimp farming. Shrimp News International, San Diego, CA
SPSS (1992) SPSS for Windows advanced statistics release 5. SPSS, Inc, Chicago
Studenmund AH, Cassidy HJ (1987) Using econometrics: a practical guide. Brown Publishing, Boston
Tu JV (1996) Advantages and disadvantages of using artificial neural networks versus logistic regression for predicting medical outcomes. Clin Epidemiol 49.1 225- 1231
Submitted: January 20, 1999; Accepted: January 1 1 , 2000 Proofs received from author(s): May 3, 2000