a frozen collision belt beneath ice: an overview of seismic ... a...overview of seismic studies...
TRANSCRIPT

• Review • Advances in Polar Science
www.aps-polar.org
* Corresponding author, E-mail: [email protected]
A frozen collision belt beneath ice: an overview of seismic studies around the Gamburtsev Subglacial Mountains, East Antarctica
AN Meijian1*, Douglas A. Wiens2 & ZHAO Yue1
1 Institute of Geomechanics, Chinese Academy of Geological Sciences, Beijing 100081, China;2 Department of Earth and Planetary Science, Washington University, St. Louis, MO 63130, Missouri, USA
Received 2 March 2016; accepted 29 June 2016
Abstract The Gamburtsev Antarctic Mountains Seismic Experiment (GAMSEIS, 2007–2010) was jointly conducted by the United States, China, and Japan during and after the International Polar Year 2007–2008. Broadband seismic stations were deployed across the ice-covered Gamburtsev Subglacial Mountains (GSM) and other previously unexplored areas in the interior of East Antarctica. Using GAMSEIS data, published results not only have revealed the deep structure of Antarctica, but also improved our understanding of the tectonic evolution of Antarctica and the supercontinent Gondwana, and of the relationship between geothermal heat flux and glaciers. This contribution draws together the major findings from recent studies, and also offers further investigation into the relationship between tectonic history and the East Antarctic Ice Sheet. The elevation of the GSM is largely supported by thickened crust, with Moho depths of ~60 km near the crest of the range. The GSM are underlain by thick (>200 km) and cold continental lithosphere that likely formed after collision of two ancient crustal blocks during the pan-African orogeny. Heat flux results obtained from seismic inversion support a model of ice sheet basal melting that depends more strongly on bedrock topography than on geothermal heat flux, while ice surface and ice thickness are inversely correlated with heat flux.
Keywords GAMSEIS, crust, lithosphere, ice sheet, Gondwana, International Polar Year
Citation: An M J, Wiens D A, Zhao Y. A frozen collision belt beneath ice: an overview of seismic studies around the Gamburtsev Subglacial Mountains, East Antarctica. Adv Polar Sci, 2016, 27: 78-89, doi: 10.13679/j.advps.2016.2.00078
doi: 10.13679/j.advps.2016.2.00078 June 2016 Vol. 27 No. 2: 78-89
1 IntroductionAntarctica, the keystone of the “southern supercontinent”, Gondwana[1], has been geologically investigated for more than 100 years. However, we still know little about the geology of the Antarctic interior[2], as the continent is largely covered by ice and outcrops are only found in a small region (<1% of the surface area), mostly at or close to the continental margin. For example, geological evidence from outcrops supports the presence of the Grenville and Pan-African orogens extending under the Antarctic ice sheet, but the exact paths of the orogens under the ice remain poorly constrained, given the scarcity of Antarctic outcrops, especially in central East Antarctica[2-3].
The Gamburtsev Subglacial Mountains (GSM) are a major mountain range in the middle of East Antarctica (EANT), but little was known about the tectonics and deep structure beneath the mountains prior to the International Polar Year (IPY) 2007–2008. In addition to being completely covered with glacial ice, the mountains are located close to the highest point of East Antarctica, Dome Argus (Dome A), which makes access extremely challenging. Although the Lambert Graben, close to the GSM, has been the subject of geological[2] and seismic[4] studies, no rock samples from the GSM have yet been retrieved, and even no reliable geophysical measurements over the mountains were made before the IPY 2007–2008. Even more problematic is that no seismicity or tectonic activity that occurs around the GSM has been recorded at teleseismic distances[5]. Given the
Overview of seismic studies around Antarctic Gamburtsev Subglacial Mountains 79
above limitations, several different hypotheses, including volcanism[6], rifting[7], and compression[8-9], have been suggested to explain the formation of the GSM. The physical mechanism behind each hypothesis would be evident in the large-scale geological, and hence, deep seismic structure, with very different factors controlling the evolution of the overlying ice sheet.
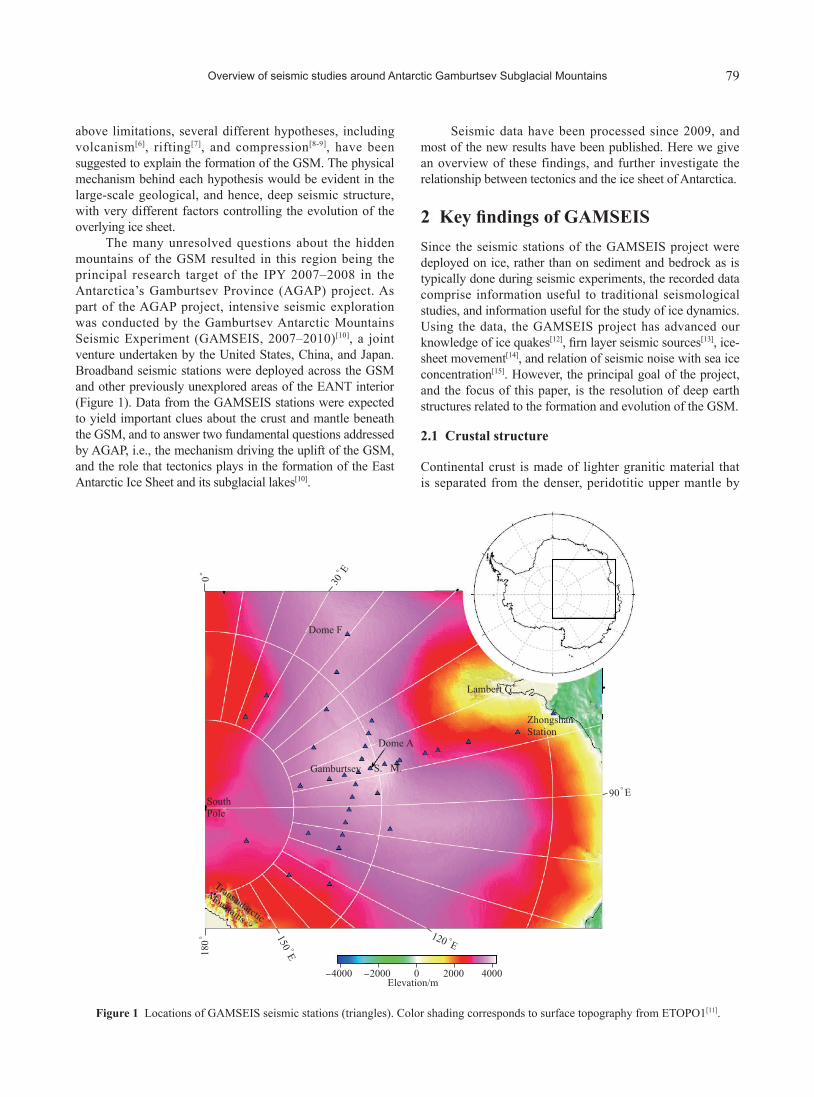
The many unresolved questions about the hidden mountains of the GSM resulted in this region being the principal research target of the IPY 2007–2008 in the Antarctica’s Gamburtsev Province (AGAP) project. As part of the AGAP project, intensive seismic exploration was conducted by the Gamburtsev Antarctic Mountains Seismic Experiment (GAMSEIS, 2007–2010)[10], a joint venture undertaken by the United States, China, and Japan. Broadband seismic stations were deployed across the GSM and other previously unexplored areas of the EANT interior (Figure 1). Data from the GAMSEIS stations were expected to yield important clues about the crust and mantle beneath the GSM, and to answer two fundamental questions addressed by AGAP, i.e., the mechanism driving the uplift of the GSM, and the role that tectonics plays in the formation of the East Antarctic Ice Sheet and its subglacial lakes[10].
Seismic data have been processed since 2009, and most of the new results have been published. Here we give an overview of these findings, and further investigate the relationship between tectonics and the ice sheet of Antarctica.
2 Key findings of GAMSEISSince the seismic stations of the GAMSEIS project were deployed on ice, rather than on sediment and bedrock as is typically done during seismic experiments, the recorded data comprise information useful to traditional seismological studies, and information useful for the study of ice dynamics. Using the data, the GAMSEIS project has advanced our knowledge of ice quakes[12], firn layer seismic sources[13], ice-sheet movement[14], and relation of seismic noise with sea ice concentration[15]. However, the principal goal of the project, and the focus of this paper, is the resolution of deep earth structures related to the formation and evolution of the GSM.
2.1 Crustal structure
Continental crust is made of lighter granitic material that is separated from the denser, peridotitic upper mantle by
Figure 1 Locations of GAMSEIS seismic stations (triangles). Color shading corresponds to surface topography from ETOPO1[11].

80 An M J, et al. Adv Polar Sci June(2016) Vol. 27 No. 2
the Moho discontinuity. Before the GAMSEIS experiment, estimates of crustal thickness in East Antarctica were sparse, and many were highly uncertain due to the lack of constraining seismic data[16]. Yet, because crustal thickness correlates with tectonic setting[17], this information is essential to understanding the tectonics and dynamic evolution of a region. For example, a Precambrian craton has a crustal thickness close to the global average of ~41 km, which is thicker than the crust beneath rift basins and thinner than the crust in orogens[17]. On the other hand, orogenic crust can be as thick as 70–85 km in the case of the Tibetan plateau[18], and ~75 km in the Andean range[19] .
Body wave receiver function analysis is a simple but effective method to provide constraints on seismic velocity discontinuities like the Moho; receiver functions are extracted from three-component seismic data by deconvolution[20]. Receiver functions of all US GAMSEIS stations were analyzed by Hansen et al.[21]; those of the Chinese stations along the Chinese National Antarctic Research Expedition
traverse, from Zhongshan to Kunlun stations (Dome A), were analyzed by Feng et al.[22]. Published Moho depths around the GSM are shown in Figure 2. These new measurements reveal that the crust beneath the stations around the GSM is 45–62 km thick, much thicker than the global continental average. From Dome A to the Chinese Zhongshan Station at the continental margin, the crust thickness decreases from about 62 to 38 km[22].
Seismic surface waves propagate along the Earth’s surface from source to receiver and sample the crust and upper mantle along their propagation paths, making them ideal tools to measure the structure of large aseismic regions like East Antarctica. The crustal and upper-mantle 3-D S-wave velocity structure was estimated beneath the GSM using Rayleigh wave phase velocities[26], and beneath the whole Antarctic plate using fundamental-mode Rayleigh wave group velocities[24]. Both the regional- and continental-scale models suggest very similar structures for the GSM, except for some fine-scale differences caused by the different sensitivities of
Figure 2 Crustal thicknesses (km) around the GSM. Color shading corresponds to bedrock surface topography from the Bedmap2 model[23]. Crustal thicknesses are taken from a compilation of ANtarctic Moho positions (AN-Moho)[24], interpreted from GAMSEIS data[21-22] and previous studies of the Lambert Graben[4] . The thickness at Dome F (49 km) was obtained from gravity data by Kanao et al.[25], but not seismic data. Slight differences may exist between the compiled AN-Moho data and the original sources due to different definitions. Crustal thicknesses here are defined as distances from the solid surface (including ice) to the Moho.

Overview of seismic studies around Antarctic Gamburtsev Subglacial Mountains 81
group and phase velocities to deep crustal structure. Using estimated values and gradients of S-wave velocities at the Moho, An et al.[24] constructed a crustal thickness map (termed AN1-CRUST) for the Antarctic continent. The AN1-CRUST model shows that both the GSM and the highly elevated East Antarctic Mountain Ranges (EAMOR or E-Amor) are underlain by thick crust (Figure 3). The thickest crust (~62 km) in Antarctica is located just beneath Dome A, at the center of the GSM. The Lambert Graben and the areas close to the Chinese Zhongshan station have thinner crust.
Gravity observations can offer reliable information about variations in Moho topography, as investigated previously in the Antarctic[16,28]. However, gravitational variations do not reveal the absolute crustal thickness (Moho depth). Using absolute Moho depths from recent seismic studies[21] as a priori constraints, the patterns of crustal thickness variations from[28] appear to be generally similar to those of the AN1-CRUST model. However, the absolute crustal thickness at the GSM is ~50 km in the gravity-based model, much smaller than the 62 km suggested by seismic studies. This disparity suggests that the topography of central East Antarctica results from deeper geodynamic processes, in addition to thicker crust.
2.2 Lithosphere and upper mantle
The lithosphere (including the crust and uppermost upper
mantle), colloquially described as the cold and rigid outer shell of the Earth, is broken into rigid plates that slide over the ductile asthenosphere over time[29]. In general, lithospheric thickness correlates with age, but also depends on the tectonic mechanism responsible for its formation. Young or extending lithosphere, such as lithosphere overlying a suspected mantle plume[30], can be very thin. However, old lithosphere, or lithosphere near a continental collision, can be very thick. For example, the old Slave Craton (Canada)[31] and the Siberian Platform[32] both have lithospheric thicknesses of >200 km, and the young India–Eurasia continental collision zone (Tibetan Plateau) may have a comparably thick lithosphere[33-34]. Therefore, lithospheric thickness is an important geodynamic parameter for understanding tectonic history. However, because reliable measurements of lithospheric thickness beneath the GSM were unavailable before the GAMSEIS project, the uplift of the GSM was interpreted as the result of several different mechanisms, such as a mantle plume[6].
The (seismic) lithosphere in seismology, also called the seismic lid, lies just above the low-velocity zone. Inversion of regional Rayleigh waves suggests that high velocities beneath the GSM extend to depths of >200 km[26], indicating a thick lithospheric root. A continental-scale study[24] has shown that not only the GSM, but the entirety of East Antarctica has high S-wave velocities at the depths of 80–250 km; this suggests that the seismic lid beneath East Antarctica is thicker than in
Figure 3 Bedrock surface, Moho, and lithosphere-asthenosphere boundary (LAB) topography. Bedrock surface data are from the Bedmap2 model[23], Moho data are from An et al [24], and LAB topography is from An et al.[27].

82 An M J, et al. Adv Polar Sci June(2016) Vol. 27 No. 2
neighboring regions. The vertical resolution in 3-D seismic model by surface-wave tomography is higher than that of body-wave (P- or S-wave) tomography, but the horizontal resolution is lower. Regional body-wave tomography shows that the highest mantle velocities are found near the core of the GSM[35], and adaptively parameterized P-wave tomography of the entire Antarctic continent suggests that relatively high velocities may extend to the mantle transition zone[36].
In geodynamics, the (thermal) lithosphere is defined as the thermal boundary between the conduction-cooled Earth surface and the convecting asthenosphere[37]. An et al.[27] estimated upper mantle temperatures beneath Antarctica using the S-wave velocity model of An et al.[24], then computed lithospheric thicknesses by taking the depth firstly reaching the 1330°C adiabat as the base of the thermal lithosphere (Figure 3). Figure 3 shows that lithospheric thickness decreases gradually from East Antarctica (>200 km) to oceanic regions. Most of East Antarctica has a very thick lithosphere (~150–250 km), with the greatest thickness (~250 km) between Dome A and Dome C.
Previous studies of other continents[33] have shown that the lithospheric thicknesses determined by seismic and thermal studies are generally consistent. The above studies revealed a similar relationship, with seismic and thermal lithospheres beneath the GSM of >200 km thickness[24,26-27]. The thicknesses are much larger than the 80 km estimate of the effective elastic lithosphere beneath the GSM obtained from gravity and topographic data[7]. While the effective elastic lithospheric thickness in some continental regions may not correspond to the exact structure of the lithosphere, it is nonetheless strongly influenced by thermal state, tectonics, crustal composition, etc.[38].
Teleseismic shear wave splitting depends mainly on
anisotropy in the upper mantle. Analyses of such splitting have shown that the direction of fast S-wave velocity is parallel to the general trend of the continental margin of central East Antarctica[39], but upper mantle anisotropy around the GSM is relatively homogeneous with fast velocities oriented along a direction perpendicular to the East Antarctic mountain ranges[40-41].
2.3 Surface heat flux
In Antarctica, heat transfer through the bedrock surface may have strong effects on ice sheet dynamics; consequently, measurements of heat flux are of great importance in glaciology. Antarctic heat flux is difficult to measure directly, due to the thick ice overlying the bedrock; therefore, it must be indirectly estimated from other observations. Maule et al. [42] estimated the depth of the Curie temperature isotherm from satellite magnetic data, but the derived heat flux mainly reflects variations in magnetic crustal thickness. Shapiro and Ritzwoller[43] derived a low-resolution surface heat flux model for Antarctica using seismic velocities in a global seismic model.
Using the boundary constraints of surface temperature and upper mantle temperatures estimated from the AN1-S model, An et al. [27] calculated the heat flux for Antarctica by assuming steady-state thermal conduction. Their new heat flux model is designated AN1-HF. The calculated heat flux in AN1-HF for East Antarctica is <65 mW.m–2, corresponding to the global continental average[44]. The lowest heat flux values are close to domes A, F, and C (Figure 4a), though the bedrock topography and ice thickness around the domes are quite different in each case (Figure 4c, 4d). This indicates that a large-scale correlation may exist between geothermal heat flux and ice surface topography[27].

Overview of seismic studies around Antarctic Gamburtsev Subglacial Mountains 83
3 DiscussionAll results from studies published before 2016 are summarized in the above sections. In this section, we discuss how these results answer the key scientific questions of the AGAP.
3.1 Uplift of the Gamburtsev Subglacial Mountains
Results of seismic studies conducted during the IPY 2007–2008 showed that the striking features of the GSM are its high elevation, very thick crust (~60 km)[21-22], and very thick lithosphere (>200 km) [24,26-27]. A systematic comparison between seismic velocities beneath the GSM and similar regions elsewhere in the world suggests these are early Proterozoic or Archean regions, corresponding to very old continental lithosphere[26]. Furthermore, these features are not limited to the GSM, but rather they extend across the East Antarctic mountain ranges (EAMOR)[24]. This indicates that either most of the mountains of the EAMOR, including the GSM, formed from similar tectonic events that occurred at similar times, or that the mechanism resulting in the uplift of the GSM is also applicable to the EAMOR. The EAMOR runs for >1000 km from east to west, so the formation process could not have been a local or regional-scale event.
The thick crust and lithosphere of the GSM could not form from magmatism or rifting, because both mechanisms normally cause crustal thinning. For example, the Lambert
Graben, close to the GSM, underlain by thin crust at present[4], underwent rifting in Permian[46]. Although rifting was previously proposed as the cause of GSM uplift[7], that hypothesis is incompatible with the very thick, high-velocity, cold lithosphere inferred beneath the region[24]. In addition, this idea cannot explain the uplift of the broader EAMOR region, which extends far from the inferred rift[24].
Very thick crust and lithosphere have been observed in present-day continental-scale orogens, like the Alpine–Himalayan mountain ranges[33-34,47-49] and the Andes[19,22,50-53]. These orogens are accompanied by horizontal shortening at continental plate boundaries, corresponding to subduction or collision between plates. Comparison of seismic velocities beneath the GSM with those beneath orogens on other continents [24,26] suggests that the GSM in particular, and the EAMOR in general, could have formed from collisional processes. Since the present EAMOR is situated within the interior of Antarctica, the formation process is something like continental amalgamation. There have been three known major orogenies that caused large-scale continental amalgamations, forming the supercontinents of Rodinia at ~1.3–0.9 Ga (Grenvillian-aged orogens), Gondwana at 600–500 Ma (Ross and Pan-African orogens), and Pangaea at ~300 Ma, respectively. The uplift of the GSM and the EAMOR could have occurred during one of these major events.
The thickest crust and lithosphere in present continental orogens is generally located at or close to plate boundaries,
Figure 4 Heat flux (a), surface topography (b), ice thickness (c), bedrock topography (d), and subglacial lakes (open purple circles) in Antarctica. Subglacial lake data are from Wright and Siegert[45]. Heat fluxes are from An et al.[27]; topographic and ice thickness data are from the Bedmap2 model[23]. In a, A = Dome A; C = Dome C; F = Dome F; EANT = East Antarctica; GSM = Gamburtsev Subglacial Mountains; WANT = West Antarctica; WARS = West Antarctic rift system. The region in the dashed ellipse corresponds to low heat flux in a and high ice surface elevations in b. In d, subglacial lakes in the regions delineated by two squares are located in areas of negative bedrock topography.

84 An M J, et al. Adv Polar Sci June(2016) Vol. 27 No. 2
rather than in the middle of plates. However, the EAMOR of Antarctica was located in the interior of Gondwana, far from the Pangaea collisional suture between the Gondwanan and Euramerican supercontinents[54]. In addition, the age of the lithosphere is much older than 300 Ma when Pangaea was formed, as indicated by the seismic velocity profile[26]. Therefore, it is unlikely that the EAMOR formed during the Pangaea collision. The EAMOR lies near the Grenvillian-aged Payner Orogen, and might have formed in Grenvillian time; however, the present EAMOR belonged to several continents before the formation of Gondwana[3], and therefore could not have formed during the early amalgamation that created the Rodinia supercontinent. The marked differences between GSM and Grenvillian S-wave velocity structures[24] also suggests that the GSM were not a result of Grenvillian orogenesis. Consequently, the GSM most likely formed by orogenic tectonism associated with the assembly of Gondwana[24,26], which brought together two early Proterozoic or Archean crustal blocks. This scenario is compatible with geological evidences of the Pan-African tectonic event found close to the continental margins of East Antarctica[2,55-59].
Since the EAMOR was located close to the boundary between East Gondwana and the continent composed of West Gondwana and Indo–Antarctica before ~550–500 Ma[3,60], the EAMOR (including the GSM) may represent the convergent suture of the continents during the Pan-African Orogen at 550–500 Ma[24]. If subduction occurred during continental amalgamation, spatial variations in crustal and lithospheric thicknesses around the EAMOR, especially in the GSM region, would support the hypothesis that East Gondwana was subducted and collided by the continent composed of West Gondwana and Indo–Antarctica, forming the Gondwana supercontinent[24]. The lithosphere of the EAMOR suture would have been altered during the event(s), but the lithospheric thermal structure and apparent age away from the immediate suture zone remain consistent with Proterozoic or Archean lithosphere. After ~500 Ma, except for the rifting at the margin of East Antarctica (e.g., the Permian Lambert Graben) [46], no evidence of major tectonic events has been found in the East Antarctic interior[2-3], indicating that the EAMOR has been stable for a long time (≥500 Ma). Therefore, the collisional suture of EAMOR can be interpreted as a convergent orogeny, bringing together two cratonic units; most of East Antarctica around EAMOR consists of Precambrian craton[24].
For a stable continent, isostatic considerations predict a high topography for a thick crust and lithosphere, but the high topography will be worn away by erosion. If the thick crust of the GSM and EAMOR formed at 500 Ma, there remains the question of how the high topography could have been preserved for so long. Detrital apatites obtained from Eocene (55–33 Ma) sands in Prydz Bay, at the terminus of the Lambert Graben, which drained a large pre-glacial basin including the northern Gamburtsev Mountains, indicate that erosion was very slow, averaging 0.01–0.02 km∙Ma-1 over 250 Ma[61]. Even though East Antarctica did not remain in
cold polar regions (south to the latitude of 60˚S) prior to ~160 Ma[62], the erosion rates of the EAMOR/GSM could have remained sufficiently low if the topographic high was large enough, its thermal and tectonic activity remained low, and its superficial rocks were resistant to erosion. Similarly, southern and central Tibet maintained low erosion rates of <0.03 km∙Ma-1 from 166 to 20 ka[63]. If the erosion rate of 0.01–0.02 km∙Ma-1 from Cox et al.[61] is assumed to be roughly constant since the formation of the EAMOR/GSM at 500 Ma, then crustal thickness would have been reduced by 5−10 km. If the GSM formed at 500 Ma, with a crustal thickness of ~70 km, similar to that of the Himalayas[47,49] and the Andes[19,50-51], then the current crustal thickness (~60 km) of the GSM is still a reasonable estimate. Thick crust in some ancient orogenic regions, such as the Paleozoic Southern Urals[64-65] and the Pre-Cambrian suture zone of southern Finland[66], supports this hypothesis. In summary, with appropriately low erosion rates, the thick crust beneath the EAMOR could have endured for a period as long as 500 Ma[24,26].
Thus, the GAMSEIS results conclusively support the hypothesis that the East Antarctic mountain ranges, including the GSM, are cratonized collisional sutures that formed at ~500–550 Ma in association with the amalgamation of the Gondwana supercontinent.
3.2 Relationship between tectonics and the ice sheet
Crustal tectonics can affect overlying glaciers via geothermal heat flux and the landscape of the bedrock surface, among other factors. Heat flux at a continental surface is controlled by many factors, but over larger regions is generally controlled by variations in heat input from the mantle.
In cold, glaciated areas like Antarctica, geothermal heat flux may play a major role in the formation of subglacial lakes[67-69]. Although real situations related to melting at glacier bases are necessarily complex[70], in the simplest conceptual model, ignoring the effects of accumulation, ablation, and horizontal advection, the temperature–depth relation in ice due to steady-state thermal conduction[71] is determined by the geothermal gradient[70]. Therefore, ice base melting depends on ice thickness, ice surface temperature, and geothermal heat flux. In other words, areas with a low geothermal heat flux and/or low surface temperatures may have thick ice.
3.2.1 Geothermal heat flux vs. glacier melting
Even though anomalously high heat flux can be found in limited regions with radiogenic crustal rocks[72], the measured values have been found to correlate with major geologic provinces; i.e., higher heat flux and more scattered values are found in active tectonic regions, while lower flux and more uniform values are found in old, stable areas[73-77]. The heat flux in AN1-HF (Figure 4a), calculated from the constraints of temperatures at the surface and in the uppermost mantle, is relatively low in cratonic East Antarctica, especially in the GSM, which is consistent with previous results from other

Overview of seismic studies around Antarctic Gamburtsev Subglacial Mountains 85
continents[74,76]. However, no obvious correlation is observed between the distributions of heat flux and subglacial lakes in East Antarctica (Figure 4a). This discrepancy could arise because of the lateral resolution limit of the heat flux model, relative to the detection threshold of locally distributed radiogenic crustal rocks[72]. The lateral resolution limit of heat flux in the AN1-HF model is ~100 km[27], which cannot detect geothermal anomalies on local scales (e.g., from a fault). However, this indicates that geothermal heat flux plays a secondary role in distributed glacier basal melting.
3.2.2 Bedrock landscape vs. glacier melting
The topography of the bedrock surface can influence basal melting of glaciers. Most of the subglacial lakes in Antarctica are obviously located in regions of negative bedrock topography, especially in the regions marked by squares in Figure 4d. This is easily understood: in completely glaciated areas, ice that covers a negative landscape (valley) is thicker than that which covers a positive landscape (ridge). Therefore, the ice base of a valley is more likely to be melted than that of a ridge. Furthermore, bedrock topography can
control glacial and melt water flow, while glacial sliding can increase the basal temperature and thus intensify basal melting[70]. In summary, the distribution of subglacial lakes should be strongly related to the negative local topography of bedrock surfaces in Antarctica.
3.2.3 Geothermal heat flux and ice thickness/surface height
Although the geothermal heat flux in AN1-HF has no obvious correlation with subglacial lakes, it does exhibit a good correlation with ice surface topography. For example, the heat flux estimates at high-elevation domes A, C, and F (Figure 4a, 4b) are all very low. This indicates the existence of a correlation between geothermal heat flux and ice surface topography on a large scale[27].
Figure 5 shows the relationship between heat flux estimates and ice thickness/ice surface elevation for Antarctica. Even though the ice surface elevation contours cross several different tectonic regions within Antarctica (Figure 4a, 4b), a negative linear correlation (q = f(h)) between heat flux (q) and ice surface height (h) is clearly evident in
Figure 5 Relationship between heat flux and ice surface elevations (a, c) and ice thickness (b, d) in Antarctica. The data are adapted from Figure 4 by dividing Antarctica into equal-area cells with lateral extents of ~120 km, as in An et al.[24]. The datum (e.g., heat flux, ice thickness, or ice surface elevation) in each cell is treated as one value for calculation of the mean (filled or hollow circles) and standard deviation (error bar) in the figure. Each mean in a, b is for the heat flux in regions with constant ice elevation or thickness; in c, d, each mean corresponds to ice surfaces or thicknesses of regions with constant heat flux. The data (or cell) numbers used to calculate each mean are shown in Figure 6. Hollow circles contain too few data for averaging (i.e., 1 point each), and are therefore not used to calculate the linear regressions (lines and corresponding equations) or the mean surface height/ice thickness of each heat flux level (dashes) in c, d.

86 An M J, et al. Adv Polar Sci June(2016) Vol. 27 No. 2
Figure 5a. That is, areas with a high ice surface (dashes in Figure 4b) have low heat flux values (Figure 4a), as expected. A similar correlation between heat flux (q) and ice thickness can also be seen in Figure 5b. Since the correlations in Figure 5a, 5b are similar to one another, we use h to represent ice thickness. Since the linearity of the above correlations (Figure 5a, 5b) is obvious, we can predict regional geothermal heat flux (q) from ice surface/ice thickness (h) using the following empirical equation:
q =-3.8h + 62.6. (1)
Moreover, Figure 5c, 5d suggest that the inverse relationship between ice surface height/ice thickness and heat flux (h=g(q)) might be widely distributed. Clusters of ice thickness/ice surface height can be observed in four heat flux ranges, separated by three values (40, 57, and 74 mW∙m–2). The ice surfaces or thicknesses within each cluster do not linearly correlate with heat flux, and each value has a large error estimate (bars in Figure 5c, 5d). However, both the mean values of each cluster and the plot of all values in the full heat flux range show a negative correlation, indicating that ice surface height/ice thickness is weakly dependent on heat flux. The correlation of h=g(q) is obviously worse than that of q = f(h), indicating that the relationship between ice thickness and geothermal heat flux is complex. Of course, many more important factors, including ice accumulation and ablation,
are likely to influence ice thickness; this investigation merely suggests that a relationship exists.
In conclusion, melting at the ice sheet base may depend more on bedrock topography than on geothermal heat flux, while ice thickness and surface topography in Antarctica are related to geothermal heat flux.
4 ConclusionsUsing the seismic data of the GAMSEIS experiment (2007–2010), crustal and upper mantle structures beneath the ice-covered Gamburtsev Subglacial Mountains were revealed for the first time. Results suggest a very thick crust and lithosphere beneath the GSM, corresponding to the topographic high of Antarctica; similar features were also found beneath the other mountains in East Antarctic mountain ranges. Using these seismic velocities to estimate temperatures in the upper mantle yields low estimates of heat flux beneath the GSM.
These and other recent seismic results improve our understanding of the dynamics of the GSM and the relationship between Antarctic tectonics and ice sheet. For example, the features resolved beneath the GSM support the hypothesis that the EAMOR and the GSM are cratonized collision sutures corresponding to where East Gondwana collided with the large continent of West Gondwana and Indo-
Figure 6 Data values (hollow or filled circles) used for statistical analysis of the corresponding subfigures in Figure 5. Hollow circles represent values with only one corresponding datum.

Overview of seismic studies around Antarctic Gamburtsev Subglacial Mountains 87
Antarctica during the Pan-African orogeny (~550–500 Ma), forming the Gondwana supercontinent. Comparisons between heat flux, subglacial lakes, and bedrock topography show that melting at the ice sheet base may be more dependent on bedrock topography than on geothermal heat flux, while ice surface topography and ice thickness are related to geothermal heat flux. Further investigation on the relationship between tectonics and ice sheet of Antarctica here shows ice surface and ice thickness in Antarctica are inversely correlated with heat flux, and it appears possible to roughly predict geothermal heat flux from ice thickness or ice surface height using a linear equation.
Acknowledgments Detailed constructive comments from Anya M. Reading, an anonymous reviewer, and the Guest Editor, Ian Allison helped improve the text. All figures were generated using Generic Mapping Tools[78].
References1 Du Toit A L. Our wandering continents. Edinburgh: Oliver and Boyd,
1937: 3662 Harley S L, Fitzsimons I C W, Zhao Y. Antarctica and supercontinent
evolution: historical perspectives, recent advances and unresolved issues. Geol Soc London Spec Publ, 2013, 383(1): 1–34, doi: 10.1144/sp383.9
3 Boger S D. Antarctica — before and after Gondwana. Gondwana Res, 2011, 19(2): 335–371, doi: 10.1016/j.gr.2010.09.003
4 Reading A M. The seismic structure of Precambrian and early Palaeozoic terranes in the Lambert Glacier region, East Antarctica. Earth Planet Sci Lett, 2006, 244(1–2): 44–57, doi: 10.1016/j.epsl.2006.01.031
5 Reading A M. The seismicity of the Antarctic plate. GSA Spec Pap, 2007, 425: 285–298, doi: 10.1130/2007.2425(18)
6 Sleep N H. Mantle plumes from top to bottom. Earth Sci Rev, 2006, 77(4): 231–271, doi: 10.1016/j.earscirev.2006.03.007
7 Ferraccioli F, Finn C A, Jordan T A, et al. East Antarctic rifting triggers uplift of the Gamburtsev Mountains. Nature, 2011, 479(7373): 388–392, doi: 10.1038/nature10566
8 Veevers J J. Case for the Gamburtsev Subglacial Mountains of East Antarctica originating by mid-Carboniferous shortening of an intracratonic basin. Geology, 1994, 22(7): 593–596, doi: 10.1130/0091-7613(1994)022<0593:CFTGSM>2.3.CO;2
9 Veevers J J, Saeed A, O’Brien P E. Provenance of the Gamburtsev Subglacial Mountains from U–Pb and Hf analysis of detrital zircons in Cretaceous to Quaternary sediments in Prydz Bay and beneath the Amery Ice Shelf. Sediment Geol, 2008, 211(1–2): 12–32, doi: 10.1016/j.sedgeo.2008.08.003
10 Wiens D A. Broadband seismology in Antarctica: recent progress and plans for the international polar year//Proc. Inter. Symp.—Asian Collaboration in IPY 2007–2008. Tokyo, Japan, 2007
11 Amante C, Eakins B W. ETOPO1 1 arc-minute global relief model: procedures, data sources and analysis. Boulder, CO, USA: National Geophysical Data Center, NOAA, 2009
12 Kanao M, Wiens D A, Tanaka S, et al. Broadband seismic deployments in East Antarctica: IPY contribution to monitoring the Earth’s interiors. Ann Geophys, 2014, 57(3): SS0322, doi: 10.4401/ag-6379
13 Lough A C, Barcheck C G, Wiens D A, et al. A previously unreported type of seismic source in the firn layer of the East Antarctic Ice Sheet. J Geophys Res, 2015, 120(11): 2237–2252, doi: 10.1002/2015JF003658
14 An M J, Wiens D, An C L, et al. Antarctic ice velocities from GPS locations logged by seismic stations. Antarct Sci, 2015, 27(2): 210–222, doi: 10.1017/S0954102014000704
15 Anthony R E, Aster R C, Wiens D, et al. The seismic noise environment of Antarctica. Seismol Res Lett, 2015, 86(2A): 431, doi: 10.1785/0220150005
16 Block A E, Bell R E, Studinger M. Antarctic crustal thickness from satellite gravity: implications for the Transantarctic and Gamburtsev Subglacial Mountains. Earth Planet Sci Lett, 2009, 288(1–2): 194–203, doi: 10.1016/j.epsl.2009.09.022
17 Christensen N I, Mooney W D. Seismic velocity structure and composition of the continental crust: a global view. J Geophys Res, 1995, 100(B6): 9761–9788
18 Teng J W, Zhang Z J, Zhang X K, et al. Investigation of the Moho discontinuity beneath the Chinese mainland using deep seismic sounding profiles. Tectonophysics, 2013, 609: 202–216, doi: 10.1016/j.tecto.2012.11.024
19 Assumpção M, Feng M, Tassara A, et al. Models of crustal thickness for South America from seismic refraction, receiver functions and surface wave tomography. Tectonophysics, 2013, 609: 82–96, doi: 10.1016/j.tecto.2012.11.014
20 Langston C A. Structure under Mount Rainier, Washington, inferred from teleseismic body waves. J Geophys Res, 1979, 84(B9): 4749–4762
21 Hansen S E, Nyblade A A, Heeszel D S, et al. Crustal structure of the Gamburtsev Mountains, East Antarctica, from S-wave receiver functions and Rayleigh wave phase velocities. Earth Planet Sci Lett, 2010, 300(3–4): 395–401, doi: 10.1016/j.epsl.2010.10.022
22 Feng M, An M J, An C L, et al. Crustal thicknesses along the traverse from Zhongshan to Dome A in east Antarctica. Chin J Polar Res, 2014, 26(2): 177–185(in Chinese)
23 Fretwell P, Pritchard H D, Vaughan D G, et al. Bedmap2: improved ice bed, surface and thickness datasets for Antarctica. Cryosph, 2013, 7(1): 375–393, doi: 10.5194/tc-7-375-2013
24 An M J, Wiens D A, Zhao Y, et al. S-velocity model and inferred Moho topography beneath the Antarctic Plate from Rayleigh waves. J Geophys Res, 2015, 120(1): 359–383, doi: 10.1002/2014JB011332
25 Kanao M, Hansen S E, Kamiyama K, et al. Crustal structure from the Lützow-Holm Bay to the inland plateau of East Antarctica, based on onshore gravity surveys and broadband seismic deployments. Tectonophysics , 2012, 572–573: 100–110, doi : 10.1016/j.tecto.2012.01.014
26 Heeszel D S, Wiens D A, Nyblade A A, et al. Rayleigh wave constraints on the structure and tectonic history of the Gamburtsev Subglacial Mountains, East Antarctica. J Geophys Res, 2013, 118(5): 2138–2153, doi: 10.1002/jgrb.50171
27 An M J, Wiens D A, Zhao Y, et al. Temperature, lithosphere-asthenosphere boundary, and heat flux beneath the Antarctic Plate inferred from seismic velocities. J Geophys Res, 2015, 120(12): 8720–8742, doi: 10.1002/2015JB011917
28 O’Donnell J P, Nyblade A A. Antarctica’s hypsometry and crustal thickness: implications for the origin of anomalous topography in East Antarctica. Earth Planet Sci Lett, 2014, 388: 143–155, doi: 10.1016/j.epsl.2013.11.051
29 Isacks B, Oliver J, Sykes L R. Seismology and the new global tectonics. J Geophys Res, 1968, 73(18): 5855–5899, doi: 10.1029/JB073i018p05855

88 An M J, et al. Adv Polar Sci June(2016) Vol. 27 No. 2
30 Morgan W J. Deep mantle convection plumes and plate motions. AAPG Bull, 1972, 56(2): 203–213
31 Van Der Lee S. Deep below North America. Science, 2001, 294(5545): 1297–1298, doi: 10.1126/science.1066319
32 Priestley K, Debayle E. Seismic evidence for a moderately thick lithosphere beneath the Siberian Platform. Geophys Res Lett, 2003, 30(3): 1118, doi: 10.1029/2002GL015931
33 An M J, Shi Y L. Lithospheric thickness of the Chinese continent. Phys Earth Planet Inter, 2006, 159(3–4): 257–266, doi: 10.1016/j.pepi.2006.08.002
34 Feng M, Van Der Lee S, An M J, et al. Lithospheric thickness, thinning, subduction, and interaction with the asthenosphere beneath China from the joint inversion of seismic S-wave train fits and Rayleigh-wave dispersion curves. Lithos, 2010, 120(1–2): 116–130, doi: 10.1016/j.lithos.2009.11.017
35 Lloyd A J, Nyblade A A, Wiens D A, et al. Upper mantle seismic structure beneath central East Antarctica from body wave tomography: implications for the origin of the Gamburtsev Subglacial Mountains. Geochem Geophys Geosyst, 2013, 14(4): 902–920, doi: 10.1002/ggge.20098
36 Hansen S E, Graw J H, Kenyon L M, et al. Imaging the Antarctic mantle using adaptively parameterized P-wave tomography: evidence for heterogeneous structure beneath West Antarctica. Earth Planet Sci Lett, 2014, 408: 66–78, doi: 10.1016/j.epsl.2014.09.043
37 Jaupart C, Mareschal J C. The thermal structure and thickness of continental roots. Lithos, 1999, 48(1–4): 93–114
38 Burov E B, Diament M. The effective elastic thickness (Te) of continental lithosphere: what does it really mean? J Geophys Res, 1995, 100(B3): 3905–3927
39 Reading A M, Heintz M. Seismic anisotropy of East Antarctica from shear-wave splitting: spatially varying contributions from lithospheric structural fabric and mantle flow? Earth Planet Sci Lett, 2008, 268(3–4): 433–443, doi: 10.1016/j.epsl.2008.01.041
40 Hernandez S, Wiens D A, Anandakrishnan S, et al. Seismic anisotropy of the Antarctic upper mantle from shear wave splitting analysis of POLENET and AGAP seismograms. Eos Trans. AGU, Fall Meeting Suppl, Abstract U51C-0043, 2009
41 Accardo N J, Wiens D A, Hernandez S, et al. Upper mantle seismic anisotropy beneath the West Antarctic Rift System and surrounding region from shear wave splitting analysis. Geophys J Int, 2014, 198(1): 414–429, doi: 10.1093/gji/ggu117
42 Maule C F, Purucker M E, Olsen N, et al. Heat flux anomalies in Antarctica revealed by satellite magnetic data. Science, 2005, 309(5733): 464–467, doi: 10.1126/science.1106888
43 Shapiro N M, Ritzwoller M H. Inferring surface heat flux distributions guided by a global seismic model: particular application to Antarctica. Earth Planet Sci Lett, 2004, 223(1–2): 213–224, doi: 10.1016/j.epsl.2004.04.011
44 Pollack H N, Hurter S J, Johnson J R. Heat flow from the Earth’s interior: analysis of the global data set. Rev Geophys, 1993, 31(3): 267–280
45 Wright A, Siegert M. A fourth inventory of Antarctic subglacial lakes. Antarct Sci, 2012, 24(6): 659–664, doi: 10.1017/S095410201200048X
46 Harrowfield M, Holdgate G R, Wilson C J L, et al. Tectonic significance of the Lambert graben, East Antarctica: reconstructing the Gondwanan rift. Geology, 2005, 33(3): 197–200, doi: 10.1130/g21081.1
47 Hirn A, Lepine J C, Jobert G, et al. Crustal structure and variability of the Himalayan border of Tibet. Nature, 1984, 307(5946): 23–25
48 Zhao W J, Nelson K D, Che J, et al. Deep seismic reflection evidence for continental underthrusting beneath southern Tibet. Nature, 1993,
366(6455): 557–55949 Hauck M L, Nelson K D, Brown L D, et al. Crustal structure of the
Himalayan orogen at ~90° east longitude from Project INDEPTH deep reflection profiles. Tectonics, 1998, 17(4): 481–500, doi: 10.1029/98TC01314
50 Beck S L, Zandt G, Myers S C, et al. Crustal-thickness variations in the central Andes. Geology, 1996, 24(5): 407–410
51 Yuan X, Sobolev S V, Kind R. Moho topography in the central Andes and its geodynamic implications. Earth Planet Sci Lett, 2002, 199(3–4): 389–402
52 Feng M, Assumpção M, Van Der Lee S. Group-velocity tomography and lithospheric S-velocity structure of the South American continent. Phys Earth Planet Inter, 2004, 147(4): 315–331
53 Feng M, Van Der Lee S, Assumpção M. Upper mantle structure of South America from joint inversion of waveforms and fundamental mode group velocities of Rayleigh waves. J Geophys Res, 2007, 112(B4): B04312, doi: 10.1029/2006JB004449
54 Veevers J J. Gondwanaland from 650–500 Ma assembly through 320 Ma merger in Pangea to 185–100 Ma breakup: supercontinental tectonics via stratigraphy and radiometric dating. Earth Sci Rev, 2004, 68(1–2): 1–132, doi: 10.1016/j.earscirev.2004.05.002
55 Zhao Y, Song B, Zhang Z Q, et al. Early Paleozoic (Pan African) thermal event of the Larsemann Hills and its neighbours, Prydz Bay, East Antarctica. Sci China, 1995, 38(1): 74–84
56 Fitzsimons I C W. A review of tectonic events in the East Antarctic Shield and their implications for Gondwana and earlier supercontinents. J Afr Earth Sci, 2000, 31(1): 3–23, doi: 10.1016/s0899-5362(00)00069-5
57 Fitzsimons I C W. Proterozoic basement provinces of southern and southwestern Australia, and their correlation with Antarctica. Geol Soc London Spec Publ, 2003, 206(1): 93–130, doi: 10.1144/gsl.sp.2003.206.01.07
58 Liu X H, Zhao Y, Liu X C, et al. Geology of the Grove Mountains in East Antarctica. Sci China Ser D Earth Sci, 2003, 46(4): 305–319, doi: 10.1360/03yd9028
59 Liu X C, Jahn B M, Zhao Y, et al. Late Pan-African granitoids from the Grove Mountains, East Antarctica: age, origin and tectonic implications. Precambrian Res, 2006, 145(1–2): 131–154
60 Boger S D, Carson C J, Fanning C M, et al. Pan-African intraplate deformation in the northern Prince Charles Mountains, east Antarctica. Earth Planet Sci Lett, 2002, 195(3–4): 195–210, doi: 10.1016/s0012-821x(01)00587-8
61 Cox S E, Thomson S N, Reiners P W, et al. Extremely low long-term erosion rates around the Gamburtsev Mountains in interior East Antarctica. Geophys Res Lett, 2010, 37(22): L22307, doi: 10.1029/2010gl045106
62 Torsvik T H, Gaina C, Redfield T F. Antarctica and global paleogeography: from rodinia, through Gondwanaland and Pangea, to the birth of the Southern Ocean and the opening of gateways//Cooper A K, et al. Antarctica: A Keystone in a Changing World. Proceedings of the 10th International Symposium on Antarctic Earth Sciences. Washington, DC: The National Academies Press, 2008: 11
63 Lal D, Harris N B W, Sharma K K, et al. Erosion history of the Tibetan Plateau since the last interglacial: constraints from the first studies of cosmogenic 10Be from Tibetan bedrock. Earth Planet Sci Lett, 2004, 217(1–2): 33–42, doi: 10.1016/S0012-821X(03)00600-9
64 Carbonell R, Pérez-Estaún A, Gallart J, et al. Crustal root beneath the Urals: wide-angle seismic evidence. Science, 1996, 274(5285): 222–224, doi: 10.1126/science.274.5285.222
65 Brown D, Spadea P, Puchkov V, et al. Arc-continent collision in the Southern Urals. Earth Sci Rev, 2006, 79(3–4): 261–287, doi: 10.1016/
Overview of seismic studies around Antarctic Gamburtsev Subglacial Mountains 89
j.earscirev.2006.08.00366 Mooney W D. Crust and lithospheric structure – global crustal
structure//Gerald S E I C. Treatise on Geophysics. Volume 1: Seismology and the Structure of the Earth. Amsterdam: Elsevier, 2007: 361–417
67 Siegert M J, Dowdeswell J A. Spatial variations in heat at the base of the Antarctic ice sheet from analysis of the thermal regime above subglacial lakes. J Glaciol, 1996, 42(142): 501–509
68 Siegert M J. Antarctic subglacial lakes. Earth Sci Rev, 2000, 50(1–2): 29–50, doi: 10.1016/S0012-8252(99)00068-9
69 Pollard D, DeConto R M, Nyblade A A. Sensitivity of Cenozoic Antarctic ice sheet variations to geothermal heat flux. Global Planet Change, 2005, 49(1–2): 63–74, doi: 10.1016/j.gloplacha.2005.05.003
70 Cuffey K M, Paterson W S B. The physics of glaciers, 4th ed. Burlington, MA: Elsevier, 2010: 704
71 De Q Robin G. Ice movement and temperature distribution in glaciers and ice sheets. J Glaciol, 1955, 2(18): 523–532, doi: 10.3189/002214355793702028
72 Carson C J, McLaren S, Roberts J L, et al. Hot rocks in a cold place: high sub-glacial heat flow in East Antarctica. J Geol Soc, 2014,
171(1): 9–12, doi: 10.1144/jgs2013-03073 Lee W H K. On the global variations of terrestrial heat-flow.
Phys Earth Planet Inter, 1970, 2(5): 332–341, doi: 10.1016/0031-9201(69)90026-0
74 Sclater J G, Francheteau J. The implications of terrestrial heat flow observations on current tectonic and geochemical models of the crust and upper mantle of the Earth. Geophys J Int, 1970, 20(5): 509–542, doi: 10.1111/j.1365-246X.1970.tb06089.x
75 Chapman D S, Pollack H N. Global heat flow: a new look. Earth Planet Sci Lett, 1975, 28(1): 23–32, doi: 10.1016/0012-821X(75)90069-2
76 Sclater J G, Jaupart C, Galson D. The heat flow through oceanic and continental crust and the heat loss of the Earth. Rev Geophys, 1980, 18(1): 269–311, doi: 10.1029/RG018i001p00269
77 Vitorello I, Pollack H N. On the variation of continental heat flow with age and the thermal evolution of continents. J Geophys Res, 1980, 85(B2): 983–995, doi: 10.1029/JB085iB02p00983
78 Wessel P, Smith W H F. Free software helps map and display data. EOS, 1991, 72(41): 441–446, doi: 10.1029/90EO00319