(a component unit of the state of connecticut ... · connecticut green bank (a component unit of...
TRANSCRIPT
CONNECTICUT GREEN BANK (A COMPONENT UNIT OF THE STATE OF CONNECTICUT)
COMPREHENSIVE ANNUAL FINANCIAL REPORT
FISCAL YEAR ENDED JUNE 30, 2017 (With Summarized Totals as of and for Fiscal Year Ended June 30, 2016)
Department of Finance and Administration 845 Brook Street
Rocky Hill, Connecticut
CONNECTICUT GREEN BANK TABLE OF CONTENTS JUNE 30, 2017
Introductory Section Page Letter of Transmittal i-v Board of Directors vi Organizational Chart vii GFOA Certificate of Achievement in Financial Reporting viii Financial Section Independent Auditors’ Report - Blum, Shapiro & Company, P.C. 1-3 Management’s Discussion and Analysis 4-13 Basic Financial Statements Financial Statements: Statement of Net Position 14-15 Statement of Revenues, Expenses and Changes in Net Position 16 Statement of Cash Flows 17 Notes to the Financial Statements 18-58 Required Supplementary Information Schedule of the Proportionate Share of the Net Pension Liability 59 Schedule of the Proportionate Share of Contributions to the State Employees’ Retirement System (SERS) 60 Statistical Section Financial Statistics
Introduction 61 Financial Trends: Net Position by Component 62 Changes in Net Position 63-65 Revenue Capacity: Operating Revenue by Source 66 Significant Sources of Operating Revenue 67 Debt Capacity: Outstanding Debt by Type 68 Demographic and Economic Information: Demographic and Economic Statistics 69 Principal Employers 70 Operating Information: FTE’s by Function 71 Operating Indicators by Function 72 Capital Asset Statistics by Function 73

Page
Non-Financial Statistics Introduction 74-75 1. Statement of the Connecticut Green Bank 76-78 2. Statement of the Non-Financial Statistics Auditor 79 3. Organizational Background 80 Governance 80-82 Ethics and Transparency 83 Open Connecticut 84 Small and Minority Owned Business Procurement 84 Efficiency 85-86 4. Measures of Success 87 Activity 87 Capital Deployed 88 Clean Energy Produced and Energy Saved 89 Clean Energy Technology Deployment 90-92 The Green Bank Model 93-94 Societal Benefits 95-96 Community Impacts 97-109 5. Programs 110 Program Logic Model and the Financing Market Transformation Strategy 110-115 Case 1 - C-PACE 116-127 Case 2 - Solar Lease 128-139 Case 3 - Residential Solar Investment Program 140-149 Case 4 - Smart-E Loan 150-159 Case 5 - Low Income Solar Lease and Energy-Efficiency Energy Savings Agreement 160-167 Case 6 - Multifamily Programs 168-178 Case 7 - CT Solar Loan (Graduated) 179-187 Anaerobic Digestion and Combined Heat and Power Pilot Programs 188-189 Strategic Investments 190-191 6. Appendix 192 Community Activity Table 192 Contractor Activity Table 192 Trained Contractor Table 192 Calculations and Assumptions 192-194 Index of Figures and Tables 195-199

INTRODUCTORY SECTION
i
October 26, 2017 We are pleased to present a Comprehensive Annual Financial Report (CAFR) of the Connecticut Green Bank (Green Bank) for the fiscal year ending June 30, 2017 accompanied by summarized totals as of and for the fiscal year ended June 30, 2016.
Management assumes full responsibility for the completeness and reliability of the information contained in this report based upon a comprehensive framework of internal controls that it has established for this purpose. To provide a reasonable basis for making these representations, the management of Green Bank has established a comprehensive internal control framework that is designed both to protect the entity’s assets from loss, theft, or misuse, and to compile sufficient reliable information for the preparation of Green Bank’s financial statements in conformity with accounting principles generally accepted in the United States of America (GAAP). Because the cost of internal controls should not outweigh the benefits, Green Bank’s comprehensive framework of internal controls has been designed to provide reasonable, rather than absolute assurance that the financial statements will be free from material misstatement. As such, management asserts that this financial report is complete and reliable in all material respects to the best of managements’ knowledge and belief.
Blum Shapiro & Company has issued an unmodified opinion on the Green Bank’s financial statements for the fiscal year ending June 30, 2017. The independent auditors’ report is presented in the financial section of this report. This letter of transmittal is designed to complement the Management’s Discussion and Analysis (MD&A) and should be read in conjunction with it. The Green Bank’s MD&A can be found immediately following the report of the independent auditors. SustainAbility has issued an independent opinion that the metrics, data collection, calculation methodologies, and transparency for the social benefits supported by the Green Bank are sound and represent best practice relative to peer financial institutions benchmarked. The independent opinion is presented in the non-financial statistics section of this report.
The Government Finance Officers Association of the United States and Canada (GFOA) awarded a Certificate of Achievement for Excellence in Financial Reporting to the Connecticut Green Bank for its comprehensive annual report for the fiscal years ending June 30, 2016, June 30, 2015 and June 30, 2014. In order to be awarded a Certificate of Achievement, a government must publish an easily readable and efficiently organized comprehensive annual financial report. This report must satisfy both generally accepted accounting principles and applicable legal requirements.
A Certificate of Achievement is valid for a period of one year only. We believe that our current comprehensive annual financial report continues to meet the Certificate of Achievement Program’s requirements and we are submitting it to the GFOA to determine its eligibility for another certificate.

ii
Profile of the Connecticut Green Bank
The Green Bank1 was established in a bipartisan manner by the Governor and Connecticut’s General Assembly on July 1, 2011 through Public Act 11-80 as a quasi-public agency that supersedes the former Connecticut Clean Energy Fund. As the nation’s first state green bank, the Connecticut Green Bank makes green energy more accessible and affordable for all Connecticut citizens and businesses by creating a thriving marketplace to accelerate the growth of green energy. We facilitate green energy deployment by leveraging a public-private financing model that uses limited public dollars to attract private capital investments. By partnering with the private sector, we create solutions that result in long-term, affordable financing to increase the number of green energy projects statewide.
The Green Bank was awarded the prestigious Harvard Kennedy School’s Ash Center’s “Innovations in American Government Awards” in 2017 for its “Sparking the Green Bank Movement” nomination. The Ash Center for Democratic Governance and Innovation advances excellence in governance and strengthens democratic institutions worldwide. Through its research, education, international programs, and government innovations awards, the Center fosters creative and effective government problem solving and serves as a catalyst for addressing many of the most pressing needs of the world’s citizens. The Innovations in American Government Award is the nation’s preeminent recognition for excellence and creativity in the public sector. The award program receives thousands of applications which are evaluated on criteria to assess their novelty, effectiveness, significance, and transferability. The Ford Foundation created the Innovations in American Government Awards in 1985 in response to widespread pessimism and distrust in government’s effectiveness.
The Green Bank’s vision is to lead the green bank movement by accelerating private investment in clean energy deployment for Connecticut to achieve economic prosperity, create jobs, promote energy security and address climate change. By accelerating the growth of green energy we contribute to a better quality of life, a better environment and a better future for Connecticut. The Green Bank’s mission is to support the Governor’s and Legislature’s energy strategy to achieve cleaner, cheaper and more reliable sources of energy while creating jobs and supporting local economic development.
To achieve its vision and mission, the Green Bank has established the following four goals:
1. To attract and deploy private capital investment to finance the clean energy2 policy goals for Connecticut.
2. To leverage limited public funds to attract multiples of private capital investment while returning and reinvesting public funds in clean energy deployment over time.
3. To develop and implement strategies that bring down the cost of clean energy in order to make it more accessible and affordable to consumers.
4. To support affordable and healthy buildings in low-to-moderate income and distressed communities by reducing the energy burden and addressing health and safety issues in their homes, businesses, and institutions.
These goals support the implementation of Connecticut’s clean energy policies be they statutory (i.e., Public Act 11-80, Public Act 13-298, Public Act 15-194), planning (i.e., Comprehensive Energy Strategy, Integrated Resources Plan), or regulatory in nature. The powers of the Green Bank are vested in and
1 Public Act 11‐80 repurposed the Connecticut Clean Energy Fund (CCEF) administered by Connecticut Innovations, into a separate quasi‐public organization called the Clean Energy Finance and Investment Authority (CEFIA). Per Public Act 14‐94, CEFIA was renamed to the Connecticut Green Bank.
2 Public Act 11‐80 defines "clean energy" broadly and includes familiar renewable energy sources such as solar photovoltaic, solar thermal, geothermal, wind and low‐impact hydroelectric energy, but also includes fuel cells, energy derived from anaerobic digestion (AD), combined heat and power (CHP) systems, infrastructure for alternative fuels for transportation and financing energy efficiency projects.
iii
exercised by a Board of Directors that is comprised of eleven voting and two non-voting members each with knowledge and expertise in matters related to the purpose of the organization. The Board of Directors and Staff are governed through the statute, as well as an Ethics Statement and Ethical Conduct Policy, Resolutions of Purposes, Bylaws, and Comprehensive Plan.
Initiatives and Results
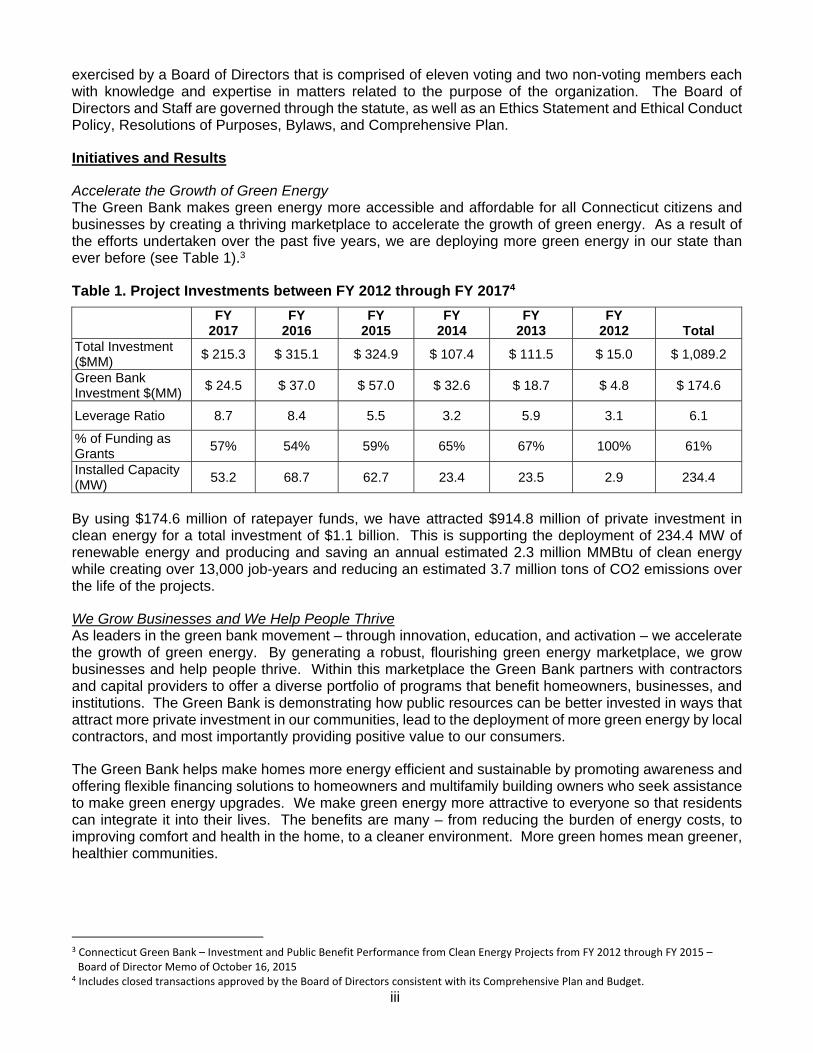
Accelerate the Growth of Green Energy The Green Bank makes green energy more accessible and affordable for all Connecticut citizens and businesses by creating a thriving marketplace to accelerate the growth of green energy. As a result of the efforts undertaken over the past five years, we are deploying more green energy in our state than ever before (see Table 1).3
Table 1. Project Investments between FY 2012 through FY 20174
FY
2017 FY
2016 FY
2015 FY
2014 FY
2013 FY
2012 Total Total Investment ($MM)
$ 215.3 $ 315.1 $ 324.9 $ 107.4 $ 111.5 $ 15.0 $ 1,089.2
Green Bank Investment $(MM)
$ 24.5 $ 37.0 $ 57.0 $ 32.6 $ 18.7 $ 4.8 $ 174.6
Leverage Ratio 8.7 8.4 5.5 3.2 5.9 3.1 6.1
% of Funding as Grants
57% 54% 59% 65% 67% 100% 61%
Installed Capacity (MW)
53.2 68.7 62.7 23.4 23.5 2.9 234.4
By using $174.6 million of ratepayer funds, we have attracted $914.8 million of private investment in clean energy for a total investment of $1.1 billion. This is supporting the deployment of 234.4 MW of renewable energy and producing and saving an annual estimated 2.3 million MMBtu of clean energy while creating over 13,000 job-years and reducing an estimated 3.7 million tons of CO2 emissions over the life of the projects.
We Grow Businesses and We Help People Thrive As leaders in the green bank movement – through innovation, education, and activation – we accelerate the growth of green energy. By generating a robust, flourishing green energy marketplace, we grow businesses and help people thrive. Within this marketplace the Green Bank partners with contractors and capital providers to offer a diverse portfolio of programs that benefit homeowners, businesses, and institutions. The Green Bank is demonstrating how public resources can be better invested in ways that attract more private investment in our communities, lead to the deployment of more green energy by local contractors, and most importantly providing positive value to our consumers.
The Green Bank helps make homes more energy efficient and sustainable by promoting awareness and offering flexible financing solutions to homeowners and multifamily building owners who seek assistance to make green energy upgrades. We make green energy more attractive to everyone so that residents can integrate it into their lives. The benefits are many – from reducing the burden of energy costs, to improving comfort and health in the home, to a cleaner environment. More green homes mean greener, healthier communities.
3 Connecticut Green Bank – Investment and Public Benefit Performance from Clean Energy Projects from FY 2012 through FY 2015 – Board of Director Memo of October 16, 2015
4 Includes closed transactions approved by the Board of Directors consistent with its Comprehensive Plan and Budget.
iv
The Green Bank makes green energy investments smarter and safer for businesses, including commercial and industrial customers, and institutions, including multifamily and not-for-profit organizations, with affordable, long-term financing for energy upgrades. We demonstrate how green energy improvements are smart investments that lower operating costs. We inspire them to embrace cleaner and more reliable sources of energy to power their buildings which stimulates a healthier local economy. Healthy buildings mean healthy businesses and institutions.
The Green Bank makes green energy more accessible and affordable to grow businesses and help people thrive.
We Believe in Inclusive Prosperity The green economy is for everyone. Washington, DC Mayor Bowser says it best “As the nation’s capital, we need to lead the way when it comes to protecting and preserving the environment. By creating a Green Bank, we will create more jobs for DC residents, which will allow us to continue our push for inclusive prosperity.” The Green Bank’s simple promise of increasing affordability and accessibility to green energy has evolved into a greater commitment to our stakeholders. We believe that everything we do, we do to help families thrive and businesses grow. We do it in the interest of achieving inclusive prosperity not only within Connecticut and across the country, but around the world. Leading the Green Bank Movement The Connecticut Green Bank is a leader in the green bank movement. The Connecticut Green Bank and its programs serve as models for other states across the country.
This year, we have seen several of our programs serving as replicable and scalable models, including:
Commercial Property Assessed Clean Energy (C-PACE) for commercial, industrial, multifamily, and non-profit buildings with Hannon Armstrong
Solar for All residential solar PV lease and energy efficiency energy savings agreement for low-to-moderate income households with PosiGen
The Connecticut Green Bank is leading a movement to use public funds more responsibly by attracting and deploying more private investment in green energy for the state’s economy and environment.
Responsible Public Investment in Green Energy
The Green Bank receives funding through a number of sources, including a Systems Benefit Charge, the Regional Greenhouse Gas Initiative (RGGI), renewable energy certificate (REC) sales and the federal government. The Green Bank’s predecessor organization’s programs were all structured as grants, which meant the funds were spent with no expectation of return. This model put the organization at the mercy of these funding streams which, while reliable, are largely determined by activities outside of our control such as levels of state electricity use and RGGI allowance prices. With the transition to a new financing model, the Green Bank is able to invest its funds in activities that earn a return and begin to build revenue streams that can be reinvested in green energy in Connecticut.
Acknowledgements
First and foremost, we would like to thank the Staff of the Connecticut Green Bank. Through their hard work, commitment and innovation, we have eclipsed $1 billion of investment into Connecticut’s economy and built a model that is delivering results for our state and serving as a model across the country and around the world.

v
We are grateful to our independent auditors, Blum Shapiro & Company and SustainAbility, for their assistance and advice during the course of this audit and review, and for supporting our interests in continuing to disclose not only our financial position, but also the public benefits to society resulting from our public-private investments.
Finally, we thank the Board of Directors for their continued leadership and guidance as we continue to prove that there is a new model for how government is able to play a part in deploying more green energy at a faster pace while using public resources responsibly.
Respectfully submitted,
Bryan T. Garcia George Bellas President and CEO Vice President - Finance and Administration

vi
Board of Directors
Connecticut Green Bank Position Status Voting Name Organization
State Treasurer (or designee) Ex Officio Yes Bettina Bronisz Treasurer’s Office
Commissioner of DEEP5 (or designee) Ex Officio Yes Robert Klee6 DEEP
Commissioner of DECD7 (or designee) Ex Officio Yes Catherine Smith8 DECD
Residential or Low Income Group Resigned Appointed
Yes
Pat Wrice Betsy Crum
Operation Fuel Women's Institute for Housing and Economic Development
Investment Fund Management Appointed Yes Norma Glover NJG Associates
Environmental Organization Appointed Yes Matthew Ranelli9 Shipman & Goodwin
Finance or Deployment Appointed Yes Thomas Flynn Environmental Data Resources
Finance of Renewable Energy Appointed Yes Reed Hundt10 Coalition for Green Capital
Finance of Renewable Energy Appointed Yes Kevin Walsh GE Energy Financial Services
Labor Organization Appointed Yes John Harrity IAM Connecticut
R&D or Manufacturing Resigned Appointed
Yes
Mun Choi Gina McCarthy
University of Connecticut Harvard T.H. Chan School of Public Health
President of the Green Bank Ex Officio No Bryan Garcia Connecticut Green Bank
Board of Connecticut Innovations11 Ex Officio No (unfilled) (unfilled)
Discretely Presented Component Units
Position Name
President Bryan Garcia
Treasurer George Bellas
Secretary Brian Farnen
Chief Investment Officer Roberto Hunter
5 Department of Energy and Environmental Protection 6 Vice Chairperson of the Board of Directors and Chairperson of the Budget and Operations Committee 7 Department of Economic and Community Development 8 Chairperson of the Board of Directors 9 Secretary of the Board of Directors and Chairperson of the Audit, Compliance and Governance Committee 10 Chairperson of the Deployment Committee 11 Catherine Smith also serves on the Board of Directors of Connecticut Innovations.

vii
Organizational Chart
Infrastructure Residential Commercial,Industrial & Institutional
Legal & Policy
Accounting
Operations
Marketing
Finance
Board of Directors
President& CEO
viii

FINANCIAL SECTION

Blum, Shapiro & Company, P.C.
29 South Main Street P.O. Box 272000 West Hartford, CT 06127-2000
Tel 860.561.4000 Fax 860.521.9241 blumshapiro.com
An independent member of Baker Tilly International
1
Independent Auditors’ Report
To the Board of Directors Connecticut Green Bank
Report on the Financial Statements
We have audited the accompanying financial statements of the business-type activities and discretely presented component units of the Connecticut Green Bank (the Green Bank) (a component unit of the State of Connecticut) as of and for the fiscal year ended June 30, 2017, and the related notes to the financial statements, which collectively comprise the Green Bank’s basic financial statements, as listed in the table of contents.
Management’s Responsibility for the Financial Statements
Management is responsible for the preparation and fair presentation of these financial statements in accordance with accounting principles generally accepted in the United States of America; this includes the design, implementation, and maintenance of internal control relevant to the preparation and fair presentation of financial statements that are free from material misstatement, whether due to fraud or error.
Auditors’ Responsibility
Our responsibility is to express opinions on these financial statements based on our audits. We conducted our audits in accordance with auditing standards generally accepted in the United States of America and the standards applicable to financial audits contained in Government Auditing Standards, issued by the Comptroller General of the United States. Those standards require that we plan and perform the audit to obtain reasonable assurance about whether the financial statements are free from material misstatement.
An audit involves performing procedures to obtain audit evidence about the amounts and disclosures in the financial statements. The procedures selected depend on the auditors’ judgment, including the assessment of the risks of material misstatement of the financial statements whether due to fraud or error. In making those risk assessments, the auditor considers internal control relevant to the entity’s preparation and presentation of the financial statements in order to design audit procedures that are appropriate in the circumstances, but not for the purpose of expressing an opinion on the effectiveness of the entity’s internal control. Accordingly, we express no such opinion. An audit also includes evaluating the appropriateness of accounting policies used and the reasonableness of significant accounting estimates made by management, as well as evaluating the overall presentation of the financial statements.
We believe that the audit evidence we have obtained is sufficient and appropriate to provide a basis for our audit opinions.

2
Opinions
In our opinion, the financial statements referred to above present fairly, in all material respects, the respective financial position of the business-type activities and the discretely presented component units of the Connecticut Green Bank as of June 30, 2017, and the respective changes in financial position and cash flows for the year then ended in accordance with accounting principles generally accepted in the United States of America.
Other Matters
Required Supplementary Information
Accounting principles generally accepted in the United States of America require that the management’s discussion and analysis on pages 4 through 13 and schedule of Green Bank’s proportionate share of the net pension liability and proportionate share of contributions to the state employees’ retirement system (SERS) on pages 59 and 60 be presented to supplement the basic financial statements. Such information, although not a part of the financial statements, is required by the Governmental Accounting Standards Board, which considers it to be an essential part of financial reporting for placing the financial statements in an appropriate operational, economic, or historical context. We have applied certain limited procedures to the required supplementary information in accordance with auditing standards generally accepted in the United States of America, which consisted of inquiries of management about the methods of preparing the information and comparing the information for consistency with management’s responses to our inquiries, the financial statements, and other knowledge we obtained during our audit of the financial statements. We do not express an opinion or provide any assurance on the information because the limited procedures do not provide us with sufficient evidence to express an opinion or provide assurance.
Other Information
Our audit was conducted for the purpose of forming opinions on the financial statements that collectively comprise Connecticut Green Bank’s basic financial statements. The introductory section, financial statistical section, and other statistical section are presented for purposes of additional analysis and are not a required part of the basic financial statements.
The introductory section, financial statistical section and other statistical section have not been subjected to the auditing procedures applied in the audit of the basic financial statements, and accordingly, we do not express an opinion or provide any assurance on them.
We also previously audited, in accordance with auditing standards generally accepted in the United States of America, the basic financial statements of the Connecticut Green Bank as of and for the year ended June 30, 2016 (not presented herein), and have issued our report thereon dated December 26, 2016, which contained unmodified opinions on the respective financial statements of the business-type activities and the discretely presented component units. The accompanying summarized comparative information as of June 30, 2016 is presented for purposes of additional analysis and is not a required part of the basic financial statements. Such information is the responsibility of management and was derived from and related directly to the underlying accounting and other records used to prepare the 2016 financial statements. The accompanying summarized comparative information has been subjected to the auditing procedures applied in the audit of the 2016 basic financial statements and certain additional procedures including comparing and reconciling such information directly to the underlying accounting and other records used to prepare those financial statements or to those financial statements themselves, and other additional procedures in accordance with auditing standards generally accepted in the United States of America. In our opinion, the summarized comparative information is fairly stated in all material respects in relation to the basic financial statements as a whole for the year ended June 30, 2016.
3
Other Reporting Required by Government Auditing Standards
In accordance with Government Auditing Standards, we have also issued our report dated October 26, 2017 on our consideration of the Connecticut Green Bank’s internal control over financial reporting and on our tests of its compliance with certain provisions of laws, regulations, contracts, and grant agreements and other matters. The purpose of that report is solely to describe the scope of our testing of internal control over financial reporting and compliance and the results of that testing, and not to provide an opinion on the effectiveness of the Connecticut Green Bank’s internal control over financial reporting or on compliance. That report is an integral part of an audit performed in accordance with Government Auditing Standards in considering the Connecticut Green Bank’s internal control over financial reporting and compliance.
West Hartford, Connecticut October 26, 2017

CONNECTICUT GREEN BANK
MANAGEMENT’S DISCUSSION AND ANALYSIS
4
The following Management’s Discussion and Analysis (MD&A) provides an overview of the financial performance of the Connecticut Green Bank (the Green Bank), formerly known as the Clean Energy Finance and Investment Authority, (a component unit of the State of Connecticut) for the fiscal year ended June 30, 2017. The information contained in this MD&A should be considered in conjunction with the information contained in the financial statements and notes to the financial statements included in the “Basic Financial Statements” section of this report. The Green Bank as a reporting entity is comprised of the primary government and two discretely presented component units as defined under Government Auditing Standards Board Statement No. 61: The Financial Reporting Entity: Omnibus and Amendment of GASB Statements No. 14 and No. 34. This MD&A discusses financial performance of both the primary government, the Green Bank, and its discretely presented component units, CT Solar Lease 2 LLC and CEFIA Solar Services Inc. We are including the performance of these component units in this analysis because they play an integral part in assisting the Green Bank in achieving its goal to deploy renewable energy in the State of Connecticut and to omit them from the analysis would not provide a complete picture of the Green Bank’s activities. Where possible we have distinguished activity pertaining solely to a component unit or the primary government in the discussion that follows. FINANCIAL STATEMENTS PRESENTED IN THIS REPORT On June 6, 2014, Public Act 14-94 of the State of Connecticut changed the name of the Clean Energy Finance and Investment Authority to the Connecticut Green Bank. The Green Bank is a quasi-public agency of the State of Connecticut established on July 1, 2011 by Section 16-245n of the Connecticut General Statutes, created for the purposes of, but not limited to: (1) implementing the Comprehensive Plan developed by the Green Bank pursuant to Section 16-245n(c) of the Connecticut General Statutes, as amended; (2) developing programs to finance and otherwise support clean energy investment in residential, municipal, small business and larger commercial projects, and such others as the Green Bank may determine; (3) supporting financing or other expenditures that promote investment in clean energy sources to foster the growth, development and commercialization of clean energy resources and related enterprises; and (4) stimulating demand for clean energy and the deployment of clean energy sources within the state that serve end-use customers in the State. The Green Bank constitutes the successor agency to Connecticut Innovations for the purposes of administering the Connecticut Clean Energy Fund in accordance with section 4-38d of the Connecticut General Statutes and therefore the net position of such fund was transferred to the newly created the Green Bank as of July 1, 2011. The basic financial statements include: Statement of Net Position, Statement of Revenues, Expenses and Changes in Net Position, and the Statement of Cash Flows. The Statement of Net Position provides a measure of the Green Bank’s economic resources. The Statement of Revenues, Expenses and Changes in Net Position measures the transactions for the periods presented and the impact of those transactions on the resources of the Green Bank. The Statement of Cash Flows reconciles the changes in cash and cash equivalents with the activities of the Green Bank for the period presented. The activities are classified as to operating, noncapital financing, capital and related financing, and investing activities. Notes to the basic financial statements provide additional detailed information to supplement the basis for reporting and nature of key assets and liabilities.

CONNECTICUT GREEN BANK
MANAGEMENT’S DISCUSSION AND ANALYSIS
5
FINANCIAL HIGHLIGHTS OF FISCAL 2017 NET POSITION The Green Bank’s overall net position increased slightly year over year. Net position as of June 30, 2017 and 2016 was $128.7 million and $127.4 million, respectively, an increase of $1.3 million. The components of net position show that unrestricted net position decreased to $51.2 million as of June 30, 2017 as compared to $62.7 million as of June 30, 2016, a decrease of $11.5 million. Contributing to this decrease in unrestricted net position was a transfer of a portion of the primary government’s available unrestricted cash balances into restricted cash balances to support the maintenance of loan loss reserves, interest rate buydowns, contractual obligations under the Clean Renewable Energy Bond and contractual obligations to maintain collateral accounts to support loan guarantees. This transfer is reflected in the component of net position designated as net position restricted for energy programs, which increased $11.5 million from $5.3 million as of June 30, 2016 to $16.8 million as of June 30, 2017. Restricted net position energy programs includes approximately $2.9 in proceeds received upon the issuance of Clean Renewable Energy Bonds by the Green Bank in fiscal year 2017 which the Green Bank, through its component unit, CGB Meriden Hydro LLC, will use to purchase a hydro-electric facility in fiscal year 2018 from the facility’s developer in a sale- lease back transaction. Note 17 Restricted Net Position provides a breakout by dollar amount of cash balances restricted for these programs. Green Bank assets increased $14.4 million in fiscal year 2017 to $191.3 million as of June 30, 2017 from $176.8 million as of June 30, 2016 primarily resulting from an increase of $8.9 million in program loans made by the primary government to support renewable energy installations and energy efficiency upgrades for both residential and commercial property owners in Connecticut and an increase in investments in capital assets by the component unit, CT LS2 LLC of $3.4 million. Investments in capital assets net of depreciation increased from $58.1 million as of June 30, 2016 to $61.5 million as of June 30, 2017, an increase of $3.4 million. This increase was the result of the purchase and construction of commercial solar PV systems by CT Solar Lease 2 LLC. These systems will either be leased or the electricity generated by them sold, to third party commercial, not for profit and municipal customers. During fiscal 2017, CT Solar lease 2 completed its acquisition of both residential and commercial solar PV systems which comprise the balance in capital assets. During fiscal year 2017, the Green Bank established a new component unit, CT Solar Lease 3 LLC, whose purpose will be to continue the acquisition of commercial solar PV systems begun by CT Solar Lease 2 LLC and to sell the electricity generated by these facilities to non-residential customers. Unrestricted cash and cash equivalents decreased $10.9 million to $37.1 million as of June 30, 2017 from $48.1 million as of June 30, 2016 and restricted cash and cash equivalents increased $12.3 million to $22.1 million as of June 30, 2017 from $9.8 million as of June 30, 2016 primarily for the reasons also discussed in the preceding paragraph. As of June 30, 2016, Green Bank assets included $1.0 million representing an equity investment in a company that developed uninterruptable power supply products. During fiscal 2017 the Green Bank fully reserved this investment which it made when it was managed as the Connecticut Clean Energy Fund by Connecticut Innovations, Inc. Connecticut Innovations investment staff continue to monitor and manage this investment and recommended a full reserve as of June 30, 2017. Investment staff will continue to monitor this investment and recommend changes to the reserve if warranted.

CONNECTICUT GREEN BANK
MANAGEMENT’S DISCUSSION AND ANALYSIS
6
Green Bank liabilities increased by $20.5 million in fiscal year 2017 to $72.6 million as of June 30, 2017 from $52.0 million as of June 30, 2016. Current liabilities, comprised of current maturities of long term debt, accounts payable and accrued expenses increased $6.2 million to $13.2 million as of June 30, 2017 compared to $ 7.0 million as of June 30, 2016. This increase was primarily the result of an increase in performance based incentives (PBI) payable to third party owners of solar facilities as of June 30, 2017 when compared to June 30, 2016 of $5.8 million. A portion of the $5.8 million, $1.7 million, represents the buyout of future PBI obligations to third party owners, which was approved by the Green Bank Board of Directors in fiscal year 2017. The significant increase in PBI liabilities resulted from the increase in residential solar PV systems coming on line and generating electricity in fiscal year 2017. The primary government is responsible for these obligations. Deferred revenues resulting from the development and acquisition of commercial solar PV systems by CEFIA Holdings LLC and CT Solar Lease 2 LLC and the leasing of residential solar PV systems by CT Solar Lease 2 LLC decreased $5.4 million to $872,000 as of June 30, 2017 from $6.3 million as of June 30, 2016 as the remaining commercial solar PV systems were completed in fiscal year 2017. The Green Bank’s allocation of the State of Connecticut State Employee Retirement System unfunded pension liability, as calculated under Government Accounting Standard Board (GASB) statement 68 increased $9.1 million in fiscal year 2017 to $25.2 million as of June 30, 2017 compared to $16.1 million as of June 30, 2016. The related Deferred Outflows of Resources, which represents timing differences in plan earnings, assumptions and Green Bank pension contributions increased $7.4 million to $10.0 million as of June 30, 2017 compared to $2.6 million as of June 30, 2016. Notes 15 and 16 provide further details regarding the pension plan. The primary government is responsible for this pension obligation. Long term debt increased $11.1 million in fiscal year 2017 to $29.7 million as of June 30, 2017 when compared to $18.6 million as of June 30, 2016. During fiscal year 2017, the Green Bank issued $2.9 million of Clean Renewable Energy Bonds. The proceeds from these bonds will be used by CGB Meriden Hydro LLC, a component of the primary government, to purchase a hydro-electric facility from the developer in fiscal year 2018 in a sale-leaseback transaction. During fiscal year 2017, CEFIA Solar Services, Inc. borrowed $1.8 million from the Connecticut Housing Finance Authority which it lent to CT Solar Lease 2 LLC to finance the installation of renewable energy and energy efficiency projects in municipal housing developments throughout Connecticut. The remainder of the increase in long term debt represents advances of $9.5 million made to CT Solar Lease 2 LLC under its credit facility with KeyBank for total of $14.2 million in new borrowings during fiscal year 2017. As of June 30, 2017, the Green Bank’s unfunded contingent grant and loan commitments, which are obligations of the primary government, the majority of which represent PBI payments to third party owners of solar facilities as described in Note 13, totaled $76 million. These grant and loan commitments are expected to be funded over the next one to six years from current and future unrestricted cash balances.

CONNECTICUT GREEN BANK
MANAGEMENT’S DISCUSSION AND ANALYSIS
7
The following table summarizes the net position of the reporting entity at June 30, 2017 and 2016:
Net Position(in thousands)
Increase2017 2016 (Decrease)
Cash and cash equivalents-unrestricted $ 37,148 $ 48,072 $ (10,924) Cash and cash equivalents-restricted 22,063 9,750 12,313 Bonds receivable 3,329 3,492 (163) Portfolio investments - 1,000 (1,000) Solar lease notes 8,113 9,008 (895) Program loans 42,206 33,268 8,938 Capital assets, net 61,510 58,115 3,395 Other assets 16,885 14,124 2,761
Total Assets 191,254 176,829 14,425
Deferred Outflows of ResourcesDeferred amount for pensions 9,978 2,575 7,403
Total deferred outflows of resources 9,978 2,575 7,403
Current liabilities 13,154 6,964 6,190 Unearned revenue 872 6,259 (5,387) Pension liabilities 25,245 16,096 9,149 Other long term liabilities 3,020 2,528 492 Fair value of interest rate swap 541 1,628 (1,087) Long term debt, less current maturities 29,737 18,567 11,170
Total liabilities 72,569 52,042 20,527
Deferred Inflows of ResourcesDeferred amount for pensions - - -
Total deferred outflows of resources - - -
Invested in capital assets 561 656 (95) Restricted Net Position: Non-expendable 60,027 58,709 1,318 Restricted - energy programs 16,843 5,295 11,548 Unrestricted 51,232 62,702 (11,470)
Total Net Position $ 128,663 $ 127,362 $ 1,301

CONNECTICUT GREEN BANK
MANAGEMENT’S DISCUSSION AND ANALYSIS
8
CHANGES IN NET POSITION Operating revenues decreased by $3.8 million to $34.0 million as of June 30, 2017 as compared to $37.8 million as of June 30, 2016. Continuing a trend in recent years, remittances to the Green Bank from utility companies representing the one mil per kilowatt hour charge to each end use customer of electric services in the State of Connecticut decreased $200,000 to $26.4 million for the fiscal year ended June 30, 2017 as compared to $26.6 million for the fiscal year ending June 30, 2016. Sales of Renewable Energy Credits (RECs) remained level year over year at $2.6 million for the fiscal year 2017 compared to $2.7 million for the fiscal year 2016. Proceeds received by the Green Bank from quarterly Regional Greenhouse Gas Initiative (RGGI) auctions declined $4.1 million year over year with proceeds of $2.4 million in fiscal year 2017 compared to proceeds of $6.5 million in fiscal year 2016. The decrease in proceeds received by the Green Bank can primarily be attributed to a decrease in the auction clearing price for CO2 allowances. For the four auctions in fiscal year 2016, the clearing price average was $6.18 per allowance while the clearing price average for the four auctions held in fiscal year 2017 was $3.40 per allowance. Contributing to the decline in auction proceed revenue was the diversion of approximately $800,000 in proceeds earmarked for the Green Bank to the State of Connecticut general fund under Public Act 16-3. Total payments of grants and incentives to commercial, not for profit, municipal and residential owners to install either solar PV systems or energy efficiency measures increased $6.4 million to $17.1 million in fiscal year 2017 compared to $10.6 million for the fiscal year 2016. PBI payments comprised the largest share of this increase as PV systems came on line in fiscal 2017 and began to generate electricity which provides the basis for the PBI payment. As a result of continuing efforts by Green Bank management to control costs, program administration expenses increased $327,000 to $16.8 million in fiscal 2017 from $16.5 million in fiscal 2016, a 2% increase. Included in program administration expenses is the non-cash depreciation expense for Solar PV capital assets acquired by CT Solar Lease 2 LLC of $2.3 million in fiscal 2017 and $1.5 million in fiscal 2016. General and administrative costs increased by $1 million to $5.7 million in fiscal year 2017 from $4.7 million in fiscal year 2016, a 2.2% increase. Included in general and administrative costs is an increase of $2.0 million year over year for the non-cash GASB 68 pension expense allocated to the Green Bank by the State of Connecticut which is not an expense that is controllable by Green Bank management. Interest earned on program investments and bank deposits increased $128,000 in fiscal 2017 to $3.1 million compared to $3 million. Interest as a revenue source is expected to continue to increase in future years as the Green Bank expands its investment portfolio. Interest expense increased $491,000 to $1.2 million from $731,000 as borrowings have increased to finance its leasing programs. The unrealized loss on investment of $1.0 million results from fully reserving the carrying cost of the Green Bank’s previously discussed equity investment. Capital contributions to CT SL2 LLC by its investor member decreased $5.9 million to $6.4 million in fiscal 2017 from $12.3 million in fiscal year. Capital contributions from the investor member are received as projects are completed. As of June 30, 2017, all capital contributions to CT SL2 LC due from the investor member have been received.

CONNECTICUT GREEN BANK
MANAGEMENT’S DISCUSSION AND ANALYSIS
9
The following table summarizes the changes in net position between June 30, 2017 and 2016:
Changes in Net Position(in thousands)
Increase2017 2016 (Decrease)
Revenues $ 33,967 $ 37,788 $ (3,821)
Operating ExpensesGrant and incentive payments 17,085 10,645 6,440 Program administration expenses 16,824 16,497 327 General and administrative expenses 5,725 4,706 1,019
Total operating expenses 39,634 31,848 7,786
Operating Income (5,667) 5,940 (11,607)
Non-Operating Revenues (Expenses)Interest earned 3,144 3,016 128 Interest expense (1,222) (731) (491) Investment loss (94) (33) (61) Unrealized loss on investment (1,000) - (1,000) Unrealized gain (loss) on interest rate swap 1,087 (968) 2,055 Provision for loan losses (956) (1,022) 66 Capital contribution by member 6,446 12,294 (5,848) Distribution to member (437) (301) (136)
Net Change 1,301 18,195 (15,894)
Net Position at Beginning of Year 127,362 109,167 18,195
Net Position at End of Year $ 128,663 $ 127,362 $ 1,301

CONNECTICUT GREEN BANK
MANAGEMENT’S DISCUSSION AND ANALYSIS
10
FINANCIAL HIGHLIGHTS OF FISCAL 2016 NET POSITION Total net position increased by $18.2 million to $127.4 million at June 30, 2016 compared to $109.2 million as of June 30, 2015. This growth was primarily driven by the acquisition of residential and commercial solar PV capital assets by a component unit of the primary government, CT Solar Lease 2 LLC, which increased $31.1 million to $58.1 million as of June 30, 2016 compared to $27.0 million as of June 30, 2015. Offsetting this growth in capital assets was a decrease in unrestricted net position of $9.2 million to $62.7 million as of June 30, 2016 compared to $71.9 million as of June 30, 2015. Significant factors affecting the decrease in unrestricted net position include an increase in long term debt to finance the acquisition of solar PV equipment by CT Solar Lease 2 LLC, an increase in the primary government’s pension obligation under GASB 68 and an increase in CT Solar Lease 2 LLC’s asset retirement obligation which is directly correlated to the increase in solar PV equipment placed into service in fiscal 2016. Unrestricted cash and cash equivalents increased $8.1 million to $48.1 million as of June 30, 2016 compared to $39.9 million as of June 30, 2015 primarily due to the sale of a portion of the Green Bank’s CPACE portfolio to an outside investor. Restricted cash over the same period increased $1.0 million to $9.75 million as a result in funds received which are to be used to administer a program of an agency of the State of Connecticut. The acquisition of $3.5 million in bonds was a part of the proceeds received by the Green Bank as a result of the sale of CPACE program loans during fiscal years 2014 through 2016. Note 5 provides further detail as to the future cash flows related to these bonds. The Green Bank’s portfolio of solar lease note principal decreased $811,000 due to scheduled principal repayments. Note 6 provides further detail as to future cash flows expected from this investment. The decrease in program loans in 2016 to $33.3 million as compared to $40.5 million in 2015 was primarily a result of sales of CPACE loans held in the Green Bank portfolio to an outside investor. Note 7 provides further detail regarding these sales The Green Bank’s allocation of the State of Connecticut State Employee Retirement System unfunded pension liability, as calculated under Government Accounting Standard Board (GASB) statement 68 increased $1.2 million in fiscal year 2016 to $16.1 million as of June 30, 2016 compared to $14.9 million as of June 30, 2015. The related Deferred Outflows of Resources, which represents timing differences in plan assumptions and Green Bank pension contributions increased $905,000 to $2.6 million as of June 30, 2016 compared to $1.7 million as of June 30, 2015. The related Deferred Inflows of Resources representing timing differences in plan earnings decreased $532,000 from its balance of $532,000 as of June 30, 2015. Notes 15 and 16 provide further details regarding the pension plan. As of June 30, 2016, the Green Bank’s unfunded contingent grant and loan commitments, all obligations of the primary government, the majority of which represent PBI payments to third party owners of solar facilities as described in Note 13, totaled $84.5 million. These grant and loan commitments are expected to be funded over the next one to six years from current and future unrestricted cash balances.

CONNECTICUT GREEN BANK
MANAGEMENT’S DISCUSSION AND ANALYSIS
11
The following table summarizes the net position of the reporting entity at June 30, 2016 and 2015:
Net Position(in thousands)
Increase2016 2015 (Decrease)
Cash and cash equivalents-unrestricted $ 48,072 $ 39,894 $ 8,178 Cash and cash equivalents-restricted 9,750 8,799 951 Bonds receivable 3,492 1,600 1,892 Portfolio investments 1,000 1,000 - Solar lease notes 9,008 9,819 (811) Program loans 33,268 40,518 (7,250) Capital assets, net 58,115 26,971 31,144 Other assets 14,124 8,972 5,152
Total Assets 176,829 137,573 39,256
Deferred Outflows of ResourcesDeferred amount for pensions 2,575 1,670 905
Total deferred outflows of resources 2,575 1,670 905
Current liabilities 6,964 6,825 139 Unearned revenue 6,259 2,519 3,740 Pension liabilities 16,096 14,900 1,196 Other long term liabilities 2,528 1,094 1,434 Fair value of interest rate swap 1,628 660 968 Long term debt, less current maturities 18,567 3,546 15,021
Total liabilities 52,042 29,544 22,498
Deferred Inflows of ResourcesDeferred amount for pensions - 532 (532)
Total deferred outflows of resources - 532 (532)
Invested in capital assets 656 501 155 Restricted Net Position: Non-expendable 58,709 32,468 26,241 Restricted - energy programs 5,295 4,344 951 Unrestricted 62,702 71,854 (9,152)
Total Net Position $ 127,362 $ 109,167 $ 18,195

CONNECTICUT GREEN BANK
MANAGEMENT’S DISCUSSION AND ANALYSIS
12
CHANGES IN NET POSITION Operating revenues decreased by $8.5 million in fiscal year 2016 primarily as a result of a decrease in RGGI auction proceeds of $10.1 million. The Green Bank received $6.5 million from the State in RGGI auction proceeds during the year as compared to RGGI auction proceeds of $16.6 million in 2015. Public Act 13-247 allowed the Commissioner of the Connecticut Department of Energy and Environmental Protection to transfer additional RGGI auction proceeds to The Green Bank to be used to support energy efficiency financing opportunities. This increase in RGGI auction proceeds helped offset payments to the State by the Green Bank required under Public Act 13-247 during fiscal year 2015. Helping to offset the decrease in RGGI auction proceeds was in increase in REC sales of $1.2 million over the prior year to $2.7 million for fiscal year 2016. Total expenditures for grants and programs in 2016 were $10.6 million, a decrease of $18,000 when compared to the total expenditures of $10.7 million in 2015. Included in these totals are payments representing financial incentives to residential and commercial property owners to install renewable energy or energy efficiency measures of $12.8 million in 2016 and $10.7 million in 2015. These financial incentives and the associated costs to administer these payments fluctuate from year to year as they are based on the achievement of contract milestones established by each the Green Bank program. General and administrative expenses increased by $1.6 million in 2016 to $4.7 million compared to $3.1 million in 2015 primarily resulting from expenditures for new marketing and branding initiatives undertaken in 2016.

CONNECTICUT GREEN BANK
MANAGEMENT’S DISCUSSION AND ANALYSIS
13
The following table summarizes the changes in net position between June 30, 2016 and 2015:
Changes in Net Position(in thousands)
Increase2016 2015 (Decrease)
Revenues $ 37,788 $ 46,294 $ (8,506)
Operating ExpensesGrant and incentive payments 10,645 10,627 18 Program administration expenses 16,497 11,504 4,993 General and administrative expenses 4,706 3,117 1,589
Total operating expenses 31,848 25,248 6,600
Operating Income 5,940 21,046 (15,106)
Non-Operating Revenues (Expenses)Interest earned 3,016 2,312 704 Interest expense (731) (119) (612) Investment loss (33) (1,180) 1,147 Unrealized loss on interest rate swap (968) (660) (308) Provision for loan losses (1,022) (564) (458) Capital contribution by member 12,294 6,844 5,450 Distribution to member (301) (105) (196) Payments to State of Connecticut - (19,200) 19,200
Net Change 18,195 8,374 10,017
Net Position at Beginning of Year 109,167 100,793 8,374
Net Position at End of Year $ 127,362 $ 109,167 $ 18,195
REQUESTS FOR INFORMATION This financial report is designed to provide a general overview of the Green Bank’s finances. Questions concerning any of the information provided in this report or request for additional financial information should be addressed to the Office of Finance and Administration, 845 Brook Street, Rocky Hill, Connecticut 06067.

CONNECTICUT GREEN BANK CONSOLIDATING STATEMENT OF NET POSITION JUNE 30, 2017 (with summarized totals for the year ended June 30, 2016)
Assets
Current Assets
Cash and cash equivalents
Accounts receivable
Utility remittance receivable
Other receivables
Due from component units
Prepaid expenses and other assets
Contractor loans
Current portion of solar lease notes
Current portion of program loans
Total current assets
Noncurrent Assets
Portfolio investments
Bonds receivable
Solar lease notes, less current portion
Program loans, less current portion
Renewable Energy Credits
Investment in component units
Capital assets, net of depreciation and
amortization
Asset retirement obligation, net
Restricted assets:
Cash and cash equivalents
Total noncurrent assets
Total Assets
Deferred Outflows of Resources
Deferred amount for pensions
Total Deferred Outflows of Resources
$ 29,705,100 $ 5,466,605 $ 1,975,578 $ 1,000 $ $ 37,148,283 $ 48,072,061
290,787 114,020 404,807 1,430,622
2,507,659 2,507,659 2,670,634
394,384 375,619 770,003 430,002
35,934,016 507,865 10,826,490 (47,268,371) - -
9,023,655 976,635 11,735 10,012,025 4,245,806
- 2,272,906
869,831 869,831 845,479
1,910,048 1,910,048 1,378,242
80,635,480 7,440,744 12,813,803 1,000 (47,268,371) 53,622,656 61,345,752
1 1 1,000,000
3,328,530 3,328,530 3,492,282
7,242,822 7,242,822 8,162,635
40,296,113 40,296,113 31,889,275
654,767 654,767 812,770
100 22,682,460 (22,682,560) - -
198,486 70,192,062 (8,880,341) 61,510,207 58,114,914
2,535,104 2,535,104 2,261,472
17,560,622 4,502,784 22,063,406 9,749,983
69,281,441 77,229,950 22,682,460 - (31,562,901) 137,630,950 115,483,331
149,916,921 84,670,694 35,496,263 1,000 (78,831,272) 191,253,606 176,829,083
9,978,107 9,978,107 2,575,368
9,978,107 - - - - 9,978,107 2,575,368
CT Solar Lease 3 LLC
Discretely Presented Component Units
2017 Total Reporting
Entity
2016 Total Reporting
EntityCT Solar
Lease 2 LLCCEFIA Solar Services Inc.
Total Primary Government
Eliminating Entries
The accompanying notes are an integral part of the financial statements
14

CONNECTICUT GREEN BANK CONSOLIDATING STATEMENT OF NET POSITION (CONTINUED) JUNE 30, 2017 (with summarized totals for the year ended June 30, 2016)
Liabilities and Net Position
Liabilities
Current maturities of long-term debt
Accounts payable and accrued expenses
Due to component units
Due to outside agency
Custodial liability
Unearned revenue
Total current liabilities
Asset retirement obligation
Long-term debt, less current maturities
Fair value of interest rate swap
Pension liability
Total liabilities
Net Position
Invested in capital assets
Restricted Net Position:
Nonexpendable
Restricted for energy programs
Unrestricted (deficit)
Total Net Position
$ 194,090 $ 2,358,281 $ 94,788 $ $ $ 2,647,159 $ 1,794,181
7,994,515 657,697 8,734 8,660,946 2,984,746
507,865 13,599,055 33,160,451 1,000 (47,268,371) - -
- 30,127
1,844,791 1,844,791 2,155,128
871,714 871,714 6,258,204
10,541,261 17,486,747 33,263,973 1,000 (47,268,371) 14,024,610 13,222,386
3,020,405 3,020,405 2,528,335
5,241,847 22,749,427 1,745,725 29,736,999 18,567,419
540,877 540,877 1,627,864
25,245,439 25,245,439 16,096,113
41,028,547 43,797,456 35,009,698 1,000 (47,268,371) 72,568,330 52,042,117
198,486 450,844 (88,803) 560,527 655,737
91,121 68,727,413 (8,791,538) 60,026,996 58,709,303
16,798,243 45,028 16,843,271 5,294,983
101,778,631 (28,350,047) 486,565 (22,682,560) 51,232,589 62,702,311
$ 118,866,481 $ 40,873,238 $ 486,565 $ - $ (31,562,901) $ 128,663,383 $ 127,362,334
CT Solar Lease 3 LLC
2017 Total Reporting
Entity
2016 Total Reporting
EntityEliminating
EntriesCT Solar
Lease 2 LLCCEFIA Solar Services Inc.
Total Primary Government
Discretely Presented Component Units
The accompanying notes are an integral part of the financial statements
15

CONNECTICUT GREEN BANK CONSOLIDATING STATEMENT OF REVENUES, EXPENDITURES AND CHANGES IN NET ASSETS FOR THE YEAR ENDED JUNE 30, 2017 (with summarized totals for the year ended June 30, 2016)
Operating Revenues
Utility remittances
Grant revenue
RGGI auction proceeds
Energy system sales
REC sales
Other income
Total operating revenues
Operating Expenses
Cost of goods sold - energy systems
Grants and incentive programs
Program administration expenses
General and administrative expenses
Total operating expenses
Operating Income (Loss)
Nonoperating Revenue (Expenses)
Interest income - promissory notes
Interest income - short-term cash deposits
Interest expense long-term debt
Interest income - component units
Interest expense - component units
Distributions to member
Realized gain (loss) on investments
Unrealized gain (loss) on investments
Unrealized gain (loss) on interest rate swap
Provision for loan losses
Total nonoperating revenue (expenses)
Change in Net Position before
Capital Contributions
Capital contributions
Change in Net Position
Net Position - Beginning of Year
Net Position - End of Year
Total Primary Government
CT Solar Lease 2 LLC
CEFIA Solar Services Inc.
CT Solar Lease 3 LLC Eliminations
$ 26,404,349 $ $ $ $ $ 26,404,349 $ 26,605,084
98,486 98,486 589,917
2,392,647 2,392,647 6,481,562
12,689,540 (12,689,540) - -
2,214,000 356,647 2,570,647 2,653,783
240,994 3,303,236 129,227 (1,173,038) 2,500,419 1,457,889
44,040,016 3,659,883 129,227 - (13,862,578) 33,966,548 37,788,235
11,333,034 (11,333,034) - -
18,128,022 (1,043,811) 17,084,211 10,644,334
13,228,749 3,884,129 (288,496) 16,824,382 16,497,328
5,228,711 620,912 4,998 (129,227) 5,725,394 4,706,315
47,918,516 4,505,041 4,998 - (12,794,568) 39,633,987 31,847,977
(3,878,500) (845,158) 124,229 (1,068,010) (5,667,439) 5,940,258
2,921,710 2,921,710 2,895,504
189,237 17,615 16,446 223,298 120,613
(228,502) (961,956) (31,926) (1,222,384) (730,839)
61,455 31,437 (92,892) - -
(92,892) 92,892 - -
(436,452) (436,452) (301,548)
(93,974) (93,974) (33,723)
(999,998) (999,998) -
1,086,987 1,086,987 (967,791)
(956,489) (956,489) (1,021,826)
893,439 (386,698) 15,957 - - 522,698 (39,610)
(2,985,061) (1,231,856) 140,186 - (1,068,010) (5,144,741) 5,900,648
8,145,358 (1,699,568) 6,445,790 12,294,443
(2,985,061) 6,913,502 140,186 - (2,767,578) 1,301,049 18,195,091
121,851,542 33,959,736 346,379 - (28,795,323) 127,362,334 109,167,243
$ 118,866,481 $ 40,873,238 $ 486,565 $ - $ (31,562,901) $ 128,663,383 $ 127,362,334
Discretely Presented Component Units
2016 Total Reporting Entity
2017 Total Reporting Entity
The accompanying notes are an integral part of the financial statements
16

CONNECTICUT GREEN BANKCONSOLIDATING STATEMENT OF CASH FLOWS FOR THE YEAR ENDED JUNE 30, 2017(with summarized totals for the year ended June 30, 2016)
Cash Flows from Operating Activities Sales of energy systemsSales of Renewable Energy CreditsUtility company remittancesGrantsRGGI auction proceedsOther incomeLease payments receivedProgram administrative expensesGrants, incentives and credit enhancementsPurchases of energy equipmentGeneral and administrative expenditures
Net cash provided by (used in) operating activities
Cash Flows from Noncapital Financing Activities Funds received (disbursed) from escrow and custodial accounts Advances to CGB component units Advances repaid (disbursed) to third party capital providers Subordinated debt advance to component units Advances from CGB and component units Repayments of advances (to) from component units
Net cash provided by (used in) noncapital financing activities
Cash Flows from Capital and Related Financing Activities Purchase of capital assets Proceeds from long-term debtRepayment of long-term debtInterest expenseProceeds from subordinated debt with component unitCapital contributions from (to) component entitiesCapital contributions from Firstar Development, LLCReturn of capital to Firstar Development, LLC
Net cash provided by (used in) capital and related financing activities
Cash Flows from Investing ActivitiesLoan lossesReturn of principal on WC & program loansInterest on short-term investments, cash, solar lease notes and loansCPACE program loan disbursementsGrid Tied program loan disbursementsAD/CHP program loan disbursementsAlpha/Operational Demo program loan disbursementsEnergy Efficiency program loan disbursementsHOPBI program loan disbursementsResidential Solar Loan program disbursements
Net cash used in investing activities
Net Increase (Decrease) in Cash and Cash Equivalents
Cash and Cash Equivalents - Beginning of Year
Cash and Cash Equivalents - End of Year
Reconciliation of Operating Income (Loss) to Net Cash
Provided by (Used in) Operating Activities:
Operating income (loss)
Adjustments to reconcile operating income (loss)
to net cash provided by (used in) operating activities:
Depreciation
Accretion
Deferred lease revenue
Pension expense adjustment
Other
Changes in operating assets and liabilities:
(Increase) decrease in operating assets
(Decrease) increase in operating liabilities
Net Cash Provided by (Used in) Operating Activities
$ 18,826,940 $ $ $ $ (18,304,578) $ 522,362 $ - 2,214,000 301,088 2,515,088 2,443,524
26,567,324 26,567,324 26,453,300 99,949 99,949 797,101
3,560,543 3,560,543 5,313,666 251,047 1,778,549 2,029,596 1,240,305
1,295,956 1,295,956 976,737 (13,734,338) (1,602,391) (15,336,729) (14,773,218) (10,842,910) (10,842,910) (11,170,406) (16,907,742) (16,907,742) (34,278,291) (2,666,644) (454,892) (12,500) (3,134,036) (4,910,476) 7,368,169 1,318,310 (12,500) - (18,304,578) (9,630,599) (27,907,758)
(564,964) (564,964) 1,035,343 (3,001,000) 3,001,000 - -
90,908 90,908 - (414,990) 414,990 - - 5,875,000 3,000,000 1,000 (8,876,000) - - (5,875,000) 5,875,000 - -
(3,475,056) 5,875,000 (3,289,990) 1,000 414,990 (474,056) 1,035,343
(105,149) (18,304,578) 18,304,578 (105,149) (67,646) 2,957,971 9,500,633 1,895,807 14,354,411 17,510,837 (715,950) (1,560,600) (55,294) (2,331,844) (1,002,770) (172,379) (906,238) (31,926) (1,110,543) (637,267)
414,990 (414,990) - - 1,699,567 (1,699,567) - - 6,445,790 6,445,790 12,294,443 (412,606) (412,606) (219,969)
1,964,493 (3,123,042) 109,020 - 17,889,588 16,840,059 27,877,628
(20,277) 9,531,886 9,531,886 26,765,812 2,679,839 17,615 47,883 2,745,337 2,225,388
(5,602,984) (5,602,984) (15,474,204) (319,471) (319,471) (911,249)
(1,997,403) (1,997,403) - (15,000) (15,000) (350,000)
(130,000) (130,000) - - (1,093,599)
(9,537,847) (9,537,847) (3,037,972) (5,411,257) 17,615 47,883 - - (5,325,482) 8,124,176
446,349 4,087,883 (3,145,587) 1,000 - 1,389,645 9,129,389
46,819,373 5,881,506 5,121,165 - - 57,822,044 48,692,655
$ 47,265,722 $ 9,969,389 $ 1,975,578 $ 1,000 $ - $ 59,211,689 $ 57,822,044
$ (3,878,500) $ (845,158) $ 124,229 $ $ (1,068,010) $ (5,667,439) $ 5,940,258
116,584 2,307,546 2,424,130 1,777,556
(273,633) (273,633) 105,843
- (41,040)
1,746,587 1,746,587 -
- 92,396
8,821,259 (272,997) (129,230) (17,236,568) (8,817,536) (37,716,132)
562,239 402,552 (7,499) 957,292 1,933,361
$ 7,368,169 $ 1,318,310 $ (12,500) $ - $ (18,304,578) $ (9,630,599) $ (27,907,758)
Discretely Presented Component Units
Total Primary Government
Eliminating Entries
2017 Total Reporting
Entity
2016 Total Reporting
EntityCT Solar
Lease 2 LLCCEFIA Solar Services Inc.
CT Solar Lease 3 LLC
The accompanying notes are an integral part of the financial statements
17

CONNECTICUT GREEN BANK NOTES TO FINANCIAL STATEMENTS FOR THE YEAR ENDED JUNE 30, 2017
18
1. NATURE OF OPERATIONS AND SIGNIFICANT ACCOUNTING POLICIES
Nature of Operations
The Connecticut Green Bank (the Green Bank) was established in July 2011 under Title 16, Sec. 16-245n of the General Statutes of the State of Connecticut as the successor entity of the Connecticut Clean Energy Fund. The Green Bank, a component unit of the State of Connecticut, was created to promote energy efficiency and investment in renewable energy sources in accordance with a comprehensive plan developed by it to foster the growth, development and commercialization of renewable energy sources and related enterprises and stimulate demand for renewable energy and deployment of renewable energy sources which serve end-use customers in the State. The Green Bank constitutes the successor agency to Connecticut Innovations Incorporated (CI), a quasi-public agency of the State of Connecticut, for the purposes of administering the Clean Energy Fund in accordance with section 4-38d of the Connecticut General Statutes and therefore the net position of such fund was transferred to the newly created Green Bank as of July 1, 2011.
On June 6, 2014, Public Act 14-94 of the State of Connecticut changed the name of the Clean Energy Finance and Investment Authority to the Connecticut Green Bank.
Prior Period Summarized Financial Information
The basic financial statements include certain prior year summarized comparative information in total but not at the level of detail required for a presentation in conformity with accounting principles generally accepted in the United States of America. Accordingly, such information should be read in conjunction with the Green Bank’s financial statements for the year ended June 30, 2016, from which the summarized information was derived.
Principal Revenue Sources
The Public Utility Regulatory Authority (PURA) assesses a charge per kilowatt-hour to each end-use customer of electric services provided by utility companies (excluding municipally owned entities) in the state, which is paid to the Green Bank and is the principal source of the Green Bank’s revenue. The Green Bank may deploy the funds for loans, direct or equity investments, contracts, grants or other actions that support energy efficiency projects and research, development, manufacture, commercialization, deployment and installation of renewable energy technologies.
The Green Bank also receives a portion, currently 23%, of proceeds the State of Connecticut receives from quarterly Regional Greenhouse Gas Initiative (RGGI) auctions. These proceeds finance energy efficiency and renewable energy projects through the Green Bank’s CPACE program. The Green Bank also earns both interest income and revenue from the sale of Solar Renewable Energy Credits (SREC’s) generated by facilities it has financed.
CONNECTICUT GREEN BANK NOTES TO FINANCIAL STATEMENTS FOR THE YEAR ENDED JUNE 30, 2017
19
1. NATURE OF OPERATIONS AND SIGNIFICANT ACCOUNTING POLICIES (CONTINUED)
Reporting Entity
The Green Bank, as the primary government, follows the reporting requirements of Governmental Accounting Standards Board (GASB) Statement No. 61 (The Financial Reporting Entity Omnibus - an Amendment of GASB Statements No. 14 and No. 34) (the Statement) regarding presentation of component units. The Statement modifies certain requirements for including component units in the reporting entity, either by blending (recording their amounts as part of the primary government), or discretely presenting them (showing their amounts separately in the reporting entity’s financial statements). To qualify as a blended component unit, the unit must meet one of the following criteria: 1) have substantively the same governing body as that of the primary government, and either (A) a financial benefit or burden relationship exists between the unit and the primary government, or (B) management of the primary government (below the level of the governing body) has operational responsibility of the unit; 2) the unit provides services or benefits exclusively or almost exclusively to the primary government; or 3) the unit’s total debt outstanding, including leases, is expected to be repaid by resources of the primary government. A unit which fails to meet the substantively the same governing requirement may still be included as a discretely presented component unit, if the primary government has appointed the voting majority of the component unit’s governance or met other criteria specified in the Statement such as whether or not it would be misleading were the entity to be excluded.
The Green Bank, as of June 30, 2017, has established five legally separate for-profit entities whose collective purpose is to administer the Green Bank’s solar energy programs. The Green Bank believes to exclude any of the entities from these financial statements would be misleading. Each entity is listed below, along with whether it is included as a blended component unit (blended) or qualifies as a discretely presented component unit (discrete) within these financial statements based on the criteria previously described.
CEFIA Holdings LLC (blended)
A Connecticut limited liability company (LLC), 99% owned by the Green Bank (1% owned by CI), established to acquire and develop a portfolio of commercial and residential solar facilities and, through its CT Solar Lease 2 program, to enable investment in solar photovoltaic equipment for the benefit of Connecticut homeowners, businesses, not-for-profits and municipalities (the End Users). CEFIA Holdings LLC acquires the initial title to the solar assets and contracts with independent solar installers to complete the installation of the solar assets and arrange for the leasing of the solar assets (or sale of energy under power purchase agreements) to the End Users. CEFIA Holdings LLC is also responsible for procuring insurance for the solar assets, operation and maintenance services as well as warranty management services for the ultimate owner of the solar assets, CT Solar Lease 2 LLC, to which CEFIA Holdings LLC sells the residential and commercial projects before the projects are placed in service. After acquiring the residential and commercial projects, CT Solar Lease 2 LLC administers the portfolio of projects with the assistance of Renew Financial Corporation. The Green Bank’s Board of Directors acts as the governing authority of CEFIA Holdings LLC. The Green Bank appoints its employees to manage the operations of CEFIA Holdings LLC. The Green Bank is also financially responsible (benefit/burden) for CEFIA Holdings LLC’s activities.

CONNECTICUT GREEN BANK NOTES TO FINANCIAL STATEMENTS FOR THE YEAR ENDED JUNE 30, 2017
20
1. NATURE OF OPERATIONS AND SIGNIFICANT ACCOUNTING POLICIES (CONTINUED)
CT Solar Loan I LLC (blended)
A limited-liability company, wholly-owned by CEFIA Holdings LLC, CT Solar Loan I LLC was established to make loans to residential property owners for the purpose of purchasing and installing solar photovoltaic equipment. The Green Bank’s Board of Directors acts as the governing authority of CT Solar Loan I LLC. The Green Bank appoints its employees to manage the operations of CT Solar Loan I LLC. The Green Bank is also financially responsible (benefit/burden) for CT Solar Loan I LLC’s activities.
CEFIA Solar Services, Inc. (discrete)
A Connecticut corporation, 100% owned by CEFIA Holdings LLC, established to share in the ownership risks and benefits derived from the leasing of solar photovoltaic and the sale of energy under power purchase agreements as managing member of CT Solar Lease 2 LLC. CEFIA Solar Services, Inc. (Solar Services) has a one percent ownership interest in CT Solar Lease 2 LLC and is its managing member. Solar Services is responsible for performing all management and operational functions pursuant to the Operating Agreement of CT Solar Lease 2 LLC. The Green Bank through CEFIA Holdings LLC directly appoints the Board of Directors of Solar Services. The Board of Directors is comprised exclusively of Green Bank employees. The primary government’s intent for owning a controlling interest in Solar Services is to enhance its ability to offer financing options to commercial entities and residents of Connecticut wishing to install renewable energy equipment. The Green Bank believes that to exclude Solar Services from these financial statements would be misleading.
CT Solar Lease 2 LLC (discrete)
A Connecticut limited-liability company, CT Solar Lease 2 LLC acquires title to the residential and commercial solar projects from the developer, CEFIA Holdings LLC, using capital from its members along with non-recourse funding from participating banks. Repayment to participating banks is predicated upon the property owners’ payment to CT Solar Lease 2 LLC of their obligations under leases and power purchase agreements, as well as revenue earned from production-based incentives. CT Solar Lease 2 LLC is owned ninety-nine percent (99%) by Firstar Development, LLC, a Delaware limited liability company, as the Investor Member and one percent (1%) by CEFIA Solar Services Inc., as the Managing Member. The primary government’s intent to provide management services through Solar Services is to directly enhance its ability to provide financing options to commercial entities and residents of Connecticut wishing to install renewable energy equipment. Although the Green Bank has a minority membership interest in CT Solar Lease 2 LLC, the Green Bank believes that to exclude it from these financial statements would be misleading.
As of June 30, 2017, CT Solar Lease 2 LLC has completed its acquisition of residential and commercial solar projects from the developer. All projects have been placed in service and are generating revenue. CT Solar Lease 2 LLC has also received all capital contributions required under its Operating Agreement from its members.

CONNECTICUT GREEN BANK NOTES TO FINANCIAL STATEMENTS FOR THE YEAR ENDED JUNE 30, 2017
21
1. NATURE OF OPERATIONS AND SIGNIFICANT ACCOUNTING POLICIES (CONTINUED)
CT Solar Lease 3 LLC (discrete)
A Connecticut limited-liability company, CT Solar Lease 3 LLC, will acquire title to commercial solar projects from the developer, CEFIA Holdings LLC, using capital from its members. CT Solar Lease 3 LLC’s primary sources of revenue will be from the sale of electricity generated by its solar PV facilities to property owners through power purchase agreements and the sale of RECs generated from facility electrical production to third parties. As of June 30, 2017, CT Solar Lease 3 LLC had a single member, CEFIA Solar Services Inc. (Solar Services). As of June 30, 2017, CT Solar Lease 3 LLC has not commenced operations. During fiscal year 2018, Solar Services plans to admit an investor member into CT Solar Lease 3 LLC. See subsequent events for developments regarding this component unit subsequent to June 30, 2017 but prior to the issuance of this report.
Advances between the primary government (the Green Bank) and its component units, or between the component units themselves, involved establishment of funds to provide for loan loss reserves as well as pay certain organizational costs. Advances were eliminated in preparing the combining and reporting entity financial statements.

CONNECTICUT GREEN BANK NOTES TO FINANCIAL STATEMENTS FOR THE YEAR ENDED JUNE 30, 2017
22
1. NATURE OF OPERATIONS AND SIGNIFICANT ACCOUNTING POLICIES (CONTINUED)
Condensed combining information for the primary government (The Green Bank) and its two blended component units (CEFIA Holdings LLC and CT Solar Loan I LLC) is presented as follows:
Condensed, Combining Information - Statement of Net Position
Assets
Current Assets
Cash and cash equivalents $ 19,766,551 $ 3,081,696 $ 6,856,853 $ $ 29,705,100
Accounts receivable 243,186 1,080 46,521 290,787
Utility remittance receivable 2,507,659 2,507,659
Other receivables 394,384 394,384
Due from component units 45,078,634 5,294,126 (14,438,744) 35,934,016
Prepaid expenses and other assets 563,936 17,755 8,441,964 9,023,655
Contractor loans
Current portion of solar lease notes 869,831 869,831
Current portion of program loans 1,712,551 197,497 1,910,048
Total current assets 71,136,732 3,298,028 20,639,464 (14,438,744) 80,635,480
Noncurrent Assets
Portfolio investments 1 1
Bonds receivable 3,328,530 3,328,530
Solar lease notes, less current portion 7,242,822 7,242,822
Program loans, less current portion 37,172,357 3,123,756 40,296,113
Renewable Energy Credits 654,767 654,767
Investment in component units 99,100 100 (99,100) 100
Capital assets, net of depreciation and
amortization 198,486 198,486
Asset retirement obligation, net
Restricted assets:
Cash and cash equivalents 17,259,690 300,932 17,560,622
Total noncurrent assets 65,955,753 3,424,688 100 (99,100) 69,281,441
Total Assets 137,092,485 6,722,716 20,639,564 (14,537,844) 149,916,921
Deferred Outflows of Resources
Deferred amount for pensions 9,978,107 9,978,107
Total Deferred Outflows of Resources 9,978,107 - - - 9,978,107
Eliminating Entries
Total Primary GovernmentCGB
CT Solar Loan I LLC
CEFIA Holdings LLC

CONNECTICUT GREEN BANK NOTES TO FINANCIAL STATEMENTS FOR THE YEAR ENDED JUNE 30, 2017
23
1. NATURE OF OPERATIONS AND SIGNIFICANT ACCOUNTING POLICIES (CONTINUED)
Condensed, Combining Information - Statement of Net Position (Continued)
Liabilities and Net Position
Liabilities
Current maturities of long-term debt $ 53,418 $ 140,672 $ $ $ 194,090
Accounts payable and accrued expenses 7,910,104 4,706 79,705 7,994,515
Due to component units 508,765 4,072,500 10,365,344 (14,438,744) 507,865
Due to outside agency
Custodial liability 762,379 1,082,412 1,844,791
Unearned revenue
Total current liabilities 9,234,666 4,217,878 11,527,461 (14,438,744) 10,541,261
Asset retirement obligation
Long-term debt, less current maturities 2,904,553 2,337,294 5,241,847
Fair value of interest rate swap
Pension liability 25,245,439 25,245,439
Total liabilities 37,384,658 6,555,172 11,527,461 (14,438,744) 41,028,547
Net Position
Invested in capital assets 198,486 198,486
Restricted Net Position:
Nonexpendable 91,121 91,121
Restricted for energy programs 16,497,311 300,932 16,798,243
Unrestricted (deficit) 92,990,137 (133,388) 9,020,982 (99,100) 101,778,631
Total Net Position $ 109,685,934 $ 167,544 $ 9,112,103 $ (99,100) $ 118,866,481
Eliminating Entries
Total Primary GovernmentCGB
CT Solar Loan I LLC
CEFIA Holdings LLC

CONNECTICUT GREEN BANK NOTES TO FINANCIAL STATEMENTS FOR THE YEAR ENDED JUNE 30, 2017
24
1. NATURE OF OPERATIONS AND SIGNIFICANT ACCOUNTING POLICIES (CONTINUED)
Condensed, Combining Information - Statement of Revenues, Expenses and Changes in Net Position
Eliminating Entries
Total Primary Government
Operating RevenuesUtility remittances $ 26,404,349 $ $ $ $ 26,404,349
Grant revenue 98,486 98,486
RGGI auction proceeds 2,392,647 2,392,647
Energy system sales 12,689,540 12,689,540
REC sales 2,214,000 2,214,000
Other income 240,371 623 240,994
Total operating revenues 31,349,853 623 12,689,540 - 44,040,016
Operating Expenses
Cost of goods sold - energy systems 11,333,034 11,333,034
Grants and incentive programs 18,128,022 18,128,022
Program administration expenses 13,011,308 58,630 158,811 13,228,749
General and administrative expenses 5,210,521 7,021 11,169 5,228,711
Total operating expenses 36,349,851 65,651 11,503,014 - 47,918,516
Operating Income (Loss) (4,999,998) (65,028) 1,186,526 (3,878,500)
Nonoperating Revenue (Expenses)Interest income - promissory notes 2,680,027 241,683 2,921,710
Interest income - short-term cash deposits 181,430 88 7,719 189,237
Interest expense long-term debt (56,123) (172,379) (228,502)
Interest income - component units 61,455 61,455
Interest expense - component units
Distributions to member
Realized gain (loss) on investments (93,974) (93,974)
Unrealized gain (loss) on investments (999,998) (999,998)
Unrealized gain (loss) on interest rate swap
Provision for loan losses (956,489) (956,489)
Total nonoperating revenue (expenses) 816,328 69,392 7,719 - 893,439
Change in Net Position before
Capital Contributions (4,183,670) 4,364 1,194,245 (2,985,061)
Capital contributions 100 (100)
Change in Net Position (4,183,570) 4,364 1,194,245 (100) (2,985,061)
Net Position - Beginning of Year 113,869,504 163,180 7,917,858 (99,000) 121,851,542
Net Position - End of Year $ 109,685,934 $ 167,544 $ 9,112,103 $ (99,100) $ 118,866,481
CT Solar Loan I LLC
CEFIA Holdings LLCCGB

CONNECTICUT GREEN BANK NOTES TO FINANCIAL STATEMENTS FOR THE YEAR ENDED JUNE 30, 2017
25
1. NATURE OF OPERATIONS AND SIGNIFICANT ACCOUNTING POLICIES (CONTINUED)
Condensed, Combining Information - Statement of Cash Flows
Cash Flows from Operating Activities Sales of energy systems $ $ $ 18,826,940 $ $ 18,826,940 Sales of Renewable Energy Credits 2,214,000 2,214,000 Utility company remittances 26,567,324 26,567,324 Grants 99,949 99,949 RGGI auction proceeds 3,560,543 3,560,543 Other income 250,424 623 251,047 Lease payments received Program administrative expenses (13,576,520) (32,397) (125,421) (13,734,338) Grants, incentives and credit enhancements (10,842,910) (10,842,910) Purchases of energy equipment (16,907,742) (16,907,742) General and administrative expenditures (2,653,092) (5,356) (8,196) (2,666,644)
Net cash provided by (used in) operating activities 5,619,718 (37,130) 1,785,581 - 7,368,169
Cash Flows from Noncapital Financing Activities Funds received (disbursed) from escrow and custodial accounts (564,964) (564,964) Advances to CGB component units (4,051,000) 1,050,000 (3,001,000) Advances repaid (disbursed) to third party capital providers 90,908 90,908 Subordinated debt advance to component units Advances from CGB and component units 1,050,000 (1,050,000) Repayments of advances (to) from component units
Net cash provided by (used in) noncapital financing activities (4,525,056) - 1,050,000 - (3,475,056)
Cash Flows from Capital and Related Financing Activities Purchase of capital assets (105,149) (105,149) Proceeds from long-term debt 2,957,971 2,957,971 Repayment of long-term debt (715,950) (715,950) Interest expense (172,379) (172,379) Proceeds from subordinated debt with component unit Capital contributions from (to) component entities Capital contributions from Firstar Development, LLC Return of capital to Firstar Development, LLC
Net cash provided by (used in) capital and related financing activities 2,852,822 (888,329) - - 1,964,493
Cash Flows from Investing ActivitiesLoan losses (20,277) (20,277) Return of principal on WC & program loans 8,812,656 719,230 9,531,886 Interest on short-term investments, cash, solar lease notes and loans 2,426,254 245,866 7,719 2,679,839 CPACE program loan disbursements (5,602,984) (5,602,984) Grid Tied program loan disbursements (319,471) (319,471) AD/CHP program loan disbursements (1,997,403) (1,997,403) Alpha/Operational Demo program loan disbursements (15,000) (15,000) Energy Efficiency program loan disbursements (130,000) (130,000) HOPBI program loan disbursements Residential Solar Loan program disbursements (9,537,847) (9,537,847)
Net cash used in investing activities (6,384,072) 965,096 7,719 - (5,411,257)
Net Increase (Decrease) in Cash and Cash Equivalents (2,436,588) 39,637 2,843,300 - 446,349
Cash and Cash Equivalents - Beginning of Year 39,462,829 3,342,991 4,013,553 - 46,819,373
Cash and Cash Equivalents - End of Year $ 37,026,241 $ 3,382,628 $ 6,856,853 $ - $ 47,265,722
Reconciliation of Operating Income (Loss) to Net Cash
Provided by (Used in) Operating Activities:
Operating income (loss) $ (4,999,998) $ (65,028) $ 1,186,526 $ $ (3,878,500)
Adjustments to reconcile operating income (loss)
to net cash provided by (used in) operating activities:
Depreciation 116,584 116,584
Accretion
Deferred lease revenue
Pension expense adjustment 1,746,587 1,746,587
Other
Changes in operating assets and liabilities:
(Increase) decrease in operating assets 2,972,962 26,233 5,822,064 8,821,259
(Decrease) increase in operating liabilities 5,783,583 1,665 (5,223,009) 562,239
Net Cash Provided by (Used in) Operating Activities $ 5,619,718 $ (37,130) $ 1,785,581 $ - $ 7,368,169
CGBCT Solar
Loan I LLCCEFIA
Holdings LLCEliminating
EntriesTotal Primary Government

CONNECTICUT GREEN BANK NOTES TO FINANCIAL STATEMENTS FOR THE YEAR ENDED JUNE 30, 2017
26
1. NATURE OF OPERATIONS AND SIGNIFICANT ACCOUNTING POLICIES (CONTINUED)
Measurement Focus, Basis of Accounting and Financial Statement Presentation
All entities are enterprise funds. Enterprise funds are used to account for governmental activities that are similar to those found in the private sector in which the determination of net income is necessary or useful to sound financial administration.
Basis of Presentation
These financial statements are reported using the economic resources measurement focus and accrual basis of accounting. Revenues are recognized when earned, and expenses are recognized when the liability is incurred, regardless of the timing of the related cash flows.
Revenue Recognition
The Green Bank, in addition to utility assessments and RGGI auction income, recognizes revenue from grants as expenses are incurred.
CT Solar Loan I LLC derives revenue from interest earned on residential solar loan products.
CEFIA Holdings LLC derives revenue from the sales of photovoltaic energy systems to CT Solar Lease 2, LLC. This amount was eliminated to arrive at the total reporting entity revenue.
CEFIA Solar Services, Inc. revenue consists of an administrative fee from CT Solar Lease 2 LLC. This amount was eliminated to arrive at the total reporting entity revenue.
CT Solar Lease 2 LLC derives revenue from the following sources: operating leases, energy generation, performance based incentives (PBIs) and the sale of Solar Renewable Energy Certificates (SRECs) to third parties.
Upon commencement of operations in fiscal 2018, CT Solar Lease 3 LLC will derive revenue from the following sources: energy generation and the sale of Solar Renewable Energy Certificates (SRECs) to third parties.
Rental income from operating leases for residential and certain commercial scale solar facilities is recognized on a straight-line basis over the term of each underlying lease.
Energy generation revenue will be recognized as electricity is generated, based on actual output and contractual prices set forth in long term PPAs associated with certain commercial scale facilities.
Revenue from the sale of SRECs to third parties is recognized upon the transfer of title and delivery of the SRECs to third parties and is derived from contractual prices set forth in SREC sale agreements associated with commercial scale facilities.
Operating vs. Nonoperating Revenue (Expense)
All entities distinguish operating revenues and expenses from nonoperating items. Operating revenues consist of utility customer assessments, grants for operating activities, and other revenue generated in connection with investments in clean energy programs. Operating expenses consist of operating costs, including depreciation on capital assets and grants and programs. Nonoperating revenue (expense) consists of investment earnings, and other items not considered operational by management.

CONNECTICUT GREEN BANK NOTES TO FINANCIAL STATEMENTS FOR THE YEAR ENDED JUNE 30, 2017
27
1. NATURE OF OPERATIONS AND SIGNIFICANT ACCOUNTING POLICIES (CONTINUED)
Use of Estimates
Management uses estimates and assumptions in preparing these financial statements in accordance with accounting principles generally accepted in the United States of America. Those estimates and assumptions affect certain reported amounts and disclosures in the financial statements. Actual results could vary from the estimates that were used.
Use of Restricted vs. Nonrestricted Resources
When both restricted and unrestricted amounts are available for use, the policy is to use restricted resources for their intended purposes first and then unrestricted resources.
Cash and Cash Equivalents
Cash equivalents consist of cash and highly liquid short-term investments with an original term of 90 days when purchased and are recorded at cost, which approximates fair value.
Capital Assets
Capital asset acquisitions exceeding $500 are capitalized at cost. Maintenance and repair expenses are charged to operations when incurred. Depreciation is computed using straight-line methods over the estimated useful lives of the assets, which range from two to thirty years. Leasehold improvements are amortized over the shorter of their useful life or the lease term.
The estimated useful lives of capital assets are as follows:
Asset Years
Solar lease equipment 30 yearsFurniture and equipment 5 yearsLeasehold improvements 5 yearsComputer hardware and software 2-3 years
For capital assets sold or otherwise disposed of, the cost and related accumulated depreciation and amortization are removed from the accounts, and any related gain or loss is reflected in income for the period.
CONNECTICUT GREEN BANK NOTES TO FINANCIAL STATEMENTS FOR THE YEAR ENDED JUNE 30, 2017
28
1. NATURE OF OPERATIONS AND SIGNIFICANT ACCOUNTING POLICIES (CONTINUED)
All solar facilities are owned by CT Solar Lease 2 LLC and are stated at cost and include all amounts necessary to construct them. Systems are placed in service when they are ready for use and all necessary approvals have been received from local utility companies. Additions, renewals, and betterments that significantly extend the life of an asset are capitalized. Expenditures for warranty maintenance and repairs to solar facilities are charged to expense as incurred. Solar facilities in process represent facilities which are in various stages of construction or have not yet received the necessary utility company approvals.
Impairment of Long-Lived Assets
CT Solar Lease 2 LLC (CT SL2) reviews its solar facilities for impairment whenever events or changes in circumstances indicate that the carrying value of an asset may not be recoverable. When recovery is reviewed, if the undiscounted cash flows estimated to be generated by an asset is less than its carrying amount, management compares the carrying amount of the asset to its fair value in order to determine whether an impairment loss has occurred. The amount of the impairment loss is equal to the excess of the asset’s carrying value over its estimated fair value. No impairment loss was recognized by CT SL2 during the fiscal year ending June 30, 2017. As of June 30, 2017, CT Solar Lease 3 LLC had not acquired any solar facilities.
Asset Retirement Obligations
CT SL2 is required to recognize its liability related to asset retirement obligations when it has the legal obligation to retire long-lived assets. Upon the expiration of operating leases or a Power Purchase Agreement’s (PPA’s) initial or extended terms, customers generally have the option to purchase the solar facilities at fair market value or require CT SL2 to remove the solar facilities at its expense.
Asset retirement obligations are recorded in the period in which they are incurred and reasonably estimable, including those obligations for which the timing method of settlement are conditional on a future event that may or may not be in the control of CT SL2. Retirement of assets may involve efforts to remove the solar facilities depending on the nature and location of the assets. In identifying asset retirement obligations, CT SL2 considers identification of legally enforceable obligations, changes in existing law, estimates of potential settlement dates, and the calculation of an appropriate discount rate to be used in calculating the fair value of the obligations. For those assets where a range of potential settlement dates may be reasonably estimated, obligations are recorded. CT SL2 routinely reviews and reassesses its estimates to determine if an adjustment to the value of asset retirement obligations is required. As of June 30, 2017, CT Solar Lease 3 LLC had not acquired any solar facilities.

CONNECTICUT GREEN BANK NOTES TO FINANCIAL STATEMENTS FOR THE YEAR ENDED JUNE 30, 2017
29
1. NATURE OF OPERATIONS AND SIGNIFICANT ACCOUNTING POLICIES (CONTINUED)
The aggregate carrying amount of asset retirement obligations recognized by CT SL2 was $3,020,405 and $2,528,335 at June 30, 2017 and June 30, 2016 respectively. The following table shows changes in the aggregate carrying amount of CT SL2’s asset retirement obligation for the year ended June 30, 2017:
Balance - June 30, 2016 $ 2,528,335
Additional accruals 429,559 Accretion expense 62,511
Balance - June 30, 2017 $ 3,020,405
Portfolio Investments
The Green Bank carries all investments at fair value. Fair value is defined as the price that would be received to sell an asset or paid to transfer liability by in an orderly transaction between market participants at the measurement date. As discussed in Note 4, the Green Bank’s portfolio investments are managed by CI. Fair value is determined by CI’s independent valuation committee (Committee) using United States Private Equity Valuation Guidelines promulgated by the Private Equity Investment Guidelines Group. In the absence of readily determinable market values, the Committee gives consideration to pertinent information about the companies comprising these investments, including, but not limited to, recent sales prices of the issuer’s securities, sales growth, progress toward business goals and other operating data. CI has applied procedures in arriving at the estimate of the value of such securities that it believes are reasonable and appropriate. Green Bank management reserves the right to establish a reserve in addition to the reserve recommended by the Committee to further account for current market conditions and volatility. Due to the inherent uncertainty of valuation, those estimated values may differ significantly from the amounts ultimately realized from the investments, and the differences could be material. The Green Bank reports gains as realized and unrealized consistent with the practice of venture capital firms. The calculation of realized gains and losses is independent of the calculation of the net change in investment value.
All of the Green Bank’s portfolio investments are uninsured against loss and unregistered, and are held in CI’s name since the investments were made when the Green Bank’s predecessor, the Connecticut Clean Energy Fund, was administered by CI.
Net Position
Net position is presented in the following three categories:
• Investment in Capital Assets represent capital assets, net of accumulated depreciation and amortization that are attributable to those particular assets.
• Restricted Net Position represent assets whose use is restricted through external restrictions imposed by creditors, grantors, contributors and the like, or through restrictions imposed by laws or through constitutional provisions or enabling legislature, and includes equity interest within the Green Bank’s component units by outside entities.
• Unrestricted Net Position represents assets which do not meet the definition of the two preceding categories.

CONNECTICUT GREEN BANK NOTES TO FINANCIAL STATEMENTS FOR THE YEAR ENDED JUNE 30, 2017
30
1. NATURE OF OPERATIONS AND SIGNIFICANT ACCOUNTING POLICIES (CONTINUED)
Grants and Programs
Expenditures for grants and programs are recorded upon the submission of invoices and other supporting documentation and approval by management. Salaries, benefits and overhead expenses are allocated to program expenses based on job functions.
Reclassifications
Certain amounts in the 2016 summarized information have been reclassified to conform to the 2017 presentation.
Subsequent Events
The Green Bank has performed a review of events subsequent to the statement of net position date through October 26, 2017, the date of the financial statements where available to be issued. Except as described below, no additional events requiring recording or disclosure in the financial statements were identified.
CT Solar Lease 3 LLC On August 2, 2017, an operating agreement between CEFIA Solar Services Inc. (Solar Services), as the managing member, and Firstar Development LLC (Firstar), as the investor member, was executed for CT Solar Lease 3 LLC (CT SL3). Solar Services membership interest is 1% and Firstar’s membership interest is 99%. Solar Services has committed to providing $13,984,204 in capital contributions and Firstar has committed providing $7,861,324 in capital contributions to CT SL3. On August 2, 2017, CT SL3 also executed a development and purchase agreement (the Agreement) with CEFIA Holdings LLC to purchase commercial solar projects. The Agreement commits CT SL3 to purchase $21,457,062 of commercial solar projects from CEFIA Holdings LLC.
Purchase of Hydroelectric Facility On August 31, 2017, the Green Bank, through its wholly owned component unit, CGB Meriden Hydro LLC (CGB Meriden), purchased a 195 kW hydroelectric facility located in Meriden, Connecticut, from the facility’s developer, Hanover Pond Hydro LLC (Hanover Pond), pursuant to a sale and leaseback agreement dated January 1, 2017 for $3,911,706. The Green Bank utilized the proceeds of the Clean Energy Renewable Bond (CREB), $2,957,971 issued in fiscal year 2017, to finance a portion of the total purchase price.
Hanover Pond will remit to CGB Meriden a monthly lease payment equal to the monthly payment made by the City of Meriden to Hanover Pond for the purchase of electricity generated by the hydroelectric facility under a power purchase agreement dated August 14, 2014, as amended. This lease commences on the date commercial operations begin and terminates on the 30th anniversary of said date. Commercial operations began on March 7, 2017. In addition to revenues earned through its lease with Hanover Pond, CGB Meriden will also receive revenues from the sale of renewable energy credits generated by the facility and sold to the local utility company under a sale and purchase contract dated July 31, 2014 which was assigned to CGB Meriden on September 18, 2017.

CONNECTICUT GREEN BANK NOTES TO FINANCIAL STATEMENTS FOR THE YEAR ENDED JUNE 30, 2017
31
2. FAIR VALUE MEASUREMENTS
The framework for measuring fair value provides a fair value hierarchy that prioritizes the inputs to valuation techniques used to measure fair value. The hierarchy gives the highest priority to unadjusted quoted prices in active markets for identical assets or liabilities (Level 1 measurements); followed by quoted prices in inactive markets or for similar assets or with observable inputs (Level 2 measurements); and the lowest priority to unobservable inputs (Level 3 measurements). In determining fair value, The Green Bank utilizes valuation techniques that maximize the use of observable inputs and minimize the use of unobservable inputs. The Green Bank also considers nonperformance risk in the overall assessment of fair value.
Investments are measured at fair value utilizing valuation techniques based on observable and/or unobservable inputs. Observable inputs reflect readily obtainable data from independent sources, while unobservable inputs reflect market assumptions. These inputs are classified into the following hierarchy:
Level 1 Unadjusted quoted prices in active markets that are accessible at the measurement date for identical assets or liabilities.
Level 2 Inputs other than quoted prices in active markets for identical assets and liabilities that are observable either directly or indirectly for substantially the full term of the asset or liability. Level 2 inputs include the following:
Quoted prices for similar assets or liabilities in active markets Quoted prices for identical or similar assets or liabilities in markets that are not active Observable inputs other than quoted prices that are used in the valuation of the asset or liability
(e.g., interest rate and yield curve quotes at commonly quoted intervals) Inputs that are derived principally from or corroborated by observed market data by correlation
or other means
Level 3 Unobservable inputs for the asset or liability (supported by little or no market activity). Level 3 inputs include management’s own assumptions about the assumptions that market participants would use in pricing the asset or liability (including assumptions about risk).
The asset or liability’s fair value measurement level within the fair value hierarchy is based on the lowest level of any input that is significant to the fair value measurement. Valuation techniques used need to maximize the use of observable inputs and minimize the use of unobservable inputs.
CONNECTICUT GREEN BANK NOTES TO FINANCIAL STATEMENTS FOR THE YEAR ENDED JUNE 30, 2017
32
2. FAIR VALUE MEASUREMENTS (CONTINUED)
The following table sets forth by level, within the fair value hierarchy, the Green Bank’s fair value measurements at June 30, 2017:
Level 1 Level 2 Level 3 Total
Portfolio investments $ $ $ 1 $ 1
Investment Assets at Fair Value as of June 30, 2017
The following table sets forth by level, within the fair value hierarchy, the Green Bank’s fair value measurements at June 30, 2016:
Level 1 Level 2 Level 3 Total
Portfolio investments $ $ $ 1,000,000 $ 1,000,000
Investment Assets at Fair Value as of June 30, 2016
There were no transfers between levels during the years ended June 30, 2017 and 2016.
3. CASH AND CASH EQUIVALENTS
The following is a summary of cash and cash equivalents for the reporting entity at June 30:
2017 2016
Checking $ 8,382,573 $ 4,499,265 Money market 13,114,107 10,103,292 State Treasurer's Short-Term Investment Fund 15,651,603 33,469,504
Unrestricted cash and cash equivalents 37,148,283 48,072,061
Checking - restricted 1,132,633 1,109,782 Money market - restricted 8,986,340 5,001,190 State Treasurer's Short-Term Investment Fund - restricted 11,944,433 3,639,011
Total Cash and Cash Equivalents $ 59,211,689 $ 57,822,044

CONNECTICUT GREEN BANK NOTES TO FINANCIAL STATEMENTS FOR THE YEAR ENDED JUNE 30, 2017
33
3. CASH AND CASH EQUIVALENTS (CONTINUED)
Primary CT Solar CEFIA Solar CT SolarGovernment Lease 2 LLC Services, Inc. Lease 3 LLC Total
Checking $ 7,722,434 $ 523,672 $ 135,967 $ 500 $ 8,382,573 Money market 6,331,063 4,942,933 1,839,611 500 13,114,107 State Treasurer's Short-Term
Investment Fund 15,651,603 15,651,603
Unrestricted cash and cash equivalents 29,705,100 5,466,605 1,975,578 1,000 37,148,283
Restricted cash:Checking 132,633 1,000,000 1,132,633 Money market 5,483,556 3,502,784 8,986,340 State Treasurer's Short-Term
Investment Fund 11,944,433 11,944,433
$ 47,265,722 $ 9,969,389 $ 1,975,578 $ 1,000 $ 59,211,689
Cash and Cash Equivalents as of June 30, 2017
Primary CT Solar CEFIA Solar CT SolarGovernment Lease 2 LLC Services, Inc. Lease 3 LLC Total
Checking $ 4,179,676 $ 244,856 $ 74,733 $ $ 4,499,265 Money market 3,920,210 1,136,650 5,046,432 10,103,292 State Treasurer's Short-Term
Investment Fund 33,469,504 33,469,504
Unrestricted cash and cash equivalents 41,569,390 1,381,506 5,121,165 - 48,072,061
Restricted cash:Checking 109,782 1,000,000 1,109,782 Money market 1,501,190 3,500,000 5,001,190 State Treasurer's Short-Term
Investment Fund 3,639,011 3,639,011
$ 46,819,373 $ 5,881,506 $ 5,121,165 $ - $ 57,822,044
Cash and Cash Equivalents as of June 30, 2016
State Treasurer’s Short-Term Investment Fund
The State Treasurer’s Short-Term Investment Fund is a Standard & Poor’s AAAm investment pool of high-quality, short-term money market instruments managed by the Cash Management Division of the State Treasurer’s Office, and operates in a manner similar to money market mutual funds. It is the investment vehicle for the operating cash of the State of Connecticut Treasury, state agencies and authorities, municipalities, and other political subdivisions of the State. The value of the Green Bank’s position in the pool is the same as the value of pool shares. Regulatory oversight is provided by an investment advisory council and the State Treasurer’s Cash Management Board.

CONNECTICUT GREEN BANK NOTES TO FINANCIAL STATEMENTS FOR THE YEAR ENDED JUNE 30, 2017
34
3. CASH AND CASH EQUIVALENTS (CONTINUED)
Investment Maturities
The State Treasurer’s Short-Term Investment Fund itself has no maturity date and is available for withdrawal on demand.
Interest Rate Risk
The Green Bank manages its exposure to declines in fair value by limiting the average maturity of its cash and cash equivalents to no more than one year. The Green Bank does not have a formal policy relating to a specific investment related risk.
Credit Risk
Connecticut General Statutes authorize the Green Bank to invest in obligations of the U.S. Treasury including its agencies and instrumentalities, commercial paper, banker’s acceptance, repurchase agreements and the State Treasurer’s Short-Term Investment Fund.
Investment ratings for the Fund’s investment are as follows:
Standard& Poor's
State Treasurer's Short-Term Investment Fund AAAm
Concentration of Credit Risk
The Green Bank’s investment policy does not limit the investment in any one investment vehicle. The State Treasurer’s Short-term Investment Fund is not subject to this disclosure.
Custodial Credit Risk - Deposits
In the case of deposits, this represents the risk that, in the event of a bank failure, the Green Bank’s deposits may not be returned to it. The Green Bank does not have a deposit policy for custodial credit risk. As of June 30, 2017 and 2016, $29,254,187 and $19,019,356, respectively, of the Green Bank’s bank balances were exposed to custodial credit risk. Primary government consisted of $17,966,373 and $8,727,950 as of June 30, 2017 and 2016, respectively. CT Solar Lease 2, LLC consisted of $9,562,237 and $5,420,241 as of June 30, 2017 and 2016, respectively. CEFIA Solar Services, Inc. consisted of $ 1,725,577 and $4,871,165 as of June 30, 2017 and 2016, respectively. Funds held by banks on behalf of the Green Bank, CT Solar Lease 2 LLC and CEFIA Solar Services included contractual requirements to maintain $10,132,312 in deposits with financial institutions participating in various lease and loan programs, representing loan loss and lease maintenance reserves and guaranty pledge accounts.
Custodial Credit Risk - Investments
For an investment, this represents the risk that, in the event of the failure of the counterparty, the Green Bank will not be able to recover the value of the investment. The Green Bank does not have a policy relating to the credit risk of investments. As of June 30, 2017 and 2016, the Green Bank had no reportable credit risk.

CONNECTICUT GREEN BANK NOTES TO FINANCIAL STATEMENTS FOR THE YEAR ENDED JUNE 30, 2017
35
4. PORTFOLIO INVESTMENTS
The former Connecticut Clean Energy Fund (CCEF) invested in emerging technology companies as equity and debt investments in Operational Demonstration projects. Based on a memorandum of understanding between the Green Bank and CI, CI manages these investments on behalf of the Green Bank.
5. BONDS RECEIVABLE
Subordinate Series 2014B-1 and 2014C-1 This Series represents two $800,000 bonds received in connection with the Green Bank’s May 2014 sale of C-PACE loans to Clean Fund Holdings, LLC (CFH). CFH paid the Green Bank approximately $6.4 million in cash along with two bonds issued to the Green Bank through Public Finance Authority. The 2014 Series bonds carry interest of 5.30% per annum with a maturity date of September 10, 2034. The bonds are secured by the C-PACE loans sold to CFH. The Green Bank received a principal repayment of $8,858 for each bond as a result of a C-PACE loan payoff in 2016. At June 30, 2017, management believes no valuation allowance is necessary on these bonds.
Each bond required semi-annual interest-only payments to the Green Bank starting September 10, 2014 and continuing to September 10, 2034. Starting March 10, 2030 and every six months thereafter, principal payments, along with the required interest is to be paid to the Green Bank.
Subordinate Series 2015B-1 and 2015C-1 This Series represents two $955,000 bonds received in connection with the Green Bank’s August 2015 sale of C-PACE Loans to Clean Fund Holdings, LLC (CFH). CFH paid the Green Bank approximately $7.7 million in cash along with two bonds issued to the Green Bank through Public Finance Authority. The 2015 Series bonds carry interest of 5.52% per annum with a maturity date of August 13, 2035. The bonds are secured by the C-PACE loans sold to CFH. The Green Bank received a principal repayment of $81,877 for each bond as a result of a C-PACE loan payoff in 2017. At June 30, 2017, management believes no valuation allowance is necessary on these bonds.
Each bond required semi-annual interest-only payments to the Green Bank starting September 10, 2015 and continuing to August 13, 2035. Starting September 10, 2032 and every six months thereafter, principal payments, along with the required interest is to be paid to the Green Bank.
Principal maturities of these bonds are as follows:
Year ended June 30, 2014B-1 2014C-1 2015B-1 2015B-1 Total
2018 $ $ $ $ $2019 2020 2021 2022
2023 - 2027 2028 - 2032 457,500 457,500 915,000 2033 - 2037 333,642 333,642 873,123 873,123 2,413,530
$ 791,142 $ 791,142 $ 873,123 $ 873,123 $ 3,328,530

CONNECTICUT GREEN BANK NOTES TO FINANCIAL STATEMENTS FOR THE YEAR ENDED JUNE 30, 2017
36
6. SOLAR LEASE NOTES RECEIVABLE
In June of 2008 the predecessor of the Green Bank, the Connecticut Clean Energy Fund (CCEF) entered into a Master Lease Program Agreement with CT Solar Leasing LLC, a third party leasing company, AFC First Financial Corporation, a third party servicer, and Firstar Development LLC, the tax equity investor, to develop a residential solar PV leasing program in Connecticut. CCEF purchased a total of $13,248,685 of promissory notes issued by CT Solar Leasing LLC during the period commencing in April of 2009 and ending in February of 2012 to fund the program. Each nonrecourse promissory note is secured by the payments under a specific PV equipment lease, with a rate of interest of 5% and a term of 15 years. Future principal repayments under the program and the current loss reserve are as follows:
Future principal repayments
2018 $ 869,831
2019 914,334
2020 958,388
2021 986,312
2022 1,008,384
2023-2026 3,457,350
8,194,599
Less reserve for losses (81,946)
$ 8,112,653
Current portion $ 869,831
Noncurrent portion 7,242,822
$ 8,112,653

CONNECTICUT GREEN BANK NOTES TO FINANCIAL STATEMENTS FOR THE YEAR ENDED JUNE 30, 2017
37
7. PROGRAM LOANS RECEIVABLE
Outstanding principal balances by program for the years ending June 30, 2017 and 2016, are as follows:
2017 2016
Loans in repayment for completed projects:
Connecticut Green BankCPACE Program benefit assessments - in repayment $ 12,157,762 $ 11,221,563 CPACE Promissory notes 1,791,578 1,553,884 Grid-Tied Program term loans 10,568,847 8,701,188 Multifamily/Affordable housing program loans 10,967,995 2,467,231 Alpha/Operational Demonstration program loans 1,151,421 1,136,421 Other program loans 684,580 680,737
CT Solar Loan I LLCResidential Solar PV Program loans-in repayment 3,321,253 4,041,563
40,643,436 29,802,587
Reserve for loan losses (5,611,942) (4,674,813)
Total loans in repayment for completed projects, net $ 35,031,494 $ 25,127,774
Loan advances for projects under construction:
Connecticut Green BankCPACE Program benefit assessments - under construction $ 7,174,667 $ 8,113,510
CT Solar Loan I LLCResidential Solar PV Program loans - under construction 26,233
Total loans advances for projects under construction $ 7,174,667 $ 8,139,743

CONNECTICUT GREEN BANK NOTES TO FINANCIAL STATEMENTS FOR THE YEAR ENDED JUNE 30, 2017
38
7. PROGRAM LOANS RECEIVABLE (CONTINUED)
Scheduled repayments of principal under these loans in repayment as of June 30, 2017 is as follows:
2018 2019 2020 2021 2022 Thereafter Total
Connecticut Green BankCPACE Program benefit assessments- in repayment $ 488,884 $ 519,622 $ 548,639 $ 577,611 $ 611,546 $ 9,411,460 $ 12,157,762 CPACE promissory notes 36,868 45,922 49,482 53,584 58,217 1,547,505 1,791,578 Grid-Tied Program term loans 303,360 310,752 318,374 327,904 1,216,697 8,091,760 10,568,847 Multifamily/Affordable housing term loans 791,352 767,720 810,092 857,148 1,400,785 6,340,898 10,967,995 Alpha/Operational Demonstration program loans 501,421 650,000 1,151,421 Other program loans 110,462 101,535 95,000 12,699 37,801 327,083 684,580
CT Solar Loan I LLCResidential Solar PV
Program loans - in repayment 197,497 189,172 202,005 215,537 230,633 2,286,409 3,321,253 2,429,844 1,934,723 2,023,592 2,044,483 3,555,679 28,655,115 40,643,436
Reserve for loan losses (519,796) (1,100) (38,460) (3,378) (5,049,208) (5,611,942)
$ 1,910,048 $ 1,933,623 $ 1,985,132 $ 2,041,105 $ 3,555,679 $ 23,605,907 $ 35,031,494
Benefits assessments under the C-PACE program finance energy efficiency upgrades and the installation of renewable energy equipment on non-residential property. These assessments carry interest rates ranging from 5.0% to 9.0% with terms ranging from 10 to 26 years. CPACE promissory notes represent a component of proceeds received from the sale of 37 benefit assessments from the Green Bank’s portfolio to a third-party capital provider. These promissory notes carry interest rates ranging from 7.1% to 14.4% and mature at various intervals commencing on September 10, 2036 and ending on March 10, 2037.
Grid-tied term loans represent the financing of three projects. The first project is the 15-megawatt Bridgeport Fuel Cell Park from Project 150. Interest is paid monthly on the outstanding principal balance at a rate of 5.0% until 2022 when principal repayments commence over a 48-month period. The second project is a 5 mega-watt wind turbine facility in Colebrook, CT. Interest on a revolving term loan is paid quarterly at prime plus 3%. Interest on a nonrevolving term loan is paid quarterly based on the project’s cash flows. The minimum rate of interest on the nonrevolving term loan is 10%. Principal under both loans is repaid at maturity which is 15 years from the date the project was placed in service. The project was placed in service in November 2015. The third project is an anaerobic digestion facility located in Southington, CT. The term loan carries an interest rate of 2% and interest and principal are repaid on a quarterly basis. Commencing on May 1, 2018 the borrower is required to make annual payments against principal equal to 50% of excess project cash flow as defined in the loan agreement.
Affordable Housing initiatives include providing term loans to two third-party capital providers to finance solar PV installations and energy efficiency measures for low to moderate income households. Under the first initiative through June 30, 2017, the Green Bank has advanced $7,691,173 of a $10,000,000 term financing facility comprising two promissory notes with interest rates of 5% and 7.7% payable monthly. Each advance under the notes matures six years from the date of the advance. The final maturity date of all advances made under these notes as of June 30, 2017 is September 26, 2023. Under a second initiative as of June 30, 2017, the Green Bank has advanced $3,500,000 of a $3,500,000 term financing facility comprising 4 promissory notes. All notes carry an interest rate of 3% payable along with principal on a monthly basis. The notes have terms of 7 and 20 years with maturities ranging from December 1, 2025 to October 1, 2037.

CONNECTICUT GREEN BANK NOTES TO FINANCIAL STATEMENTS FOR THE YEAR ENDED JUNE 30, 2017
39
7. PROGRAM LOANS RECEIVABLE (CONTINUED)
Multifamily pre-development loans are advances to developers and owners of multifamily residences to provide funding for project feasibility and site development work. Loans mature in two years and carry no interest. As of June 30, 2017, $91,875 had been advanced under this program.
Operational demonstration program loans are residual transactions of the programs of the Connecticut Clean Energy Fund. The loans finance the development of emerging clean energy technologies. Repayment of each loan is based upon the commercial success of the technology and carries an interest rate of 6%. If commercial success is not achieved after ten years from the date of the loan agreement, the loan converts to a grant. Connecticut Innovations assists in overseeing these loans.
Other program loans represent the financing of feasibility studies for various renewable energy projects or energy efficiency upgrades.
The residential solar PV loan program administered by CT Solar Loan I LLC, makes loans to residential property owners for solar PV installations. Loans carry an interest rate ranging from 6.49% to 6.75% with a term of 15 years.
8. FINANCING ACTIVITIES
Long-Term Debt - Primary Government
CT Solar Loan I LLC Line of Credit
On February 3, 2014, CT Solar Loan I LLC (SLI) executed a $4,000,000 line of credit with Solar Mosaic, Inc. (LOC). The LOC was amended in June 2015 to $1,100,000. Borrowings on the LOC immediately turn into a term note with predefined repayment terms at the time of borrowing. No further borrowings were available after June 30, 2015. Borrowings on the Mosaic LOC bear interest at 6.4586% (Base Rate) and SLI exercised its option to buy-down the interest rate to 6.00% (Reduced Rate) by making a payment on the borrowing date of 2.875% of the principal amount of the loan (Rate Buy-down Amount). As of June 30, 2017 and 2016 there was $508,793 and $691,707, respectively, outstanding. All borrowings will have matured by September 20, 2028.
In connection with the LOC, SLI is required to establish and maintain a collections account, debt service reserve account and a loan loss reserve account. Deposits shall be made into the collections account for all payments received from residential borrowers against loans securing the LOC. The debt service reserve account is required to have no less than six months forward-looking principal and interest payments for the loans outstanding. The loan loss reserve account required a one-time deposit of $300,000 as of June 30, 2014 which was reduced to $82,500 as of June 30, 2015.
CONNECTICUT GREEN BANK NOTES TO FINANCIAL STATEMENTS FOR THE YEAR ENDED JUNE 30, 2017
40
8. FINANCING ACTIVITIES (CONTINUED)
Future maturities on borrowings on the LOC are as follows:
Years Ending June 30, Principal Interest Total
2018 $ 47,385 $ 29,237 $ 76,622 2019 49,991 26,325 76,316 2020 52,848 23,248 76,096 2021 55,874 19,994 75,868 2022 59,080 16,555 75,635
2023 - 2027 231,771 32,834 264,605 Thereafter 11,844 294 12,138
$ 508,793 $ 148,487 $ 657,280
CT Solar Loan I LLC Term Note
On April 25, 2016, CT Solar Loan I LLC (SLI) executed a $2,510,837 Loan Agreement and Promissory Note (Note) with the Reinvestment Fund, Inc. The Note carries a fixed interest rate of 6.02%. Interest and principal repayments are amortized over a hypothetical 15 year period. The Note has a maturity date of April 1, 2023 with all unpaid principal and accrued interest due at that time. Principal repayments and interest payments are made in monthly installments beginning June 1, 2016.
In connection with the Note, SLI is required to establish and maintain a collections account, and maintain $217,500 in a loan loss reserve account. Deposits shall be made into the collections account for all payments received from residential borrowers against loans securing the Note.
Future maturities on borrowings under the Reinvestment Fund LOC is as follows:
Years Ending June 30, Principal Interest Total
2018 $ 93,287 $ 115,998 $ 209,285 2019 99,060 110,225 209,285 2020 105,191 104,094 209,285 2021 111,701 97,584 209,285 2022 118,615 90,671 209,286
2023 - 2027 1,441,319 69,970 1,511,289 Thereafter -
$ 1,969,173 $ 588,542 $ 2,557,715

CONNECTICUT GREEN BANK NOTES TO FINANCIAL STATEMENTS FOR THE YEAR ENDED JUNE 30, 2017
41
8. FINANCING ACTIVITIES (CONTINUED)
Connecticut Green Bank New Clean Renewable Energy Bond
On February 26, 2016 the Board of Directors of the Green Bank authorized the issuance of a New Clean Energy Renewable Energy Bond (CREB) in an amount not to exceed $3,000,000 to finance a portion of the acquisition cost of a 193kW Hydroelectric Facility located in Meriden, Connecticut by CGB Meriden Hydro LLC, a subsidiary of the Green Bank. On February 2, 2017 the Green Bank issued a CREB in the amount of $2,957,971 with an annual interest rate of 4.19%, maturing on November 15, 2036. Interest and principal payments are to be paid annually on November 15th. Proceeds from the sale of the CREB have been deposited with the bond trustee and will be disbursed upon acquisition of the hydroelectric facility from its developer which is expected to occur during the first quarter of fiscal year 2018. Proceeds from the sale of electricity generated by the facility to the City of Meriden along with revenue from the associated renewable energy credits will fund the payment of principal and interest on the CREB. The CREB qualified for a tax credit from the US Treasury under Section 54C of the Internal Revenue Code. The tax credit will be paid in the form of a subsidy to the Green Bank. The project also qualified to receive an interest rate subsidy from the local electricity utility through a program approved by the Connecticut Public Utility Regulatory Authority (PURA). This subsidy will be paid directly to the purchaser of the CREB. Both these subsidies will reduce the borrowing costs of the Green Bank.
Future maturities on borrowings under the CREB is as follows:
US Treasury CT PURATax Interest
Years Ending June 30, Principal Interest Subsidy Subsidy Total
2018 $ 53,418 $ 97,430 $ (68,721) $ (18,013) $ 64,114 2019 106,223 121,701 (85,840) (18,013) 124,071 2020 109,041 117,250 (82,701) (18,013) 125,577 2021 123,718 112,681 (79,479) (18,013) 138,907 2022 134,348 107,497 (75,822) (18,013) 148,010
2023 - 2027 842,955 440,696 (310,840) (90,067) 882,744 2028 - 2032 841,184 262,200 (184,940) 918,444 2033 - 2037 747,084 95,718 (67,514) 775,288
$ 2,957,971 $ 1,355,173 $ (955,857) $ (180,132) $ 3,177,155
Long-Term Debt - Primary Government - Discretely Presented Component Units
CEFIA Solar Services Inc. Term Note
On October 18, 2016 CEFIA Solar Services Inc. executed a term note with the Connecticut Housing Finance Authority (CHFA) in the amount of $1,895,807 with an interest rate of 2.5% with a 20-year term maturing on November 1, 2036. Principal and interest are payable monthly. CEFIA Solar Services, in its role as managing member of CT Solar Lease 2 LLC (CT SL2) lent these funds to CT SL2 through the execution of a subordinated promissory note of same date. CT SL2 used these funds to finance the acquisition of renewable energy equipment and installation of energy efficiency measures by eleven housing developments owned by municipalities throughout Connecticut.

CONNECTICUT GREEN BANK NOTES TO FINANCIAL STATEMENTS FOR THE YEAR ENDED JUNE 30, 2017
42
8. FINANCING ACTIVITIES (CONTINUED)
Future maturities on borrowings under CHFA is as follows:
Years Ending June 30, Principal Interest Total
2018 $ 94,788 $ 44,927 $ 139,715 2019 94,788 42,557 137,345 2020 94,788 40,187 134,975 2021 94,788 37,817 132,605 2022 94,788 35,448 130,236
2023 - 2027 473,953 141,692 615,645 2028 - 2032 473,953 82,448 556,401 2033 - 2037 418,667 23,949 442,616
$ 1,840,513 $ 449,025 $ 2,289,538
Line of Credit - Discretely Presented Component Unit - CT Solar Lease 2, LLC
CT Solar Lease 2, LLC has a $27,600,000 line of credit agreement (Additional LOC) with Key Bank as the Administrative Agent and Lender along with an additional participating lender. The additional LOC is broken down by lender as follows:
Key Bank $ 17,250,000
Webster Bank, National Association 10,350,000
$ 27,600,000
Funds may be drawn down in no more than ten total advances by March 31, 2017. With the exception of the final advance, each advance must be in the principal amount of $2,760,000 or a whole multiple of $100,000 in excess of $2,760,000. Each loan funding will be shared by all participating lenders in accordance with their pro-rata share of the total facility commitment. As of June 30, 2017 and 2016, $27,500,633 and $18,000,000, respectively, had been advanced under the additional LOC. Principal repayments as of June 30, 2017 and 2016, were $1,560,600 and $832,325, respectively.
Each advance will be amortized separately. CT Solar Lease 2 LLC has the option with each advance of selecting between the LIBOR rate or the base rate which is defined as the highest of (a) the Federal Funds Effective Rate plus one-half of 1 percent, (b) Key Bank’s prime rate, and (c) the LIBOR rate plus 1%. CT Solar Lease 2 LLC may also elect to convert an advance from one rate to the other by following the process outlined in the credit agreement.

CONNECTICUT GREEN BANK NOTES TO FINANCIAL STATEMENTS FOR THE YEAR ENDED JUNE 30, 2017
43
8. FINANCING ACTIVITIES (CONTINUED)
Payments of interest with respect to any LIBOR rate advances are due on the 15th day of the month following each calendar quarter end. Payments of interest with respect to any base rate advances are due monthly. Payments of principal with respect to all advances are due on the 15th day of the month following each calendar quarter end. Principal payments on each advance will be based on a modified 15-year amortization schedule and are calculated as the lessor of 2.1675% of the initial principal amount of each advance or the net operating income with respect to the projects purchased with each advance as defined in the credit agreement.
Within one month of each advance, CT Solar Lease 2 LLC is required to enter into an interest rate swap contract with respect to a minimum amount of 75% of such advance. If one of the participating lenders is the counterparty to the swap contract, such contract will be secured by the collateral of the credit agreement; otherwise, the swap contract will be unsecured. See Note 9.
Certain obligations of CT Solar Lease 2 LLC under the credit agreement are guaranteed by the Green Bank. This credit agreement is secured by all assets of CT Solar Lease 2 LLC as well as CEFIA Solar Services (the Managing Member) interest in CT Solar Lease 2 LLC. There are no prepayment penalties. There are certain debt service coverage ratios CT Solar Lease 2 LLC must maintain related to each separate advance and which require the separate measurement of the net operating income with respect to the projects purchased with each advance.
9. INTEREST RATE SWAP AGREEMENT
CT Solar Lease 2 LLC entered into a multi-year interest rate swap agreement with Key Bank (the KeyBank Agreement) in September 2014 in anticipation of making its first draw down on the credit agreement with KeyBank. Payments made and received were based on a notional amount of $17,553,675 and $19,374,375 as of June 30, 2017 and 2016, respectively. The KeyBank Agreement provides for CT Solar Lease 2 LLC to receive payments based on the 1 month USD-LIBOR-BBA (1.15889% and 0.44205% at June 15, 2017 and 2016, respectively, the dates of the last reset) and to make payments based on fixed interest rates ranging from 1.96% to 2.78%. The KeyBank Agreement matures on December 15, 2025. The fair value of the KeyBank Agreement as of June 30, 2017 and 2016 was reported as a liability of $520,880 and $1,627,864, respectively, which is represented as the fair value of the interest rate swap on the accompanying 2017 and 2016 statement of net position.
CT Solar Lease 2 LLC entered into an interest rate swap agreement with Webster Bank (the Webster Agreement) in June of 2017 to meet certain requirements under its credit agreement with KeyBank in which Webster Bank also participates. Payments made and received were based on a notional amount of $2,000,000 as of June 30, 2017. The Webster Agreement provides for CT Solar Lease 2 LLC to receive payments based on the 1 month USD-LIBOR-BBA (1.21556% at June 22, 2017, the date the Webster Agreement became effective). Subsequent reset dates will be adjusted to coincide with the KeyBank reset date of the 15th of each month and to make payments based on a fixed rate of 2.10%. The Webster Agreement matures on June 15, 2027. The fair value of the Webster Agreement as of June 30, 2017 was reported as a liability of $19,997 which is a component of the fair value of interest rate swap on the accompanying 2017 statement of net position.
CT Solar Lease 2 LLC uses the dollar-offset method for evaluating effectiveness of the interest rate swap agreements.
CONNECTICUT GREEN BANK NOTES TO FINANCIAL STATEMENTS FOR THE YEAR ENDED JUNE 30, 2017
44
10. RELATED PARTY TRANSACTIONS AND OPERATING LEASES
Due to outside agency
The Green Bank utilizes the services of CI when needed for certain operating expenses. CI provides these services at cost. Such services include, but are not limited to, staff for human resources, office space, equipment leases and office expenses. Expenses billed to the Green Bank by CI totaled $77,807 and $58,401 for the years ended June 30, 2017 and 2016, respectively. As of June 30, 2017, no amount was due to CI. The amount due CI as of June 30, 2016 was $30,127.
Unused Commitment Fee
The Investor Member of CT Solar Lease 2 LLC is entitled to an annual fee due within 30 days of the end of each calendar year, calculated on a monthly basis, based on the amount of the Investor Member’s unfunded capital contributions. The fee for each month is equal to 1.25% times the amount by which the Investor Member’s contribution cap exceeds the total capital contributions funded as of the last day of the month in question divided by twelve. Amounts not paid timely accrue interest at the US Bank Prime Rate in effect on the due date plus 2%. The unused commitment fee totaled $33,896 and $99,486 for the years ended June 30, 2017 and 2016, respectively, and is included in accounts payable and accrued expenses on the accompanying statement of net position.
Priority Return
The Investor Member is the Tax-Equity Investor and is entitled to substantially all of the tax benefits of CT Solar Lease 2 LLC until January 1 of the year which is five years after the date the last project is installed, which is anticipated to be January 1, 2021, the Flip Date.
The investor Member of CT Solar Lease 2 LLC shall be due a cumulative, quarterly distribution equal to 0.5% of its paid-in capital contributions in respect of projects beginning at the end of the first quarter after the first project acquisition capital contribution is made and continuing until the Flip Date. To the extent the priority return is not paid in a quarter until the Flip Date, unpaid amounts will accrue interest at the lower of 24% per annum or the highest rate permitted by law.
In accordance with the Operating Agreement, all amounts and accrued interest due on the priority return are to be paid from net cash flow prior to certain required payments due under the Credit Agreement. The Investor Member was paid priority returns of $436,452 and $299,831 for the years ended June 30, 2017 and 2016, respectively.
Administrative Services Fee
The Managing Member of CT Solar Lease 2 LLC, CEFIA Solar Services, Inc., provides administrative and management services to the Company and earns a quarterly fee initially equal to $30,000 per quarter beginning July 1, 2013. The amount of the fee increased 2.5% each July 1st beginning July 1, 2014. The administrative services fee totaled $129,227 and $130,075 for the years ended June 30, 2017 and 2016, respectively, and is included in accounts payable and accrued expenses on the accompanying statement of net position.
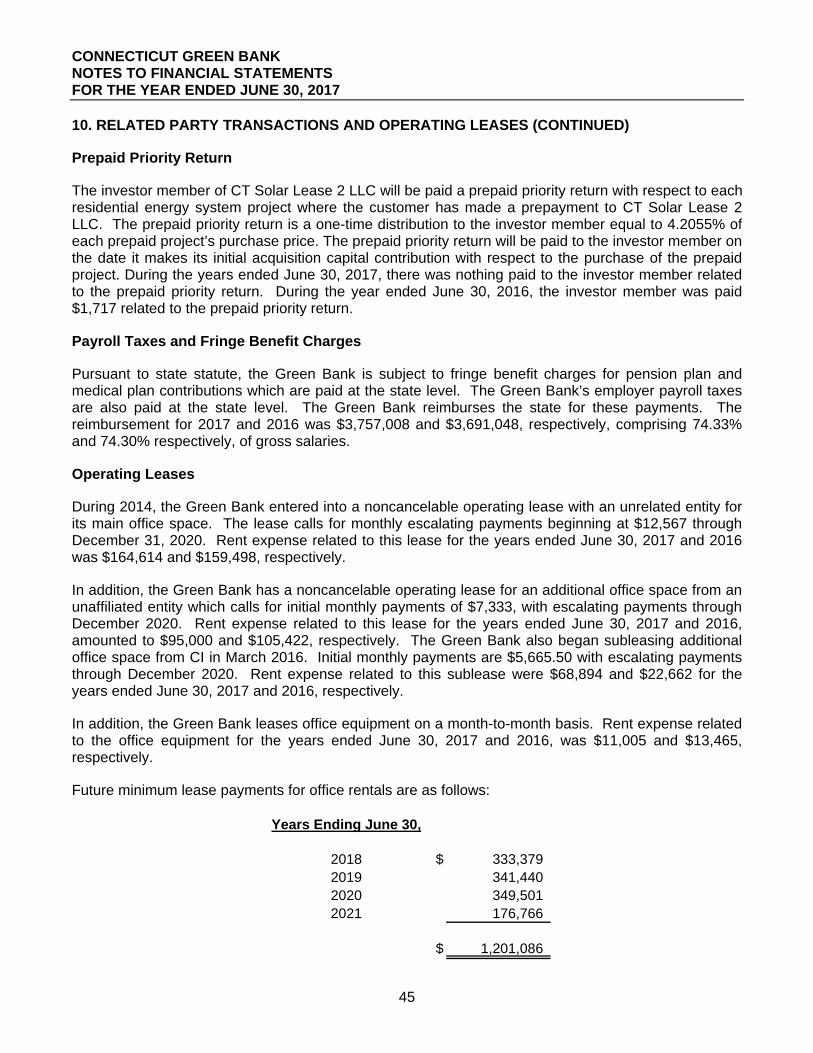
CONNECTICUT GREEN BANK NOTES TO FINANCIAL STATEMENTS FOR THE YEAR ENDED JUNE 30, 2017
45
10. RELATED PARTY TRANSACTIONS AND OPERATING LEASES (CONTINUED)
Prepaid Priority Return
The investor member of CT Solar Lease 2 LLC will be paid a prepaid priority return with respect to each residential energy system project where the customer has made a prepayment to CT Solar Lease 2 LLC. The prepaid priority return is a one-time distribution to the investor member equal to 4.2055% of each prepaid project’s purchase price. The prepaid priority return will be paid to the investor member on the date it makes its initial acquisition capital contribution with respect to the purchase of the prepaid project. During the years ended June 30, 2017, there was nothing paid to the investor member related to the prepaid priority return. During the year ended June 30, 2016, the investor member was paid $1,717 related to the prepaid priority return.
Payroll Taxes and Fringe Benefit Charges
Pursuant to state statute, the Green Bank is subject to fringe benefit charges for pension plan and medical plan contributions which are paid at the state level. The Green Bank’s employer payroll taxes are also paid at the state level. The Green Bank reimburses the state for these payments. The reimbursement for 2017 and 2016 was $3,757,008 and $3,691,048, respectively, comprising 74.33% and 74.30% respectively, of gross salaries.
Operating Leases
During 2014, the Green Bank entered into a noncancelable operating lease with an unrelated entity for its main office space. The lease calls for monthly escalating payments beginning at $12,567 through December 31, 2020. Rent expense related to this lease for the years ended June 30, 2017 and 2016 was $164,614 and $159,498, respectively.
In addition, the Green Bank has a noncancelable operating lease for an additional office space from an unaffiliated entity which calls for initial monthly payments of $7,333, with escalating payments through December 2020. Rent expense related to this lease for the years ended June 30, 2017 and 2016, amounted to $95,000 and $105,422, respectively. The Green Bank also began subleasing additional office space from CI in March 2016. Initial monthly payments are $5,665.50 with escalating payments through December 2020. Rent expense related to this sublease were $68,894 and $22,662 for the years ended June 30, 2017 and 2016, respectively.
In addition, the Green Bank leases office equipment on a month-to-month basis. Rent expense related to the office equipment for the years ended June 30, 2017 and 2016, was $11,005 and $13,465, respectively.
Future minimum lease payments for office rentals are as follows:
Years Ending June 30,
2018 $ 333,379 2019 341,440 2020 349,501 2021 176,766
$ 1,201,086

CONNECTICUT GREEN BANK NOTES TO FINANCIAL STATEMENTS FOR THE YEAR ENDED JUNE 30, 2017
46
11. CAPITAL ASSETS
Capital asset activity for reporting entity for the years ended June 30, 2017 and 2016, are as follows:
Primary Government:
Balance, Balance,2017 July 1, 2016 Additions Deletions Adjustments June 30, 2017
Capital assets being depreciated:Furniture and equipment $ 169,423 $ 532 $ $ $ 169,955
Computer hardware and software 212,831 45,151 (23,845) 234,137
Leasehold improvements 225,844 25,137 250,981 Capital assets not being depreciated:
Construction in progress 4,502 9,517 (14,019) - 612,600 80,337 (37,864) - 655,073
Less accumulated depreciation and amortization:
Furniture and equipment 103,079 33,300 136,379 Computer hardware and software 151,573 37,244 (23,845) 164,972 Leasehold improvements 109,196 46,040 155,236
363,848 116,584 (23,845) - 456,587
Capital assets, net $ 248,752 $ (36,247) $ (14,019) $ - $ 198,486
Balance, Balance,2016 July 1, 2015 Additions Deletions Adjustments June 30, 2016
Capital assets being depreciated:Furniture and equipment $ 222,701 $ 11,417 $ (7,054) $ (57,641) $ 169,423 Computer hardware and software 128,627 35,963 (9,400) 57,641 212,831 Leasehold improvements 153,657 72,187 225,844
Capital assets not being depreciated:Construction in progress 7,141 23,090 (25,729) 4,502
512,126 142,657 (42,183) - 612,600
Less accumulated depreciation and amortization:
Furniture and equipment 122,149 60,653 (4,125) (75,598) 103,079 Computer hardware and software 50,906 26,124 (1,055) 75,598 151,573 Leasehold improvements 75,232 33,964 109,196
248,287 120,741 (5,180) - 363,848
Capital assets, net $ 263,839 $ 21,916 $ (37,003) $ - $ 248,752

CONNECTICUT GREEN BANK NOTES TO FINANCIAL STATEMENTS FOR THE YEAR ENDED JUNE 30, 2017
47
11. CAPITAL ASSETS (CONTINUED)
Discretely presented component units:
Balance, Balance,2017 July 1, 2016 Additions Deletions Adjustments June 30, 2017
Capital assets being depreciated:Solar lease equipment $ 47,534,491 $ 21,042,372 $ $ (3,646,021) $ 64,930,842
Capital assets not being depreciated:WIP solar lease equipment 11,931,741 6,685,666 (20,906,922) 2,289,515 -
59,466,232 27,728,038 (20,906,922) (1,356,506) 64,930,842 Less accumulated depreciation and amortization:
Solar lease equipment 1,600,070 2,307,547 (288,496) 3,619,121 1,600,070 2,307,547 - (288,496) 3,619,121
Capital assets, net $ 57,866,162 $ 25,420,491 $ (20,906,922) $ (1,068,010) $ 61,311,721
Balance, Balance,2016 July 1, 2015 Additions Deletions Adjustments June 30, 2016
Capital assets being depreciated:Solar lease equipment $ 21,011,832 $ 29,240,167 $ $ (2,717,508) $ 47,534,491
Capital assets not being depreciated:WIP solar lease equipment 6,014,560 18,206,741 (11,067,035) (1,222,525) 11,931,741
27,026,392 47,446,908 (11,067,035) (3,940,033) 59,466,232 Less accumulated depreciation and amortization:
Solar lease equipment 319,144 1,532,051 (251,125) 1,600,070 319,144 1,532,051 - (251,125) 1,600,070
Capital assets, net $ 26,707,248 $ 45,914,857 $ (11,067,035) $ (3,688,908) $ 57,866,162

CONNECTICUT GREEN BANK NOTES TO FINANCIAL STATEMENTS FOR THE YEAR ENDED JUNE 30, 2017
48
11. CAPITAL ASSETS (CONTINUED)
Total Reporting Entity:
Balance, Balance,2017 July 1, 2016 Additions Deletions Adjustments June 30, 2017
Capital assets being depreciated:Solar lease equipment $ 47,534,491 $ 21,042,372 $ $ (3,646,021) $ 64,930,842 Furniture and equipment 169,423 532 169,955 Computer hardware and software 212,831 45,151 (23,845) 234,137 Leasehold improvements 225,844 25,137 250,981
Capital assets not being depreciated:WIP solar lease equipment 11,931,741 6,685,666 (20,906,922) 2,289,515 - Construction in progress 4,502 9,517 (14,019) -
60,078,832 27,808,375 (20,944,786) (1,356,506) 65,585,915 Less accumulated depreciation and amortization:
Solar lease equipment 1,600,070 2,307,547 (288,496) 3,619,121 Furniture and equipment 103,079 33,300 136,379 Computer hardware and software 151,573 37,244 (23,845) 164,972 Leasehold improvements 109,196 46,040 155,236
1,963,918 2,424,131 (23,845) (288,496) 4,075,708
Capital assets, net $ 58,114,914 $ 25,384,244 $ (20,920,941) $ (1,068,010) $ 61,510,207
Balance, Balance,2016 July 1, 2015 Additions Deletions Adjustments June 30, 2016
Capital assets being depreciated:Solar lease equipment $ 21,011,832 $ 29,240,167 $ $ (2,717,508) $ 47,534,491 Furniture and equipment 222,701 11,417 (7,054) (57,641) 169,423 Computer hardware and software 128,627 35,963 (9,400) 57,641 212,831 Leasehold improvements 153,657 72,187 225,844
Capital assets not being depreciated:WIP solar lease equipment 6,014,560 18,206,741 (11,067,035) (1,222,525) 11,931,741 Construction in progress 7,141 23,090 (25,729) 4,502
27,538,518 47,589,565 (11,109,218) (3,940,033) 60,078,832
Less accumulated depreciation and amortization:
Solar lease equipment 319,144 1,532,051 (251,125) 1,600,070 Furniture and equipment 122,149 60,653 (4,125) (75,598) 103,079 Computer hardware and software 50,906 26,124 (1,055) 75,598 151,573 Leasehold improvements 75,232 33,964 109,196
567,431 1,652,792 (5,180) (251,125) 1,963,918
Capital assets, net $ 26,971,087 $ 45,936,773 $ (11,104,038) $ (3,688,908) $ 58,114,914
12. GRANT PROGRAMS
The Green Bank, the primary government, recognizes grant revenue based on expenditures or fulfillment of program requirements. For the year ended June 30, 2017 and 2016, the Green Bank recognized related grant revenue of $73,486 and $589,917, respectively under Department of Energy programs.

CONNECTICUT GREEN BANK NOTES TO FINANCIAL STATEMENTS FOR THE YEAR ENDED JUNE 30, 2017
49
13. COMMITMENTS AND LOAN GUARANTEES
Commitments
As of June 30, 2017 and 2016, the Board of Directors designated a portion of the Green Bank’s unrestricted net position to fund financial incentives for specific commercial and residential projects in the following areas:
Type June 30, 2017 Type June 30, 2016Primary Government
Connecticut Green BankSolar PV Incentive $ 52,403,654 Incentive $ 56,457,195 AD/CHP Programs Loan 18,464,844 Loan 15,462,247
Fuel Cells Loan 5,000,000 Loan - CPACE Loan 2,089,057 Loan 7,022,004 Multifamily/LMI Solar PV & Energy Eff. Loan 3,179,452 Grant/Loan 9,510,841 Energy Efficiency Programs Grant/Loan - Grant 1,130,000 Education and Outreach Grant 58,704 Loan 706,900 Other Technologies Loan 271,795 Loan 271,795 Alpha and Operational Demonstration Loan - Loan 165,000
81,467,506 90,725,982 Solar PV commitments payable to CT Solar Lease 2 LLC: (4,593,338) (6,223,664)
Total Reporting Entity $ 76,874,168 $ 84,502,318
These commitments are expected to be funded over the next one to six fiscal years and are contingent upon the completion of performance milestones by the recipient. All commitments are those of the primary government.

CONNECTICUT GREEN BANK NOTES TO FINANCIAL STATEMENTS FOR THE YEAR ENDED JUNE 30, 2017
50
13. COMMITMENTS AND LOAN GUARANTEES (CONTINUED)
Loan Guarantees
As of June 30, 2017 and 2016, the following financial guarantees, approved by the Board of Directors, were outstanding. As of June 30, 2017, CGB has not recognized a liability or made any payments pursuant to these guarantees. Should payments be made in the future, the Green Bank will utilize standard collection efforts to recover payments made on behalf of issuers to those entitled to receive payments pursuant to the obligation guaranteed. All guarantees are those of the primary government.
CGB Owners of multifamily dwellings in Connecticut
Issuers participate in program administered by CGB and the Housing Development Fund to install energy upgrades in multifamily dwellings.
Commercial and consumer loan products with various terms 5,000,000$ 1,323,325$ -$
CGB Developers of clean energy projects in Connecticut
Issuers participate in programs administered by CGB to install energy equipment at residential and commercial sites.
Commercial loans with various terms 5,000,000 - -
CGB CT Solar Loan I LLC Blended unit of primary government
Nonrevolving term note 2,510,837 1,969,173 2,502,218
CGB CT Energy Efficiency Finance Company
Issuer provides loans for the installation of energy efficiency measures in single family homes to credit challenged households to meet the goals outlined in CGB's Comprehensive Plan.
Guarantee limited to $600,000 on revolving credit note of $6,000,000 600,000 6,000,000 6,000,000
CGB New England Hydropower Company
Issuer is the developer of hydropower project in Connecticut approved by the CGB Board of Directors. Line of credit 3,900,000 3,896,773 -
CGB New England Hydropower Company
Issuer is the developer of hydropower project in Connecticut approved by the CGB Board of Directors. Line of credit 300,000 300,000 345,660
CEFIA Holdings LLC
CEFIA Solar Services Inc. Holdings is the sole shareholder of Services and an affiliate of CGB
Promissory note for funds received from CHFA upon their issuance of Qualified Energy Conservation Bonds (QECBs) for State Sponsored Housing Projects (SSHP) 1,895,807 1,840,513 -
19,206,644$ 15,329,784$ 8,847,878$
Maximum Amount of Guaranty
Obligations Guaranteed as of
6/30/2016Guarantor IssuerRelationship of
Guarantor to IssuerType of Obligation
Guaranteed
Obligations Guaranteed as
of 6/30/2017
These commitments will be funded from current and future unrestricted cash balances.

CONNECTICUT GREEN BANK NOTES TO FINANCIAL STATEMENTS FOR THE YEAR ENDED JUNE 30, 2017
51
14. PENSION PLAN
All employees of the Green Bank participate in the State Employees’ Retirement System (SERS), which is administered by the State Employees’ Retirement Commission. The latest actuarial study was performed on the plan as a whole, as of June 30, 2012, and does not separate information for employees of the Green Bank. Therefore, certain pension disclosures pertinent to the Green Bank otherwise required pursuant to accounting principles generally accepted in the United States of America are omitted. Based upon the 2012 valuation, the Plan, as a whole, utilized the project unit credit cost method to develop employer contributions, and included the following actuarial assumptions: 1) investment return of 6.9% (previously 8%); 2) price inflation of 2.5% (previously 2.75%) for cost of living adjustments; 3) projected salary increases of 3.5% to 19.5% (previously 4% to 20%), Social Security wage base increases of 3.50% per annum; 4) payroll growth of 3.5% (previously 3.75%) per annum; and 5) the RP-2014 White Collar Mortality Table (previously RP-2000 Mortality Table). Information on the total plan funding status and progress, contribution required and trend information can be found in the State of Connecticut’s Comprehensive Annual Financial Report available from the Office of the State Comptroller, 55 Elm Street, Hartford, CT 06106.
Plan Description
SERS is a single-employer defined benefit public employee retirement system (PERS) established in 1939 and governed by Sections 5-152 and 5-192 of the Connecticut General Statutes. Employees are covered under one of four tiers. Tier I, Tier IIA and Tier III are contributory plans, and Tier II is a noncontributory plan.
Members who joined the retirement system prior to July 1, 1984 are enrolled in Tier I. Tier I employees who retire at or after age 65 with 10 years of credited service, at or after age 55 with 25 years of service, or at age 55 with 10 years of credited service with reduced benefits are entitled to an annual retirement benefit payable monthly for life, in an amount of 2 percent of the annual average earnings (which are based on the three highest earning years of service) over $4,800 plus 1 percent of $4,800 for each year of credited service. Tier II employees who retire at or after age 60 with 25 years of service, or at age 62 with 10 years of service, or at age 65 with 5 years of service, are entitled to one and one-third percent of the average annual earnings plus one-half of one percent of the average annual earnings in excess of the salary breakpoint in the year of retirement for each year of credited service. Tier II employees between the ages of 55 and 62 with 10 years but less than 25 years of service may retire with reduced benefits. In addition, Tier II and Tier IIA members with at least five but less than ten years of actual state service who terminate their state employment July 2, 1997 or later and prior to attaining age 62 will be in deferred vested status and may commence receipt of normal retirement benefits on the first of the month on or following their sixty-fifth (65) birthday.
Employees hired on and after July 1, 1997, will become members of Tier IIA. Tier IIA plan is essentially the existing Tier II plan with the exception that employee contributions of 2 percent of salary are required. Tier I members are vested after ten years of service, while Tier II and Tier IIA members may be vested after five years of service under certain conditions, and all three plans provide for death and disability benefits.

CONNECTICUT GREEN BANK NOTES TO FINANCIAL STATEMENTS FOR THE YEAR ENDED JUNE 30, 2017
52
14. PENSION PLAN (CONTINUED)
Employees hired on or after July 1, 2011 are covered under the Tier III plan. Tier III requires employee contributions of two percent of salary up to a $250,000 limit after which no additional contributions will be taken on earnings above this limit. The normal retirement date will be the first of any month on or after age 63 if the employee has at least 25 years of vested service or age 65 if the employee has at least 10 but less than 25 years of vested service. Tier III members who have at least 10 years of vested service can receive early reduced retirement benefits if they retire on the first of any month on or following their 58th birthday. Tier III normal retirement benefits include annual retirement benefits for life, in the amount of one and one-third percent of the five-year average annual earnings plus one-half of one percent of the five-year average annual earnings in excess of the salary breakpoint in the year of retirement for each year of credited service plus one and five-eighths of the five-year annual average salary times years of credited service over 35 years.
The total payroll for employees of the Green Bank covered by SERS for the years ended June 30, 2017 and 2016, was $5,061,287 and $4,695,647, respectively.
Contributions Made
Green Bank’s contribution is determined by applying a State mandated percentage to eligible salaries and wages as follows for the years ended June 30:
2017 2016 2015
Contributions made:By employees 144,286$ 208,516$ 171,260$
Percent of current year covered payroll 2.9% 4.4% 4.3%Percent of required contributions 100.0% 100.0% 100.0%
By Green Bank 1,803,349$ 2,474,182$ 1,974,507$ Percent of current year covered payroll 35.6% 52.7% 49.2%Percent of required contributions 100.0% 100.0% 100.0%
The Green Bank has contributed the required amount for each of the past three years.
15. PENSION LIABILITIES, PENSION EXPENSE, DEFERRED OUTFLOWS OF RESOURCES, AND DEFERRED INFLOWS OF RESOURCES
The implementation of GASB 68 resulted in the Green Bank’s reporting an initial net pension liability for fiscal year 2015. The Statement required the Green Bank to recognize a net pension liability for the difference between the present value of the projected benefits for the past service known as the Total Pension Liability (TPL) and the restricted resources held in trust for the payment of pension benefits, known as the Fiduciary Net Pension (FNP). For purposes of measuring the net pension liability, deferred outflows of resources and deferred inflows of resources related to pensions, and pension expense, information about the FNP of SERS and additions to/deductions from SERS FNP have been determined on the same basis as they are reported by SERS. For this purpose, benefit payments (including refunds of employee contributions) are recognized when due and payable in accordance with the benefit term. Investments are recorded at fair value.

CONNECTICUT GREEN BANK NOTES TO FINANCIAL STATEMENTS FOR THE YEAR ENDED JUNE 30, 2017
53
15. PENSION LIABILITIES, PENSION EXPENSE, DEFERRED OUTFLOWS OF RESOURCES, AND DEFERRED INFLOWS OF RESOURCES (CONTINUED)
At June 30, 2017 and 2016, the Green Bank reported a liability of $25,245,439 and $16,096,113, respectively, for its proportionate share of the net pension liability. The net pension liability as of June 30, 2017 was measured as of June 30, 2016, and the total pension liability used to calculate the net pension liability was determined by the actuarial valuation as of that date based on actuarial experience studies. The Green Bank’s allocation of the net pension liability was based on the 2016 covered payroll multiplied by the SERS 2016 contribution rate of 40.36%. As of June 30, 2017 and 2016, the Green Bank’s proportion was 0.10994% and 0.09741%, respectively.
For the years ended June 30, 2017 and 2016, the Green Bank recognized pension expense of $3,226,512 and $1,399,477, respectively. Pension expense is reported in the Green Bank’s financial statements as part of general and administration expense. At June 30, 2017 and 2016, the Green Bank reported deferred outflows of resources and deferred inflows of resources related to pension from the following sources:
As of June 30, 2017:
Difference between expected and actual experience $ 701,307 $
Net difference between projected and actual earnings on pension plan investments 791,666
Change of assumptions 4,501,094
Change in proportion and differences between employer contributions and proportionate share of contributions 2,180,691
Green Bank contributions subsequent to the measurement date 1,803,349
$ 9,978,107 $ -
As of June 30, 2016:
Net difference between projected and actual earnings on pension plan investments $ 2,535 $
Change in proportion and differences between employer contributions and proportionate share of contributions 598,326
Green Bank contributions subsequent to the measurement date 1,974,507
$ 2,575,368 $ -
Deferred Outflows of Resources
Deferred Inflows of Resources
Deferred Outflows of Resources
Deferred Inflows of Resources
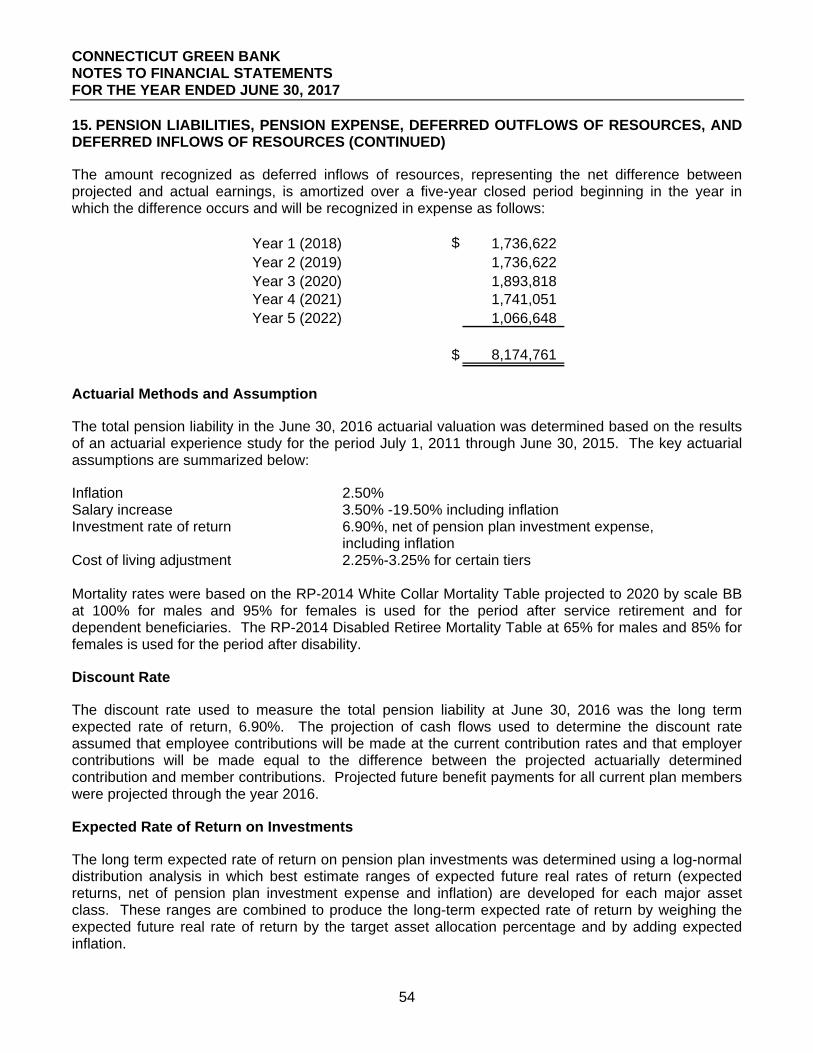
CONNECTICUT GREEN BANK NOTES TO FINANCIAL STATEMENTS FOR THE YEAR ENDED JUNE 30, 2017
54
15. PENSION LIABILITIES, PENSION EXPENSE, DEFERRED OUTFLOWS OF RESOURCES, AND DEFERRED INFLOWS OF RESOURCES (CONTINUED)
The amount recognized as deferred inflows of resources, representing the net difference between projected and actual earnings, is amortized over a five-year closed period beginning in the year in which the difference occurs and will be recognized in expense as follows:
Year 1 (2018) $ 1,736,622 Year 2 (2019) 1,736,622 Year 3 (2020) 1,893,818 Year 4 (2021) 1,741,051 Year 5 (2022) 1,066,648
$ 8,174,761
Actuarial Methods and Assumption
The total pension liability in the June 30, 2016 actuarial valuation was determined based on the results of an actuarial experience study for the period July 1, 2011 through June 30, 2015. The key actuarial assumptions are summarized below:
Inflation 2.50% Salary increase 3.50% -19.50% including inflation Investment rate of return 6.90%, net of pension plan investment expense, including inflation Cost of living adjustment 2.25%-3.25% for certain tiers Mortality rates were based on the RP-2014 White Collar Mortality Table projected to 2020 by scale BB at 100% for males and 95% for females is used for the period after service retirement and for dependent beneficiaries. The RP-2014 Disabled Retiree Mortality Table at 65% for males and 85% for females is used for the period after disability.
Discount Rate
The discount rate used to measure the total pension liability at June 30, 2016 was the long term expected rate of return, 6.90%. The projection of cash flows used to determine the discount rate assumed that employee contributions will be made at the current contribution rates and that employer contributions will be made equal to the difference between the projected actuarially determined contribution and member contributions. Projected future benefit payments for all current plan members were projected through the year 2016.
Expected Rate of Return on Investments
The long term expected rate of return on pension plan investments was determined using a log-normal distribution analysis in which best estimate ranges of expected future real rates of return (expected returns, net of pension plan investment expense and inflation) are developed for each major asset class. These ranges are combined to produce the long-term expected rate of return by weighing the expected future real rate of return by the target asset allocation percentage and by adding expected inflation.

CONNECTICUT GREEN BANK NOTES TO FINANCIAL STATEMENTS FOR THE YEAR ENDED JUNE 30, 2017
55
15. PENSION LIABILITIES, PENSION EXPENSE, DEFERRED OUTFLOWS OF RESOURCES, AND DEFERRED INFLOWS OF RESOURCES (CONTINUED)
The target asset allocation and best estimate of arithmetic real rates of return for each major asset class are summarized in the following table:
Asset Class
Large Cap U.S. Equities 21.0% 5.8%Developed Non-U.S. Equities 18.0% 6.6%Emerging Market (non-U.S.) 9.0% 8.3%Real Estate 7.0% 5.1%Private Equity 11.0% 7.6%Alternative Investments 8.0% 4.1%Fixed Income (Core) 8.0% 1.3%High Yield Bonds 5.0% 3.9%Emerging Market Bond 4.0% 3.7%TIPS 5.0% 1.0%Cash 4.0% 0.4%
Target Allocation
Long-term Expected Real Rate of Return
Sensitivity of Green Bank Proportionate Share of the Net Pension Liability to Changes in the Discount Rates
The following presents the Green Bank’s proportionate share of the net pension liability calculated using the discount rate of 6.90%, as well as the proportionate share of the net pension liability using a 1.00% increase or decrease from the current discount rate.
1% Decrease Discount Rate 1% Increase5.9% 6.9% 7.9%
Green Bank's proportionate share of the net pension liability $ 29,958,758 $ 25,245,439 $ 21,322,878

CONNECTICUT GREEN BANK NOTES TO FINANCIAL STATEMENTS FOR THE YEAR ENDED JUNE 30, 2017
56
16. POST EMPLOYMENT BENEFITS
In addition to the pension benefits described in Note 15, the State provides post-employment health care and life insurance benefits in accordance with State statutes, Sections 5-257(d) and 5 259(a), to all eligible employees who retire from the State, including employees of Connecticut Green Bank.
Currently, 6 retirees meet those eligibility requirements. When employees retire, the State pays up to 100% of their health care insurance premium cost (including dependent's coverage) depending upon the plan. The State currently pays up to 20% of the cost for retiree dental insurance (including dependent's coverage) depending upon the plan. In addition, the State pays 100% of the premium cost for a portion of the employees' life insurance continued after retirement. The amount of life insurance, continued at no cost to the retiree, is determined based on the number of years of service that the retiree had with the State at time of retirement as follows: (a) if the retiree had 25 years or more of service, the amount of insurance will be one-half of the amount of insurance for which the retiree was insured immediately prior to retirement, but the reduced amount cannot be less than $10,000; (b) if the retiree had less than 25 years of service, the amount of insurance will be the proportionate amount that such years of service is to 25, rounded to the nearest $100. The State finances the cost of post-employment health care and life insurance benefits on a pay-as you-go basis through an appropriation in the General Fund.
In accordance with the Revised State Employees Bargaining Agent Coalition (SEBAC) 2011 Agreement between the State of Connecticut and the SEBAC, all employees shall pay the three percent (3%) retiree health care insurance contribution for a period of ten (10) years or retirement, whichever is sooner. In addition, participants of Tier III shall be required to have fifteen (15) years of actual State service to be eligible for retirement health insurance. Deferred vested retirees who are eligible for retiree health insurance shall be required to meet the rule of seventy-five (75), which is the combination of age and actual State service equaling seventy-five (75) in order to begin receiving retiree health insurance based on applicable SEBAC agreement.
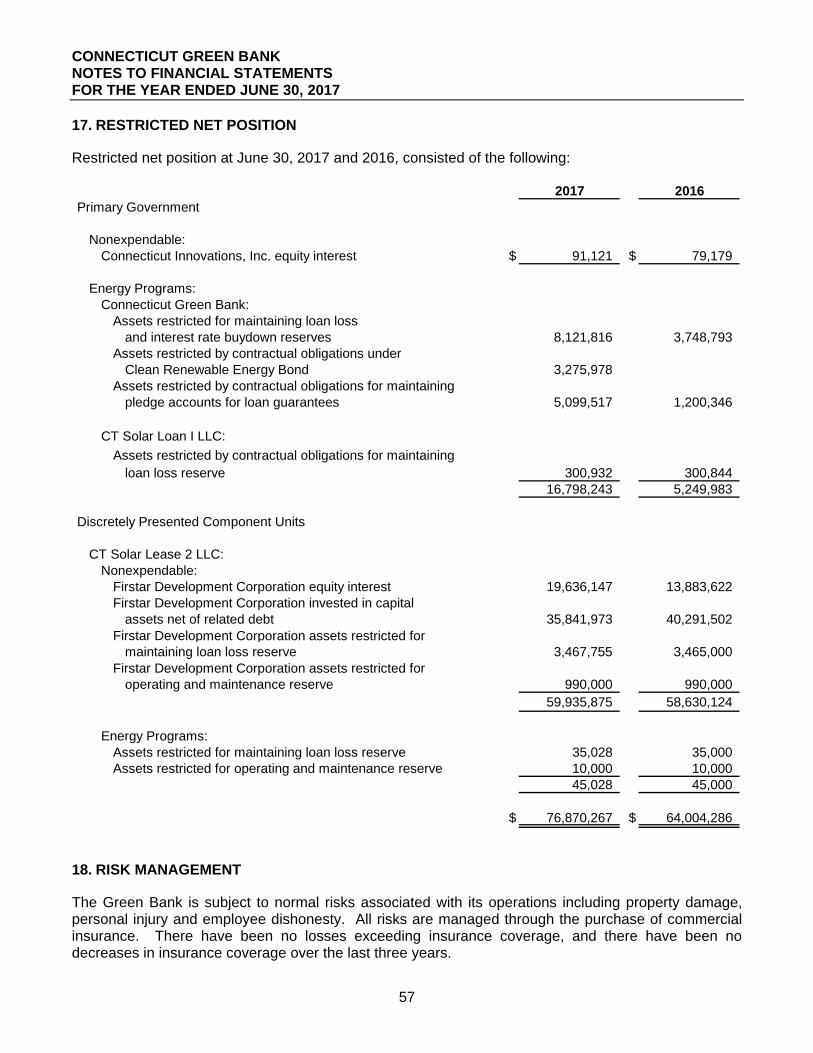
CONNECTICUT GREEN BANK NOTES TO FINANCIAL STATEMENTS FOR THE YEAR ENDED JUNE 30, 2017
57
17. RESTRICTED NET POSITION
Restricted net position at June 30, 2017 and 2016, consisted of the following:
2017 2016Primary Government
Nonexpendable:Connecticut Innovations, Inc. equity interest $ 91,121 $ 79,179
Energy Programs:Connecticut Green Bank:
Assets restricted for maintaining loan lossand interest rate buydown reserves 8,121,816 3,748,793
Assets restricted by contractual obligations underClean Renewable Energy Bond 3,275,978
Assets restricted by contractual obligations for maintaining pledge accounts for loan guarantees 5,099,517 1,200,346
CT Solar Loan I LLC:
Assets restricted by contractual obligations for maintaining loan loss reserve 300,932 300,844
16,798,243 5,249,983
Discretely Presented Component Units
CT Solar Lease 2 LLC:Nonexpendable:
Firstar Development Corporation equity interest 19,636,147 13,883,622 Firstar Development Corporation invested in capital
assets net of related debt 35,841,973 40,291,502 Firstar Development Corporation assets restricted for
maintaining loan loss reserve 3,467,755 3,465,000 Firstar Development Corporation assets restricted for
operating and maintenance reserve 990,000 990,000 59,935,875 58,630,124
Energy Programs:Assets restricted for maintaining loan loss reserve 35,028 35,000 Assets restricted for operating and maintenance reserve 10,000 10,000
45,028 45,000
$ 76,870,267 $ 64,004,286
18. RISK MANAGEMENT
The Green Bank is subject to normal risks associated with its operations including property damage, personal injury and employee dishonesty. All risks are managed through the purchase of commercial insurance. There have been no losses exceeding insurance coverage, and there have been no decreases in insurance coverage over the last three years.

CONNECTICUT GREEN BANK NOTES TO FINANCIAL STATEMENTS FOR THE YEAR ENDED JUNE 30, 2017
58
19. RENEWABLE ENERGY CREDITS (PRIMARY GOVERNMENT)
The Green Bank owns Class 1 Renewable Energy Credits (RECs) that are generated by certain commercial renewable energy facilities for which the Green Bank provided the initial funding. Through its Residential Solar Incentive Program (RSIP), the Green Bank owns the rights to future RECs generated by facilities installed on residential properties. On March 23, 2015 the Green Bank entered into a contract to sell a total of 98,553 RECs generated during the calendar years of 2014 to 2016. For the years ended June 30, 2017 and 2016 the Green Bank generated and sold its contractual obligations of 45,000 and 30,000 RECs, respectively. As of June 30, 2017, the Green Bank has met its contractual obligations under this contract.
RECs trade on the New England Power Pool (NEPOOL) market. The market price of Connecticut Class 1 RECs as of June 30, 2017 ranged from $17.00 to $19.00. The Green Bank’s inventory of RECs generated by commercial facilities as of June 30, 2017 and 2016, was $44,682 and $58,436, respectively. The Green Bank recorded its inventory as of June 30, 2017 at cost, which is below market price.
Public Act No.15-194 (the Act) enacted on October 1, 2015 and as amended by Public Act 16-212 created a Solar Home Energy Credit (SHREC) associated with energy generated from qualifying residential solar PV systems that have received incentives under the Green Bank’s RSIP. Each SHREC represents 1 megawatt hour of electrical generation. Under the Act the Green Bank will own these SHRECs. The Act requires these SHRECs to be purchased by the State’s two investor owned public utilities from the Green Bank through 15-year master purchase agreements (MPA) for each vintage year that these systems are placed into service beginning with the vintage year commencing January 1, 2015 and terminating the earlier of the vintage year ending December 31, 2022 or the deployment of solar PV systems that in the aggregate can generate 300 megawatts of electricity. The Act requires all MPAs to be approved by the State’s Public Utility Regulatory Authority (PURA) prior to execution and sets the initial price for the purchase of a SHREC at $50. Thereafter pricing will be determined by the Green Bank and incorporated into PURA approved MPAs for subsequent vintage years. The initial MPA for vintage years 2015, 2016 and 2017 was approved by PURA and executed on February 7, 2017. SHRECs created and certificated in the New England Power Pool Generation System (NEPOOL GIS) from electricity generated for the period January 1, 2017 through December 31, 2017 for vintage 2015-2017 PV systems will be sold to the two utilities at the initial price of $50 per SHREC on a quarterly basis. SHRECs are certificated by NEPOOL during the fifth month subsequent to the end of the quarter in which the electricity was generated. Once certificated ownership of the SHRECs are transferred to each public utility, payment is received by the Green Bank 30 days later. For electricity generated for the quarter ended March 31, 2017, SHREC certificates were created and transferred to the two utilities in July 2017 at an aggregate sale price of $400,700.
20. SUBSEQUENT EVENTS
On October 26, 2017, the State of Connecticut General Assembly approved the State of Connecticut two-year budget plan which is now pending approval by the Governor. The budget would reduce revenue from ratepayer funds and Regional Greenhouse Gas Initiative (RGGI) auction proceeds historically earned by the Green Bank. The reduction in revenue each year over the next two years from ratepayer funds is $14 million, and management of the Green Bank estimates the reduction attributable to RGGI auction proceeds is approximately $2.3 million in each year as it receives 23% of the RGGI allowance proceeds. Management is proactively addressing the new funding levels based on this revised information.

REQUIRED SUPPLEMENTARY INFORMATION

RSI-1CONNECTICUT GREEN BANKSCHEDULE OF GREEN BANK'S PROPORTIONATE SHARE OF THE NET PENSION LIABILITYLAST THREE FISCAL YEARS*
As of June 30,2017 2016 2015
Green Bank's portion of the net pension liability 0.10994% 0.09741% 0.09304%
Green Bank's proportionate share of the net pension liability 25,245,439$ 16,096,113$ 14,899,766$
Green Bank's covered employee payroll 5,061,287$ 4,695,647$ 4,013,411$
Green Bank's proportionate share of the net pension liability as a percentage of its covered-employee payroll 498.79% 342.79% 371.25%
Plan fiduciary net position as a percentage of the total pension liability 31.69% 39.23% 39.54%
*Note: This schedule is intended to show information for ten years. Additional years' information will be displayed as it becomes available.
59
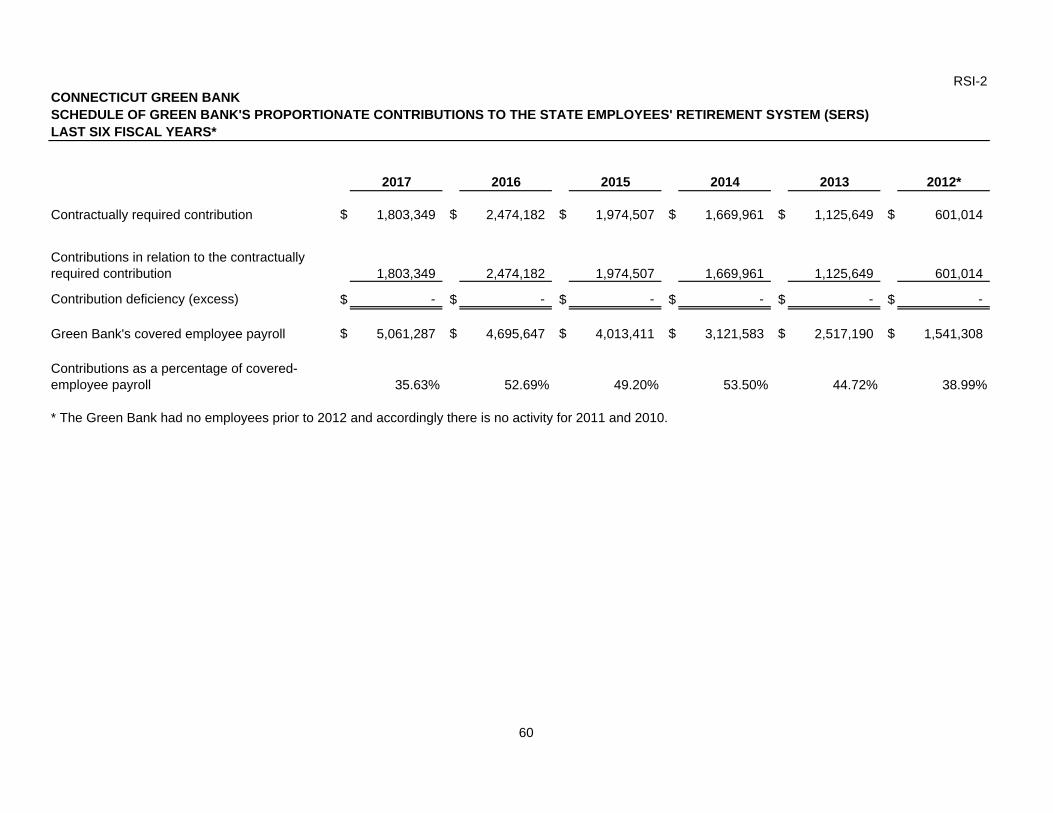
RSI-2CONNECTICUT GREEN BANKSCHEDULE OF GREEN BANK'S PROPORTIONATE CONTRIBUTIONS TO THE STATE EMPLOYEES' RETIREMENT SYSTEM (SERS)LAST SIX FISCAL YEARS*
2017 2016 2015 2014 2013 2012*
Contractually required contribution $ 1,803,349 $ 2,474,182 $ 1,974,507 $ 1,669,961 $ 1,125,649 $ 601,014
1,803,349 2,474,182 1,974,507 1,669,961 1,125,649 601,014
Contribution deficiency (excess) $ - $ - $ - $ - $ - $ -
Green Bank's covered employee payroll $ 5,061,287 $ 4,695,647 $ 4,013,411 $ 3,121,583 $ 2,517,190 $ 1,541,308
35.63% 52.69% 49.20% 53.50% 44.72% 38.99%
* The Green Bank had no employees prior to 2012 and accordingly there is no activity for 2011 and 2010.
Contributions in relation to the contractually required contribution
Contributions as a percentage of covered-employee payroll
60

STATISTICAL SECTION (unaudited)

FINANCIAL STATISTICS

61
CONNECTICUT GREEN BANK STATISTICAL SECTION INTRODUCTION
This part of the Connecticut Green Bank’s (CGB’s) comprehensive annual financial report presents detailed information as a context for understanding what the information about the primary government and the discretely presented component units in the financial statements, note disclosures, and required supplementary information says about the benefits of CGB’s investments.
FINANCIAL STATISTICS CONTENTS PAGE Financial Trends .................................................................................................................. 62-65
These schedules contain trend information to help the reader understand how CGB’s financial performance and well-being have changed over time.
Revenue Capacity ................................................................................................................ 66-67
These schedules contain information to help the reader assess CGB’s most significant local revenue sources.
Debt Capacity ............................................................................................................................ 68
These schedules present information to help the reader assess the affordability of the government's current level of outstanding debt and the CGB’s ability to issue additional debt in the future.
Demographic and Economic Information .......................................................................... 69-70
These schedules offer demographic and economic indicators to help the reader understand the environment within which CGB’s financial activities take place.
Operating Information ......................................................................................................... 71-73
These schedules contain service and infrastructure data to help the reader understand how the information in CGB’s financial report relates to the services CGB provides and the activities it performs.

CONNECTICUT GREEN BANKNET POSITION BY COMPONENTLast Six Fiscal Years
Year Ended June 30, 2017 2016 2015 2014 2013 2012
Primary GovernmentInvested in capital assets, net of related debt $ 198,486 $ 248,752 $ 263,839 $ 289,932 $ 362,505 $ 91,329 Restricted Net Position:
Nonexpendable 91,121 79,179 41,845 8,379 1,000 Restricted - energy programs 16,798,243 5,249,983 4,299,005 4,595,715 5,036,656 176,974
Unrestricted 101,778,631 116,273,628 104,840,938 97,747,386 93,717,230 80,920,002 118,866,481 121,851,542 109,445,627 102,641,412 99,117,391 81,188,305
CT Solar Lease 2 LLCInvested in capital assets, net of related debt 450,844 485,108 278,307 35,390 Restricted Net Position:
Nonexpendable 68,727,413 66,364,332 36,508,164 7,617,084 4,691,594 Restricted - energy programs 45,028 45,000 45,000 45,000 45,000
Unrestricted (deficit) (28,350,047) (32,934,704) (21,703,932) (4,105,401) (1,853,380) 40,873,238 33,959,736 15,127,539 3,592,073 2,883,214 -
CEFIA Solar Services, Inc.Restricted Net Position:
Nonexpendable Restricted - energy programs
Unrestricted (deficit) 486,565 346,379 224,754 109,223 100 486,565 346,379 224,754 109,223 100 -
CT Solar Lease 3 LLCRestricted Net Position:
Nonexpendable Restricted - energy programs
Unrestricted (deficit) - - - - - -
Eliminations (31,562,901) (28,795,323) (15,630,676) (5,549,471) (3,500,100)
Total Net Position $ 128,663,383 $ 127,362,334 $ 109,167,244 $ 100,793,237 $ 98,500,605 $ 81,188,305
62

CONNECTICUT GREEN BANKCHANGES IN NET POSITIONLast Six Fiscal Years
Year Ended June 30,2017 2016 2015 2014 2013 2012
Primary Government
Operating Revenues $ 44,040,016 $ 69,250,883 $ 72,038,472 $ 52,301,283 $ 43,343,093 $ 39,753,684
Operating ExpensesCost of good sold - energy systems 11,333,034 28,826,974 22,526,874 2,794,270 Grants and program expenditures 18,128,022 11,539,070 10,686,366 13,798,012 17,767,885 27,977,688 Program administration expenditures 13,228,749 13,964,097 10,833,325 9,150,664 5,866,580 3,144,667 General and administrative expenses 5,228,711 4,445,648 2,984,178 2,408,715 1,811,227 1,387,854
Total Operating Expenses 47,918,516 58,775,789 47,030,743 28,151,661 25,445,692 32,510,209
Operating Income (Loss) (3,878,500) 10,475,094 25,007,729 24,149,622 17,897,401 7,243,475
Nonoperating Revenue (Expenses)Interest income - promissory notes 2,921,710 2,895,504 2,625,308 1,034,953 583,575 589,007 Interest income - short-term investments 189,237 92,536 83,761 98,383 103,928 140,786 Interest income 61,455 60,127 58,511 57,407 Interest expense - long-term debt (228,502) (61,796) (26,985) Realized gain (loss) on investments (93,974) (33,723) (1,180,285) (350,000) (1,034,605) Unrealized gain (loss) on investments (999,998) 349,999 378,059 434,702 Provision for loan losses (956,489) (1,021,826) (563,825) (1,310,933)
Net Nonoperating Revenues (Expenses) 893,439 1,930,822 996,485 (120,191) 30,957 1,164,495
Income (Loss) Before Transfers, CapitalContributions and Member (Distributions) (2,985,061) 12,405,916 26,004,214 24,029,431 17,928,358 8,407,970
Capital Contributions 1,000 Transfers to State of Connecticut (19,200,000) (6,200,000)
Change in Net Position $ (2,985,061) $ 12,405,916 $ 6,804,214 $ 17,829,431 $ 17,929,358 $ 8,407,970
63

CONNECTICUT GREEN BANKCHANGES IN NET POSITION (CONTINUED)Last Six Fiscal Years
Year Ended June 30,2017 2016 2015 2014 2013 2012
CT Solar Lease 2 LLC
Operating Revenues $ 3,659,883 $ 2,416,597 $ 210,869 $ 1,770 $ $
Operating ExpensesProgram administration expenditures 3,884,129 3,078,633 1,201,123 600,186 General and administrative expenses 620,912 305,217 124,748 127,511 853,480
Total Operating Expenses 4,505,041 3,383,850 1,325,871 727,697 853,480
Operating Income (Loss) (845,158) (967,253) (1,115,002) (725,927) (853,480) -
Nonoperating Revenue (Expenses)Interest on short-term investments 17,615 27,777 9,207 8,642 Interest expense (1,054,848) (729,170) (150,871) (57,407) Unrealized gain (loss) on investments 1,086,987 (967,791) (660,073)
Net Nonoperating Revenues (Expenses) 49,754 (1,669,184) (801,737) (48,765) - -
Income (Loss) Before Transfers, Capital Contributions and Member (Distributions) (795,404) (2,636,437) (1,916,739) (774,692) (853,480)
Capital Contributions 8,145,358 21,770,182 13,556,783 1,496,135 3,736,694 Distributions to Members (436,452) (301,548) (104,579) (12,584)
Change in Net Position $ 6,913,502 $ 18,832,197 $ 11,535,465 $ 708,859 $ 2,883,214 $ -
64

CONNECTICUT GREEN BANKCHANGES IN NET POSITION (CONTINUED)Last Six Fiscal Years
Year Ended June 30,2017 2016 2015 2014 2013 2012
CEFIA Solar Services, Inc.
Operating Revenues $ 129,227 $ 126,075 $ 123,000 $ 120,000 $ $
Operating ExpensesGrants and program expenditures General and administrative expenses 4,998 4,750 8,450 10,877
Total Operating Expenses 4,998 4,750 8,450 10,877 - -
Operating Income (Loss) 124,229 121,325 114,550 109,123 - -
Nonoperating Revenue (Expenses)Interest on short-term investments 16,446 300 981 Interest income 31,437 Interest expense long-term debt (31,926)
Net Nonoperating Revenues (Expenses) 15,957 300 981 - - -
Income (Loss) Before Transfers, Capital Contributions and Member (Distributions) 140,186 121,625 115,531 109,123 - -
Capital Contributions 100
Change in Net Position $ 140,186 $ 121,625 $ 115,531 $ 109,123 $ 100 $ -
Year Ended June 30,2017 2016 2015 2014 2013 2012
CT Solar Lease 3 LLC
Operating Revenues $ $ $ $ $ $
Operating ExpensesGeneral and administrative expenses
Total Operating Expenses - - - - - -
Operating Income (Loss) - - - - - -
Nonoperating Revenue (Expenses)Interest on short-term investments
Net Nonoperating Revenues - - - - - -
Income (Loss) Before Transfers, Capital Contributions and Member (Distributions) - - - - - -
Capital Contributions
Change in Net Position $ - - - - - -
65

CONNECTICUT GREEN BANKOPERATING REVENUE BY SOURCELast Six Fiscal Years Ending June 30,
Utility Remittances RGGI Auction Proceeds Grant RevenueSales of Energy
EquipmentSales of Renewable Energy Certificates Other Revenues
Total Operating % of % of % of % of % of % ofRevenues Revenue Annual Revenue Annual Revenue Annual Revenue Annual Revenue Annual Revenue Annual
Primary Government2017 $ 44,040,016 $ 26,404,349 60.0 % $ 2,392,647 5.4 % $ 98,486 0.2 % $ 12,689,540 28.8 % $ 2,214,000 5.0 % $ 240,994 0.5 % 2016 69,250,883 26,605,084 38.4 % 6,481,562 9.4 % 589,917 0.9 % 32,767,009 47.3 % 2,419,990 3.5 % 387,321 0.6 % 2015 72,038,471 27,233,987 37.8 % 16,583,545 23.0 % 192,274 0.3 % 25,912,414 36.0 % 1,474,488 2.0 % 641,763 0.9 % 2014 52,301,283 27,779,345 53.1 % 20,074,668 38.4 % 321,642 0.6 % 3,548,840 6.8 % 376,559 0.7 % 200,229 0.4 % 2013 43,343,093 27,621,409 63.7 % 4,744,657 10.9 % 10,035,250 23.2 % - % 147,000 0.3 % 794,777 1.8 % 2012 39,753,684 27,025,088 68.0 % 2,052,748 5.2 % 10,435,251 26.2 % - % 142,738 0.4 % 97,860 0.2 %
CT Solar Lease 2 LLC2017 $ 3,659,883 $ - % $ - % $ - % $ - % $ 356,647 9.7 % $ 3,303,236 90.3 % 2016 2,416,597 - % - % - % - % 233,793 9.7 % 2,182,804 90.3 % 2015 210,869 - % - % - % - % - % 210,869 100.0 % 2014 1,770 - % - % - % - % - % 1,770 100.0 % 2013 - - % - % - % - % - % - % 2012 - - % - % - % - % - % - %
CEFIA Solar Services Inc.2017 $ 129,227 $ - % $ - % $ - % $ - % $ - % $ 129,227 100.0 % 2016 126,075 - % - % - % - % - % 126,075 100.0 % 2015 123,000 - % - % - % - % - % 123,000 100.0 % 2014 120,000 - % - % - % - % - % 120,000 100.0 % 2013 - - % - % - % - % - % - % 2012 - - % - % - % - % - % - %
CT Solar Lease 3 LLC2017 $ - $ - % $ - % $ - % $ - % $ -- % $ -- % 2016 - - % - % - % - % -- % -- % 2015 - - % - % - % - % - % -- % 2014 - - % - % - % - % - % -- % 2013 - - % - % - % - % - % - % 2012 - - % - % - % - % - % - %
Eliminations2017 $ (13,862,578) $ - % $ - % $ -- % $ (12,689,540) 91.5 % $ - % $ (1,173,038) 8.5 % 2016 (34,005,320) $ - % - % -- % (32,767,009) 96.4 % $ $ (1,238,311) 3.6 % 2015 (26,077,923) - % - % - % (25,895,727) 99.3 % - % (182,196) 0.7 % 2014 (3,668,840) - % - % - % (3,548,840) 96.7 % - % (120,000) 3.3 % 2013 - - % - % - % - % - % - % 2012 - - % - % - % - % - % - %
Total Reporting Entity2017 $ 33,966,548 $ 26,404,349 77.7 % $ 2,392,647 7.0 % $ 98,486 0.3 % $ - % $ 2,570,647 7.6 % $ 2,500,419 7.4 % 2016 37,788,235 $ 26,605,084 70.4 % 6,481,562 17.2 % 589,917 1.6 % - % 2,653,783 7.0 % 1,457,889 3.9 % 2015 46,294,417 27,233,987 58.8 % 16,583,545 35.8 % 192,274 0.4 % 16,687 0.0 % 1,474,488 3.2 % 793,436 1.7 % 2014 48,754,213 27,779,345 57.0 % 20,074,668 41.2 % 321,642 0.7 % - % 376,559 0.8 % 201,999 0.4 % 2013 43,343,093 27,621,409 63.7 % 4,744,657 10.9 % 10,035,250 23.2 % - % 147,000 0.3 % 794,777 1.8 % 2012 39,753,684 27,025,088 68.0 % 2,052,748 5.2 % 10,435,251 26.2 % - % 142,738 0.4 % 97,860 0.2 %
66

CONNECTICUT GREEN BANKSIGNIFICANT SOURCES OF OPERATING REVENUELast Six Fiscal Years
Year Ended June 30,2017 2016 2015 2014 2013 2012
% of % of % of % of % of % ofRevenue Total Revenue Total Revenue Total Revenue Total Revenue Total Revenue Total
Utility Remittances (1)
Eversource $ 21,135,147 80.0 % $ 21,223,577 79.8 % $ 21,899,541 80.4 % $ 22,322,100 80.4 % $ 22,144,093 80.2 % $ 22,037,771 81.5 % United Illuminating 5,269,202 20.0 % 5,381,507 20.2 % 5,334,446 19.6 % 5,457,245 19.6 % 5,477,316 19.8 % 4,987,317 18.5 %
Total $ 26,404,349 $ 100.0 % $ 26,605,084 $ 100.0 % $ 27,233,987 100.0 % $ 27,779,345 100.0 % $ 27,621,409 100.0 % $ 27,025,088 100.0 %
RGGI Auction Proceeds (2)
Renewables $ 2,392,647 100.0 % $ 6,481,562 100.0 % $ 5,631,156 34.0 % $ 7,476,158 37.2 % $ 4,744,657 100.0 % $ 2,052,748 100.0 % Energy Efficiency -- % -- % 10,952,389 66.0 % 12,598,510 62.8 % -- % -- %
Total $ 2,392,647 100.0 % $ 6,481,562 100.0 % $ 16,583,545 100.0 % $ 20,074,668 100.0 % $ 4,744,657 100.0 % $ 2,052,748 100.0 %
Grant RevenueFederal ARRA Grants $ -- % $ -- % $ -- % $ -- % $ 8,376,681 83.5 % $ 8,738,726 83.8 % DOE Grants 73,486 74.6 % 589,917 100.0 % 143,614 74.7 % 321,642 100.0 % 1,622,569 16.2 % 1,645,525 15.8 % Private Foundation 25,000 25.4 % -- % 48,660 25.3 % -- % 36,000 0.4 % 50,000 0.5 %
Total $ 98,486 100.0 % $ 589,917 100.0 % $ 192,274 100.0 % $ 321,642 100.0 % $ 10,035,250 100.0 % $ 10,434,251 100.0 %
Sales of Renewable Energy Certificates (3)
Gross Proceeds $ 2,584,147 100.5 % $ 2,677,317 100.9 % $ 1,474,488 100.0 % $ 381,444 101.3 % $ 150,000 102.0 % $ 146,038 102.3 % Commissions (13,500) (0.5 %) (23,534) (0.9 %) -- % (4,885) (1.3 %) (3,000) (2.0 %) (3,300) (2.3 %)
Total $ 2,570,647 100.0 % $ 2,653,783 100.0 % $ 1,474,488 100.0 % $ 376,559 100.0 % $ 147,000 100.0 % $ 142,738 100.0 %
(1) Revenue based on Statutory rate of 1 mil per kWh generated by the utility.(2)
(3)
The Regional Greenhouse Gas Initiative (RGGI) is a cooperative effort among nine Northeastern and Mid-Atlantic states to reduce greenhouse gas emissions. RGGI holds quarterly auctions of the member state’s CO2 allowances. At auction, a market-based clearing price is determined from prices submitted in the winning bids and is used to value proceeds returned to the states. The Connecticut Green Bank receives a portion of Connecticut’s auction proceeds which is recognized as revenue and invested in clean energy programs.
CGB owns Class 1 Renewable Energy Credits (RECs) generated by certain commercial renewable energy facilities for which CGB provided the initial funding. Through its RSIP program, CGB owns the rights to future RECs generated by facilities installed on residential properties. CGB enters into contracts to sell RECs generated during specified time periods. RECs trade on the New England Power Pool (NEPOOL) market.
67

CONNECTICUT GREEN BANKOUTSTANDING DEBT BY TYPELast Six Fiscal Years
Year Ended June 30, 2017 2016 2015 2014 2013 2012
Primary GovernmentLine of Credit (including adjustments) $ 1,100,000 $ 1,100,000 $ 1,100,000 $ 4,000,000 $ - $ - Cumulative Advances 1,085,956 1,085,956 1,085,956 126,088 - - Cumulative Repayments (577,162) (394,249) (232,431) - - -
Cumulative Outstanding Debt 508,794 691,707 853,525 126,088 - -
Available LOC - - - 3,873,912 - -
Primary GovernmentOriginal Term Note 2,510,837 2,510,837 - - - - Repayments (541,664) (8,619) - - - -
Cumulative Outstanding Debt 1,969,173 2,502,218 - - - -
Primary GovernmentClean Renewable Energy Bond 2,957,971 - - - - - Repayments - - - - - -
Cumulative Outstanding Debt 2,957,971 - - - - -
CT Solar Lease 2 LLCLine of Credit (including adjustments) 27,600,000 24,000,000 26,700,000 26,700,000 26,700,000 - Cumulative Advances 27,500,633 18,000,000 3,000,000 - - - Cumulative Repayments (2,392,925) (832,325) - - - -
Cumulative Outstanding Debt 25,107,708 17,167,675 3,000,000 - - -
Available LOC - 6,000,000 23,700,000 26,700,000 26,700,000 -
CEFIA Solar Services Inc.Original Term Note 1,895,807 - - - - - Repayments (55,295) - - - - -
Cumulative Outstanding Debt 1,840,512 - - - - -
Total Reporting EntityCumulative Outstanding Debt $ 32,384,158 $ 20,361,600 $ 3,853,525 $ 126,088 $ - $ -
68
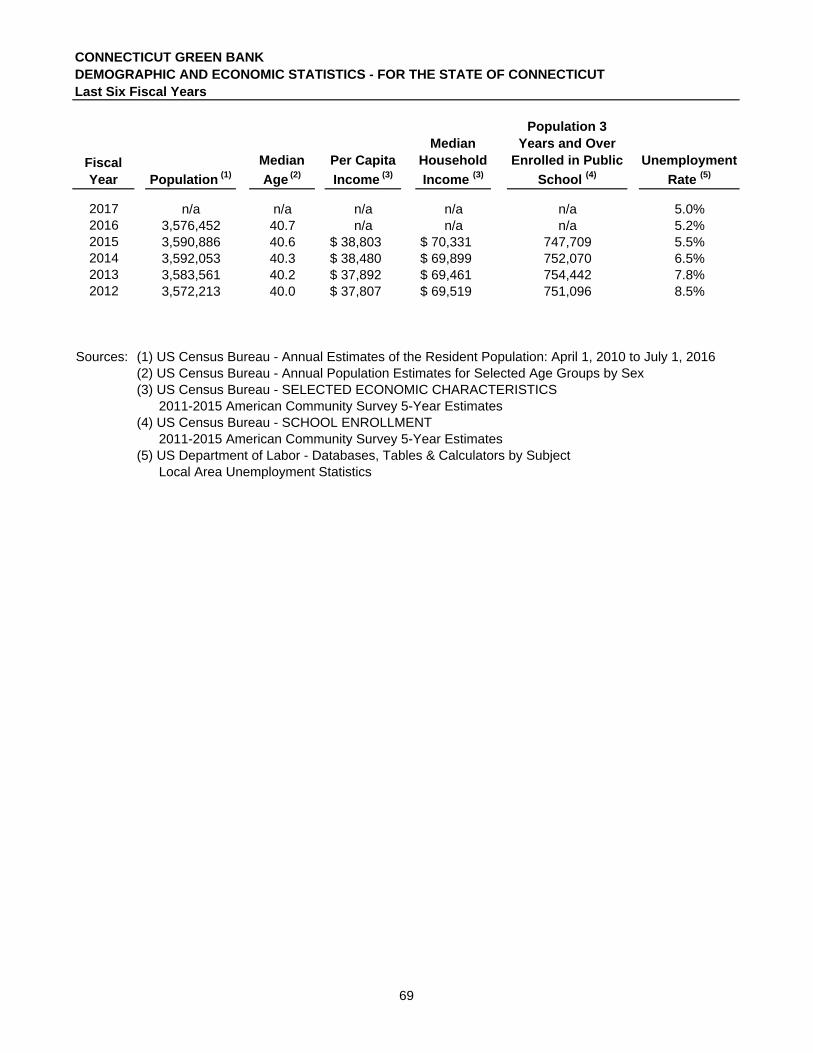
CONNECTICUT GREEN BANKDEMOGRAPHIC AND ECONOMIC STATISTICS - FOR THE STATE OF CONNECTICUTLast Six Fiscal Years
Fiscal Year Population (1)
Median
Age (2)
Per Capita
Income (3)
Median Household
Income (3)
Population 3 Years and Over
Enrolled in Public
School (4)
Unemployment
Rate (5)
2017 n/a n/a n/a n/a n/a 5.0%2016 3,576,452 40.7 n/a n/a n/a 5.2%2015 3,590,886 40.6 $ 38,803 $ 70,331 747,709 5.5%2014 3,592,053 40.3 $ 38,480 $ 69,899 752,070 6.5%2013 3,583,561 40.2 $ 37,892 $ 69,461 754,442 7.8%2012 3,572,213 40.0 $ 37,807 $ 69,519 751,096 8.5%
Sources: (1) US Census Bureau - Annual Estimates of the Resident Population: April 1, 2010 to July 1, 2016(2) US Census Bureau - Annual Population Estimates for Selected Age Groups by Sex(3) US Census Bureau - SELECTED ECONOMIC CHARACTERISTICS 2011-2015 American Community Survey 5-Year Estimates(4) US Census Bureau - SCHOOL ENROLLMENT 2011-2015 American Community Survey 5-Year Estimates(5) US Department of Labor - Databases, Tables & Calculators by Subject Local Area Unemployment Statistics
69

CONNECTICUT GREEN BANKPRINCIPAL EMPLOYERS - FOR THE STATE OF CONNECTICUTLast Four Calendar Years
2016 2015 2014 2013
Employer Employees (1) Rank
Percentage of Total State Employment (2) Employees (1) Rank
Percentage of Total State Employment (2) Employees (1) Rank
Percentage of Total State Employment (2) Employees (1) Rank
Percentage of Total State
Employment (2)
State of Connecticut 48,912 1 2.71% 51,646 1 2.89% 54,230 1 3.05% 53,951 1 3.10%Yale New Haven Health System 19,920 2 1.10 20,071 3 1.12 18,869 3 1.06 18,639 3 1.07 Hartford Healthcare 18,135 3 1.01 18,107 4 1.01 18,597 4 1.05 16,951 4 0.98 Yale University 15,018 4 0.83 14,787 5 0.83 14,787 5 0.83 14,750 5 0.85 United Technologies 15,000 5 0.83 24,000 2 1.34 25,000 2 1.40 27,000 2 1.55 General Dynamics Electric Boat 10,230 6 0.57 9,583 6 0.54 8,896 7 0.50 8,817 6 0.51 Wal-Mart Stores Inc. 8,800 7 0.49 8,800 7 0.49 9,289 6 0.52 8,761 7 0.50 Sikosrsky, A Lockheed Martin Company 8,000 8 0.44 N/A --- -- N/A --- -- N/A --- --The Travelers Cos. Inc. 7,400 9 0.41 7,300 8 0.41 7,400 9 0.42 7,400 9 0.43 The Hartford Financial Services Group 7,000 10 0.39 7,000 9 0.39 7,000 11 0.39 7,700 11 0.44 Mohegan Sun 6,735 11 0.37 6,900 10 0.39 7,300 10 0.41 7,300 10 0.42 Foxwoods Resort Casino 6,500 12 0.36 5,301 14 0.30 7,600 8 0.43 7,667 8 0.44
1804108 1785273 1779503 1737630
Sources: (1) Hartford Business Journal, Book of Lists: Connecticut's largest employers (For 2016, removed #7 University of Connecticut per HBJ footnote (2) employee count is already included in State of Connecticut employee count.)(2) Total State Employment from US Department of Labor - Databases, Tables & Calculators by Subject - Local Area Unemployment Statistics
70

CONNECTICUT GREEN BANKFTEs BY FUNCTIONLast Six Fiscal Years
Year Ended June 30, 2017 2016 2015 2014 2013 2012
Program ServicesStatutory & Infrastructure 9.00 9.00 8.00 7.00 7.00 9.00 Residential 6.00 6.00 6.00 5.00 3.00 1.00 Commercial & Industrial 4.00 4.00 2.00 4.00 2.00 Institutional 1.00 1.00 1.00 1.00
Subtotal Program Services 19.00 19.00 17.00 17.00 13.00 11.00
Administrative & SupportExecutive 4.00 4.00 4.00 4.00 4.00 4.00 Finance 5.00 6.00 5.00 4.00 3.00 1.00 Accounting 5.75 5.75 5.30 3.50 2.75 2.20 Legal & Policy 3.00 3.00 3.00 2.00 2.00 2.00 Marketing 6.00 6.00 6.00 5.00 5.00 5.00 Operations 3.50 3.90 3.50 3.80 4.00 3.85
Subtotal Administrative & Support 27.25 28.65 26.80 22.30 20.75 18.05
Total FTEs by Function 46.25 47.65 43.80 39.30 33.75 29.05
Source: Connecticut Green Bank internal payroll records
71

CONNECTICUT GREEN BANKOPERATING INDICATORS BY FUNCTION Last Six Fiscal Years
Year Ended June 30,2017 2016 2015 2014 2013 2012
Clean Energy Investment ($s in Millions)CGB Dollars Invested 24.5$ 37.0$ 57.0$ 32.6$ 18.7$ 4.8$ Private Dollars Invested 190.8 278.1 267.9 74.9 92.8 10.2 Total Project Investment 215.3 315.1 324.9 107.5 111.5 15.0
Number of Clean Energy Projects 5,459 7,606 6,527 2,456 1,119 417 Annual Energy Savings of Clean Energy (MMBtu) 532,685 346,135 709,965 246,195 463,328 11,183
Installed Capacity of Clean Energy (MW)Anaerobic Digesters 1.0 Biomass 0.6 CHP 0.3 3.0 0.7 CHP/Microgrid 0.8 Fuel Cell 14.8 Energy EfficiencyGeothermal Hydro 0.2 0.9 Solar PV 52.2 67.7 55.9 20.4 8.0 2.9 Wind 5.0
Total 53.2 68.7 62.7 23.4 23.5 2.9
Lifetime Production of Clean Energy (MWh)Anaerobic Digesters 106,171 Biomass 17,082 CHP 31,930 354,780 81,008 CHP/Microgrid 94,017 Energy Efficiency 69,315 103,710 43,128 56,929 4,846 Fuel Cell 1,166,832 Geothermal 329 295 38 84 Hydro 20,626 96,185 Solar PV 1,485,568 1,927,692 1,592,258 581,702 227,323 81,939 Wind 118,260
Total 1,669,855 2,137,868 1,898,881 993,495 1,480,009 81,939
Jobs Created by YearDirect Jobs (# of Jobs) 722 1,654 1,465 594 580 88 Indirect and Induced Jobs (# of Jobs) 957 2,660 2,357 954 1,165 142
Lifetime CO2 Emission Reductions (Tons)Avoided Emissions 883,582 1,145,841 1,055,021 357,139 210,616 45,820 Homes' Energy Use for One Year 84,644 109,767 101,067 34,213 20,176 4,389 Passenger Vehicles Driven for One Year 169,319 219,575 202,172 68,438 40,360 8,780 Acres of U.S. Forests in One Year 758,771 983,985 905,994 306,692 180,865 39,347
Source: Internal Connecticut Green Bank Reporting: Key Performance Indicators Data File
72

CONNECTICUT GREEN BANKCAPITAL ASSETS STATISTICS BY FUNCTIONLast Six Fiscal Years
2017 2016 2015 2014 2013 2012
Capital assets being depreciated:Solar lease equipment $ 64,930,842 $ 47,534,491 $ 21,011,832 $ 1,035,159 $ $ Furniture and equipment 169,955 169,423 222,701 338,938 335,744 13,049 Computer hardware and software 234,137 212,832 128,628 88,337 136,659 28,460 Leasehold improvements 250,981 225,844 153,657 139,682 71,470 56,224
Capital assets not being depreciated:WIP solar lease equipment 11,931,740 6,014,560 1,759,111 Construction in progress 4,502 7,141 7,141
65,585,915 60,078,832 27,538,519 3,368,368 543,873 97,733
Less accumulated depreciation and amortization:Solar lease equipment 3,619,121 1,600,070 319,144 9,865 Furniture and equipment 136,379 103,079 122,149 205,820 146,560 626 Computer hardware and software 164,972 151,573 50,906 33,845 18,093 3,807 Leasehold improvements 155,236 109,196 75,232 44,501 16,715 1,971
4,075,708 1,963,918 567,431 294,031 181,368 6,404
Capital assets, net $ 61,510,207 $ 58,114,914 $ 26,971,088 $ 3,074,337 $ 362,505 $ 91,329
Year Ended June 30,
73

NON-FINANCIAL STATISTICS

CONNECTICUT GREEN BANK NON-FINANCIAL STATISTICS INTRODUCTION
74
Contents
This part of the Connecticut Green Bank’s comprehensive annual financial report presents detailed non-financial information as a context for understanding the methods management uses to measure the Connecticut Green Bank’s success and efforts to transform the clean energy market in using its financial resources.
1. STATEMENT OF THE CONNECTICUT GREEN BANK .................................................... 76
2. STATEMENT OF NON-FINANCIAL STATISTICS AUDITOR ........................................... 79
3. ORGANIZATIONAL BACKGROUND ..................................................................................... 80
Governance .......................................................................................................................................................... 80
Ethics and Transparency ................................................................................................................................... 83
Open Connecticut ................................................................................................................................................ 84
Small and Minority Business Procurement ..................................................................................................... 84
Efficiency .............................................................................................................................................................. 85
4. MEASURES OF SUCCESS ...................................................................................................... 87
Activity .................................................................................................................................................................. 87
Capital Deployed ................................................................................................................................................. 88
Clean Energy Produced and Energy Saved ..................................................................................................... 89
Clean Energy Technology Deployment ............................................................................................................ 90
The Green Bank Model ....................................................................................................................................... 93
Societal Benefits .................................................................................................................................................. 95
Community Impacts ............................................................................................................................................ 97
5. PROGRAMS ............................................................................................................................... 110
Program Logic Model and the Financing Market Transformation Strategy .............................................. 110
Case 1 – C-PACE ............................................................................................................................................... 116
Case 2 – Solar Lease ......................................................................................................................................... 128

CONNECTICUT GREEN BANK NON-FINANCIAL STATISTICS INTRODUCTION
75
Case 3 – Residential Solar Investment Program ........................................................................................... 140
Case 4 – Smart-E Loan ..................................................................................................................................... 150
Case 5 – Low Income Solar Lease and Energy-Efficiency Energy Savings Agreement (ESA) .............. 160
Case 6 – Multifamily Programs ........................................................................................................................ 168
Case 7 – CT Solar Loan (Graduated) .............................................................................................................. 179
Anaerobic Digestion and Combined Heat and Power Pilot Programs ....................................................... 188
Strategic Investments ....................................................................................................................................... 190
6. APPENDIX .................................................................................................................................. 192
Community Activity Table ................................................................................................................................ 192
Contractor Activity Table ................................................................................................................................. 192
Trained Contractor Table ................................................................................................................................. 192
Calculations and Assumptions ....................................................................................................................... 192
Index of Figures and Tables ............................................................................................................................. 195

CONNECTICUT GREEN BANK 1. STATEMENT OF THE CONNECTICUT GREEN BANK
76
1. Statement of the Connecticut Green Bank August 25, 2017
Re: Statement of the Connecticut Green Bank on the Non-Financial Statistics Contents of the Comprehensive Annual Financial Report for FY 2017 - Background and Market, Measures of Success, and Market Transformation
Dear Reader:
This is the “Non-Financial Statistics” section of the Comprehensive Annual Financial Report for FY 2017.
In FY 2017, our sixth year of operation, we continued building public private partnerships that leverage limited public funds by attracting private capital to spark the growth of green energy. It was a year filled with milestones for our organization:
Our first “green bond” – Clean Renewable Energy Bonds – was issued to finance a first-in-the-nation deployment of an Archimedes Screw Generator hydroelectric technology for a run-of-river project on the Hanover Pond in Meriden, CT.
We received our first Program Related Investment (PRI) from the Kresge Foundation to develop community based energy storage projects that provide resiliency.
As an organization, we passed the mark of $1 billion in cumulative capital deployed to clean energy projects.
Commercial Property Assessed Clean Energy passed $100 million in capital deployed in its lifetime.
Residential programs passed $100 million in capital deployed since we started addressing the sector.
In recognition not just of these milestone but for our innovative approach to “Sparking the Green Bank Movement” and building inclusive prosperity through the green economy, the Ash Center for Democratic Governance and Innovation at Harvard University’s Kennedy School of Government awarded the Green Bank the winner of the 2017 Innovations in American Government Award1. We are making steady progress ensuring that the green economy is accessible to everyone – and throughout this report, the reader will see the progress we are making in underserved markets.
The assembly of the “Non-Financial Statistics” section of the Comprehensive Annual Financial Report is a process of continuous improvement, at the forefront of such is having established methodologies. During the course of FY2017, we made great strides in terms of our Evaluation, Measurement, and
1 Innovations in American Government Award: http://www.ash.harvard.edu/innovations‐american‐government‐awards
CONNECTICUT GREEN BANK 1. STATEMENT OF THE CONNECTICUT GREEN BANK
77
Verification agenda as well. Our board of directors approved the Evaluation Framework as a structure by which we will measure our programs and their impact. We started focusing on specific methodologies and processes within the framework by which we gauge different societal benefits supported by our investments. We, in conjunction with Navigant Consulting and the Department of Economic and Community Development, updated our Jobs study and formalized calculations for determining the job years stimulated by clean energy in Connecticut. Working with the Connecticut Department of Energy and Environment Protection and the U.S. Environmental Protection Agency, we adopted a new model for assessing the environmental benefits created by the support of our projects. We intend to build on this progress in FY2018 focusing on Public Health and energy measurement with a focus on renewable energy.
To bolster our work on methodology and transparency, we engaged SustainAbility to assess the organization’s methods for representing impact using our indicators. The team from SustainAbility had no findings and has endorsed the Green Bank’s methodologies. Further, SustainAbility benchmarked the Green Bank’s reporting against other green banks, utilities, and financial institutions. They found the Connecticut Green Bank’s reporting to provide a high degree of transparency both in terms of activity and in terms of the underlying methods used to calculate this activity. SustainAbility also reviewed the organization’s manners of presentation and the Connecticut Green Bank will be using SustainAbility’s report as a guide to improve its impact reporting across the board.
The result is a more transparent Non-Financial Statistics section. In this document, you will find:
Organizational Background – an overview of the organization’s governance, including engagement of its members at the board and committee levels, along with ethics compliance and financial interest disclosure requirements as well as the organization’s dedication to transparency. You will see how the organization has made steady progress in terms of voluntarily ensuring that Connecticut’s small businesses and minority-owned enterprises have opportunities to bid on a portion of the purchases of goods and services that the organization procures. You will also find measures of our efficiency, showing that as we have grown we have remained nimble as an organization.
• Measures of Success –as outlined in the organization’s Comprehensive Plan2, we are reporting on the following measures of success:
• Attract & Deploy Capital – how we are sourcing projects (as illustrated by projects in statuses from approved to completed), level of investment by both the Connecticut Green Bank and the end-use consumer or private investor, and the private to public leverage ratio being achieved by sector.
• Energy Saved and Generated – how we are quantifying the energy generated and/or saved by each project. - This includes the amount of clean energy deployed (i.e., kW), estimate of clean energy produced over the life of the projects (i.e., MWh), estimate of the annual amount of energy savings (i.e., MMBtu), and the variety of clean energy technologies we have invested in by sector.
2 Comprehensive Plan: http://www.ctgreenbank.com/wp‐content/uploads/2016/11/CTGreenBank‐Comprehensive‐Plan‐Fiscal‐Years‐2017‐2018‐11232016.pdf

CONNECTICUT GREEN BANK 1. STATEMENT OF THE CONNECTICUT GREEN BANK
78
• Green Bank – how we are building a balance sheet because of our financing focus in terms of asset management (i.e., current vs. non-current assets), ratio of public funds invested in grants and subsidies versus credit enhancements, loans, and leases, and the general credit quality of residential borrowers in our financing programs.
• Societal Benefits – how our investment activities are supporting economic development (i.e., jobs) and environmental protection (i.e., GHG emission reductions and equivalencies) benefits.
• Community Impacts – how we are attracting investment to and deploying clean energy in our local communities, including distressed communities and low income census tracts.
• Programs – an overview of the programs of the Green Bank and of the program logic model for the organization in terms of its goals:
• Attract and Deploy – to attract and deploy private capital to finance the clean energy policy goals for Connecticut;
• Leverage and Reinvestment – to leverage limited public funds to attract multiples of private capital investment while returning and reinvesting public funds in clean energy deployment over time;
• Affordable and Accessible – to develop and implement strategies that bring down the cost of clean energy to make it more accessible and affordable to customers; and
• Underserved Markets – to support affordable and healthy buildings in low-to-moderate income and distressed communities by reducing the energy burden and addressing health and safety issues in their homes, businesses, and institutions.
• Appendix – the appendix contains tables showing data contained in the bodies of prior years’ Non-Financial Statistics showing Green Bank activity by Community and by Contractor and includes factors used in our calculations.
As always, we continue to strive to provide a transparent view of our organization and our programs with the hope that where we find both success and challenges, others will be able to learn from our example.
Regards,
Bryan Garcia Eric Shrago President and CEO Director of Operations
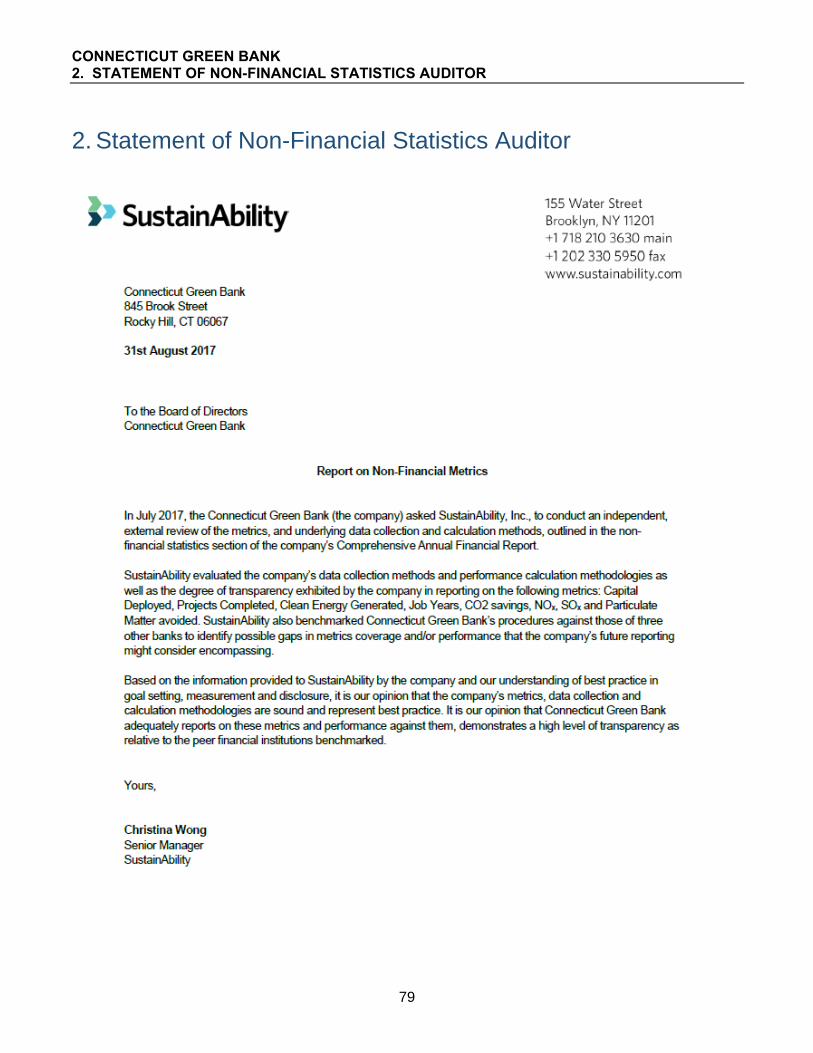
CONNECTICUT GREEN BANK 2. STATEMENT OF NON-FINANCIAL STATISTICS AUDITOR
79
2. Statement of Non-Financial Statistics Auditor
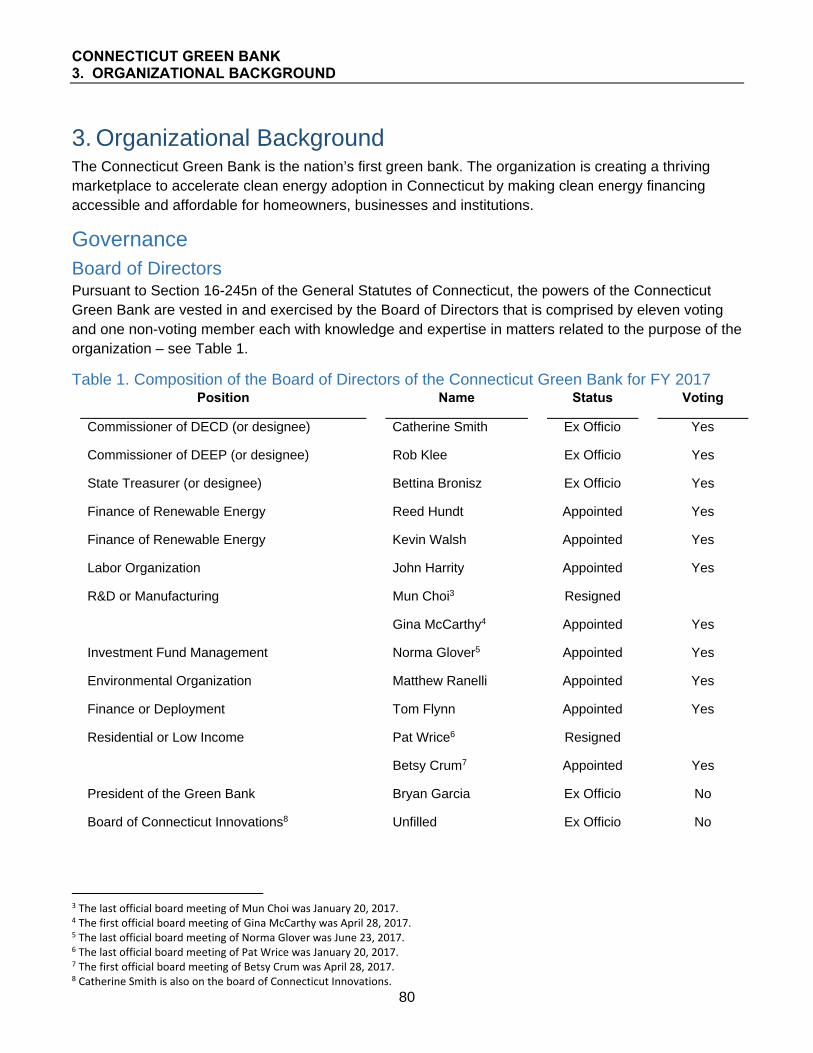
CONNECTICUT GREEN BANK 3. ORGANIZATIONAL BACKGROUND
80
3. Organizational Background The Connecticut Green Bank is the nation’s first green bank. The organization is creating a thriving marketplace to accelerate clean energy adoption in Connecticut by making clean energy financing accessible and affordable for homeowners, businesses and institutions.
Governance Board of Directors Pursuant to Section 16-245n of the General Statutes of Connecticut, the powers of the Connecticut Green Bank are vested in and exercised by the Board of Directors that is comprised by eleven voting and one non-voting member each with knowledge and expertise in matters related to the purpose of the organization – see Table 1.
Table 1. Composition of the Board of Directors of the Connecticut Green Bank for FY 2017 Position Name Status Voting
Commissioner of DECD (or designee) Catherine Smith Ex Officio Yes
Commissioner of DEEP (or designee) Rob Klee Ex Officio Yes
State Treasurer (or designee) Bettina Bronisz Ex Officio Yes
Finance of Renewable Energy Reed Hundt Appointed Yes
Finance of Renewable Energy Kevin Walsh Appointed Yes
Labor Organization John Harrity Appointed Yes
R&D or Manufacturing
Mun Choi3
Gina McCarthy4
Resigned
Appointed Yes
Investment Fund Management Norma Glover5 Appointed Yes
Environmental Organization Matthew Ranelli Appointed Yes
Finance or Deployment Tom Flynn Appointed Yes
Residential or Low Income
Pat Wrice6
Betsy Crum7
Resigned
Appointed
Yes
President of the Green Bank Bryan Garcia Ex Officio No
Board of Connecticut Innovations8 Unfilled Ex Officio No
3 The last official board meeting of Mun Choi was January 20, 2017. 4 The first official board meeting of Gina McCarthy was April 28, 2017. 5 The last official board meeting of Norma Glover was June 23, 2017. 6 The last official board meeting of Pat Wrice was January 20, 2017. 7 The first official board meeting of Betsy Crum was April 28, 2017. 8 Catherine Smith is also on the board of Connecticut Innovations.

CONNECTICUT GREEN BANK 3. ORGANIZATIONAL BACKGROUND
81
The Board of Directors of the Connecticut Green Bank is governed through statute, as well as an Ethics Statement9 and Ethical Conduct Policy10, Resolutions of Purposes11, Bylaws12, Joint Committee Bylaws13, and Comprehensive Plan14. The Comprehensive Plan for the Connecticut Green Bank provides a multiyear strategy to support the vision and mission of the organization and the public policy objective of delivering consumers cheaper, cleaner, and more reliable sources of energy while creating jobs and supporting local economic development. An Employee Handbook and Operating Procedures15 have also been approved by the Board of Directors and serve to guide the staff to ensure that it is following proper contracting, financial assistance, and other requirements.
As noted above, the Board of Directors of the Connecticut Green Bank is comprised of eleven (11) ex officio and appointed voting members, and two (2) ex officio non-voting members. The leadership of the Board of Directors, includes:
Chair - Catherine Smith, Commissioner of DECD (designated as the Chair of the Connecticut Green Bank by Governor Malloy)
Vice Chair - Rob Klee, Commissioner of DEEP (voted in by his peers of the Connecticut Green Bank Board of Directors)
Secretary - Matthew Ranelli, Partner at Shipman and Goodwin (voted in by his peers of the Connecticut Green Bank Board of Directors)
Staff Lead – Bryan Garcia, President and CEO
During FY 2017, the Board of Directors of the Connecticut Green Bank met ten (10) times, including six (6) regularly scheduled meetings and four (4) special meetings. There was an attendance rate of 70% by the Board of Directors and 49 approved resolutions. For a link to the materials from the Board of Directors meetings that are publicly accessible – click here16.
Committees of the Board of Directors
There are four (4) committees of the Board of Directors of the Connecticut Green Bank, including:
Audit, Compliance, and Governance Budget and Operations Deployment
Joint Committee of the Energy Efficiency Board and the Connecticut Green Bank
9Ethics Statement: http://www.ctgreenbank.com/wp‐content/uploads/2017/02/Green‐Bank_Ethics‐Statement‐CLEAN‐REVISED‐102214.pdf 10 Ethical Conduct Policy: http://www.ctgreenbank.com/wp‐content/uploads/2017/08/Green‐Bank_Ethical‐Conduct‐Policy_BOD_CLEAN_REVISED‐101714.pdf 11 Resolutions of Purposes: http://www.ctgreenbank.com/wp‐content/uploads/2016/01/Financial‐and‐Gov._‐CT‐Green‐Bank‐Resolution‐of‐Purpose.pdf 12 Bylaws: http://www.ctgreenbank.com/wp‐content/uploads/2017/02/CTGreenBank‐Bylaws‐sec16‐245n‐CTGS‐r12162016.pdf 13 Joint Committee Bylaws: http://www.ctgreenbank.com/wp‐content/uploads/2015/12/ECMB_CGB_Joint_Committee_Bylaws_October_2014FINAL.pdf 14 Comprehensive Plan: http://www.ctgreenbank.com/wp‐content/uploads/2016/11/CTGreenBank‐Comprehensive‐Plan‐Fiscal‐Years‐2017‐2018‐11232016.pdf 15 Operating Procedures: http://www.ctgreenbank.com/wp‐content/uploads/2017/02/CTGreenBank‐Operating‐Procedures‐sec16‐245n‐CTGS‐r12162016.pdf 16 Board of Directors meetings: http://www.ctgreenbank.com/about‐us/governance/connecticut‐grboard‐meetings/

CONNECTICUT GREEN BANK 3. ORGANIZATIONAL BACKGROUND
82
Audit, Compliance and Governance Committee The Audit, Compliance and Governance Committee (ACG Committee) of the Connecticut Green Bank is comprised of three (3) ex officio and appointed voting members. The leadership of the ACG Committee, includes:
Chair – Matthew Ranelli, Partner and Shipman and Goodwin (designated as the Chair by Catherine Smith)
Members17 – John Harrity and Pat Wrice/Tom Flynn18 (designated as a member of the Committee by Catherine Smith)
During FY 2017, the ACG Committee of the Connecticut Green Bank met two (2) times, including two (2) special meetings and no regular meetings. There was an attendance rate of 83% by the Committee members and 6 approved resolutions. For a link to the materials from the ACG Committee meetings that are publicly accessible – click here19.
Budget and Operations Committee The Budget & Operations Committee (B&O Committee) of the Connecticut Green Bank is comprised of three (3) ex officio and appointed voting members. The leadership of the B&O Committee, includes:
Chair - Rob Klee, Commissioner of DEEP (designated as the Chair by Catherine Smith)
Members20 - Mun Choi21 and Norma Glover (designated as a member of the Committee by Catherine Smith)
During FY 2017, the B&O Committee of the Connecticut Green Bank met three (3) times, including two (2) regularly scheduled meetings and one (1) special meeting. There was an attendance rate of 100% by the Committee members and 1 approved resolution. For a link to the materials from the B&O Committee meetings that are publicly accessible – click here22.
Deployment Committee The Deployment Committee of the Connecticut Green Bank is comprised of four (4) ex officio and appointed voting members. The leadership of the Deployment Committee, includes:
Chair - Reed Hundt, CEO of the Coalition for Green Capital (designated as the Chair by Catherine Smith)
Members - Bettina Bronisz (ex officio per bylaws), Matthew Ranelli, and Pat Wrice / Betsy Crum23 (designated as a member of the Committee by Catherine Smith)
During FY 2017, the Deployment Committee of the Connecticut Green Bank met four (4) times, including four (4) regularly scheduled meetings and no special meetings. There was an attendance
17 Note – the Chair and/or Vice Chair of the Board of Directors of the Connecticut Green Bank can attend the Audit, Compliance, and Governance Committee meeting to establish a quorum.
18 Note ‐ as a result of the resignation of Pat Wrice and given his professional experiences, Tom Flynn was appointed to the ACG Committee. 19 ACG, B&O, Deployment Committee meetings: http://www.ctgreenbank.com/about‐us/governance/connecticut‐grittee‐meetings/ 20 Note – the Chair and/or Vice Chair of the Board of Directors of the Connecticut Green Bank can attend the Audit, Compliance, and Governance Committee meeting to establish a quorum.
21 The last official B&O committee meeting of Mun Choi was January 11, 2017. 22 ACG, B&O, Deployment Committee meetings: http://www.ctgreenbank.com/about‐us/governance/connecticut‐grittee‐meetings/ 23 Betsy Crum was appointed by Catherine Smith to serve on the Deployment Committee to fill the position vacated by Pat Wrice.

CONNECTICUT GREEN BANK 3. ORGANIZATIONAL BACKGROUND
83
rate of 75% by Committee members and 7 approved resolutions. For a link to the materials from the Deployment Committee meetings that are publicly accessible – click here24.
Joint Committee A Joint Committee of the Energy Efficiency Board and the Connecticut Green Bank was established pursuant to Section 16-245m(d)(2) of the Connecticut General Statutes. Per bylaws established and approved by the EEB and the Connecticut Green Bank, the Joint Committee is comprised of four (4) appointed and voting members, one (1) ex officio and voting member, and four (4) ex officio and non-voting members. The leadership of the Joint Committee, includes:
Chair - Eric Brown, Attorney with CBIA (voted in by his peers of the EEB and the Connecticut Green Bank)
Vice Chair - Diane Duva, DEEP (voted in by her peers of the EEB and the Connecticut Green Bank)
Secretary - Bryan Garcia, Connecticut Green Bank, and Craig Diamond, Connecticut Energy Efficiency Fund (voted in by their peers of the EEB and the Connecticut Green Bank)
Members25 - Bryan Garcia (non-voting), Norma Glover, Bert Hunter (non-voting), and John Harrity (designated as members of the Committee by Catherine Smith)
During FY 2017, the Joint Committee of the EEB and the Connecticut Green Bank met four (4) times, including four (4) regularly scheduled meetings and no special meetings. There was an attendance rate of 78% by the Joint Committee members and 0 approved resolutions. For a link to the materials from the Joint Committee meetings that are publicly accessible – click here26.
Ethics and Transparency Statement of Financial Interest
It is required by state ethics laws and a determination of the Governor’s standard that senior-level staff (i.e., Director level and above) and members of the Board of Directors annually file a Statement of Financial Interest (SFI). The Governor’s standard is the following:
“Governor Malloy has established a standard which requires “filing of Annual Statements of Financial Interests by all persons in the Executive Branch and Quasi-Public Agencies who exercise (i) significant policy-making, regulatory or contractual authority; (ii) significant decision-making and/or supervisory responsibility for the review and/or award of State contracts; or (iii) significant decision-making and/or supervisory responsibility over staff that monitor State contracts.”
These statements include information such as names of all associated business, income over $1,000, a list of all real property, and a list of creditors. SFIs that have been filed are available to the public under the Freedom of Information Act. The SFIs serve two purposes. First, the financial disclosure provides a checklist or reminder to the official/employee to be mindful of potential conflicts of interest. Second, the statements serve as a tool to maximize public confidence in governmental decision making.
24 ACG, B&O, Deployment Committee meetings: http://www.ctgreenbank.com/about‐us/governance/connecticut‐grittee‐meetings/ 25 Note – these members are representatives from the Connecticut Green Bank. 26 Joint Committee meeting: http://www.ctgreenbank.com/about‐us/governance/connecticut‐grittee‐meetings/

CONNECTICUT GREEN BANK 3. ORGANIZATIONAL BACKGROUND
84
With respect to the 2017 SFI filing – required by May 1, 2017 – the Connecticut Office of State Ethics received the following from the Connecticut Green Bank – see Table 2.
Table 2. Summary of State of Financial Interest Filings with the Office of State Ethics for FY 2017
Number of SFIs % Submitted Submitted on Time Senior Staff 9 100% Board of Directors 9 100%
The Connecticut Green Bank received a Certificate of Excellence Ethics Compliance from the Connecticut Office of State Ethics. The organization has received this designation in each of its first six years of operation.
Open Connecticut Open Connecticut centralizes state financial information to make it easier to follow state dollars. In Connecticut, quasi-public agencies are required to submit annual reports to the legislature, including a summary of their activities and financial information. In addition, the comptroller’s office requested that quasi-public agencies voluntarily provide checkbook-level vendor payment data for display on Open Connecticut. The Connecticut Green Bank has voluntarily submitted this information since the inception of Open Connecticut. To access this information, click here27.
Small and Minority Business Procurement The State of Connecticut’s Supplier Diversity Program was established to ensure Connecticut small businesses have an opportunity to bid on a portion of the State’s purchases. Through Fiscal Year 2015, the program required agencies and political subdivisions to set aside 25% of their annual budgets for construction, housing rehabilitation, and purchasing goods and services (after approved exemptions by the Department of Administrative Services) to be awarded to certified small businesses, with 25% of this amount to be awarded to certified minority business enterprises. Although reporting is no longer required, the Connecticut Green Bank is performing the analysis to ensure we are still committed to voluntarily meeting our set aside goals.
Table 3. Small Business Procurement Year Goal Actual Percentage2012 $59,775 $39,520 66% 2013 $62,598 $59,340 95% 2014 $135,320 $120,560 89% 2015 $221,750 $251,980 113% 2016 $238,550 $510,797 214% 2017 $ 209,725 $ 379,246 180%
27 Open Connecticut: http://www.osc.ct.gov/openCT/quasi.html

CONNECTICUT GREEN BANK 3. ORGANIZATIONAL BACKGROUND
85
Table 4. Minority Business Enterprise Procurement Year Goal Actual Percentage2012 $14,944 $31,474 211% 2013 $15,649 $52,308 334% 2014 $33,830 $88,427 261% 2015 $55,438 $153,319 277% 2016 $ 9,638 $96,020 161% 2017 $52,431 $ 107,974 205%
Efficiency Since its inception in July of 2011 (FY 2012), the Green Bank has grown in financial resources, real estate, and in human capital. As demonstrated in the following table, while staff has grown by 1.6 and office space has increased by 4 times, the organization’s overall expenses have remained flat. Revenues have remained flat.
Table 5. Human and Financial Resources of the Green Bank FY 2012 vs FY 2017 Human Resources Financial Resources
Fiscal Year FTE
Office Space (ft2)
Total Expenses
General Admin & Program Admin
General Admin
SBC Revenue
RGGI Revenue
2012 29.1 3,626 $32,510,209 $4,532,520 $1,387,854 $27,025,088 $2,052,7482017 46.25 16,122 $39,625,205 $21,497,183 $5,716,875 $26,404,349 $2,392,647
Despite a sixty percent increase in FTEs and comparable expenses between these two fiscal years, the impact of the organization has grown significantly. Private Investment and clean energy deployment have increased over 19-fold as demonstrated in Table 6.
Table 6. Green Bank Impact FY 2012 vs FY 2017 Impact
Fiscal Year
Private Investment
Clean Energy Deployment
(MW)
Expected Annual
Generation (MWh)
Annual Saved
/ Produced (MMBtu)
Job Years Supported
Annual CO2 Savings (tons)
2012 $10,184,827 2.9 3,278 11,183 231 1,833
2017 $197,369,415 55.0 72,305 532,685 1,680 36,975 Multiple 19.4x 19.0x 22.1x 47.6x 7.3x 20.2x
As a quasi-public organization, the Connecticut Green Bank strives to leverage its resources in attracting investment and in deploying clean energy as efficiently as possible. Reviewing the Green Bank’s human capital, real estate, and expenses versus the amount of private investment and clean energy deployed shows a marked increase during the organization’s first 5 years of existence.

CONNECTICUT GREEN BANK 3. ORGANIZATIONAL BACKGROUND
86
Table 7. Green Bank Deployment Efficiency FY 2012 vs FY 2017 Impact Delivered to Human and Financial Resources Used
Fiscal Year
Private Investment /
FTE
Clean Energy
Deployment / FTE
Private Investment /
Total Expenses
Private Investment /
General Admin
Private Investment / Office Space
Clean Energy Deployment / Office Space
($/FTE) (kW/FTE) ($/ft2) (kW/ft2)
2012 $350,596 100 0.31 7.34 $2,809 0.8
2017 $4,267,446 1,189 4.98 34.52 $12,242 3.41
Multiple 12.2x 11.9x 15.9x 4.7x 4.4x 4.3x

CONNECTICUT GREEN BANK 4. MEASURES OF SUCCESS
87
4. Measures of Success The Green Bank develops a comprehensive plan every two years, establishing targets around its Key Performance Indicators: Capital Deployed, Projects Completed, and Clean Energy Generated. In addition to these KPIs, the Green Bank reports its several program-associated societal benefits including jobs created, and environmental impacts, among others.
Table 8. Green Bank Actuals vs Targets by FY Closed28
FY Closed 2012 2013 2014 2015 2016 201729 Total# Closed Projects
Target - - 4,396 4,485 14,252 6,856 29,989 Actual 417 1,119 2,456 6,527 7,606 5,459 23,584 % of Target
56% 146% 53% 80% 79%
Capital DeployedTarget $56,439,000 $291,602,500 $591,131,745 $272,358,518 $1,211,531,763 Actual $14,989,569 $111,175,698 $101,929,030 $312,957,453 $310,569,962 $212,749,474 $1,064,371,186 % of Target 181% 107% 53% 78% 88%
Capacity Installed (MW)Target - - 31.6 55.5 119.5 68.7 275.3 Actual 2.9 23.5 23.4 62.7 68.7 53.2 234.4 % of Target 74% 113% 58% 77% 85%
As the above metrics show, the Green Bank continues to deploy capital to new projects that lead to increased deployment of clean energy. The Green Bank continues to set ambitious targets each year after consulting its biannual Comprehensive Plan, which analyzes markets and directs the programs of the organization.
In addition to these Key Performance Indicators, the Connecticut Green Bank passed some significant milestones in FY 2017. Shortly after the organization’s fifth anniversary, the Green Bank passed its billionth dollar deployed. Both C-PACE and the Residential programs passed milestones marked by $100 million in capital deployed.
Activity The Connecticut Green Bank tracks projects through three phases as they move through the pipeline from application until the implementation is complete – Approved, Closed, and Completed. “Approved” signifies that the appropriate authority within the Connecticut Green Bank, whether President & CEO, Deployment Committee, or Board of Directors, has approved the Connecticut Green Bank’s investment in the project per the Comprehensive Plan and Budget. “Closed” indicates all financial and legal documents have been executed and any additional funding has been secured. “Completion” indicates the project has closed, all construction and installation is complete, and the project is operational. The full energy, economic, and environmental benefits from these projects begin to be fully accounted for and reported after they are closed. Table 9 below presents annual project activity by these three phases.
28 Residential solar projects that receive financing also receive an incentive under the Residential Solar Incentive Program and Multifamily
and Commercial Lease projects may also use C‐PACE so they are counted in each sector's results. These projects have been removed from the total to avoid double counting. 29 Targets for FY 2017 are the adjusted targets approved by the Board in January of 2017.

CONNECTICUT GREEN BANK 4. MEASURES OF SUCCESS
88
Table 9. Green Bank Project Activity by FY Closed30 2012 2013 2014 2015 2016 2017 Total
Approved 417 1,133 2,476 6,486 7,750 5,672 23,934
Closed 417 1,119 2,456 6,527 7,606 5,459 23,584
Completed 152 916 1,282 3,611 7,543 6,251 19,755
Number of projects does not capture the extent of the organization’s activities in a year as different projects have different sizes. Further demonstration of the organization’s reach can be seen in the number of multi-family units impacted by closed projects each year.
Table 10. Green Bank Number of Multifamily Housing Units Impacted by FY Closed Affordable Market Rate Total 2014 120 120 2015 285 82 367 2016 1,578 191 1,769 2017 1,244 100 1,344 Total 3,227 373 3,600
Capital Deployed Clean Energy Investment The Connecticut Green Bank’s intent, stated in the Comprehensive Plan is to use public funds to attract multiples of private investment into Connecticut’s green energy economy, both to decrease the reliance on public funds over time, as well as expand the scale of clean energy investments in the state. Several of the tables below, including Tables 11-13 show activity to date on this subject.
Table 11. Green Bank Clean Energy Investment by Source - Public and Private by FY Closed31
2012 2013 2014 2015 2016 2017 Total
Green Bank $4,804,743 $18,705,488 $32,559,362 $57,048,511 $36,954,135 $24,496,404 $174,568,643
Private $10,184,827 $92,783,682 $74,921,011 $267,898,099 $278,148,207 $190,843,805 $914,779,630
Total $14,989,569 $111,489,169 $107,480,373 $324,946,609 $315,102,342 $215,340,209 $1,089,348,272
The table below shows the average total investment of public and private funds per project, by fiscal year and in total. In reviewing the results from year to year it is important to note that the mix, size, and financial requirements of projects differ from year to year across the program portfolio offered by the Green Bank.
30 Residential solar projects that receive financing also receive an incentive under the Residential Solar Incentive Program and Multifamily and Commercial Lease projects may also use C‐PACE so they are counted in each sector's results. These projects have been removed from the total to avoid double counting. 31 Residential solar projects that receive financing also receive an incentive under the Residential Solar Incentive Program and Multifamily and Commercial Lease projects may also use C‐PACE so they are counted in each sector's results. These projects have been removed from the total to avoid double counting.

CONNECTICUT GREEN BANK 4. MEASURES OF SUCCESS
89
Table 12. Green Bank Clean Energy Projects - Average Public and Private Investments by FY Closed32
2012 2013 2014 2015 2016 2017 Total$35,946.21 $99,632.86 $43,762.37 $49,784.99 $41,428.13 $39,446.82 $46,190.14
Leverage Ratio The Table below shows in ratio form the extent to which public monies are driving private investment into the Green Bank’s programs. This leverage ratio, as it is commonly referred to, is calculated by dividing the total monies available in each period – here the Green Bank’s fiscal year periods – by the amount of private investment. The table presents these ratios by fiscal year and by the Green Bank’s program categories. The leverage ratios for the Connecticut Green Bank are increasing over time. In addition, as shown in Table 13, a greater percentage of the public funds being used are in the form of loans and leases rather than subsidies and grants, which results in repayments of the funds over time.
Table 13. Green Bank Sector Leverage Ratios by FY Closed Sector 2012 2013 2014 2015 2016 2017 Total
Commercial 0.0 3.8 2.2 2.8 4.7 7.2 3.8
Infrastructure 3.1 3.2 3.9 6.5 11.1 10.6 6.9
Residential 0.0 0.8 8.3 4.3 5.3 6.8 5.4
Strategic 0.0 12.2 0.0 17.5 0.0 1.2 10.2
Total 3.1 5.9 3.2 5.5 8.4 8.7 6.1
Clean Energy Produced and Energy Saved The data below present the output of the projects supported by the Green Bank: electric capacity (megawatts [MW]), electricity production (megawatt hours [MWh]), and Energy Saved or Produced (MMBtu) – see Table 14.
Table 14. Green Bank Installed Capacity, Estimated Generation and Energy Saved and/or Produced by FY Closed33
FY Closed 2012 2013 2014 2015 2016 2017 Total Installed Capacity (MW)
MW 2.9 23.5 23.4 62.7 68.7 53.2 234.4 Estimated Generation (MWh)
Annual 3,278 131,581 51,668 210,440 92,840 72,305 562,111 Lifetime 81,939 1,480,009 993,496 1,898,881 2,137,867 1,669,855 8,262,048 Lifetime Clean Energy Produced (kWh) / Investment at Risk ($) 17.1 79.1 30.5 33.3 57.9 68.2 47.3
32 Residential solar projects that receive financing also receive an incentive under the Residential Solar Incentive Program and Multifamily and Commercial Lease projects may also use C‐PACE so they are counted in each sector's results. These projects have been removed from the total to avoid double counting. 33 Residential solar projects that receive financing also receive an incentive under the Residential Solar Incentive Program and Multifamily and Commercial Lease projects may also use C‐PACE so they are counted in each sector's results. These projects have been removed from the total to avoid double counting.

CONNECTICUT GREEN BANK 4. MEASURES OF SUCCESS
90
FY Closed 2012 2013 2014 2015 2016 2017 Total Energy Saved or Produced (MMBtu)
Annual 11,183 463,328 246,195 709,965 346,135 532,685 2,309,491 Lifetime 279,577 5,268,112 4,519,573 6,303,485 7,817,648 10,016,405 34,204,801 Investment at Risk ($) / Lifetime Combined Energy Generated & Saved (MMBtu) 17.2 3.6 7.2 9.1 4.7 2.4 5.1
Clean Energy Technology Deployment The Connecticut Green Bank takes a technology-agnostic approach to its financing products, with any commercially available technology that meets eligibility guidelines. The tables below present the number of projects by technology and project type by FY closed.
Clean energy means solar photovoltaic energy, solar thermal, geothermal energy, wind, ocean thermal energy, wave or tidal energy, fuel cells, landfill gas, hydropower that meets the low-impact standards of the Low-Impact Hydropower Institute, hydrogen production and hydrogen conversion technologies, low emission advanced biomass conversion technologies, alternative fuels, used for electricity generation including ethanol, biodiesel or other fuel produced in Connecticut and derived from agricultural produce, food waste or waste vegetable oil, provided the Commissioner of Energy and Environmental Protection determines that such fuels provide net reductions in greenhouse gas emissions and fossil fuel consumption, usable electricity from combined heat and power systems with waste heat recovery systems, thermal storage systems, other energy resources and emerging technologies which have significant potential for commercialization and which do not involve the combustion of coal, petroleum or petroleum products, municipal solid waste or nuclear fission, financing of energy efficiency projects, projects that seek to deploy electric, electric hybrid, natural gas or alternative fuel vehicles and associated infrastructure, any related storage, distribution, manufacturing technologies or facilities and any Class I renewable energy source, as defined in section 16-1.34
34 Connecticut Public Act 11‐80

CONNECTICUT GREEN BANK 4. MEASURES OF SUCCESS
91
Table 15. Green Bank Projects by Technology35 by FY Closed36 37 2012 2013 2014 2015 2016 2017 Total
# of Projects AD 0 0 0 0 1 0 1 CHP 0 2 1 4 0 0 7 CHP/Microgrid 0 0 0 0 0 1 1 EE 0 4 99 132 114 346 695 Fuel Cell 0 1 0 0 0 0 1 Geothermal 0 0 2 1 8 6 17 Hydro 0 0 0 1 0 1 2 PV 417 1,111 2,347 6,372 7,466 5,057 22,770 PV/Biomass 0 0 0 1 0 0 1 Waste Heat Recovery 0 0 0 1 0 0 1 Wind 0 0 0 1 0 0 1 Unknown 0 1 7 14 17 48 87 Total 417 1,119 2,456 6,527 7,606 5,459 23,584
MW AD 0.0 0.0 0.0 0.0 1.0 0.0 1.0 CHP 0.0 0.7 3.0 0.3 0.0 0.0 4.0 CHP/Microgrid 0.0 0.0 0.0 0.0 0.0 0.8 0.8 EE 0.0 0.0 0.0 0.0 0.0 0.0 0.0 Fuel Cell 0.0 14.8 0.0 0.0 0.0 0.0 14.8 Geothermal 0.0 0.0 0.0 0.0 0.0 0.0 0.0 Hydro 0.0 0.0 0.0 0.9 0.0 0.2 1.1 PV 2.9 8.0 20.4 55.9 67.7 52.2 207.1 PV/Biomass 0.0 0.0 0.0 0.6 0.0 0.0 0.6 Waste Heat Recovery 0.0 0.0 0.0 0.0 0.0 0.0 0.0 Wind 0.0 0.0 0.0 5.0 0.0 0.0 5.0 Unknown 0.0 0.0 0.0 0.0 0.0 0.0 0.0 Total 2.9 23.5 23.4 62.7 68.7 53.2 234.4
Expected Lifetime Savings or Generation (MWh) AD 0 0 0 0 106,171 0 106,171 CHP 0 81,008 354,780 31,930 0 0 467,718 CHP/Microgrid 0 0 0 0 0 94,017 94,017 EE 0 4,846 56,929 43,128 103,710 69,315 277,928 Fuel Cell 0 1,166,832 0 0 0 0 1,166,832Geothermal 0 0 84 38 295 329 746 Hydro 0 0 0 96,185 0 20,626 116,811 PV 81,939 227,323 581,702 1,592,258 1,927,692 1,485,568 5,896,482PV/Biomass 0 0 0 17,082 0 0 17,082 Waste Heat Recovery38 0 0 0 0 0 0 0 Wind 0 0 0 118,260 0 0 118,260 Unknown 0 0 0 0 0 0 0 Total 81,939 1,480,009 993,496 1,898,881 2,137,867 1,669,855 8,262,048
35 Commercial and Residential projects can be a combination of RE and EE measures and the data presented includes the EE generation for those projects but it is assigned to the applicable RE technology. 36 Residential solar projects that receive financing also receive an incentive under the Residential Solar Incentive Program and Multifamily and Commercial Lease projects may also use C‐PACE so they are counted in each sector's results. These projects have been removed from the total to avoid double counting. 37 1,202 of the clean energy projects in this table were accompanied with energy efficiency measures. 38 The expected annual generation for the Bridgeport Heating Loop project is 12,611 MWh. Lifetime generation is not available.

CONNECTICUT GREEN BANK 4. MEASURES OF SUCCESS
92
Table 16. Green Bank Project Types by FY Closed39 2012 2013 2014 2015 2016 2017 Total
# of Projects EE 0 4 99 132 114 346 695 RE 417 1,113 2,341 6,299 7,075 4,358 21,603 RE/EE 0 1 9 81 403 708 1,202 Other 0 0 0 1 0 0 1 Unknown 0 1 7 14 14 47 83 Total 417 1,119 2,456 6,527 7,606 5,459 23,584
MW EE 0.0 0.0 0.0 0.0 0.0 0.0 0.0 RE 2.9 23.4 22.8 60.9 65.5 48.4 223.7 RE/EE 0.0 0.1 0.6 1.8 3.3 4.8 10.6 Other 0.0 0.0 0.0 0.0 0.0 0.0 0.0 Unknown 0.0 0.0 0.0 0.0 0.0 0.0 0.0 Total 2.9 23.5 23.4 62.7 68.7 53.2 234.4
Expected Lifetime Savings or Generation (MWh) EE 0 4,846 56,929 43,128 103,710 69,315 277,928 RE 81,939 1,472,287 918,792 1,791,297 1,941,338 1,463,309 7,668,962 RE/EE 0 2,875 17,774 64,456 92,820 137,231 315,158 Other 0 0 0 0 0 0 0 Unknown 0 0 0 0 0 0 0 Total 81,939 1,480,009 993,496 1,898,881 2,137,867 1,669,855 8,262,048
The Connecticut Green Bank’s efforts have led to a proportionately large amount of solar PV deployment in the state; about 97% of all clean energy projects deployed are from solar PV. When comparing deployment to clean energy production, solar PV produces the most energy (71% of all clean energy production), fuel cells also contribute a large proportion given the efficiency of the technology (14% of all clean energy production), both providing highly reliable baseload power.
39 Residential solar projects that receive financing also receive an incentive under the Residential Solar Incentive Program and Multifamily and Commercial Lease projects may also use C‐PACE so they are counted in each sector's results. These projects have been removed from the total to avoid double counting.

CONNECTICUT GREEN BANK 4. MEASURES OF SUCCESS
93
The Green Bank Model Assets – Current and Non-Current The Connecticut Green Bank’s successful shift to a financing model from one formerly driven by grants and subsidies is evidenced by a net positive change in assets since its inception. The growth of the Green Bank’s financing programs has led to a steady increase in non-current assets over time as more and more loans and leases are closed.
Table 17. Current and Non-Current Assets
Ratio of Public Funds Invested As the first Green Bank in the country, the Connecticut Green Bank seeks to use limited public resources to attract private capital investment in clean energy. The Connecticut Green Bank does this by moving away from the subsidy-based model of supporting clean energy and towards a financing model. As highlighted below – see Figures 1 and 2, the Connecticut Green Bank has quickly moved towards this model, with fewer and fewer funds devoted to subsidies. This trend has developed even as total investment in clean energy has increased to over $1 billion in total from 2012 through 2017, enabling the Connecticut Green Bank to do more at a faster pace while managing ratepayer resources more efficiently.
Year Ended June 30,2017 2016 2015 2014 2013 2012
Current AssetsCash and cash equivalents 37,151,067$ 48,072,061$ 39,893,649$ 71,411,034$ 68,105,014$ 64,672,910$ Receivables 3,682,469 4,531,258 2,867,233 8,253,318 4,545,661 3,305,301 Prepaid expenses and other assets 10,012,024 4,245,806 1,030,251 619,639 520,814 350,302 Contractor loans -- 2,272,906 3,112,663 -- -- -- Current portion of solar lease notes 869,831 845,479 803,573 766,086 704,032 670,645 Current portion of program loans 1,910,048 1,378,242 10,264,825 652,447 -- --
Total Current Assets 53,625,439 61,345,752 57,972,194 81,702,524 73,875,521 68,999,158
Noncurrent AssetsPortfolio investments 1 1,000,000 1,000,000 1,000,000 1,000,000 2,155,525 Bonds receivable 3,328,530 3,492,282 1,600,000 1,600,000 -- -- Solar lease notes - less current portion 7,242,822 8,162,635 9,015,437 9,778,315 10,536,136 11,064,879 Program loans - less current portion 40,296,113 31,889,275 30,253,119 12,750,457 3,788,094 -- Renewable energy certificates 654,767 812,770 933,054 1,069,390 1,217,491 1,324,614 Capital assets, net of depreciation and amortization 62,578,217 58,114,914 26,971,087 3,074,337 362,505 91,329 Asset retirement obligation, net 2,535,104 2,261,472 1,029,196 -- -- -- Restricted assets:
Cash and cash equivalents 22,060,622 9,749,983 8,799,005 9,513,715 9,536,656 8,540,684
Total noncurrent assets 138,696,176 115,483,331 79,600,898 38,786,214 26,440,882 23,177,031
Total Assets 192,321,615$ 176,829,083$ 137,573,092$ 120,488,738$ 100,316,403$ 92,176,189$

CONNECTICUT GREEN BANK 4. MEASURES OF SUCCESS
94
Figure 1. Green Bank KPI Capital Deployment Chart by FY Closed
Figure 2. Green Bank Cumulative Green Bank Funds Invested by Type by FY Closed
$0
$20,000,000
$40,000,000
$60,000,000
$80,000,000
$100,000,000
$120,000,000
2012 2013 2014 2015 2016 2017
Cumulative Green Bank Funds Invested By Year
Subsidies Credit Enhancements Loans/Leases

CONNECTICUT GREEN BANK 4. MEASURES OF SUCCESS
95
Table 18. Green Bank Ratio of Capital Invested as Subsidies, Credit Enhancements, and Loans and Leases by FY Closed40
CGB Funds Invested 2012 2013 2014 201541 2016 2017 Total Subsidies (Grants & Incentives) $4,804,743 $12,508,064 $21,236,693 $33,525,414 $19,856,255 $13,867,584 $105,798,753 % Subsidies 100% 67% 65% 59% 54% 57% 61% Credit Enhancements (LLR & IRB) $0 $187,122 $630,610 $2,275,871 $1,911,448 $894,296 $5,899,346 % Credit Enhancements 0% 1% 2% 4% 5% 4% 3% Loans and Leases (includes sell downs) $0 $6,010,302 $10,692,059 $21,247,225 $15,186,433 $9,734,524 $62,870,543 % Loans and Leases 0% 32% 33% 37% 41% 40% 36% Total $4,804,743 $18,705,488 $32,559,362 $57,048,511 $36,954,135 $24,496,404 $174,568,643
Societal Benefits Societal Benefits and the Evaluation Framework One of the Connecticut Green Bank’s evaluation activities is intended to understand how the increase in investment and deployment of clean energy supported by the Green Bank results in benefits to society. Working with internal and external subject matter experts, the Connecticut Green Bank has established an evaluation framework to guide the assessment, monitoring and reporting of the program impacts and processes, including, but not limited to energy savings and clean energy production and the resulting societal impacts or benefits arising from clean energy investment. The evaluation framework can be found here42.
Societal Benefits: Jobs The Connecticut Green Bank stimulates economic activity in the state through the lending and investing conducted by its programs. This economic activity can be measured by job creation. The Green Bank, in conjunction with the Connecticut Department of Economic and Community Development commissioned a study by Navigant Consulting in 2010 on to quantify those jobs. This study was updated in 2016 and is the basis for how the Green Bank measures its impact on job creation. For more information on this study and the methodology, click here43. An overview of our Jobs methodology can be found here44.
40 Residential solar projects that receive financing also receive an incentive under the Residential Solar Incentive Program and Multifamily and Commercial Lease projects may also use C‐PACE so they are counted in each sector's results. These projects have been removed from the total to avoid double counting. 41 As of January 1, 2015, all RSIP subsidies are redeployed over time through the SHREC cost recovery. 42 CGB Evaluation Framework: http://ctgreenbank.com/wp‐content/uploads/2017/02/CTGreenBank‐Evaluation‐Framework‐July‐2016.pdf 43 Clean Energy Jobs in Connecticut: http://ctgreenbank.com/wp‐content/uploads/2017/02/CTGReenBank‐Clean‐Energy‐Jobs‐CT‐August102016.pdf 44 CGB Economic Development Factsheet: http://www.ctgreenbank.com/wp‐content/uploads/2017/08/CGB_DECD_Jobs‐Study_Fact‐Sheet.pdf

CONNECTICUT GREEN BANK 4. MEASURES OF SUCCESS
96
Table 19. Green Bank Job Years Supported by FY Closed45
2012 2013 2014 2015 2016 2017 Total Direct 88 580 594 1,465 1,654 722 5,104 Indirect and Induced 142 1,165 954 2,357 2,660 957 8,236 Total 231 1,745 1,548 3,822 4,314 1,680 13,340
Green Bank Societal Benefits: Environmental Impacts and Equivalencies The Green Bank assesses the impact of its projects in terms of the local environmental benefits these projects produce. These benefits are primarily in the form of cleaner air in the state and are measured in terms of tons of Carbon Dioxide (CO2) and pounds of Nitrous Oxide (NOx), Sulfur Dioxide (SOx) and particulate matter (PM 2.5) not emitted. The Green Bank has developed its methodology for these measurements in conjunction with outside experts at the Connecticut Department of Energy and Environmental Protection and at the United States Environmental Protection Agency. For more information on this methodology, click here46. For more information on the EPA’s AvERT, click here47.
Table 20. Green Bank Avoided Emissions by FY Closed48 2012 2013 2014 2015 2016 2017 Total
CO2 Savings (tons)Annual 1,833 13,266 15,662 44,952 48,376 36,975 161,064 Lifetime 45,820 210,616 357,139 1,055,021 1,145,841 883,582 3,698,018 Investment at Risk ($) / Lifetime Tons of CO2 Emissions (TCO2) $104.86 $88.81 $91.17 $54.07 $32.25 $27.72 $47.21
NOx Savings (pounds)Annual 2,307 70,810 20,876 50,524 51,079 37,325 232,921 Lifetime 57,671 821,238 479,656 1,199,483 1,207,003 897,064 4,662,115 Investment at Risk ($) / Lifetime Pounds of NOX Emissions $83.31 $22.78 $67.88 $47.56 $30.62 $27.31 $37.44
SOx Savings (pounds)Annual 3,016 55,584 23,792 47,634 40,133 26,695 196,854 Lifetime 75,409 700,425 547,634 1,134,204 934,111 641,857 4,033,641 Investment at Risk ($) / Lifetime Pounds of SOX Emissions $63.72 $26.71 $59.45 $50.30 $39.56 $38.16 $43.28
PM 2.5 (pounds)Annual 164 475 1,380 3,688 4,203 3,182 13,092 Lifetime 4,112 11,627 31,731 87,015 100,056 76,326 310,867 Investment at Risk ($) / Lifetime Pounds of PM 2.5 Emissions $1,168.47 $1,608.81 $1,026.11 $655.62 $369.33 $320.94 $561.55
Using the organization’s methodology for environmental impact, the Green Bank calculates environmental equivalencies using factors from the EPA’s environmental equivalency calculator. The lifetime numbers are based on the aggregation of projects’ impact for one year multiplied by the useful
45 See Appendix for Job Year Factors. 46 CGB Environmental Impact Factsheet: http://www.ctgreenbank.com/wp‐content/uploads/2017/05/CGB‐Environmental‐Impact‐051617.pdf 47 Environmental Protection Agency AvERT User Manual: http://www.ctgreenbank.com/wp‐content/uploads/2017/05/AVERT_fact_sheet_user_manual_03‐01‐17.pdf 48 See Appendix for Average Emission Rates.

CONNECTICUT GREEN BANK 4. MEASURES OF SUCCESS
97
life of the technology for each project. For more information on this methodology, click here49. The EPA environmental equivalency calculator can be found here50.
Table 21. Green Bank Greenhouse Gas Equivalencies (based on reductions of CO2 tons) by FY Closed
2012 2013 2014 2015 2016 2017 Total
Greenhouse gas emissions from:Passenger
vehicles driven for one year
Annual 351 2,542 3,001 8,614 9,270 7,085 30,864
Lifetime 8,780 40,360 68,438 202,172 219,575 169,319 708,644 Miles driven by
an average passenger
vehicle
Annual 3,984,866 28,843,642 34,052,135 97,736,084 105,178,625 80,390,801 350,186,153
Lifetime 99,621,647 457,923,254 776,495,651 2,293,835,856 2,491,297,120 1,921,091,832 8,040,265,359 CO2 emissions from:
Gallons of gasoline
consumed
Annual 187,091 1,354,220 1,598,761 4,588,747 4,938,177 3,774,379 16,441,376
Lifetime 4,677,275 21,499,675 36,456,772 107,696,484 116,967,367 90,196,008 377,493,581
Homes' energy use for one year
Annual 176 1,271 1,500 4,306 4,634 3,542 15,429 Lifetime 4,389 20,176 34,213 101,067 109,767 84,644 354,255
Carbon sequestered by:Tree seedlings grown for 10
years
Annual 43,090 311,900 368,221 1,056,865 1,137,345 869,303 3,786,725
Lifetime 1,077,255 4,951,736 8,396,606 24,804,306 26,939,546 20,773,653 86,943,101 Acres of U.S. forests in one
year
Annual 1,574 11,392 13,450 38,603 41,542 31,752 138,313
Lifetime 39,347 180,865 306,692 905,994 983,985 758,771 3,175,655
Other Societal Benefits The Green Bank is presently working on methodologies to further measure additional societal impacts of its programs. During Fiscal Year 2018, the organization will finalize methodologies for measuring and quantifying public health benefits associated with improved air quality and on the refined measurement of energy generated by the organization’s projects. The Green Bank is reviewing the economic relief from the energy burden felt by participating property owners and tenants.
Community Impacts Community and Market Descriptions Communities across Connecticut are demonstrating leadership in their support of clean energy. The Connecticut Green Bank distributes reports to communities on an annual basis to provide them with a breakdown of their performance. There are many leaders of clean energy deployment across the state, and we have assembled the “Top 5” in energy, environment, and economy for both FY 2017 as well as FY 2012 through FY 2017.
49 http://www.epa.gov/energy/greenhouse‐gases‐equivalencies‐calculator‐calculations‐and‐references 50 EPA Greenhouse Gas Equivalencies Calculator: http://www.epa.gov/energy/greenhouse‐gas‐equivalencies‐calculator

CONNECTICUT GREEN BANK 4. MEASURES OF SUCCESS
98
Table 22. The “Top 5” Energy, Environment, and Economy Metrics based on FY 2017 Closed Activity
Municipality Watts / Capita Municipality
Investment / Capita Municipality
Total Lifetime CO2 Emissions
(Tons) Thompson 263.4 Thompson $855.98 Manchester 50,182
Canaan 168.7 Canaan $683.46 Thompson 39,874 Lebanon 68.3 Manchester $230.22 Stratford 32,703 Chester 64.1 Chester $225.53 New Britain 32,302
Bloomfield 59.6 Lebanon $219.71 Bridgeport 30,430
Table 23. The “Top 5” Energy, Environment, and Economy Metrics based on FY 2012 – 2017 Closed Activity
Municipality Watts / Capita Municipality
Investment / Capita Municipality
Total Lifetime CO2 Emissions
(Tons) Colebrook 3,426.9 Colebrook $15,426.21 Bridgeport 184,215 Canaan 348.5 Deep River $1,556.41 Manchester 93,039
Thompson 347.0 Canaan $1,536.75 Hartford 84,295 Woodbridge 221.2 Thompson $1,179.52 Waterbury 73,246
Durham 220.3 Bridgeport $1,014.02 New Britain 70,181
Projects by Income Bands In addition to looking at funding and clean energy deployment in distressed municipalities, the Green Bank works to ensure that low to moderate income (LMI) census tracts across the entire state are benefiting from its programs. The Green Bank defines low to moderate income as 100% or less of the Area Median Income (AMI) of a Metropolitan Statistical Area (MSA). Table 26 groups the Green Bank’s residential projects based upon the average area median income (AMI) of their census tract from the American Community Survey (ACS) 5 Year Estimate data. Table 27 groups the Green Bank‘s residential projects based upon the average state median income (SMI) of their census tract from the American Community Survey (ACS) 5 Year Estimate data.

CONNECTICUT GREEN BANK 4. MEASURES OF SUCCESS
99
Table 24. Overview of Population and Households in 2015 American Community Survey (ACS) Metropolitan Statistical Area (MSA) Area Median Income (AMI) Bands51
MSA AMI Band
Total Population
% Total Population Distribution
Total Households
% Total Household Distribution
Total Owner
Occupied 1-4 Unit
Households
% Owner Occupied 1-4 Unit
Household Distribution
Total Owner/Rental Occupied 5+
Unit Households
% Owner/Rental Occupied 5+
Unit Household Distribution
Total Rental
Occupied 1 - 4
Housing Units
% Rental Occupied 1 - 4 Housing
Unit Distribution
<60% 662,619 18% 240,062 18% 64,361 7% 84,158 37% 91,543 35% 60%-80% 489,826 14% 193,188 14% 96,305 11% 44,668 19% 52,215 20% 80%-100% 650,163 18% 264,609 20% 164,873 19% 53,494 23% 46,242 18% 100%-120% 631,741 18% 240,485 18% 184,613 21% 24,388 11% 31,484 12% >120% 1,150,974 32% 414,212 31% 352,621 41% 23,491 10% 38,100 15% Total 3,585,323 100% 1,352,556 100% 862,773 100% 230,199 100% 259,584 100%
Table 25. Overview of Population and Households in 2015 American Community Survey (ACS) Metropolitan Statistical Area (MSA) State Median Income (SMI) Bands52
MSA SMI Band
Total Population
% Total Population Distribution
Total Households
% Total Household Distribution
Total Owner
Occupied 1-4 Unit
Households
% Owner Occupied 1-4 Unit
Household Distribution
Total Owner/Rental Occupied 5+
Unit Households
% Owner/Rental Occupied 5+
Unit Household Distribution
Total Rental
Occupied 1 - 4
Housing Units
% Rental Occupied 1 - 4 Housing
Unit Distribution
<60% 643,447 18% 236,756 18% 65,471 8% 81,295 35% 89,990 35% 60%-80% 601,556 17% 235,289 17% 119,341 14% 53,768 23% 62,180 24% 80%-100% 648,379 18% 262,503 19% 169,692 20% 49,076 21% 43,735 17% 100%-120% 636,897 18% 247,545 18% 189,955 22% 25,811 11% 31,779 12% >120% 1,055,044 29% 370,463 27% 318,314 37% 20,249 9% 31,900 12% Total 3,585,323 100% 1,352,556 100% 862,773 100% 230,199 100% 259,584 100%
51 The suite of products offered by the Connecticut Green Bank do not currently address rental properties of 1‐4 units. 52 The suite of products offered by the Connecticut Green Bank do not currently address rental properties of 1‐4 units.

CONNECTICUT GREEN BANK 4. MEASURES OF SUCCESS
100
Table 26. Green Bank Residential53 Activity in Metropolitan Statistical Area (MSA) Area Median Income (AMI) Bands by FY Closed54 55
Fiscal Year Closed
MSA AMI Band
# of Project Units
% Project Distribution
Investment (Gross System Cost)
% Investment Distribution
Installed Capacity
(MW) % MW
Distribution Total
Households
% Total Household Distribution
Project Units / 1,000
Total Households
Investment / Total
Household
Watts / Total
Household
2012 <60% 10 2% 279,743 2% 0.1 2% 228,062 17% 0.0 $1.23 0.2
2012 60%-80% 10 2% 242,605 2% 0.1 2% 207,439 15% 0.0 $1.17 0.3
2012 80%-100% 48 12% 1,644,387 11% 0.3 12% 239,356 18% 0.2 $6.87 1.4
2012 100%-120% 118 28% 4,193,070 28% 0.8 28% 280,563 21% 0.4 $14.95 2.9
2012 >120% 231 55% 8,629,764 58% 1.6 57% 404,748 30% 0.6 $21.32 4.0
2012 Total 417 100% 14,989,569 100% 2.9 100% 1,360,168 100% 0.3 $11.02 2.1
2013 <60% 20 2% 415,069 1% 0.1 1% 224,259 17% 0.1 $1.85 0.4
2013 60%-80% 56 5% 1,683,198 5% 0.4 5% 222,791 16% 0.3 $7.56 1.7
2013 80%-100% 128 12% 3,896,496 11% 0.8 10% 236,905 17% 0.5 $16.45 3.5
2013 100%-120% 221 20% 6,752,086 19% 1.5 19% 264,685 20% 0.8 $25.51 5.5
2013 >120% 687 62% 22,717,370 64% 5.1 65% 407,204 30% 1.7 $55.79 12.6
2013 Total 1,112 100% 35,464,219 100% 7.9 100% 1,355,844 100% 0.8 $26.16 5.8
2014 <60% 85 3% 1,951,582 3% 0.4 3% 224,369 17% 0.4 $8.70 1.9
2014 60%-80% 162 6% 4,231,799 6% 0.9 5% 216,437 16% 0.7 $19.55 4.2
2014 80%-100% 522 20% 11,892,770 16% 2.5 15% 231,014 17% 2.3 $51.48 11.0
2014 100%-120% 613 24% 19,319,129 26% 4.3 26% 278,174 21% 2.2 $69.45 15.6
2014 >120% 1,166 46% 36,828,938 50% 8.5 51% 406,185 30% 2.9 $90.67 21.0
2014 Total 2,548 100% 74,224,218 100% 16.7 100% 1,356,179 100% 1.9 $54.73 12.3
2015 <60% 275 4% 6,896,152 3% 1.5 3% 240,062 18% 1.1 $28.73 6.4
2015 60%-80% 617 9% 17,854,340 8% 4.0 8% 193,188 14% 3.2 $92.42 20.5
2015 80%-100% 1,243 19% 38,391,291 18% 7.9 17% 264,609 20% 4.7 $145.09 29.9
2015 100%-120% 1,644 24% 56,688,974 26% 12.3 26% 240,485 18% 6.8 $235.73 51.2
2015 >120% 2,937 44% 98,586,296 45% 22.3 46% 414,212 31% 7.1 $238.01 53.8
2015 Total 6,716 100% 218,417,053 100% 48.0 100% 1,352,556 100% 5.0 $161.48 35.5
53 Residential Owner occupied properties of 1‐4 units and multifamily housing greater than 4 units. 54 Residential solar projects that receive financing also receive an incentive under the Residential Solar Incentive Program and Multifamily and Commercial Lease projects may also use C‐PACE so they are counted in each sector's results. These projects have been removed from the total to avoid double counting. 55 Excludes projects in unknown bands.

CONNECTICUT GREEN BANK 4. MEASURES OF SUCCESS
101
Fiscal Year Closed
MSA AMI Band
# of Project Units
% Project Distribution
Investment (Gross System Cost)
% Investment Distribution
Installed Capacity
(MW) % MW
Distribution Total
Households
% Total Household Distribution
Project Units / 1,000
Total Households
Investment / Total
Household
Watts / Total
Household
2016 <60% 919 11% 19,052,183 7% 4.2 7% 240,062 18% 3.8 $79.36 17.4
2016 60%-80% 1,066 13% 26,554,108 10% 6.4 11% 193,188 14% 5.5 $137.45 33.0
2016 80%-100% 1,739 21% 52,380,872 21% 11.3 19% 264,609 20% 6.6 $197.96 42.6
2016 100%-120% 2,007 24% 62,089,139 24% 14.0 24% 240,485 18% 8.3 $258.18 58.1
2016 >120% 2,672 32% 94,495,537 37% 22.5 39% 414,212 31% 6.5 $228.13 54.2
2016 Total 8,403 100% 254,571,838 100% 58.2 100% 1,352,556 100% 6.2 $188.22 43.1
2017 <60% 1,268 19% 29,930,106 19% 4.8 12% 240,062 18% 5.3 $124.68 20.1
2017 60%-80% 1,132 17% 23,069,670 14% 5.6 14% 193,188 14% 5.9 $119.42 29.0
2017 80%-100% 1,154 18% 27,521,142 17% 7.5 19% 264,609 20% 4.4 $104.01 28.4
2017 100%-120% 1,258 19% 29,568,212 19% 8.0 20% 240,485 18% 5.2 $122.95 33.2
2017 >120% 1,743 27% 49,516,185 31% 13.5 34% 414,212 31% 4.2 $119.54 32.6
2017 Total 6,555 100% 159,605,315 100% 39.5 100% 1,352,556 100% 4.8 $118.00 29.2
Total <60% 2,577 10% 58,524,835 8% 11.1 6% 240,062 18% 10.7 $243.79 46.3
Total 60%-80% 3,043 12% 73,635,719 10% 17.2 10% 193,188 14% 15.8 $381.16 89.3
Total 80%-100% 4,834 19% 135,726,958 18% 30.4 18% 264,609 20% 18.3 $512.93 115.0
Total 100%-120% 5,861 23% 178,610,610 24% 40.9 24% 240,485 18% 24.4 $742.71 169.9
Total >120% 9,436 37% 310,774,090 41% 73.6 42% 414,212 31% 22.8 $750.28 177.6
Total Total 25,751 100% 757,272,212 100% 173.2 100% 1,352,556 100% 19.0 $559.88 128.1

CONNECTICUT GREEN BANK 4. MEASURES OF SUCCESS
102
Table 27. Green Bank Residential56 Activity in Metropolitan Statistical Area (MSA) State Median Income (SMI) Bands by FY Closed57 58
Fiscal Year Closed
MSA SMI Band
# of Project Units
% Project Distribution
Investment (Gross System Cost)
% Investment Distribution
Installed Capacity
(MW) % MW
Distribution Total
Households
% Total Household Distribution
Project Units / 1,000
Total Households
Investment / Total
Household
Watts / Total
Household 2012 <60% 12 3% 247,910 2% 0.1 2% 249,608 18% 0.0 $0.99 0.2 2012 60%-80% 8 2% 212,810 1% 0.1 2% 204,836 15% 0.0 $1.04 0.3 2012 80%-100% 93 22% 3,213,897 21% 0.6 21% 293,878 22% 0.3 $10.94 2.1 2012 100%-120% 122 29% 4,373,772 29% 0.8 29% 260,689 19% 0.5 $16.78 3.2 2012 >120% 182 44% 6,941,180 46% 1.3 46% 351,157 26% 0.5 $19.77 3.8 2012 Total 417 100% 14,989,569 100% 2.9 100% 1,360,168 100% 0.3 $11.02 2.1 2013 <60% 30 3% 777,069 2% 0.2 2% 251,171 19% 0.1 $3.09 0.7 2013 60%-80% 51 5% 1,459,921 4% 0.3 4% 211,049 16% 0.2 $6.92 1.5 2013 80%-100% 194 17% 5,936,366 17% 1.3 16% 295,748 22% 0.7 $20.07 4.3 2013 100%-120% 227 20% 7,354,103 21% 1.5 19% 247,329 18% 0.9 $29.73 6.1 2013 >120% 610 55% 19,936,760 56% 4.6 59% 350,547 26% 1.7 $56.87 13.2 2013 Total 1,112 100% 35,464,219 100% 7.9 100% 1,355,844 100% 0.8 $26.16 5.8 2014 <60% 119 5% 2,800,024 4% 0.6 4% 264,100 19% 0.5 $10.60 2.2 2014 60%-80% 164 6% 4,459,868 6% 1.0 6% 189,153 14% 0.9 $23.58 5.0 2014 80%-100% 708 28% 18,092,192 24% 3.9 24% 288,116 21% 2.5 $62.79 13.7 2014 100%-120% 601 24% 18,665,331 25% 4.2 25% 242,617 18% 2.5 $76.93 17.4 2014 >120% 956 38% 30,206,804 41% 7.0 42% 372,193 27% 2.6 $81.16 18.9 2014 Total 2,548 100% 74,224,218 100% 16.7 100% 1,356,179 100% 1.9 $54.73 12.3 2015 <60% 394 6% 10,112,962 5% 2.2 5% 236,756 18% 1.7 $42.71 9.5 2015 60%-80% 858 13% 23,503,029 11% 5.1 11% 235,289 17% 3.6 $99.89 21.7 2015 80%-100% 1,468 22% 48,401,136 22% 10.4 22% 262,503 19% 5.6 $184.38 39.6 2015 100%-120% 1,774 26% 56,222,016 26% 12.2 26% 247,545 18% 7.2 $227.12 49.5 2015 >120% 2,222 33% 80,177,909 37% 18.0 38% 370,463 27% 6.0 $216.43 48.6 2015 Total 6,716 100% 218,417,053 100% 48.0 100% 1,352,556 100% 5.0 $161.48 35.5 2016 <60% 942 11% 18,608,131 7% 4.5 8% 236,756 18% 4.0 $78.60 18.9 2016 60%-80% 1,418 17% 38,455,293 15% 8.9 15% 235,289 17% 6.0 $163.44 37.8 2016 80%-100% 1,778 21% 58,707,520 23% 12.8 22% 262,503 19% 6.8 $223.65 48.8 2016 100%-120% 1,974 23% 62,577,938 25% 13.9 24% 247,545 18% 8.0 $252.79 56.0 2016 >120% 2,291 27% 76,222,957 30% 18.2 31% 370,463 27% 6.2 $205.75 49.1 2016 Total 8,403 100% 254,571,838 100% 58.2 100% 1,352,556 100% 6.2 $188.22 43.1
56 Residential Owner occupied properties of 1‐4 units and multifamily housing greater than 4 units. 57 Residential solar projects that receive financing also receive an incentive under the Residential Solar Incentive Program and Multifamily and Commercial Lease projects may also use C‐PACE so they are counted in each sector's results. These projects have been removed from the total to avoid double counting. 58 Excludes projects in unknown bands.
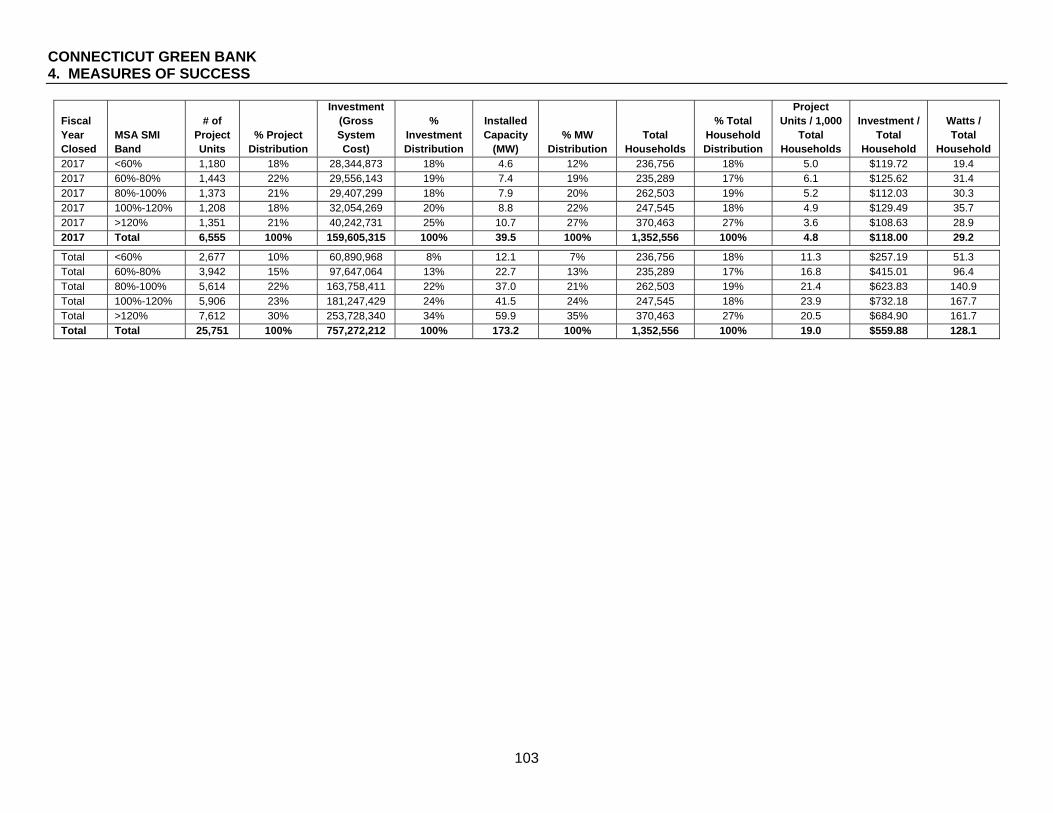
CONNECTICUT GREEN BANK 4. MEASURES OF SUCCESS
103
Fiscal Year Closed
MSA SMI Band
# of Project Units
% Project Distribution
Investment (Gross System Cost)
% Investment Distribution
Installed Capacity
(MW) % MW
Distribution Total
Households
% Total Household Distribution
Project Units / 1,000
Total Households
Investment / Total
Household
Watts / Total
Household 2017 <60% 1,180 18% 28,344,873 18% 4.6 12% 236,756 18% 5.0 $119.72 19.4 2017 60%-80% 1,443 22% 29,556,143 19% 7.4 19% 235,289 17% 6.1 $125.62 31.4 2017 80%-100% 1,373 21% 29,407,299 18% 7.9 20% 262,503 19% 5.2 $112.03 30.3 2017 100%-120% 1,208 18% 32,054,269 20% 8.8 22% 247,545 18% 4.9 $129.49 35.7 2017 >120% 1,351 21% 40,242,731 25% 10.7 27% 370,463 27% 3.6 $108.63 28.9 2017 Total 6,555 100% 159,605,315 100% 39.5 100% 1,352,556 100% 4.8 $118.00 29.2 Total <60% 2,677 10% 60,890,968 8% 12.1 7% 236,756 18% 11.3 $257.19 51.3 Total 60%-80% 3,942 15% 97,647,064 13% 22.7 13% 235,289 17% 16.8 $415.01 96.4 Total 80%-100% 5,614 22% 163,758,411 22% 37.0 21% 262,503 19% 21.4 $623.83 140.9 Total 100%-120% 5,906 23% 181,247,429 24% 41.5 24% 247,545 18% 23.9 $732.18 167.7 Total >120% 7,612 30% 253,728,340 34% 59.9 35% 370,463 27% 20.5 $684.90 161.7 Total Total 25,751 100% 757,272,212 100% 173.2 100% 1,352,556 100% 19.0 $559.88 128.1

CONNECTICUT GREEN BANK 4. MEASURES OF SUCCESS
104
Through such products and initiatives as the LMI solar incentive, its partnership with PosiGen, ongoing education to the market about the good credit quality of low and moderate income homeowners and market research made available to industry participants for targeting (customer segmentation, demographic and geographic data), and its affordable multifamily housing energy financing products, The Green Bank has focused on increasing its penetration in the LMI market shown in Tables 28 and 29 to deliver inclusive prosperity through the green economy.
Table 28. Green Bank Residential59 Activity in Metropolitan Statistical Area (MSA) Area Median Income (AMI) Bands Above or Below 100% by FY Closed60 61
# Project Units MW Investment (Gross Cost) Fiscal Year Closed Total
Over 100% AMI
100% or Below
AMI
% at 100% or Below Total
Over 100% AMI
100% or Below
AMI
% at 100% or Below Total
Over 100% AMI
100% or Below AMI
% at 100% or Below
2012 417 349 68 16% 2.9 2.4 0.4 15% $14,989,569 $12,822,834 $2,166,735 14% 2013 1,112 908 204 18% 7.9 6.6 1.3 16% $35,464,219 $29,469,456 $5,994,762 17% 2014 2,548 1,779 769 30% 16.7 12.9 3.9 23% $74,224,218 $56,148,067 $18,076,152 24% 2015 6,716 4,581 2,135 32% 48.0 34.6 13.4 28% $218,417,053 $155,275,270 $63,141,783 29% 2016 8,403 4,679 3,724 44% 58.2 36.4 21.8 37% $254,571,838 $156,584,676 $97,987,162 38% 2017 6,555 3,001 3,554 54% 39.5 21.5 17.9 45% $159,605,315 $79,084,397 $80,520,918 50% Total 25,751 15,297 10,454 41% 173.2 114.4 58.8 34% $757,272,212 $489,384,700 $267,887,512 35%
59 Residential Owner occupied properties of 1‐4 units and multifamily housing greater than 4 units 60 Residential solar projects that receive financing also receive an incentive under the Residential Solar Incentive Program and Multifamily and Commercial Lease projects may also use C‐PACE so they are counted in each sector's results. These projects have been removed from the total to avoid double counting. 61 Excludes projects in unknown bands.

CONNECTICUT GREEN BANK 4. MEASURES OF SUCCESS
105
Table 29. Green Bank Residential62 Activity in Metropolitan Statistical Area (MSA) State Median Income (SMI) Bands Above or Below 100% by FY Closed63 64
# Project Units MW Investment (Gross Cost) Fiscal Year Closed Total
Over 100% SMI
100% or Below
SMI
% at 100% or Below Total
Over 100% SMI
100% or Below
SMI
% at 100% or Below Total
Over 100% SMI
100% or Below SMI
% at 100% or Below
2012 417 304 113 27% 2.9 2.2 0.7 25% $14,989,569 $11,314,952 $3,674,617 25% 2013 1,112 837 275 25% 7.9 6.1 1.7 22% $35,464,219 $27,290,863 $8,173,356 23% 2014 2,548 1,557 991 39% 16.7 11.3 5.5 33% $74,224,218 $48,872,135 $25,352,084 34% 2015 6,716 3,996 2,720 41% 48.0 30.3 17.7 37% $218,417,053 $136,399,926 $82,017,127 38% 2016 8,403 4,265 4,138 49% 58.2 32.1 26.2 45% $254,571,838 $138,800,895 $115,770,943 45% 2017 6,555 2,559 3,996 61% 39.5 19.5 19.9 51% $159,605,315 $72,296,999 $87,308,315 55% Total 25,751 13,518 12,233 48% 173.2 101.4 71.8 41% $757,272,212 $434,975,769 $322,296,443 43%
Distressed Communities Connecticut’s “distressed communities” are particularly affected by the state’s high energy prices. On average, Connecticut’s neediest households owe $2,560 more in annual energy bills than they can afford65. The Green Bank’s financing products and marketing efforts seek to bring lower and more predictable energy costs to homes and businesses in these communities.
Table 30. Distressed and Not Distressed Municipalities, Population, and Households in Connecticut66 For more information on DECD Distressed Municipality criterions, click here67
201668 DECD Distressed Designation Distressed Not Distressed Total % Distressed
# Towns 25 144 169 15% Population (2010 Census) 1,167,312 2,406,785 3,574,097 33% Households (2010 Census) 445,638 925,449 1,371,087 33%
62 Residential Owner occupied properties of 1‐4 units and multifamily housing greater than 4 units. 63 Residential solar projects that receive financing also receive an incentive under the Residential Solar Incentive Program and Multifamily and Commercial Lease projects may also use C‐PACE so they are counted in each sector's results. These projects have been removed from the total to avoid double counting. 64 Excludes projects in unknown bands. 65 Home Energy Affordability in Connecticut: http://www.operationfuel.org/wp‐content/uploads/Connecticut‐2014‐HEAG‐Final.pdf 66 As designated by DECD in 2016. 67 Department of Economic and Community Development: http://www.ct.gov/ecd/cwp/view.asp?a=1105&q=251248 68 2017 DECD Distressed Designations have not been made public at the time that this was published. The Green Bank will update its internal calculations with the 2017 designations once available.

CONNECTICUT GREEN BANK 4. MEASURES OF SUCCESS
106
The Green Bank has steadily increased its percentage of projects deployed each year in distressed municipalities. This has led to nearly $350 million in clean energy projects in these communities, creating 4,000 jobs.
Table 31. Green Bank Commercial and Residential Activity in Distressed Communities by FY Closed69 Fiscal Year Closed Distressed
# of Project Units
% Project Distribution
Investment (Gross System
Cost)
% Investment Distribution
Installed Capacity
(MW) % MW
Distribution
2010 Census
Population% Population Distribution
Investment / Capita
Watts / Capita
2010 Census
Households
% Household Distribution
Investment / Household
Watts / Household
2012 Yes 46 11% $1,283,753 9% 0.3 9% 1,172,186 33% $1.10 0.2 449,097 33% $2.86 $0.59 2012 No 371 89% $13,705,816 91% 2.6 91% 2,401,911 67% $5.71 1.1 921,990 67% $14.87 $2.83 2012 Total 417 100% $14,989,569 100% 2.9 100% 3,574,097 100% $4.19 0.8 1,371,087 100% $10.93 $2.10
2013 Yes 121 11% $75,175,239 68% 15.5 66% 1,124,337 31% $66.86 13.8 428,395 31% $175.48 $36.23 2013 No 998 89% $36,040,124 32% 7.9 34% 2,449,760 69% $14.71 3.2 942,692 69% $38.23 $8.43 2013 Total 1,119 100% $111,215,363 100% 23.5 100% 3,574,097 100% $31.12 6.6 1,371,087 100% $81.11 $17.12
2014 Yes 388 15% $20,924,533 20% 3.9 17% 1,104,894 31% $18.94 3.6 420,721 31% $49.73 $9.37 2014 No 2,187 85% $82,671,271 80% 19.5 83% 2,469,203 69% $33.48 7.9 950,366 69% $86.99 $20.51 2014 Total 2,575 100% $103,595,804 100% 23.4 100% 3,574,097 100% $28.99 6.6 1,371,087 100% $75.56 $17.09
2015 Yes 1,514 22% $93,699,121 30% 13.2 21% 1,123,207 31% $83.42 11.7 429,250 31% $218.29 $30.69 2015 No 5,264 78% $222,834,399 70% 49.5 79% 2,450,890 69% $90.92 20.2 941,837 69% $236.60 $52.58 2015 Total 6,778 100% $316,533,520 100% 62.7 100% 3,574,097 100% $88.56 17.5 1,371,087 100% $230.86 $45.73
2016 Yes 2,495 29% $82,415,451 26% 17.5 25% 1,167,312 33% $70.60 15.0 445,638 33% $184.94 $39.27 2016 No 6,191 71% $229,372,784 74% 51.2 75% 2,406,785 67% $95.30 21.3 925,449 67% $247.85 $55.35 2016 Total 8,686 100% $311,788,235 100% 68.7 100% 3,574,097 100% $87.24 19.2 1,371,087 100% $227.40 $50.12
2017 Yes 2,455 36% $73,495,156 34% 16.3 31% 1,167,312 33% $62.96 14.0 445,638 33% $164.92 $36.61 2017 No 4,277 64% $140,309,017 66% 36.9 69% 2,406,785 67% $58.30 15.3 925,449 67% $151.61 $39.82 2017 Total 6,732 100% $213,804,172 100% 53.2 100% 3,574,097 100% $59.82 14.9 1,371,087 100% $155.94 $38.78
Total Yes 7,019 27% $346,993,253 32% 66.7 28% 1,167,312 33% $297.26 57.2 445,638 33% $778.64 $149.71 Total No 19,288 73% $724,933,411 68% 167.6 72% 2,406,785 67% $301.20 69.7 925,449 67% $783.33 $181.16 Total Total 26,307 100% $1,071,926,663 100% 234.4 100% 3,574,097 100% $299.92 65.6 1,371,087 100% $781.81 $170.93
69 Residential solar projects that receive financing also receive an incentive under the Residential Solar Incentive Program and Multifamily and Commercial Lease projects may also use C‐PACE so they are counted in each sector's results. These projects have been removed from the total to avoid double counting.

CONNECTICUT GREEN BANK 4. MEASURES OF SUCCESS
107
Credit Quality of Homeowners The credit quality of Green Bank’s borrowers in Green Bank residential 1-4 programs that do FICO-based underwriting reflects the relatively high FICO scores in the state; 94% of single family households that are Green Bank borrowers in these programs have a FICO of 680 or higher. The Green Bank has begun to focus on ensuring that credit challenged customers have access to energy financing products through such initiatives as its partnership with PosiGen (which uses an alternative underwriting approach) and launching a credit-challenged version of the Smart-E program that broadens the credit eligibility and now has six lenders including Capital 4 Change (a CDFI) and all the credit unions participating (all institution with experience serving this market).
Table 32. Credit Score Ranges of Household Borrowers Using Residential Financing Programs Program Name Unknown >639 640-679 680-699 700-719 720+ Total Smart-E 3 18 91 94 106 853 1,165 Solar Lease - 1 45 39 78 1,026 1,189 Solar Loan - - - 11 15 253 279 Total 3 19 136 144 199 2,132 2,633
0% 1% 5% 5% 8% 81%

CONNECTICUT GREEN BANK 4. MEASURES OF SUCCESS
108
Projects by CRA Eligibility The Community Reinvestment Act was enacted by Congress in 1977 to encourage depository institutions to lend in low-to-moderate-income communities. These lending institutions are rated as to the volume of their lending to projects in these communities by regulators. Projects are potentially compliant with CRA requirements if they are below 80% of a Metropolitan Statistical Area’s (MSA) Adjusted Median Income (AMI) level. For FY 2017, Between 35% and 50% of projects maybe CRA compliant.
Table 33. Green Bank Commercial and Residential Activity in Metropolitan Statistical Area (MSA) Area Median Income (AMI) Bands Above or Below 80% by FY Closed70 71
# Projects Investment (Gross Cost) Amount Financed
Fiscal Year Closed Total
Over 80% AMI
80% or
Below AMI
80% or
Below AMI Total
Over 80% AMI
80% or Below AMI
80% or
Below AMI Total
Over 80% AMI
80% or Below AMI
80% or Below
AMI 2012 417 397 20 5% $14,989,569 $14,467,221 $522,348 3% $0 $0 $0 0% 2013 1,119 1,040 79 7% $111,215,363 $35,056,219 $76,159,144 68% $6,962,882 $1,034,730 $5,928,152 85% 2014 2,456 2,198 258 11% $103,595,804 $87,223,562 $16,372,242 16% $29,697,964 $19,573,243 $10,124,721 34% 2015 6,527 5,606 921 14% $316,533,520 $245,636,987 $70,896,533 22% $73,310,347 $60,038,631 $13,271,716 18% 2016 7,600 5,841 1,759 23% $309,706,751 $242,071,201 $67,635,550 22% $77,047,006 $51,561,454 $25,485,552 33% 2017 5,448 3,610 1,838 34% $212,298,380 $133,830,283 $78,468,098 37% $71,895,375 $35,707,006 $36,188,369 50% Total 23,567 18,692 4,875 21% $1,068,339,387 $758,285,473 $310,053,915 29% $258,913,573 $167,915,064 $90,998,510 35%
70 Excludes projects in unknown bands. 71 This table has been adjusted to include all the Low Income Solar Lease (ESA) and Multifamily Affordable Housing projects as 80% or Below AMI regardless of which census tract the project falls into as these programs are designed to serve the LMI market.

CONNECTICUT GREEN BANK 4. MEASURES OF SUCCESS
109
Customer Types and Market Segments The Connecticut Green Bank targets end users of energy in Connecticut both at work and at home. A breakdown of projects by year by customer type is seen in Table 34.
Table 34. Green Bank Activity in Residential and Commercial Markets by FY Closed72
Fiscal Year Closed Market
# of Projects
# of Project Units
Investment (Gross
System Cost)
Installed Capacity
(MW)
Expected Annual
Generation (MWh)
Annual Saved /
Produced (MMBtu)
2012 Residential 417 417 $14,989,569 2.9 3,278 11,183 Total 417 417 $14,989,569 2.9 3,278 11,183
2013 Commercial 7 7 $75,751,144 15.6 122,597 432,678 Residential 1,112 1,112 $35,464,219 7.9 8,983 30,651
Total 1,119 1,119 $111,215,363 23.5 131,581 463,328
2014 Commercial 27 27 $29,371,586 6.7 32,134 179,454 Residential 2,429 2,548 $74,224,218 16.7 19,534 66,714
Total 2,456 2,575 $103,595,804 23.4 51,668 246,168
2015 Commercial 62 62 $98,116,467 14.7 155,132 520,179 Residential 6,465 6,716 $218,417,053 48.0 55,308 189,758 Total 6,527 6,778 $316,533,520 62.7 210,440 709,938
2016 Commercial 71 71 $56,347,967 10.2 25,613 115,584 Residential 7,535 8,615 $255,440,268 58.5 67,227 227,828
Total 7,606 8,686 $311,788,235 68.7 92,840 343,412
2017 Commercial 62 62 $52,693,065 13.6 25,267 370,947 Residential 5,397 6,670 $161,111,107 39.5 47,038 158,418
Total 5,459 6,732 $213,804,172 53.2 72,305 529,365
Total Commercial 229 229 $312,280,229 60.8 360,742 1,618,842 Residential 23,355 26,078 $759,646,434 173.5 201,369 690,649 Total 23,584 26,307 $1,071,926,663 234.4 562,111 2,309,491
72 Residential solar projects that receive financing also receive an incentive under the Residential Solar Incentive Program and Multifamily and Commercial Lease projects may also use C‐PACE so they are counted in each sector's results. These projects have been removed from the total to avoid double counting.
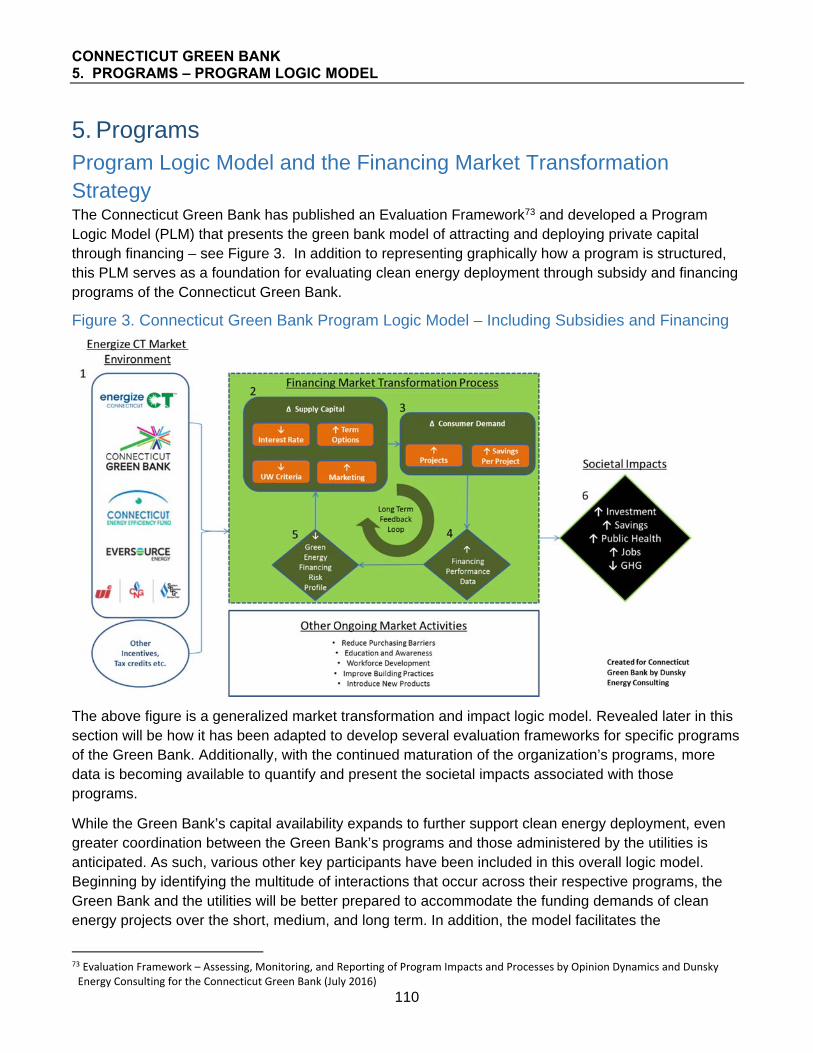
CONNECTICUT GREEN BANK 5. PROGRAMS – PROGRAM LOGIC MODEL
110
5. Programs Program Logic Model and the Financing Market Transformation Strategy The Connecticut Green Bank has published an Evaluation Framework73 and developed a Program Logic Model (PLM) that presents the green bank model of attracting and deploying private capital through financing – see Figure 3. In addition to representing graphically how a program is structured, this PLM serves as a foundation for evaluating clean energy deployment through subsidy and financing programs of the Connecticut Green Bank.
Figure 3. Connecticut Green Bank Program Logic Model – Including Subsidies and Financing
The above figure is a generalized market transformation and impact logic model. Revealed later in this section will be how it has been adapted to develop several evaluation frameworks for specific programs of the Green Bank. Additionally, with the continued maturation of the organization’s programs, more data is becoming available to quantify and present the societal impacts associated with those programs.
While the Green Bank’s capital availability expands to further support clean energy deployment, even greater coordination between the Green Bank’s programs and those administered by the utilities is anticipated. As such, various other key participants have been included in this overall logic model. Beginning by identifying the multitude of interactions that occur across their respective programs, the Green Bank and the utilities will be better prepared to accommodate the funding demands of clean energy projects over the short, medium, and long term. In addition, the model facilitates the
73 Evaluation Framework – Assessing, Monitoring, and Reporting of Program Impacts and Processes by Opinion Dynamics and Dunsky Energy Consulting for the Connecticut Green Bank (July 2016)

CONNECTICUT GREEN BANK 5. PROGRAMS – PROGRAM LOGIC MODEL
111
identification and capture of known interventions in the clean energy environment that may impact the trajectory of the Green Bank’s financing efforts over time.
The PLM includes three (3) components – Energize CT Market Environment (including Other Ongoing Market Activities), Green Bank Financing Market Transformation Process, and Societal Impacts.
Energize CT Market Environment
Energize CT is an initiative of the Green Bank, the Connecticut Energy Efficiency Fund, the State, and the local electric and gas utilities. It provides Connecticut consumers, businesses and communities the resources and information they need to make it easy to save energy and build a clean energy future for everyone in the state. Under this umbrella, the electric and gas investor owned utilities (IOUs) provide information, marketing, and deliver the energy efficiency programs that have been approved by the State and supported by the Connecticut Energy Efficiency Fund. Operating under a statutory mandate that all cost-effective energy efficiency be acquired, with guidance from the Connecticut Energy Efficiency Board and its consultants, the utilities offer a variety of programs and encouragements for residential, commercial, and industrial customers to make decisions to participate in these cost-reducing opportunities. A range of methods is used to encourage customers to participate in the programs, among them targeted information, low cost/no cost measures, financial incentives, discounted retail products, and product and project financing. The Connecticut Green Bank, with a statutorily established residential solar PV target of 300MW by 2022, also markets and delivers its clean energy programs to residential customers. Informed by aggregate consumer and demographic data, the Green Bank promotes its programs and market offerings with direct incentives and financing opportunities in addition to a host of marketing, communication and outreach tools. 74
Within the Green Bank’s current programs, only participants in the Residential Solar Investment Program (RSIP) are required to receive a home energy assessment (supported by the utility efficiency programs), a BPI audit, or equivalent. Having satisfied the program’s qualifying energy producing measures, RSIP participants may also receive rebates or incentives from the utilities (intended to overcome barriers to customer participation and/or encourage increased selection of energy efficient measures), or other levels of government (e.g., state incentives and Federal tax credits for several energy saving technologies), as well as opportunities to access affordable financing for some or all of the remaining portion of their clean energy project. In the context of a PLM, one may also anticipate similar links between the Green Bank programs and those of the investor owned utilities (IOU’s).
The impetus behind increased coordination among the utility administered energy efficiency programs and the Green Bank’s programs is threefold: 1) more energy savings, and resulting emissions reductions, are expected to be acquired more economically both to the programs and to the project participants, 2) delivery efficiencies and greater savings could be found in coordinating financing that each entity offers to common customer segments within the sphere of program activities that they offer, and 3) coordination through a Joint Committee of the Energy Efficiency Board and the Connecticut Green Bank is required by statute.75 It is important to note that a number of other ongoing market
74 Per Public Act 15‐194 “An Act Concerning the Encouragement of Local Economic Development and Access to Residential Renewable Energy,” the Connecticut Green Bank administers a rebate and performance‐based incentive program to support solar PV.
75 Pursuant to Section 15‐245m(d)(2) of Connecticut General Statutes, the Joint Committee shall examine opportunities to coordinate the programs and activities contained in the plan developed under Section 16‐245n(c) of the General Statutes [Comprehensive Plan of the Connecticut Green Bank] with the programs and activities contained in the plan developed under section 16‐245m(d)(1) of the General Statutes [Energy Conservation and Load Management Plan] and to provide financing to increase the benefits of programs funded by the

CONNECTICUT GREEN BANK 5. PROGRAMS – PROGRAM LOGIC MODEL
112
activities are occurring through Energize CT or outside of the Green Bank’s market transformation process. From introducing new products, reducing purchasing barriers, education and awareness programs to workforce development, and improving building practices – there are a variety of activities that help move the market towards more clean energy deployment.
Finance Market Transformation Process
The efforts of the Green Bank are exemplified through the financing market transformation process which focuses on accelerating the deployment of clean energy – more customers and “deeper” more comprehensive measures being undertaken – by securing increasingly affordable and attractive private capital. The Green Bank can enter the process at several points (i.e., from numbers 2 through 4 in the above PLM figure), such as supplying capital through financing offers, marketing clean energy financing, or offsetting clean energy financing risk by backstopping loans, or sharing loan performance data.
Below is a breakdown of each component of the financing market transformation process of the Green Bank:
Supply of Capital – financing programs aim to increase the supply of affordable and attractive capital available to support energy savings and clean energy production in the market place. This is done at the Green Bank by:
a. Providing financing (loans or leases) to customers using Green Bank capital; and/or b. Establishing structures, programs, and public-private partnerships that connect third-party
capital to support energy savings projects.
Beyond ensuring that financing is available for clean energy projects, the Green Bank’s Supply of Capital interventions can lead to, but are not limited to benefits such as:
a. Reduced interest rates, which lower the cost of capital for clean energy projects; b. More loan term options to better match savings cash flows (e.g., longer terms for longer
payback projects, early repayment, or deferred first year payments); c. Less restrictive underwriting criteria, resulting in increased eligibility and access to
financing; and d. Increased marketing efforts by lenders to leverage clean energy investment opportunities.
Each of these features is intended to increase uptake of clean energy projects, leading to increased energy savings, clean energy production, and other positive societal impacts. The long-term goal of the Green Bank’s efforts is to achieve these attractive features in the market with a reduced need for Green Bank intervention, through the provision of performance data that convinces private capital providers to offer such features on their own.
Consumer Demand – in combination with a comprehensive set of clean energy programs under the Energize CT initiative, offered by the utilities, the Green Bank drives consumer demand for clean energy by marketing financing programs and increasing awareness of the potential benefits stemming from clean energy projects through the range of programs it offers.
plan developed under section 16‐245m(d)(1) of the General Statutes so as to reduce the long‐term cost, environmental impacts, and security risks of energy in the state.

CONNECTICUT GREEN BANK 5. PROGRAMS – PROGRAM LOGIC MODEL
113
It should also be noted that through channel marketing strategies (e.g., contractor channels to the customer) success will be determined by an increase in demand for financing. The results of the increased demand are expected to, but are not limited to:
a. Increase in the number of clean energy projects; and b. Increase in the associated average savings and/or clean energy production per project.
Increasing affordable and attractive financing offerings in the marketplace is an important component of unlocking consumer demand and driving greater energy savings and clean energy production, and is central to the Green Bank’s market transformation efforts.
Financing Performance Data – Green Bank gathers and communicates the performance of clean energy financing either through its own programs or for other financing options in the market place. This increases access to valuable information that can help lenders and customers identify promising clean energy investments. Enabling access to this information (i.e., data transparency) is important to encouraging market competition. Ultimately, data on the performance of Green Bank sponsored financial products is expected to continue to play a pivotal role in the attraction of private capital directed toward more affordable and accessible financing offerings. As the Green Bank increases the access to affordable and attractive capital, and more customers use this financing for their clean energy projects, data demonstrating strong and reliable performance of these projects is also expected to enable lower interest rates due to a better-informed assumption of risk.
Financing Risk Profile – Green Bank can help reduce clean energy financing risk profiles in many ways. For example, it can absorb a portion or all the credit risk by providing loan loss reserve (LLR) funds and guarantees or taking the first-loss position on investments (i.e., subordinated debt). It can also channel or attract rebates and incentives to finance energy saving projects thus improving their economic performance and lowering the associated performance risk. In the long run, by making clean energy financing performance data available to the market, Green Bank programs increase lenders’ and borrowers’ understanding of clean energy investment risk profiles, which is expected to enable them to (1) design more affordable and attractive financing products and (2) select projects for financing to reduce risks.
This element of the PLM plays the key linking role in the Market Transformation feedback loop, leading to longer term impacts, as the market (1) recognizes the expected advantageous risk/return profile associated with clean energy investments and (2) takes further steps to increase the supply of affordable and attractive capital with less Green Bank credit enhancement needed to support demand for clean energy investments.
Ensuring that financing performance and risk profile data are available to the market is important from various perspectives. For a deeper examination and presentation, please see the report by the State Energy Efficiency Action Network.76
76 State and Local Energy Efficiency Action Network. (2014). Energy Efficiency Finance Programs: Use Case Analysis to Define Data Needs and Guidelines. Prepared by: Peter Thompson, Peter Larsen, Chris Kramer, and Charles Goldman of Lawrence Berkeley National Laboratory. Click here (http://www4.eere.energy.gov/seeaction/publication/energy‐efficiency‐finance‐programs‐use‐case‐analysis‐define‐data‐needs‐and‐guidelines)

CONNECTICUT GREEN BANK 5. PROGRAMS – PROGRAM LOGIC MODEL
114
Societal Impact
The efforts to accelerate and scale-up investment in clean energy deployment by the Green Bank, lead to a myriad of societal impacts and benefits.
All the PLM elements ultimately aim to contribute to Green Bank program impacts and benefits. These include the direct increase in energy savings and improvement of public health (e.g., asbestos remediation, lead abatement, etc.) to the customer,77 increase in the creation of local in-state jobs,78 and the reduction of greenhouse gas emissions79 for society. The impacts may also include consideration of secondary or indirect benefits such as GDP growth and energy savings supported by lenders who have leveraged Green Bank data or marketing efforts. Figure 4 below represents the transition over time of the Green Bank’s clean energy impacts and associated creation of societal benefits.
77 Green Bank will be working with the Connecticut Department of Energy and Environmental Protection and the U.S. Environmental Protection Agency to develop and approve a methodology for estimating public health benefits from the reduction of criteria pollutants as a result of the production of clean energy and reduction of energy consumption through the use of the Co‐Benefits Risk Assessment (COBRA) model – http://www.epa.gov/statelocalclimate/co‐benefits‐risk‐assessment‐cobra‐screening‐model
78 Green Bank is working with the Connecticut Department of Economic and Community Development and Navigant Consulting to update and approve a methodology for estimating economic development benefits from the investment in clean energy projects.
79 Green Bank is working with the Connecticut Department of Energy and Environmental Protection to develop and approve a methodology for estimating greenhouse gas emission reduction benefits from the production of clean energy and reduction of energy consumption through the use of the Avoided Emissions and geneRation Tool (AVERT) ‐ http://www.epa.gov/statelocalclimate/avoided‐emissions‐and‐generation‐tool‐avert

CONNECTICUT GREEN BANK 5. PROGRAMS – PROGRAM LOGIC MODEL
115
Figure 4. Societal Benefits – Environmental Protection and Economic Development – from Greater Private Capital Investment
As the Green Bank continues to attract more private investment in Connecticut’s clean energy economy through the issuance of green bonds, the deployment of clean energy will be accelerated. The more clean energy that is being deployed, the greater the societal benefits.

CONNECTICUT GREEN BANK 5. PROGRAMS – C-PACE
116
Case 1 – C-PACE Description Commercial Property Assessed Clean Energy (C-PACE) enables building owners to pay for clean energy improvements or clean energy production projects over time through a voluntary benefit assessment on their property tax bills. This process makes it easier for building owners to secure low-interest capital to fund energy improvements and is structured so that energy savings more than offset the benefit assessment.
Figure 5. Legal Structure and Flows of Capital for C-PACE
For a municipality to participate in the C-PACE program, its legislative body must pass a resolution enabling it to enter into an agreement with the Connecticut Green Bank to assess, collect, remit, and assign benefit assessments against C-PACE borrowers’ liabilities. As of June 30, 2017, there are 128 cities and towns signed up for C-PACE representing more than 90% of commercial and industrial building space in Connecticut. Additionally, as of June 30, 2017, over $100 million in C-PACE benefit assessment advances have been closed.
A portfolio of $17.5 million in benefit assessment liens comprised of 30 energy efficiency and clean energy projects across 22 municipalities was sold in two tranches to the Public Finance Authority (WI) (“PFA”) under a bond conduit structure financed by Clean Fund. Using an auction process, bids for the portfolio were competitively solicited across the Connecticut Green Bank’s capital providers. Bidders were encouraged to offer various structures and pricing, with or without credit enhancement, and to bid for one or more projects. The selected structure (See Figure 5) has the PFA use proceeds from Clean Fund (in return for a single class of Senior "A" bonds) to fund 80 percent of the portfolio purchase price. To credit enhance the transaction, the Connecticut Green Bank has taken back, in equal measure, Subordinated "B" and "C" bonds. The structure is, in effect, a "private securitization" of the underlying portfolio.

CONNECTICUT GREEN BANK 5. PROGRAMS – C-PACE
117
Building on this experience and the growth of the Connecticut C-PACE market, the Green Bank again solicited proposals from several financial institutions in 2015. As a result of the competitive solicitation, the Green Bank established a strategic financing partnership with Hannon Armstrong Sustainable Infrastructure (Hannon Armstrong), publicly listed on the NYSE. The Green Bank and Hannon Armstrong structure uses a special purpose entity (SPE) established by Hannon Armstrong specifically for the Green Bank C-PACE portfolio. The SPE purchases the benefit assessment liens in tranches that are financed from between 80% and 90% by Hannon Armstrong up to a maximum of $100 million with the residual capital provided by the Green Bank.
Key Performance Indicators The Key Performance Indicators for C-PACE closed activity are reflected in Tables 35 through 38. These illustrate the volume of projects by year, investment, generation capacity installed, and the amount of energy saved and/or produced. It also breaks down the volume of projects by energy efficiency, renewable generation, or both.
Table 35. C-PACE Project Types and Investment by FY Closed Fiscal Year Closed EE RE RE/EE
# Projects
# Project Units
Investment (Gross Cost)80
Green Bank Investment81
Private Investment
Leverage Ratio
2012 - - - - - - - - - 2013 2 1 3 3 $1,512,144 $210,302 $1,301,842 7.2 2014 6 14 3 23 23 $21,785,167 $9,550,120 $12,235,046 2.3 2015 10 30 9 49 49 $33,694,139 $12,635,906 $21,058,234 2.7 2016 10 34 8 52 52 $36,248,743 $7,407,738 $28,841,004 4.9 2017 5 28 5 38 38 $15,278,194 $3,140,789 $12,137,406 4.9 Total 33 106 26 165 165 $108,518,387 $32,944,855 $75,573,532 3.3
Table 36. C-PACE Project Capacity, Generation and Savings by FY Closed
Fiscal Year Closed
Installed Capacity
(kW)
Expected Annual
Generation (kWh)
Expected Lifetime Savings
or Generation (MWh)
Annual Saved /
Produced (MMBtu)
Lifetime Saved /
Produced (MMBtu)
Annual Cost
Savings
Lifetime Cost
Savings 2012 - - - - - - - 2013 101.0 513,495 7,657 2,021 32,845 $132,907 $2,538,186 2014 3,631.0 8,409,814 154,673 36,264 716,930 $1,905,050 $40,635,908 2015 7,280.0 14,973,965 325,349 41,464 902,240 $2,792,189 $58,534,753 2016 6,265.3 15,198,989 275,141 59,253 1,123,536 $3,833,096 $82,410,363 2017 3,918.9 6,283,132 133,414 23,113 497,061 $560,640 $14,072,754 Total 21,196.1 45,379,395 896,234 162,115 3,272,612 $9,223,881 $198,191,964
80 Includes closing costs and capitalized interest for C‐PACE and the Fair Market Value for Commercial/Residential Leases. 81 Includes incentives, interest rate buydowns and loan loss reserves.

CONNECTICUT GREEN BANK 5. PROGRAMS – C-PACE
118
Table 37. C-PACE Project Averages by FY Closed Fiscal Year Closed
Average Gross
System Cost
Average Amount
Financed
Average Installed
Capacity (kW)
Average Annual Saved / Produced
(MMBtu)
Average Finance Term
(months)
Average Finance
Rate 2012 - - - - - - 2013 $504,048 $350,503 33.7 674 17 5.00 2014 $947,181 $883,582 157.9 1,577 18 5.57 2015 $687,635 $646,762 148.6 846 18 4.82 2016 $697,091 $644,825 120.5 1,139 18 4.75 2017 $402,058 $386,620 103.1 608 17 4.29 Total $657,687 $613,865 128.5 983 18 4.78
Table 38. C-PACE Project Application Yield82 by FY Received83 Fiscal Year Received
Applications Received
Projects in Review/On
Hold Projects
Approved Projects
Withdrawn Applications
Denied Approved
Rate Denied
Rate 2012 - - - - - - - 2013 59 2 20 33 4 35% 7% 2014 149 22 39 85 3 31% 2% 2015 147 36 46 62 3 41% 3% 2016 111 43 41 24 3 60% 4% 2017 95 40 28 26 1 51% 2% Total 561 143 174 230 14 42% 3%
82 Applications received are complete initial applications that have been received for C‐PACE financing. Applications denied are any initial applications received for C‐PACE financing that do not meet programmatic requirements. Projects in review are projects that are being reviewed, either technically or financially, prior to being approved. Projects approved are projects that have gone through technical and financial underwriting and have met all the necessary programmatic requirements. These include projects that have been approved and are waiting to close, projects that have closed, and projects that have completed construction and are in repayment. Projects withdrawn are projects that have been approved at the application stage, but have since fallen out of our pipeline for numerous reasons and are no longer active. Projects in this category could have fallen out of our pipeline in the in review or the approved stage. 83 This table represents projects whose initial applications have been approved and are proceeding through the C‐PACE financing pipeline prior to loan closure. Of initial applications received, about 98% enter the pipeline.

CONNECTICUT GREEN BANK 5. PROGRAMS – C-PACE
119
C-PACE has been used as a financing tool across a wide variety of end-use customers in Connecticut in its 5 years of existence as illustrated by Table 39.
Table 39. Types of End-Use Customers Participating in C-PACE Property Type # of Properties Square Footage Agricultural 2 10,904 Education 2 99,531 House of Worship 6 20,000 Industrial 42 1,862,979 Multi-family/apartment (> 5 units) 5 177,889 Non-profit 20 410,719 Nursing Home/Rehab Facility 1 - Office 39 3,332,839 Public assembly 4 139,000 Retail 34 800,543 Special Purpose 1 10,000 Warehouse & storage 9 179,650 Total 165 7,044,054
To date, 128 municipalities have opted into the C-PACE program resulting in 165 closed projects – see Table 40.
Table 40. Municipalities Participating in C-PACE Municipality Opt in Date # Closed ProjectsAnsonia 9/27/2013 1 Avon 4/9/2013 2 Barkhamsted 7/21/2014 Beacon Falls 4/11/2013 Berlin 10/30/2013 Bethany 9/2/2015 Bethel 1/24/2014 Bloomfield 6/21/2013 1 Branford 9/9/2013 1 Bridgeport 12/7/2012 13 Bristol 11/19/2014 5 Brookfield 8/5/2013 3 Burlington 1/12/2016 Canaan 8/8/2013 1 Canterbury 11/5/2014 Canton 7/9/2013 1 Cheshire 10/27/2014 1 Chester 7/25/2013 Clinton 5/29/2013 1 Columbia 10/21/2014 Coventry 6/24/2013 Cromwell 4/9/2014 1 Danbury 10/8/2013 2 Darien 2/28/2014

CONNECTICUT GREEN BANK 5. PROGRAMS – C-PACE
120
Municipality Opt in Date # Closed ProjectsDeep River 7/22/2014 1 Durham 4/2/2013 1 East Granby 6/27/2013 East Haddam 8/1/2013 2 East Hampton 7/10/2013 East Hartford 4/11/2013 1 East Haven 2/28/2017 East Lyme 9/11/2014 2 East Windsor 11/27/2013 5 Eastford 11/10/2014 Easton 5/14/2015 Ellington 8/27/2014 1 Enfield 1/3/2014 1 Essex 7/17/2014 Fairfield 4/30/2014 3 Farmington 12/17/2013 2 Franklin 10/6/2015 Glastonbury 6/14/2013 3 Granby 11/28/2013 Greenwich 9/23/2013 1 Griswold 3/15/2016 Groton 10/21/2013 2 Guilford 3/29/2016 Haddam 9/18/2015 Hamden 3/3/2014 Hartford 10/26/2012 13 Hebron 12/20/2016 Kent 9/17/2014 Killingly 12/9/2014 Killingworth 5/31/2013 1 Lebanon 5/13/2015 Ledyard 1/14/2016 1 Madison 9/5/2014 Manchester 8/1/2013 5 Mansfield 8/27/2013 Meriden 5/24/2013 2 Middlefield 7/21/2015 Middletown 3/25/2013 6 Milford 8/2/2013 Monroe 3/8/2017 Montville 12/4/2013 1 Naugatuck 6/30/2014 1 New Britain 7/17/2013 2 New Canaan 10/24/2014 New Haven 12/6/2013 New London 6/18/2013 8 New Milford 6/10/2013
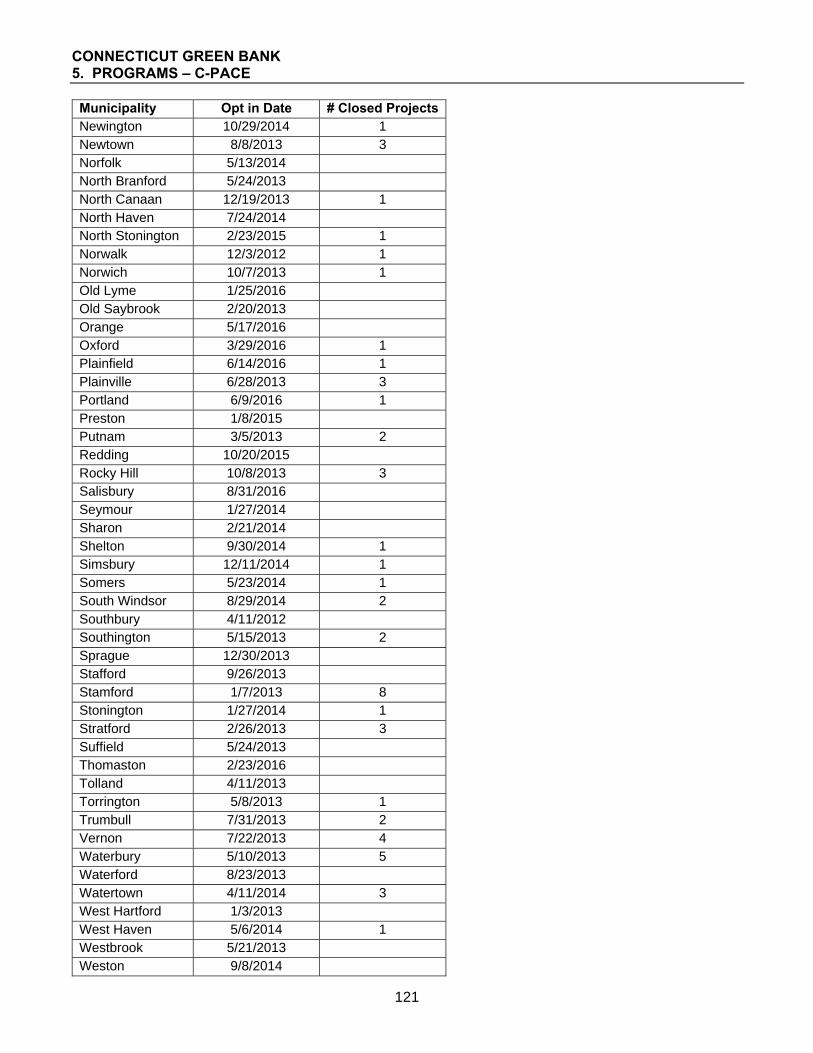
CONNECTICUT GREEN BANK 5. PROGRAMS – C-PACE
121
Municipality Opt in Date # Closed ProjectsNewington 10/29/2014 1 Newtown 8/8/2013 3 Norfolk 5/13/2014 North Branford 5/24/2013 North Canaan 12/19/2013 1 North Haven 7/24/2014 North Stonington 2/23/2015 1 Norwalk 12/3/2012 1 Norwich 10/7/2013 1 Old Lyme 1/25/2016 Old Saybrook 2/20/2013 Orange 5/17/2016 Oxford 3/29/2016 1 Plainfield 6/14/2016 1 Plainville 6/28/2013 3 Portland 6/9/2016 1 Preston 1/8/2015 Putnam 3/5/2013 2 Redding 10/20/2015 Rocky Hill 10/8/2013 3 Salisbury 8/31/2016 Seymour 1/27/2014 Sharon 2/21/2014 Shelton 9/30/2014 1 Simsbury 12/11/2014 1 Somers 5/23/2014 1 South Windsor 8/29/2014 2 Southbury 4/11/2012 Southington 5/15/2013 2 Sprague 12/30/2013 Stafford 9/26/2013 Stamford 1/7/2013 8 Stonington 1/27/2014 1 Stratford 2/26/2013 3 Suffield 5/24/2013 Thomaston 2/23/2016 Tolland 4/11/2013 Torrington 5/8/2013 1 Trumbull 7/31/2013 2 Vernon 7/22/2013 4 Waterbury 5/10/2013 5 Waterford 8/23/2013 Watertown 4/11/2014 3 West Hartford 1/3/2013 West Haven 5/6/2014 1 Westbrook 5/21/2013 Weston 9/8/2014

CONNECTICUT GREEN BANK 5. PROGRAMS – C-PACE
122
Municipality Opt in Date # Closed ProjectsWestport 2/7/2013 4 Wethersfield 5/28/2013 Willington 7/2/2014 1 Wilton 2/27/2012 2 Windham 5/1/2013 1 Windsor 5/16/2013 2 Windsor Locks 7/30/2015 1 Woodbridge 5/30/2014 2 Woodbury 3/18/2015 Woodstock 4/15/2016 Total 128 165

CONNECTICUT GREEN BANK 5. PROGRAMS – C-PACE
123
Area Median Income Band Penetration C-PACE has been used to fund projects in economically diverse locations across the state as reflected by Table 41 for Metropolitan Statistical Area (MSA) Area Median Income (AMI). It should be noted that C-PACE is not an income targeted program.
Table 41. C-PACE Activity in Metropolitan Statistical Area (MSA) Area Median Income (AMI) Bands by FY Closed84
Fiscal Year Closed
MSA AMI Band
# of Project Units
% Project Distribution
Investment (Gross System Cost)
% Investment Distribution
Installed Capacity
(MW)
% MW Distribution
Total Population
% Total Population Distribution
Project Units / 1,000
People
Investment / Total
Population
Watts / Total
Population
2012 <60% 0 0% 0 0% 0.0 0% 609,363 17% 0.0 $0.00 0.0 2012 60%-80% 0 0% 0 0% 0.0 0% 527,217 15% 0.0 $0.00 0.0 2012 80%-100% 0 0% 0 0% 0.0 0% 589,440 17% 0.0 $0.00 0.0 2012 100%-120% 0 0% 0 0% 0.0 0% 722,664 20% 0.0 $0.00 0.0 2012 >120% 0 0% 0 0% 0.0 0% 1,116,395 31% 0.0 $0.00 0.0 2012 Total 0 0% 0 0% 0.0 0% 3,565,079 100% 0.0 $0.00 0.0 2013 <60% 1 33% 150,877 10% 0.0 0% 604,433 17% 0.0 $0.25 0.0 2013 60%-80% 0 0% 0 0% 0.0 0% 568,952 16% 0.0 $0.00 0.0 2013 80%-100% 1 33% 711,251 47% 0.1 100% 588,813 16% 0.0 $1.21 0.2 2013 100%-120% 1 33% 650,016 43% 0.0 0% 690,591 19% 0.0 $0.94 0.0 2013 >120% 0 0% 0 0% 0.0 0% 1,131,305 32% 0.0 $0.00 0.0 2013 Total 3 100% 1,512,144 100% 0.1 100% 3,584,094 100% 0.0 $0.42 0.0 2014 <60% 7 30% 8,907,842 41% 1.3 37% 614,135 17% 0.0 $14.50 2.2 2014 60%-80% 2 9% 609,883 3% 0.2 6% 546,132 15% 0.0 $1.12 0.4 2014 80%-100% 5 22% 3,593,730 16% 1.1 32% 577,061 16% 0.0 $6.23 2.0 2014 100%-120% 3 13% 800,605 4% 0.3 7% 720,856 20% 0.0 $1.11 0.4 2014 >120% 6 26% 7,873,108 36% 0.7 18% 1,125,910 31% 0.0 $6.99 0.6 2014 Total 23 100% 21,785,167 100% 3.6 100% 3,584,094 100% 0.0 $6.08 1.0 2015 <60% 18 37% 7,737,619 23% 1.8 25% 662,619 18% 0.0 $11.68 2.7 2015 60%-80% 5 10% 3,408,609 10% 0.8 10% 489,826 14% 0.0 $6.96 1.6 2015 80%-100% 4 8% 3,427,052 10% 0.4 6% 650,163 18% 0.0 $5.27 0.7 2015 100%-120% 9 18% 4,486,437 13% 1.2 16% 631,741 18% 0.0 $7.10 1.9 2015 >120% 13 27% 14,634,422 43% 3.1 43% 1,150,974 32% 0.0 $12.71 2.7 2015 Total 49 100% 33,694,139 100% 7.3 100% 3,585,323 100% 0.0 $9.40 2.0 2016 <60% 8 16% 3,197,820 9% 0.6 10% 662,619 18% 0.0 $4.83 0.9 2016 60%-80% 7 14% 3,255,764 9% 0.9 15% 489,826 14% 0.0 $6.65 1.8 2016 80%-100% 9 18% 15,082,702 43% 0.8 14% 650,163 18% 0.0 $23.20 1.3 2016 100%-120% 10 20% 5,901,863 17% 1.8 31% 631,741 18% 0.0 $9.34 2.9 2016 >120% 15 31% 7,597,539 22% 1.8 30% 1,150,974 32% 0.0 $6.60 1.6
84 Excludes projects in unknown bands.

CONNECTICUT GREEN BANK 5. PROGRAMS – C-PACE
124
Fiscal Year Closed
MSA AMI Band
# of Project Units
% Project Distribution
Investment (Gross System Cost)
% Investment Distribution
Installed Capacity
(MW)
% MW Distribution
Total Population
% Total Population Distribution
Project Units / 1,000
People
Investment / Total
Population
Watts / Total
Population 2016 Total 49 100% 35,035,689 100% 6.0 100% 3,585,323 100% 0.0 $9.77 1.7 2017 <60% 7 18% 4,529,669 30% 1.7 43% 662,619 18% 0.0 $6.84 2.6 2017 60%-80% 4 11% 1,312,429 9% 0.4 11% 489,826 14% 0.0 $2.68 0.8 2017 80%-100% 7 18% 2,092,122 14% 0.4 9% 650,163 18% 0.0 $3.22 0.5 2017 100%-120% 8 21% 2,305,092 15% 0.6 16% 631,741 18% 0.0 $3.65 1.0 2017 >120% 12 32% 5,038,882 33% 0.8 21% 1,150,974 32% 0.0 $4.38 0.7 2017 Total 38 100% 15,278,194 100% 3.9 100% 3,585,323 100% 0.0 $4.26 1.1 Total <60% 41 25% 24,523,827 23% 5.5 26% 662,619 18% 0.1 $37.01 8.2 Total 60%-80% 18 11% 8,586,685 8% 2.3 11% 489,826 14% 0.0 $17.53 4.7 Total 80%-100% 26 16% 24,906,858 23% 2.9 14% 650,163 18% 0.0 $38.31 4.4 Total 100%-120% 31 19% 14,144,013 13% 3.9 19% 631,741 18% 0.0 $22.39 6.2 Total >120% 46 28% 35,143,951 33% 6.4 31% 1,150,974 32% 0.0 $30.53 5.5 Total Total 162 100% 107,305,333 100% 20.9 100% 3,585,323 100% 0.0 $29.93 5.8
Table 42. C-PACE Activity in Metropolitan Statistical Area (MSA) Area Median Income (AMI) Bands Above or Below 100% by FY Closed85
# Project Units MW Investment (Gross Cost) Fiscal Year Closed Total
Over 100% AMI
100% or Below
AMI
% at 100% or Below Total
Over 100% AMI
100% or Below AMI
% at 100% or Below Total
Over 100% AMI
100% or Below
AMI
% at 100% or Below
2012 0 0% 0.0 0.0 0.0 0% $0 $0 $0 0% 0 0% 2013 3 67% 0.1 0.0 0.1 100% $1,512,144 $650,016 $862,128 57% 3 67% 2014 23 61% 3.6 0.9 2.7 75% $21,785,167 $8,673,712 $13,111,454 60% 23 61% 2015 49 55% 7.3 4.3 3.0 41% $33,694,139 $19,120,859 $14,573,280 43% 49 55% 2016 49 49% 6.0 3.6 2.3 39% $35,035,689 $13,499,402 $21,536,287 61% 49 49% 2017 38 47% 3.9 1.4 2.5 63% $15,278,194 $7,343,974 $7,934,220 52% 38 47% Total 162 52% 20.9 10.3 10.6 51% $107,305,333 $49,287,964 $58,017,370 54% 162 52%
85 Excludes projects in unknown bands.

CONNECTICUT GREEN BANK 5. PROGRAMS – C-PACE
125
Distressed Community Penetration For a breakdown of C-PACE project volume and investment by census tracts categorized by Distressed Communities – see Table 43. It should be noted that C-PACE is not an income targeted program.
Table 43. C-PACE Activity in Distressed Communities by FY Closed Fiscal Year Closed Distressed
# of Project Units
% Project Distribution
Investment (Gross System
Cost)
% Investment Distribution
Installed Capacity
(MW) % MW
Distribution
2010 Census
Population
% Population Distribution
Investment / Capita
Watts / Capita
2010 Census
Households
% Household Distribution
Investment / Household
Watts / Household
2012 Yes 0 0% $0 0% 0.0 0% 1,172,186 33% $0.00 0.0 449,097 33% $0.00 $0.00 2012 No 0 0% $0 0% 0.0 0% 2,401,911 67% $0.00 0.0 921,990 67% $0.00 $0.00 2012 Total 0 0% $0 0% 0.0 0% 3,574,097 100% $0.00 0.0 1,371,087 100% $0.00 $0.00
2013 Yes 2 67% $800,893 53% 0.0 0% 1,124,337 31% $0.71 0.0 428,395 31% $1.87 $0.00 2013 No 1 33% $711,251 47% 0.1 100% 2,449,760 69% $0.29 0.0 942,692 69% $0.75 $0.11 2013 Total 3 100% $1,512,144 100% 0.1 100% 3,574,097 100% $0.42 0.0 1,371,087 100% $1.10 $0.07
2014 Yes 7 30% $9,047,808 42% 1.4 40% 1,104,894 31% $8.19 1.3 420,721 31% $21.51 $3.43 2014 No 16 70% $12,737,358 58% 2.2 60% 2,469,203 69% $5.16 0.9 950,366 69% $13.40 $2.30 2014 Total 23 100% $21,785,167 100% 3.6 100% 3,574,097 100% $6.10 1.0 1,371,087 100% $15.89 $2.65
2015 Yes 24 49% $17,102,026 51% 4.0 55% 1,123,207 31% $15.23 3.5 429,250 31% $39.84 $9.24 2015 No 25 51% $16,592,113 49% 3.3 45% 2,450,890 69% $6.77 1.4 941,837 69% $17.62 $3.52 2015 Total 49 100% $33,694,139 100% 7.3 100% 3,574,097 100% $9.43 2.0 1,371,087 100% $24.57 $5.31
2016 Yes 15 29% $15,127,000 42% 1.5 24% 1,167,312 33% $12.96 1.3 445,638 33% $33.94 $3.34 2016 No 37 71% $21,121,743 58% 4.8 76% 2,406,785 67% $8.78 2.0 925,449 67% $22.82 $5.16 2016 Total 52 100% $36,248,743 100% 6.3 100% 3,574,097 100% $10.14 1.8 1,371,087 100% $26.44 $4.57
2017 Yes 10 26% $6,422,413 42% 2.0 52% 1,167,312 33% $5.50 1.7 445,638 33% $14.41 $4.57 2017 No 28 74% $8,855,781 58% 1.9 48% 2,406,785 67% $3.68 0.8 925,449 67% $9.57 $2.03 2017 Total 38 100% $15,278,194 100% 3.9 100% 3,574,097 100% $4.27 1.1 1,371,087 100% $11.14 $2.86
Total Yes 58 35% $48,500,141 45% 8.9 42% 1,167,312 33% $41.55 7.7 445,638 33% $108.83 $20.06 Total No 107 65% $60,018,246 55% 12.3 58% 2,406,785 67% $24.94 5.1 925,449 67% $64.85 $13.24 Total Total 165 100% $108,518,387 100% 21.2 100% 3,574,097 100% $30.36 5.9 1,371,087 100% $79.15 $15.46

CONNECTICUT GREEN BANK 5. PROGRAMS – C-PACE
126
Societal Impacts Ratepayers in Connecticut continue to enjoy the societal benefits of C-PACE. In its 5 years of existence, the program has supported the creation of 1,272 job years, avoided the lifetime emission of 491,782 tons of carbon dioxide, 539,713 pounds of nitrous oxide, 494,403 pounds of sulfur oxide, and 37,927 pounds of particulate matter as illustrated by Tables 44 and 45.
Table 44. C-PACE Job Years Supported by FY Closed
2012 2013 2014 2015 2016 2017 Total Direct 0 9 109 142 179 56 495 Indirect and Induced 0 15 174 227 285 76 777 Total 0 24 282 369 464 132 1,272
Table 45. C-PACE Avoided Emissions by FY Closed 2012 2013 2014 2015 2016 2017 Total
CO2 Savings (tons)Annual - 283 4,700 7,725 8,587 3,497 24,792Lifetime - 4,224 86,427 171,292 155,257 74,582 491,782
NOx Savings (pounds)Annual - 386 6,077 8,237 9,240 3,442 27,382Lifetime - 5,811 113,223 180,977 165,015 74,688 539,713
SOx Savings (pounds)Annual - 477 6,872 7,764 8,141 2,451 25,706Lifetime - 7,148 128,033 168,384 137,591 53,246 494,403
PM 2.5 (pounds) Annual - 24 400 488 714 298 1,924 Lifetime - 360 7,497 10,467 13,158 6,444 37,927
Financing Program Commercial Property Assessed Clean Energy (C-PACE) is a structure through which commercial property owners can finance energy efficiency and clean energy improvements through a voluntary benefit assessment on their property, repaid through their municipality along with real property taxes. Alien, or voluntary benefit assessment, is placed on the improved property as security for the financing, and the Connecticut Green Bank requires lender consent from existing mortgage holders prior to approving a C-PACE project. It should be noted that, to date, 32 unique banks and 5 specialized lending institutions have provided lender consent for over 70 projects – demonstrating that existing mortgage holders see that C-PACE adds adding value to properties and increases net income to the business occupying the building as a result of lower energy prices.
The Connecticut Green Bank maintains a warehouse of capital from which it finances C-PACE transactions and sells to capital markets upon completion. Through the warehouse, funds are advanced to either the customer or the contractor during construction based on the project meeting certain deliverables. Once the project is completed, the construction advances convert to long term financing whereby the property owner pays a benefit assessment over time to the municipality at the same time real property taxes are paid on the property. As the benefit assessment payments are made by the property owners, they are then remitted from the associated municipalities to the Connecticut

CONNECTICUT GREEN BANK 5. PROGRAMS – C-PACE
127
Green Bank, or its designated servicer, to repay the capital providers for the energy improvements financed through C-PACE.
Financial Performance To date there have been no defaults and as of 6/30/2017, there are no delinquencies.
Marketing To accelerate the adoption of C-PACE to finance clean energy and energy efficiency projects, the Connecticut Green Bank has implemented marketing efforts that target specific industry verticals. The Green Bank used a group purchase model, in which it aggregated several C-PACE projects at auto retailers, and offered interest rate reductions on the portfolio of projects. Connecticut Green Bank also worked with the State of Connecticut’s Department of Economic and Community Development (DECD) to target manufacturing facilities through its Manufacturing Innovation Fund (MIF). Promoted via its multi touch “Energy on the Line” marketing campaign, the Green Bank was able to access $800,000 through MIF to provide manufacturers an incentive in the form of a grant equal to a 1% interest rate reduction, applied to the total project amount of a closed C-PACE project.
Connecticut Green Bank has also established relationships with contractors, and provided them with materials and resources to support their use of C-PACE. Green Bank provides co-brandable materials and other physical sales tools, as well as the Project Accelerator Service (PAS). PAS assists contractors in navigating the C-PACE process and developing projects, serving as both a means of originating projects for the Green Bank and a way of creating more skilled and active C-PACE contractors.

CONNECTICUT GREEN BANK 5. PROGRAMS – CT SOLAR LEASE
128
Case 2 – Solar Lease Description The Green Bank has used third-party ownership structures to deploy distributed solar generation in Connecticut both in the Residential and in the Commercial sectors. These funds are a unique combination of a tax equity investor and a syndicate of debt providers and the Green Bank to support solar PV installations (i.e., rooftop residential lease financing for solar PV and commercial leases and PPAs for rooftop, carport, and ground mount solar PV).
Residential leases were one of the first products to graduate from Green Bank funding, but the organization still actively pursues new projects in the Commercial, Industrial, and Institutional sector for its funds and performs asset management functions for the entire portfolio including the now closed Residential portion of the program.
Figure 6. Legal Structure and Flows of Capital for the CT Solar Lease86
The CT Solar Lease 2 fund was the second “solar PV fund” established using a combination of ratepayer funds and private capital. In developing this fund, which was fully utilized in 2017, the Green Bank sought to innovate both in the types of credits that would be underwritten and broaden the sources of capital in the fund. Before these innovations by the Green Bank, a fund had not been established that would underwrite residential solar PV installations as well as installations on a “commercial scale” such as for municipal and school buildings, community oriented not-for-profit structures (all of which can’t take advantage of Federal tax incentives due to their tax-exempt status) as well as a vast array of for profit enterprises. These commercial-scale projects were historically the most difficult to finance: too small to attract investment funds, and similarly if aggregated to a size worthy of investment, comprised of off-takers that for the most part are non-investment grade or “unrated” credits that are difficult to underwrite in a manner that would permit deploying solar PV at scale. By prudently assessing these risks and operational issues, the Green Bank could obtain the support of the tax equity
86 It should be noted that the Special Purpose Entity structure includes several entities – CT Solar Lease II, LLC and CEFIA Holdings, LLC that provide different functions.
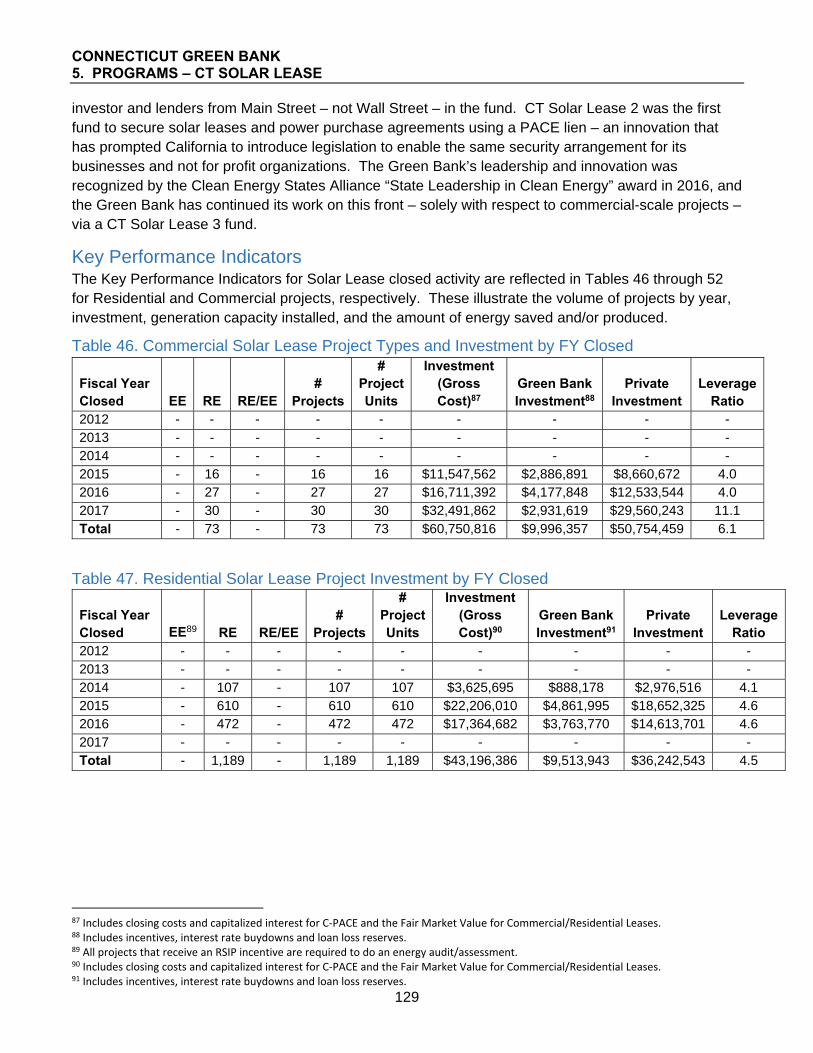
CONNECTICUT GREEN BANK 5. PROGRAMS – CT SOLAR LEASE
129
investor and lenders from Main Street – not Wall Street – in the fund. CT Solar Lease 2 was the first fund to secure solar leases and power purchase agreements using a PACE lien – an innovation that has prompted California to introduce legislation to enable the same security arrangement for its businesses and not for profit organizations. The Green Bank’s leadership and innovation was recognized by the Clean Energy States Alliance “State Leadership in Clean Energy” award in 2016, and the Green Bank has continued its work on this front – solely with respect to commercial-scale projects – via a CT Solar Lease 3 fund.
Key Performance Indicators The Key Performance Indicators for Solar Lease closed activity are reflected in Tables 46 through 52 for Residential and Commercial projects, respectively. These illustrate the volume of projects by year, investment, generation capacity installed, and the amount of energy saved and/or produced.
Table 46. Commercial Solar Lease Project Types and Investment by FY Closed
Fiscal Year Closed EE RE RE/EE
# Projects
# Project Units
Investment (Gross Cost)87
Green Bank Investment88
Private Investment
Leverage Ratio
2012 - - - - - - - - - 2013 - - - - - - - - - 2014 - - - - - - - - - 2015 - 16 - 16 16 $11,547,562 $2,886,891 $8,660,672 4.0 2016 - 27 - 27 27 $16,711,392 $4,177,848 $12,533,544 4.0 2017 - 30 - 30 30 $32,491,862 $2,931,619 $29,560,243 11.1 Total - 73 - 73 73 $60,750,816 $9,996,357 $50,754,459 6.1
Table 47. Residential Solar Lease Project Investment by FY Closed
Fiscal Year Closed EE89 RE RE/EE
# Projects
# Project Units
Investment (Gross Cost)90
Green Bank Investment91
Private Investment
Leverage Ratio
2012 - - - - - - - - - 2013 - - - - - - - - - 2014 - 107 - 107 107 $3,625,695 $888,178 $2,976,516 4.1 2015 - 610 - 610 610 $22,206,010 $4,861,995 $18,652,325 4.6 2016 - 472 - 472 472 $17,364,682 $3,763,770 $14,613,701 4.6 2017 - - - - - - - - - Total - 1,189 - 1,189 1,189 $43,196,386 $9,513,943 $36,242,543 4.5
87 Includes closing costs and capitalized interest for C‐PACE and the Fair Market Value for Commercial/Residential Leases. 88 Includes incentives, interest rate buydowns and loan loss reserves. 89 All projects that receive an RSIP incentive are required to do an energy audit/assessment. 90 Includes closing costs and capitalized interest for C‐PACE and the Fair Market Value for Commercial/Residential Leases. 91 Includes incentives, interest rate buydowns and loan loss reserves.

CONNECTICUT GREEN BANK 5. PROGRAMS – CT SOLAR LEASE
130
Table 48. Commercial Solar Lease Project Capacity, Generation and Savings92 by FY Closed Fiscal Year Closed
Installed Capacity
(kW) Expected Annual Generation (kWh)
Expected Lifetime Savings or
Generation (MWh)
Annual Saved / Produced
(MMBtu)
Lifetime Saved / Produced
(MMBtu) 2012 - - - - - 2013 - - - - - 2014 - - - - - 2015 3,533.7 4,024,143 100,604 12,975 324,370 2016 5,470.1 6,229,384 155,735 21,282 532,057 2017 10,573.0 12,040,487 301,012 41,082 1,027,054 Total 19,576.8 22,294,014 557,350 75,339 1,883,481
Table 49. Residential Solar Lease Project Capacity, Generation and Savings93 by FY Closed Fiscal Year Closed
Installed Capacity
(kW) Expected Annual Generation (kWh)
Expected Lifetime Savings or
Generation (MWh)
Annual Saved / Produced
(MMBtu)
Lifetime Saved / Produced
(MMBtu) 2012 - - - - - 2013 - - - - - 2014 817.1 930,503 23,263 3,175 79,372 2015 4,892.6 5,571,667 139,292 19,011 475,263 2016 3,840.6 4,373,704 109,343 14,923 373,077 2017 - - - - - Total 9,550.3 10,875,874 271,897 37,108 927,712
Table 50. Commercial Solar Lease Project Averages by FY Closed Fiscal Year Closed
Average Gross
System Cost
Average Amount
Financed
Average Installed
Capacity (kW)
Average Annual Saved / Produced
(MMBtu)
Average Finance Term
(months)
Average PPA Lease
Price 2012 - - - - - - 2013 - - - - - - 2014 - - - - - - 2015 $721,723 $721,723 220.9 811 20 $0.10 2016 $618,940 $618,940 202.6 788 20 $0.10 2017 $1,083,062 $1,083,062 352.4 1,369 20 $0.08 Total $832,203 $832,203 268.2 1,032 20 $0.09
92 The Green Bank currently estimates annual savings and is in the process or reviewing and updating this methodology to include actual savings where possible. 93 The Green Bank currently estimates annual savings and is in the process or reviewing and updating this methodology to include actual savings where possible.

CONNECTICUT GREEN BANK 5. PROGRAMS – CT SOLAR LEASE
131
Table 51. Residential Solar Lease Project Averages by FY Closed Fiscal Year Closed
Average Gross
System Cost
Average Amount
Financed
Average Installed
Capacity (kW)
Average Annual Saved / Produced
(MMBtu)
Average Finance Term
(months) Average
DTI
Average FICO Score
2012 - - - - - - - 2013 - - - - - - - 2014 $33,885 $38,182 7.6 30 240 30 785 2015 $36,403 $36,663 8.0 31 240 31 777 2016 $36,790 $36,679 8.1 32 240 35 776 2017 - - - - - - - Total $36,330 $36,806 8.0 31 240 33 777
Table 52. Residential Solar Lease Project Application Yield94 by FY Received Fiscal Year Received
Applications Received
Applications Approved
Applications Withdrawn
Applications Denied
Approved Rate
Denied Rate
2012 - - - - - - 2013 - - - - - - 2014 669 452 256 217 68% 32% 2015 1,813 1,466 619 347 81% 19% 2016 351 300 154 51 85% 15% 2017 - - - - - - Total 2,833 2,218 1,029 615 78% 22%
The types of Commercial end-use customers participating in the Solar Lease program are shown in Table 53 along with the square footage impacted where available.
Table 53. Types of End-Use Customers Participating in Commercial Solar Lease Property Type # of Properties Square Footage Agricultural 1 - Education 4 99,531 House of Worship 6 20,000 Industrial 2 - Municipal building 30 - Non-profit 15 - Nursing Home/Rehab Facility 1 - Office 10 24,100 Public assembly 2 11,000 Retail 1 - Warehouse & storage 1 - Total 73 154,631
94 Applications received are applications submitted to Renew Financial (servicer of the CT Solar Lease) for credit approval. Applications
approved are applications that have met the credit requirements for the program and can move to lease signing, pending formal
technical approval of the solar equipment by the Residential Solar Investment Program. Applications withdrawn are applications that
have been cancelled by the submitter due to the project not moving forward. Applications denied are applications that are not approved
because the customer does not meet underwriting requirements.

CONNECTICUT GREEN BANK 5. PROGRAMS – CT SOLAR LEASE
132
Area Median Income Band Penetration The CT Solar Lease program has been used to fund projects in economically diverse locations across the state as reflected by Table 54 and 55 for Metropolitan Statistical Area (MSA) Area Median Income (AMI). It should be noted that these Solar Lease funds are not part of an income targeted program.
Table 54. Commercial Solar Lease Activity in Metropolitan Statistical Area (MSA) Area Median Income (AMI) Bands by FY Closed95
Fiscal Year Closed
MSA AMI Band
# of Project Units
% Project Distribution
Investment (Gross System Cost)
% Investment Distribution
Installed Capacity
(MW)
% MW Distribution
Total Population
% Total Population Distribution
Project Units / 1,000
People
Investment / Total
Population
Watts / Total
Population 2012 <60% 0 0% 0 0% 0.0 0% 609,363 17% 0.0 $0.00 0.0 2012 60%-80% 0 0% 0 0% 0.0 0% 527,217 15% 0.0 $0.00 0.0 2012 80%-100% 0 0% 0 0% 0.0 0% 589,440 17% 0.0 $0.00 0.0 2012 100%-120% 0 0% 0 0% 0.0 0% 722,664 20% 0.0 $0.00 0.0 2012 >120% 0 0% 0 0% 0.0 0% 1,116,395 31% 0.0 $0.00 0.0 2012 Total 0 0% 0 0% 0.0 0% 3,565,079 100% 0.0 $0.00 0.0 2013 <60% 0 0% 0 0% 0.0 0% 604,433 17% 0.0 $0.00 0.0 2013 60%-80% 0 0% 0 0% 0.0 0% 568,952 16% 0.0 $0.00 0.0 2013 80%-100% 0 0% 0 0% 0.0 0% 588,813 16% 0.0 $0.00 0.0 2013 100%-120% 0 0% 0 0% 0.0 0% 690,591 19% 0.0 $0.00 0.0 2013 >120% 0 0% 0 0% 0.0 0% 1,131,305 32% 0.0 $0.00 0.0 2013 Total 0 0% 0 0% 0.0 0% 3,584,094 100% 0.0 $0.00 0.0 2014 <60% 0 0% 0 0% 0.0 0% 614,135 17% 0.0 $0.00 0.0 2014 60%-80% 0 0% 0 0% 0.0 0% 546,132 15% 0.0 $0.00 0.0 2014 80%-100% 0 0% 0 0% 0.0 0% 577,061 16% 0.0 $0.00 0.0 2014 100%-120% 0 0% 0 0% 0.0 0% 720,856 20% 0.0 $0.00 0.0 2014 >120% 0 0% 0 0% 0.0 0% 1,125,910 31% 0.0 $0.00 0.0 2014 Total 0 0% 0 0% 0.0 0% 3,584,094 100% 0.0 $0.00 0.0 2015 <60% 2 13% 416,000 4% 0.1 4% 662,619 18% 0.0 $0.63 0.2 2015 60%-80% 1 6% 300,000 3% 0.1 2% 489,826 14% 0.0 $0.61 0.2 2015 80%-100% 2 13% 1,904,000 16% 0.6 18% 650,163 18% 0.0 $2.93 1.0 2015 100%-120% 3 19% 1,238,000 11% 0.4 10% 631,741 18% 0.0 $1.96 0.6 2015 >120% 8 50% 7,689,562 67% 2.3 65% 1,150,974 32% 0.0 $6.68 2.0 2015 Total 16 100% 11,547,562 100% 3.5 100% 3,585,323 100% 0.0 $3.22 1.0 2016 <60% 0 0% 0 0% 0.0 0% 662,619 18% 0.0 $0.00 0.0 2016 60%-80% 1 4% 486,864 3% 0.1 2% 489,826 14% 0.0 $0.99 0.3 2016 80%-100% 5 19% 2,251,498 13% 0.7 13% 650,163 18% 0.0 $3.46 1.1 2016 100%-120% 7 26% 4,825,648 29% 1.6 29% 631,741 18% 0.0 $7.64 2.5
95 Excludes projects in unknown bands.

CONNECTICUT GREEN BANK 5. PROGRAMS – CT SOLAR LEASE
133
Fiscal Year Closed
MSA AMI Band
# of Project Units
% Project Distribution
Investment (Gross System Cost)
% Investment Distribution
Installed Capacity
(MW)
% MW Distribution
Total Population
% Total Population Distribution
Project Units / 1,000
People
Investment / Total
Population
Watts / Total
Population 2016 >120% 14 52% 9,147,382 55% 3.0 56% 1,150,974 32% 0.0 $7.95 2.6 2016 Total 27 100% 16,711,392 100% 5.5 100% 3,585,323 100% 0.0 $4.66 1.5 2017 <60% 4 13% 3,456,922 11% 1.5 14% 662,619 18% 0.0 $5.22 2.2 2017 60%-80% 3 10% 426,802 1% 0.1 1% 489,826 14% 0.0 $0.87 0.3 2017 80%-100% 5 17% 8,452,522 26% 2.8 26% 650,163 18% 0.0 $13.00 4.3 2017 100%-120% 8 27% 8,663,950 27% 2.7 25% 631,741 18% 0.0 $13.71 4.2 2017 >120% 10 33% 11,491,666 35% 3.5 33% 1,150,974 32% 0.0 $9.98 3.1 2017 Total 30 100% 32,491,862 100% 10.6 100% 3,585,323 100% 0.0 $9.06 2.9 Total <60% 6 8% 3,872,922 6% 1.6 8% 662,619 18% 0.0 $5.84 2.4 Total 60%-80% 5 7% 1,213,666 2% 0.3 2% 489,826 14% 0.0 $2.48 0.7 Total 80%-100% 12 16% 12,608,020 21% 4.1 21% 650,163 18% 0.0 $19.39 6.4 Total 100%-120% 18 25% 14,727,598 24% 4.6 24% 631,741 18% 0.0 $23.31 7.3 Total >120% 32 44% 28,328,610 47% 8.9 45% 1,150,974 32% 0.0 $24.61 7.7 Total Total 73 100% 60,750,816 100% 19.6 100% 3,585,323 100% 0.0 $16.94 5.5
Table 55. Residential Solar Lease Activity in Metropolitan Statistical Area (MSA) Area Median Income (AMI) Bands by FY Closed96
Fiscal Year Closed
MSA AMI Band
# of Project Units
% Project Distribution
Investment (Gross System Cost)
% Investment Distribution
Installed Capacity
(MW) % MW
Distribution
Total Owner Occupied 1-
4 Unit Households
% Total Household Distribution
Project Units / 1,000
Total Households
Investment / Total
Household
Watts / Total
Household
2012 <60% 0 0% 0 0% 0.0 0% 61,168 7% 0.0 $0.00 0.0 2012 60%-80% 0 0% 0 0% 0.0 0% 101,640 12% 0.0 $0.00 0.0 2012 80%-100% 0 0% 0 0% 0.0 0% 151,346 17% 0.0 $0.00 0.0 2012 100%-120% 0 0% 0 0% 0.0 0% 216,988 25% 0.0 $0.00 0.0 2012 >120% 0 0% 0 0% 0.0 0% 350,196 40% 0.0 $0.00 0.0 2012 Total 0 0% 0 0% 0.0 0% 881,338 100% 0.0 $0.00 0.0 2013 <60% 0 0% 0 0% 0.0 0% 59,494 7% 0.0 $0.00 0.0 2013 60%-80% 0 0% 0 0% 0.0 0% 109,189 12% 0.0 $0.00 0.0 2013 80%-100% 0 0% 0 0% 0.0 0% 150,603 17% 0.0 $0.00 0.0 2013 100%-120% 0 0% 0 0% 0.0 0% 203,157 23% 0.0 $0.00 0.0 2013 >120% 0 0% 0 0% 0.0 0% 351,633 40% 0.0 $0.00 0.0 2013 Total 0 0% 0 0% 0.0 0% 874,076 100% 0.0 $0.00 0.0 2014 <60% 0 0% 0 0% 0.0 0% 57,673 7% 0.0 $0.00 0.0 2014 60%-80% 6 6% 203,310 6% 0.0 5% 103,934 12% 0.1 $1.96 0.4
96 Excludes projects in unknown bands.
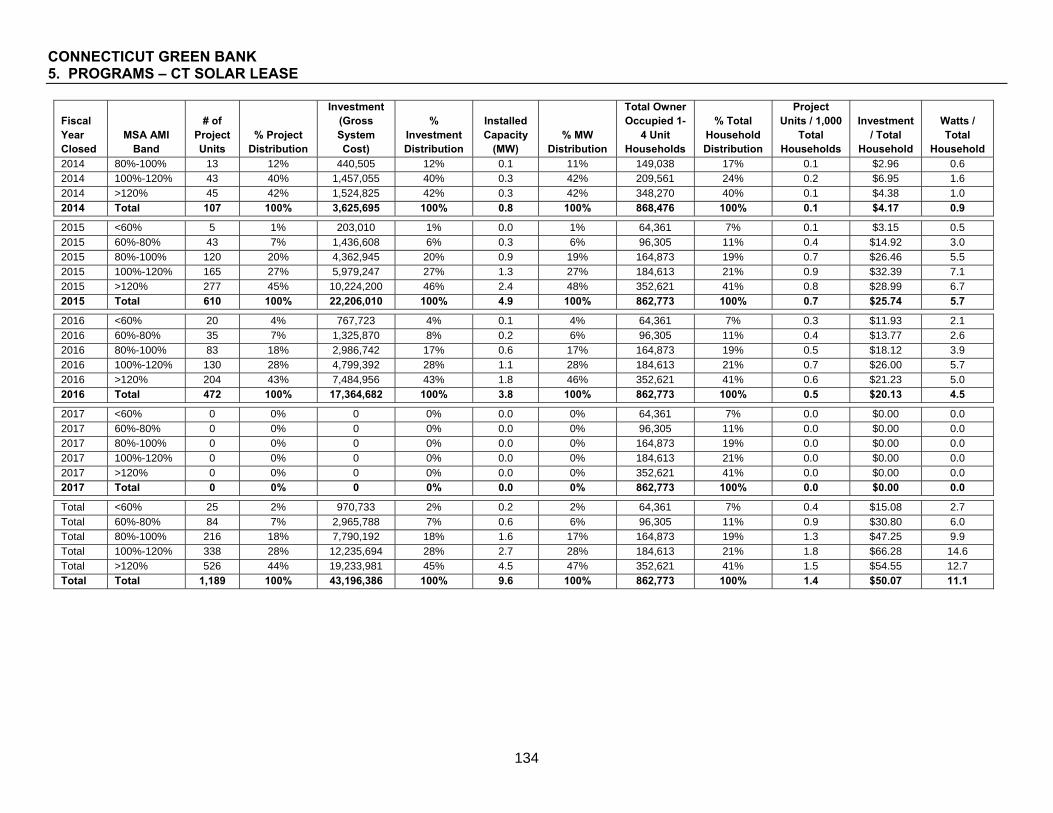
CONNECTICUT GREEN BANK 5. PROGRAMS – CT SOLAR LEASE
134
Fiscal Year Closed
MSA AMI Band
# of Project Units
% Project Distribution
Investment (Gross System Cost)
% Investment Distribution
Installed Capacity
(MW) % MW
Distribution
Total Owner Occupied 1-
4 Unit Households
% Total Household Distribution
Project Units / 1,000
Total Households
Investment / Total
Household
Watts / Total
Household 2014 80%-100% 13 12% 440,505 12% 0.1 11% 149,038 17% 0.1 $2.96 0.6 2014 100%-120% 43 40% 1,457,055 40% 0.3 42% 209,561 24% 0.2 $6.95 1.6 2014 >120% 45 42% 1,524,825 42% 0.3 42% 348,270 40% 0.1 $4.38 1.0 2014 Total 107 100% 3,625,695 100% 0.8 100% 868,476 100% 0.1 $4.17 0.9 2015 <60% 5 1% 203,010 1% 0.0 1% 64,361 7% 0.1 $3.15 0.5 2015 60%-80% 43 7% 1,436,608 6% 0.3 6% 96,305 11% 0.4 $14.92 3.0 2015 80%-100% 120 20% 4,362,945 20% 0.9 19% 164,873 19% 0.7 $26.46 5.5 2015 100%-120% 165 27% 5,979,247 27% 1.3 27% 184,613 21% 0.9 $32.39 7.1 2015 >120% 277 45% 10,224,200 46% 2.4 48% 352,621 41% 0.8 $28.99 6.7 2015 Total 610 100% 22,206,010 100% 4.9 100% 862,773 100% 0.7 $25.74 5.7 2016 <60% 20 4% 767,723 4% 0.1 4% 64,361 7% 0.3 $11.93 2.1 2016 60%-80% 35 7% 1,325,870 8% 0.2 6% 96,305 11% 0.4 $13.77 2.6 2016 80%-100% 83 18% 2,986,742 17% 0.6 17% 164,873 19% 0.5 $18.12 3.9 2016 100%-120% 130 28% 4,799,392 28% 1.1 28% 184,613 21% 0.7 $26.00 5.7 2016 >120% 204 43% 7,484,956 43% 1.8 46% 352,621 41% 0.6 $21.23 5.0 2016 Total 472 100% 17,364,682 100% 3.8 100% 862,773 100% 0.5 $20.13 4.5 2017 <60% 0 0% 0 0% 0.0 0% 64,361 7% 0.0 $0.00 0.0 2017 60%-80% 0 0% 0 0% 0.0 0% 96,305 11% 0.0 $0.00 0.0 2017 80%-100% 0 0% 0 0% 0.0 0% 164,873 19% 0.0 $0.00 0.0 2017 100%-120% 0 0% 0 0% 0.0 0% 184,613 21% 0.0 $0.00 0.0 2017 >120% 0 0% 0 0% 0.0 0% 352,621 41% 0.0 $0.00 0.0 2017 Total 0 0% 0 0% 0.0 0% 862,773 100% 0.0 $0.00 0.0 Total <60% 25 2% 970,733 2% 0.2 2% 64,361 7% 0.4 $15.08 2.7 Total 60%-80% 84 7% 2,965,788 7% 0.6 6% 96,305 11% 0.9 $30.80 6.0 Total 80%-100% 216 18% 7,790,192 18% 1.6 17% 164,873 19% 1.3 $47.25 9.9 Total 100%-120% 338 28% 12,235,694 28% 2.7 28% 184,613 21% 1.8 $66.28 14.6 Total >120% 526 44% 19,233,981 45% 4.5 47% 352,621 41% 1.5 $54.55 12.7 Total Total 1,189 100% 43,196,386 100% 9.6 100% 862,773 100% 1.4 $50.07 11.1

CONNECTICUT GREEN BANK 5. PROGRAMS – CT SOLAR LEASE
135
Table 56. Commercial Solar Lease Activity in Metropolitan Statistical Area (MSA) Area Median Income (AMI) Bands Above or Below 100% by FY Closed97
# Project Units MW Investment (Gross Cost) Fiscal Year Closed Total
Over 100% AMI
100% or Below
AMI
% at 100% or Below Total
Over 100% AMI
100% or Below AMI
% at 100% or Below Total
Over 100% AMI
100% or Below
AMI
% at 100% or Below
2012 0 0% 0.0 0.0 0.0 0% $0 $0 $0 0% 0 0% 2013 0 0% 0.0 0.0 0.0 0% $0 $0 $0 0% 0 0% 2014 0 0% 0.0 0.0 0.0 0% $0 $0 $0 0% 0 0% 2015 16 31% 3.5 2.7 0.9 24% $11,547,562 $8,927,562 $2,620,000 23% 16 31% 2016 27 22% 5.5 4.6 0.8 16% $16,711,392 $13,973,030 $2,738,362 16% 27 22% 2017 30 40% 10.6 6.2 4.4 41% $32,491,862 $20,155,616 $12,336,246 38% 30 40% Total 73 32% 19.6 13.5 6.1 31% $60,750,816 $43,056,208 $17,694,608 29% 73 32%
Table 57. Residential Solar Lease Activity in Metropolitan Statistical Area (MSA) Area Median Income (AMI) Bands Above or Below 100% by FY Closed98
# Project Units MW Investment (Gross Cost) Fiscal Year Closed Total
Over 100% AMI
100% or Below
AMI
% at 100% or Below Total
Over 100% AMI
100% or Below AMI
% at 100% or Below Total
Over 100% AMI
100% or Below
AMI
% at 100% or Below
2012 0 0% 0.0 0.0 0.0 0% $0 $0 $0 0% 0 0% 2013 0 0% 0.0 0.0 0.0 0% $0 $0 $0 0% 0 0% 2014 107 18% 0.8 0.7 0.1 16% $3,625,695 $2,981,880 $643,815 18% 107 18% 2015 610 28% 4.9 3.7 1.2 25% $22,206,010 $16,203,447 $6,002,563 27% 610 28% 2016 472 29% 3.8 2.8 1.0 27% $17,364,682 $12,284,348 $5,080,334 29% 472 29% 2017 0 0% 0.0 0.0 0.0 0% $0 $0 $0 0% 0 0% Total 1,189 27% 9.6 7.2 2.4 25% $43,196,386 $31,469,675 $11,726,712 27% 1,189 27%
97 Excludes projects in unknown bands. 98 Excludes projects in unknown bands.

CONNECTICUT GREEN BANK 5. PROGRAMS – CT SOLAR LEASE
136
Distressed Community Penetration For a breakdown of Solar Lease project volume and investment by census tracts categorized by Distressed Communities – see Tables 58 and 59. It should be noted that Solar Lease is not an income targeted program.
Table 58. Commercial Solar Lease Activity in Distressed Communities by FY Closed Fiscal Year Closed Distressed
# of Project Units
% Project Distribution
Investment (Gross
System Cost)
% Investment Distribution
Installed Capacity
(MW) % MW
Distribution
2010 Census
Population
% Population Distribution
Investment / Capita
Watts / Capita
2010 Census
Households
% Household Distribution
Investment / Household
Watts / Household
2012 Yes 0 0% $0 0% 0.0 0% 1,172,186 33% $0.00 0.0 449,097 33% $0.00 $0.00 2012 No 0 0% $0 0% 0.0 0% 2,401,911 67% $0.00 0.0 921,990 67% $0.00 $0.00 2012 Total 0 0% $0 0% 0.0 0% 3,574,097 100% $0.00 0.0 1,371,087 100% $0.00 $0.00
2013 Yes 0 0% $0 0% 0.0 0% 1,124,337 31% $0.00 0.0 428,395 31% $0.00 $0.00 2013 No 0 0% $0 0% 0.0 0% 2,449,760 69% $0.00 0.0 942,692 69% $0.00 $0.00 2013 Total 0 0% $0 0% 0.0 0% 3,574,097 100% $0.00 0.0 1,371,087 100% $0.00 $0.00
2014 Yes 0 0% $0 0% 0.0 0% 1,104,894 31% $0.00 0.0 420,721 31% $0.00 $0.00 2014 No 0 0% $0 0% 0.0 0% 2,469,203 69% $0.00 0.0 950,366 69% $0.00 $0.00 2014 Total 0 0% $0 0% 0.0 0% 3,574,097 100% $0.00 0.0 1,371,087 100% $0.00 $0.00
2015 Yes 2 13% $416,000 4% 0.1 4% 1,123,207 31% $0.37 0.1 429,250 31% $0.97 $0.33 2015 No 14 88% $11,131,562 96% 3.4 96% 2,450,890 69% $4.54 1.4 941,837 69% $11.82 $3.60 2015 Total 16 100% $11,547,562 100% 3.5 100% 3,574,097 100% $3.23 1.0 1,371,087 100% $8.42 $2.58
2016 Yes 1 4% $486,864 3% 0.1 2% 1,167,312 33% $0.42 0.1 445,638 33% $1.09 $0.30 2016 No 26 96% $16,224,528 97% 5.3 98% 2,406,785 67% $6.74 2.2 925,449 67% $17.53 $5.76 2016 Total 27 100% $16,711,392 100% 5.5 100% 3,574,097 100% $4.68 1.5 1,371,087 100% $12.19 $3.99
2017 Yes 2 7% $2,889,250 9% 1.3 12% 1,167,312 33% $2.48 1.1 445,638 33% $6.48 $2.89 2017 No 28 93% $29,602,612 91% 9.3 88% 2,406,785 67% $12.30 3.9 925,449 67% $31.99 $10.03 2017 Total 30 100% $32,491,862 100% 10.6 100% 3,574,097 100% $9.09 3.0 1,371,087 100% $23.70 $7.71
Total Yes 5 7% $3,792,114 6% 1.6 8% 1,167,312 33% $3.25 1.3 445,638 33% $8.51 $3.51 Total No 68 93% $56,958,702 94% 18.0 92% 2,406,785 67% $23.67 7.5 925,449 67% $61.55 $19.46 Total Total 73 100% $60,750,816 100% 19.6 100% 3,574,097 100% $17.00 5.5 1,371,087 100% $44.31 $14.28

CONNECTICUT GREEN BANK 5. PROGRAMS – CT SOLAR LEASE
137
Table 59. Residential Solar Lease Activity in Distressed Communities by FY Closed Fiscal Year Closed Distressed
# of Project Units
% Project Distribution
Investment (Gross
System Cost)
% Investment Distribution
Installed Capacity
(MW) % MW
Distribution
2010 Census
Population
% Population Distribution
Investment / Capita
Watts / Capita
2010 Census
Households
% Household Distribution
Investment / Household
Watts / Household
2012 Yes 0 0% $0 0% 0.0 0% 1,172,186 33% $0.00 0.0 449,097 33% $0.00 $0.00 2012 No 0 0% $0 0% 0.0 0% 2,401,911 67% $0.00 0.0 921,990 67% $0.00 $0.00 2012 Total 0 0% $0 0% 0.0 0% 3,574,097 100% $0.00 0.0 1,371,087 100% $0.00 $0.00
2013 Yes 0 0% $0 0% 0.0 0% 1,124,337 31% $0.00 0.0 428,395 31% $0.00 $0.00 2013 No 0 0% $0 0% 0.0 0% 2,449,760 69% $0.00 0.0 942,692 69% $0.00 $0.00 2013 Total 0 0% $0 0% 0.0 0% 3,574,097 100% $0.00 0.0 1,371,087 100% $0.00 $0.00
2014 Yes 15 14% $508,275 14% 0.1 12% 1,104,894 31% $0.46 0.1 420,721 31% $1.21 $0.24 2014 No 92 86% $3,117,420 86% 0.7 88% 2,469,203 69% $1.26 0.3 950,366 69% $3.28 $0.75 2014 Total 107 100% $3,625,695 100% 0.8 100% 3,574,097 100% $1.01 0.2 1,371,087 100% $2.64 $0.60
2015 Yes 95 16% $3,474,590 16% 0.7 15% 1,123,207 31% $3.09 0.6 429,250 31% $8.09 $1.67 2015 No 515 84% $18,731,420 84% 4.2 85% 2,450,890 69% $7.64 1.7 941,837 69% $19.89 $4.43 2015 Total 610 100% $22,206,010 100% 4.9 100% 3,574,097 100% $6.21 1.4 1,371,087 100% $16.20 $3.57
2016 Yes 97 21% $3,462,405 20% 0.8 20% 1,167,312 33% $2.97 0.6 445,638 33% $7.77 $1.69 2016 No 375 79% $13,902,277 80% 3.1 80% 2,406,785 67% $5.78 1.3 925,449 67% $15.02 $3.34 2016 Total 472 100% $17,364,682 100% 3.8 100% 3,574,097 100% $4.86 1.1 1,371,087 100% $12.66 $2.80
2017 Yes 0 0% $0 0% 0.0 0% 1,167,312 33% $0.00 0.0 445,638 33% $0.00 $0.00 2017 No 0 0% $0 0% 0.0 0% 2,406,785 67% $0.00 0.0 925,449 67% $0.00 $0.00 2017 Total 0 0% $0 0% 0.0 0% 3,574,097 100% $0.00 0.0 1,371,087 100% $0.00 $0.00
Total Yes 207 17% $7,445,270 17% 1.6 16% 1,167,312 33% $6.38 1.3 445,638 33% $16.71 $3.52 Total No 982 83% $35,751,116 83% 8.0 84% 2,406,785 67% $14.85 3.3 925,449 67% $38.63 $8.63 Total Total 1,189 100% $43,196,386 100% 9.6 100% 3,574,097 100% $12.09 2.7 1,371,087 100% $31.51 $6.97
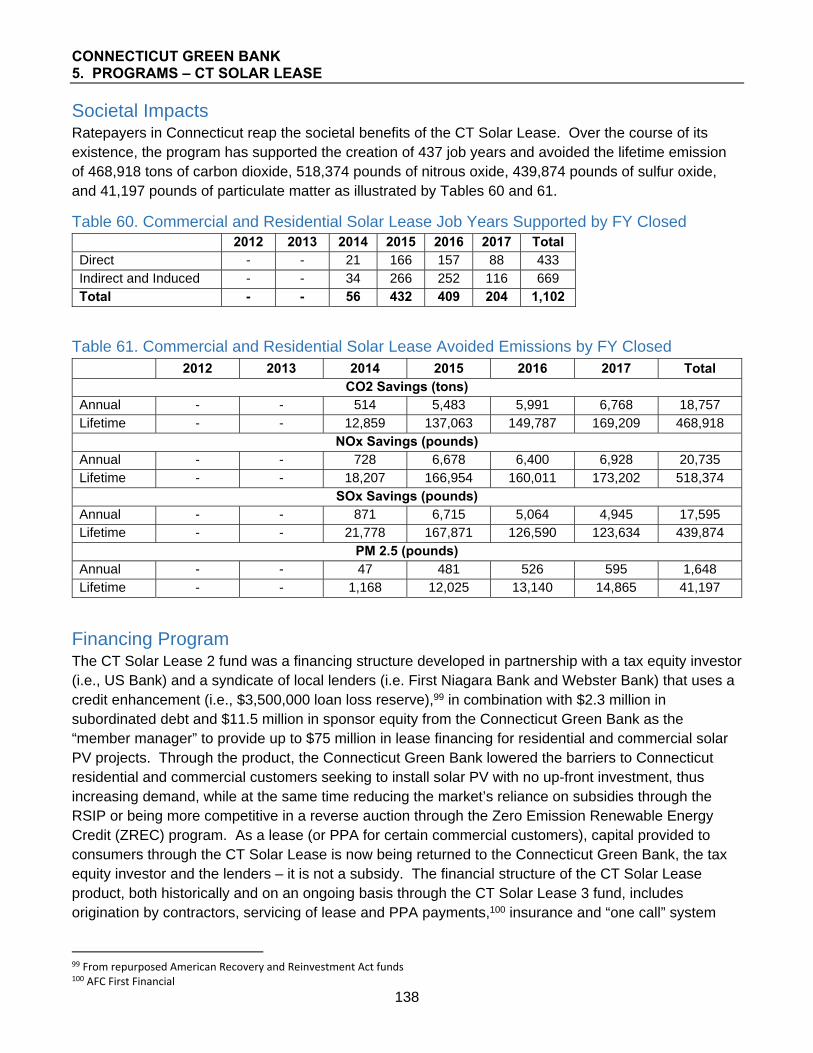
CONNECTICUT GREEN BANK 5. PROGRAMS – CT SOLAR LEASE
138
Societal Impacts Ratepayers in Connecticut reap the societal benefits of the CT Solar Lease. Over the course of its existence, the program has supported the creation of 437 job years and avoided the lifetime emission of 468,918 tons of carbon dioxide, 518,374 pounds of nitrous oxide, 439,874 pounds of sulfur oxide, and 41,197 pounds of particulate matter as illustrated by Tables 60 and 61.
Table 60. Commercial and Residential Solar Lease Job Years Supported by FY Closed
2012 2013 2014 2015 2016 2017 Total Direct - - 21 166 157 88 433 Indirect and Induced - - 34 266 252 116 669 Total - - 56 432 409 204 1,102
Table 61. Commercial and Residential Solar Lease Avoided Emissions by FY Closed 2012 2013 2014 2015 2016 2017 Total
CO2 Savings (tons)Annual - - 514 5,483 5,991 6,768 18,757 Lifetime - - 12,859 137,063 149,787 169,209 468,918
NOx Savings (pounds) Annual - - 728 6,678 6,400 6,928 20,735 Lifetime - - 18,207 166,954 160,011 173,202 518,374
SOx Savings (pounds) Annual - - 871 6,715 5,064 4,945 17,595 Lifetime - - 21,778 167,871 126,590 123,634 439,874
PM 2.5 (pounds) Annual - - 47 481 526 595 1,648 Lifetime - - 1,168 12,025 13,140 14,865 41,197
Financing Program The CT Solar Lease 2 fund was a financing structure developed in partnership with a tax equity investor (i.e., US Bank) and a syndicate of local lenders (i.e. First Niagara Bank and Webster Bank) that uses a credit enhancement (i.e., $3,500,000 loan loss reserve),99 in combination with $2.3 million in subordinated debt and $11.5 million in sponsor equity from the Connecticut Green Bank as the “member manager” to provide up to $75 million in lease financing for residential and commercial solar PV projects. Through the product, the Connecticut Green Bank lowered the barriers to Connecticut residential and commercial customers seeking to install solar PV with no up-front investment, thus increasing demand, while at the same time reducing the market’s reliance on subsidies through the RSIP or being more competitive in a reverse auction through the Zero Emission Renewable Energy Credit (ZREC) program. As a lease (or PPA for certain commercial customers), capital provided to consumers through the CT Solar Lease is now being returned to the Connecticut Green Bank, the tax equity investor and the lenders – it is not a subsidy. The financial structure of the CT Solar Lease product, both historically and on an ongoing basis through the CT Solar Lease 3 fund, includes origination by contractors, servicing of lease and PPA payments,100 insurance and “one call” system
99 From repurposed American Recovery and Reinvestment Act funds 100 AFC First Financial

CONNECTICUT GREEN BANK 5. PROGRAMS – CT SOLAR LEASE
139
performance and insurance resolution,101 and financing features in combination with the support of the Connecticut Green Bank.
Financial Performance To date there are no defaults and as of 6/30/2017 there are 15 delinquencies totaling $54,970 or 0.1% of the Commercial Solar Lease portfolio. To date there is 1 default with an original principal balance of $34,940 or 0.1% of the Residential Solar Lease portfolio and as of 6/30/2017 there are no delinquencies.
The household customers that accessed the CT Solar Lease since its launch in 2014 had varying credit scores – see Table 62.
Table 62. Credit Score Ranges of Household Customers Using the CT Solar Lease by FY Closed
-639 640-679 680-699 700-719 720+ Fiscal Year Closed
# Projects
% of Total
# Projects
% of Total
# Projects
% of Total
# Projects
% of Total
# Projects
% of Total
Total # Projects
2014 - 0.0% 4 3.7% - 0.0% 5 4.7% 98 91.6% 107 2015 - 0.0% 26 4.3% 23 3.8% 39 6.4% 522 85.6% 610 2016 1 0.2% 15 3.2% 16 3.4% 34 7.2% 406 86.0% 472 Total 1 0.1% 45 3.8% 39 3.3% 78 6.6% 1,026 86.3% 1,189
Marketing To accelerate the deployment of residential solar PV through the RSIP and the uptake of the CT Solar Lease financing product, the Connecticut Green Bank implemented Solarize Connecticut. The Green Bank sponsored Solarize programs are designed to use a combination of group purchasing, time-limited offers, and grassroots outreach, while local clean energy advocates volunteer and coordinate with their towns to help speed the process – see Table 63. The Green Bank also implemented channel marketing through the solar installer channel to support residential and commercial installers and their ability to grow their businesses by providing the CT Solar Lease product to their customers.
Table 63. Number of Projects, Investment, and Installed Capacity through Green Bank Solarize Connecticut for the CT Solar Lease Financing Product
Solarize # of Projects Investment (Gross Cost) Installed Capacity (MW) Solarize 325 $11,878,017 2.5 Not Solarize 864 $31,318,369 7.0 Total 1,189 $43,196,386 9.6 % Solarize 27% 27% 27%
The Green Bank Solarize Connecticut program provided a marketing channel and origination catalyst for the CT Solar Lease comprising 27 percent of the total projects, investment, and installed capacity.
101 Assurant

CONNECTICUT GREEN BANK 5. PROGRAMS – RESIDENTIAL SOLAR INVESTMENT PROGRAM
140
Case 3 – Residential Solar Investment Program Description The RSIP is a subsidy program that provides incentives to reduce the cost for homeowners to own solar photovoltaic (PV) systems or for third party owners (TPOs) to provide clean electricity from solar PV systems through leases or power purchase agreements (PPAs) with homeowners. Incentives are provided either upfront (i.e., through an expected performance based buy-down or EPBB) for homeowner-owned systems or are paid out over time102 based on system production (i.e., through a performance based incentive or PBI) for third-party owned projects. With either incentive type, the Renewable Energy Credits (RECs) are owned by the Connecticut Green Bank.
Figure 7. RSIP Legal Structure and Flows of Capital103
The subsidy under the RSIP has decreased over time – see Table 64, supporting the goal of reducing market reliance on rebates and incentives while moving it towards innovative low-cost financing and sustainable orderly development.
Table 64. RSIP Subsidy by Step and Incentive Type
RSIP Subsidy by Step Start Date
EPBB ($/W)
PBI ($/kWh)
LMI ($/kWh)
≤5 kW 5 to 10
kW >10 kW, ≤ 20 kW ≤10 kW
>10 kW, ≤ 20 kW ≤10 kW
>10 kW, ≤ 20 kW
Step 1 3/2/2012 $2.450 $1.250 $0.000 $0.300 $0.000 N/A N/A Step 2 5/8/2012 $2.275 $1.075 $0.000 $0.300 $0.000 N/A N/A
Step 3 1/4/2013 EPBB,
4/1/2013 PBI $1.750 $0.550 $0.000 $0.225 $0.000 N/A N/A
Step 4 1/6/2014 $1.250 $0.750 $0.000 $0.180 $0.000 N/A N/A Step 5 9/1/2014 $0.800 $0.400 $0.125 $0.060 N/A N/A Step 6 1/1/2015 $0.675 $0.400 $0.080 $0.060 N/A N/A Step 7 4/11/2015 $0.540 $0.400 $0.064 $0.060 N/A N/A Step 8 8/8/2015 $0.540 $0.400 $0.054 $0.054 $0.110 $0.055 Step 9 2/1/2016 $0.513 $0.400 $0.046 $0.046 $0.110 $0.055 Step 10 9/1/2016 $0.487 $0.400 $0.039 $0.039 $0.110 $0.055 Step 11 8/1/2017 $0.487 $0.400 $0.039 $0.039 $0.110 $0.055
102 The PBI is currently paid out quarterly over a period of six years. 103 The Green Bank incentive is issued to the Contractor on behalf of the Customer. In the case of Third‐Party Owned systems, RECs flow from the Contractor to the Connecticut Green Bank.

CONNECTICUT GREEN BANK 5. PROGRAMS – RESIDENTIAL SOLAR INVESTMENT PROGRAM
141
Key Performance Indicators The Key Performance Indicators for RSIP closed activity are reflected in Tables 65 through 70. These illustrate the volume of projects by year, investment, generation capacity installed, and the amount of energy saved and/or produced. It also breaks down the volume of projects by energy efficiency, renewable generation, or both.
Table 65. RSIP Project Types and Investment by FY Closed Fiscal Year Closed EE104 RE RE/EE
# Projects
# Project Units
Investment (Gross Cost)105
Green Bank Investment106
Private Investment
Leverage Ratio
2012 - 417 - 417 417 $14,989,569 $4,804,743 $10,184,827 3.1 2013 - 1,115 - 1,115 1,115 $35,584,155 $11,953,564 $23,630,591 3.0 2014 - 2,388 - 2,388 2,388 $74,052,944 $20,106,693 $53,946,251 3.7 2015 - 6,445 - 6,445 6,445 $216,516,944 $33,464,664 $183,052,280 6.5 2016 - 7,237 - 7,237 7,237 $232,901,017 $19,856,255 $213,044,762 11.7 2017 - 5,024 - 5,024 5,024 $138,068,370 $12,867,584 $125,200,786 10.7 Total - 22,626 - 22,626 22,626 $712,113,000 $103,053,503 $609,059,497 6.9
Table 66. RSIP Project Capacity, Generation and Savings by FY Closed
Fiscal Year Closed
Installed Capacity
(kW)
Expected Annual Generation
(kWh)
Expected Lifetime
Savings or Generation
(MWh)
Annual Saved /
Produced (MMBtu)
Lifetime Saved /
Produced (MMBtu)
Annual Cost
Savings Lifetime Cost
Savings 2012 2,878.1 3,277,578 81,939 11,183 279,577 $499,900 $12,497,490 2013 7,924.2 9,024,056 225,601 30,790 769,752 $1,336,662 $33,416,550 2014 17,170.3 19,553,593 488,840 66,717 1,667,922 $2,862,734 $71,568,360 2015 49,120.3 55,938,159 1,398,454 190,861 4,771,525 $7,726,266 $193,156,650 2016 56,449.2 64,284,374 1,607,109 219,338 5,483,457 $8,675,716 $216,892,890 2017 38,929.3 44,332,743 1,108,319 151,263 3,781,583 $6,022,771 $150,569,280 Total 172,471.5 196,410,503 4,910,263 670,153 16,753,816 $27,124,049 $678,101,220
Table 67. RSIP Project Averages by FY Closed
Fiscal Year Closed
Average Installed Capacity
(kW)
Average Annual Saved
/ Produced (MMBtu)
Average Incentive Amount
Average Gross
Installed Cost
Incentive ($/W)
Installed Cost ($/W)
Incentive % of
Gross Cost
Net Cost to
Customer 2012 6.9 27 $11,522 $35,946 $1.67 $5.21 32% $24,424.042013 7.1 28 $10,721 $31,914 $1.51 $4.49 34% $21,193.362014 7.2 28 $8,420 $31,010 $1.17 $4.31 27% $22,590.562015 7.6 30 $5,192 $33,595 $0.68 $4.41 15% $28,402.22
104 All projects that receive an RSIP incentive are required to do an energy audit/assessment. A significant percentage of these are completed through the utility administered Home Energy Solutions Program, which provides an evaluation of a home’s energy performance, implementation of energy savings measures such as air sealing, duct sealing, installation of energy‐efficient lighting, and water saving measures, as well as recommendations for deeper energy saving measures. 105 Includes closing costs and capitalized interest for C‐PACE and the Fair Market Value for Commercial/Residential Leases. 106 Includes incentives, interest rate buydowns and loan loss reserves.

CONNECTICUT GREEN BANK 5. PROGRAMS – RESIDENTIAL SOLAR INVESTMENT PROGRAM
142
Fiscal Year Closed
Average Installed Capacity
(kW)
Average Annual Saved
/ Produced (MMBtu)
Average Incentive Amount
Average Gross
Installed Cost
Incentive ($/W)
Installed Cost ($/W)
Incentive % of
Gross Cost
Net Cost to
Customer 2016 7.8 30 $2,744 $32,182 $0.35 $4.13 9% $29,438.272017 7.7 30 $2,561 $27,482 $0.33 $3.55 9% $24,920.54Total 7.6 30 $4,555 $31,473 $0.60 $4.13 14% $26,918.57
Table 68. RSIP Project Application Yield107 by FY Received Fiscal Year Received
Applications Received
Applications in Review
Applications Approved
Applications Withdrawn
Applications Denied
Approved Rate
Denied Rate
2012 382 - 343 52 39 90% 10% 2013 1,279 - 1,262 125 17 99% 1% 2014 2,797 - 2,782 251 15 99% 1% 2015 7,872 - 7,852 1,385 20 100% 0% 2016 8,711 - 8,681 1,494 30 100% 0% 2017 5,308 93 5,181 265 34 99% 1% Total 26,349 93 26,101 3,572 155 99% 1%
Table 69. RSIP Systems Closed through the Subsidy by Step RSIP Subsidy by Step
Installed Capacity
(kW) Incentive Amount
Gross Installed
Cost Incentive
($/W)
Installed Cost ($/W)
Incentive % of Gross
Cost Net Cost to Customer
None 921.7 $1,379,986 $5,026,558 $1.50 $5.45 27% $3,646,572 Step 1 1,380.7 $2,470,307 $7,222,670 $1.79 $5.23 34% $4,752,363 Step 2 5,991.8 $9,762,264 $26,992,954 $1.63 $4.50 36% $17,230,690 Step 3 13,164.1 $16,177,276 $56,168,196 $1.23 $4.27 29% $39,990,920 Step 4 19,415.0 $20,055,054 $85,478,583 $1.03 $4.40 23% $65,423,529 Step 5 13,513.1 $10,073,966 $60,318,503 $0.75 $4.46 17% $50,244,537 Step 6 12,306.8 $6,308,807 $54,482,961 $0.51 $4.43 12% $48,174,153 Step 7 19,252.2 $7,695,213 $83,959,008 $0.40 $4.36 9% $76,263,795 Step 8 28,578.8 $10,169,200 $119,155,860 $0.36 $4.17 9% $108,986,660Step 9 28,797.5 $9,502,809 $111,704,105 $0.33 $3.88 9% $102,201,296Step 10 29,149.8 $9,458,622 $101,603,604 $0.32 $3.49 9% $92,144,982 Total 172,471.5 $103,053,503 $712,113,000 $0.60 $4.13 14% $609,059,497
Table 70. RSIP Third Party Owned vs Homeowner-owned Systems There are 16,070 PBI systems that are owned by a third party representing 71% of the RSIP.
107 Applications Received are applications for incentives submitted to RSIP for review. Applications in Review are submitted applications yet to be reviewed, approved or rejected. Applications Withdrawn are those that have been cancelled by the submitter due to the project not moving forward (e.g., customer cancellation) or due to the incentive expiring before the project is installed (incentives are reserved for 270 days). Applications Denied are those that are not approved for an incentive because the project does not meet RSIP requirements. The Approved Rate reflects the number of Applications Approved relative to the number of Applications Received.

CONNECTICUT GREEN BANK 5. PROGRAMS – RESIDENTIAL SOLAR INVESTMENT PROGRAM
143
Area Median Income Band Penetration For a breakdown of RSIP project volume and investment by census tracts categorized by Area Median Income (AMI) bands – see Table 71. It should be noted that RSIP is not an income targeted program. However, following the UCONN study108 in December of 2014, the Green Bank Board of Directors approved the Income-Targeted incentive to better penetrate these tracts and to create inclusive prosperity. This special incentive is one of the methods through which the Green Bank has expanded its reach of previously underserved communities.
Table 71. RSIP Activity in Metropolitan Statistical Area (MSA) Area Median Income (AMI) Bands by FY Closed109
Fiscal Year Closed
MSA AMI Band
# of Project Units
% Project Distribution
Investment (Gross System Cost)
% Investment Distribution
Installed Capacity
(MW) % MW
Distribution
Total Owner Occupied 1-
4 Unit Households
% Total Household Distribution
Project Units / 1,000
Total Households
Investment / Total
Household
Watts / Total
Household
2012 <60% 10 2% 279,743 2% 0.1 2% 61,168 7% 0.2 $4.57 0.9 2012 60%-80% 10 2% 242,605 2% 0.1 2% 101,640 12% 0.1 $2.39 0.5 2012 80%-100% 48 12% 1,644,387 11% 0.3 12% 151,346 17% 0.3 $10.87 2.2 2012 100%-120% 118 28% 4,193,070 28% 0.8 28% 216,988 25% 0.5 $19.32 3.7 2012 >120% 231 55% 8,629,764 58% 1.6 57% 350,196 40% 0.7 $24.64 4.7 2012 Total 417 100% 14,989,569 100% 2.9 100% 881,338 100% 0.5 $17.01 3.3 2013 <60% 20 2% 415,069 1% 0.1 1% 59,494 7% 0.3 $6.98 1.5 2013 60%-80% 56 5% 1,683,198 5% 0.4 5% 109,189 12% 0.5 $15.42 3.4 2013 80%-100% 128 11% 3,911,597 11% 0.8 11% 150,603 17% 0.8 $25.97 5.5 2013 100%-120% 221 20% 6,753,881 19% 1.5 19% 203,157 23% 1.1 $33.24 7.2 2013 >120% 690 62% 22,820,410 64% 5.2 65% 351,633 40% 2.0 $64.90 14.7 2013 Total 1,115 100% 35,584,155 100% 7.9 100% 874,076 100% 1.3 $40.71 9.1 2014 <60% 74 3% 1,839,839 2% 0.4 2% 57,673 7% 1.3 $31.90 7.2 2014 60%-80% 159 7% 4,362,397 6% 1.0 6% 103,934 12% 1.5 $41.97 9.5 2014 80%-100% 388 16% 11,333,704 15% 2.6 15% 149,038 17% 2.6 $76.05 17.3 2014 100%-120% 610 26% 19,476,939 26% 4.5 26% 209,561 24% 2.9 $92.94 21.3 2014 >120% 1,157 48% 37,040,065 50% 8.7 51% 348,270 40% 3.3 $106.35 25.1 2014 Total 2,388 100% 74,052,944 100% 17.2 100% 868,476 100% 2.7 $85.27 19.8 2015 <60% 265 4% 6,762,903 3% 1.5 3% 64,361 7% 4.1 $105.08 24.0 2015 60%-80% 597 9% 17,468,491 8% 4.0 8% 96,305 11% 6.2 $181.39 41.3 2015 80%-100% 1,113 17% 36,624,003 17% 8.1 17% 164,873 19% 6.8 $222.13 49.2 2015 100%-120% 1,680 26% 57,417,389 27% 12.8 26% 184,613 21% 9.1 $311.01 69.3 2015 >120% 2,790 43% 98,244,158 45% 22.7 46% 352,621 41% 7.9 $278.61 64.4 2015 Total 6,445 100% 216,516,944 100% 49.1 100% 862,773 100% 7.5 $250.95 56.9
108 http://www.ctcleanenergy.com/Portals/0/board‐materials/7cii_Role of a Green Bank_Market Analysis_Low Income Solar and Housing_Memo_121214.pdf 109 Excludes projects in unknown bands.

CONNECTICUT GREEN BANK 5. PROGRAMS – RESIDENTIAL SOLAR INVESTMENT PROGRAM
144
Fiscal Year Closed
MSA AMI Band
# of Project Units
% Project Distribution
Investment (Gross System Cost)
% Investment Distribution
Installed Capacity
(MW) % MW
Distribution
Total Owner Occupied 1-
4 Unit Households
% Total Household Distribution
Project Units / 1,000
Total Households
Investment / Total
Household
Watts / Total
Household 2016 <60% 652 9% 16,993,034 7% 4.1 7% 64,361 7% 10.1 $264.03 63.5 2016 60%-80% 890 12% 25,048,687 11% 6.3 11% 96,305 11% 9.2 $260.10 65.4 2016 80%-100% 1,421 20% 44,726,687 19% 10.7 19% 164,873 19% 8.6 $271.28 65.0 2016 100%-120% 1,734 24% 55,661,524 24% 13.5 24% 184,613 21% 9.4 $301.50 73.1 2016 >120% 2,540 35% 90,471,085 39% 21.9 39% 352,621 41% 7.2 $256.57 62.0 2016 Total 7,237 100% 232,901,017 100% 56.4 100% 862,773 100% 8.4 $269.94 65.4 2017 <60% 707 14% 17,609,501 13% 4.5 12% 64,361 7% 11.0 $273.61 70.4 2017 60%-80% 779 16% 19,090,287 14% 5.4 14% 96,305 11% 8.1 $198.23 56.1 2017 80%-100% 992 20% 26,882,997 20% 7.5 19% 164,873 19% 6.0 $163.05 45.8 2017 100%-120% 965 19% 26,998,694 20% 7.8 20% 184,613 21% 5.2 $146.24 42.1 2017 >120% 1,569 31% 47,142,883 34% 13.6 35% 352,621 41% 4.4 $133.69 38.5 2017 Total 5,012 100% 137,724,361 100% 38.8 100% 862,773 100% 5.8 $159.63 45.0 Total <60% 1,728 8% 43,900,089 6% 10.7 6% 64,361 7% 26.8 $682.09 166.6 Total 60%-80% 2,491 11% 67,895,665 10% 17.1 10% 96,305 11% 25.9 $705.01 177.4 Total 80%-100% 4,090 18% 125,123,375 18% 30.1 17% 164,873 19% 24.8 $758.91 182.7 Total 100%-120% 5,328 24% 170,501,497 24% 40.8 24% 184,613 21% 28.9 $923.56 221.0 Total >120% 8,977 40% 304,348,365 43% 73.6 43% 352,621 41% 25.5 $863.10 208.9 Total Total 22,614 100% 711,768,991 100% 172.4 100% 862,773 100% 26.2 $824.98 199.8
Table 72. RSIP Activity in Metropolitan Statistical Area (MSA) Area Median Income (AMI) Bands Above or Below 100% by FY Closed110 # Project Units MW Investment (Gross Cost) Fiscal Year Closed Total
Over 100% AMI
100% or Below
AMI
% at 100% or Below Total
Over 100% AMI
100% or Below
AMI
% at 100% or Below Total
Over 100% AMI
100% or Below AMI
% at 100% or Below
2012 417 349 68 16% 2.9 2.4 0.4 15% $14,989,569 $12,822,834 $2,166,735 14% 2013 1,115 911 204 18% 7.9 6.6 1.3 16% $35,584,155 $29,574,291 $6,009,864 17% 2014 2,388 1,767 621 26% 17.2 13.2 4.0 23% $74,052,944 $56,517,004 $17,535,940 24% 2015 6,445 4,470 1,975 31% 49.1 35.5 13.6 28% $216,516,944 $155,661,547 $60,855,397 28% 2016 7,237 4,274 2,963 41% 56.4 35.3 21.1 37% $232,901,017 $146,132,608 $86,768,409 37% 2017 5,012 2,534 2,478 49% 38.8 21.4 17.5 45% $137,724,361 $74,141,577 $63,582,785 46% Total 22,614 14,305 8,309 37% 172.4 114.4 57.9 34% $711,768,991 $474,849,863 $236,919,129 33%
110 Excludes projects in unknown bands.

CONNECTICUT GREEN BANK 5. PROGRAMS – RESIDENTIAL SOLAR INVESTMENT PROGRAM
145
Distressed Community Penetration For a breakdown of RSIP project volume and investment by census tracts categorized by Distressed Communities – see Table 73. It should be noted that RSIP is not an income targeted program.
Table 73. RSIP Activity in Distressed Communities by FY Closed Fiscal Year Closed Distressed
# of Project Units
% Project Distribution
Investment (Gross
System Cost)
% Investment Distribution
Installed Capacity
(MW) % MW
Distribution
2010 Census
Population
% Population Distribution
Investment / Capita
Watts / Capita
2010 Census
Households
% Household Distribution
Investment / Household
Watts / Household
2012 Yes 46 11% $1,283,753 9% 0.3 9% 1,172,186 33% $1.10 0.2 449,097 33% $2.86 $0.59 2012 No 371 89% $13,705,816 91% 2.6 91% 2,401,911 67% $5.71 1.1 921,990 67% $14.87 $2.83 2012 Total 417 100% $14,989,569 100% 2.9 100% 3,574,097 100% $4.19 0.8 1,371,087 100% $10.93 $2.10
2013 Yes 115 10% $3,270,246 9% 0.7 9% 1,124,337 31% $2.91 0.6 428,395 31% $7.63 $1.67 2013 No 1,000 90% $32,313,909 91% 7.2 91% 2,449,760 69% $13.19 2.9 942,692 69% $34.28 $7.65 2013 Total 1,115 100% $35,584,155 100% 7.9 100% 3,574,097 100% $9.96 2.2 1,371,087 100% $25.95 $5.78
2014 Yes 381 16% $11,175,252 15% 2.5 15% 1,104,894 31% $10.11 2.3 420,721 31% $26.56 $5.98 2014 No 2,007 84% $62,877,692 85% 14.7 85% 2,469,203 69% $25.46 5.9 950,366 69% $66.16 $15.42 2014 Total 2,388 100% $74,052,944 100% 17.2 100% 3,574,097 100% $20.72 4.8 1,371,087 100% $54.01 $12.52
2015 Yes 1,381 21% $41,836,952 19% 9.4 19% 1,123,207 31% $37.25 8.4 429,250 31% $97.47 $21.97 2015 No 5,064 79% $174,679,992 81% 39.7 81% 2,450,890 69% $71.27 16.2 941,837 69% $185.47 $42.14 2015 Total 6,445 100% $216,516,944 100% 49.1 100% 3,574,097 100% $60.58 13.7 1,371,087 100% $157.92 $35.83
2016 Yes 2,150 30% $62,927,515 27% 15.3 27% 1,167,312 33% $53.91 13.1 445,638 33% $141.21 $34.27 2016 No 5,087 70% $169,973,502 73% 41.2 73% 2,406,785 67% $70.62 17.1 925,449 67% $183.67 $44.49 2016 Total 7,237 100% $232,901,017 100% 56.4 100% 3,574,097 100% $65.16 15.8 1,371,087 100% $169.87 $41.17
2017 Yes 1,857 37% $46,025,148 33% 13.0 33% 1,167,312 33% $39.43 11.1 445,638 33% $103.28 $29.13 2017 No 3,167 63% $92,043,222 67% 26.0 67% 2,406,785 67% $38.24 10.8 925,449 67% $99.46 $28.04 2017 Total 5,024 100% $138,068,370 100% 38.9 100% 3,574,097 100% $38.63 10.9 1,371,087 100% $100.70 $28.39
Total Yes 5,930 26% $166,518,868 23% 41.2 24% 1,167,312 33% $142.65 35.3 445,638 33% $373.66 $92.41 Total No 16,696 74% $545,594,133 77% 131.3 76% 2,406,785 67% $226.69 54.5 925,449 67% $589.55 $141.86 Total Total 22,626 100% $712,113,000 100% 172.5 100% 3,574,097 100% $199.24 48.3 1,371,087 100% $519.38 $125.79
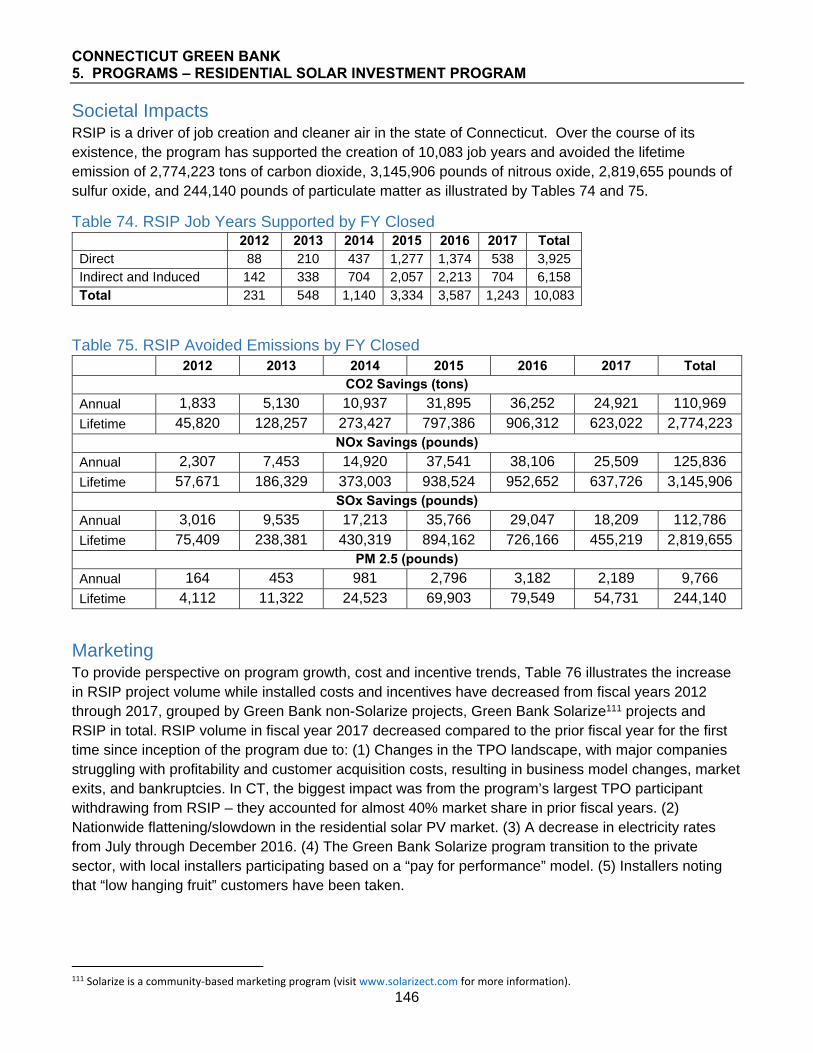
CONNECTICUT GREEN BANK 5. PROGRAMS – RESIDENTIAL SOLAR INVESTMENT PROGRAM
146
Societal Impacts RSIP is a driver of job creation and cleaner air in the state of Connecticut. Over the course of its existence, the program has supported the creation of 10,083 job years and avoided the lifetime emission of 2,774,223 tons of carbon dioxide, 3,145,906 pounds of nitrous oxide, 2,819,655 pounds of sulfur oxide, and 244,140 pounds of particulate matter as illustrated by Tables 74 and 75.
Table 74. RSIP Job Years Supported by FY Closed
2012 2013 2014 2015 2016 2017 Total Direct 88 210 437 1,277 1,374 538 3,925 Indirect and Induced 142 338 704 2,057 2,213 704 6,158 Total 231 548 1,140 3,334 3,587 1,243 10,083
Table 75. RSIP Avoided Emissions by FY Closed 2012 2013 2014 2015 2016 2017 Total
CO2 Savings (tons)
Annual 1,833 5,130 10,937 31,895 36,252 24,921 110,969
Lifetime 45,820 128,257 273,427 797,386 906,312 623,022 2,774,223 NOx Savings (pounds)
Annual 2,307 7,453 14,920 37,541 38,106 25,509 125,836
Lifetime 57,671 186,329 373,003 938,524 952,652 637,726 3,145,906 SOx Savings (pounds)
Annual 3,016 9,535 17,213 35,766 29,047 18,209 112,786
Lifetime 75,409 238,381 430,319 894,162 726,166 455,219 2,819,655 PM 2.5 (pounds)
Annual 164 453 981 2,796 3,182 2,189 9,766
Lifetime 4,112 11,322 24,523 69,903 79,549 54,731 244,140
Marketing To provide perspective on program growth, cost and incentive trends, Table 76 illustrates the increase in RSIP project volume while installed costs and incentives have decreased from fiscal years 2012 through 2017, grouped by Green Bank non-Solarize projects, Green Bank Solarize111 projects and RSIP in total. RSIP volume in fiscal year 2017 decreased compared to the prior fiscal year for the first time since inception of the program due to: (1) Changes in the TPO landscape, with major companies struggling with profitability and customer acquisition costs, resulting in business model changes, market exits, and bankruptcies. In CT, the biggest impact was from the program’s largest TPO participant withdrawing from RSIP – they accounted for almost 40% market share in prior fiscal years. (2) Nationwide flattening/slowdown in the residential solar PV market. (3) A decrease in electricity rates from July through December 2016. (4) The Green Bank Solarize program transition to the private sector, with local installers participating based on a “pay for performance” model. (5) Installers noting that “low hanging fruit” customers have been taken.
111 Solarize is a community‐based marketing program (visit www.solarizect.com for more information).
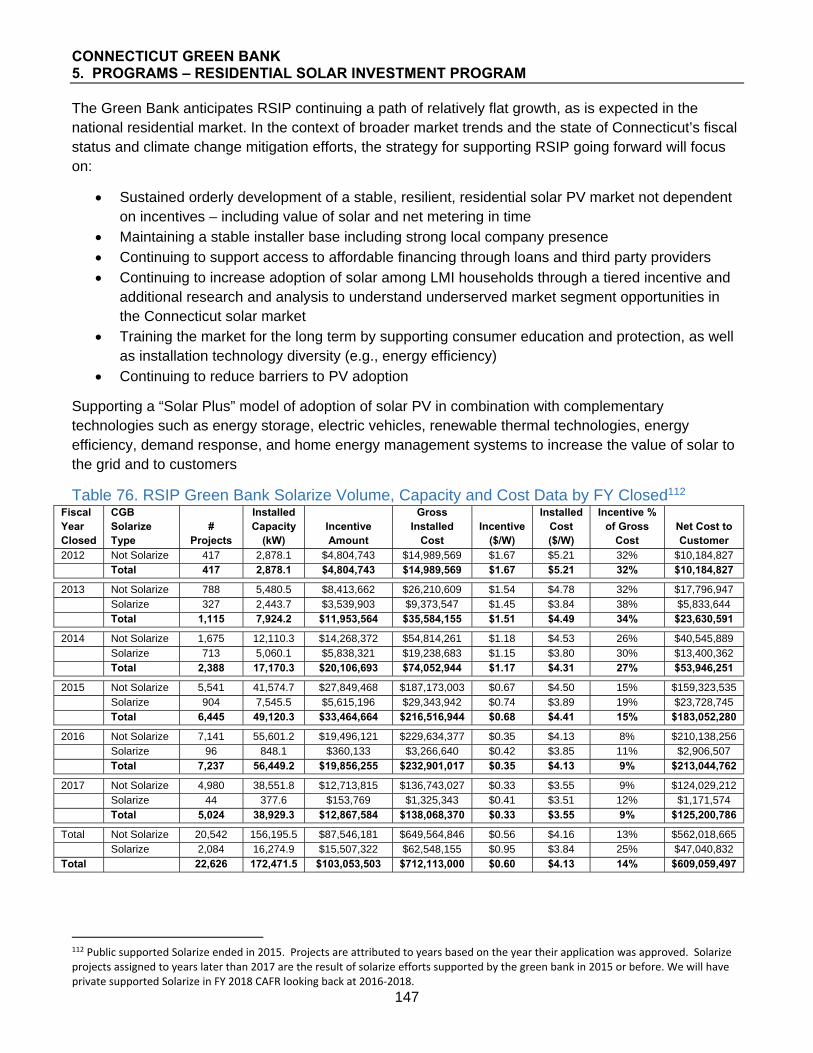
CONNECTICUT GREEN BANK 5. PROGRAMS – RESIDENTIAL SOLAR INVESTMENT PROGRAM
147
The Green Bank anticipates RSIP continuing a path of relatively flat growth, as is expected in the national residential market. In the context of broader market trends and the state of Connecticut’s fiscal status and climate change mitigation efforts, the strategy for supporting RSIP going forward will focus on:
Sustained orderly development of a stable, resilient, residential solar PV market not dependent on incentives – including value of solar and net metering in time
Maintaining a stable installer base including strong local company presence Continuing to support access to affordable financing through loans and third party providers Continuing to increase adoption of solar among LMI households through a tiered incentive and
additional research and analysis to understand underserved market segment opportunities in the Connecticut solar market
Training the market for the long term by supporting consumer education and protection, as well as installation technology diversity (e.g., energy efficiency)
Continuing to reduce barriers to PV adoption
Supporting a “Solar Plus” model of adoption of solar PV in combination with complementary technologies such as energy storage, electric vehicles, renewable thermal technologies, energy efficiency, demand response, and home energy management systems to increase the value of solar to the grid and to customers
Table 76. RSIP Green Bank Solarize Volume, Capacity and Cost Data by FY Closed112 Fiscal Year Closed
CGB Solarize Type
# Projects
Installed Capacity
(kW) Incentive Amount
Gross Installed
Cost Incentive
($/W)
Installed Cost ($/W)
Incentive % of Gross
Cost Net Cost to Customer
2012 Not Solarize 417 2,878.1 $4,804,743 $14,989,569 $1.67 $5.21 32% $10,184,827
Total 417 2,878.1 $4,804,743 $14,989,569 $1.67 $5.21 32% $10,184,827
2013 Not Solarize 788 5,480.5 $8,413,662 $26,210,609 $1.54 $4.78 32% $17,796,947
Solarize 327 2,443.7 $3,539,903 $9,373,547 $1.45 $3.84 38% $5,833,644
Total 1,115 7,924.2 $11,953,564 $35,584,155 $1.51 $4.49 34% $23,630,591
2014 Not Solarize 1,675 12,110.3 $14,268,372 $54,814,261 $1.18 $4.53 26% $40,545,889
Solarize 713 5,060.1 $5,838,321 $19,238,683 $1.15 $3.80 30% $13,400,362
Total 2,388 17,170.3 $20,106,693 $74,052,944 $1.17 $4.31 27% $53,946,251
2015 Not Solarize 5,541 41,574.7 $27,849,468 $187,173,003 $0.67 $4.50 15% $159,323,535
Solarize 904 7,545.5 $5,615,196 $29,343,942 $0.74 $3.89 19% $23,728,745
Total 6,445 49,120.3 $33,464,664 $216,516,944 $0.68 $4.41 15% $183,052,280
2016 Not Solarize 7,141 55,601.2 $19,496,121 $229,634,377 $0.35 $4.13 8% $210,138,256
Solarize 96 848.1 $360,133 $3,266,640 $0.42 $3.85 11% $2,906,507
Total 7,237 56,449.2 $19,856,255 $232,901,017 $0.35 $4.13 9% $213,044,762
2017 Not Solarize 4,980 38,551.8 $12,713,815 $136,743,027 $0.33 $3.55 9% $124,029,212
Solarize 44 377.6 $153,769 $1,325,343 $0.41 $3.51 12% $1,171,574
Total 5,024 38,929.3 $12,867,584 $138,068,370 $0.33 $3.55 9% $125,200,786
Total Not Solarize 20,542 156,195.5 $87,546,181 $649,564,846 $0.56 $4.16 13% $562,018,665 Solarize 2,084 16,274.9 $15,507,322 $62,548,155 $0.95 $3.84 25% $47,040,832 Total 22,626 172,471.5 $103,053,503 $712,113,000 $0.60 $4.13 14% $609,059,497
112 Public supported Solarize ended in 2015. Projects are attributed to years based on the year their application was approved. Solarize projects assigned to years later than 2017 are the result of solarize efforts supported by the green bank in 2015 or before. We will have private supported Solarize in FY 2018 CAFR looking back at 2016‐2018.

CONNECTICUT GREEN BANK 5. PROGRAMS – RESIDENTIAL SOLAR INVESTMENT PROGRAM
148
SHREC Program Legislation enacted by the General Assembly enables the Connecticut Green Bank to recover the costs of the RSIP by aggregating and monetizing the Solar Home Renewable Energy Credits (SHRECs) earned for solar energy generated by systems whose owners received RSIP incentives. The SHRECs are sold through long-term contracts to the state’s two investor-owned utilities, as mandated by the law. In FY17, significant progress was made to implement SHREC policy: (1) the SHREC Master Purchase Agreement was approved by PURA and executed with the utilities, (2) the SHREC aggregation process was approved by PURA and a Transaction Confirmation Agreement was executed with the utilities for the 2017 Tranche, including 2015 and 2016 Vintage SHRECs.
Market Transformation The Connecticut Green Bank contracted with Cadmus Group, Inc., to conduct a cost-effectiveness analysis of its Residential Solar Investment Program (RSIP), completed in March 2016. The findings of the study were: (1) RSIP is cost-effective from the perspective of program participants, the Connecticut Green Bank, from a total resource perspective, and for society as a whole. (2) RSIP has increasingly made efficient use of program funds by reducing incentives while supporting market growth through financing, marketing, outreach and education. (3) RSIP benefits sufficiently outweigh costs to allow for bundling of residential solar PV with emerging technologies such as energy storage, while maintaining cost-effectiveness. The study included data from RSIP steps 1 through 7, for which cost-effectiveness was found to increase with progressive steps as incentives were reduced. Cadmus noted that incentives represented the large majority of program costs. Therefore, the general pattern of increasing cost-effectiveness would be expected to continue as incentives were reduced further from steps 7-10 and beyond. As the Connecticut Green Bank’s only subsidy program, we are applying the Program Logic Model that focuses on rebates and incentives as the financial driver for customer action rather than financing.
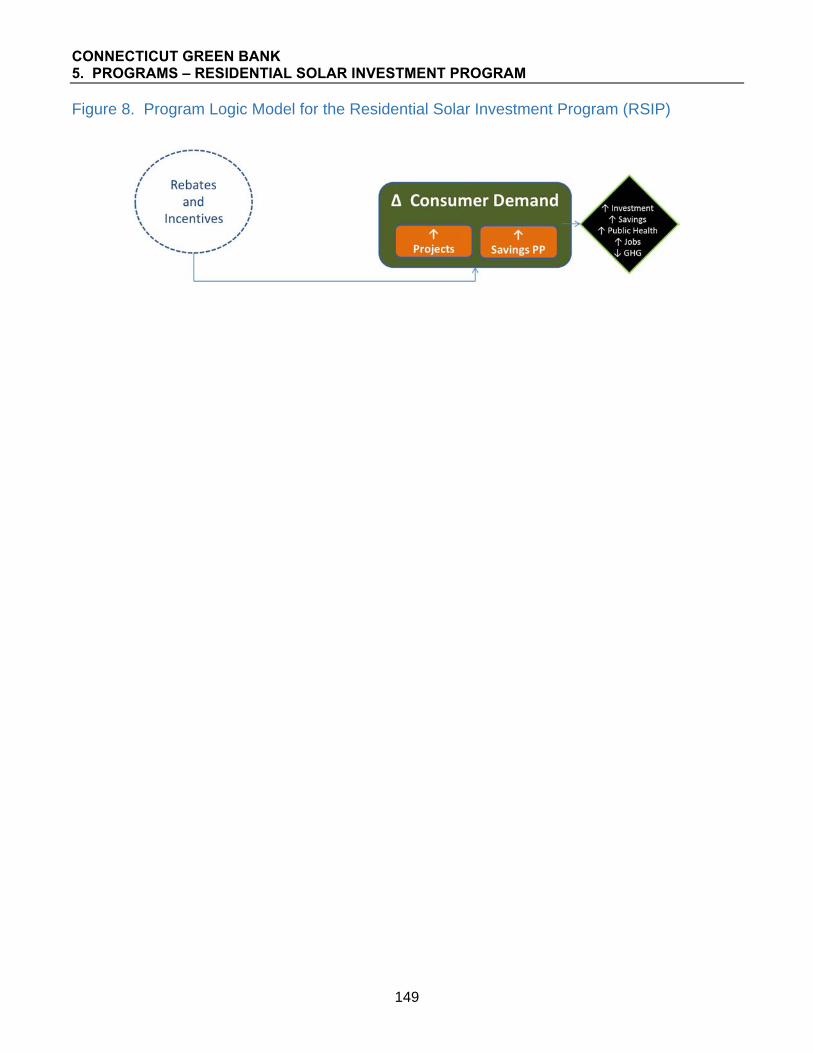
CONNECTICUT GREEN BANK 5. PROGRAMS – RESIDENTIAL SOLAR INVESTMENT PROGRAM
149
Figure 8. Program Logic Model for the Residential Solar Investment Program (RSIP)

CONNECTICUT GREEN BANK 5. PROGRAMS – SMART-E LOAN
150
Case 4 – Smart-E Loan Description The Smart-E residential loan program is a financing program developed in partnership with Energize CT and local lenders that uses a credit enhancement (i.e., $1,800,000 loan loss reserve)113 and interest rate buy-downs ($6,000,000 directly to programs)114 to stimulate the market for residential energy efficiency and solar loans in Connecticut. Through the product, the Connecticut Green Bank lowers the cost of capital for Connecticut residential customers seeking to install solar PV, high efficiency heating and cooling equipment, insulation or other home energy upgrades and reduces the loan performance risks to lenders. The $1.8 million loan loss reserve is used to encourage lenders to offer below market interest rates and longer terms for unsecured loans, mitigates their losses, and encourages customers to undertake measures that would prove uneconomical at higher interest rates. The interest rate buy-downs further encourage additional energy savings as they are reserved primarily for customers coupling multiple retrofits (e.g. solar and efficiency) or installing high priority policy measures (heat pump technologies, natural gas conversions).
The Smart-E Loan was designed to make it easy and affordable for homeowners to make energy efficiency and clean energy improvements to their homes with no out-of-pocket cash and at interest rates low enough and repayment terms long enough to make the improvements “cash flow positive.” At the same time, the Green Bank was intentional in opening conversations with local lenders to demonstrate the value of loans that would help their existing customers with burdensome energy costs, and serve as an effective marketing tool to attract new relationships. In return for a “second loss” reserve which would be available beyond an agreed “normal” level of loan losses, lenders agreed to lengthen their terms and lower their rates. The end result is a successful loan product that has enabled hundreds of homeowners throughout the state to lower energy costs and make their homes more comfortable in the summer heat or the depths of winter.
The financial structure of the Smart-E Loan product includes origination,115 servicing,116 and financing features in combination with the support of the Connecticut Green Bank.
113 During FY2017, the Green Bank, in an effort to optimize its resources, now holds the Loan Loss Reserve on its balance sheet. 114 From repurposed American Recovery and Reinvestment Act funds. 115 Network of participating community banks and credit unions with local contractors. 116 Network of participating community banks and credit unions.

CONNECTICUT GREEN BANK 5. PROGRAMS – SMART-E LOAN
151
Figure 9. Legal Structure and Flows of Capital for the Smart-E Loan
Key Performance Indicators The Key Performance Indicators for Smart-E closed activity are reflected in Tables 77 through 80. These illustrate the volume of projects by year, investment, generation capacity installed, and the amount of energy saved and/or produced. It also breaks down the volume of projects by energy efficiency, renewable generation, or both.
Table 77. Smart-E Loan Project Types and Investment by FY Closed Fiscal Year Closed EE RE RE/EE Unknown
# Projects
# Project Units
Amount Financed
Investment (Gross Cost)117
Green Bank Investment118
Private Investment
Leverage Ratio
2012 - - - - - - - - - - 2013 1 1 1 3 3 $52,400 $64,140 $182,097 $64,140 0.4 2014 90 40 6 6 142 142 $1,772,707 $2,444,163 $150,144 $2,444,163 16.3 2015 121 82 68 11 282 282 $5,380,532 $7,955,503 $734,433 $7,955,503 10.8 2016 104 49 66 2 221 221 $4,518,288 $5,684,530 $730,181 $5,684,530 7.8 2017 340 63 77 37 517 517 $8,543,246 $9,597,945 $763,399 $9,597,945 12.6 Total 656 235 217 57 1,165 1,165 $20,267,174 $25,746,281 $2,560,254 $25,746,281 10.1
Table 78. Smart-E Loan Project Capacity, Generation and Savings by FY Closed
Fiscal Year Closed
Installed Capacity
(kW)
Expected Annual
Generation (kWh)
Expected Lifetime
Savings or Generation
(MWh)
Annual Saved /
Produced (MMBtu)
Lifetime Saved /
Produced (MMBtu)
Annual Cost
Savings
Lifetime Cost
Savings 2012 -- - - - - - 2013 6.0 12,218 235 42 803 $1,636 $38,715 2014 348.9 865,283 15,593 3,043 55,476 $93,770 $2,138,233 2015 1,337.0 2,164,651 45,789 8,459 183,061 $281,378 $6,600,314
117 Includes closing costs and capitalized interest for C‐PACE and the Fair Market Value for Commercial/Residential Leases. 118 Includes incentives, interest rate buydowns and loan loss reserves.

CONNECTICUT GREEN BANK 5. PROGRAMS – SMART-E LOAN
152
Fiscal Year Closed
Installed Capacity
(kW)
Expected Annual
Generation (kWh)
Expected Lifetime
Savings or Generation
(MWh)
Annual Saved /
Produced (MMBtu)
Lifetime Saved /
Produced (MMBtu)
Annual Cost
Savings
Lifetime Cost
Savings 2016 939.8 1,660,416 33,992 6,837 142,486 $215,677 $5,004,880 2017 1,224.9 3,421,512 59,364 12,918 233,643 $389,782 $8,725,336 Total 3,856.7 8,124,080 154,973 31,299 615,469 $982,243 $22,507,478
Table 79. Smart-E Loan Project Averages by FY Closed
Fiscal Year Closed
Average Gross
System Cost
Average Amount
Financed
Average Installed Capacity
(kW)
Average Number
of Measures
Average Annual Saved /
Produced (MMBtu)
Average Finance
Term (months)
Average Finance
Rate Average
DTI
Average FICO Score
2012 - - - - - - - - - 2013 $21,380 $17,467 2.0 1 14 100 5.49 54 711 2014 $17,212 $12,484 2.5 1 21 90 5.21 32 752 2015 $28,211 $19,080 4.7 2 30 100 4.18 30 754 2016 $25,722 $20,445 4.3 2 31 100 4.10 32 756 2017 $18,565 $16,525 2.4 2 25 102 2.78 20 746 Total $22,100 $17,397 3.3 2 27 100 3.67 26 750
Table 80. Smart-E Loan Project Application Yield119 by FY Received Fiscal Year Received
Applications Received
Applications in Review
Applications Approved
Applications Withdrawn
Applications Denied
Approved Rate
Denied Rate
2012 - - - - - ‐ ‐
2013 19 14 1 5 74% 26%
2014 302 220 41 82 73% 27%
2015 553 410 79 143 74% 26%
2016 416 283 52 133 68% 32%
2017 1,029 29 796 75 204 80% 20%
Total 2,319 29 1,723 248 567 75% 25%
119 Applications received are applications submitted by the homeowner to a participating lending institution for credit approval.
Applications in review are submitted applications yet to be reviewed, approved or rejected. Applications withdrawn are applications that
have been cancelled by the submitter due to the project not moving forward. Applications denied are applications that are not approved
because the customer does not meet underwriting requirements.

CONNECTICUT GREEN BANK 5. PROGRAMS – SMART-E LOAN
153
Area Median Income Band Penetration For a breakdown of Smart-E loan volume and investment by census tracts categorized by Area Median Income (AMI) bands – see Table 81. It should be noted that Smart-E is not an income targeted program and only in the second half of FY17 began offering the expanded credit-challenged version of the program, opening new opportunities to partner with mission-oriented lenders focused on reaching consumers in underserved lower income markets.
Table 81. Smart-E Loan Activity in Metropolitan Statistical Area (MSA) Area Median Income (AMI) Bands by FY Closed120
Fiscal Year Closed
MSA AMI Band
# of Project Units
% Project Distribution
Investment (Gross System Cost)
% Investment Distribution
Installed Capacity
(MW) % MW
Distribution
Total Owner Occupied 1-
4 Unit Households
% Total Household Distribution
Project Units / 1,000
Total Households
Investment / Total
Household
Watts / Total
Household
2012 <60% 0 0% 0 0% 0.0 0% 61,168 7% 0.0 $0.00 0.0 2012 60%-80% 0 0% 0 0% 0.0 0% 101,640 12% 0.0 $0.00 0.0 2012 80%-100% 0 0% 0 0% 0.0 0% 151,346 17% 0.0 $0.00 0.0 2012 100%-120% 0 0% 0 0% 0.0 0% 216,988 25% 0.0 $0.00 0.0 2012 >120% 0 0% 0 0% 0.0 0% 350,196 40% 0.0 $0.00 0.0 2012 Total 0 0% 0 0% 0.0 0% 881,338 100% 0.0 $0.00 0.0 2013 <60% 0 0% 0 0% 0.0 0% 59,494 7% 0.0 $0.00 0.0 2013 60%-80% 0 0% 0 0% 0.0 0% 109,189 12% 0.0 $0.00 0.0 2013 80%-100% 1 33% 8,400 13% 0.0 0% 150,603 17% 0.0 $0.06 0.0 2013 100%-120% 2 67% 55,740 87% 0.0 100% 203,157 23% 0.0 $0.27 0.0 2013 >120% 0 0% 0 0% 0.0 0% 351,633 40% 0.0 $0.00 0.0 2013 Total 3 100% 64,140 100% 0.0 100% 874,076 100% 0.0 $0.07 0.0 2014 <60% 13 9% 157,653 6% 0.0 5% 57,673 7% 0.2 $2.73 0.3 2014 60%-80% 16 11% 211,825 9% 0.0 6% 103,934 12% 0.2 $2.04 0.2 2014 80%-100% 31 22% 564,220 23% 0.1 25% 149,038 17% 0.2 $3.79 0.6 2014 100%-120% 26 18% 494,334 20% 0.1 16% 209,561 24% 0.1 $2.36 0.3 2014 >120% 56 39% 1,016,132 42% 0.2 48% 348,270 40% 0.2 $2.92 0.5 2014 Total 142 100% 2,444,163 100% 0.3 100% 868,476 100% 0.2 $2.81 0.4 2015 <60% 12 4% 125,510 2% 0.0 0% 64,361 7% 0.2 $1.95 0.0 2015 60%-80% 24 9% 351,015 4% 0.0 3% 96,305 11% 0.2 $3.64 0.4 2015 80%-100% 57 20% 1,887,730 24% 0.2 13% 164,873 19% 0.3 $11.45 1.0 2015 100%-120% 57 20% 1,671,772 21% 0.4 26% 184,613 21% 0.3 $9.06 1.9 2015 >120% 132 47% 3,919,477 49% 0.8 58% 352,621 41% 0.4 $11.12 2.2 2015 Total 282 100% 7,955,503 100% 1.3 100% 862,773 100% 0.3 $9.22 1.5 2016 <60% 12 5% 160,327 3% 0.0 1% 64,361 7% 0.2 $2.49 0.1 2016 60%-80% 21 10% 263,279 5% 0.0 1% 96,305 11% 0.2 $2.73 0.1 2016 80%-100% 38 17% 882,455 16% 0.1 15% 164,873 19% 0.2 $5.35 0.8
120 Excludes projects in unknown bands.

CONNECTICUT GREEN BANK 5. PROGRAMS – SMART-E LOAN
154
Fiscal Year Closed
MSA AMI Band
# of Project Units
% Project Distribution
Investment (Gross System Cost)
% Investment Distribution
Installed Capacity
(MW) % MW
Distribution
Total Owner Occupied 1-
4 Unit Households
% Total Household Distribution
Project Units / 1,000
Total Households
Investment / Total
Household
Watts / Total
Household 2016 100%-120% 48 22% 1,244,713 22% 0.2 21% 184,613 21% 0.3 $6.74 1.1 2016 >120% 102 46% 3,133,757 55% 0.6 62% 352,621 41% 0.3 $8.89 1.7 2016 Total 221 100% 5,684,530 100% 0.9 100% 862,773 100% 0.3 $6.59 1.1 2017 <60% 32 6% 539,124 6% 0.1 5% 64,361 7% 0.5 $8.38 0.9 2017 60%-80% 55 11% 835,840 9% 0.1 10% 96,305 11% 0.6 $8.68 1.3 2017 80%-100% 80 15% 1,174,158 12% 0.1 11% 164,873 19% 0.5 $7.12 0.8 2017 100%-120% 128 25% 2,634,033 27% 0.4 29% 184,613 21% 0.7 $14.27 1.9 2017 >120% 222 43% 4,414,790 46% 0.6 46% 352,621 41% 0.6 $12.52 1.6 2017 Total 517 100% 9,597,945 100% 1.2 100% 862,773 100% 0.6 $11.12 1.4 Total <60% 69 6% 982,613 4% 0.1 2% 64,361 7% 1.1 $15.27 1.3 Total 60%-80% 116 10% 1,661,958 6% 0.2 5% 96,305 11% 1.2 $17.26 1.9 Total 80%-100% 207 18% 4,516,962 18% 0.5 14% 164,873 19% 1.3 $27.40 3.2 Total 100%-120% 261 22% 6,100,592 24% 1.0 25% 184,613 21% 1.4 $33.05 5.2 Total >120% 512 44% 12,484,156 48% 2.1 54% 352,621 41% 1.5 $35.40 5.9 Total Total 1,165 100% 25,746,281 100% 3.9 100% 862,773 100% 1.4 $29.84 4.5
Table 82. Smart-E Loan Activity in Metropolitan Statistical Area (MSA) Area Median Income (AMI) Bands Above or Below 100% by FY Closed121 # Project Units MW Investment (Gross Cost) Fiscal Year Closed Total
Over 100% AMI
100% or Below
AMI
% at 100% or Below Total
Over 100% AMI
100% or Below
AMI
% at 100% or Below Total
Over 100% AMI
100% or Below
AMI
% at 100% or Below
2012 0 0 0 0% 0.0 0.0 0.0 0% $0 0 0 0 2013 3 2 1 33% 0.0 0.0 0.0 0% $64,140 3 2 1 2014 142 82 60 42% 0.3 0.2 0.1 36% $2,444,163 142 82 60 2015 282 189 93 33% 1.3 1.1 0.2 15% $7,955,503 282 189 93 2016 221 150 71 32% 0.9 0.8 0.2 16% $5,684,530 221 150 71 2017 517 350 167 32% 1.2 0.9 0.3 26% $9,597,945 517 350 167 Total 1,165 773 392 34% 3.9 3.1 0.8 21% $25,746,281 1,165 773 392
121 Excludes projects in unknown bands.

CONNECTICUT GREEN BANK 5. PROGRAMS – SMART-E LOAN
155
Distressed Community Penetration For a breakdown of Smart-E project volume and investment by census tracts categorized by Distressed Communities – see Table 83. It should be noted that Smart-E is not an income targeted program.
Table 83. Smart-E Loan Activity in Distressed Communities by FY Closed
Fiscal Year Closed
Distressed
# of Project Units
% Project Distribution
Investment (Gross System Cost)
% Investment Distribution
Installed Capacity
(MW) % MW
Distribution
2010 Census
Population
% Population Distribution
Investment / Capita
Watts / Capita
2010 Census
Households
% Household Distribution
Investment / Household
Watts / Household
2012 Yes 0 0% $0 0% 0.0 0% 1,172,186 33% $0.00 0.0 449,097 33% $0.00 $0.00 2012 No 0 0% $0 0% 0.0 0% 2,401,911 67% $0.00 0.0 921,990 67% $0.00 $0.00 2012 Total 0 0% $0 0% 0.0 0% 3,574,097 100% $0.00 0.0 1,371,087 100% $0.00 $0.00
2013 Yes 2 67% $55,740 87% 0.0 100% 1,124,337 31% $0.05 0.0 428,395 31% $0.13 $0.01 2013 No 1 33% $8,400 13% 0.0 0% 2,449,760 69% $0.00 0.0 942,692 69% $0.01 $0.00 2013 Total 3 100% $64,140 100% 0.0 100% 3,574,097 100% $0.02 0.0 1,371,087 100% $0.05 $0.00
2014 Yes 21 15% $441,479 18% 0.1 22% 1,104,894 31% $0.40 0.1 420,721 31% $1.05 $0.18 2014 No 121 85% $2,002,684 82% 0.3 78% 2,469,203 69% $0.81 0.1 950,366 69% $2.11 $0.29 2014 Total 142 100% $2,444,163 100% 0.3 100% 3,574,097 100% $0.68 0.1 1,371,087 100% $1.78 $0.25
2015 Yes 36 13% $654,711 8% 0.1 7% 1,123,207 31% $0.58 0.1 429,250 31% $1.53 $0.20 2015 No 246 87% $7,300,792 92% 1.2 93% 2,450,890 69% $2.98 0.5 941,837 69% $7.75 $1.33 2015 Total 282 100% $7,955,503 100% 1.3 100% 3,574,097 100% $2.23 0.4 1,371,087 100% $5.80 $0.98
2016 Yes 65 29% $1,232,986 22% 0.1 13% 1,167,312 33% $1.06 0.1 445,638 33% $2.77 $0.28 2016 No 156 71% $4,451,544 78% 0.8 87% 2,406,785 67% $1.85 0.3 925,449 67% $4.81 $0.88 2016 Total 221 100% $5,684,530 100% 0.9 100% 3,574,097 100% $1.59 0.3 1,371,087 100% $4.15 $0.69
2017 Yes 119 23% $1,791,845 19% 0.3 21% 1,167,312 33% $1.54 0.2 445,638 33% $4.02 $0.58 2017 No 398 77% $7,806,101 81% 1.0 79% 2,406,785 67% $3.24 0.4 925,449 67% $8.43 $1.04 2017 Total 517 100% $9,597,945 100% 1.2 100% 3,574,097 100% $2.69 0.3 1,371,087 100% $7.00 $0.89
Total Yes 243 21% $4,176,761 16% 0.6 14% 1,167,312 33% $3.58 0.5 445,638 33% $9.37 $1.24 Total No 922 79% $21,569,520 84% 3.3 86% 2,406,785 67% $8.96 1.4 925,449 67% $23.31 $3.57 Total Total 1,165 100% $25,746,281 100% 3.9 100% 3,574,097 100% $7.20 1.1 1,371,087 100% $18.78 $2.81
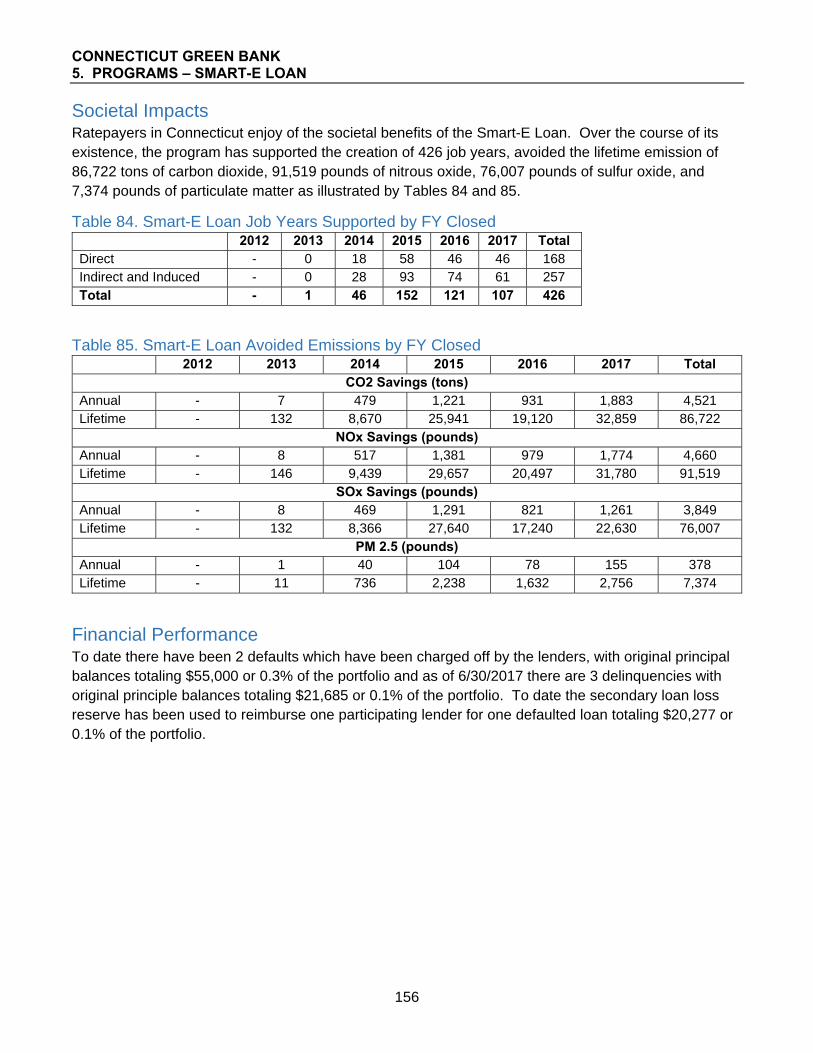
CONNECTICUT GREEN BANK 5. PROGRAMS – SMART-E LOAN
156
Societal Impacts Ratepayers in Connecticut enjoy of the societal benefits of the Smart-E Loan. Over the course of its existence, the program has supported the creation of 426 job years, avoided the lifetime emission of 86,722 tons of carbon dioxide, 91,519 pounds of nitrous oxide, 76,007 pounds of sulfur oxide, and 7,374 pounds of particulate matter as illustrated by Tables 84 and 85.
Table 84. Smart-E Loan Job Years Supported by FY Closed 2012 2013 2014 2015 2016 2017 Total Direct - 0 18 58 46 46 168 Indirect and Induced - 0 28 93 74 61 257 Total - 1 46 152 121 107 426
Table 85. Smart-E Loan Avoided Emissions by FY Closed 2012 2013 2014 2015 2016 2017 Total
CO2 Savings (tons) Annual - 7 479 1,221 931 1,883 4,521 Lifetime - 132 8,670 25,941 19,120 32,859 86,722
NOx Savings (pounds) Annual - 8 517 1,381 979 1,774 4,660 Lifetime - 146 9,439 29,657 20,497 31,780 91,519
SOx Savings (pounds) Annual - 8 469 1,291 821 1,261 3,849 Lifetime - 132 8,366 27,640 17,240 22,630 76,007
PM 2.5 (pounds) Annual - 1 40 104 78 155 378 Lifetime - 11 736 2,238 1,632 2,756 7,374
Financial Performance To date there have been 2 defaults which have been charged off by the lenders, with original principal balances totaling $55,000 or 0.3% of the portfolio and as of 6/30/2017 there are 3 delinquencies with original principle balances totaling $21,685 or 0.1% of the portfolio. To date the secondary loan loss reserve has been used to reimburse one participating lender for one defaulted loan totaling $20,277 or 0.1% of the portfolio.

CONNECTICUT GREEN BANK 5. PROGRAMS – SMART-E LOAN
157
The household customers that accessed the Smart-E Loan since its launch in 2013 had varying credit scores – see Table 86.
Table 86. Credit Score Ranges of Household Customers Using the Smart-E Loan by FY Closed
Unknown -639 640-679 680-699 700-719 720+Fiscal Year Closed
# Projects
% of Total
# Projects
% of Total
# Projects
% of Total
# Projects
% of Total
# Projects
% of Total
# Projects
% of Total
Total # Projects
2013 - 0.0% - 0.0% - 0.0% 2 66.7% - 0.0% 1 33.3% 3 2014 - 0.0% - 0.0% 15 10.6% 9 6.3% 12 8.5% 106 74.6% 142 2015 1 0.4% 1 0.4% 22 7.8% 16 5.7% 19 6.7% 223 79.1% 282 2016 - 0.0% 3 1.4% 14 6.3% 15 6.8% 28 12.7% 161 72.9% 221 2017 2 0.4% 14 2.7% 40 7.7% 52 10.1% 47 9.1% 362 70.0% 517 Total 3 0.3% 18 1.5% 91 7.8% 94 8.1% 106 9.1% 853 73.2% 1,165
Of the Smart-E Loans approved and closed with household customers, Table 87 presents the lenders offering the financing products in this program with accompanying data.
Table 87. Smart-E Loan Lenders
Lender # of
Loans Total Amount
Financed % of
Loans Min Loan Amount
Max Loan Amount
Average Loan
Amount
Average Interest
Rate
Average Term
(months) Decline
Rate Capital For Change 209 $2,812,642 13.88% $1,319 $40,000 $13,458 2.48 100 19% CorePlus Federal Credit Union 187 $2,421,162 11.95% $1,993 $45,107 $12,947 4.63 84 12% Eastern Savings Bank 227 $5,643,010 27.84% $1,800 $50,000 $24,859 3.68 112 32% First National Bank of Suffield 42 $840,868 4.15% $3,778 $40,000 $20,021 3.39 104 7% Ion Bank 46 $558,043 2.75% $4,000 $25,000 $12,131 5.12 92 22% Liberty Bank 23 $307,434 1.52% $4,550 $25,000 $13,367 5.10 85 26% Mutual Security Credit Union 92 $1,863,756 9.20% $0 $40,000 $20,258 2.59 110 11% Nutmeg State Financial Credit Union 226 $4,054,099 20.00% $3,325 $40,000 $17,938 3.74 101 30% Patriot Bank 43 $598,337 2.95% $5,000 $25,000 $13,915 4.70 87 19% Quinnipiac Bank & Trust 7 $84,056 0.41% $8,550 $16,556 $12,008 4.85 98 59% Thomaston Savings Bank 23 $314,072 1.55% $2,500 $25,000 $13,655 4.12 98 36% Union Savings Bank 28 $511,842 2.53% $6,500 $25,000 $18,280 3.65 101 46% Workers Federal Credit Union 12 $257,854 1.27% $7,000 $52,923 $21,488 3.96 79 0% Total 1,165 $20,267,174 100.00% $17,397 3.67 100 25%

CONNECTICUT GREEN BANK 5. PROGRAMS – SMART-E LOAN
158
Marketing To accelerate the deployment of natural gas conversions in the state, the Smart-E program was launched in 2014 with an Energize Norwich campaign in partnership with Norwich Public Utilities and 2 local lenders. Building on that success, and to accelerate the deployment of residential solar PV through the RSIP and the uptake of the Smart-E Loan financing product, the Connecticut Green Bank implemented “Solarize Connecticut” through the end of 2015. Green Bank Solarize Connecticut programs are town based and designed to use a combination of group purchasing, time-limited offers, and grassroots outreach. Solarize campaign efforts are augmented by local clean energy advocates and volunteers that effectively expedite the process of going solar – see Table 88. The Green Bank has also partnered with EnergizeCT and the utility companies and select municipalities to run Energize campaigns focused on insulation, natural gas conversions and high efficiency heating and cooling equipment. The Green Bank launched a co-op marketing program for contractors and lenders in 2015 that helps fulfill its channel partners’ need for high quality co-branded marketing materials, strategic and tactical planning resources, as well as advertising cost-sharing opportunities. The co-op marketing program and the Green Bank’s own digital marketing and earned media initiatives constitute a key driver of volume in FY16 and FY17.
Table 88. Number of Projects, Investment, and Installed Capacity through Solarize Connecticut for the Smart-E Loan
# of Projects Investment (Gross Cost) Installed Capacity (MW) Solarize 117 $4,306,579 1.1 Not Solarize 302 $10,261,126 2.7 Not Solar 677 $9,863,336 0.0 Unknown 69 $1,315,241 0.1 Total 1,165 $25,746,281 3.9 % Solarize 10% 17% 27%
The Green Bank Solarize Connecticut program provided a significant marketing channel and origination catalyst for the Smart-E Loan comprising nearly 10 to 20 percent of the total projects and investment and 27% of the installed capacity.122
Table 89. Smart-E Loan Project Channels Channel # of Projects Investment (Gross Cost) Installed Capacity (MW) Capital for Change/Home Energy Solutions 177 $2,340,255 0.1 Other Energy Efficiency/HVAC Contractors 507 $7,667,849 0.0 Solar Installers 422 $14,746,962 3.8 Unknown 59 $991,215 0.0 Total 1,165 $25,746,281 3.9
122 It should also be noted that Solarize was adapted to support a transition from propane and heating oil to natural gas through a pilot community‐based marketing partnership with Norwich Public Utilities and SmartPower through Energize Norwich. Over 100 Smart‐E Loans were originated through this pilot demonstrating that community‐based marketing approaches could be adapted to support loan origination strategies.

CONNECTICUT GREEN BANK 5. PROGRAMS – SMART-E LOAN
159
Table 90. Smart-E Loan Measures # of Measures # of Projects Unknown 61 1 578 2 347 3 95 4 39 5 23 6 13 7 6 8 1 9 2 Total 1,165
CONNECTICUT GREEN BANK 5. PROGRAMS – LOW INCOME SOLAR LEASE
160
Case 5 – Low Income Solar Lease and Energy-Efficiency Energy Savings Agreement (ESA) Description Through the solar developer PosiGen, a respondent to the Connecticut Green Bank’s 2015 RFP soliciting solar financing solutions to address underserved markets, the Green Bank supports solar deployment targeted at the state’s low- to moderate-income (LMI) population. PosiGen develops and originates these solar projects as project sponsor, utilizing tax equity from multiple investors and senior debt capital from two Connecticut lenders (Enhanced Capital and Stonehenge Capital). The Green Bank supplied an initial debt advance of $5,000,000 (and recently another $3.5 million), which has since been subordinated to an additional $8,500,000 advanced by Enhanced and Stonehenge to provide over $25 million in lease financing for solar projects targeting LMI homeowners. The RSIP program’s tiered LMI performance based incentive (PBI) provides PosiGen a significantly higher incentive for customers demonstrating these income requirements.
Through the partnership with PosiGen, the Connecticut Green Bank lowers the financial barriers to Connecticut LMI residential customers seeking to install solar PV with no up-front investment. PosiGen’s model also includes an alternative underwriting approach that does not rely on credit scores and a community-based marketing approach – two key ingredients for targeting this hard to reach market segment. Capital provided to PosiGen to be able to offer consumers a solar PV lease and energy efficiency “Energy Savings Agreement” is returned to the Connecticut Green Bank, the tax equity investor and the lenders through consumer lease repayments. This contrasts with traditional energy program subsidies targeted to LMI homeowners, which are typically in the form of grants only.
The financial structure of the Low Income Solar Lease product includes origination, servicing, and financing features123 in combination with the support of the Connecticut Green Bank.
123 Origination, servicing and financing managed by PosiGen.

CONNECTICUT GREEN BANK 5. PROGRAMS – LOW INCOME SOLAR LEASE
161
Figure 10. Low Income Solar Lease Legal Structure and Flows of Capital
Connecticut represented the first expansion for PosiGen outside of its initial market in Louisiana, where starting in 2011, it paired solar leasing and energy efficiency services to maximize savings for LMI customers. Given the strategic emphasis the Green Bank has placed on driving investment for lower income homeowners, the organization developed a flexible funding structure to rapidly bring PosiGen to market. The concept started with the Green Bank providing “anchor capital” for PosiGen in the form of low-cost debt, together with PosiGen’s own resources and tax equity from U.S. Bank (U.S. Bank was already an investor in the Connecticut market through the Green Bank’s CT Solar Lease). Documentation was structured to facilitate funding by a senior lender, providing for the subordination of the Green Bank’s loans once this senior lender could be secured. The Green Bank also integrated a working capital module within the financing arrangements to enable PosiGen to focus its capital resources on expanding to Connecticut. With initial capital requirements underwritten by the Green Bank, PosiGen had the financial backing and capital flexibility it needed to confidently secure its base of operation in Bridgeport, hire management and local staff, pursue local partnerships with existing energy efficiency and solar PV contractors, and resolve supply chain issues. By using its balance sheet as an initial source of low-cost debt capital, the Green Bank made it possible for a developer that had proven its business model in another market to bring its innovative approach to Connecticut to build investment in solar and energy efficiency for homeowners of more modest means. The investment had the intended impact: PosiGen could establish operations and get a market started, and its rapid success in Connecticut enabled the Green Bank and PosiGen to secure senior lenders and new sources of tax equity to enable operations to expand to several cities throughout Connecticut.

CONNECTICUT GREEN BANK 5. PROGRAMS – LOW INCOME SOLAR LEASE
162
Key Performance Indicators The Key Performance Indicators for the Low-Income Solar Lease’s closed projects are reflected in Tables 91 through 93. These illustrate the volume of projects by year, investment, generation capacity installed, and the amount of energy saved and/or produced.
Table 91. Low Income Solar Lease Project Types and Investment by FY Closed Fiscal Year Closed EE124 RE RE/EE
# Projects
# Project Units
Investment (Gross Cost)125
Green Bank Investment126
Private Investment
Leverage Ratio
2012 - - - - - - - - - 2013 - - - - - - - - - 2014 - - - - - - - - - 2015 - 4 - 4 4 $109,380 $36,000 $73,380 3.0 2016 - 175 155 330 330 $9,450,354 $2,970,000 $6,480,354 3.2 2017 - 154 473 627 627 $17,336,078 $5,643,000 $11,693,078 3.1 Total - 333 628 961 961 $26,895,812 $8,649,000 $18,246,812 3.1
Table 92. Low Income Solar Lease Project Capacity, Generation and Savings by FY Closed
Fiscal Year Closed
Installed Capacity
(kW)
Expected Annual
Generation (kWh)
Expected Lifetime
Savings or Generation
(MWh)
Annual Saved /
Produced (MMBtu)127
Lifetime Saved /
Produced (MMBtu)
Annual Cost
Savings
Lifetime Cost
Savings 2012 - - - - - - - 2013 - - - - - - - 2014 - - - - - - - 2015 25.0 28,470 712 150 3,761 $4,795 $119,880 2016 2,106.0 2,398,313 59,958 12,584 314,590 $395,604 $9,890,100 2017 3,841.5 4,374,700 109,368 23,284 582,110 $751,648 $18,791,190 Total 5,972.5 6,801,483 170,037 36,018 900,461 $1,152,047 $28,801,170
124 All projects that receive an RSIP incentive are required to do an energy audit/assessment. 125 Includes closing costs and capitalized interest for C‐PACE and the Fair Market Value for Commercial/Residential Leases. 126 Includes incentives, interest rate buydowns and loan loss reserves. 127 Includes only the MMBtus for the HES audit. MMTBtus for other ECMs are not included.

CONNECTICUT GREEN BANK 5. PROGRAMS – LOW INCOME SOLAR LEASE
163
Table 93. Low Income Solar Lease Project Averages by FY Closed
FY Closed
Average Gross
System Cost
Average Amount
Financed
Average Installed Capacity
(kW)
Average Annual Saved
/ Produced (MMBtu)
Average Finance
Term (months)
Average Lease
Price per Month
Average ESA Price
per month128
2012 - - - - - - - 2013 - - - - - - - 2014 - - - - - - - 2015 $27,345 $27,345 6.3 38 240 $79 - 2016 $28,637 $28,637 6.4 38 240 $80 $10 2017 $27,649 $27,649 6.1 37 240 $81 $10 Total $27,987 $27,987 6.2 37 240 $81 $10
On average, 60% of all Posigen leases sold yield an installed, energized system.
Of the low-income households that installed solar PV, 65% of them also participated in the energy efficiency ESA, resulting in more comprehensive energy efficiency measures being included in the project.
128 Posigen’s ESA provides energy efficiency measures valued at over $2000 to lessees for between $10‐15 a month.

CONNECTICUT GREEN BANK 5. PROGRAMS – LOW INCOME SOLAR LEASE
164
Area Median Income Band Penetration For a breakdown of PosiGen Solar for All volume and investment by census tracts categorized by Area Median Income bands – see Table 94. As an income-targeted program, this table illustrates the degree to which the goal of serving consumers in lower income communities is being met.
Table 94. Low Income Solar Lease Activity in Metropolitan Statistical Area (MSA) Area Median Income (AMI) Bands by FY Closed129
Fiscal Year Closed
MSA AMI Band
# of Project Units
% Project Distribution
Investment (Gross System Cost)
% Investment Distribution
Installed Capacity
(MW) % MW
Distribution
Total Owner Occupied 1-
4 Unit Households
% Total Household Distribution
Project Units / 1,000
Total Households
Investment / Total
Household
Watts / Total
Household
2012 <60% 0 0% 0 0% 0.0 0% 61,168 7% 0.0 $0.00 0.0 2012 60%-80% 0 0% 0 0% 0.0 0% 101,640 12% 0.0 $0.00 0.0 2012 80%-100% 0 0% 0 0% 0.0 0% 151,346 17% 0.0 $0.00 0.0 2012 100%-120% 0 0% 0 0% 0.0 0% 216,988 25% 0.0 $0.00 0.0 2012 >120% 0 0% 0 0% 0.0 0% 350,196 40% 0.0 $0.00 0.0 2012 Total 0 0% 0 0% 0.0 0% 881,338 100% 0.0 $0.00 0.0 2013 <60% 0 0% 0 0% 0.0 0% 59,494 7% 0.0 $0.00 0.0 2013 60%-80% 0 0% 0 0% 0.0 0% 109,189 12% 0.0 $0.00 0.0 2013 80%-100% 0 0% 0 0% 0.0 0% 150,603 17% 0.0 $0.00 0.0 2013 100%-120% 0 0% 0 0% 0.0 0% 203,157 23% 0.0 $0.00 0.0 2013 >120% 0 0% 0 0% 0.0 0% 351,633 40% 0.0 $0.00 0.0 2013 Total 0 0% 0 0% 0.0 0% 874,076 100% 0.0 $0.00 0.0 2014 <60% 0 0% 0 0% 0.0 0% 57,673 7% 0.0 $0.00 0.0 2014 60%-80% 0 0% 0 0% 0.0 0% 103,934 12% 0.0 $0.00 0.0 2014 80%-100% 0 0% 0 0% 0.0 0% 149,038 17% 0.0 $0.00 0.0 2014 100%-120% 0 0% 0 0% 0.0 0% 209,561 24% 0.0 $0.00 0.0 2014 >120% 0 0% 0 0% 0.0 0% 348,270 40% 0.0 $0.00 0.0 2014 Total 0 0% 0 0% 0.0 0% 868,476 100% 0.0 $0.00 0.0 2015 <60% 3 75% 82,380 75% 0.0 76% 64,361 7% 0.0 $1.28 0.3 2015 60%-80% 0 0% 0 0% 0.0 0% 96,305 11% 0.0 $0.00 0.0 2015 80%-100% 0 0% 0 0% 0.0 0% 164,873 19% 0.0 $0.00 0.0 2015 100%-120% 0 0% 0 0% 0.0 0% 184,613 21% 0.0 $0.00 0.0 2015 >120% 1 25% 27,000 25% 0.0 24% 352,621 41% 0.0 $0.08 0.0 2015 Total 4 100% 109,380 100% 0.0 100% 862,773 100% 0.0 $0.13 0.0 2016 <60% 133 40% 3,738,342 40% 0.8 39% 64,361 7% 2.1 $58.08 12.8
129 Excludes projects in unknown bands.
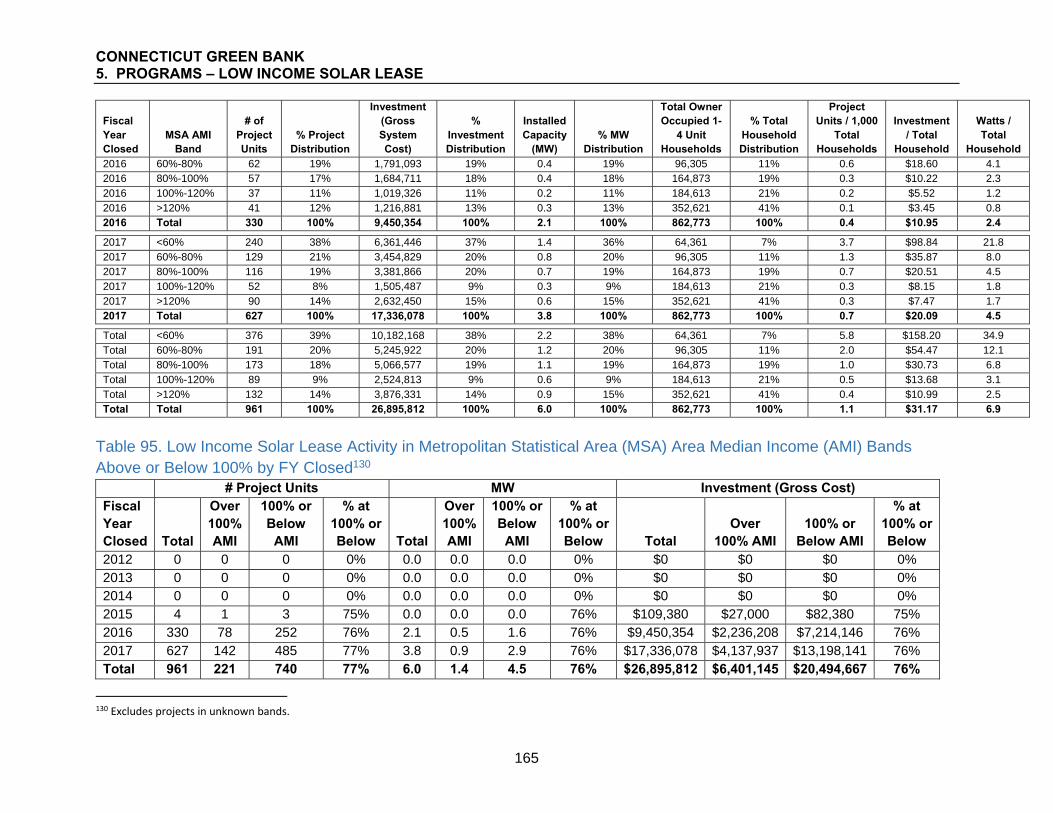
CONNECTICUT GREEN BANK 5. PROGRAMS – LOW INCOME SOLAR LEASE
165
Fiscal Year Closed
MSA AMI Band
# of Project Units
% Project Distribution
Investment (Gross System Cost)
% Investment Distribution
Installed Capacity
(MW) % MW
Distribution
Total Owner Occupied 1-
4 Unit Households
% Total Household Distribution
Project Units / 1,000
Total Households
Investment / Total
Household
Watts / Total
Household 2016 60%-80% 62 19% 1,791,093 19% 0.4 19% 96,305 11% 0.6 $18.60 4.1 2016 80%-100% 57 17% 1,684,711 18% 0.4 18% 164,873 19% 0.3 $10.22 2.3 2016 100%-120% 37 11% 1,019,326 11% 0.2 11% 184,613 21% 0.2 $5.52 1.2 2016 >120% 41 12% 1,216,881 13% 0.3 13% 352,621 41% 0.1 $3.45 0.8 2016 Total 330 100% 9,450,354 100% 2.1 100% 862,773 100% 0.4 $10.95 2.4 2017 <60% 240 38% 6,361,446 37% 1.4 36% 64,361 7% 3.7 $98.84 21.8 2017 60%-80% 129 21% 3,454,829 20% 0.8 20% 96,305 11% 1.3 $35.87 8.0 2017 80%-100% 116 19% 3,381,866 20% 0.7 19% 164,873 19% 0.7 $20.51 4.5 2017 100%-120% 52 8% 1,505,487 9% 0.3 9% 184,613 21% 0.3 $8.15 1.8 2017 >120% 90 14% 2,632,450 15% 0.6 15% 352,621 41% 0.3 $7.47 1.7 2017 Total 627 100% 17,336,078 100% 3.8 100% 862,773 100% 0.7 $20.09 4.5 Total <60% 376 39% 10,182,168 38% 2.2 38% 64,361 7% 5.8 $158.20 34.9 Total 60%-80% 191 20% 5,245,922 20% 1.2 20% 96,305 11% 2.0 $54.47 12.1 Total 80%-100% 173 18% 5,066,577 19% 1.1 19% 164,873 19% 1.0 $30.73 6.8 Total 100%-120% 89 9% 2,524,813 9% 0.6 9% 184,613 21% 0.5 $13.68 3.1 Total >120% 132 14% 3,876,331 14% 0.9 15% 352,621 41% 0.4 $10.99 2.5 Total Total 961 100% 26,895,812 100% 6.0 100% 862,773 100% 1.1 $31.17 6.9
Table 95. Low Income Solar Lease Activity in Metropolitan Statistical Area (MSA) Area Median Income (AMI) Bands Above or Below 100% by FY Closed130 # Project Units MW Investment (Gross Cost) Fiscal Year Closed Total
Over 100% AMI
100% or Below
AMI
% at 100% or Below Total
Over 100% AMI
100% or Below
AMI
% at 100% or Below Total
Over 100% AMI
100% or Below AMI
% at 100% or Below
2012 0 0 0 0% 0.0 0.0 0.0 0% $0 $0 $0 0% 2013 0 0 0 0% 0.0 0.0 0.0 0% $0 $0 $0 0% 2014 0 0 0 0% 0.0 0.0 0.0 0% $0 $0 $0 0% 2015 4 1 3 75% 0.0 0.0 0.0 76% $109,380 $27,000 $82,380 75% 2016 330 78 252 76% 2.1 0.5 1.6 76% $9,450,354 $2,236,208 $7,214,146 76% 2017 627 142 485 77% 3.8 0.9 2.9 76% $17,336,078 $4,137,937 $13,198,141 76% Total 961 221 740 77% 6.0 1.4 4.5 76% $26,895,812 $6,401,145 $20,494,667 76%
130 Excludes projects in unknown bands.
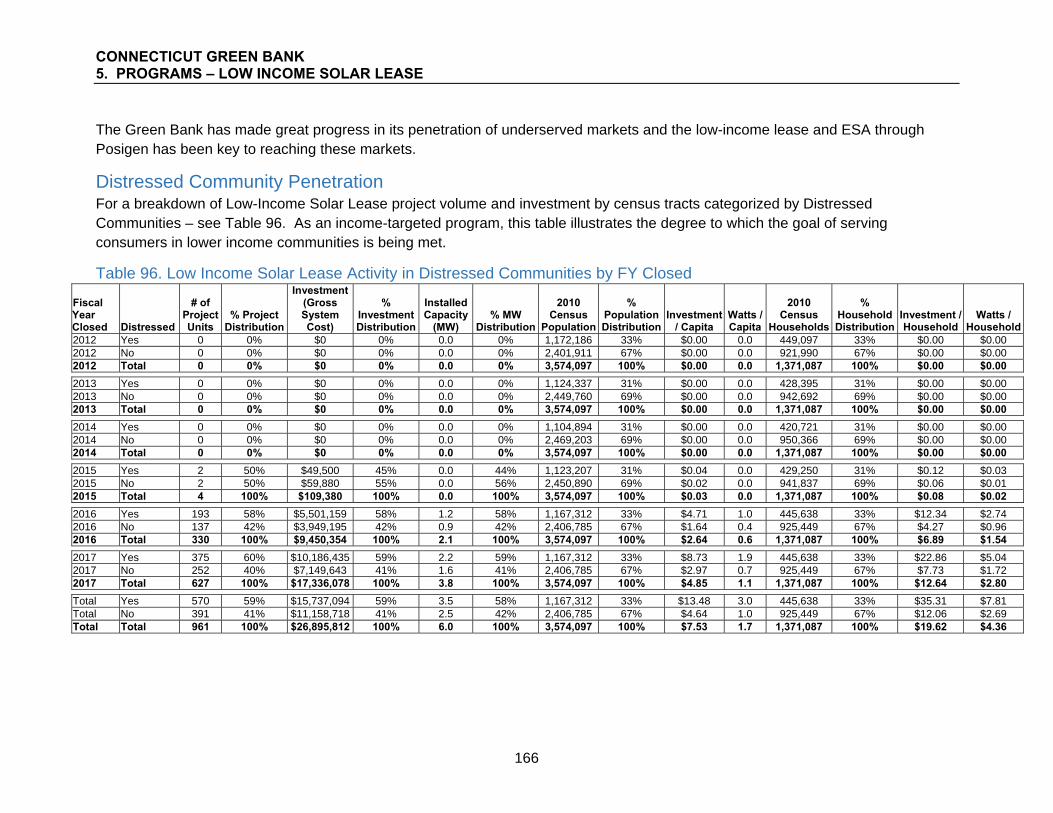
CONNECTICUT GREEN BANK 5. PROGRAMS – LOW INCOME SOLAR LEASE
166
The Green Bank has made great progress in its penetration of underserved markets and the low-income lease and ESA through Posigen has been key to reaching these markets.
Distressed Community Penetration For a breakdown of Low-Income Solar Lease project volume and investment by census tracts categorized by Distressed Communities – see Table 96. As an income-targeted program, this table illustrates the degree to which the goal of serving consumers in lower income communities is being met.
Table 96. Low Income Solar Lease Activity in Distressed Communities by FY Closed
Fiscal Year Closed Distressed
# of Project Units
% Project Distribution
Investment (Gross System Cost)
% Investment Distribution
Installed Capacity
(MW) % MW
Distribution
2010 Census
Population
% Population Distribution
Investment / Capita
Watts / Capita
2010 Census
Households
% Household Distribution
Investment /Household
Watts / Household
2012 Yes 0 0% $0 0% 0.0 0% 1,172,186 33% $0.00 0.0 449,097 33% $0.00 $0.00 2012 No 0 0% $0 0% 0.0 0% 2,401,911 67% $0.00 0.0 921,990 67% $0.00 $0.00 2012 Total 0 0% $0 0% 0.0 0% 3,574,097 100% $0.00 0.0 1,371,087 100% $0.00 $0.00
2013 Yes 0 0% $0 0% 0.0 0% 1,124,337 31% $0.00 0.0 428,395 31% $0.00 $0.00 2013 No 0 0% $0 0% 0.0 0% 2,449,760 69% $0.00 0.0 942,692 69% $0.00 $0.00 2013 Total 0 0% $0 0% 0.0 0% 3,574,097 100% $0.00 0.0 1,371,087 100% $0.00 $0.00
2014 Yes 0 0% $0 0% 0.0 0% 1,104,894 31% $0.00 0.0 420,721 31% $0.00 $0.00 2014 No 0 0% $0 0% 0.0 0% 2,469,203 69% $0.00 0.0 950,366 69% $0.00 $0.00 2014 Total 0 0% $0 0% 0.0 0% 3,574,097 100% $0.00 0.0 1,371,087 100% $0.00 $0.00
2015 Yes 2 50% $49,500 45% 0.0 44% 1,123,207 31% $0.04 0.0 429,250 31% $0.12 $0.03 2015 No 2 50% $59,880 55% 0.0 56% 2,450,890 69% $0.02 0.0 941,837 69% $0.06 $0.01 2015 Total 4 100% $109,380 100% 0.0 100% 3,574,097 100% $0.03 0.0 1,371,087 100% $0.08 $0.02
2016 Yes 193 58% $5,501,159 58% 1.2 58% 1,167,312 33% $4.71 1.0 445,638 33% $12.34 $2.74 2016 No 137 42% $3,949,195 42% 0.9 42% 2,406,785 67% $1.64 0.4 925,449 67% $4.27 $0.96 2016 Total 330 100% $9,450,354 100% 2.1 100% 3,574,097 100% $2.64 0.6 1,371,087 100% $6.89 $1.54
2017 Yes 375 60% $10,186,435 59% 2.2 59% 1,167,312 33% $8.73 1.9 445,638 33% $22.86 $5.04 2017 No 252 40% $7,149,643 41% 1.6 41% 2,406,785 67% $2.97 0.7 925,449 67% $7.73 $1.72 2017 Total 627 100% $17,336,078 100% 3.8 100% 3,574,097 100% $4.85 1.1 1,371,087 100% $12.64 $2.80
Total Yes 570 59% $15,737,094 59% 3.5 58% 1,167,312 33% $13.48 3.0 445,638 33% $35.31 $7.81 Total No 391 41% $11,158,718 41% 2.5 42% 2,406,785 67% $4.64 1.0 925,449 67% $12.06 $2.69 Total Total 961 100% $26,895,812 100% 6.0 100% 3,574,097 100% $7.53 1.7 1,371,087 100% $19.62 $4.36

CONNECTICUT GREEN BANK 5. PROGRAMS – LOW INCOME SOLAR LEASE
167
Societal Impacts Ratepayers in Connecticut are starting to feel the impact of the societal benefits of the Green Bank’s Low-Income Solar Lease. Over the course of its existence, the program has supported the creation of 187 job years, avoided the lifetime emission of 95,586 tons of carbon dioxide, 97,860 pounds of nitrous oxide, 69,888 pounds of sulfur oxide, and 8,397 pounds of particulate matter as illustrated by Tables 97 and 98.
Table 97. Low Income Solar Lease Job Years Supported by FY Closed 2012 2013 2014 2015 2016 2017 Total Direct - - - 0 35 42 77 Indirect and Induced - - - 1 56 54 111 Total - - - 1 90 96 187
Table 98. Low Income Solar Lease Avoided Emissions by FY Closed 2012 2013 2014 2015 2016 2017 Total
CO2 Savings (tons) Annual - - - 16 1,348 2,459 3,823 Lifetime - - - 400 33,706 61,479 95,586
NOx Savings (pounds) Annual - - - 16 1,381 2,517 3,914 Lifetime - - - 410 34,520 62,930 97,860
SOx Savings (pounds) Annual - - - 12 987 1,797 2,796 Lifetime - - - 292 24,676 44,920 69,888
PM 2.5 (pounds) Annual - - - 1 118 216 336 Lifetime - - - 35 2,961 5,401 8,397
Financial Performance To date there have been no defaults and as of 7/31/2017131 there are 18 delinquencies totaling $337,138 or 1.3% of the portfolio, well within expectations for a low-to-moderate income targeted using an alternative underwriting approach.
Marketing To build the pipeline of projects for the lease, Connecticut Green Bank supports PosiGen’s community-based marketing campaigns, leveraging the institution’s market analysis and local experience and connections. The Green Bank also co-brands the program so partnering community organizations and consumers know there is governmental involvement, especially critical given the targeting of underserved communities and homeowners. This includes assisting with PosiGen’s outreach efforts through its Solar for All campaigns which are modeled after Green Bank Solarize campaigns.
131 June 30, 2017 loan servicing report is not available.

CONNECTICUT GREEN BANK 5. PROGRAMS – MULTIFAMILY PROGRAMS
168
Case 6 – Multifamily Programs Description Defined as buildings with 5 or more units, the Green Bank provides a suit of financing options that support property owners to assess, design, fund, and monitor high impact green energy upgrades for multifamily properties. The Green Bank encourages owners to take a holistic approach to their buildings by implementing energy upgrades that will deliver a high return on investment over the long term through energy and operating cost savings, increased property values, and improvement of resident health and safety and living environment. The organization partners with building owners to finance a project design approach that is both technology and fuel agnostic – whereby owners identify the combination of renewable energy and energy efficiency measures/technology approaches that will deliver the most benefits and highest impact. This holistic approach and focus on deeper efficiency measures is particularly important in Connecticut due to the state’s old and aging housing stock need for significant capital improvements and health and safety remediation, as well as a state budget crisis that impacts the housing sector. We are catalyzing holistic projects that reap the benefits of significant energy and operating cost savings, which can be used to finance other capital improvements like full roof replacements and remediation of mold, asbestos, lead, etc.
The Green Bank programs primarily target the low- and moderate-income market in Connecticut but are also available to market rate properties as well, for all ownership types, including private and non-profit owned apartments, condominiums, cooperatives, and state and federally funded affordable housing developments, including senior and assisted living facilities.
Pre-development resources In a traditionally difficult sector to address, multifamily projects have a significant need for pre-development financing, trusted technical support, and streamlined access to funding programs. In 2015, the Green Bank developed pre-development energy loan programs to support property owners in identifying high-quality technical assistance providers, and fund the work needed to scope and secure financing for deeper, cost effective energy upgrades. There are two versions available – a high-touch version, the “Sherpa Loan” program, and an owner-managed version, the “Navigator Loan” program. Eligible assessment and design services funded under the pre-development loans include energy and water efficiency, efficient fuel conversion, renewable energy systems, energy storage and EV fueling stations, qualified health and safety measures, and performance benchmarking.
The Green Bank is working to change the model of pre-development and technical assistance from one that is primarily grant-funded in the low- and moderate-income housing space to one that is loan driven. Both loan programs include loan forgiveness provisions that allow owners the opportunity to have deferred and accrued costs forgiven if there are real physical and/or financial reasons a given project is unable to proceed to implementation (including, but not limited to, negative return-on-investment from improvements, prohibitive health and safety burden, etc.).
This program is supported by a revolving loan fund for loans of 0.0% to 2.99% and up to two-year terms. The affordable multifamily version of this program is housed at the Housing

CONNECTICUT GREEN BANK 5. PROGRAMS – MULTIFAMILY PROGRAMS
169
Development Fund, a local CDFI, and part of a $5 million program-related investment from the MacArthur Foundation used to support the program. Additionally, $1,000,000 of Green Bank funds are available.
Sherpa Pre-Development Energy Loan132 funds a low-risk, one-stop solution for owners to analyze, design, and acquire funding for energy upgrades through a process managed by the Green Bank’s designated technical service provider, the non-profit New Ecology, Inc.
Navigator Pre-Development Energy Loan133 funds pre-development costs for building owners who prefer to select and manage the energy professionals needed to scope and design their project.
BenchmarkCT134 is a performance assessment resource that provides one year of free energy benchmarking to measure the performance of a property or portfolio of properties against comparable buildings. The program is jointly funded by Green Bank and the Connecticut Housing Finance Authority.
Term Financing Solutions The Green Bank offers the following term financing options for project implementation135.
Low Income Multifamily Energy (LIME) Loan136 funds energy improvement projects for low- and moderate-income properties (where at least 60% of units serve renters at 80% or lower of Area Median Income) and is geared towards mid-cycle energy improvements. The LIME Loan program is delivered through a partnership with Capital for Change, a local CDFI (formerly known as Connecticut Housing Investment Fund) and provides unsecured loans that cover 100% of project costs, require no money down, and are repaid from energy cost savings for terms up to 20 years. Projected energy savings are used to cover the debt service of the loan. The Green Bank supports LIME with a $325,000 loan loss reserve and provided $3.5 million to capitalize the initial $5 million loan fund.
Solar-only137 financing allows owners to go solar and lock in lower long-term electricity rates with no upfront cost and without the risk or hassle of purchasing and maintaining a system. Solar financing is available for multifamily properties through the Green Bank’s solar lease facility (both leases and power purchase agreements are supported). See the Case 2 – Solar Lease for more information. Of particular note is the Multifamily Program’s partnership with CHFA and their State Sponsored Housing Portfolio, a Solarize-style group
132 Sherpa Pre‐Development Loan: http://www.ctgreenbank.com/wp‐content/uploads/2017/03/Sherpa_Loan_web.pdf 133 Navigator Pre‐Development Energy Loan: http://www.ctgreenbank.com/wp‐content/uploads/2017/03/Navigator_Loan_web.pdf 134 BenchmarkCT: http://www.wegowise.com/benchmarkct 135 Owners are also encouraged to seek other sources of capital if they can be secured under more favorable terms than those offered by the Green Bank. 136 Low Income Multifamily Energy (LIME) Loan: http://ctgreenbank.com/wp‐content/uploads/2017/02/LIME‐Loan‐program‐sheet.pdf 137 Solar Power Purchase Agreement: http://ctgreenbank.com/wp‐content/uploads/2017/02/Solar‐PPA‐program‐sheet.pdf

CONNECTICUT GREEN BANK 5. PROGRAMS – MULTIFAMILY PROGRAMS
170
purchasing model to increase deployment and drive down aggregate solar PV costs on housing authorities.
Commercial Property Assessed Clean Energy138 (C-PACE) funds 100% of project costs with no money down. C-PACE loans are for a term of up to 20 years, and are secured by using a benefit assessment on the borrower’s property tax bill. The program serves market rate as well as affordable multifamily properties; however, to-date, given difficulties acquiring lender consent, multifamily C-PACE financing has been limited, however, the Green Bank was pleased to see HUD issue guidance in 2017 that would allow C-PACE on HUD financed affordable multifamily properties. See Case 1 – C-PACE for more information.
Catalyst Financing139 is available for gap and health and safety financing to help spur
implementation of energy improvements if adequate funds for merited projects cannot be secured from the programs here or other sources. The program is funded in part, by the MacArthur Foundation’s $5 million program-related investment housed at the Housing Development Fund, as well as $1.5 million of Green Bank balance sheet funds, as well as $1.5 million in RGGI funds provide by DEEP to the Green Bank for energy-related health and safety remediation.
Key Performance Indicators The Key Performance Indicators for Multifamily programs closed activity are reflected in Tables 99 through 101. These illustrate the volume of projects by year, investment, generation capacity installed, and the amount of energy saved and/or produced. It also breaks down the volume of projects by energy efficiency, renewable generation, or both.
Table 99. Multifamily Project Types and Investment by FY Closed Fiscal Year Closed EE RE RE/EE # Projects
# Project Units
Amount Financed
Investment (Gross Cost)140
Green Bank Investment141
Private Investment
Leverage Ratio
2012 - - - - - - - - - - 2013 - - - - - - - - - - 2014 1 1 120 $250,000 $420,000 $9,367 $420,000 44.8 2015 1 2 3 6 368 $5,022,454 $5,388,362 $3,527,840 $1,871,101 1.5 2016 2 17 12 31 1,769 $14,677,683 $15,313,030 $1,473,342 $14,008,165 10.4 2017 8 10 18 1,345 $17,822,430 $19,017,556 $349,467 $18,798,986 54.4 Total 3 27 26 56 3,602 $37,772,568 $40,138,948 $5,360,015 $35,098,252 7.5
138 Commercial Property Assessed Clean Energy: http://www.CPACE.com/ 139 Catalyst Financing: http://ctgreenbank.com/programs/multifamily/catalyst‐fund/ 140 Includes closing costs and capitalized interest for C‐PACE and the Fair Market Value for Commercial/Residential Leases. 141 Includes incentives, interest rate buydowns and loan loss reserves.

CONNECTICUT GREEN BANK 5. PROGRAMS – MULTIFAMILY PROGRAMS
171
Table 100. Multifamily Project Capacity, Generation and Savings by FY Closed
Fiscal Year Closed
Installed Capacity
(kW)
Expected Annual
Generation (kWh)
Expected Lifetime
Savings or Generation
(MWh)
Annual Saved /
Produced (MMBtu)
Lifetime Saved /
Produced (MMBtu)
Annual Cost
Savings
Lifetime Cost
Savings 2012 - - - - - - - 2013 - - - - - - - 2014 0.0 0 0 0 0 $69,534 2015 914.0 3,943,030 97,540 13,454 332,806 $433,542 2016 1,429.8 1,904,598 44,023 6,498 150,207 $531,183 2017 1,010.6 1,150,883 28,772 3,927 98,170 $375,183 Total 3,354.5 6,998,511 170,335 23,879 581,183 $1,409,443
Table 101. Multifamily Project Averages by FY Closed
Fiscal Year Closed
Average Gross
System Cost
Average Amount
Financed
Average Amount
Financed per Unit
Average Installed Capacity
(kW)
Average Annual Saved /
Produced (MMBtu)
Average Finance
Term (months)
Average Finance
Rate 2012 - - - - - - - 2013 - - - - - - - 2014 $420,000 $250,000 $2,083 0.0 0 9 0.00 2015 $898,060 $837,076 $13,648 152.3 2,242 10 3.34 2016 $493,969 $473,474 $8,297 46.1 210 12 5.94 2017 $1,056,531 $990,135 $13,251 56.1 218 13 4.98 Total $716,767 $674,510 $10,487 59.9 426 12 4.88

CONNECTICUT GREEN BANK 5. PROGRAMS – MULTIFAMILY PROGRAMS
172
As the Green Bank’s Multifamily programs are partially income-targeted, Table 102 shows a breakdown of projects completed in a year by property type and reflects the number of units impacted.
Table 102. Multifamily Projects by Low to Moderate Income (LMI) or Market Rate Property by FY Closed
Fiscal Year Closed Class Product # of Projects # Units 2014 LMI Term 1 120
Total 1 120
2015 LMI Term 5 286 Market Rate Term 1 82
Total 6 368
2016 LMI Pre-Dev 4 131 Term 26 1,447 Market Rate Term 1 191
Total 31 1,769
2017 LMI Pre-Dev 3 135 Term 14 1,110 Market Rate Pre-Dev 1 100
Total 18 1,345
Total LMI Pre-Dev 7 266 LMI Term 46 2,963 Market Rate Pre-Dev 1 100 Market Rate Term 7 273 Total 56 3,602

CONNECTICUT GREEN BANK 5. PROGRAMS – MULTIFAMILY PROGRAMS
173
Area Median Income Band Penetration For a breakdown of Multifamily volume and investment by census tracts categorized by Area Median Income bands – see Table 103. As a program predominantly focused on properties that serve low-to-moderate income residents, this table doesn’t reflect the degree to which the goal of serving lower income residents is being met. The program is equally focused on affordable housing properties located in more affluent communities and census tracts that are housing families of lower incomes as it is on affordable housing properties in lower income census tracts.
Table 103. Multifamily Activity in Metropolitan Statistical Area (MSA) Area Median Income (AMI) Bands by FY Closed142
Fiscal Year Closed
MSA AMI Band
# of Project Units
% Project Distribution
Investment (Gross System Cost)
% Investment Distribution
Installed Capacity
(MW) % MW
Distribution
Total Owner/Rental Occupied
5+ Unit Households
% Total Household Distribution
Project Units / 1,000
Total Households
Investment / Total
Household
Watts / Total
Household 2012 <60% 0 0% 0 0% 0.0 0% 70,561 35% 0.0 $0.00 0.0 2012 60%-80% 0 0% 0 0% 0.0 0% 43,788 22% 0.0 $0.00 0.0 2012 80%-100% 0 0% 0 0% 0.0 0% 39,234 20% 0.0 $0.00 0.0 2012 100%-120% 0 0% 0 0% 0.0 0% 27,834 14% 0.0 $0.00 0.0 2012 >120% 0 0% 0 0% 0.0 0% 19,133 10% 0.0 $0.00 0.0 2012 Total 0 0% 0 0% 0.0 0% 200,550 100% 0.0 $0.00 0.0 2013 <60% 0 0% 0 0% 0.0 0% 68,381 35% 0.0 $0.00 0.0 2013 60%-80% 0 0% 0 0% 0.0 0% 45,202 23% 0.0 $0.00 0.0 2013 80%-100% 0 0% 0 0% 0.0 0% 39,451 20% 0.0 $0.00 0.0 2013 100%-120% 0 0% 0 0% 0.0 0% 25,294 13% 0.0 $0.00 0.0 2013 >120% 0 0% 0 0% 0.0 0% 19,303 10% 0.0 $0.00 0.0 2013 Total 0 0% 0 0% 0.0 0% 197,631 100% 0.0 $0.00 0.0 2014 <60% 0 0% 0 0% 0.0 0% 68,722 35% 0.0 $0.00 0.0 2014 60%-80% 0 0% 0 0% 0.0 0% 44,830 23% 0.0 $0.00 0.0 2014 80%-100% 120 100% 420,000 100% 0.0 0% 36,752 18% 3.3 $11.43 0.0 2014 100%-120% 0 0% 0 0% 0.0 0% 28,263 14% 0.0 $0.00 0.0 2014 >120% 0 0% 0 0% 0.0 0% 20,384 10% 0.0 $0.00 0.0 2014 Total 120 100% 420,000 100% 0.0 0% 198,951 100% 0.6 $2.11 0.0
142 Excludes projects in unknown bands.
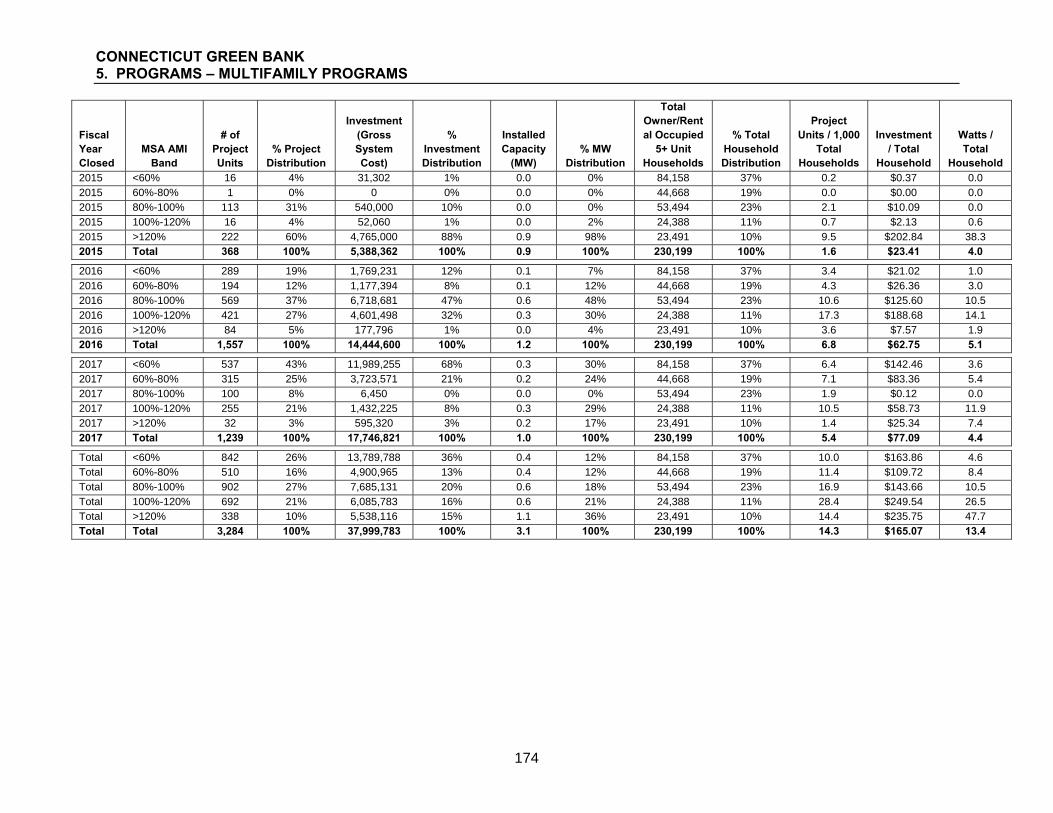
CONNECTICUT GREEN BANK 5. PROGRAMS – MULTIFAMILY PROGRAMS
174
Fiscal Year Closed
MSA AMI Band
# of Project Units
% Project Distribution
Investment (Gross System Cost)
% Investment Distribution
Installed Capacity
(MW) % MW
Distribution
Total Owner/Rental Occupied
5+ Unit Households
% Total Household Distribution
Project Units / 1,000
Total Households
Investment / Total
Household
Watts / Total
Household
2015 <60% 16 4% 31,302 1% 0.0 0% 84,158 37% 0.2 $0.37 0.0 2015 60%-80% 1 0% 0 0% 0.0 0% 44,668 19% 0.0 $0.00 0.0 2015 80%-100% 113 31% 540,000 10% 0.0 0% 53,494 23% 2.1 $10.09 0.0 2015 100%-120% 16 4% 52,060 1% 0.0 2% 24,388 11% 0.7 $2.13 0.6 2015 >120% 222 60% 4,765,000 88% 0.9 98% 23,491 10% 9.5 $202.84 38.3 2015 Total 368 100% 5,388,362 100% 0.9 100% 230,199 100% 1.6 $23.41 4.0 2016 <60% 289 19% 1,769,231 12% 0.1 7% 84,158 37% 3.4 $21.02 1.0 2016 60%-80% 194 12% 1,177,394 8% 0.1 12% 44,668 19% 4.3 $26.36 3.0 2016 80%-100% 569 37% 6,718,681 47% 0.6 48% 53,494 23% 10.6 $125.60 10.5 2016 100%-120% 421 27% 4,601,498 32% 0.3 30% 24,388 11% 17.3 $188.68 14.1 2016 >120% 84 5% 177,796 1% 0.0 4% 23,491 10% 3.6 $7.57 1.9 2016 Total 1,557 100% 14,444,600 100% 1.2 100% 230,199 100% 6.8 $62.75 5.1 2017 <60% 537 43% 11,989,255 68% 0.3 30% 84,158 37% 6.4 $142.46 3.6 2017 60%-80% 315 25% 3,723,571 21% 0.2 24% 44,668 19% 7.1 $83.36 5.4 2017 80%-100% 100 8% 6,450 0% 0.0 0% 53,494 23% 1.9 $0.12 0.0 2017 100%-120% 255 21% 1,432,225 8% 0.3 29% 24,388 11% 10.5 $58.73 11.9 2017 >120% 32 3% 595,320 3% 0.2 17% 23,491 10% 1.4 $25.34 7.4 2017 Total 1,239 100% 17,746,821 100% 1.0 100% 230,199 100% 5.4 $77.09 4.4 Total <60% 842 26% 13,789,788 36% 0.4 12% 84,158 37% 10.0 $163.86 4.6 Total 60%-80% 510 16% 4,900,965 13% 0.4 12% 44,668 19% 11.4 $109.72 8.4 Total 80%-100% 902 27% 7,685,131 20% 0.6 18% 53,494 23% 16.9 $143.66 10.5 Total 100%-120% 692 21% 6,085,783 16% 0.6 21% 24,388 11% 28.4 $249.54 26.5 Total >120% 338 10% 5,538,116 15% 1.1 36% 23,491 10% 14.4 $235.75 47.7 Total Total 3,284 100% 37,999,783 100% 3.1 100% 230,199 100% 14.3 $165.07 13.4
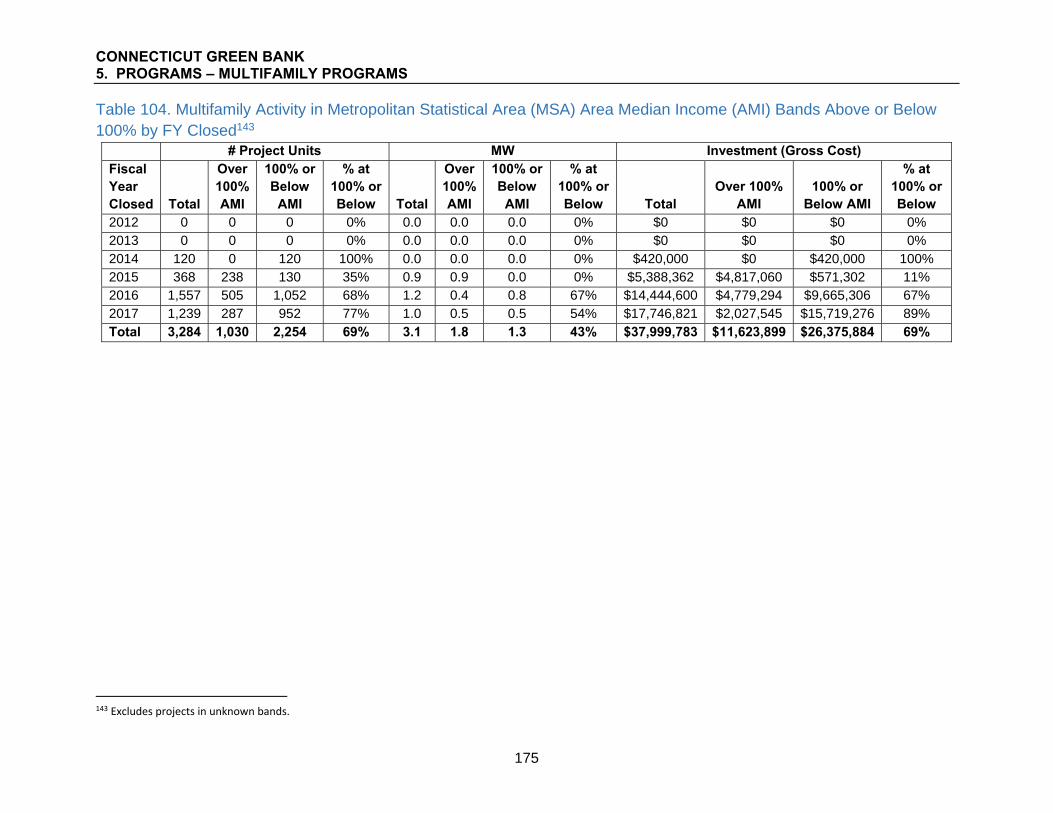
CONNECTICUT GREEN BANK 5. PROGRAMS – MULTIFAMILY PROGRAMS
175
Table 104. Multifamily Activity in Metropolitan Statistical Area (MSA) Area Median Income (AMI) Bands Above or Below 100% by FY Closed143
# Project Units MW Investment (Gross Cost) Fiscal Year Closed Total
Over 100% AMI
100% or Below
AMI
% at 100% or Below Total
Over 100% AMI
100% or Below
AMI
% at 100% or Below Total
Over 100% AMI
100% or Below AMI
% at 100% or Below
2012 0 0 0 0% 0.0 0.0 0.0 0% $0 $0 $0 0% 2013 0 0 0 0% 0.0 0.0 0.0 0% $0 $0 $0 0% 2014 120 0 120 100% 0.0 0.0 0.0 0% $420,000 $0 $420,000 100% 2015 368 238 130 35% 0.9 0.9 0.0 0% $5,388,362 $4,817,060 $571,302 11% 2016 1,557 505 1,052 68% 1.2 0.4 0.8 67% $14,444,600 $4,779,294 $9,665,306 67% 2017 1,239 287 952 77% 1.0 0.5 0.5 54% $17,746,821 $2,027,545 $15,719,276 89% Total 3,284 1,030 2,254 69% 3.1 1.8 1.3 43% $37,999,783 $11,623,899 $26,375,884 69%
143 Excludes projects in unknown bands.

CONNECTICUT GREEN BANK 5. PROGRAMS – MULTIFAMILY PROGRAMS
176
Distressed Community Penetration For a breakdown of Multifamily project volume and investment by census tracts categorized by Distressed Communities – see Table 105. As a program predominantly focused on properties that serve low-to-moderate income residents, this table doesn’t reflect the degree to which the goal of serving lower income residents is being met. The program is equally focused on affordable housing properties located in more affluent communities and census tracts that are housing families of lower incomes as it is on affordable housing properties in lower income census tracts.
Table 105. Multifamily Activity in Distressed Communities by FY Closed
Fiscal Year Closed
Distressed
# of Project Units
% Project Distribution
Investment (Gross System Cost)
% Investment Distribution
Installed Capacity
(MW) % MW
Distribution
2010 Census
Population
% Population Distribution
Investment / Capita
Watts / Capita
2010 Census
Households
% Household Distribution
Investment / Household
Watts / Household
2012 Yes 0 0% $0 0% 0.0 0% 1,172,186 33% $0.00 0.0 449,097 33% $0.00 $0.00 2012 No 0 0% $0 0% 0.0 0% 2,401,911 67% $0.00 0.0 921,990 67% $0.00 $0.00 2012 Total 0 0% $0 0% 0.0 0% 3,574,097 100% $0.00 0.0 1,371,087 100% $0.00 $0.00
2013 Yes 0 0% $0 0% 0.0 0% 1,124,337 31% $0.00 0.0 428,395 31% $0.00 $0.00 2013 No 0 0% $0 0% 0.0 0% 2,449,760 69% $0.00 0.0 942,692 69% $0.00 $0.00 2013 Total 0 0% $0 0% 0.0 0% 3,574,097 100% $0.00 0.0 1,371,087 100% $0.00 $0.00
2014 Yes 0 0% $0 0% 0.0 0% 1,104,894 31% $0.00 0.0 420,721 31% $0.00 $0.00 2014 No 120 100% $420,000 100% 0.0 0% 2,469,203 69% $0.17 0.0 950,366 69% $0.44 $0.00 2014 Total 120 100% $420,000 100% 0.0 0% 3,574,097 100% $0.12 0.0 1,371,087 100% $0.31 $0.00
2015 Yes 211 57% $5,271,302 98% 0.9 98% 1,123,207 31% $4.69 0.8 429,250 31% $12.28 $2.10 2015 No 157 43% $117,060 2% 0.0 2% 2,450,890 69% $0.05 0.0 941,837 69% $0.12 $0.01 2015 Total 368 100% $5,388,362 100% 0.9 100% 3,574,097 100% $1.51 0.3 1,371,087 100% $3.93 $0.67
2016 Yes 321 18% $1,932,553 13% 0.4 28% 1,167,312 33% $1.66 0.3 445,638 33% $4.34 $0.89 2016 No 1,448 82% $13,380,477 87% 1.0 72% 2,406,785 67% $5.56 0.4 925,449 67% $14.46 $1.12 2016 Total 1,769 100% $15,313,030 100% 1.4 100% 3,574,097 100% $4.28 0.4 1,371,087 100% $11.17 $1.04
2017 Yes 497 37% $12,020,088 63% 0.3 25% 1,167,312 33% $10.30 0.2 445,638 33% $26.97 $0.57 2017 No 848 63% $6,997,468 37% 0.8 75% 2,406,785 67% $2.91 0.3 925,449 67% $7.56 $0.82 2017 Total 1,345 100% $19,017,556 100% 1.0 100% 3,574,097 100% $5.32 0.3 1,371,087 100% $13.87 $0.74
Total Yes 1,029 29% $19,223,943 48% 1.5 46% 1,167,312 33% $16.47 1.3 445,638 33% $43.14 $3.48 Total No 2,573 71% $20,915,005 52% 1.8 54% 2,406,785 67% $8.69 0.7 925,449 67% $22.60 $1.95 Total Total 3,602 100% $40,138,948 100% 3.4 100% 3,574,097 100% $11.23 0.9 1,371,087 100% $29.28 $2.45
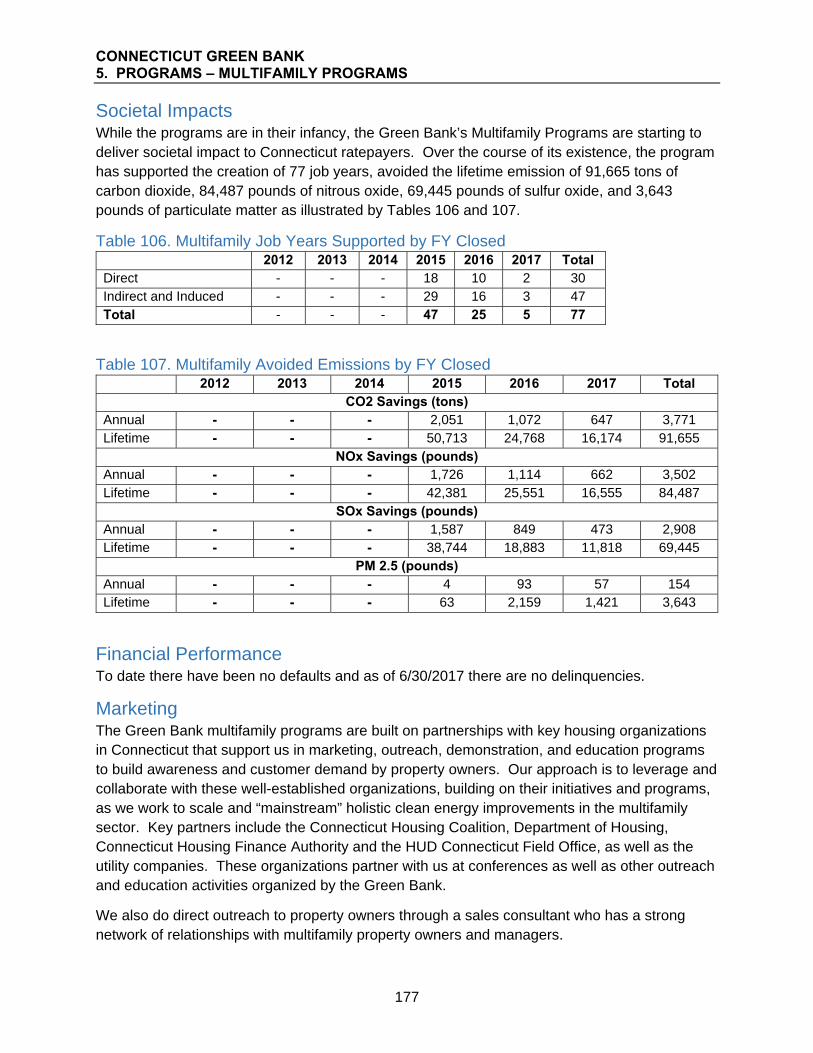
CONNECTICUT GREEN BANK 5. PROGRAMS – MULTIFAMILY PROGRAMS
177
Societal Impacts While the programs are in their infancy, the Green Bank’s Multifamily Programs are starting to deliver societal impact to Connecticut ratepayers. Over the course of its existence, the program has supported the creation of 77 job years, avoided the lifetime emission of 91,665 tons of carbon dioxide, 84,487 pounds of nitrous oxide, 69,445 pounds of sulfur oxide, and 3,643 pounds of particulate matter as illustrated by Tables 106 and 107.
Table 106. Multifamily Job Years Supported by FY Closed 2012 2013 2014 2015 2016 2017 Total Direct - - - 18 10 2 30 Indirect and Induced - - - 29 16 3 47 Total - - - 47 25 5 77
Table 107. Multifamily Avoided Emissions by FY Closed 2012 2013 2014 2015 2016 2017 Total
CO2 Savings (tons) Annual - - - 2,051 1,072 647 3,771 Lifetime - - - 50,713 24,768 16,174 91,655
NOx Savings (pounds) Annual - - - 1,726 1,114 662 3,502 Lifetime - - - 42,381 25,551 16,555 84,487
SOx Savings (pounds) Annual - - - 1,587 849 473 2,908 Lifetime - - - 38,744 18,883 11,818 69,445
PM 2.5 (pounds) Annual - - - 4 93 57 154 Lifetime - - - 63 2,159 1,421 3,643
Financial Performance To date there have been no defaults and as of 6/30/2017 there are no delinquencies.
Marketing The Green Bank multifamily programs are built on partnerships with key housing organizations in Connecticut that support us in marketing, outreach, demonstration, and education programs to build awareness and customer demand by property owners. Our approach is to leverage and collaborate with these well-established organizations, building on their initiatives and programs, as we work to scale and “mainstream” holistic clean energy improvements in the multifamily sector. Key partners include the Connecticut Housing Coalition, Department of Housing, Connecticut Housing Finance Authority and the HUD Connecticut Field Office, as well as the utility companies. These organizations partner with us at conferences as well as other outreach and education activities organized by the Green Bank.
We also do direct outreach to property owners through a sales consultant who has a strong network of relationships with multifamily property owners and managers.

CONNECTICUT GREEN BANK 5. PROGRAMS – MULTIFAMILY PROGRAMS
178
In 2017 we established a Multifamily Peer-to-Peer network where advanced practitioners, including owners, developers, architects, professional service providers and funders, gather on a monthly basis to exchange information and discuss their projects – with the goal of building greater professional capacity in the sector and awareness of Green Bank programs.
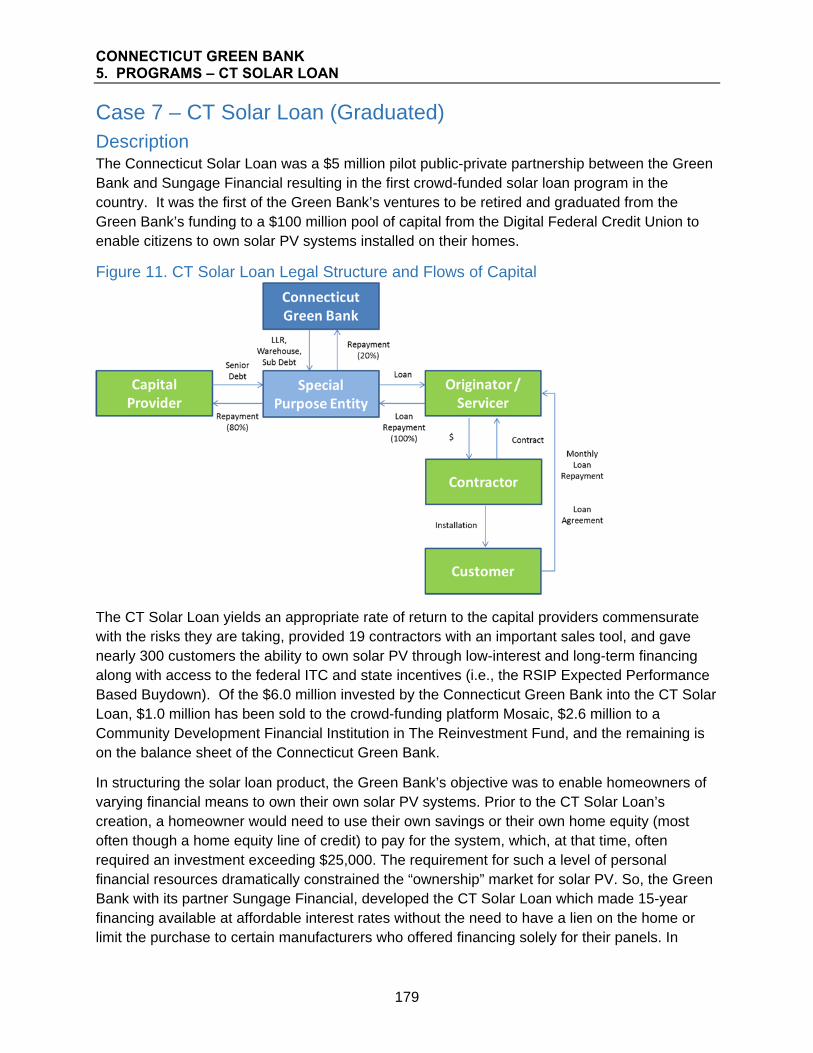
CONNECTICUT GREEN BANK 5. PROGRAMS – CT SOLAR LOAN
179
Case 7 – CT Solar Loan (Graduated) Description The Connecticut Solar Loan was a $5 million pilot public-private partnership between the Green Bank and Sungage Financial resulting in the first crowd-funded solar loan program in the country. It was the first of the Green Bank’s ventures to be retired and graduated from the Green Bank’s funding to a $100 million pool of capital from the Digital Federal Credit Union to enable citizens to own solar PV systems installed on their homes.
Figure 11. CT Solar Loan Legal Structure and Flows of Capital
The CT Solar Loan yields an appropriate rate of return to the capital providers commensurate with the risks they are taking, provided 19 contractors with an important sales tool, and gave nearly 300 customers the ability to own solar PV through low-interest and long-term financing along with access to the federal ITC and state incentives (i.e., the RSIP Expected Performance Based Buydown). Of the $6.0 million invested by the Connecticut Green Bank into the CT Solar Loan, $1.0 million has been sold to the crowd-funding platform Mosaic, $2.6 million to a Community Development Financial Institution in The Reinvestment Fund, and the remaining is on the balance sheet of the Connecticut Green Bank.
In structuring the solar loan product, the Green Bank’s objective was to enable homeowners of varying financial means to own their own solar PV systems. Prior to the CT Solar Loan’s creation, a homeowner would need to use their own savings or their own home equity (most often though a home equity line of credit) to pay for the system, which, at that time, often required an investment exceeding $25,000. The requirement for such a level of personal financial resources dramatically constrained the “ownership” market for solar PV. So, the Green Bank with its partner Sungage Financial, developed the CT Solar Loan which made 15-year financing available at affordable interest rates without the need to have a lien on the home or limit the purchase to certain manufacturers who offered financing solely for their panels. In

CONNECTICUT GREEN BANK 5. PROGRAMS – CT SOLAR LOAN
180
developing the CT Solar Loan, the Green Bank had to overcome the risk of being unable to sell the loans to private investors which would have tied up capital resources of the Green Bank and limited its ability to deploy investment of additional clean energy. Ultimately, the Green Bank became confident that a sufficient rate of return could be offered to enable the investments to “clear” the market without a discount (or loss) to the Green Bank. The combination of crowdsourced funding and a structured private placement enabled the Green Bank to sell the investments with recourse limited to the underlying consumer loans as well as a limited loan loss reserve using American Recovery and Reinvestment Act funds from the US Department of Energy.
The CT Solar Loan was the Connecticut Green Bank’s first residential product graduation. It started off being the first crowd-funded residential solar PV transaction with Sungage Financial through Mosaic.144 And then it graduated to a partnership between Sungage Financial and Digital Federal Credit Union – with no resources from the Connecticut Green Bank.145 The loan offering from Sungage Financial now includes 5, 10, and 20 year maturity terms at affordable interest rates and is being offered in California, Florida, Massachusetts, New Jersey, New York, and Texas – along with solar PV contractors in Connecticut.
Key Performance Indicators The Key Performance Indicators for the CT Solar Loan closed activity are reflected in Tables 108 through 111. These illustrate the volume of projects by year, investment, generation capacity installed, and the amount of energy saved and/or produced. It also breaks down the volume of projects by energy efficiency, renewable generation, or both.
Table 108. CT Solar Loan Project Types and Investment by FY Closed Fiscal Year Closed EE146 RE RE/EE
# Projects
# Project Units
Investment (Gross Cost)147
Green Bank Investment148
Private Investment
Leverage Ratio
2012 - - - - - - - ‐ - 2013 - 3 - 3 3 $86,899 $5,025 $86,899 17.3 2014 - 140 - 140 140 $4,229,733 $232,100 $4,229,733 18.2 2015 - 136 - 136 136 $4,279,512 $222,549 $4,279,512 19.2
2016 - - - - - - - ‐ -
2017 - - - - - - - ‐ - Total 279 279 279 $8,596,143 $459,674 $8,596,143 18.7
144 http://www.businesswire.com/news/home/20140206005031/en/Sungage‐Financial‐CEFIA‐Mosaic‐Announce‐5‐Million#.VgRTgVIXL4Y 145 http://www.ctgreenbank.com/ct‐solar‐loan‐partner‐graduates‐connecticut‐green‐bank/ 146 All projects that receive an RSIP incentive are required to do an energy audit/assessment. 147 Includes closing costs and capitalized interest for C‐PACE and the Fair Market Value for Commercial/Residential Leases. 148 Includes incentives, interest rate buydowns and loan loss reserves.

CONNECTICUT GREEN BANK 5. PROGRAMS – CT SOLAR LOAN
181
Table 109. CT Solar Loan Project Capacity, Generation and Savings by FY Closed
Fiscal Year Closed
Installed Capacity
(kW)
Expected Annual
Generation (kWh)
Expected Lifetime
Savings or Generation
(MWh)
Annual Saved /
Produced (MMBtu)
Lifetime Saved /
Produced (MMBtu)
Annual Cost
Savings
Lifetime Cost
Savings 2012 - - - - - - - 2013 17.0 19,407 485 66 1,655 $3,596 $89,910 2014 1,107.9 1,261,626 31,541 4,305 107,617 $167,832 $4,195,800 2015 1,068.2 1,216,503 30,413 4,151 103,768 $163,037 $4,075,920 2016 - - - - - - - 2017 - - - - - - - Total 2,193.1 2,497,536 62,438 8,522 213,040 $334,465 $8,361,630
Table 110. CT Solar Loan Project Averages by FY Closed
Fiscal Year Closed
Average Gross
System Cost
Average Amount
Financed
Average Installed Capacity
(kW)
Average Annual Saved /
Produced (MMBtu)
Average Finance
Term (months)
Average Finance
Rate Average
DTI
Average FICO Score
2012 - - - - - - - - 2013 $28,966 $19,658 5.7 22 180 5.58 0 758 2014 $30,212 $19,819 7.9 31 180 5.57 0 771 2015 $31,467 $22,942 7.9 31 180 3.34 0 771 2016 - - - - - - - - 2017 - - - - - - - - Total $30,811 $21,340 7.9 31 180 4.48 0 771
Table 111. CT Solar Loan Project Application Yield149 by FY Received Fiscal Year Received
Applications Received
Applications Approved
Applications Withdrawn
Applications Denied
Approved Rate
Denied Rate
2012 - - - - - - 2013 14 12 5 2 86% 14% 2014 284 217 54 67 76% 24% 2015 164 146 37 18 89% 11% 2016 - - - - - - 2017 - - - - - - Total 462 375 96 87 81% 19%
149 Applications received are applications submitted to Sungage Financial (servicer of the CT Solar Loan) for credit approval. Applications approved are applications that have met the credit requirements for the program and can move to loan closing, pending formal technical approval of the solar equipment by the Residential Solar Investment Program. Applications withdrawn are applications that have been cancelled by the submitter due to the project not moving forward. Applications denied are applications that are not approved because the customer does not meet underwriting requirements.

CONNECTICUT GREEN BANK 5. PROGRAMS – CT SOLAR LOAN
182
Area Median Income Band Penetration For a breakdown of the CT Solar Loan volume and investment by census tracts categorized by Area Median Income bands – see Table 112. It should be noted that the CT Solar Loan is not an income-targeted program.
Table 112. CT Solar Loan Activity in Metropolitan Statistical Area (MSA) Area Median Income (AMI) Bands by FY Closed150
Fiscal Year Closed
MSA AMI Band
# of Project Units
% Project Distribution
Investment (Gross System Cost)
% Investment Distribution
Installed Capacity
(MW) % MW
Distribution Total
Households
% Total Household Distribution
Project Units / 1,000
Total Households
Investment / Total
Household
Watts / Total
Household 2012 <60% 0 0% 0 0% 0.0 0% 61,168 7% 0.0 $0.00 0.0 2012 60%-80% 0 0% 0 0% 0.0 0% 101,640 12% 0.0 $0.00 0.0 2012 80%-100% 0 0% 0 0% 0.0 0% 151,346 17% 0.0 $0.00 0.0 2012 100%-120% 0 0% 0 0% 0.0 0% 216,988 25% 0.0 $0.00 0.0 2012 >120% 0 0% 0 0% 0.0 0% 350,196 40% 0.0 $0.00 0.0 2012 Total 0 0% 0 0% 0.0 0% 881,338 100% 0.0 $0.00 0.0 2013 <60% 0 0% 0 0% 0.0 0% 59,494 7% 0.0 $0.00 0.0 2013 60%-80% 1 33% 32,100 37% 0.0 31% 109,189 12% 0.0 $0.29 0.0 2013 80%-100% 0 0% 0 0% 0.0 0% 150,603 17% 0.0 $0.00 0.0 2013 100%-120% 1 33% 36,574 42% 0.0 47% 203,157 23% 0.0 $0.18 0.0 2013 >120% 1 33% 18,225 21% 0.0 22% 351,633 40% 0.0 $0.05 0.0 2013 Total 3 100% 86,899 100% 0.0 100% 874,076 100% 0.0 $0.10 0.0 2014 <60% 1 1% 8,273 0% 0.0 0% 57,673 7% 0.0 $0.14 0.0 2014 60%-80% 3 2% 84,771 2% 0.0 2% 103,934 12% 0.0 $0.82 0.2 2014 80%-100% 24 17% 597,628 14% 0.2 14% 149,038 17% 0.2 $4.01 1.1 2014 100%-120% 49 35% 1,542,441 36% 0.4 37% 209,561 24% 0.2 $7.36 2.0 2014 >120% 63 45% 1,996,620 47% 0.5 47% 348,270 40% 0.2 $5.73 1.5 2014 Total 140 100% 4,229,733 100% 1.1 100% 868,476 100% 0.2 $4.87 1.3 2015 <60% 1 1% 20,835 0% 0.0 0% 64,361 7% 0.0 $0.32 0.1 2015 60%-80% 10 7% 269,810 6% 0.1 6% 96,305 11% 0.1 $2.80 0.7 2015 80%-100% 18 13% 570,355 13% 0.1 13% 164,873 19% 0.1 $3.46 0.8 2015 100%-120% 30 22% 960,907 22% 0.2 23% 184,613 21% 0.2 $5.20 1.3 2015 >120% 77 57% 2,457,604 57% 0.6 58% 352,621 41% 0.2 $6.97 1.8 2015 Total 136 100% 4,279,512 100% 1.1 100% 862,773 100% 0.2 $4.96 1.2 2016 <60% 0 0% 0 0% 0.0 0% 64,361 7% 0.0 $0.00 0.0 2016 60%-80% 0 0% 0 0% 0.0 0% 96,305 11% 0.0 $0.00 0.0
150 Excludes projects in unknown bands.

CONNECTICUT GREEN BANK 5. PROGRAMS – CT SOLAR LOAN
183
Fiscal Year Closed
MSA AMI Band
# of Project Units
% Project Distribution
Investment (Gross System Cost)
% Investment Distribution
Installed Capacity
(MW) % MW
Distribution Total
Households
% Total Household Distribution
Project Units / 1,000
Total Households
Investment / Total
Household
Watts / Total
Household 2016 80%-100% 0 0% 0 0% 0.0 0% 164,873 19% 0.0 $0.00 0.0 2016 100%-120% 0 0% 0 0% 0.0 0% 184,613 21% 0.0 $0.00 0.0 2016 >120% 0 0% 0 0% 0.0 0% 352,621 41% 0.0 $0.00 0.0 2016 Total 0 0% 0 0% 0.0 0% 862,773 100% 0.0 $0.00 0.0 2017 <60% 0 0% 0 0% 0.0 0% 64,361 7% 0.0 $0.00 0.0 2017 60%-80% 0 0% 0 0% 0.0 0% 96,305 11% 0.0 $0.00 0.0 2017 80%-100% 0 0% 0 0% 0.0 0% 164,873 19% 0.0 $0.00 0.0 2017 100%-120% 0 0% 0 0% 0.0 0% 184,613 21% 0.0 $0.00 0.0 2017 >120% 0 0% 0 0% 0.0 0% 352,621 41% 0.0 $0.00 0.0 2017 Total 0 0% 0 0% 0.0 0% 862,773 100% 0.0 $0.00 0.0 Total <60% 2 1% 29,108 0% 0.0 0% 64,361 7% 0.0 $0.45 0.1 Total 60%-80% 14 5% 386,681 4% 0.1 4% 96,305 11% 0.1 $4.02 0.9 Total 80%-100% 42 15% 1,167,983 14% 0.3 14% 164,873 19% 0.3 $7.08 1.8 Total 100%-120% 80 29% 2,539,922 30% 0.7 30% 184,613 21% 0.4 $13.76 3.6 Total >120% 141 51% 4,472,449 52% 1.1 52% 352,621 41% 0.4 $12.68 3.2 Total Total 279 100% 8,596,143 100% 2.2 100% 862,773 100% 0.3 $9.96 2.5
Table 113. CT Solar Loan Activity in Metropolitan Statistical Area (MSA) Area Median Income (AMI) Bands Above or Below 100% by FY Closed151 # Project Units MW Investment (Gross Cost) Fiscal Year Closed Total
Over 100% AMI
100% or Below
AMI
% at 100% or Below Total
Over 100% AMI
100% or Below
AMI
% at 100% or Below Total
Over 100% AMI
100% or Below
AMI
% at 100% or Below
2012 0 0 0 0% 0.0 0.0 0.0 0% $0 $0 $0 0% 2013 3 2 1 33% 0.0 0.0 0.0 31% $86,899 $54,799 $32,100 37% 2014 140 112 28 20% 1.1 0.9 0.2 16% $4,229,733 $3,539,061 $690,671 16% 2015 136 107 29 21% 1.1 0.9 0.2 20% $4,279,512 $3,418,511 $861,001 20% 2016 0 0 0 0% 0.0 0.0 0.0 0% $0 $0 $0 0% 2017 0 0 0 0% 0.0 0.0 0.0 0% $0 $0 $0 0% Total 279 221 58 21% 2.2 1.8 0.4 18% $8,596,143 $7,012,371 $1,583,772 18%
151 Excludes projects in unknown bands.

CONNECTICUT GREEN BANK 5. PROGRAMS – CT SOLAR LOAN
184
Distressed Community Penetration For a breakdown of the CT Solar Loan project volume and investment by census tracts categorized by Distressed Communities – see Table 114. It should be noted that the CT Solar Loan is not an income-targeted program.
Table 114. CT Solar Loan Activity in Distressed Communities by FY Closed
Fiscal Year Closed Distressed
# of Project Units
% Project Distribution
Investment (Gross System Cost)
% Investment Distribution
Installed Capacity
(MW) % MW
Distribution
2010 Census
Population
% Population Distribution
Investment / Capita
Watts / Capita
2010 Census
Households
% Household Distribution
Investment / Household
Watts / Household
2012 Yes 0 0% $0 0% 0.0 0% 1,172,186 33% $0.00 0.0 449,097 33% $0.00 $0.00 2012 No 0 0% $0 0% 0.0 0% 2,401,911 67% $0.00 0.0 921,990 67% $0.00 $0.00 2012 Total 0 0% $0 0% 0.0 0% 3,574,097 100% $0.00 0.0 1,371,087 100% $0.00 $0.00
2013 Yes 2 67% $68,674 79% 0.0 78% 1,124,337 31% $0.06 0.0 428,395 31% $0.16 $0.03 2013 No 1 33% $18,225 21% 0.0 22% 2,449,760 69% $0.01 0.0 942,692 69% $0.02 $0.00 2013 Total 3 100% $86,899 100% 0.0 100% 3,574,097 100% $0.02 0.0 1,371,087 100% $0.06 $0.01
2014 Yes 26 19% $713,759 17% 0.2 18% 1,104,894 31% $0.65 0.2 420,721 31% $1.70 $0.47 2014 No 114 81% $3,515,973 83% 0.9 82% 2,469,203 69% $1.42 0.4 950,366 69% $3.70 $0.96 2014 Total 140 100% $4,229,733 100% 1.1 100% 3,574,097 100% $1.18 0.3 1,371,087 100% $3.08 $0.81
2015 Yes 18 13% $450,815 11% 0.1 11% 1,123,207 31% $0.40 0.1 429,250 31% $1.05 $0.27 2015 No 118 87% $3,828,697 89% 1.0 89% 2,450,890 69% $1.56 0.4 941,837 69% $4.07 $1.01 2015 Total 136 100% $4,279,512 100% 1.1 100% 3,574,097 100% $1.20 0.3 1,371,087 100% $3.12 $0.78
2016 Yes 0 0% $0 0% 0.0 0% 1,167,312 33% $0.00 0.0 445,638 33% $0.00 $0.00 2016 No 0 0% $0 0% 0.0 0% 2,406,785 67% $0.00 0.0 925,449 67% $0.00 $0.00 2016 Total 0 0% $0 0% 0.0 0% 3,574,097 100% $0.00 0.0 1,371,087 100% $0.00 $0.00
2017 Yes 0 0% $0 0% 0.0 0% 1,167,312 33% $0.00 0.0 445,638 33% $0.00 $0.00 2017 No 0 0% $0 0% 0.0 0% 2,406,785 67% $0.00 0.0 925,449 67% $0.00 $0.00 2017 Total 0 0% $0 0% 0.0 0% 3,574,097 100% $0.00 0.0 1,371,087 100% $0.00 $0.00
Total Yes 46 16% $1,233,248 14% 0.3 15% 1,167,312 33% $1.06 0.3 445,638 33% $2.77 $0.73 Total No 233 84% $7,362,895 86% 1.9 85% 2,406,785 67% $3.06 0.8 925,449 67% $7.96 $2.02 Total Total 279 100% $8,596,143 100% 2.2 100% 3,574,097 100% $2.41 0.6 1,371,087 100% $6.27 $1.60

CONNECTICUT GREEN BANK 5. PROGRAMS – CT SOLAR LOAN
185
Societal Impacts Ratepayers in Connecticut continue to enjoy the societal benefits of the CT Solar Loan Program despite its closure. Over the course of its existence, the program has supported the creation of 132 job years, avoided the lifetime emission of 34,990 tons of carbon dioxide, 47,187 pounds of nitrous oxide, 53,746 pounds of sulfur oxide, and 3,133 pounds of particulate matter as illustrated by Tables 115 and 116.
Table 115. CT Solar Loan Job Years Supported by FY Closed 2012 2013 2014 2015 2016 2017 Total Direct - 1 25 25 0 0 51 Indirect and Induced - 1 40 41 0 0 82 Total - 1 65 66 0 0 132
Table 116. CT Solar Loan Avoided Emissions by FY Closed 2012 2013 2014 2015 2016 2017 Total
CO2 Savings (tons) Annual - 11 700 689 - - 1,400 Lifetime - 278 17,497 17,215 - - 34,990
NOx Savings (pounds) Annual - 17 988 883 - - 1,887 Lifetime - 417 24,702 22,068 - - 47,187
SOx Savings (pounds) Annual - 21 1,180 948 - - 2,150 Lifetime - 537 29,504 23,705 - - 53,746
PM 2.5 (pounds) Annual - 1 63 61 - - 125 Lifetime - 24 1,583 1,526 - - 3,133
Financing Program The CT Solar Loan was a financing product developed in partnership with Sungage Financial152 that used credit enhancements (i.e., $300,000 loan loss reserve and $168,000 interest rate buy-downs)153 in combination with a $5 million warehouse of funds and $1 million of subordinated debt from the Connecticut Green Bank. Through this product, the Connecticut Green Bank lowered the barriers to Connecticut homeowners seeking to install solar PV installations thus increasing demand while at the same time reducing the market’s reliance on subsidies being offered through the RSIP. The CT Solar Loan was the first dedicated residential solar loan product not secured by a lien on the home or tied to a particular PV equipment OEM supplier. As a loan, capital provided to consumers for the CT Solar Loan is returned to the Connecticut Green Bank – it is not a subsidy. In fact, approximately 80% of the loan value was sold to retail investors through a “crowd funding” platform or to institutional investors without recourse to the
152 Sungage Financial (http://www.sungagefinancial.com/) won a competitive RFP through the Connecticut Green Bank’s Financial Innovation RFP to support a residential solar PV loan program 153 From repurposed American Recovery and Reinvestment Act funds

CONNECTICUT GREEN BANK 5. PROGRAMS – CT SOLAR LOAN
186
Connecticut Green Bank. The financial structure of the CT Solar Loan product includes origination,154 servicing,155 and financing features in combination with the support of the Connecticut Green Bank.
Launched in March of 2013, the CT Solar Loan provided up to $55,000 per loan, with 15-year maturity terms and affordable 6.49% interest rates (including 0.25% ACH payment benefit) to provide homeowners with the upfront capital they needed to finance residential solar PV projects.
Financial Performance To date there have been no defaults and as of 6/30/2017 there are 2 delinquencies with original principle balances totaling $46,743 or 0.5% of the portfolio.
The household customers that accessed the CT Solar Loan since its launch in 2013 had varying credit scores – see Table 117.
Table 117. Credit Score Ranges of Household Customers Using the CT Solar Loan by FY Closed
-639 640-679 680-699 700-719 720+ Fiscal Year Closed
# Projects
% of Total
# Projects
% of Total
# Projects
% of Total
# Projects
% of Total
# Projects
% of Total
Total # Projects
2013 - 0.0% - 0.0% 0.0% 0.0% 3 100.0% 3 2014 - 0.0% - 0.0% 5 3.6% 7 5.0% 128 91.4% 140 2015 - 0.0% - 0.0% 6 4.4% 8 5.9% 122 89.7% 136 Total - 0.0% - 0.0% 11 3.9% 15 5.4% 253 90.7% 279
Marketing To accelerate the deployment of residential solar PV through the RSIP and the uptake of the CT Solar Loan financing product, the Connecticut Green Bank implemented Solarize Connecticut. Green Bank Solarize programs are designed to use a combination of group purchasing, time-limited offers, and grassroots outreach, while local clean energy advocates volunteer and coordinate with their towns to help speed the process – see Table 118.
Table 118. Number of Projects, Investment, and Installed Capacity through Green Bank Solarize Connecticut for the CT Solar Loan Financing Product
# of Projects Investment (Gross Cost) Installed Capacity (MW) Solarize 168 $4,929,399 1.3 Not Solarize 111 $3,666,744 0.9 Total 279 $8,596,143 2.2 % Solarize 60% 57% 59%
154 Sungage Financial in partnership with local contractors 155 Concord Servicing Corporation

CONNECTICUT GREEN BANK 5. PROGRAMS – CT SOLAR LOAN
187
The Green Bank Solarize Connecticut program provided a significant marketing channel to catalyze origination for the CT Solar Loan comprising nearly 60 percent of the total projects, investment, and installed capacity.
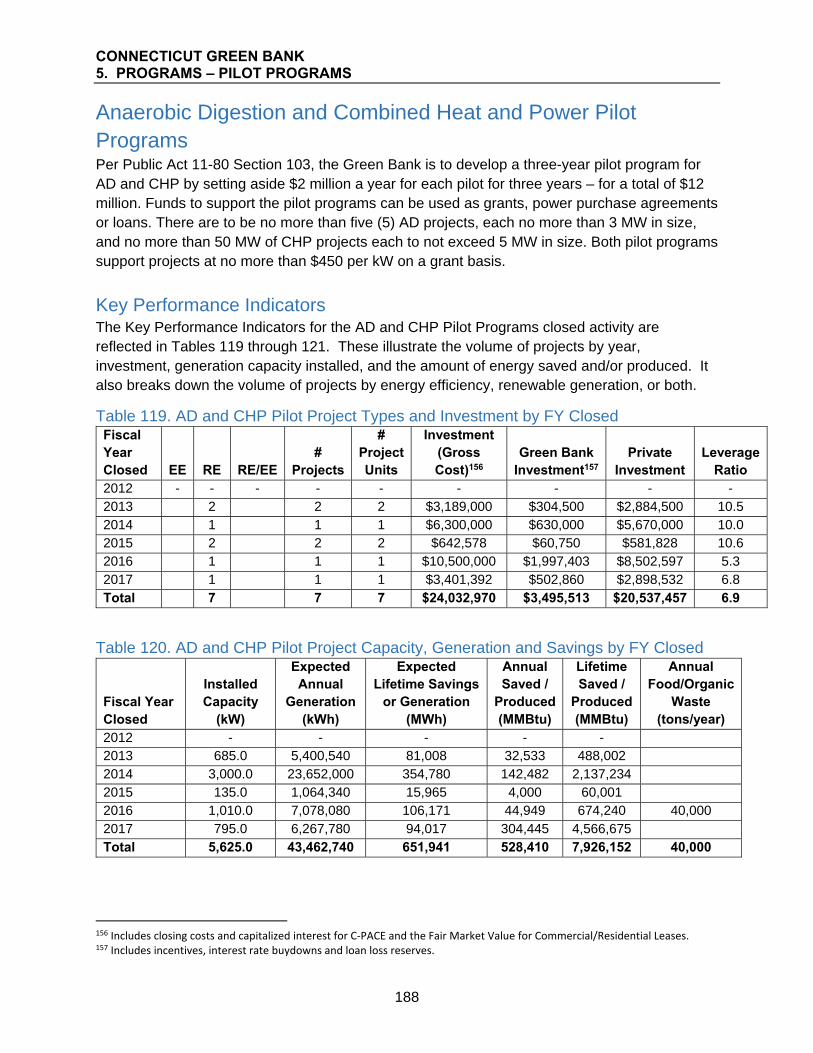
CONNECTICUT GREEN BANK 5. PROGRAMS – PILOT PROGRAMS
188
Anaerobic Digestion and Combined Heat and Power Pilot Programs Per Public Act 11-80 Section 103, the Green Bank is to develop a three-year pilot program for AD and CHP by setting aside $2 million a year for each pilot for three years – for a total of $12 million. Funds to support the pilot programs can be used as grants, power purchase agreements or loans. There are to be no more than five (5) AD projects, each no more than 3 MW in size, and no more than 50 MW of CHP projects each to not exceed 5 MW in size. Both pilot programs support projects at no more than $450 per kW on a grant basis.
Key Performance Indicators The Key Performance Indicators for the AD and CHP Pilot Programs closed activity are reflected in Tables 119 through 121. These illustrate the volume of projects by year, investment, generation capacity installed, and the amount of energy saved and/or produced. It also breaks down the volume of projects by energy efficiency, renewable generation, or both.
Table 119. AD and CHP Pilot Project Types and Investment by FY Closed Fiscal Year Closed EE RE RE/EE
# Projects
# Project Units
Investment (Gross Cost)156
Green Bank Investment157
Private Investment
Leverage Ratio
2012 - - - - - - - - - 2013 2 2 2 $3,189,000 $304,500 $2,884,500 10.5 2014 1 1 1 $6,300,000 $630,000 $5,670,000 10.0 2015 2 2 2 $642,578 $60,750 $581,828 10.6 2016 1 1 1 $10,500,000 $1,997,403 $8,502,597 5.3 2017 1 1 1 $3,401,392 $502,860 $2,898,532 6.8 Total 7 7 7 $24,032,970 $3,495,513 $20,537,457 6.9
Table 120. AD and CHP Pilot Project Capacity, Generation and Savings by FY Closed
Fiscal Year Closed
Installed Capacity
(kW)
Expected Annual
Generation (kWh)
Expected Lifetime Savings
or Generation (MWh)
Annual Saved /
Produced (MMBtu)
Lifetime Saved /
Produced (MMBtu)
Annual Food/Organic
Waste (tons/year)
2012 - - - - - 2013 685.0 5,400,540 81,008 32,533 488,002 2014 3,000.0 23,652,000 354,780 142,482 2,137,234 2015 135.0 1,064,340 15,965 4,000 60,001 2016 1,010.0 7,078,080 106,171 44,949 674,240 40,000 2017 795.0 6,267,780 94,017 304,445 4,566,675 Total 5,625.0 43,462,740 651,941 528,410 7,926,152 40,000
156 Includes closing costs and capitalized interest for C‐PACE and the Fair Market Value for Commercial/Residential Leases. 157 Includes incentives, interest rate buydowns and loan loss reserves.

CONNECTICUT GREEN BANK 5. PROGRAMS – PILOT PROGRAMS
189
Table 121. AD and CHP Pilot Project Averages by FY Closed
Fiscal Year Closed
Average Gross System
Cost
Average Amount
Financed
Average Installed
Capacity (kW)
Average Annual Saved / Produced
(MMBtu) 2012 - - 2013 $1,594,500 $0 342.5 16,267 2014 $6,300,000 $0 3,000.0 142,482 2015 $321,289 $0 67.5 2,000 2016 $10,500,000 $1,997,403 1,010.0 44,949 2017 $3,401,392 $502,860 795.0 304,445 Total $3,433,281 $357,180 803.6 75,487
Societal Impacts Ratepayers in Connecticut continue to enjoy the societal benefits of the AD and CHP Programs despite its closure. Over the course of its existence, these programs have supported the creation of 219 job years as illustrated by Table 122.
Table 122. AD and CHP Pilot Job Years Supported by FY Closed
2012 2013 2014 2015 2016 2017 Total Direct - 20 39 4 0 21 84 Indirect and Induced - 32 62 7 0 34 135 Total - 51 101 11 0 55 219

CONNECTICUT GREEN BANK 5. PROGRAMS – STRATEGIC INVESTMENTS
190
Strategic Investments As opportunities present themselves, the Green Bank from time to time is part of the capital stack for projects that are outside any of the organization’s existing programs. These projects are selected based on the opportunity to expand the organization’s experience with specific technologies, advance economic development in a specific locale, or to drive adoption of clean energy that would otherwise not occur.
Key Performance Indicators The Key Performance Indicators for the Strategic Program closed activity is reflected in Tables 123 through 125. These illustrate the volume of projects by year, investment, generation capacity installed, and the amount of energy saved and/or produced. It also breaks down the volume of projects by energy efficiency, renewable generation, or both.
Table 123. Strategic Project Types and Investment by FY Closed Fiscal Year Closed EE RE RE/EE Other
# Projects
# Project Units
Investment (Gross Cost)158
Green Bank Investment159
Private Investment
Leverage Ratio
2012 - - - - - - - - - 2013 1 1 1 $70,800,000 $5,800,000 $65,000,000 12.2 2014 - - - - - - - - - 2015 1 1 2 2 $56,500,000 $3,227,000 $53,273,000 17.5 2016 - - - - - - - - - 2017 1 1 1 $4,538,212 $3,900,000 $638,212 1.2 Total 3 4 4 $131,838,212 $12,927,000 $118,911,212 10.2
Table 124. Strategic Project Capacity, Generation and Savings by FY Closed
Fiscal Year Closed
Installed Capacity
(kW)
Expected Annual
Generation (kWh)
Expected Lifetime Savings
or Generation (MWh)
Annual Saved /
Produced (MMBtu)
Lifetime Saved /
Produced (MMBtu)
2012 - - - - - 2013 14,800.0 116,683,200 1,166,832 398,123 3,981,231 2014 - - - - - 2015 5,000.0 136,494,997 118,260 465,850 403,503 2016 - - - - - 2017 193.0 825,052 20,626 2,815 70,377 Total 19,993.0 254,003,249 1,305,718 866,788 4,455,111
158 Includes closing costs and capitalized interest for C‐PACE and the Fair Market Value for Commercial/Residential Leases. 159 Includes incentives, interest rate buydowns and loan loss reserves.

CONNECTICUT GREEN BANK 5. PROGRAMS – STRATEGIC INVESTMENTS
191
Table 125. Strategic Project Averages by FY Closed
Fiscal Year Closed
Average Gross
System Cost
Average Amount
Financed
Average Installed
Capacity (kW)
Average Annual Saved / Produced
(MMBtu) 2012 - - - - 2013 $70,800,000 $5,800,000 14,800.0 398,123 2014 - - - - 2015 $28,250,000 $1,613,500 2,500.0 232,925 2016 - - - - 2017 $4,538,212 $3,900,000 193.0 2,815 Total $32,959,553 $3,231,750 4,998.3 216,697
Societal Impacts Ratepayers in Connecticut enjoy of the societal benefits of Strategic Investments. Over the course of its existence, the program has supported the creation of 1,119 job years, avoided the emission 153,004 tons of carbon dioxide, 689,616 pounds of nitrous oxide, 503,689 pounds of sulfur oxide, and 4,644 pounds of particulate matter as illustrated by Tables 126 and 127.
Table 126. Strategic Job Years Supported by FY Closed 2012 2013 2014 2015 2016 2017 Total Direct - 340 0 0 0 0 340 Indirect and Induced - 779 0 0 0 0 779 Total - 1,119 0 0 0 0 1,119
Table 127. Strategic Avoided Emissions by FY Closed 2012 2013 2014 2015 2016 2017 Total
CO2 Savings (tons) Annual - 7,876 0 4,235 0 429 12,540 Lifetime - 78,761 0 63,528 0 10,715 153,004
NOx Savings (pounds) Annual - 63,009 0 3,377 0 355 66,741 Lifetime - 630,089 0 50,658 0 8,869 689,616
SOx Savings (pounds) Annual - 45,623 0 2,628 0 322 48,572 Lifetime - 456,231 0 39,414 0 8,044 503,689
PM 2.5 (pounds) Annual - 0 0 310 0 0 310 Lifetime - 0 0 4,644 0 0 4,644

CONNECTICUT GREEN BANK 6. APPENDIX
192
6. Appendix Community Activity Table See the Municipality Tables in here.160
Contractor Activity Table See the Contractor Tables in here.161
Trained Contractor Table See the Trained Contractor table in here.162
Calculations and Assumptions Table 128. Capacity Factors and Expected Useful Life (EUL) By Technology Technology Capacity Factor EUL AD 0.80 15 CHP 0.90 15 EE 0 12 Fuel Cell 0.90 10 Geothermal 0 25 Hydro 0.49 25 PV 0.13 25 PV/Biomass 0.13 25 Solar Thermal 0 20 Wind 0.18 15
Table 129. Job Year Factors by Year Approved by Technology
2009 Factors - Approved prior to 6/30/2016
2016 Factors - Approved after 7/1/2016
Direct Job
Years
Indirect and
Induced Jobs
Total Job
Years per $1M Invested
Direct Job
Years
Indirect and
Induced Jobs
Total Job
Years per $1M Invested
Renewable Energy Fuel Cell Manufacturing 4.8 11.0 15.8 4.9 6.4 11.3 Fuel Cell R&D/Engineering1 0.0 0.0 0.0 2.9 3.8 6.7 Solar PV - Residential 5.9 9.5 15.4 3.9 5.1 9.0 Solar PV - Non-Residential 3.4 5.4 8.8 3.1 4.0 7.1 Ductless Split Heat Pump 0.0 0.0 0.0 6.7 8.7 15.4 Geothermal 8.3 13.3 21.6 6.7 8.7 15.4 Solar Thermal 7.6 12.2 19.8 5.6 7.3 12.9
160 http://www.ctgreenbank.com/fy17‐cafr‐nfs‐appendix/ 161 http://www.ctgreenbank.com/fy17‐cafr‐nfs‐appendix/ 162 http://www.ctgreenbank.com/fy17‐cafr‐nfs‐appendix/

CONNECTICUT GREEN BANK 6. APPENDIX
193
2009 Factors - Approved prior to 6/30/2016
2016 Factors - Approved after 7/1/2016
Direct Job
Years
Indirect and
Induced Jobs
Total Job
Years per $1M Invested
Direct Job
Years
Indirect and
Induced Jobs
Total Job
Years per $1M Invested
Renewable Energy Wind Installation 0.0 0.0 0.0 6.2 8.0 14.2 Hydro Installation 0.0 0.0 0.0 6.2 8.0 14.2 EV Charging Stations - Installation 0.0 0.0 0.0 3.1 4.0 7.1 Storage Installation1 0.0 0.0 0.0 2.2 2.9 5.1 CHP2 6.2 9.9 16.1 6.2 8.1 14.3
Energy Efficiency Residential 12.9 20.6 33.5 - - - Residential Lighting1 0.0 0.0 0.0 7.7 10.0 17.7 Residential Home Energy Solutions (HES) - Audits1 0.0 0.0 0.0 7.8 10.2 18.0 Residential HES - Weatherization & HVAC 0.0 0.0 0.0 5.6 7.3 12.9 Residential Gas Conversion 0.0 0.0 0.0 5.6 7.3 12.9 Small Business Energy Advantage 9.1 14.6 23.7 6.2 8.0 14.2 Large Commercial and Industrial 7.6 12.2 19.8 5.6 7.3 12.9 1. Not currently being used. 2. Developed by Green Bank.
Table 130. Residential Single Family Annual and Lifetime MMBTUs and Cost Savings
Improvement Type
Average Annual Savings MMBTUs
Average Lifetime Savings MMBTUs
Average Annual $ Savings
Average Lifetime $ Savings
Average Expected
Useful Life (EUL)
Air Source Heat Pump 10 190 $419 $8,374 20 Boiler 18 370 $372 $7,441 20 Central AC 3 58 $142 $2,552 18 Ductless Heat Pump 10 176 $443 $7,975 18 Furnace 15 295 $357 $7,136 20 Geothermal Heat Pump 5 104 $1,593 $31,860 20 Heat Pump Water Heater 6 78 $215 $2,584 12 Insulation 19 471 $413 $10,328 25 Other 7 138 $154 $3,075 20 Solar Hot Water Heater 6 157 $150 $3,740 25 Solar PV1 27 680 $1,199 $29,970 25 Water Heater 5 102 $78 $1,564 20 Windows 8 197 $134 $3,362 25 1. Used for other residential market programs.

CONNECTICUT GREEN BANK 6. APPENDIX
194
Table 131. Average Emission Rates by Year Completed by Technology
Year Completed 2016 4 2015 2014 2013 2012 5
CO2 tons AD 0.000 0.000 0.000 0.000 0.000 CHP 0.000 0.000 0.000 0.000 0.000 EE Only1 0.543 0.570 0.549 0.555 0.536 Fuel Cell2 0.068 0.068 0.068 0.068 0.068 Geothermal2 0.400 0.400 0.400 0.400 0.400 Hydro2 0.520 0.520 0.520 0.520 0.520 Solar PV1 0.562 0.575 0.551 0.572 0.558 Solar Thermal2 0.547 0.547 0.547 0.547 0.547 Wind1 0.537 0.575 0.562 0.558 0.523
NOX pounds AD 0.000 0.000 0.000 0.000 0.000 CHP 0.000 0.000 0.000 0.000 0.000 EE Only1 0.480 0.648 0.739 0.741 0.548 Fuel Cell2 0.540 0.540 0.540 0.540 0.540 Geothermal2 0.335 0.335 0.335 0.335 0.335 Hydro2 0.430 0.430 0.430 0.430 0.430 Solar PV1 0.575 0.697 0.790 0.859 0.689 Solar Thermal2 0.453 0.453 0.453 0.453 0.453 Wind1 0.428 0.642 0.760 0.737 0.469
SO2 pounds AD 0.000 0.000 0.000 0.000 0.000 CHP 0.000 0.000 0.000 0.000 0.000 EE Only1 0.340 0.665 0.890 0.952 0.732 Fuel Cell2 0.391 0.391 0.391 0.391 0.391 Geothermal2 0.297 0.297 0.297 0.297 0.297 Hydro2 0.390 0.390 0.390 0.390 0.390 Solar PV1 0.411 0.698 0.956 1.107 0.911 Solar Thermal2 0.411 0.411 0.411 0.411 0.411 Wind1 0.333 0.723 1.012 1.000 0.643
PM2.5 pounds3 AD 0.000 0.000 0.000 0.000 0.000 CHP 0.000 0.000 0.000 0.000 0.000 EE Only1 0.043 0.045 0.045 0.045 0.045 Fuel Cell2 0.000 0.000 0.000 0.000 0.000 Geothermal2 0.000 0.000 0.000 0.000 0.000 Hydro2 0.000 0.000 0.000 0.000 0.000 Solar PV1 0.049 0.050 0.050 0.050 0.050 Solar Thermal2 0.000 0.000 0.000 0.000 0.000 Wind1 0.039 0.044 0.044 0.044 0.044 1. Average Emission Rates from AVERT Model. 2. Average Emission Rates from 2007 New England Marginal Emission Rate Analysis. 3. PM 2.5 Rates for 2010 - 2014 are unavailable and use the 2015 rates. 4. 2016 rates are used for projects completed in 2017 and those pending completion. 5. 2012 rates are used for projects completed prior to 2012.
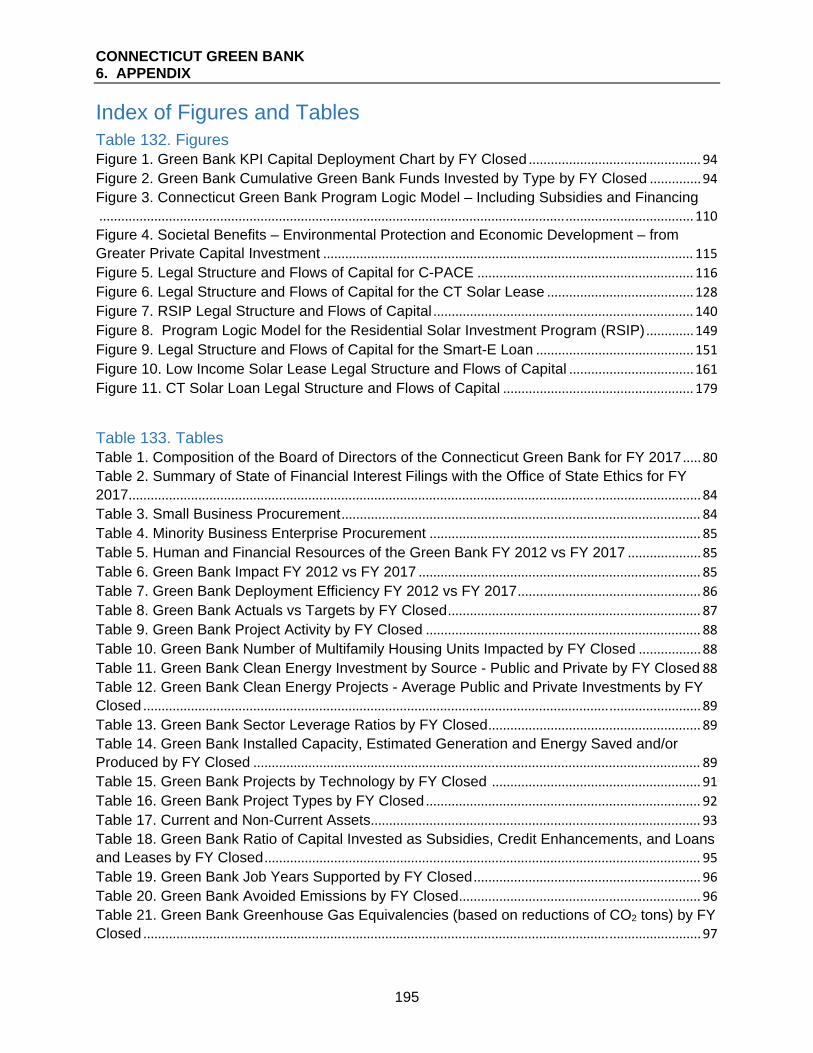
CONNECTICUT GREEN BANK 6. APPENDIX
195
Index of Figures and Tables Table 132. Figures Figure 1. Green Bank KPI Capital Deployment Chart by FY Closed ............................................... 94 Figure 2. Green Bank Cumulative Green Bank Funds Invested by Type by FY Closed .............. 94 Figure 3. Connecticut Green Bank Program Logic Model – Including Subsidies and Financing .................................................................................................................................................................. 110
Figure 4. Societal Benefits – Environmental Protection and Economic Development – from Greater Private Capital Investment ..................................................................................................... 115 Figure 5. Legal Structure and Flows of Capital for C-PACE ........................................................... 116 Figure 6. Legal Structure and Flows of Capital for the CT Solar Lease ........................................ 128 Figure 7. RSIP Legal Structure and Flows of Capital ....................................................................... 140 Figure 8. Program Logic Model for the Residential Solar Investment Program (RSIP) ............. 149 Figure 9. Legal Structure and Flows of Capital for the Smart-E Loan ........................................... 151 Figure 10. Low Income Solar Lease Legal Structure and Flows of Capital .................................. 161 Figure 11. CT Solar Loan Legal Structure and Flows of Capital .................................................... 179
Table 133. Tables Table 1. Composition of the Board of Directors of the Connecticut Green Bank for FY 2017 ..... 80 Table 2. Summary of State of Financial Interest Filings with the Office of State Ethics for FY 2017 ............................................................................................................................................................ 84 Table 3. Small Business Procurement .................................................................................................. 84 Table 4. Minority Business Enterprise Procurement .......................................................................... 85 Table 5. Human and Financial Resources of the Green Bank FY 2012 vs FY 2017 .................... 85 Table 6. Green Bank Impact FY 2012 vs FY 2017 ............................................................................. 85 Table 7. Green Bank Deployment Efficiency FY 2012 vs FY 2017 .................................................. 86 Table 8. Green Bank Actuals vs Targets by FY Closed ..................................................................... 87 Table 9. Green Bank Project Activity by FY Closed ........................................................................... 88 Table 10. Green Bank Number of Multifamily Housing Units Impacted by FY Closed ................. 88 Table 11. Green Bank Clean Energy Investment by Source - Public and Private by FY Closed 88 Table 12. Green Bank Clean Energy Projects - Average Public and Private Investments by FY Closed ........................................................................................................................................................ 89 Table 13. Green Bank Sector Leverage Ratios by FY Closed .......................................................... 89 Table 14. Green Bank Installed Capacity, Estimated Generation and Energy Saved and/or Produced by FY Closed .......................................................................................................................... 89 Table 15. Green Bank Projects by Technology by FY Closed ......................................................... 91 Table 16. Green Bank Project Types by FY Closed ........................................................................... 92 Table 17. Current and Non-Current Assets .......................................................................................... 93 Table 18. Green Bank Ratio of Capital Invested as Subsidies, Credit Enhancements, and Loans and Leases by FY Closed ....................................................................................................................... 95 Table 19. Green Bank Job Years Supported by FY Closed .............................................................. 96 Table 20. Green Bank Avoided Emissions by FY Closed .................................................................. 96 Table 21. Green Bank Greenhouse Gas Equivalencies (based on reductions of CO2 tons) by FY Closed ........................................................................................................................................................ 97

CONNECTICUT GREEN BANK 6. APPENDIX
196
Table 22. The “Top 5” Energy, Environment, and Economy Metrics based on FY 2017 Closed Activity ........................................................................................................................................................ 98 Table 23. The “Top 5” Energy, Environment, and Economy Metrics based on FY 2012 – 2017 Closed Activity .......................................................................................................................................... 98 Table 24. Overview of Population and Households in 2015 American Community Survey (ACS) Metropolitan Statistical Area (MSA) Area Median Income (AMI) Bands ......................................... 99 Table 25. Overview of Population and Households in 2015 American Community Survey (ACS) Metropolitan Statistical Area (MSA) State Median Income (SMI) Bands ........................................ 99 Table 26. Green Bank Residential Activity in Metropolitan Statistical Area (MSA) Area Median Income (AMI) Bands by FY Closed .................................................................................................... 100 Table 27. Green Bank Residential Activity in Metropolitan Statistical Area (MSA) State Median Income (SMI) Bands by FY Closed .................................................................................................... 102 Table 28. Green Bank Residential Activity in Metropolitan Statistical Area (MSA) Area Median Income (AMI) Bands Above or Below 100% by FY Closed ............................................................ 104 Table 29. Green Bank Residential Activity in Metropolitan Statistical Area (MSA) State Median Income (SMI) Bands Above or Below 100% by FY Closed ............................................................ 105 Table 30. Distressed and Not Distressed Municipalities, Population, and Households in Connecticut ............................................................................................................................................. 105 Table 31. Green Bank Commercial and Residential Activity in Distressed Communities by FY Closed ...................................................................................................................................................... 106 Table 32. Credit Score Ranges of Household Borrowers Using Residential Financing Programs .................................................................................................................................................................. 107
Table 33. Green Bank Commercial and Residential Activity in Metropolitan Statistical Area (MSA) Area Median Income (AMI) Bands Above or Below 80% by FY Closed .......................... 108 Table 34. Green Bank Activity in Residential and Commercial Markets by FY Closed .............. 109 Table 35. C-PACE Project Types and Investment by FY Closed ................................................... 117 Table 36. C-PACE Project Capacity, Generation and Savings by FY Closed.............................. 117 Table 37. C-PACE Project Averages by FY Closed ......................................................................... 118 Table 38. C-PACE Project Application Yield by FY Received ........................................................ 118 Table 39. Types of End-Use Customers Participating in C-PACE ................................................. 119 Table 40. Municipalities Participating in C-PACE ............................................................................. 119 Table 41. C-PACE Activity in Metropolitan Statistical Area (MSA) Area Median Income (AMI) Bands by FY Closed .............................................................................................................................. 123 Table 42. C-PACE Activity in Metropolitan Statistical Area (MSA) Area Median Income (AMI) Bands Above or Below 100% by FY Closed ...................................................................................... 124 Table 43. C-PACE Activity in Distressed Communities by FY Closed .......................................... 125 Table 44. C-PACE Job Years Supported by FY Closed .................................................................. 126 Table 45. C-PACE Avoided Emissions by FY Closed ...................................................................... 126 Table 46. Commercial Solar Lease Project Types and Investment by FY Closed ...................... 129 Table 47. Residential Solar Lease Project Investment by FY Closed ........................................... 129 Table 48. Commercial Solar Lease Project Capacity, Generation and Savings by FY Closed . 130 Table 49. Residential Solar Lease Project Capacity, Generation and Savings by FY Closed .. 130 Table 50. Commercial Solar Lease Project Averages by FY Closed ............................................. 130 Table 51. Residential Solar Lease Project Averages by FY Closed .............................................. 131 Table 52. Residential Solar Lease Project Application Yield by FY Received ............................. 131

CONNECTICUT GREEN BANK 6. APPENDIX
197
Table 53. Types of End-Use Customers Participating in Commercial Solar Lease .................... 131 Table 54. Commercial Solar Lease Activity in Metropolitan Statistical Area (MSA) Area Median Income (AMI) Bands by FY Closed ..................................................................................................... 132 Table 55. Residential Solar Lease Activity in Metropolitan Statistical Area (MSA) Area Median Income (AMI) Bands by FY Closed ..................................................................................................... 133 Table 56. Commercial Solar Lease Activity in Metropolitan Statistical Area (MSA) Area Median Income (AMI) Bands Above or Below 100% by FY Closed ............................................................. 135 Table 57. Residential Solar Lease Activity in Metropolitan Statistical Area (MSA) Area Median Income (AMI) Bands Above or Below 100% by FY Closed ............................................................. 135 Table 58. Commercial Solar Lease Activity in Distressed Communities by FY Closed .............. 136 Table 59. Residential Solar Lease Activity in Distressed Communities by FY Closed ............... 137 Table 60. Commercial and Residential Solar Lease Job Years Supported by FY Closed ......... 138 Table 61. Commercial and Residential Solar Lease Avoided Emissions by FY Closed ............. 138 Table 62. Credit Score Ranges of Household Customers Using the CT Solar Lease by FY Closed ...................................................................................................................................................... 139 Table 63. Number of Projects, Investment, and Installed Capacity through Green Bank Solarize Connecticut for the CT Solar Lease Financing Product ................................................................... 139 Table 64. RSIP Subsidy by Step and Incentive Type ....................................................................... 140 Table 65. RSIP Project Types and Investment by FY Closed ......................................................... 141 Table 66. RSIP Project Capacity, Generation and Savings by FY Closed ................................... 141 Table 67. RSIP Project Averages by FY Closed ............................................................................... 141 Table 68. RSIP Project Application Yield by FY Received .............................................................. 142 Table 69. RSIP Systems Closed through the Subsidy by Step ...................................................... 142 Table 70. RSIP Third Party Owned vs Homeowner-owned Systems ............................................ 142 Table 71. RSIP Activity in Metropolitan Statistical Area (MSA) Area Median Income (AMI) Bands by FY Closed........................................................................................................................................... 143 Table 72. RSIP Activity in Metropolitan Statistical Area (MSA) Area Median Income (AMI) Bands Above or Below 100% by FY Closed .................................................................................................. 144 Table 73. RSIP Activity in Distressed Communities by FY Closed ................................................ 145 Table 74. RSIP Job Years Supported by FY Closed ........................................................................ 146 Table 75. RSIP Avoided Emissions by FY Closed ............................................................................ 146 Table 76. RSIP Green Bank Solarize Volume, Capacity and Cost Data by FY Closed .............. 147 Table 77. Smart-E Loan Project Types and Investment by FY Closed ......................................... 151 Table 78. Smart-E Loan Project Capacity, Generation and Savings by FY Closed .................... 151 Table 79. Smart-E Loan Project Averages by FY Closed ................................................................ 152 Table 80. Smart-E Loan Project Application Yield by FY Received ............................................... 152 Table 81. Smart-E Loan Activity in Metropolitan Statistical Area (MSA) Area Median Income (AMI) Bands by FY Closed ................................................................................................................... 153 Table 82. Smart-E Loan Activity in Metropolitan Statistical Area (MSA) Area Median Income (AMI) Bands Above or Below 100% by FY Closed ........................................................................... 154 Table 83. Smart-E Loan Activity in Distressed Communities by FY Closed ................................. 155 Table 84. Smart-E Loan Job Years Supported by FY Closed ......................................................... 156 Table 85. Smart-E Loan Avoided Emissions by FY Closed ............................................................ 156 Table 86. Credit Score Ranges of Household Customers Using the Smart-E Loan by FY Closed .................................................................................................................................................................. 157

CONNECTICUT GREEN BANK 6. APPENDIX
198
Table 87. Smart-E Loan Lenders ......................................................................................................... 157 Table 88. Number of Projects, Investment, and Installed Capacity through Solarize Connecticut for the Smart-E Loan ............................................................................................................................. 158 Table 89. Smart-E Loan Project Channels ......................................................................................... 158 Table 90. Smart-E Loan Measures ..................................................................................................... 159 Table 91. Low Income Solar Lease Project Types and Investment by FY Closed ...................... 162 Table 92. Low Income Solar Lease Project Capacity, Generation and Savings by FY Closed . 162 Table 93. Low Income Solar Lease Project Averages by FY Closed ............................................ 163 Table 94. Low Income Solar Lease Activity in Metropolitan Statistical Area (MSA) Area Median Income (AMI) Bands by FY Closed ..................................................................................................... 164 Table 95. Low Income Solar Lease Activity in Metropolitan Statistical Area (MSA) Area Median Income (AMI) Bands Above or Below 100% by FY Closed ............................................................. 165 Table 96. Low Income Solar Lease Activity in Distressed Communities by FY Closed .............. 166 Table 97. Low Income Solar Lease Job Years Supported by FY Closed ..................................... 167 Table 98. Low Income Solar Lease Avoided Emissions by FY Closed ......................................... 167 Table 99. Multifamily Project Types and Investment by FY Closed ............................................... 170 Table 100. Multifamily Project Capacity, Generation and Savings by FY Closed ........................ 171 Table 101. Multifamily Project Averages by FY Closed ................................................................... 171 Table 102. Multifamily Projects by Low to Moderate Income (LMI) or Market Rate Property by FY Closed ................................................................................................................................................ 172 Table 103. Multifamily Activity in Metropolitan Statistical Area (MSA) Area Median Income (AMI) Bands by FY Closed .............................................................................................................................. 173 Table 104. Multifamily Activity in Metropolitan Statistical Area (MSA) Area Median Income (AMI) Bands Above or Below 100% by FY Closed ...................................................................................... 175 Table 105. Multifamily Activity in Distressed Communities by FY Closed .................................... 176 Table 106. Multifamily Job Years Supported by FY Closed ............................................................ 177 Table 107. Multifamily Avoided Emissions by FY Closed ................................................................ 177 Table 108. CT Solar Loan Project Types and Investment by FY Closed ...................................... 180 Table 109. CT Solar Loan Project Capacity, Generation and Savings by FY Closed ................. 181 Table 110. CT Solar Loan Project Averages by FY Closed ............................................................ 181 Table 111. CT Solar Loan Project Application Yield by FY Received ........................................... 181 Table 112. CT Solar Loan Activity in Metropolitan Statistical Area (MSA) Area Median Income (AMI) Bands by FY Closed ................................................................................................................... 182 Table 113. CT Solar Loan Activity in Metropolitan Statistical Area (MSA) Area Median Income (AMI) Bands Above or Below 100% by FY Closed ........................................................................... 183 Table 114. CT Solar Loan Activity in Distressed Communities by FY Closed .............................. 184 Table 115. CT Solar Loan Job Years Supported by FY Closed ..................................................... 185 Table 116. CT Solar Loan Avoided Emissions by FY Closed ......................................................... 185 Table 117. Credit Score Ranges of Household Customers Using the CT Solar Loan by FY Closed ...................................................................................................................................................... 186 Table 118. Number of Projects, Investment, and Installed Capacity through Green Bank Solarize Connecticut for the CT Solar Loan Financing Product ..................................................... 186 Table 119. AD and CHP Pilot Project Types and Investment by FY Closed ................................ 188 Table 120. AD and CHP Pilot Project Capacity, Generation and Savings by FY Closed ........... 188 Table 121. AD and CHP Pilot Project Averages by FY Closed ...................................................... 189

CONNECTICUT GREEN BANK 6. APPENDIX
199
Table 122. AD and CHP Pilot Job Years Supported by FY Closed ............................................... 189 Table 123. Strategic Project Types and Investment by FY Closed ................................................ 190 Table 124. Strategic Project Capacity, Generation and Savings by FY Closed ........................... 190 Table 125. Strategic Project Averages by FY Closed ...................................................................... 191 Table 126. Strategic Job Years Supported by FY Closed ............................................................... 191 Table 127. Strategic Avoided Emissions by FY Closed ................................................................... 191 Table 128. Capacity Factors and Expected Useful Life (EUL) By Technology ........................... 192 Table 129. Job Year Factors by Year Approved by Technology .................................................... 192 Table 130. Residential Single Family Annual and Lifetime MMBTUs and Cost Savings ........... 193 Table 131. Average Emission Rates by Year Completed by Technology ..................................... 194 Table 132. Figures ................................................................................................................................. 195 Table 133. Tables ................................................................................................................................... 195