of orange county (a component unit of the …a component unit of the county of orange, california)...
TRANSCRIPT

(a Component Unit of the County of Orange, California)
● ● ● www.occhildrenandfamilies.com
● ● ●
Comprehensive Annual Financial Report For the Fiscal Year Ended June 30, 2013

CHILDREN AND FAMILIES COMMISSION OF ORANGE COUNTY
(a Component Unit of the County of Orange, California)
COMPREHENSIVE ANNUAL FINANCIAL REPORT For the Fiscal Year Ended June 30, 2013
Prepared by:
Michael Garcell, CPA

CHILDREN AND FAMILIES COMMISSION OF ORANGE COUNTY (a Component Unit of the
County of Orange, California)
COMPREHENSIVE ANNUAL FINANCIAL REPORT
For the Year Ended June 30, 2013
Michael Garcell, CPA
Finance Manager

CHILDREN AND FAMILIES COMMISSION
OF ORANGE COUNTY FOR THE YEAR ENDED JUNE 30, 2013
Table of Contents INTRODUCTORY SECTION: Page(s)
Letter of Transmittal………………………………………………………………………………………. i
Board of Commissioners…………………………………………………………………………............... iv
Organization Chart………………………………………………………………………………………… v
FINANCIAL SECTION:
Independent Auditors’ Report……...…………………………………………………………….……….. 1
Management’s Discussion and Analysis (Required Supplementary Information).........................……….. 3
Basic Financial Statements:
Statement of Net Position………………………………………………………………………..…….. 15
Statement of Activities………………………………………………………………………………… 16
Governmental Fund Balance Sheet……………………………………………………………………. 17
Reconciliation of the Governmental Fund Balance Sheet to the Statement of Net Position………….…………………………………………………………
18
Governmental Fund Revenues, Expenditures and Changes in Fund Balance…………………………………………..…….………
19
Reconciliation of the Change in Fund Balance to the Changes in Fund Balance to the Statement of Activities………………………..……………
20
Statement of Revenues, Expenditures and Changes in Fund Balance – Budget and Actual……………..………………………..………………..…………
21
Notes to Basic Financial Statements…………………………………………………………………… 22
OTHER SUPPLEMENTARY INFORMATION:
Schedule of First 5 California Funding………………………………………………………………… 34
STATISTICAL SECTION:
Financial Trends
Net Position by Component………………………………………………….………………………… 36
Changes in Net Position..………………………………………………………………………………. 38
Fund Balances – General Fund………………………………………………………………………… 40
Changes in Fund Balance – General Fund……………………………………………………………... 42
Revenue Capacity
First 5 California County Tax Revenue Capacity……………………………………………………… 44
State of California-Cigarette Taxes and Other Tobacco Products Surtax Revenue…………………... 45
State of California-Cigarette Distributions and Per Capita Consumption……………………………... 46
Demographic Information
Demographic Data……………………………………………………………………………………... 47
Live Births, California Counties……………………………………………………………………….. 48
Children’s Score Card Orange County...………………………………………………………………. 49

STATISTICAL SECTION (Continued):
Operating Information
Capital Assets Statistics………………………………………………………………………………... 50
Principal Employers……………………………………………………………………………………. 51
Employees by Function………………………………………………………………………………… 52
COMPLIANCE SECTION:
Independent Auditors’ Report on Internal Control Over Financial Reporting and On Compliance and Other Matters Based on an Audit of Financial Statements Performed in Accordance with Government Auditing Standards………………………………… 54
Independent Auditors’ Report on State Compliance…………………………………………………... 56

i
17320 Red Hill Avenue, Suite 200 Irvine, California 92614 714-834-5310 FAX: 949-474-2243
October 2, 2013 Board of Commissioners Children and Families Commission of Orange County 17320 Redhill Avenue Suite 200 Irvine, CA 92614 Dear Commissioners, The Comprehensive Annual Financial Report (CAFR) of the Children and Families Commission of Orange County (the Commission) is hereby submitted. This report contains financial statements that have been prepared in conformity with United States generally accepted accounting principles (GAAP) prescribed for governmental entities. Responsibility for the accuracy of the data and the completeness and fairness of the presentation, including all disclosures, rests with the management of the Commission. To the best of our knowledge and belief, the enclosed data is accurate in all material aspects and is reported in a manner that presents fairly the financial position and changes to the financial position of the Children and Families Commission of Orange County. All disclosures necessary to enable the reader to gain an understanding of the Commission’s financial activities have been included. The CAFR has been audited by the independent certified public accounting firm of Vavrinek, Trine, Day & Co., LLP. The goal of the independent audit was to provide reasonable assurance about whether the basic financial statements of the Commission for the year ended June 30, 2013, are free of material misstatement. The independent certified public accounting firm has issued an unmodified (“clean”) opinion on the Commission’s financial statements as of and for the year ended June 30, 2013. The independent auditors’ report is located at the front of the financial section of this report. This letter of transmittal is designed to complement and should be read in conjunction with the Management’s Discussion and Analysis (MD&A) that immediately follows the independent auditors’ report. The MD&A provides a narrative introduction, overview, and an analysis of the basic financial statements. Profile of the Commission The Commission was established by the Orange County Board of Supervisors in September 1999 following the passage of Proposition 10, through which California voters made an unprecedented investment in early childhood development. Our activities have been built to develop, adopt, promote and implement early childhood development. Since inception, the Commission has made a lasting positive impact in Orange County through its expenditures of approximately $616 million toward grants, programs and operations that improve the well-being of young children and families in Orange County.

ii
Relevant Financial Policies Financial Plan The Long-Term Financial Plan was reviewed and revised in April 2013 to address current economic issues, emerging program needs, and future demand on Commission resources. The revised Long-Term Financial Plan includes one-time catalytic funding investments focused on key Commission priorities. The goal of catalytic funding is to reduce or eliminate future ongoing support for several major programs. First round catalytic investments totaling $45 million were made to support Autism/Early Developmental programs, Children’s Dental, Emergency Shelters, Early Literacy & Math, Healthy Child Development, and VISTA program transition. Round two catalytic funding priorities consist of investments in Partnerships for Children’s Health, Prevention Program Planning, Nutrition and Fitness, Vision Screening and Capacity Building. Staff will continue to monitor and report on the total $55 million catalytic allocation as expenses are realized. The FY 2013-2014 Operating Budget, presented in April 2013, includes the funding actions taken earlier this year to fund catalytic programs and renew funding for core programs that support the four goal areas. The step-down approach continues to be embedded in the approved Long-Term Financial Plan, and assumes a reduction of base budget program spending from $30 million to $27.6 million in FY 2013/14 and $25.1 million in FY 2014/15. The budget plan continues the reduction of program spending gradually, depending on actual revenue, to bring the total budget in line with the forecasted revenue and a reduction in fund balance not already allocated to Catalytic funding. Strategic Plan Although changes in the long-term funding plan were made, the Commission will continue to utilize the Strategic Plan adopted in April 2013 for fiscal year 2013-2014 detailing our continuing commitment to partnering with the Orange County community to improve the lives of expectant parents, children from the prenatal stage through age 5 and their families. This will be the guide by which we will plan, develop, implement and evaluate our activities through 2014. Other Financial Information Internal Control The management of the Commission is responsible for establishing and maintaining internal controls designed to ensure that the assets of the public entity are protected from loss, theft, or misuse. Management is also responsible for ensuring that adequate accounting data are compiled to allow for the preparation of the basic financial statements in conformity with accounting principles generally accepted in the United States of America. Internal controls are designed to provide reasonable, but not absolute, assurance that these objectives are met. The concept of reasonable assurance recognizes that: (1) the cost of a control should not exceed the benefits likely to be derived; and (2) the valuation of costs and benefits requires estimates and judgments by management.
iii
Budgetary Control The objective of budgetary control is to ensure that spending is limited to the total amount authorized by the Board of Commissioners. The initial budget for fiscal year 2012-2013 was adopted on April 4, 2012 with subsequent adjustments approved in November 7, 2012 and April 3, 2013. The Executive Director has the discretion to adjust the budget as defined within the budget policy of the Board of Commissioners. Monthly financial highlights are provided to the Board of Commissioners. Risk Management The Commission manages its risk exposure in part through the purchase of Workers Compensation, Property, General Liability, Auto, Crime and Directors and Officers insurance through the County of Orange. Awards and Acknowledgements The Government Finance Officers Association of the United States and Canada (GFOA) awarded a Certificate of Achievement for Excellence in Financial Reporting to the Commission for its Comprehensive Annual Financial Report (CAFR) for the fiscal year ended June 30, 2012. This was the third consecutive year that the government has achieved this prestigious award. In order to be awarded a Certificate of Achievement, the government must publish an easily readable and efficiently organized CAFR. This report must satisfy both accounting principles generally accepted in the United State of America and applicable legal requirements. A Certificate of Achievement is valid for a period of one year only. We believe that our current CAFR continues to meet the Certificate of Achievement program’s requirements and we are submitting it to the GFOA to determine its eligibility for another certificate. I would like to express my sincere appreciation to Commission staff and the staff of the certified public accounting firm of Vavrinek, Trine, Day & Co., LLP. I hope this report will be of interest and use to those in the County of Orange, other governmental agencies, and the public interested in the financial activity of the Commission. Sincerely,
Christina Altmayer Executive Director

CHILDREN AND FAMILIES COMMISSION OF ORANGE COUNTY
BOARD OF COMMISSIONERS FOR THE FISCAL YEAR ENDED JUNE 30, 2013
iv
BOARD MEMBERS (9)
Michael L. Riley, Ph.D. (M)
Social Services Agency Chair
Kimberly Cripe (A) Vice Chair
Sandra Barry (A) Chair Pro-tem
Katherine Ahn, DDS (A)
Hugh Hewitt (A)
Maria E. Minon, M.D. (A)
Janet Nguyen (M) Board of Supervisors
Mark Refowitz (M) Health Care Agency
Sandra Pierce (A)
(M) Mandatory members (A) At-large members
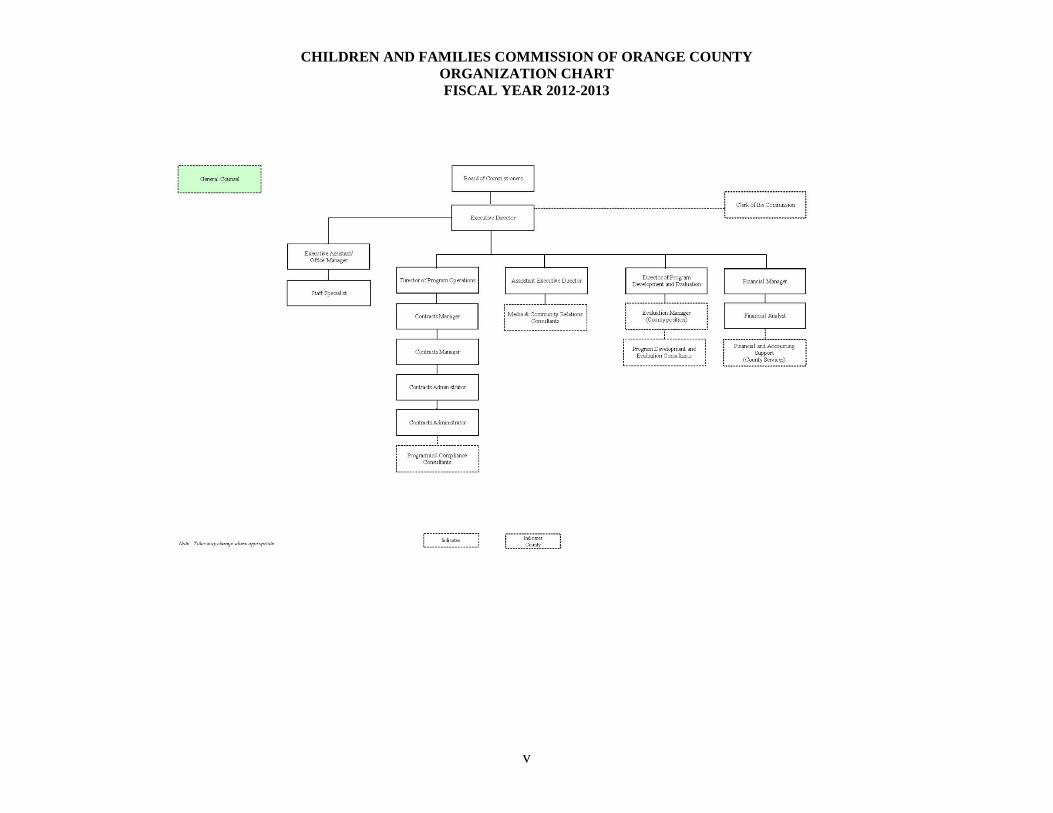
CHILDREN AND FAMILIES COMMISSION OF ORANGE COUNTY ORGANIZATION CHART FISCAL YEAR 2012-2013
v

vi

1
INDEPENDENT AUDITORS’ REPORT
To the Board of Commissioners Children and Families Commission of Orange County Report on the Financial Statements We have audited the accompanying financial statements of the governmental activities and the general fund of the Children and Families Commission of Orange County (Commission), a component unit of the County of Orange, California, as of and for the year ended June 30, 2013, and the related notes to the financial statements, which collectively comprise the Commission’s basic financial statements as listed in the table of contents. Management’s Responsibility for the Financial Statements Management is responsible for the preparation and fair presentation of these financial statements in accordance with accounting principles generally accepted in the United States of America; this includes the design, implementation, and maintenance of internal control relevant to the preparation and fair presentation of financial statements that are free from material misstatement, whether due to fraud or error. Auditors’ Responsibility Our responsibility is to express opinions on these financial statements based on our audit. We conducted our audit in accordance with auditing standards generally accepted in the United States of America and the standards applicable to financial audits contained in Government Auditing Standards, issued by the Comptroller General of the United States. Those standards require that we plan and perform the audit to obtain reasonable assurance about whether the financial statements are free from material misstatement. An audit involves performing procedures to obtain audit evidence about the amounts and disclosures in the financial statements. The procedures selected depend on the auditor’s judgment, including the assessment of the risks of material misstatement of the financial statements, whether due to fraud or error. In making those risk assessments, the auditor considers internal control relevant to the entity’s preparation and fair presentation of the financial statements in order to design audit procedures that are appropriate in the circumstances, but not for the purpose of expressing an opinion on the effectiveness of the entity’s internal control. Accordingly, we express no such opinion. An audit also includes evaluating the appropriateness of accounting policies used and the reasonableness of significant accounting estimates made by management, as well as evaluating the overall presentation of the financial statements. We believe that the audit evidence we have obtained is sufficient and appropriate to provide a basis for our audit opinions. Opinions In our opinion, the financial statements referred to above present fairly, in all material respects, the respective financial position of the governmental activities and general fund of the Commission as of June 30, 2013, and the respective changes in financial position thereof and the respective budgetary comparison for the General Fund for the year then ended in accordance with accounting principles generally accepted in the United States of America.
Vavrinek, Trine, Day & Co., LLPCertified Public Accountants
VALUE THE D IFFERENCE
FRESN O • L AGUN A H I L LS • PALO ALTO • P LEASANTON • RAN C HO CUC AMON GA • R I v E R S I d E • SACRAMENTO
25231 Paseo De Alicia, Suite 100 Laguna Hills, CA 92653 Tel: 949.768.0833 Fax: 949.768.8408 www.vtdcpa.com

2
Emphasis of Matter As described in Note 1 to the financial statements, the Commission adopted Governmental Accounting Standards Board (GASB) Statement No. 63, Financial Reporting of Deferred Outflows of Resources, Deferred Inflows of Resources, and Net Position, effective July 1, 2012. Our opinion is not modified with respect to this matter. Other Matters Required Supplementary Information Accounting principles generally accepted in the United States of America require that the Management’s Discussion and Analysis on pages 3 through 14 be presented to supplement the basic financial statements. Such information, although not a part of the basic financial statements, is required by the Governmental Accounting Standards Board, who considers it to be an essential part of financial reporting for placing the basic financial statements in an appropriate operational, economic, or historical context. We have applied certain limited procedures to the required supplementary information in accordance with auditing standards generally accepted in the United States of America, which consisted of inquiries of management about the methods of preparing the information and comparing the information for consistency with management’s responses to our inquiries, the basic financial statements, and other knowledge we obtained during our audit of the basic financial statements. We do not express an opinion or provide any assurance on the information because the limited procedures do not provide us with sufficient evidence to express an opinion or provide any assurance. Other Information Our audit was conducted for the purpose of forming opinions on the financial statements that collectively comprise the Commission’s basic financial statements. The Introductory Section, Schedule of First 5 California Funding (Schedule), and Statistical Section are presented for purposes of additional analysis and are not a required part of the basic financial statements. The Schedule is the responsibility of management and was derived from and relates directly to the underlying accounting and other records used to prepare the basic financial statements. Such information has been subjected to the auditing procedures applied in the audit of the basic financial statements and certain additional procedures, including comparing and reconciling such information directly to the underlying accounting and other records used to prepare the basic financial statements or to the basic financial statements themselves, and other additional procedures in accordance with auditing standards generally accepted in the United States of America. In our opinion, the Schedule is fairly stated in all material respects in relation to the basic financial statements as a whole. The introductory and statistical sections have not been subjected to the auditing procedures applied in the audit of the basic financial statements and, accordingly, we do not express an opinion or provide any assurance on them. Other Reporting Required by Government Auditing Standards In accordance with Government Auditing Standards, we have also issued our report dated September 27, 2013, on our consideration of the Commission’s internal control over financial reporting and on our tests of its compliance with certain provisions of laws, regulations, contracts, and grant agreements and other matters. The purpose of that report is to describe the scope of our testing of internal control over financial reporting and compliance and the results of that testing, and not to provide an opinion on internal control over financial reporting or on compliance. That report is an integral part of an audit performed in accordance with Government Auditing Standards in considering the Commission’s internal control over financial reporting and compliance. Laguna Hills, California September 27, 2013
CHILDREN AND FAMILIES COMMISSION OF ORANGE COUNTY MANAGEMENT’S DISCUSSION AND ANALYSIS
(UNAUDITED) JUNE 30, 2013
3
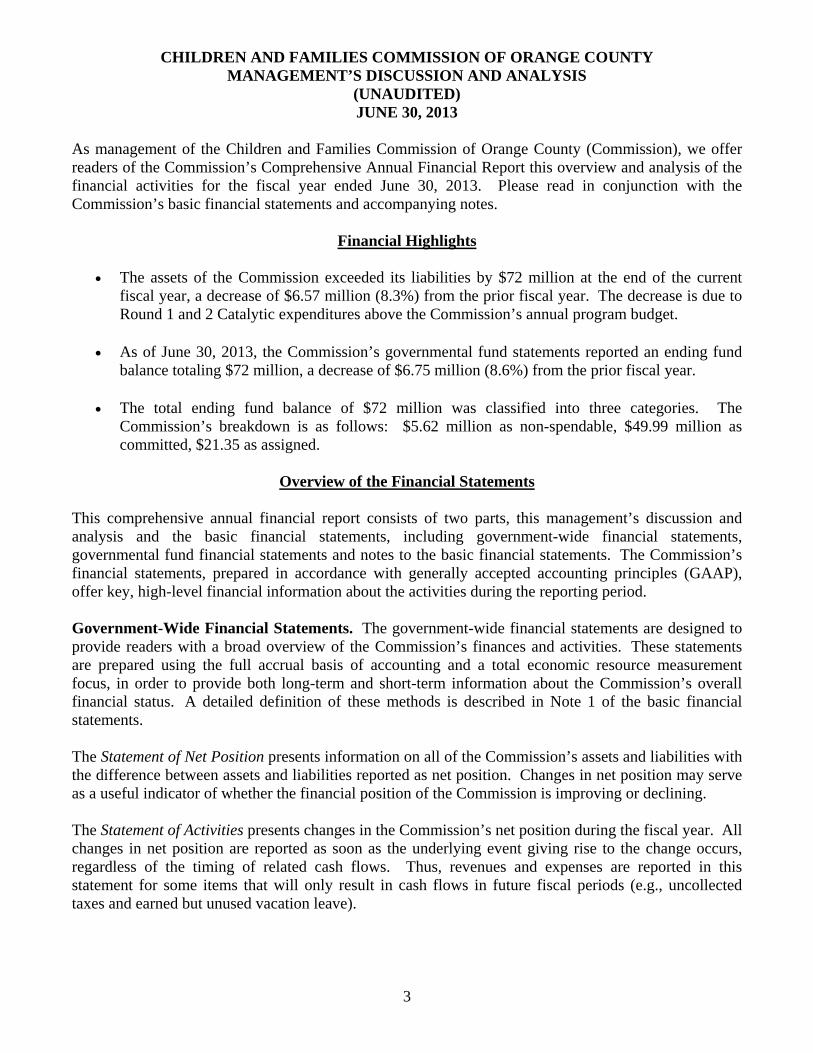
As management of the Children and Families Commission of Orange County (Commission), we offer readers of the Commission’s Comprehensive Annual Financial Report this overview and analysis of the financial activities for the fiscal year ended June 30, 2013. Please read in conjunction with the Commission’s basic financial statements and accompanying notes.
Financial Highlights
The assets of the Commission exceeded its liabilities by $72 million at the end of the current fiscal year, a decrease of $6.57 million (8.3%) from the prior fiscal year. The decrease is due to Round 1 and 2 Catalytic expenditures above the Commission’s annual program budget.
As of June 30, 2013, the Commission’s governmental fund statements reported an ending fund balance totaling $72 million, a decrease of $6.75 million (8.6%) from the prior fiscal year.
The total ending fund balance of $72 million was classified into three categories. The Commission’s breakdown is as follows: $5.62 million as non-spendable, $49.99 million as committed, $21.35 as assigned.
Overview of the Financial Statements
This comprehensive annual financial report consists of two parts, this management’s discussion and analysis and the basic financial statements, including government-wide financial statements, governmental fund financial statements and notes to the basic financial statements. The Commission’s financial statements, prepared in accordance with generally accepted accounting principles (GAAP), offer key, high-level financial information about the activities during the reporting period. Government-Wide Financial Statements. The government-wide financial statements are designed to provide readers with a broad overview of the Commission’s finances and activities. These statements are prepared using the full accrual basis of accounting and a total economic resource measurement focus, in order to provide both long-term and short-term information about the Commission’s overall financial status. A detailed definition of these methods is described in Note 1 of the basic financial statements. The Statement of Net Position presents information on all of the Commission’s assets and liabilities with the difference between assets and liabilities reported as net position. Changes in net position may serve as a useful indicator of whether the financial position of the Commission is improving or declining. The Statement of Activities presents changes in the Commission’s net position during the fiscal year. All changes in net position are reported as soon as the underlying event giving rise to the change occurs, regardless of the timing of related cash flows. Thus, revenues and expenses are reported in this statement for some items that will only result in cash flows in future fiscal periods (e.g., uncollected taxes and earned but unused vacation leave).

CHILDREN AND FAMILIES COMMISSION OF ORANGE COUNTY MANAGEMENT’S DISCUSSION AND ANALYSIS
(UNAUDITED) JUNE 30, 2013
4
Fund Financial Statements. A fund is a grouping of related accounts that is used to maintain control over resources that have been segregated for specific activities or objectives. Fund accounting is used to ensure and demonstrate compliance with finance-related and legal requirements. All of the Commission’s activities are accounted for in the general fund. Governmental funds are used to account for essentially the same functions reported as governmental activities in the government-wide financial statements. However, unlike the government-wide financial statements, governmental fund financial statements focus on near-term inflows and outflows of spendable resources, as well as on balances of spendable resources available at the end of the year. Such information may be useful in evaluating the Commission’s near-term financing requirements. Because the focus of government funds is narrower than that of the government-wide financial statements, it is useful to compare the information presented for governmental funds with similar information presented for governmental activities in the government-wide financial statements. By doing so, readers may better understand the long-term impact of the Commission’s near-term financial decisions. Reconciliations are presented for the Balance Sheet of governmental funds and the Statement of Revenues, Expenditures and Changes in Fund Balances of governmental funds to facilitate comparison between governmental funds and governmental activities. Governmental Fund Financial Statements are prepared on a modified accrual basis, which means that they measure only current financial resources and uses. Capital assets and long-term liabilities are not presented in the Governmental Fund Financial Statements, as they do not represent current available resources or obligations. The Commission adopts an annual appropriated budget for the general fund. A budgetary comparison statement for the general fund is presented in the basic financial statements to demonstrate compliance with the adopted budget. Notes to the Financial Statements. The notes provide additional information that is essential to a full understanding of the data provided in the government-wide and fund financial statements. The notes to the financial statements can be found immediately following the basic financial statements.
Analysis of the Commission’s Government-wide Financial Statements
Net Position. Net position may serve over time as a useful indicator of a government’s financial position. In the case of the Commission, net position was $72.41 million at the end of the current fiscal year, an 8% decrease from the prior fiscal year. Following is a summary of the government-wide Statement of Net Position comparing balances at June 30, 2013 and June 30, 2012.

CHILDREN AND FAMILIES COMMISSION OF ORANGE COUNTY MANAGEMENT’S DISCUSSION AND ANALYSIS
(UNAUDITED) JUNE 30, 2013
5
The Commission’s net position as of June 30, 2013 is considered unrestricted because their use is not for a purpose narrower than the purpose of the Commission and were comprised of the following:
Percent Increase FY 2012-13 FY 2011-12 (Decrease)
Assets: Cash and investments $69,280,830 $83,017,827 -17% Imprest cash 15,000 15,000 -
Interest receivable 19,931 71,795 -72% Deposit with others 5,380,606 93,625 +5,647% Due from County of Orange 881 3,738 -76% Due from other governments 5,836,164 6,151,327 -5% Prepaid expense 243,435 65,657 +271% Total assets $80,776,847 $89,419,968 -10%
Liabilities: Accounts payable and accrued liabilities $2,847,704 $3,862,837 -26% Due to County of Orange 9,593 77,574 -88% Due to other governments 3,673,252 3,898,071 -6% Retentions payable 1,634,093 2,384,936 -31% Accrued wages and benefits 70,254 76,718 -8% Compensated absences: Payable within one year 77,336 87,838 -12% Payable after one year 53,482 46,509 15% Total liabilities 8,365,714 10,434,483 -20% Net Position: Unrestricted 72,411,134 78,985,485 -8% Total net position $72,411,134 $78,985,485

CHILDREN AND FAMILIES COMMISSION OF ORANGE COUNTY MANAGEMENT’S DISCUSSION AND ANALYSIS
(UNAUDITED) JUNE 30, 2013
6
Assets, Current and Other
Cash and investments totaled $69.3 million. All of the $69.3 million was invested in the Orange County Investment Pool (OCIP), except for a small petty cash fund held at the Commission. The investments in OCIP are managed by the County Treasurer and reviewed for compliance with the Commission’s Annual Investment Policy.
Due from other governments totaled $5.8 million. Of this amount, $4.9 million is Prop 10 tobacco tax revenue due from the State of California for May and June 2013 allocations.
Deposits with others totaling $5.4 million represents funds advanced or transferred to contractors for services not provided by June 30, 2013. The large increase in this account is due to funds transferred for Round 1 and 2 Catalytic programs.
Other current assets totaling $0.26 million consisting of $0.02 million in interest receivable and $0.24 million in prepaid expense.
$0
$20
$40
$60
$80
$100
$120
$140
6/30/09 06/30/10 6/30/11 6/30/12 6/30/13
Net PositionComparison of Last Five Fiscal Years
($ in millions)

CHILDREN AND FAMILIES COMMISSION OF ORANGE COUNTY MANAGEMENT’S DISCUSSION AND ANALYSIS
(UNAUDITED) JUNE 30, 2013
7
Liabilities Accounts payable and accrued expenses and due to other governments totaled $6.5 million.
Payables to grantees for services not yet billed at June 30, 2013 are based on established contract terms. The accounts payable decrease is due to more timely billing by contractors and lower program spending.
Retentions payable totaled $1.6 million. Retentions payable are held until end of contract audits are completed and received by the Commission to ensure compliance with contract terms.
Other current liabilities totaling $0.2 million consisting of amounts due to the County of Orange and accrued wages and benefits.
AssetsAs of June 30, 2013
Cash & investments
Receivables
Deposits with others
Due from other governments
Prepaid expense
LiabilitiesAs of June 30, 2013
Accounts payable & accrued liabilities
Due to County of Orange
Due to other governments
Retentions payable
CHILDREN AND FAMILIES COMMISSION OF ORANGE COUNTY MANAGEMENT’S DISCUSSION AND ANALYSIS
(UNAUDITED) JUNE 30, 2013
8
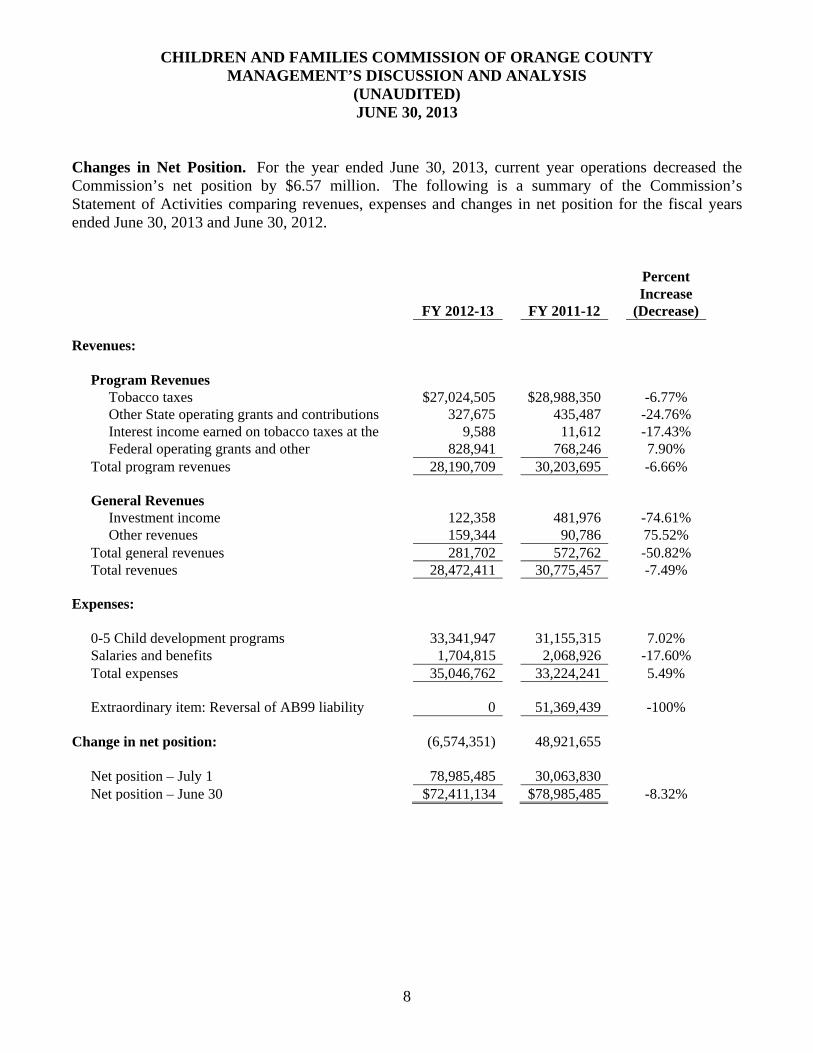
Changes in Net Position. For the year ended June 30, 2013, current year operations decreased the Commission’s net position by $6.57 million. The following is a summary of the Commission’s Statement of Activities comparing revenues, expenses and changes in net position for the fiscal years ended June 30, 2013 and June 30, 2012. Percent Increase FY 2012-13 FY 2011-12 (Decrease) Revenues: Program Revenues Tobacco taxes $27,024,505 $28,988,350 -6.77% Other State operating grants and contributions 327,675 435,487 -24.76% Interest income earned on tobacco taxes at the 9,588 11,612 -17.43% Federal operating grants and other 828,941 768,246 7.90% Total program revenues 28,190,709 30,203,695 -6.66% General Revenues Investment income 122,358 481,976 -74.61% Other revenues 159,344 90,786 75.52% Total general revenues 281,702 572,762 -50.82% Total revenues 28,472,411 30,775,457 -7.49% Expenses: 0-5 Child development programs 33,341,947 31,155,315 7.02% Salaries and benefits 1,704,815 2,068,926 -17.60% Total expenses 35,046,762 33,224,241 5.49% Extraordinary item: Reversal of AB99 liability 0 51,369,439 -100% Change in net position: (6,574,351) 48,921,655 Net position – July 1 78,985,485 30,063,830 Net position – June 30 $72,411,134 $78,985,485 -8.32%
CHILDREN AND FAMILIES COMMISSION OF ORANGE COUNTY MANAGEMENT’S DISCUSSION AND ANALYSIS
(UNAUDITED) JUNE 30, 2013
9
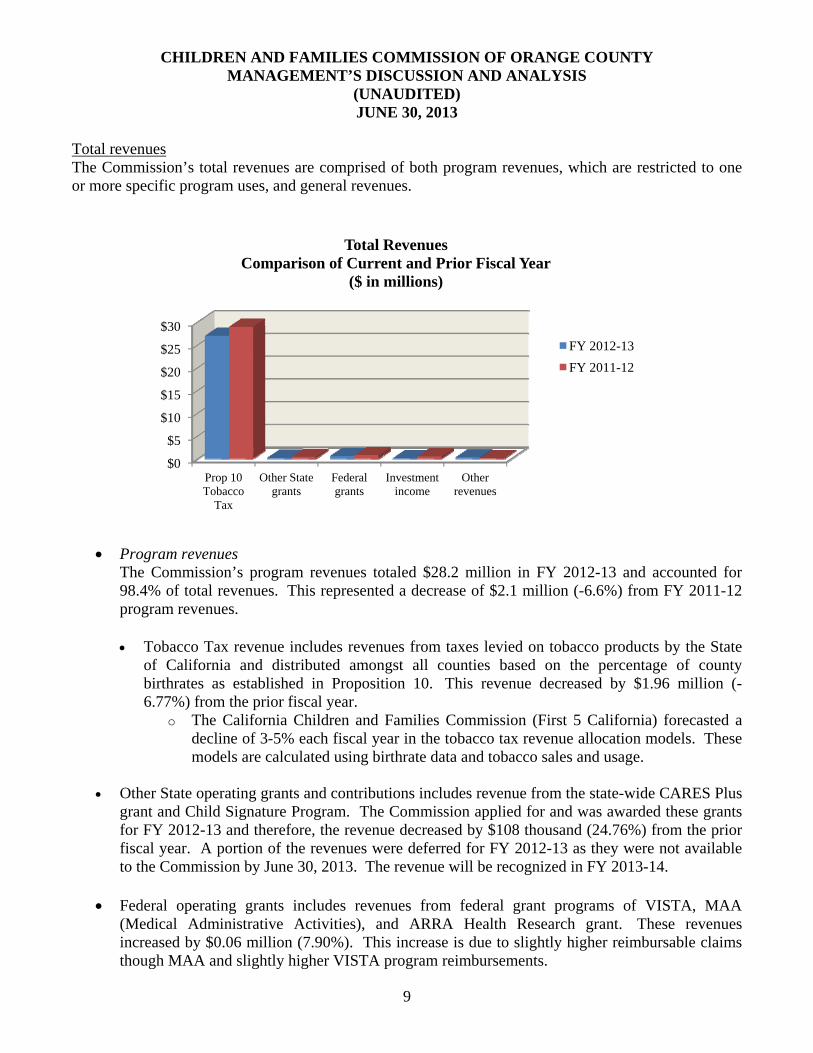
Total revenues The Commission’s total revenues are comprised of both program revenues, which are restricted to one or more specific program uses, and general revenues.
Program revenues
The Commission’s program revenues totaled $28.2 million in FY 2012-13 and accounted for 98.4% of total revenues. This represented a decrease of $2.1 million (-6.6%) from FY 2011-12 program revenues. Tobacco Tax revenue includes revenues from taxes levied on tobacco products by the State
of California and distributed amongst all counties based on the percentage of county birthrates as established in Proposition 10. This revenue decreased by $1.96 million (-6.77%) from the prior fiscal year.
o The California Children and Families Commission (First 5 California) forecasted a decline of 3-5% each fiscal year in the tobacco tax revenue allocation models. These models are calculated using birthrate data and tobacco sales and usage.
Other State operating grants and contributions includes revenue from the state-wide CARES Plus
grant and Child Signature Program. The Commission applied for and was awarded these grants for FY 2012-13 and therefore, the revenue decreased by $108 thousand (24.76%) from the prior fiscal year. A portion of the revenues were deferred for FY 2012-13 as they were not available to the Commission by June 30, 2013. The revenue will be recognized in FY 2013-14.
Federal operating grants includes revenues from federal grant programs of VISTA, MAA
(Medical Administrative Activities), and ARRA Health Research grant. These revenues increased by $0.06 million (7.90%). This increase is due to slightly higher reimbursable claims though MAA and slightly higher VISTA program reimbursements.
$0
$5
$10
$15
$20
$25
$30
Prop 10 Tobacco
Tax
Other State grants
Federal grants
Investment income
Other revenues
Total RevenuesComparison of Current and Prior Fiscal Year
($ in millions)
FY 2012-13
FY 2011-12
CHILDREN AND FAMILIES COMMISSION OF ORANGE COUNTY MANAGEMENT’S DISCUSSION AND ANALYSIS
(UNAUDITED) JUNE 30, 2013
10
General revenues The Commission’s general revenues totaled $282 thousand in FY 2012-13 and accounted for 1% of total revenues. General revenues include all revenues that do not qualify as program revenues, such as investment income and other miscellaneous revenues.
Investment income, decreased by $0.36 million (75%) from the prior fiscal year. The
decrease in investment income from the Orange County Investment Pool (OCIP), which is administered by the County Treasurer, is due to the overall lower returns in the fixed income markets combined with less available investable cash balances as well as a negative fair value adjustment posted for the Commission’s proportionate share in the county investment pool at year end.
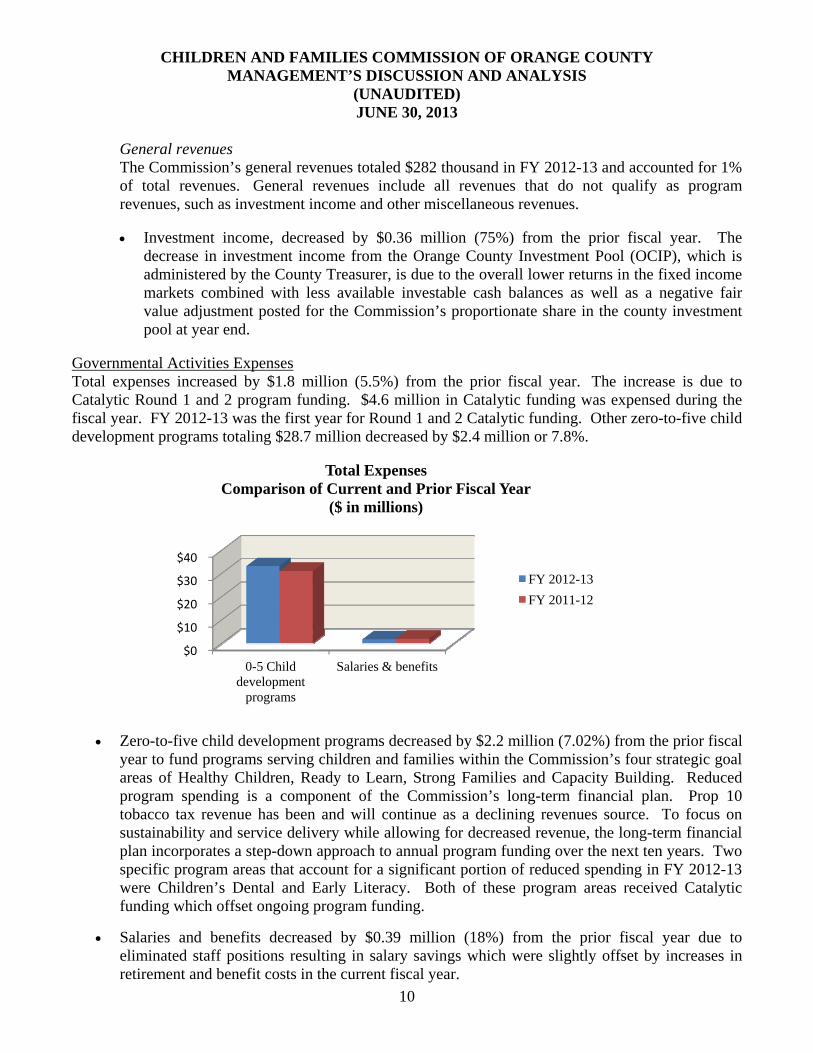
Governmental Activities Expenses Total expenses increased by $1.8 million (5.5%) from the prior fiscal year. The increase is due to Catalytic Round 1 and 2 program funding. $4.6 million in Catalytic funding was expensed during the fiscal year. FY 2012-13 was the first year for Round 1 and 2 Catalytic funding. Other zero-to-five child development programs totaling $28.7 million decreased by $2.4 million or 7.8%.
Zero-to-five child development programs decreased by $2.2 million (7.02%) from the prior fiscal year to fund programs serving children and families within the Commission’s four strategic goal areas of Healthy Children, Ready to Learn, Strong Families and Capacity Building. Reduced program spending is a component of the Commission’s long-term financial plan. Prop 10 tobacco tax revenue has been and will continue as a declining revenues source. To focus on sustainability and service delivery while allowing for decreased revenue, the long-term financial plan incorporates a step-down approach to annual program funding over the next ten years. Two specific program areas that account for a significant portion of reduced spending in FY 2012-13 were Children’s Dental and Early Literacy. Both of these program areas received Catalytic funding which offset ongoing program funding.
Salaries and benefits decreased by $0.39 million (18%) from the prior fiscal year due to eliminated staff positions resulting in salary savings which were slightly offset by increases in retirement and benefit costs in the current fiscal year.
$0
$10
$20
$30
$40
0-5 Child development
programs
Salaries & benefits
Total ExpensesComparison of Current and Prior Fiscal Year
($ in millions)
FY 2012-13
FY 2011-12

CHILDREN AND FAMILIES COMMISSION OF ORANGE COUNTY MANAGEMENT’S DISCUSSION AND ANALYSIS
(UNAUDITED) JUNE 30, 2013
11
Analysis of the Commission’s Governmental Fund Statements As noted earlier, the Commission uses fund accounting to ensure and demonstrate compliance with finance-related legal requirements. Governmental Funds. The child development functions are contained in the general fund of the Commission. The focus of the Commission’s governmental funds is to provide information on near-term inflows, outflows and balances of spendable resources. Such information is useful in assessing the Commission’s financing requirements. In particular, fund balance may serve as a useful measure of a government’s net resources, both committed and available for future operational needs. As of the end of the current fiscal year, the Commission’s general fund reported total ending fund balance of $71.9 million, a decrease of $6.8 million (8.6%) in comparison with the prior fiscal year. Total fund balance decreased due to the initial distributions of Catalytic funding in the amount of $4.6 million. The remaining decrease of $2.2 million was fund balance used to bridge the gap between current year revenue and expenditures as planned for in the Commission’s financial plan.
$0
$5
$10
$15
$20
$25
$30
$35
$40
$45
Fund Balance ClassificationsAs of June 30, 2013
($ in millions)
Nonspendable
Committed
Assigned

CHILDREN AND FAMILIES COMMISSION OF ORANGE COUNTY MANAGEMENT’S DISCUSSION AND ANALYSIS
(UNAUDITED) JUNE 30, 2013
12
General Fund Budgetary Highlights Budget Amendments. The budget amendments are approved annually during the fiscal year for the General Fund in order to reflect the most current revenue trends and to account for shifts in funding objectives.
Total budgeted revenues were increased by $1.85 million in the Prop 10 tobacco tax revenue line item. The increase was based on a higher projection of tobacco tax distributions by the California Department of Finance and the establishment of budgeted revenues for CARES Plus, VISTA and ARRA Health Research grants.
o Tobacco tax revenues – increase of $1.2 million based on prior-year receipts. FY 2011-
12 revenue actually increased from the prior-year. Budgeted tobacco tax revenues were adjusted to reflect a 3.5% decline from the higher FY 2011-12 tobacco tax revenue receipts.
o Other program revenues – increase of $.65 million was due to First 5 California, federal grant revenues, and partner reimbursements to be received through program grants.
Total budgeted appropriations were increased by $1.8 million in the 0-5 child development
program expenditures line item. The major components of the increase are summarized as follows:
o Healthy Children – increase of $1.37 million mostly for the carryover of prior year
unspent funds in Community Clinics and Pediatric Health Services programs.
o Strong Families – increase of $0.3 million for the carryover over of prior year unspent funds in Homeless Prevention programs.
o Early Learning - decrease of $0.4 million of funding set-aside in Early Literacy programs.
o Capacity Building – increase of $0.54 million comprised of $0.13 million of carryover of
prior year unspent funds in Capacity Building Grants and $0.41 million in new appropriations to VISTA for reimbursable expense though the federal grant award.
Budget to Actual Comparisons. This section contains an explanation of the significant differences between the Commission’s Final Budget amounts and actual amounts recorded for revenues and expenditures for FY 2012-13 as detailed on the Statement of Revenues, Expenditures and Changes in Fund Balance – Budget and Actual.
Total actual revenues were less than budgeted revenues in FY 2012-13 by $1.27 million. A decrease in actual Prop 10 tobacco tax revenues of 6.77% from the prior year was most of the variance.
CHILDREN AND FAMILIES COMMISSION OF ORANGE COUNTY MANAGEMENT’S DISCUSSION AND ANALYSIS
(UNAUDITED) JUNE 30, 2013
13
Total budgeted appropriations exceeded actual expenditures in FY 2012-13 by $48.4 million largely due to the timing of Catalytic program implementations and funding.
o 0-5 child development program expenditures were less than budgeted appropriations by $4.27 million. The variance is due to an accumulation of various program under-spending and the timing of program cost recognition. Budgeted funding amounts for programs delayed or extended will be carried over into the following year’s budget.
o Salaries and benefits actual expenditures were less than budgeted appropriations by $0.06 million due to savings from eliminated positions during the current fiscal year.
o Catalytic expenditures were $4.6 million compared to the final budget of $48.7 million. FY2012-13 was the first year Round 1 and 2 catalytic funds were disbursed. A total funding amount of $55 million was approved by the Commission as detailed below. Expenditures will be recognized as services are provided and deliverables met for each separate Catalytic program. At budget adoption, the timing of fund distributions and expense recognition were not known. Each Catalytic program has a unique scope and budget. Final payment terms are included in the contracts approved by the Commission for each Catalytic program. The remaining $50.4 million in Catalytic funding will be carried forward into future year budgets as defined in the related Catalytic contract payment and deliverable schedules.
Commission Catalytic funding Round 1: Children’s Dental Programs $20,000,000 Early Developmental Services / Autism Program 7,000,000 Year Around Emergency Shelter 7,000,000 Early Literacy and Math 5,000,000 Healthy Child Development 5,500,000 VISTA/AmeriCorps transition feasibility 500,000 $45,000,000 Round 2: Capacity Building $3,500,000 Partnership for Children’s Health 3,000,000 Prevention Services 500,000 Nutrition and Fitness 500,000 Pediatric Vision Services 1,500,000 New Capacity Building 500,000 Implementation for Capacity Building Projects 500,000 $10,000,000

CHILDREN AND FAMILIES COMMISSION OF ORANGE COUNTY MANAGEMENT’S DISCUSSION AND ANALYSIS
(UNAUDITED) JUNE 30, 2013
14
Related Events The State projects a continuing decrease of State Tax Allocations revenue and a decrease in the share allocated to the Children and Families Commission of Orange County due to a proportionally lower birth rate combining for a projected annual revenue decrease estimated at 3.5% per year. The Commission’s financial plan will continue planned reductions in annual program funding to account for declining revenues. While the financial plan does assume portions of fund balance will be used in future years to bridge some of the gap between needed services and projected revenue, the Commission still maintains a minimum fund balance of 25% of the annual operating budget.
Requests for Financial Information This comprehensive annual financial report is intended to provide the public with an overview of the Commission’s financial operations and condition for the fiscal year ended June 30, 2013. Questions concerning any of the information provided in this report or requests for additional financial information should be addressed to the Executive Director, Children & Families Commission of Orange County, 17320 Red Hill Avenue, Suite 200, Irvine, California 92614.

CHILDREN AND FAMILIES COMMISSION OF ORANGE COUNTY STATEMENT OF NET POSITION
JUNE 30, 2013
See accompanying notes to the basic financial statements.
15
ASSETSCash and investments in County Treasury 69,280,830$ Imprest cash 15,000 Interest receivable 19,931 Deposits with others 5,380,606 Due from County of Orange 881 Due from other governments 5,836,164 Prepaid expense 243,435
TOTAL ASSETS 80,776,847
LIABILITIES
Accounts payable and accrued liabilities 2,847,704 Due to County of Orange 9,593 Due to other governments 3,673,252 Retentions payable 1,634,093 Accrued wages and benefits 70,254 Compensated absences:
Payable within one year 77,336 Payable after one year 53,482
TOTAL LIABILITIES 8,365,714
NET POSITIONUnrestricted 72,411,134
TOTAL NET POSITION 72,411,134$
GOVERNMENTALACTIVITIES

CHILDREN AND FAMILIES COMMISSION OF ORANGE COUNTY STATEMENT OF ACTIVITIES
FOR THE YEAR ENDED JUNE 30, 2013
See accompanying notes to the basic financial statements.
16
Program Revenues
Operating GrantsExpenses And Contributions
Governmental Activities:Child development 35,046,762$ 28,190,709$ (6,856,053)$
General Revenues:Investment income 122,358 Miscellaneous 159,344
Total General Revenues 281,703
Change in Net Position (6,574,351)
Net Position, July 1 78,985,485
Net Position, June 30 72,411,134$
Net (Expense) Revenueand Changes in Net Position
Governmental Activities

CHILDREN AND FAMILIES COMMISSION OF ORANGE COUNTY GOVERNMENTAL FUND BALANCE SHEET
JUNE 30, 2013
See accompanying notes to the basic financial statements.
17
ASSETS
Cash and investments in County Treasury 69,280,830$ Imprest cash 15,000 Interest receivable 19,931 Deposits with others 5,380,606 Due from County of Orange 881 Due from other governments 5,836,164 Prepaid Expense 243,435
Total Assets 80,776,847$
LIABILITIES AND FUND BALANCES
LIABILITIES
Accounts payable 2,847,704$ Due to County of Orange 9,593 Due to other governments 3,673,252 Retentions payable 1,634,093 Accrued wages and benefits 70,254 Deferred revenue 577,553
Total Liabilities 8,812,448
FUND BALANCES
Nonspendable fund balance 5,624,041 Committed fund balance 44,990,092 Assigned fund balance 21,350,266
Total Fund Balances 71,964,399
Total Liabilities and Fund Balances 80,776,847$
General Fund
CHILDREN AND FAMILIES COMMISSION OF ORANGE COUNTY RECONCILIATION OF GOVERNMENTAL FUND BALANCE SHEET
TO THE STATEMENT OF NET POSITION JUNE 30, 2013
See accompanying notes to the basic financial statements.
18
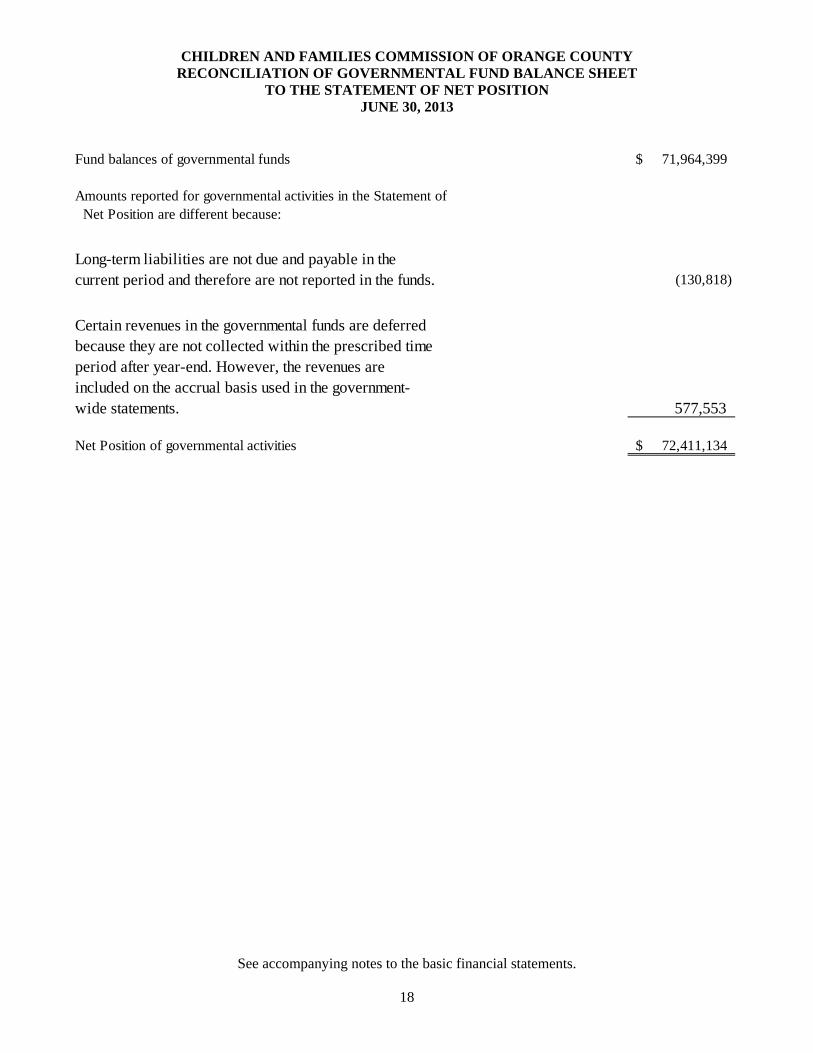
Fund balances of governmental funds 71,964,399$
Amounts reported for governmental activities in the Statement of Net Position are different because:
(130,818)
577,553
Net Position of governmental activities 72,411,134$
Long-term liabilities are not due and payable in the current period and therefore are not reported in the funds.
Certain revenues in the governmental funds are deferred because they are not collected within the prescribed time period after year-end. However, the revenues are included on the accrual basis used in the government-wide statements.

CHILDREN AND FAMILIES COMMISSION OF ORANGE COUNTY GOVERNMENTAL FUND STATEMENT OF REVENUES, EXPENDITURES, AND CHANGES IN FUND BALANCE
FOR THE YEAR ENDED JUNE 30, 2013
See accompanying notes to the basic financial statements.
19
REVENUESProp 10 Tobacco Tax 27,024,505$ Investment income earned on tobacco taxes at the State level 9,588 Other State operating grants and contributions 217,258
Federal operating grants 603,957 Investment income 122,358 Other revenue 320,180
Total Revenues 28,297,846
EXPENDITURESCurrent:
Salaries and benefits 1,708,344 Expenditures related to the "Zero to Five" Program 28,712,645 Catalytic Round 1 and 2 Program 4,629,302
Total Expenditures 35,050,291
Change in Fund Balance (6,752,445)
FUND BALANCE, July 1 78,716,844
FUND BALANCE, June 30 71,964,399$

CHILDREN AND FAMILIES COMMISSION OF ORANGE COUNTY RECONCILIATION OF THE STATEMENT OF REVENUES, EXPENDITURES AND CHANGES IN FUND BALANCE TO THE STATEMENT OF ACTIVITIES
FOR THE YEAR ENDED JUNE 30, 2013
See accompanying notes to the basic financial statements.
20
Net changes in fund balance - total governmental funds (6,752,445)$
3,529
174,565
Change in net postion of governmental activities (6,574,351)$
Certain revenues in the governmental funds are deferred because they are not collected within the prescribed time period after year-end. However, the revenues are included on the accrual basis used in the government-wide statements.
Amounts reported for governmental activities in the statement of revenues, expenditures, and changes in fund balance differs from the amounts reported in the statement of activities because:
Compensated absences expenses reported in the Statement of Activities do not require the use of current financial resources and therefore are not reported as expenditures in governmental funds. This amount represents the net change in the compensated absences liability.

CHILDREN AND FAMILIES COMMISSION OF ORANGE COUNTY STATEMENT OF REVENUES, EXPENDITURES, AND
CHANGES IN FUND BALANCE – BUDGET AND ACTUAL GENERAL FUND
FOR THE YEAR ENDED JUNE 30, 2013
See accompanying notes to the basic financial statements.
21
Variance withFinal Budget -
Actual Positive Original Final Amounts (Negative)
REVENUESProp 10 Tobacco Tax 26,809,800$ 27,971,800$ 27,024,505$ (947,295)$ Investment income earned on tobacco taxes at the State level - - 9,588 9,588 Other State operating grants and contributions 300,000 425,000 217,258 (207,742) Federal operating grants 455,195 880,126 603,957 (276,169) Investment income 150,000 150,000 122,358 (27,642) Other revenue - 143,000 320,180 177,180
Total Revenues 27,714,995 29,569,926 28,297,846 (1,272,080)
EXPENDITURESCurrent:
Salaries and benefits 1,825,000 1,772,000 1,708,344 63,656 Expenditures related to the "Zero to Five" Program 31,161,628 32,989,182 28,712,645 4,276,537 Catalytic Round 1 and 2 Program Funding 45,000,000 48,730,000 4,629,302 44,100,698
Total Expenditures 77,986,628 83,491,182 35,050,291 48,440,891
Net Change in Fund Balance (50,271,633) (53,921,256) (6,752,445) 49,712,971
FUND BALANCE, July 1 78,716,844 78,716,844 78,716,844 -
FUND BALANCE, June 30 28,445,211$ 24,795,588$ 71,964,399$ 49,712,971$
Budgeted Amouts

CHILDREN AND FAMILIES COMMISSION OF ORANGE COUNTY NOTES TO BASIC FINANCIAL STATEMENTS
FOR THE YEAR ENDED JUNE 30, 2013
22
NOTE 1 – ORGANIZATIONS AND SUMMARY OF SIGNIFICANT ACCOUNTING POLICIES Reporting Entity The Children and Families Commission of Orange County (Commission) was established by the Orange County Board of Supervisors in 1999 under the provisions of the California Children and Families Act of 1998 (Act). The Commission is a public entity legally separate and apart from the County. The purpose of the Commission is to develop, adopt, promote and implement early childhood development and school readiness programs in the County of Orange consistent with the goals and objectives of the Act. The Commission’s programs are funded primarily by taxes levied by the State of California on tobacco products. A governing board of nine members, which are appointed by the County Board of Supervisors, oversees the Commission. Three members are considered Mandatory Members, comprised of representatives of the County Health Care Agency, Social Services Agency and Board of Supervisors. Other members are considered At-Large Members. The Board of Supervisors Mandatory Member serves for a one-year term without limitation on the number of terms he/she may serve. Other Mandatory Members serve until removed by the Board of Supervisors. At-Large Members serve for terms ranging from two to four years, not to exceed eight consecutive years. The County Board of Supervisors may remove any Commission Member at any time. The Commission is considered a component unit of the County of Orange. Upon termination of the commission, all assets of the Commission shall be returned to the State of California. The liabilities of the Commission shall not become liabilities of the County upon either termination of the Commission or the liquidation or disposition of the Commission’s remaining assets. Basis of Accounting and Measurement Focus The basic financial statements of the Commission are composed of the following:
Government-wide financial statements
Fund financial statements
Notes to the basic financial statements
Government-Wide Financial Statements Government-wide financial statements consist of the statement of net position and the statement of activities. These statements are presented on an economic resources measurement focus. All economic resources and obligations of the reporting government are reported in the financial statements. The government-wide financial statements have been prepared on the accrual basis of accounting. Under the accrual basis of accounting all assets and liabilities of the Commission are included on the statement of net position. The difference between the Commission’s assets and liabilities is its net position. Net position represent the resources the Commission has available for use in providing services. The Commission’s net position is classified as:
Net Investment in Capital Assets – This amount represents the Commission’s capital assets, net of accumulated depreciation.
Unrestricted – This category represents neither restrictions or invested in capital assets and may be used by the Commission for any purpose though they may not be necessarily liquid.

CHILDREN AND FAMILIES COMMISSION OF ORANGE COUNTY NOTES TO BASIC FINANCIAL STATEMENTS
FOR THE YEAR ENDED JUNE 30, 2013
23
NOTE 1 – ORGANIZATIONS AND SUMMARY OF SIGNIFICANT ACCOUNTING POLICIES (Continued) Government-Wide Financial Statements, (Continued) The statement of activities presents a comparison of the direct expenses and program revenues for the Commission’s governmental activities. Program revenues include grants and contributions restricted for the operational requirements of a particular program. Grants and similar items are recognized as revenue as soon as all eligibility requirements have been met. Program revenues include tobacco taxes, First 5 CARES Plus, First 5 CSP, and federal revenues. General revenues are all revenues that do not qualify as program revenues and include investment income and miscellaneous income. Revenues, expenses, gains, losses, assets and liabilities resulting from exchange and exchange-like transactions are recognized when the exchange takes place. Revenues, expenses, gains, losses, assets and liabilities resulting from non-exchange transactions are recognized in accordance with the requirements of GASB Statement No. 33 which defines the time requirements and purpose restrictions on the use of resources. Fund Financial Statements The fund financial statements consist of the balance sheet, the statement of revenues, expenditures and changes in fund balance, and the statement of revenues, expenditures and changes in fund balance – budget and actual of the Commission’s general fund. These statements are presented on a current financial resources measurement focus. Generally, only current assets and current liabilities are included on the balance sheet. The statement of revenues, expenditures and changes in fund balance for the governmental fund generally presents increases (revenues) and decreases (expenditures) in net current assets. All operations of the Commission are accounted for in the general fund. The fund financial statements have been prepared on the modified accrual basis of accounting. Revenues are recognized in the accounting period in which they become both measurable and available to finance expenditures of the current period. Revenues are considered available if they are received within 60 days after year-end. Revenues susceptible to accrual include tax revenues, grant revenues and investment income. Expenditures are recognized in the accounting period in which the fund liability is incurred except for compensated absences, which are recognized when due and payable at year-end. Capital assets, net of accumulated depreciation Equipment is not considered to be financial resources and therefore, is not reported as an asset in the fund financial statements. Equipment is capitalized and reported at cost, net of accumulated depreciation in the government-wide financial statements. There were no additions to the capital assets in the current year. Capital assets are recorded at cost. The Commission capitalizes assets with cost in excess of $5,000 and a useful life greater than one year. The Commission depreciates capital assets using a straight-line method over the estimated useful life of each asset. The estimated useful life used for the capital assets, comprised only of equipments, ranges from 5 to 10 years.

CHILDREN AND FAMILIES COMMISSION OF ORANGE COUNTY NOTES TO BASIC FINANCIAL STATEMENTS
FOR THE YEAR ENDED JUNE 30, 2013
24
NOTE 1 – ORGANIZATIONS AND SUMMARY OF SIGNIFICANT ACCOUNTING POLICIES (Continued) Adjustments Between Fund Financial Statements and Government-Wide Financial Statements Deferred Revenue Under the modified accrual basis of accounting, revenue is recognized in the fund financial statements if it has been collected after year-end within the Commission’s established availability period of 60 days. All other accrued revenues due the Commission are deferred at year-end in the fund financial statements. Deferred revenue of $577,553 at June 30, 2013 was recognized as revenue in the government-wide financial statements. Long-Term Liabilities Compensated absence obligations are considered long-term in nature and are reported in the fund financial statements as expenditures in the period paid or when due and payable at year-end under the modified accrual basis of accounting. The compensated absences have been accrued in the government-wide financial statements and are included in long-term liabilities. The compensated absences are liquidated by the general fund. Deposits with Others The Deposits with Others account includes funds that were transferred or advanced to program providers, but the related services were not provided before June 30, 2013. Due to Other Governments Due to other governments represents amounts owed to grantees and governmental agencies for services provided to the Commission in accordance with the Commission’s strategic plan. Retentions Payable The Commission retains a percentage of amounts billed by grantees and vendors in accordance with executed contracts. Upon fulfilling the requirements of the grantee agreement or contract, the amounts are released. Use of Estimates The preparation of financial statements in conformity with generally accepted accounting principles in the United States requires management to make estimates and assumptions that affect the amounts reported in the financial statements and accompanying notes. Actual results could differ from those estimates. The Commission’s significant estimates are recorded in accounts payable and due to other governments and pertain to accruals for services provided by grantees and vendors but not invoiced as of June 30, 2013. Budget and Budget Reporting The Commission is required by County ordinance to prepare a budget each year based on estimates of revenues and expected expenditures. The Commission’s Board of Commissioners adopted an annual budget of expenditures for the year ended June 30, 2013, which is prepared on the modified accrual basis of accounting. The accompanying statement of revenues, expenditures and changes in fund balance – budget and actual includes the budgeted expenditures for the year, along with management’s estimate of revenues for the year. The legal level of budgetary control is at the total fund level.
CHILDREN AND FAMILIES COMMISSION OF ORANGE COUNTY NOTES TO BASIC FINANCIAL STATEMENTS
FOR THE YEAR ENDED JUNE 30, 2013
25
NOTE 1 – ORGANIZATIONS AND SUMMARY OF SIGNIFICANT ACCOUNTING POLICIES (Continued) Fund Balance GASB Statement No. 54, Fund Balance Reporting and Governmental Fund Type Definitions statement established fund balance classifications that comprise a hierarchy based primarily on the extent to which a government is bound to observe constraints imposed upon the use of the resources reported in governmental funds. The Commission established the following classifications and definitions of fund balance:
Nonspendable – Resources that cannot be spent because they are not in an expendable form (e.g. prepaid asset, inventory) or must be maintained intact (e.g. endowment principal). Restricted – Resources that are constrained to specific purposes by an external provider (e.g. grantors, contributors, governmental laws and regulations) or by constitutional provisions or enabling legislation. Committed – Resources with self-imposed limitations, evidenced by the Commission’s formal action (resolution), and require both the approval of the highest level of decision making authority (Board of Commissioners) and the same formal action to remove or modify the limitations. Includes legally enforceable multi-year contracts not yet spent, specific agreements approved but not yet executed. Assigned – Resources with self-imposed limitations but do not require approval by the highest level of decision making authority (may be a body, committee or individual designated by Board of Commissioners) or the same level of formal action to remove or modify limitations. Includes appropriation of a portion of existing fund balance sufficient to eliminate subsequent year’s budget deficit, resources assigned to specific program for which there is an approved budget, and resources approved by the Commission for a long range financial plan.
Unassigned – Resources that cannot be reported in any other classification. The Commission’s spending priority is to spend restricted fund balance first, followed by committed, assigned and unassigned fund balance.
Minimum Fund Balance Policy The policy of the Commission is to maintain a minimum fund balance equal to 25% of the Commission’s annual operating budget. The fund balance will be used to mitigate the impact on contracted services due to unanticipated circumstances and events, provide adequate resources for cash flow, and to mitigate short-term effects of revenue shortages. The amount of the minimum fund balance is subject to approval by the Board of Commissioners as part of the annual budget adoption. Encumbrances The Commission utilizes an encumbrance system as a management control technique to assist in controlling expenditures. Unencumbered appropriations lapse at the end of the fiscal year.
CHILDREN AND FAMILIES COMMISSION OF ORANGE COUNTY NOTES TO BASIC FINANCIAL STATEMENTS
FOR THE YEAR ENDED JUNE 30, 2013
26
NOTE 1 – ORGANIZATIONS AND SUMMARY OF SIGNIFICANT ACCOUNTING POLICIES (Continued) Effect of New Governmental Accounting Standards Board (GASB) Pronouncements GASB Statement No. 60 – In December 2010, GASB issued Statement No. 60, Accounting and Financial Reporting for Service Concession Arrangements. This statement is to improve financial reporting by addressing issues related to service concession arrangements. This statement was effective July 1, 2012. The Commission has determined that this statement did not have a material impact on the financial statements. GASB Statement No. 61 – In December 2010, GASB issued Statement No. 61, The Financial Reporting Entity: Omnibus. The objective of this statement is to improve financial reporting for governmental financial reporting entities. This statement modifies certain requirements for inclusion of component units in the financial reporting entity and amends the criteria for reporting component units as if they were a part of the primary government in certain circumstances. This statement was effective July 1, 2012. The Commission has determined that this statement does not have a material impact on the financial statements. GASB Statement No. 62 – In June 2011, GASB issued Statement No. 62, Codification of Accounting and Financial Reporting Guidance Contained in Pre-November 30, 1989 FASB and AICPA Pronouncements. The objective of this statement is to incorporate into the GASB’s authoritative literature certain accounting and financial reporting guidance that is included in FASB and AICPA pronouncements issued on or before November 30, 1989 which does not conflict with our contradict GASB pronouncements. This statement was effective July 1, 2012. The Commission has determined that this statement did not have a material impact on the financial statements. GASB Statement No. 63, Financial Reporting of Deferred Outflows of Resources, Deferred Inflows of Resources, and Net Position, was issued in June 30, 2011. This statement provides financial reporting guidance for deferred outflows of resources and deferred inflows of resources. This statement also amends the net asset reporting requirements in Statement No. 34, Basic Financial Statements—and Management’s Discussion and Analysis—for State and Local Governments, and other pronouncements by incorporating deferred outflows of resources and deferred inflows of resources into the definitions of the required components of the residual measure and by renaming that measure as net position, rather than net assets. The Commission implemented this statement effective July 1, 2012. GASB Statement No. 65 – In March 2012, GASB issued Statement No. 65, Items Previously Reported as Assets and Liabilities. This statement establishes accounting and financial reporting standards that reclassify, as deferred outflows of resources, certain items that were previously reported as assets and liabilities and recognizes, as outflows of resources or inflows of resources, certain items that were previously reported as assets and liabilities. This statement is effective for periods beginning after December 15, 2012. The Commission has not determined the effect of this statement. GASB Statement No. 66 – In March 2012, GASB issued Statement No. 66, Technical Corrections – 2012 – an amendment of GASB Statement No. 10 and No. 62. This statement is to improve accounting and financial reporting for a governmental financial reporting entity by resolving conflicting guidance that resulted from the issuance of two pronouncements, Statement No. 54, Fund Balance Reporting and Governmental Fund Type Definitions, and No. 62, Codification of Accounting and Financial Reporting Guidance Contained in Pre-November 30, 1989 FASB and AICPA Pronouncements. This statement is effective for financial statements beginning after December 15, 2012. The Commission has not determined the effect of this statement.

CHILDREN AND FAMILIES COMMISSION OF ORANGE COUNTY NOTES TO BASIC FINANCIAL STATEMENTS
FOR THE YEAR ENDED JUNE 30, 2013
27
NOTE 1 – ORGANIZATIONS AND SUMMARY OF SIGNIFICANT ACCOUNTING POLICIES (Continued) Effect of New Governmental Accounting Standards Board (GASB) Pronouncements (Continued) GASB Statement No. 67 – In June 2012, GASB issued Statement No. 67, Financial Reporting for Pension Plans – an amendment of GASB Statement No. 25. This statement results from a comprehensive review of the effectiveness of existing standards of accounting and financial reporting for pensions with regard to providing decision-useful information, supporting assessments of accountability and interperiod equity, and creating additional transparency. This statement is effective June 30, 2014. The Commission has not determined the effect of this statement. GASB Statement No. 68 – In June 2012, GASB issued Statement No. 68, Accounting and Financial Reporting for Pensions – an amendment of GASB Statement No. 27. This Statement replaces the requirements of Statements No. 27 and No. 50 related to pension plans that are administered through trusts or equivalent arrangements. The requirements of Statements No. 27 and No. 50 remain applicable for pensions that are not administered as trusts or equivalent arrangements. The requirements of this Statement are effective for financial statements for fiscal years beginning after June 15, 2014. The Commission has not determined the effect of this statement. GASB Statement No. 69 – In January 2013, GASB issued Statement No. 69, Government Combinations and Disposals of Government Operations. This Statement establishes accounting and financial reporting standards related to government combinations and disposals of government operations. This Statement is effective for periods beginning after December 31, 2013. The Commission has not determined the effect of this statement. GASB Statement No. 70 – In April 2013, GASB issued Statement No. 70, Accounting and Financial Reporting for Nonexchange Financial Guarantees. This Statement improves accounting and financial reporting by state and local governments that extend and receive nonexchange financial guarantees. This Statement is effective for periods beginning after June 15, 2013. The Commission has not determined the effect of this statement. NOTE 2 – CASH AND INVESTMENTS Cash and investments are classified in the financial statements as follows: Cash and investments in County Treasury 69,280,830$ Imprest Cash 15,000
Total Cash and Investments 69,295,830$
Cash and investments consisted of the following at June 30, 2013: Orange County Investment Pool:
Equity in pooled Money Market fund 69,280,830$ Imprest Cash 15,000
Total Cash and Investments 69,295,830$

CHILDREN AND FAMILIES COMMISSION OF ORANGE COUNTY NOTES TO BASIC FINANCIAL STATEMENTS
FOR THE YEAR ENDED JUNE 30, 2013
28
NOTE 2 – CASH AND INVESTMENTS (Continued) Investments Authorized by the California Government Code and the Commission’s Investment Policy The table below identifies the investment types that are authorized by the California Government Code or the Commission’s investment policy, where more restrictive. The table also identifies certain provisions of the California Government Code or the Commission’s investment policy, where more restrictive, that address interest rate risk, credit risk, and concentration of credit risk.
Authorized Investment Type
Maximum Maturity
Maximum Percentage of Portfolio
Maximum Investment
in One Issuer U.S. Treasury Obligations U.S. Government Agency Securities
N/A N/A
None None
None 30%
Commercial Paper Negotiable Certificates of Deposit Repurchase Agreements Banker’s Acceptances Money Market Mutual Funds Municipal Debt Asset Backed Securities Medium-Term Notes Orange County Investment Pool
N/A N/A N/A N/A
5 years N/A N/A N/A
397 days
25% 30% 50% 40% 20% 30% 10% 30% None
5% 5% 5%
30% None 5% 5% 5%
None
The Commission’s deposit in the Orange County Treasurer’s Money Market Fund of the Investment Pool (Pool) is similar to a demand deposit and amounts can be withdrawn at any time without prior written notice. The County’s Investment Policy Statement establishes policies governing the Pool. Interest is apportioned to the Commission monthly based on the average daily balances on deposit with the County Treasurer. The County Treasury Oversight Committee, established in December 1995, conducts Pool oversight. The weighted average maturity of the Pool is approximately 380 days as of June 30, 2013. The Commission’s equity in the Pool was 2.24% of the total Pool. For further information regarding the Orange County Investment Pool, refer to the County of Orange Comprehensive Annual Financial Report. Cash on deposit with the Treasurer at June 30, 2013 is stated at fair value. The Pool values participant shares on an amortized cost basis during the year and adjusts the value at year-end to fair value based on quoted market prices. The fair value adjustment at June 30, 2013 decreased the Commission’s investment income by $168,441. Investments in pools managed by other governments are not subject to categorization because they are not evidenced by securities that exist in physical or book entry form. Credit Risk The County Treasurer’s Investment Policy limits investments in any specific purpose investment portfolio to the short-term category to mitigate interest rate risk and defines a minimum credit rating from Moody’s and Standard & Poors (S&P) for issuers of financial instruments to minimize credit risk. For an issuer of short-term debt, the rating must be no less than P-1 (Moody’s) or A-1 (S&P) while an issuer of long-term debt shall be rated no less than A. At June 30, 2013, the Orange County Investment Pool was assigned by S&P at a AAAm Principal Stability Fund Rating.
CHILDREN AND FAMILIES COMMISSION OF ORANGE COUNTY NOTES TO BASIC FINANCIAL STATEMENTS
FOR THE YEAR ENDED JUNE 30, 2013
29
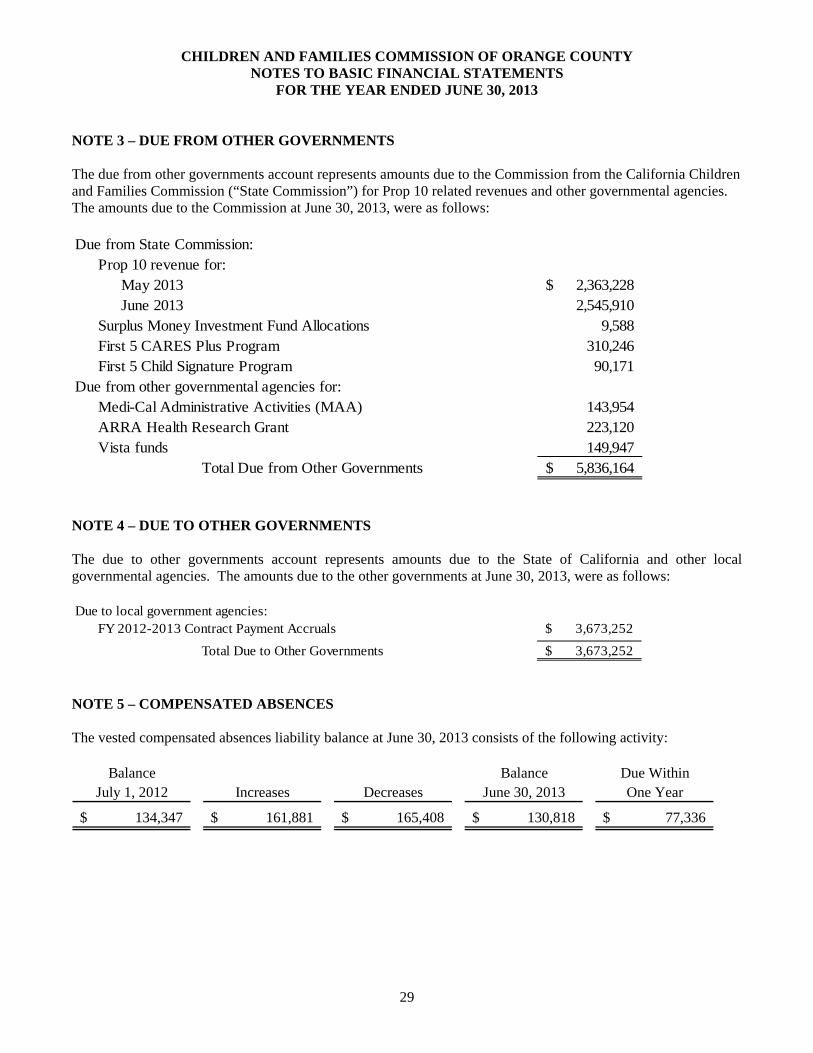
NOTE 3 – DUE FROM OTHER GOVERNMENTS The due from other governments account represents amounts due to the Commission from the California Children and Families Commission (“State Commission”) for Prop 10 related revenues and other governmental agencies. The amounts due to the Commission at June 30, 2013, were as follows: Due from State Commission:
Prop 10 revenue for:May 2013 2,363,228$ June 2013 2,545,910
Surplus Money Investment Fund Allocations 9,588 First 5 CARES Plus Program 310,246 First 5 Child Signature Program 90,171
Due from other governmental agencies for:Medi-Cal Administrative Activities (MAA) 143,954 ARRA Health Research Grant 223,120 Vista funds 149,947
Total Due from Other Governments 5,836,164$
NOTE 4 – DUE TO OTHER GOVERNMENTS The due to other governments account represents amounts due to the State of California and other local governmental agencies. The amounts due to the other governments at June 30, 2013, were as follows: Due to local government agencies:
FY 2012-2013 Contract Payment Accruals 3,673,252$
Total Due to Other Governments 3,673,252$
NOTE 5 – COMPENSATED ABSENCES The vested compensated absences liability balance at June 30, 2013 consists of the following activity:
Balance Balance Due WithinJuly 1, 2012 Increases Decreases June 30, 2013 One Year
134,347$ 161,881$ 165,408$ 130,818$ 77,336$

CHILDREN AND FAMILIES COMMISSION OF ORANGE COUNTY NOTES TO BASIC FINANCIAL STATEMENTS
FOR THE YEAR ENDED JUNE 30, 2013
30
NOTE 6 – FUND BALANCE Fund balance is classified using a hierarchy based primarily on the extent to which a government is bound to observe constraints imposed upon the use of the resources reported in governmental funds. Fund balance at June 30, 2013 consists of the following:
June 30, 2013Nonspendable:
Prepaid retirements 243,435$ Deposits with Others 5,624,041
Committed for:Contractual obligations 44,990,092
Assigned for:Budgeted programs 21,350,266
Total Due from Other Governments 71,964,399$
Fund Balance Category Descriptions Nonspendable – consists of prepaid retirement contributions for FY 2013-2014. Refer to Note 8 for further details. Also included are the amounts transferred to contractors for services not provided by June 30, 2013. Committed for contractual obligations – consists of contract amounts approved by Commission action as of June 30, 2013 for FY 2013-2014 and future years of Commission Round 1 and 2 Catalytic funding. Assigned for budgeted programs – consists of FY 2013-2014 contracts that were approved by Commission action and included in the FY 2013-2014 Operating Budget. NOTE 7 – CONTINGENCIES The Commission is involved in various legal proceedings from time to time in the normal course of business. In management’s opinion, the Commission is not involved in any legal proceeding that will have a material adverse effect on financial position or changes in financial position of the Commission. NOTE 8 – DEFINED BENEFIT PENSION PLAN Plan Description. All full-time employees of the Commission participate in the Orange County Employees Retirement System (OCERS), which is a cost-sharing, multiple-employer, defined benefit pension plan. OCERS provides for retirement, death, disability and cost-of-living benefits, and is subject to the provisions of the County Employees Retirement Act of 1937 and other applicable statutes.
CHILDREN AND FAMILIES COMMISSION OF ORANGE COUNTY NOTES TO BASIC FINANCIAL STATEMENTS
FOR THE YEAR ENDED JUNE 30, 2013
31
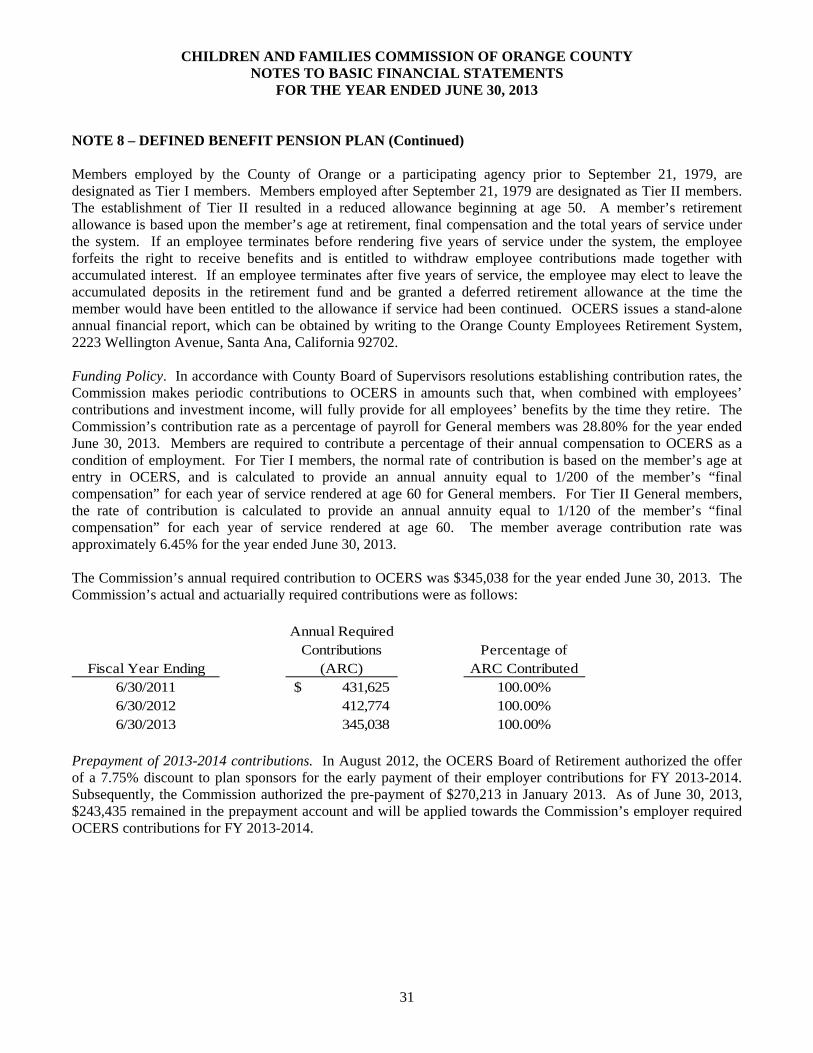
NOTE 8 – DEFINED BENEFIT PENSION PLAN (Continued) Members employed by the County of Orange or a participating agency prior to September 21, 1979, are designated as Tier I members. Members employed after September 21, 1979 are designated as Tier II members. The establishment of Tier II resulted in a reduced allowance beginning at age 50. A member’s retirement allowance is based upon the member’s age at retirement, final compensation and the total years of service under the system. If an employee terminates before rendering five years of service under the system, the employee forfeits the right to receive benefits and is entitled to withdraw employee contributions made together with accumulated interest. If an employee terminates after five years of service, the employee may elect to leave the accumulated deposits in the retirement fund and be granted a deferred retirement allowance at the time the member would have been entitled to the allowance if service had been continued. OCERS issues a stand-alone annual financial report, which can be obtained by writing to the Orange County Employees Retirement System, 2223 Wellington Avenue, Santa Ana, California 92702. Funding Policy. In accordance with County Board of Supervisors resolutions establishing contribution rates, the Commission makes periodic contributions to OCERS in amounts such that, when combined with employees’ contributions and investment income, will fully provide for all employees’ benefits by the time they retire. The Commission’s contribution rate as a percentage of payroll for General members was 28.80% for the year ended June 30, 2013. Members are required to contribute a percentage of their annual compensation to OCERS as a condition of employment. For Tier I members, the normal rate of contribution is based on the member’s age at entry in OCERS, and is calculated to provide an annual annuity equal to 1/200 of the member’s “final compensation” for each year of service rendered at age 60 for General members. For Tier II General members, the rate of contribution is calculated to provide an annual annuity equal to 1/120 of the member’s “final compensation” for each year of service rendered at age 60. The member average contribution rate was approximately 6.45% for the year ended June 30, 2013. The Commission’s annual required contribution to OCERS was $345,038 for the year ended June 30, 2013. The Commission’s actual and actuarially required contributions were as follows:
Fiscal Year Ending
Annual Required Contributions
(ARC)Percentage of
ARC Contributed6/30/2011 431,625$ 100.00%6/30/2012 412,774 100.00%6/30/2013 345,038 100.00%
Prepayment of 2013-2014 contributions. In August 2012, the OCERS Board of Retirement authorized the offer of a 7.75% discount to plan sponsors for the early payment of their employer contributions for FY 2013-2014. Subsequently, the Commission authorized the pre-payment of $270,213 in January 2013. As of June 30, 2013, $243,435 remained in the prepayment account and will be applied towards the Commission’s employer required OCERS contributions for FY 2013-2014.

CHILDREN AND FAMILIES COMMISSION OF ORANGE COUNTY NOTES TO BASIC FINANCIAL STATEMENTS
FOR THE YEAR ENDED JUNE 30, 2013
32
NOTE 9 – COMMITMENTS The Commission leases office space from a third party under a long-term operating lease. The latest lease expires on October 31, 2016 (FY 2016-17). The future minimum rental payments due under the lease are as follows.
FY 2013-14 111,470$ FY 2014-15 68,607 FY 2015-16 68,607 FY 2016-17 22,869
271,553$
Rent expense was $197,196 for the year ended June 30, 2013. NOTE 10 – RELATED PARTY TRANSACTIONS The Commission contracts with the County to provide accounting, banking and investment, purchasing, human resources, risk management and other administrative services. The Commission participates in the County’s risk management programs (commercial and self-insurance programs) for general and automobile liability insurance, public official liability, rental interruption, personal property, worker’s compensation, group health indemnified plans, group salary continuance plan, group dental plan and unemployment benefit plan. The Commission records its portion of related insurance premiums charged by the County as an expense. Insurance expense for the year ended June 30, 2013 was $60,895. The Commission incurred expenses totaling $569,307 for all other County services provided during the year ended June 30, 2013. The amount owed to the County of Orange for related party transactions at June 30, 2013 was $9,593. The Commission paid $1,688,636 of service provider grants to organizations which are represented by two members of the Board of Commissioners, although both members abstain from all votes regarding funding to the organization represented. NOTE 11 – PROGRAM EVALUATION In accordance with the Standards and Procedures for Audits of California Counties Participating in the California Children and Families Program, issued by the California State Controller, the Commission is required to disclose the amounts expended during the fiscal year on program evaluation. Program evaluation costs pertain to those activities undertaken to support the collection, production, analysis and presentation of evaluation information for Commission management, Commissioners and other interested parties. For the year ended June 30, 2013, the Commission expended $894,496 for program evaluation.
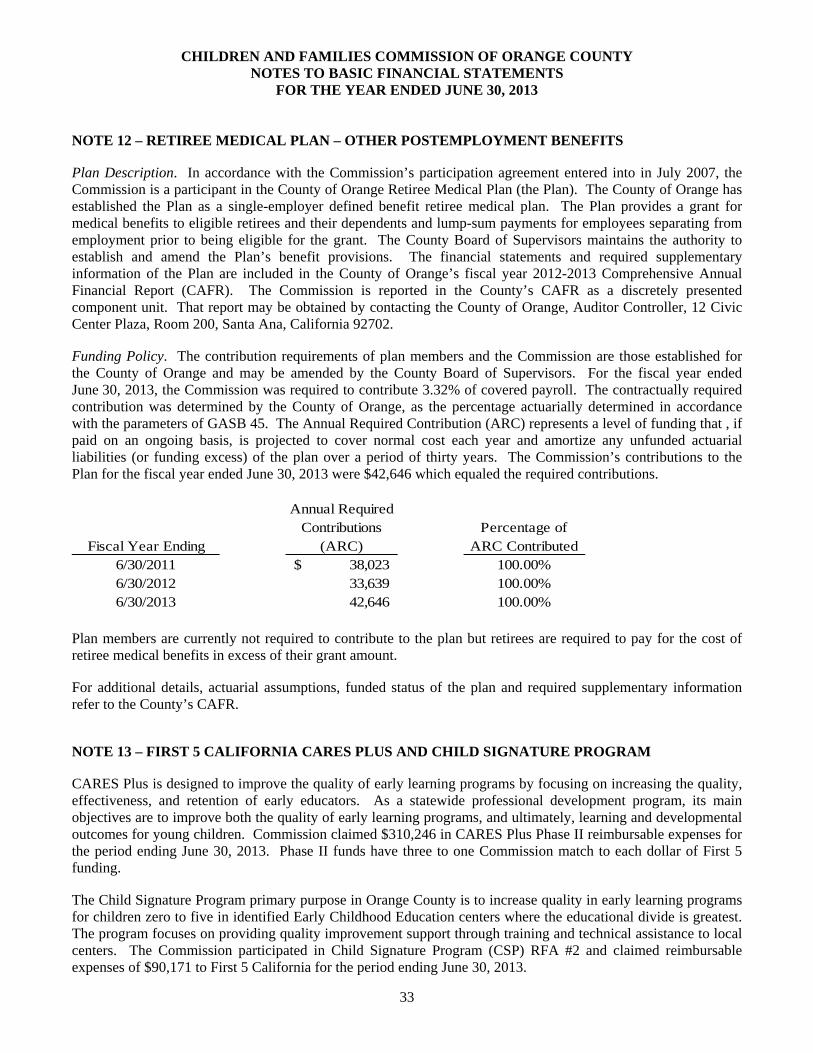
CHILDREN AND FAMILIES COMMISSION OF ORANGE COUNTY NOTES TO BASIC FINANCIAL STATEMENTS
FOR THE YEAR ENDED JUNE 30, 2013
33
NOTE 12 – RETIREE MEDICAL PLAN – OTHER POSTEMPLOYMENT BENEFITS Plan Description. In accordance with the Commission’s participation agreement entered into in July 2007, the Commission is a participant in the County of Orange Retiree Medical Plan (the Plan). The County of Orange has established the Plan as a single-employer defined benefit retiree medical plan. The Plan provides a grant for medical benefits to eligible retirees and their dependents and lump-sum payments for employees separating from employment prior to being eligible for the grant. The County Board of Supervisors maintains the authority to establish and amend the Plan’s benefit provisions. The financial statements and required supplementary information of the Plan are included in the County of Orange’s fiscal year 2012-2013 Comprehensive Annual Financial Report (CAFR). The Commission is reported in the County’s CAFR as a discretely presented component unit. That report may be obtained by contacting the County of Orange, Auditor Controller, 12 Civic Center Plaza, Room 200, Santa Ana, California 92702. Funding Policy. The contribution requirements of plan members and the Commission are those established for the County of Orange and may be amended by the County Board of Supervisors. For the fiscal year ended June 30, 2013, the Commission was required to contribute 3.32% of covered payroll. The contractually required contribution was determined by the County of Orange, as the percentage actuarially determined in accordance with the parameters of GASB 45. The Annual Required Contribution (ARC) represents a level of funding that , if paid on an ongoing basis, is projected to cover normal cost each year and amortize any unfunded actuarial liabilities (or funding excess) of the plan over a period of thirty years. The Commission’s contributions to the Plan for the fiscal year ended June 30, 2013 were $42,646 which equaled the required contributions.
Fiscal Year Ending
Annual Required Contributions
(ARC)Percentage of
ARC Contributed6/30/2011 38,023$ 100.00%6/30/2012 33,639 100.00%6/30/2013 42,646 100.00%
Plan members are currently not required to contribute to the plan but retirees are required to pay for the cost of retiree medical benefits in excess of their grant amount. For additional details, actuarial assumptions, funded status of the plan and required supplementary information refer to the County’s CAFR. NOTE 13 – FIRST 5 CALIFORNIA CARES PLUS AND CHILD SIGNATURE PROGRAM CARES Plus is designed to improve the quality of early learning programs by focusing on increasing the quality, effectiveness, and retention of early educators. As a statewide professional development program, its main objectives are to improve both the quality of early learning programs, and ultimately, learning and developmental outcomes for young children. Commission claimed $310,246 in CARES Plus Phase II reimbursable expenses for the period ending June 30, 2013. Phase II funds have three to one Commission match to each dollar of First 5 funding. The Child Signature Program primary purpose in Orange County is to increase quality in early learning programs for children zero to five in identified Early Childhood Education centers where the educational divide is greatest. The program focuses on providing quality improvement support through training and technical assistance to local centers. The Commission participated in Child Signature Program (CSP) RFA #2 and claimed reimbursable expenses of $90,171 to First 5 California for the period ending June 30, 2013.

OTHER SUPPLEMENTARY INFORMATION

CHILDREN AND FAMILIES COMMISSION OF ORANGE COUNTY SCHEDULE OF FIRST 5 CALIFORNIA FUNDING
YEAR ENDED JUNE 30, 2013
34
First 5 California Program Funding Revenue Program Title F5CA Funds Expenditures CARES Plus Phase II F5CA Program Funds $310,246 $310,246 County, Local Funds 930,738 930,738 CSP RFA #2 F5CA Program Funds 90,171 90,171 County, Local Funds - - * For the purpose of this schedule, the revenue reported, in amount of $310,246 for CARES Plus Phase II and $90,171for Child Signature Program RFA 2 represents the amount claimed by the Commission. For financial reporting purposes, this amount was included in deferred revenue as it did not meet the Commission’s period of availability as described in Note 1.

CHILDREN AND FAMILIES COMMISSION OF ORANGE COUNTY STATISTICAL SECTION
(UNAUDITED)
35
The information in this section is not covered by the Independent Auditor’s Report, but it is presentedas supplemental data for the benefit of the readers of the comprehensive annual financial report. Theobjectives of statistical section information are to provide financial statement users with additionaldetailed information as a context for understanding what the financial statements, notes to financialstatements, and required supplementary information say about the Commission's economic condition.
PagesFinancial TrendsThese schedules contain trend information to help the reader understand how the 36Commission’s financial performance and well-being have changed over time.
Revenue CapacityThese schedules contain trend information to help the reader assess the Commission’s 44most significant revenue base.
Demographic InformationThese schedules offer economic and demographic indicators to help the reader 47understand how the information in the Commission’s financial report relates to theservices the Commission provides and the activities it performs.
Operating InformationThis schedule contains infrastructure data to help the reader understand how the 50Information in the Commission’s financial report relates to the services theCommission performs.
Sources: Unless otherwise noted, the information in these schedules is derived from thecomprehensive annual financial reports for the relevant years.
(1) Since certain data (i.e. total personal income , per capita personal income and unemployment)
are not considered relevant to Commission operations, substitute information specific to theCommission is presented.
CHILDREN AND FAMILIES COMMISSION OF ORANGE COUNTYSTATISTICAL SECTION (1)
(UNAUDITED)

CHILDREN AND FAMILIES COMMISSION OF ORANGE COUNTY NET POSITION BY COMPONENT
LAST NINE FISCAL YEARS*
36
2013 2012 2011 2010
Net investment in capital assets -$ -$ 235$ 798$
Unrestricted 72,411,134 78,985,485 30,063,595 102,842,804
Total net position 72,411,134$ 78,985,485$ 30,063,830$ 102,843,602$
* Statistical information is presented as of the first fiscal year that GASB 34 was implemented.
Fiscal Year

37
2009 2008 2007 2006 2005
2,301$ 5,121$ 7,942$ 11,419$ 16,213$
122,720,258 142,142,025 151,578,753 152,265,738 146,184,260
122,722,559$ 142,147,146$ 151,586,695$ 152,277,157$ 146,200,473$
Fiscal Year

CHILDREN AND FAMILIES COMMISSION OF ORANGE COUNTY CHANGES IN NET POSITION LAST NINE FISCAL YEARS*
38
2013 2012 2011 2010
Expenses:Governmental activities:
Salaries and benefits 1,704,815 2,094,872 2,290,308 2,415,467 Expenses related to "Zero to 33,341,947 31,129,369 49,431,678 46,836,184 Services and supplies for State 6,844,534
Extraordinary Item: Accrual of AB99 liability
51,369,439
Total expenses 35,046,762 33,224,241 103,091,425 56,096,185
Program revenues:Governmental activities:
Operating grants and contributionsProp 10 Tobacco taxes 27,024,505$ 28,988,350$ 28,809,921$ 29,706,126$ Prop 10 State School Readiness 4,349,489 First 5 CARES Plus 237,504 435,487 First 5 Child Signature Program 90,171 Other State operating grants and 145,834 Federal operating grants 668105 592,725 641,124 752,152
General revenuesInvestment income earned on 9,588 11,612 15,331 82,000 Investment income 122,358 481,976 818,294 1,141,118 Other revenue 320,180 265,632 26,983 40,509
Extraordinary Item: Reversal of AB99 liability
51,369,439
Total revenues 28,472,411$ 82,145,221$ 30,311,653$ 36,217,228$
Net (expense) revenue (6,574,351)$ 48,920,980$ (72,779,772)$ (19,878,957)$
* Statistical information is presented as of the first fiscal year that GASB 34 was implemented.
Fiscal Year

39
2009 2008 2007 2006 2005
2,439,415 2,323,471 2,258,080 2,241,058 1,675,442 54,377,591 51,331,591 42,972,440 36,171,992 46,969,598 5,660,307 5,959,517 5,856,371 4,921,544 4,232,963
62,477,313 59,614,579 51,086,891 43,334,594 52,878,003
33,396,055$ 35,494,096$ 37,356,314$ 39,332,323$ 40,175,154$ 4,294,144 4,114,774 1,706,125 2,554,681 3,698,878
104,166 352,597 669,897 330,598 476,537 1,020,269 1,020,556 2,237,302 307,741 4,601,132
82,479 190,332 430,669 203,588 871,949 3,944,954 8,854,562 7,954,594 6,506,090 3,499,075
210,659 148,113 41,527 176,257 210,602
43,052,726$ 50,175,030$ 50,396,428$ 49,411,278$ 53,533,327$
(19,424,587)$ (9,439,549)$ (690,463)$ 6,076,684$ 655,324$
Fiscal Year

CHILDREN AND FAMILIES COMMISSION OF ORANGE COUNTY FUND BALANCES – GENERAL FUND
LAST NINE FISCAL YEARS*
40
2013 2012 2011 2010
Reserved
Reserved for imprest fund 15,000$
Reserved for encumbrances 43,044,502
Reserved for contractual obligations 24,677,280
Reserved for capital projects 2,500,050
Reserved for First 5 California initiatives
Unreserved
Designated for program operations 2,495,502
Designated for future funding cycles and operating budget
30,006,543
Total fund balances -$ -$ -$ 102,738,877$
2013 2012 2011 2010
FUND BALANCES
Nonspendable fund balance 5,624,041$ 65,657$ 399,279$ -$
Restricted fund balance
Committed fund balance 44,990,092 45,090,000 35,123,581 67,721,782
Assigned fund balance 21,350,266 33,560,512 5,010,552
Unassigned fund balance (5,547,385) 30,006,543 Total fund balances 71,964,399$ 78,716,169$ 29,975,475$ 102,738,877$
Fiscal Year
Fiscal Year

41
2009 2008 2007 2006 2005
15,000$ 15,000$ 15,000$ -$ -$
70,245,812 2,207,285 22,151,367 20,116,494 16,586,404
27,017,022 68,027,433 33,553,325 32,771,294
4,000,000 5,000,000
8,690,731 5,378,112
3,128,463
18,115,319 58,252,130 123,929,539 89,740,050 89,740,050
122,521,616$ 142,192,579$ 151,474,018$ 143,409,869$ 139,097,748$
2009 2008 2007 2006 2005
-$ -$ -$ -$ -$
8,690,731 5,378,112
97,262,834 70,234,718 22,151,367 53,669,819 49,357,698
7,143,463 5,015,000 15,000
18,115,319 58,252,130 123,929,539 89,740,050 89,740,050 122,521,616$ 142,192,579$ 151,474,018$ 143,409,869$ 139,097,748$
Fiscal Year
Fiscal Year

CHILDREN AND FAMILIES COMMISSION OF ORANGE COUNTY CHANGES IN FUND BALANCES – GENERAL FUND
LAST NINE FISCAL YEARS*
42
2013 2012 2011
Revenues:Prop 10 Tobacco taxes 27,024,505$ 28,988,350$ 28,809,921$ Prop 10 State School Readiness
Other State operating grants and contributions
First 5 CARES Plus 217,258 145,487 First 5 Child Signature Program
Investment income earned on tobacco taxes at the State Level (SMIF)
9,588 11,612 15,331
Federal operating grants 603,957 903,770 686,722 Investment income 122,358 481,976 818,294 Other revenue 320,180 90,786 26,983
Total revenues 28,297,846 30,621,981 30,357,251
Expenditures:Current:
Salaries and benefits 1,708,344 2,094,972 2,320,099 Expenditures related to "Zero to Five" Program 33,341,947 31,155,080 49,431,115 Services and supplies for State School Readiness program
Total expenditures 35,050,291 33,250,052 51,751,214
Excess (deficiency) or revenues (6,752,445) (2,628,071) (21,393,963) over (under) expenditures
Other Financing Sources (uses):Extraordinary Item: Accrual of AB99 liability (51,369,439) Extraordinary Item: Reversal of AB99 liability 51,369,439
Total changes in fund balance (6,752,445)$ 48,741,368$ (72,763,402)$
* Statistical information is presented as of the first fiscal year that GASB 34 was implemented.
Capital outlay
Fiscal Year

43
2010 2009 2008 2007 2006 2005
29,706,126$ 33,396,055$ 35,527,837$ 37,356,314$ 39,332,323$ 40,175,154$ 4,349,489 4,294,144 4,114,774 10,461,757
145,834 104,166 352,597 669,897 311,792 193,567
82,000 82,479 190,332 430,669 871,949
840,427 757,061 1,130,638 2,237,302 1,432,084 1,848,076 1,141,118 3,944,954 8,854,562 7,954,594 6,506,090 3,499,075
40,509 210,659 148,113 41,527 36,867 181,836 36,305,503 42,789,518 50,318,853 59,152,060 47,619,156 46,769,657
2,409,027 2,425,403 2,312,004 2,262,578 2,218,293 1,670,398 46,834,681 54,374,771 51,328,771 42,968,962 36,167,198 46,965,745 6,844,534 5,660,307 5,959,517 5,856,371 4,921,544 4,232,963
11,286 56,088,242 62,460,481 59,600,292 51,087,911 43,307,035 52,880,392
(19,782,739) (19,670,963) (9,281,439) 8,064,149 4,312,121 (6,110,735)
(19,782,739)$ (19,670,963)$ (9,281,439)$ 8,064,149$ 4,312,121$ (6,110,735)$
Fiscal Year

CHILDREN AND FAMILIES COMMISSION OF ORANGE COUNTY FIRST 5 CALIFORNIA COUNTY TAX REVENUE CAPAPCITY
44
Orange County State TotalActual Revenues Received (1)
2003/2004 $39,551,911 $458,509,8672004/2005 $40,175,154 $474,651,7472005/2006 $39,332,323 $468,897,0222006/2007 $37,356,302 $451,562,7232007/2008 $35,527,837 $442,394,7482008/2009 $33,396,055 $424,449,4992009/2010 $29,706,126 $381,995,5742010/2011 $28,809,921 $374,284,0182011/2012 $28,988,350 $377,690,1332012/2013 $27,024,505 $360,434,399
Projected Revenues (2)
2013/2014 $26,319,003 $346,791,2002014/2015 $25,342,828 $335,591,2002015/2016 $24,738,693 $327,591,2002016/2017 $23,772,076 $314,791,200
* Historical data and projected revenues are presented to communicate tax revenuecapacity as a declining revenue source
(1) Source: First 5 California County Funds Distributions; historical data is presentedas of the first fiscal year that GASB 34 was implemented.
(2) Source: First 5 California County Tax Revenue Projections for 2012/13 to 2016/17(Updated 5/28/13 utilizing DOF May Revise 2013 Tobacco Tax Projectionsand DOF 2011 Birth Projections for California State and Counties 1970-2021)

CHILDREN AND FAMILIES COMMISSION OF ORANGE COUNTY STATE OF CALIFORNIA-CIGARETTE TAXES AND OTHER TOBACCO PRODUCTS
SURTAX REVENUE, 1959-60 TO 2010-11
45
Cigarette tax Other tobacco products surtax
Distributors' Gross value of
Fiscal year Revenue a/ discounts b/ tax indicia c/ Refunds Revenue Rate (%)
1 2 3 4 5 6 7
2010-11 $828,831,000 $7,105,000 $835,937,000 $1,308,000 $77,016,000 33.02%
2009-10 838,709,000 7,187,000 845,896,000 1,583,000 84,617,000 41.11%
2008-09 912,724,000 7,819,000 920,543,000 626,000 85,506,000 45.13%
2007-08 955,030,000 8,185,000 963,215,000 727,000 85,929,000 45.13%
2006-07 998,723,000 8,558,000 1,007,281,000 1,330,000 79,946,000 46.76%
2005-06 1,026,497,000 8,795,000 1,035,293,000 1,707,000 67,348,000 46.76%
2004-05 1,024,272,000 8,778,000 1,033,051,000 1,653,000 58,441,000 46.76%
2003-04 1,021,366,000 8,755,000 1,030,121,000 4,721,000 44,166,000 46.76%
2002-03 1,031,772,000 8,845,000 1,040,617,000 13,248,000 40,996,000 48.89%
2001-02 1,067,004,000 9,146,000 1,076,150,000 10,774,000 50,037,000 52.65% d/
2000-01 1,110,692,000 9,503,000 1,120,195,000 8,741,000 52,834,000 54.89%
1999-00 1,166,880,000 9,980,000 1,176,859,000 9,413,000 66,884,000 66.50%
1998-99 841,911,000 e/ 7,206,000 849,117,000 6,808,000 42,137,000 f/ 61.53% f/
1997-98 612,066,000 5,244,000 617,309,000 5,448,000 39,617,000 29.37%
1996-97 629,579,000 5,394,000 634,973,000 5,060,000 41,590,000 30.38%
1995-96 639,030,000 5,469,000 644,499,000 6,193,000 32,788,000 31.20%
1994-95 656,923,000 5,628,000 662,551,000 11,159,000 28,460,000 31.20%
1993-94 647,993,000 g/ 5,553,000 653,546,000 8,353,000 19,773,000 23.03%
1992-93 667,479,000 5,715,000 673,195,000 9,138,000 21,480,000 26.82%
1991-92 711,275,000 6,086,000 717,362,000 7,791,000 22,016,000 29.35%
1990-91 729,612,000 6,242,000 735,854,000 7,904,000 24,064,000 34.17%
1989-90 770,042,000 h/ 6,581,000 776,623,000 11,615,000 24,956,000 h/ 37.47
1988-89 499,712,000 h/ 4,273,000 503,984,000 4,968,000 9,994,000 h/ 41.67
1987-88 254,869,000 2,180,000 257,049,000 2,970,000
1986-87 257,337,000 2,202,000 259,539,000 2,661,000
1985-86 260,960,000 2,231,000 263,190,000 2,834,000
1984-85 265,070,000 2,267,000 267,337,000 2,390,000
1983-84 265,265,000 2,267,000 267,532,000 2,756,000
1982-83 273,748,000 2,336,000 276,084,000 2,060,000
1981-82 278,667,000 2,383,000 281,050,000 1,843,000
1980-81 280,087,000 2,395,000 282,482,000 1,567,000
1979-80 272,119,000 2,327,000 274,446,000 1,645,000
1978-79 270,658,000 2,315,000 272,973,000 1,408,000
1977-78 275,042,000 2,352,000 277,394,000 1,239,000
1976-77 270,502,000 2,315,000 272,817,000 832,000
1975-76 269,852,000 2,309,000 272,161,000 927,000
1974-75 264,182,000 2,262,000 266,444,000 745,000
1973-74 259,738,000 2,222,000 261,960,000 632,000
1972-73 253,089,000 2,167,000 255,256,000 626,000
1971-72 248,398,000 2,127,000 250,525,000 677,000
1970-71 240,372,000 2,058,000 242,430,000 552,000
1969-70 237,220,000 2,032,000 239,253,000 455,000
1968-69 238,836,000 2,046,000 240,882,000 492,000
1967-68 208,125,000 i/ 1,862,000 209,987,000 328,000
1966-67 75,659,000 1,543,000 77,202,000 129,000
1965-66 74,880,000 1,528,000 76,407,000 88,000
1964-65 74,487,000 1,520,000 76,007,000 61,000
1963-64 71,530,000 1,459,000 72,989,000 71,000
1962-63 70,829,000 1,445,000 72,274,000 79,000
1961-62 68,203,000 1,390,000 69,593,000 47,000
1960-61 66,051,000 j/ 1,675,000 k/ 67,726,000 76,000
1959-60 61,791,000 l/ 767,000 l/ 62,558,000 67,000
Source: State Board of Equalization 2010-2011 Annual Report: Cigarette Taxes and Other Tobacco Products Surtax Revenue, 1959-60 to 2010-11
a. Net of refunds for tax indicia on cigarettes that become unfit for use (See column 5). b. A discount of .85 percent of gross value of tax indicia is granted to distributors for affixing the stamps. From July 1, 1960, until August 1, 1967, the discount rate was 2 percent. c. Includes sales of indicia purchased on credit. Effective July 16, 1961, distributors have been able to purchase tax indicia on credit. d. From July 1, 2001, through September 9, 2001, the surtax rate on smokeless tobacco ranged from 131 percent for moist snuff to 490 percent for chewing tobacco.
Effective September 10, 2001, the surtax rate on smokeless tobacco was lowered to 52.65 percent. e. Effective January 1, 1999, the overall tax rate on cigarettes was increased from 37 cents to 87 cents per pack under voter-approved Proposition 10. The additional 50-cent-per-
pack tax was imposed to raise funds for early childhood development programs. Excludes $87,978,766 in 1998-99 from the floor stocks taxes for both cigarettes and other tobacco products levied on January 1, 1999.
f. From July 1, 1998, through December 31, 1998, the surtax rate was 26.17 percent for other tobacco products. Effective January 1, 1999, the new surtax imposed under Proposition 10 raised the combined surtax rate to 61.53 percent for other tobacco products. The new surtax is equivalent (in terms of the wholesale costs of other tobacco products) to a 50-cent-per-pack tax on cigarettes.
g. Effective January 1, 1994, the overall tax rate on cigarettes was increased from 35 cents to 37 cents per pack. The additional 2-cent-per-pack tax was imposed to raise funds for breast cancer research and education.
h. Effective January 1, 1989, an additional 25-cent-per-pack surtax was imposed on cigarettes and a new 41.67 percent surtax was imposed on other tobacco products. Excludes $57,927,856 in 1988-89 and $595,000 in 1989-90 from the floor stocks tax levied on January 1, 1989.
i. Effective August 1, 1967, the tax rate was increased from 3 cents to 7 cents per pack. On October 1, 1967, the rate was further increased to 10 cents per pack, with the stipulation that 30 percent of the tax be allocated to cities and counties. Includes $6,515,209 from the 4-cent-per-pack floor stocks tax levied on August 1, 1967; and $4,889,485 from the 3-cent-per-pack floor stocks tax imposed October 1, 1967.
j. Refunds made for distributors' discounts in the 1960-61 fiscal year on purchases made in the 1959-60 fiscal year have been deducted. These refunds amounted to $324,000. k. Effective July 1, 1960, a discount was allowed at the time tax indicia were purchased. l. Includes $2,673,048 from the 3-cent per pack floor stocks tax imposed July 1, 1959; and also includes the amount of distributors' discounts which were refunded after pur-
chase of indicia. During July and August of 1959, the tax was collected by invoice and no discount was allowed on these collections of $8,123,700, nor on the $2,673,048 tax on floor stocks. Note: Detail may not compute to total due to rounding.
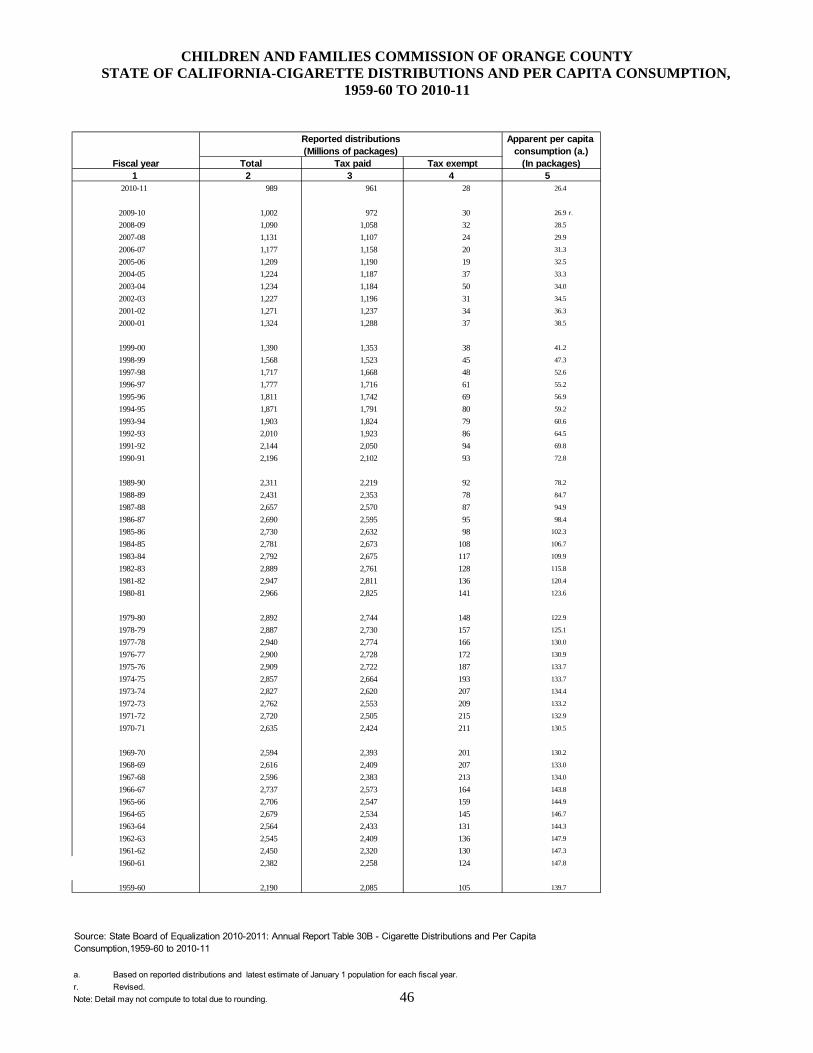
CHILDREN AND FAMILIES COMMISSION OF ORANGE COUNTY STATE OF CALIFORNIA-CIGARETTE DISTRIBUTIONS AND PER CAPITA CONSUMPTION,
1959-60 TO 2010-11
46
Reported distributions Apparent per capita consumption (a.)
Fiscal year Total Tax paid Tax exempt (In packages)1 2 3 4 5
2010-11 989 961 28 26.4
2009-10 1,002 972 30 26.9 r.
2008-09 1,090 1,058 32 28.5
2007-08 1,131 1,107 24 29.9
2006-07 1,177 1,158 20 31.3
2005-06 1,209 1,190 19 32.5
2004-05 1,224 1,187 37 33.3
2003-04 1,234 1,184 50 34.0
2002-03 1,227 1,196 31 34.5
2001-02 1,271 1,237 34 36.3
2000-01 1,324 1,288 37 38.5
1999-00 1,390 1,353 38 41.2
1998-99 1,568 1,523 45 47.3
1997-98 1,717 1,668 48 52.6
1996-97 1,777 1,716 61 55.2
1995-96 1,811 1,742 69 56.9
1994-95 1,871 1,791 80 59.2
1993-94 1,903 1,824 79 60.6
1992-93 2,010 1,923 86 64.5
1991-92 2,144 2,050 94 69.8
1990-91 2,196 2,102 93 72.8
1989-90 2,311 2,219 92 78.2
1988-89 2,431 2,353 78 84.7
1987-88 2,657 2,570 87 94.9
1986-87 2,690 2,595 95 98.4
1985-86 2,730 2,632 98 102.3
1984-85 2,781 2,673 108 106.7
1983-84 2,792 2,675 117 109.9
1982-83 2,889 2,761 128 115.8
1981-82 2,947 2,811 136 120.4
1980-81 2,966 2,825 141 123.6
1979-80 2,892 2,744 148 122.9
1978-79 2,887 2,730 157 125.1
1977-78 2,940 2,774 166 130.0
1976-77 2,900 2,728 172 130.9
1975-76 2,909 2,722 187 133.7
1974-75 2,857 2,664 193 133.7
1973-74 2,827 2,620 207 134.4
1972-73 2,762 2,553 209 133.2
1971-72 2,720 2,505 215 132.9
1970-71 2,635 2,424 211 130.5
1969-70 2,594 2,393 201 130.2
1968-69 2,616 2,409 207 133.0
1967-68 2,596 2,383 213 134.0
1966-67 2,737 2,573 164 143.8
1965-66 2,706 2,547 159 144.9
1964-65 2,679 2,534 145 146.7
1963-64 2,564 2,433 131 144.3
1962-63 2,545 2,409 136 147.9
1961-62 2,450 2,320 130 147.3
1960-61 2,382 2,258 124 147.8
1959-60 2,190 2,085 105 139.7
a. Based on reported distributions and latest estimate of January 1 population for each fiscal year.
r. Revised.
Note: Detail may not compute to total due to rounding.
Source: State Board of Equalization 2010-2011: Annual Report Table 30B - Cigarette Distributions and Per Capita Consumption,1959-60 to 2010-11
(Millions of packages)

CHILDREN AND FAMILIES COMMISSION OF ORANGE COUNTY DEMOGRAPHIC DATA
47
2011** 2010** 2009* 2008* 2007* 2006* 2005* 2004* 2003* 2002* 2001*
Total Population 3,047,120 3,017,327 2,998,820 2,982,790 2,965,829 2,955,425 2,957,137 2,956,473 2,939,733 2,914,419 2,889,905
White 1,334,890 1,336,843 1,363,087 1,383,364 1,392,586 1,405,485 1,423,283 1,439,227 1,447,963 1,453,276 1,458,041
Hispanic 1,032,608 1,010,752 1,008,604 986,104 972,550 961,383 953,194 943,436 928,977 912,149 894,753
Asian & Pacific Islander 554,923 549,149 510,352 499,281 488,521 478,200 471,594 466,022 457,035 445,830 436,407
Black 47,714 45,894 44,641 44,520 44,336 44,328 44,454 44,504 44,397 44,230 44,064
Other/Multi-Race 76,985 74,689 72,136 69,521 67,836 66,029 64,612 63,284 61,361 58,934 56,640
Female 1,540,252 1,526,396 1,512,752 1,505,167 1,496,612 1,491,352 1,491,824 1,490,897 1,482,044 1,469,077 1,456,254
Male 1,506,868 1,490,931 1,486,068 1,477,623 1,469,217 1,464,073 1,465,313 1,465,576 1,457,689 1,445,342 1,433,651
Under 5 years 190,153 190,574 194,723 200,988 202,945 206,581 211,862 215,185 216,027 215,595 215,302
5-9 years 196,567 197,334 200,944 206,588 209,284 211,386 214,222 218,740 222,701 226,100 228,607
10-14 years 208,217 210,213 209,260 218,622 222,735 226,066 228,892 229,527 226,559 221,305 214,550
15-19 years 226,967 228,147 222,780 219,706 215,560 211,947 209,182 206,124 202,996 200,166 198,376
20-24 years 220,121 215,348 209,857 210,065 209,122 208,119 207,329 205,261 201,562 197,484 194,730
25-34 years 420,397 414,942 411,027 407,538 406,889 410,873 420,513 433,062 444,037 454,288 464,427
35-44 years 433,018 436,662 447,102 463,117 468,042 472,297 477,416 481,743 482,978 482,564 481,660
45-54 years 448,793 444,935 443,950 431,378 422,705 413,346 405,181 397,440 388,866 380,310 372,891
55-59 years 185,367 177,331 172,474 165,260 163,804 161,041 157,034 152,133 146,880 140,817 133,371
60-64 years 154,221 148,668 142,894 132,056 125,167 120,075 116,676 113,220 108,649 103,451 99,290
65-74 years 197,489 189,614 183,812 171,707 166,405 162,709 160,296 158,012 154,978 151,806 149,338
75-84 years 114,165 113,374 111,930 111,338 110,392 109,762 108,681 107,286 105,784 103,938 101,841
85+ 51,645 50,184 48,067 44,427 42,779 41,223 39,853 38,740 37,716 36,595 35,522
Sources: *
** State of California, Department of Finance, Report P-2 - State and County Population Projections by Race/Ethnicity and 5-year Age Groups, 2010-2060 (by year), Jan 2013.
State of California, Department of Finance, Race/Ethnic Population with Age and Sex Detail, 2000–2050. Sacramento, CA, May 2012.

CHILDREN AND FAMILIES COMMISSION OF ORANGE COUNTY LIVE BIRTHS, CALIFORNIA COUNTIES, 2002-2011 (By Place of Residence)
48
2002 2003 2004 2005 2006 2007 2008 2009 2010 2011CALIFORNIA 529,245 540,827 544,685 548,700 562,157 566,137 551,567 526,774 509,979 502,023 ALAMEDA 21,802 21,574 20,919 20,902 21,058 21,519 20,972 20,320 19,302 19,002 ALPINE 11 14 8 15 13 13 13 4 4 6 AMADOR 260 299 262 288 274 294 288 295 272 269 BUTTE 2,268 2,382 2,354 2,451 2,633 2,519 2,518 2,439 2,454 2,392 CALAVERAS 338 323 322 371 393 397 373 338 346 326 COLUSA 307 330 345 381 389 386 367 361 338 302 CONTRA COSTA 13,315 13,210 13,279 13,143 13,565 13,485 13,136 12,680 12,352 12,057 DEL NORTE 288 299 285 327 365 356 312 333 372 337 EL DORADO 1,765 1,751 1,897 1,930 2,036 1,881 1,814 1,719 1,618 1,629 FRESNO 14,766 15,401 15,896 15,936 16,876 17,291 16,760 16,273 16,281 16,157 GLENN 408 431 398 431 455 434 472 424 434 391 HUMBOLDT 1,420 1,444 1,509 1,598 1,643 1,599 1,601 1,542 1,551 1,448 IMPERIAL 2,662 2,908 2,861 3,058 3,127 3,148 3,221 3,145 3,072 3,075 INYO 173 198 214 205 250 212 226 239 192 213 KERN 12,211 12,888 13,455 14,022 15,104 15,328 15,315 14,827 14,416 14,287 KINGS 2,311 2,365 2,549 2,554 2,683 2,781 2,710 2,644 2,507 2,565 LAKE 636 684 686 728 695 742 705 726 721 715 LASSEN 301 300 301 289 259 264 323 325 322 300 LOS ANGELES 151,167 152,192 151,504 150,377 151,837 151,813 147,684 139,679 133,160 130,312 MADERA 2,147 2,291 2,346 2,349 2,622 2,611 2,535 2,390 2,434 2,401 MARIN 2,772 2,830 2,792 2,785 2,734 2,819 2,716 2,495 2,368 2,385 MARIPOSA 130 135 150 122 159 141 147 155 145 132 MENDOCINO 1,078 1,102 1,125 1,121 1,106 1,145 1,168 1,100 1,059 1,061 MERCED 4,030 4,278 4,296 4,470 4,742 4,650 4,423 4,407 4,248 4,281 MODOC 67 89 85 81 80 80 92 85 119 87 MONO 138 139 170 153 192 161 175 139 151 156 MONTEREY 7,119 7,423 7,396 7,501 7,474 7,551 7,434 7,068 6,764 6,814 NAPA 1,571 1,676 1,604 1,658 1,754 1,665 1,671 1,653 1,525 1,572 NEVADA 823 821 818 819 804 844 871 758 793 761 ORANGE 44,796 45,366 45,060 44,065 44,231 44,026 42,456 40,431 38,237 38,100 PLACER 3,484 3,639 3,797 3,823 3,892 4,051 4,035 3,804 3,824 3,832 PLUMAS 183 180 173 176 172 186 175 154 170 165 RIVERSIDE 26,691 28,028 29,545 31,509 33,659 34,556 32,866 31,601 30,659 30,610 SACRAMENTO 19,243 20,424 20,836 21,184 21,952 22,110 21,389 20,426 20,055 19,998 SAN BENITO 920 869 887 892 885 882 816 752 735 772 SAN BERNARDINO 29,696 30,824 31,914 33,075 34,675 35,193 33,788 31,984 31,367 30,573 SAN DIEGO 43,951 45,368 45,758 45,897 46,876 47,545 46,742 44,960 44,838 43,621 SAN FRANCISCO 8,361 8,659 8,579 8,403 8,609 9,125 9,104 8,807 8,800 8,813 SAN JOAQUIN 10,162 10,455 11,010 11,495 11,782 11,592 11,030 10,872 10,593 10,328 SAN LUIS OBISPO 2,368 2,620 2,694 2,664 2,727 2,884 2,737 2,614 2,736 2,632 SAN MATEO 10,091 10,179 10,089 9,938 9,808 9,910 9,765 9,452 9,193 9,047 SANTA BARBARA 5,698 5,800 6,209 6,192 6,166 6,289 6,319 6,039 5,819 5,803 SANTA CLARA 27,060 26,997 26,537 26,553 26,942 27,484 26,730 25,200 23,936 23,652 SANTA CRUZ 3,334 3,453 3,399 3,385 3,600 3,571 3,538 3,301 3,190 3,232 SHASTA 1,963 2,060 2,046 2,123 2,191 2,230 2,186 2,069 2,136 2,021 SIERRA 30 30 18 35 14 24 22 21 23 23 SISKIYOU 411 493 467 470 493 512 498 477 434 472 SOLANO 5,851 5,818 5,688 5,737 5,801 5,847 5,607 5,392 5,047 5,158 SONOMA 5,679 5,843 5,964 5,613 5,896 5,742 5,761 5,683 5,391 5,150 STANISLAUS 7,929 8,022 8,061 8,445 8,728 8,826 8,549 7,941 7,804 7,737 SUTTER 1,263 1,352 1,342 1,484 1,577 1,497 1,468 1,433 1,360 1,326 TEHAMA 711 758 700 872 818 765 790 814 767 728 TRINITY 106 105 110 120 122 117 126 116 107 123 TULARE 7,419 7,602 7,957 8,168 8,284 8,505 8,533 8,362 8,155 7,966 TUOLUMNE 442 468 477 446 495 474 486 425 487 430 VENTURA 11,606 12,008 11,954 12,160 12,453 12,194 12,076 11,353 11,147 10,656 YOLO 2,384 2,434 2,404 2,453 2,646 2,522 2,669 2,483 2,426 2,340 YUBA 1,129 1,196 1,184 1,258 1,341 1,349 1,264 1,245 1,223 1,282
Source: State of California, Department of Public Health, Birth Records
YEARCOUNTY

CHILDREN AND FAMILIES COMMISSION OF ORANGE COUNTY CHILDREN’S SCORECARD ORANGE COUNTY TRENDS, 2000-2010
49
2010 2009 2008 2007 2006 2005 2004 2003 2002 2001GOOD HEALTHTotal percentage of women who received early prenatal care* 89.0% 88.0% 88.0% 88.0% 91.0% 91.0% 92.0% 92.0% 91.0% 89.0%Women with prenatal care in the first trimester* 34,018 35,650 37,267 38,727 38,364 38,365 41,306 41,516 40,654 40,612Newborns with low birth weight (less than 2,500 grams)* 2,462 2,670 2,705 2,879 2,816 2,826 2,782 2,718 2,710 2,666Percent of Newborns with low birth weight* 6.4% 6.6% 6.4% 6.5% 6.4% 6.4% 6.2% 6.0% 6.1% 5.9%Infants taken into protective custody due to positive testing for alcohol/drug exposure at birth*
89 81 107 158 164 165 203 120 121 93
Children adequately immunized at age 2* 76.6% 81.1% 76.9% 78.9% 78.9% 77.6% 71.4% 73.8% 71.4% 69.7%Infant Deaths* 147 165 202 187 224 211 179 200 216 206Infant Mortality Rate (per 1,000 live births)* 3.8 4.1 4.8 4.2 5.1 4.8 4 4.4 4.8 4.5Birth rate per 1,000 females ages 15-19 in Orange County* 21.4 23.6 25.9 27.7 29.9 29.8 30.1 30.7 32.3 34.9Breastfeeding Percentages (any)* 92.7% 88.0% ***Breastfeeding Percentages (exclusive)* 55.6% 39.2% ***Number of children under 18 served by children and youth services* 13,006 12,864 12,552 12,334 11,962 12,203 13,724 14,007 13,590 12,893
ECONOMIC WELL-BEINGChildren receiving financial assistance though CalWORKS* 42,793 35,962 31,932 32,040 33,618 36,245 37,384 38,997 38,999 39,826Percent of children receiving CalWORKS of total population under 18* 5.4% 4.5% 4.0% 4.0% 4.0% 5.0% 5.0% 5.0% 5.0% 5.0%Number of students receiving free and reduced lunch* 227,820 211,179 197,671 184,956 193,802 200,340 196,430 198,167 190,979 183,524Percentage of students receiving free and reduced lunch* 44.0% 43.0% 40.0% 39.0% 39.0% 39.0% 38.0% 38.0% 38.0% 37.0%Number of participants served by the WIC program* 100,434 104,622 117,188 107,595 95,635 98,635 99,115 97,882 103,264 99,632Total number of child support cases* 100,056 103,598 94,860 94,769 97,425 98,503 99,134 102,040 99,903 102,043Total child support collections $ (in millions)* 177.6 180.3 179.6 179 176.8 176.9 171.9 166.1 163.5 159.3
EDUCATIONAL ACHIEVEMENTTotal public school enrollment* 502,903 502,239 504,136 503,225 503,955 510,114 513,744 515,464 512,105 503,351Number of English leaner students* 141,605 140,887 142,833 141,762 144,118 149,535 153,055 159,145 156,725 150,653Average $ expenditure per pupil for grades K-12* 7,852 8,724 8,844 8,008 7,360 6,944 6,750 6,715 6,557 6,156Total number of students K-12 receiving special education* 51,208 51,394 51,486 51,047 51,131 52,243 51,049 51,514 50,236 49,013
SAFE HOMES AND COMMUNITIESTotal number of child abuse registry reports* 37,977 38,900 41,119 36,593 33,381 34,909 37,015 27,704 25,607 26,005Average monthly number of children in out-of-home care* 2,195 2,466 2,668 2,562 2,394 2,566 2,772 2,939 3,253 3,475Average monthly number of dependents of the court* 3,022 3,433 3,675 3,447 3,187 3,399 3,674 4,007 4,256 4,618Emancipation Services Program: monthly average youth served* 1,981 1,717 1,775 1,778 1,807 1,866 1,872 1,803 1,794 1,586Total number of children places in adoptive homes* 355 345 406 343 295 373 424 513 475 419Total juvenile arrests for youth 10 to 17 years of age* 13,495 14,354 14,927 15,015 14,036 13,014 13,033 13,580 13,646 14,986Total number of juveniles referred to probation, 10 to 18 years* 11,533 11,531 12,456 11,900 10,852 10,772 10,092 10,491 10,770 10,688
* The 18th Annual Report on the Condition of Children in Orange County 2012 presents dates through calendar year 2010. Data through FY 2011-12 not yet available.
*** Methodologies used to collect data have been revised. 2009 data and prior years should not be compared.
** The Public Schools Accountability Act (PSAA) of 1999 (Chapter 3, Statutes of 1999), requires that the California Department of Education (CDE) annually calculate APIs for California public schools and publish school rankings based on these indicies.

CHILDREN AND FAMILIES COMMISSION OF ORANGE COUNTY CAPITAL ASSETS STATISTICS
50
Capital Assets (equipment) are used by the Commission for general operating and administrative functions.Proposition 10 funds (tobacco taxes) were not used to purchase any capital assets.

CHILDREN AND FAMILIES COMMISSION OF ORANGE COUNTY PRINCIPAL EMPLOYERS
51
Percentage ofNumber of Total County
Employer Employees Rank Employment
Walt Disney Co. 25,000 1 1.57%University of California, Irvine 21,800 2 1.37%St. Joseph Health System 11,679 3 0.73%Boeing Co. 6,873 4 0.43%Kaiser Permanente 6,300 5 0.40%Bank of America Corp. 6,000 6 0.38%Memorial Care Health System 5,545 7 0.35%Target Corp. 5,400 8 0.34%Cedar Fair LP 5,200 9 0.33%California State University, Fullerton 4,984 10 0.31%
Percentage ofNumber of Total County
Employer Employees Rank Employment
Walt Disney Co. 21,000 1 1.35%University of California, Irvine 15,000 2 0.96%CKE Restaurants Inc 14,000 3 0.90%Boeing Co. 10,800 4 0.69%Albertson's 8,700 5 0.56%St. Joseph Health System 8,500 6 0.54%Tenet Healthcare 8,300 6 0.53%Yum Brands Inc. 6,500 8 0.42%SBC Communications 5,900 9 0.38%Target Corp. 5,400 10 0.35%
* Source: Orange County Business Journal, Book of Lists, 2013 (list includes corporations, hospitals and universities)
** Source: OC ALMANAC - Largest Employers in Orange County, 2002-2003 (list includes corporations, hospitals and universities)
2012*
2003**

CHILDREN AND FAMILIES COMMISSION OF ORANGE COUNTY EMPLOYEES BY FUNCTION LAST EIGHTS FISCAL YEAR
52
2013 2012 2011 2010
Number of Employees by Function
General Administration 4 6 7 7
Finance 1 2 2 2
Contracts Administration 4 4 5 5
Program Management & Evaluation 4 3 3 4
Total Employees 13 15 17 18
* Table presents Regular and Limited-Term Employees
Fiscal Year

53
2009 2008 2007 2006 2005
7 8 7 8 8
2 1 2 3 2
5 5 5 5 2
4 4 2 2 2
18 18 16 18 14
Fiscal Year

54
INDEPENDENT AUDITORS’ REPORT ON INTERNAL CONTROL OVER FINANCIAL REPORTING AND ON COMPLIANCE AND OTHER MATTERS BASED ON AN AUDIT OF
FINANCIAL STATEMENTS PERFORMED IN ACCORDANCE WITH GOVERNMENT AUDITING STANDARDS
To the Board of Commissioners Children and Families Commission of Orange County We have audited, in accordance with the auditing standards generally accepted in the United States of America and the standards applicable to financial audits contained in Government Auditing Standards issued by the Comptroller General of the United States, the financial statements of the governmental activities and the general fund of the Children and Families Commission of Orange County (Commission) as of and for the year ended June 30, 2013, and the related notes to the financial statements, which collectively comprise the Commission’s basic financial statements, and have issued our report thereon dated September 27, 2013. Our report included an emphasis-of-matter regarding the Commission’s adoption of Governmental Accounting Standards Board (GASB) Statement No. 63, Financial Reporting of Deferred Outflows of Resources, Deferred Inflows of Resources, and Net Position, effective July 1, 2012. Internal Control Over Financial Reporting In planning and performing our audit of the financial statements, we considered the Commission’s internal control over financial reporting (internal control) to determine the audit procedures that are appropriate in the circumstances for the purpose of expressing our opinions on the financial statements, but not for the purpose of expressing an opinion on the effectiveness of the Commission’s internal control. Accordingly, we do not express an opinion on the effectiveness of the Commission’s internal control. A deficiency in internal control exists when the design or operation of a control does not allow management or employees, in the normal course of performing their assigned functions, to prevent, or detect and correct, misstatements on a timely basis. A material weakness is a deficiency, or a combination of deficiencies, in internal control, such that there is a reasonable possibility that a material misstatement of the entity’s financial statements will not be prevented, or detected and corrected on a timely basis. A significant deficiency is a deficiency, or a combination of deficiencies, in internal control that is less severe than a material weakness, yet important enough to merit attention by those charged with governance. Our consideration of internal control was for the limited purpose described in the first paragraph of this section and was not designed to identify all deficiencies in internal control that might be material weaknesses or, significant deficiencies. Given these limitations, during our audit we did not identify any deficiencies in internal control that we consider to be material weaknesses. However, material weaknesses may exist that have not been identified.
Vavrinek, Trine, Day & Co., LLPCertified Public Accountants
VALUE THE D IFFERENCE
FRESN O • L AGUN A H I L LS • PALO ALTO • P LEASANTON • RAN C HO CUC AMON GA • R I v E R S I d E • SACRAMENTO
25231 Paseo De Alicia, Suite 100 Laguna Hills, CA 92653 Tel: 949.768.0833 Fax: 949.768.8408 www.vtdcpa.com

55
Compliance and Other Matters As part of obtaining reasonable assurance about whether the Commission’s financial statements are free from material misstatement, we performed tests of its compliance with certain provisions of laws, regulations, contracts, and grant agreements, noncompliance with which could have a direct and material effect on the determination of financial statement amounts. However, providing an opinion on compliance with those provisions was not an objective of our audit, and accordingly, we do not express such an opinion. The results of our tests disclosed no instances of noncompliance or other matters that are required to be reported under Government Auditing Standards. Purpose of this Report The purpose of this report is solely to describe the scope of our testing of internal control and compliance and the results of that testing, and not to provide an opinion on the effectiveness of the entity’s internal control or on compliance. This report is an integral part of an audit performed in accordance with Government Auditing Standards in considering the Commission’s internal control and compliance. Accordingly, this communication is not suitable for any other purpose. Laguna Hills, California September 27, 2013
56
INDEPENDENT AUDITORS’ REPORT ON STATE COMPLIANCE
To the Board of Commissioners Children and Families Commission of Orange County Compliance We have audited the basic financial statements of the Children and Families Commission of Orange County (Commission), a component unit of the County of Orange, California as of and for the year ended June 30, 2013 and have issued our report thereon dated September 27, 2013. Our report included an emphasis-of-matter regarding the Commission’s adoption of Statement of Governmental Accounting Standard (GASB) Statement No. 63, Financial Reporting of Deferred Outflows of Resources, Deferred Inflows of Resources, and Net Position, effective July 1, 2012. We conducted our audit in accordance with auditing standards generally accepted in the United States of America and the standards applicable to financial audits contained in Government Auditing Standards, issued by the Comptroller General of the United States. We have also audited the Commission’s compliance with the requirements specified in the State of California’s Standards and Procedures for Audits of Local Entities Administering the California Children and Families Act, issued by the State Controller’s Office, applicable to the Commission’s statutory requirements identified below for the year ended June 30, 2013. Management’s Responsibility Compliance with the requirements referred to above is the responsibility of the Commission’s management. Auditor’s Responsibility Our responsibility is to express an opinion on the Commission’s compliance based on our audit. We conducted our compliance audit in accordance with auditing standards generally accepted in the United States of America; the standards applicable to financial audits contained in Government Auditing Standards issued by the Comptroller General of the United States; and the State of California’s Standards and Procedures for Audits of Local Entities Administering the California Children and Families Act, issued by the State Controller’s Office. Those standards and the State of California’s Standards and Procedures for Audits of Local Entities Administering the California Children and Families Act require that we plan and perform the audit to obtain reasonable assurance about whether noncompliance with the compliance requirements referred to above that could have a material effect on the statutory requirements listed below occurred. An audit includes examining, on a test basis, evidence about the Commission’s compliance with those requirements and performing such other procedures as we considered necessary in the circumstances. We believe that our audit provides a reasonable basis for our opinion. Our audit does not provide a legal determination of the Commission’s compliance with those requirements.
Vavrinek, Trine, Day & Co., LLPCertified Public Accountants
VALUE THE D IFFERENCE
FRESN O • L AGUN A H I L LS • PALO ALTO • P LEASANTON • RAN C HO CUC AMON GA • R I v E R S I d E • SACRAMENTO
25231 Paseo De Alicia, Suite 100 Laguna Hills, CA 92653 Tel: 949.768.0833 Fax: 949.768.8408 www.vtdcpa.com

57
In connection with the audit referred to above, we selected and tested transactions and records to determine the Commission’s compliance with the state laws and regulations applicable to the following items:
Audit Guide Procedures Description Procedures Performed Contracting and Procurement 6 Yes Administrative Costs 3 Yes Conflict-of-Interest 3 Yes County Ordinance 4 Yes Long-range Financial Plans 2 Yes Financial Condition of the Commission 1 Yes Program Evaluation 3 Yes Salaries and Benefit Policies 2 Yes Opinion In our opinion, the Commission complied, in all material respects, with the compliance requirements referred to above that are applicable to the statutory requirements listed above for the year ended June 30, 2013. Purpose of Report The purpose of this report on compliance is solely to describe the scope of our testing over compliance and the results of that testing based on the State of California’s Standards and Procedures for Audits of Local Entities Administering the California Children and Families Act, issued by the Controller’s Office. Accordingly, this report is not suitable for any other purpose. Laguna Hills, California September 27, 2013

CHILDREN AND FAMILIES COMMISSION OF ORANGE COUNTY
SINGLE AUDIT REPORT
FOR THE FISCAL YEAR ENDED JUNE 30, 2013

CHILDREN AND FAMILIES COMMISSION OF ORANGE COUNTY FISCAL YEAR ENDED JUNE 30, 2013
TABLE OF CONTENTS
PAGE Independent Auditors' Report on Internal Control Over Financial Reporting and on Compliance and Other Matters Based on an Audit of Financial Statements Performed in Accordance with Government Auditing Standards
1 Independent Auditors' Report on Compliance for Each Major Federal Program; Report on Internal Control Over Compliance; and Report on Schedule of Expenditures of Federal Awards Required by OMB Circular A-133 3 Schedule of Expenditures of Federal Awards 5 Notes to Schedule of Expenditures of Federal Awards 6 Schedule of Findings and Questioned Costs
I. Summary of Auditors’ Results 7
II. Financial Statement Findings 8
III. Federal Award Findings and Questioned Costs 9
Schedule of Prior Year Audit Findings and Recommendations 10

1
INDEPENDENT AUDITORS’ REPORT ON INTERNAL CONTROL OVER FINANCIAL REPORTING AND ON COMPLIANCE AND OTHER MATTERS BASED ON AN
AUDIT OF FINANCIAL STATEMENTS PERFORMED IN ACCORDANCE WITH GOVERNMENT AUDITING STANDARDS
To the Board of Commissioners Children and Families Commission of Orange County We have audited, in accordance with the auditing standards generally accepted in the United States of America and the standards applicable to financial audits contained in Government Auditing Standards issued by the Comptroller General of the United States, the financial statements of the governmental activities and the general fund of the Children and Families Commission of Orange County (Commission) as of and for the year ended June 30, 2013, and the related notes to the financial statements, which collectively comprise the Commission’s basic financial statements, and have issued our report thereon dated September 27, 2013. Our report included an emphasis-of-matter regarding the Commission’s adoption of Governmental Accounting Standards Board (GASB) Statement No. 63, Financial Reporting of Deferred Outflows of Resources, Deferred Inflows of Resources, and Net Position, effective July 1, 2012. Internal Control Over Financial Reporting In planning and performing our audit of the financial statements, we considered the Commission’s internal control over financial reporting (internal control) to determine the audit procedures that are appropriate in the circumstances for the purpose of expressing our opinions on the financial statements, but not for the purpose of expressing an opinion on the effectiveness of the Commission’s internal control. Accordingly, we do not express an opinion on the effectiveness of the Commission’s internal control. A deficiency in internal control exists when the design or operation of a control does not allow management or employees, in the normal course of performing their assigned functions, to prevent, or detect and correct, misstatements on a timely basis. A material weakness is a deficiency, or a combination of deficiencies, in internal control, such that there is a reasonable possibility that a material misstatement of the entity’s financial statements will not be prevented, or detected and corrected on a timely basis. A significant deficiency is a deficiency, or a combination of deficiencies, in internal control that is less severe than a material weakness, yet important enough to merit attention by those charged with governance. Our consideration of internal control was for the limited purpose described in the first paragraph of this section and was not designed to identify all deficiencies in internal control that might be material weaknesses or, significant deficiencies. Given these limitations, during our audit we did not identify any deficiencies in internal control that we consider to be material weaknesses. However, material weaknesses may exist that have not been identified.
Vavrinek, Trine, Day & Co., LLPCertified Public Accountants
VALUE THE D IFFERENCE
FRESN O • L AGUN A H I L LS • PALO ALTO • P LEASANTON • RAN C HO CUC AMON GA • R I v E R S I d E • SACRAMENTO
25231 Paseo De Alicia, Suite 100 Laguna Hills, CA 92653 Tel: 949.768.0833 Fax: 949.768.8408 www.vtdcpa.com
2
Compliance and Other Matters As part of obtaining reasonable assurance about whether the Commission’s financial statements are free from material misstatement, we performed tests of its compliance with certain provisions of laws, regulations, contracts, and grant agreements, noncompliance with which could have a direct and material effect on the determination of financial statement amounts. However, providing an opinion on compliance with those provisions was not an objective of our audit, and accordingly, we do not express such an opinion. The results of our tests disclosed no instances of noncompliance or other matters that are required to be reported under Government Auditing Standards. Purpose of this Report
The purpose of this report is solely to describe the scope of our testing of internal control and compliance and the results of that testing, and not to provide an opinion on the effectiveness of the entity’s internal control or on compliance. This report is an integral part of an audit performed in accordance with Government Auditing Standards in considering the Commission’s internal control and compliance. Accordingly, this communication is not suitable for any other purpose. Laguna Hills, California September 27, 2013

3
INDEPENDENT AUDITORS' REPORT ON COMPLIANCE FOR EACH MAJOR FEDERAL PROGRAM; REPORT ON INTERNAL CONTROL OVER COMPLIANCE; AND REPORT ON
SCHEDULE OF EXPENDITURES OF FEDERAL AWARDS REQUIRED BY OMB CIRCULAR A-133
To the Board of Commissioners Children and Families Commission of Orange County Report on Compliance for Each Major Federal Program We have audited the Children and Families Commission of Orange County’s (the Commission) compliance with the types of compliance requirements described in the OMB Circular A-133 Compliance Supplement that could have a direct and material effect on each of the Commission’s major federal programs for the year ended June 30, 2013. The Commission’s major federal programs are identified in the summary of auditor’s results section of the accompanying schedule of findings and questioned costs. Management’s Responsibility Management is responsible for compliance with the requirements of laws, regulations, contracts, and grants applicable to its federal programs. Auditor’s Responsibility Our responsibility is to express an opinion on compliance for each of the Commission’s major federal programs based on our audit of the types of compliance requirements referred to above. We conducted our audit of compliance in accordance with auditing standards generally accepted in the United States of America; the standards applicable to financial audits contained in Government Auditing Standards, issued by the Comptroller General of the United States; and OMB Circular A-133, Audits of States, Local Governments, and Non-Profit Organizations. Those standards and OMB Circular A-133 require that we plan and perform the audit to obtain reasonable assurance about whether noncompliance with the types of compliance requirements referred to above that could have a direct and material effect on a major federal program occurred. An audit includes examining, on a test basis, evidence about the Commission’s compliance with those requirements and performing such other procedures as we considered necessary in the circumstances. We believe that our audit provides a reasonable basis for our opinion on compliance for each major federal program. However, our audit does not provide a legal determination of the Commission’s compliance. Opinion on Each Major Federal Program In our opinion, the Commission, complied, in all material respects, with the types of compliance requirements referred to above that could have a direct and material effect on each of its major federal programs for the year ended June 30, 2013.
Vavrinek, Trine, Day & Co., LLPCertified Public Accountants
VALUE THE D IFFERENCE
FRESN O • L AGUN A H I L LS • PALO ALTO • P LEASANTON • RAN C HO CUC AMON GA • R I v E R S I d E • SACRAMENTO
25231 Paseo De Alicia, Suite 100 Laguna Hills, CA 92653 Tel: 949.768.0833 Fax: 949.768.8408 www.vtdcpa.com

4
Report on Internal Control Over Compliance Management of the Commission is responsible for establishing and maintaining effective internal control over compliance with the types of compliance requirements referred to above. In planning and performing our audit of compliance, we considered the Commission’s internal control over compliance with the types of requirements that could have a direct and material effect on each major federal program to determine the auditing procedures that are appropriate in the circumstances for the purpose of expressing an opinion on compliance for each major federal program and to test and report on internal control over compliance in accordance with OMB Circular A-133, but not for the purpose of expressing an opinion on the effectiveness of internal control over compliance. Accordingly, we do not express an opinion on the effectiveness of the Commission’s internal control over compliance. A deficiency in internal control over compliance exists when the design or operation of a control over compliance does not allow management or employees, in the normal course of performing their assigned functions, to prevent, or detect and correct, noncompliance with a type of compliance requirement of a federal program on a timely basis. A material weakness in internal control over compliance is a deficiency, or combination of deficiencies, in internal control over compliance, such that there is a reasonable possibility that material noncompliance with a type of compliance requirement of a federal program will not be prevented, or detected and corrected, on a timely basis. A significant deficiency in internal control over compliance is a deficiency, or a combination of deficiencies, in internal control over compliance with a type of compliance requirement of a federal program that is less severe than a material weakness in internal control over compliance, yet important enough to merit attention by those charged with governance. Our consideration of internal control over compliance was for the limited purpose described in the first paragraph of this section and was not designed to identify all deficiencies in internal control over compliance that might be material weaknesses or significant deficiencies. We did not identify any deficiencies in internal control over compliance that we consider to be material weaknesses. However, material weaknesses may exist that have not been identified. The purpose of this report on internal control over compliance is solely to describe the scope of our testing of internal control over compliance and the results of that testing based on the requirements of OMB Circular A-133. Accordingly, this report is not suitable for any other purpose. Report on Schedule of Expenditures of Federal Awards Required by OMB Circular A-133 We have audited the financial statements of the governmental activities and the general fund of the Commission a as of and for the year ended June 30, 2013, and the related notes to the financial statements, which collectively comprise the Commission’s basic financial statements. Our report included an emphasis-of-matter regarding the Commission’s adoption of Governmental Accounting Standards Board (GASB) Statement No. 63, Financial Reporting of Deferred Outflows of Resources, Deferred Inflows of Resources, and Net Position, effective July 1, 2012. We issued our report thereon dated September 27, 2013, which contained unmodified opinions on those financial statements. Our audit was conducted for the purpose of forming our opinions on the financial statements that collectively comprise the basic financial statements. The accompanying schedule of expenditures of federal awards is presented for the purposes of additional analysis as required by OMB Circular A-133, and is not a required part of the financial statements. Such information is the responsibility of management and was derived from and relates directly to the underlying accounting and other records used to prepare the basic financial statements. The information has been subjected to the auditing procedures applied in the audit of the financial statements and certain additional procedures, including comparing and reconciling such information directly to the underlying accounting and other records used to prepare the financial statements or to the basic financial statements themselves, and other additional procedures in accordance with auditing standards generally accepted in the United States of America. In our opinion, the schedule of expenditures of federal awards is fairly stated in all material respects in relation to the basic financial statements as a whole. Laguna Hills, California September 27, 2013

CHILDREN AND FAMILIES COMMISSION OF ORANGE COUNTY SCHEDULE OF EXPENDITURES OF FEDERAL AWARDS FOR THE YEAR ENDED JUNE 30, 2013
See accompanying notes to Schedule of Expenditures of Federal Awards.
5
Federal Pass-ThroughCFDA Entity Identifying Federal
Federal Grantor/Program Title Number Number Expenditures
Corporation for National and Community Services:Volunteers in Service to America (VISTA) [1] 94.013 06VSPCA032 371,535$
U.S. Department of Health and Human Services:NIH Recovery Act Research Support - ARRA
Passed through from:The University of California, Irvine 93.701 2010-2490 277,364
Medical Assistance ProgramPassed through from:
County of Orange Medi-Cal Administrative Activities 93.778 03-75080 143,954 Subtotal - U.S Department of Health and Human Services 421,318
Total Expenditures of Federal Awards 792,853$
[1] Denotes a major Federal Financial Assistance Program
CHILDREN AND FAMILIES COMMISSION OF ORANGE COUNTY NOTES TO SCHEDULE OF EXPENDITURES OF FEDERAL AWARDS FOR THE YEAR ENDED JUNE 30, 2013
6
NOTE #1 – SUMMARY OF SIGNIFICANT ACCOUNTING POLICIES A. General
The accompanying Schedule of Expenditures of Federal Awards presents the activity of all federal award programs of the Children and Families Commission of Orange County (Commission). The Commission's reporting entity is defined in Note #1 of the Commission's basic financial statements. All federal awards received directly from federal agencies as well as federal awards passed through from other government agencies are included on the Schedule of Expenditures of Federal Awards.
B. Basis of Accounting
The accompanying Schedule of Expenditures of Federal Awards is presented using the modified accrual basis of accounting, which is described in Note #1 of the Commission's Financial Statements.
C. Medi-Cal Administrative Activities
The Schedule of Expenditures of Federal Awards includes expenditures incurred for Medi-Cal Administrative Activities (CFDA No. 93.778) in the fiscal year 2011-2012, which were approved for reimbursement by the grantor agency in the fiscal year 2012-2013.
D. Relationship to Basic Financial Statements
Federal awards revenues are generally reported within the Commission's financial statements under the financial statement caption "Federal Operating Grants" for the Governmental Fund.
E. Relationship to Federal Financial Reports
Amounts reported in the accompanying Schedule of Expenditures to Federal Awards agree with the amounts reported in the related federal financial reports. However, certain federal financial reports are filed based on cash expenditures. As such, certain timing differences may exist in the recognition of revenues and expenditures between the Schedule of Expenditures of Federal Awards and the federal financial reports.

CHILDREN AND FAMILIES COMMISSION OF ORANGE COUNTY SCHEDULE OF FINDINGS AND QUESTIONED COSTS FOR THE YEAR ENDED JUNE 30, 2013 I. SUMMARY OF AUDITORS’ RESULTS
7
FINANCIAL STATEMENTSUnmodified
NoNone reported
No
FEDERAL AWARDS
NoNone reported
Unmodified
No
CFDA Number(s) Name of Federal Program or Cluster94.013 Volunteers in Service to America (VISTA)
300,000$ Auditee qualified as low-risk auditee? Yes
Material weaknesses identified?
Type of auditors' report issued:Internal control over financial reporting:
Material weaknesses identified?
Internal control over major programs:
Significant deficiencies identified not considered to be material weaknesses?Noncompliance material to financial statements noted?
Type of auditors' report issued on compliance for major programs:
Significant deficiencies identified not considered to be material weaknesses?
Any audit findings disclosed that are required to be reported in accordance with Circular A-133, Section .510(a)
Identification of major programs:
Dollar threshold used to distinguish between Type A and Type B programs:

CHILDREN AND FAMILIES COMMISSION OF ORANGE COUNTY SCHEDULE OF FINDINGS AND QUESTIONED COSTS FOR THE YEAR ENDED JUNE 30, 2013 II. FINANCIAL STATEMENT FINDINGS
8
None noted.

CHILDREN AND FAMILIES COMMISSION OF ORANGE COUNTY SCHEDULE OF FINDINGS AND QUESTIONED COSTS FOR THE YEAR ENDED JUNE 30, 2013 III. FEDERAL AWARD FINDINGS AND QUESTIONED COSTS
9
None noted.

CHILDREN AND FAMILIES COMMISSION OF ORANGE COUNTY SCHEDULE OF PRIOR YEAR AUDIT FINDINGS AND RECOMMENDATIONS FOR THE YEAR ENDED JUNE 30, 2013
10
None noted.

Commissioners Executive Director
Agenda Item No. 7 October 2, 2013 Meeting
DATE: September 23, 2013 TO: Children and Families Commission of Orange County
FROM: Christina Altmayer, Executive Director SUBJECT: Public Hearing: FY 2012-13 Annual Report and Financial Audit and
Amendments to FY 2013-14 Operating Budget and Strategic Plan SUMMARY: The California Children & Families Act of 1998 (Health & Safety Code Sections 130140 & 130150) requires that each county commission complete an annual audit and program report of the preceding fiscal year, conduct a public hearing on the audit and program reports, and submit both to the First 5 California Commission on or before November 1 of each year. Also, the audit report must be filed with the State Controller’s Office. The annual financial audit and the program reports have been completed and are submitted to the Commission for public hearing. This report provides the required components to conduct the public hearing related to:
• Annual program report, including supplemental report • Required certifications • Comprehensive Annual Financial Report and Single Audit Report
In addition, this report includes recommended amendments to FY 2012/13 Approved Operating Budget. Annual Program Report including Supplemental Report State law requires that each county commission prepare an annual program report to address: (1) how funds were spent; (2) the progress toward and achievement of program goals and objectives; and (3) the measurement of outcomes. This report is submitted to First 5 California for the consolidated annual report to the Governor and the Legislature. The full report is on file with the Clerk of the Commission. Attachment 1 includes a summary of the full report. In addition to the Annual Program Report that is developed consistent with First 5 California Guidelines, a Supplemental Report has been developed that presents the Annual Program Report data by the Commission’s goal area and funded including child demographic data. This past year, the First 5 California Association’s Evaluation Committee worked with the state and local Commissions to revise the Annual Report Glossary. The purpose of this effort was to: • Promote greater consistency in the data collected • Focus data reporting in the areas where First 5 counties are having significant statewide
impact • Support county commissions who may not have reviewed the Glossary in recent years.
17320 Redhill Avenue, Suite 200 Michael L. Riley, Ph.D., Chair Sandra Barry Janet Nguyen Christina Altmayer Irvine, CA 92614 Kimberly Chavalas Cripe, Vice Chair Hugh Hewitt Sandra Pierce Tel: 714-834-5310 Katherine Ahn, D.D.S. Maria E. Minon, M.D. Mark Refowitz Fax: 949-474-2243
Although the use of the new Glossary for FY 2012/13 reporting is voluntary, Orange County has implemented the new glossary for this reporting period. Changes include several child health result areas now bundled into a broader Maternal Child Health category and all comprehensive screening and assessment is now merged into one result area. The Annual Report format has been updated this year to once again include a brief County Summary highlighting priorities for each local Commission. This year, Orange County’s Summary includes a focus of the transitions occurring in the child health enrollment and coverage and the Commission’s investments in Autism and early developmental services, oral health and vision services. . Highlights from the Orange County FY 2012/13 Annual Program Report include:
• 171,426 children ages 0-5 received Commission-funded services • 170,221 family members of children ages 0-5 received Commission-funded services • 1,222,195 services were provided to children • 786,746 services were provided to family members
During the FY 2011/12 reporting period, there had been a nine-percent reduction in the number of children served due to the AB99 program funding reductions. Due to factors such as the reinvestment of fiscal leveraging reimbursements into current programs, and other one-time funding, there has been an increase in the number of children and family members served during FY 2012/13. During this reporting period, there was a 26 percent increase in the number of children 0 – 5 served, an increase of eight-percent in the number of family members served and an over 10 percent decrease in the number of providers served. Required Certifications Each year, First 5 California requests each county commission’s Executive Director to certify compliance with Health and Safety Code Section 130140 (Fiscal Memo 10-01) prior to July 1 in order to remain eligible to receive Proposition 10 tobacco tax revenues. This certification was submitted to the First 5 California in May 2013 prior to the prescribed deadline. First 5 California also requests that each county commission certify that Commission funds have been used only to supplement, not supplant, existing program funding for grantees. Commission authorization is requested for the Executive Director to provide the required statement that the Children and Families Commission of Orange County did not use its funding to supplant existing program funds. Comprehensive Annual Financial Report (CAFR) Vavrinek, Trine, Day & Co., LLP (Vavrinek) performed an independent annual audit of Commission financial statements for FY 2012/13 that included the expanded audit compliance requirements mandated by AB109/SB35. The auditors conducted their audit work in accordance with all standards applicable to financial audits, including generally accepted auditing standards, standards and procedures issued by the California State Controller’s Office, and Government Auditing Standards issued by the Comptroller General of the United States. The Comprehensive Annual Financial Report for the Year Ended June 30, 2013 is included as Attachment 1. Single Audit Report Vavrinek completed a Single Audit Report for FY 2012/13 as required by the Single Audit Act Amendments of 1996, Office of Management and Budget (OMB) Circular A-133, “Audits of

States, Local Governments and Non-Profit Organizations,” the OMB Circular A-133 Compliance Supplement and Government Auditing Standards for entities that have expended $500,000 or more in federal awards. The Single Audit Report for the Year Ended June 30, 2013 is included as Attachment 2. Results: The independent auditors found no instances of noncompliance with state or federal laws and regulations concerning financial matters. The auditors found no significant deficiencies, material weaknesses involving internal controls over financial reporting, or audit adjustments, and rendered unmodified (formerly known as an unqualified opinion) on both the Commission’s Comprehensive Annual Financial Report and Single Audit Report for Year End June 30, 2013. Vavrinek states these same results in the following reports:
a. Independent Auditor’s Report: “In our opinion, the financial statements referred to above present fairly, in all material respects, the respective financial position of the governmental activities and general fund of the Commission, as of June 30, 2013, and the respective changes in financial position thereof and budgetary comparison for the General Fund for the year then ended in accordance with accounting principles generally accepted in the United States of America.”
b. Auditors’ Report on State Compliance: “In our opinion, the Commission compiled, in all
material respects, with the compliance requirements referred to above that are applicable to the statutory requirements listed above for the year ended June 30, 2013.
c. Auditors’ Single Audit Report: “In our opinion, the Commission complied, in all material respects, with the types of compliance requirements referred to above that could have a direct and material effect on each of its major federal programs for the year ended June 30, 2013.”
The Commission’s Comprehensive Annual Financial Report was prepared in compliance with the most up to date guidelines issued by the State Controller. Amendments to FY 2013/14 Approved Operating Budget The FY 2013/14 Budget was approved by the Commission in March 2013. Staff analyzed current program allocations and encumbrances and has developed a proposed Amended Annual Operating Budget for FY 2013/14 to include both appropriations made by Commission action after the initial budget adoption in March and previously encumbered contracts recommended to be carried forward into the current year:
• Revenue – Total revenue has been increased by $4.5 million in the Amended Budget. Actual Proposition 10 revenue for FY 2012/13 was $27 million or $900,000 below what was previously forecasted. The original FY 2013/14 Budget assumed a higher year-end actual for FY 2012/13 and projected a decline from that higher base estimated at $26.9. To align with the lower than expected revenue receipts in the FY 2012/13 year, staff is recommending budgeted revenue be reduced by $681,116 to $26.6 million to reflect a three-percent decrease from FY 2012/13 actual receipts. The latest California Department

of Finance release projected a 2.61 percent decline, but assuming a three-percent decline for a more conservative revenue outlook is consistent with past Commission practice. Also included in the Amended Budget are increases in revenues for federal and state First 5 grants awards. American Recovery and Reinvestment Act (ARRA) Health Research grant revenue was reduced by $38,056 for the remaining federal award amount available through September 22, 2013 to close the grant. The federal AmeriCorps/VISTA (Volunteers in Service to America) program was increased by $654,000 to include the most recent federal award along with reimbursements the Commission will receive from other participating counties. This is consistent with the action taken by the Commission in September to renew the AmeriCorps/VISTA Program. First 5 CARES Plus Round 2 and Child Signature Program RFA #3 funds totaling $4.6 million awarded to the Commission have also been added to the FY 2013/14 budget.
• Program Funding – Program funding has been increased from $30.1 to $37 million to
account for greater than anticipated carryover funding and program expenses offset by outside revenue sources. This is substantially due to the increase of $5.35 million in expenses associated with federal and state grants awards, specifically CARES Plus, Child Signature Program, and AmeriCorps/VISTA. Almost $700,000 of the carryover was transferred to the Community Clinics budget line item for Clinic Demonstration and Clinic Catalytic funding not spent in the prior year. Finally, $250,000 originally budgeted in FY 2012/13 is now included as carryover in FY 2013/14 for the recently issued Technology Capacity Building Request for Application (RFA).
• Administrative Expenses – Health and Safety Code Section 130140 requires the
Commission to adopt a limit on the percentage of the Commission’s operating budget that may be spent on administrative functions. Administrative costs and functions are defined by State First 5 Commission guidelines pursuant to Chapter 284, Statutes of 2005 (AB109). The Commission’s Budget is prepared in accordance with these guidelines and the adopted policy of a 10 percent limitation on administrative functions related to the operational budget. Commission staff has continued to significantly reduce administrative expenses. The FY 2013/14 amended budget of $2.54 million for administration includes $27,000 in carryover of prior-year budgeted not spent before June 30, 2013. Administration costs under the FY 2013/14 amended budget are now 6.94 percent of the total operating budget due to increase in program funding carryover and the new grant awards mentioned above. The initial adopted budget had administrative costs at 8.38 percent of the total operating budget.
Year-end Results and Long-Term Financial Plan The Commission will consider the updated Long Term Financial Plan at the November meeting. It will include updated year-end financial results and revised revenue forecasts for the planning horizon. At the request of the Commission Chair, an ad-hoc Administrative meeting will be held in October to address updated revenue projections and future-year program funding scenarios. The Long-Term Financial Plan will be updated after the meeting and presented the Commission at the November meeting.

Strategic Plan Revisions The core elements of the Commission’s Strategic Plan were reviewed to assess alignment with priorities and strategies articulated by the Commission at their June Planning Meeting. The summary of the proposed changes were presented at the September meeting and focused on using consistent terminology in all elements, aligning the language with current terms, and concisely stating the Commission’s priorities. Also presented in September were proposed Guiding Principles and Organizational Values that were developed to underscore behavioral expectations for all staff in interactions with one another, Commissioners, and external partners. Commission approval of the final proposed language as written in Attachment 6 is recommended. The required annual comprehensive review of the Strategic Plan is scheduled for April 2014. STRATEGIC PLAN AND FISCAL SUMMARY: The reports and recommended actions presented in this staff report have been reviewed in relation to the Commission’s Strategic Plan and are consistent with applicable goals. PRIOR COMMISSION ACTIONS: • April 2013 – Conducted public hearing for annual review of the Strategic Plan • April 2013 – Conducted public hearing and approved FY 2012/13 Business Plan • March 2013 – Conducted public hearing on state commission’s FY 2011/12 Annual Report RECOMMENDED ACTIONS: 1. Conduct Public Hearing. 2. Receive the Annual Program Report including Supplemental Report for FY 2012/13
(Attachment 1) and authorize the Executive Director to submit to the First 5 California Commission.
3. Authorize the Executive Director to execute required certifications to the First 5 California Commission and to incorporate non-substantive revisions to the Annual Program Report including Supplemental Report for FY 2012/13 prior to submittal.
4. Receive the Comprehensive Annual Financial Report for Year Ended June 30, 2013, including State Compliance Report, (Attachment 2) and authorize the Executive Director to submit the Annual Financial Audit Reports, along with any supporting materials, to the First 5 California Commission and to the State Controller’s Office.
5. Receive the Single Audit Report for the Year Ended June 30, 2013 (Attachment 3) and authorize the Executive Director to submit the Single Audit Report with the audit reporting package to the Federal Audit Clearinghouse.
6. Approve FY 2013-14 Amendments to FY 2013/14 Operating Budget (Attachment 4) and adopt Resolution (Attachment 5) approving the Amended Annual Operating Budget for FY 2013-14.
7. Approve final proposed revisions to the Commission’s Strategic Plan (Attachment 6) and adopt Resolution (Attachment 7) approving the revisions to the Strategic Plan.
8. Provide policy direction to staff.
ATTACHMENTS: 1. Annual Program Report including Supplemental Report, FY 2012-13 2. Comprehensive Annual Financial Report for Year Ended June 30, 2013 3. Single Audit Report for the Year Ended June 30, 2013 4. FY 2013-14 Amended Budget 5. Resolution approving FY 2013-14 Amended Budget 6. Proposed revisions to the Strategic Plan 7. Resolution approving final proposed revisions to Strategic Plan Contacts: Michael Garcell – Annual Financial Audit and Budget Amendments
Alyce Mastrianni – Annual Program Report

October 2, 2013 Meeting
Agenda Item No. 7
Attachment 1

AR1/AR2 Summary Report
for Fiscal Year 2012-2013 (July 1, 2012 - June 30, 2013)
Wednesday, September 25, 2013County: Orange
Improved Child Development Early Education Provider Program In Progress $243,304 0 1,090
Improved Child Development Other Child Development Services In Progress $146,320 0 449
Improved Child Development State School Readiness Programs & Local Match In Progress $0 0 0
Improved Systems of Care Community Strengthening Efforts In Progress $1,190,521
Improved Child Development Preschool for 3 and 4 Year Olds In Progress $25,000 0 0
Improved Family Functioning Other Family Functioning Support Services In Progress $94,602 0 0
Improved Systems of Care Service Outreach, Planning, Support and Management In Progress $548,351
Improved Systems of Care Provider Capacity Building, Training and Support In Progress $805,231
Improved Child Health Other Health Services In Progress $746,601 40 482
Improved Child Health Targeted Intensive Intervention for Identified Special Needs In Progress $4,274,352 0 105
Improved Child Health Safety Education and Intentional and Unintentional Injury Prevention
In Progress $22,342 0 61
Improved Family Functioning Family Literacy Programs In Progress $914,610 59,338 29,417
Improved Family Functioning Targeted Intensive Parent Support Services In Progress $3,586,580 1,718 2,049
Improved Family Functioning Distribution of Kit for New Parents In Progress $20,000 0 0
Improved Child Health Comprehensive Screening and Assessments In Progress $3,220,894 21,788 44,947
Improved Family Functioning Community Resource and Referral In Progress $199,920 0 16,650
Improved Child Development Early Education Programs for Children (Other than School Readiness and Preschool for 3/4 year olds)
In Progress $4,313,741 30,105 29,526
Improved Child Health Oral Health In Progress $1,357,733 18,775 9,831
Improved Child Health Primary Care Services (Immunizations and/or Well Child Checkups)
In Progress $3,122,348 20,272 21,978
Improved Child Health Home Visitation for Newborns In Progress $5,282,789 16,082 26,599
Improved Child Health Nutrition and Fitness In Progress $378,911 2,639 213
Improved Child Health Health Access In Progress $602,095 668 1,235
TOTAL $31,096,245 171,425 184,632
Result Area Service Status Total Dollars Spent Total Number of Children Served
Total Number of Parents/Other Family Members/Providers Served
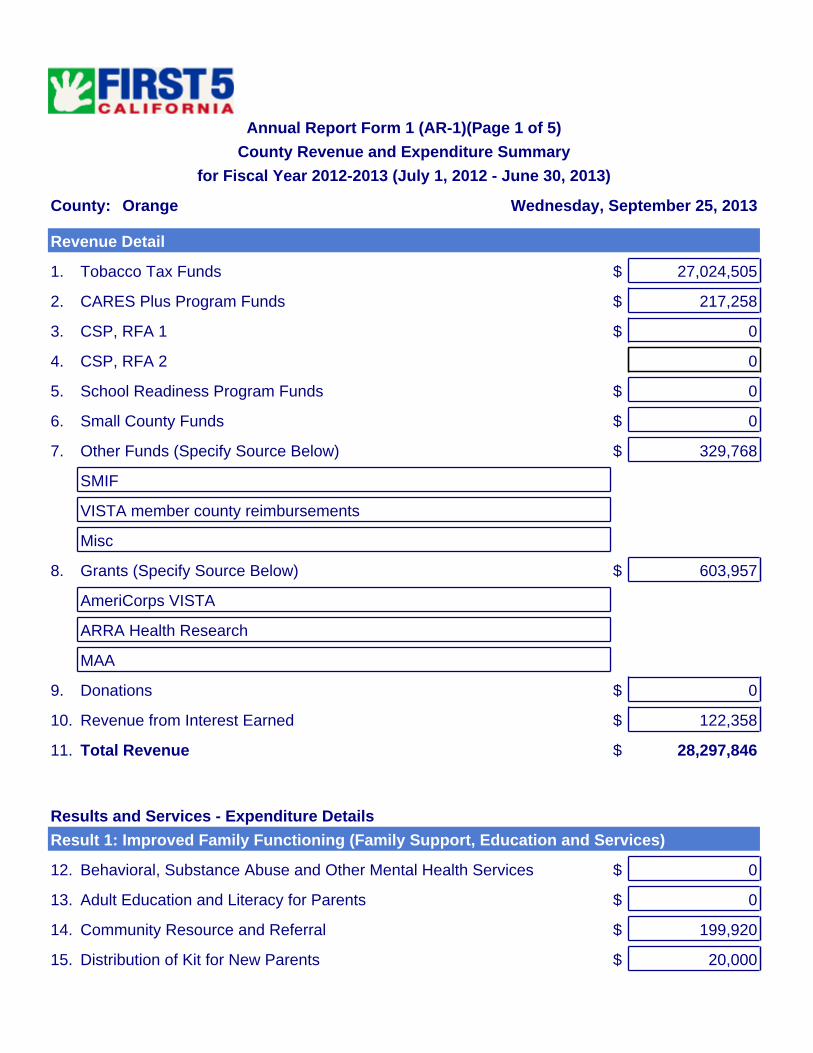
Annual Report Form 1 (AR-1)(Page 1 of 5)
County Revenue and Expenditure Summary
for Fiscal Year 2012-2013 (July 1, 2012 - June 30, 2013)
Wednesday, September 25, 2013County: Orange
13. Adult Education and Literacy for Parents $ 0
12. Behavioral, Substance Abuse and Other Mental Health Services $ 0
15. Distribution of Kit for New Parents $ 20,000
14. Community Resource and Referral $ 199,920
Results and Services - Expenditure Details
Result 1: Improved Family Functioning (Family Support, Education and Services)
8. Grants (Specify Source Below) $ 603,957
AmeriCorps VISTA
VISTA member county reimbursements
11. Total Revenue $ 28,297,846
Misc
9. Donations $ 0
10. Revenue from Interest Earned $ 122,358
ARRA Health Research
MAA
2. CARES Plus Program Funds $ 217,258
3. CSP, RFA 1 $ 0
1. Tobacco Tax Funds $ 27,024,505
4. CSP, RFA 2 0
7. Other Funds (Specify Source Below) $ 329,768
SMIF
5. School Readiness Program Funds $ 0
6. Small County Funds $ 0
Revenue Detail
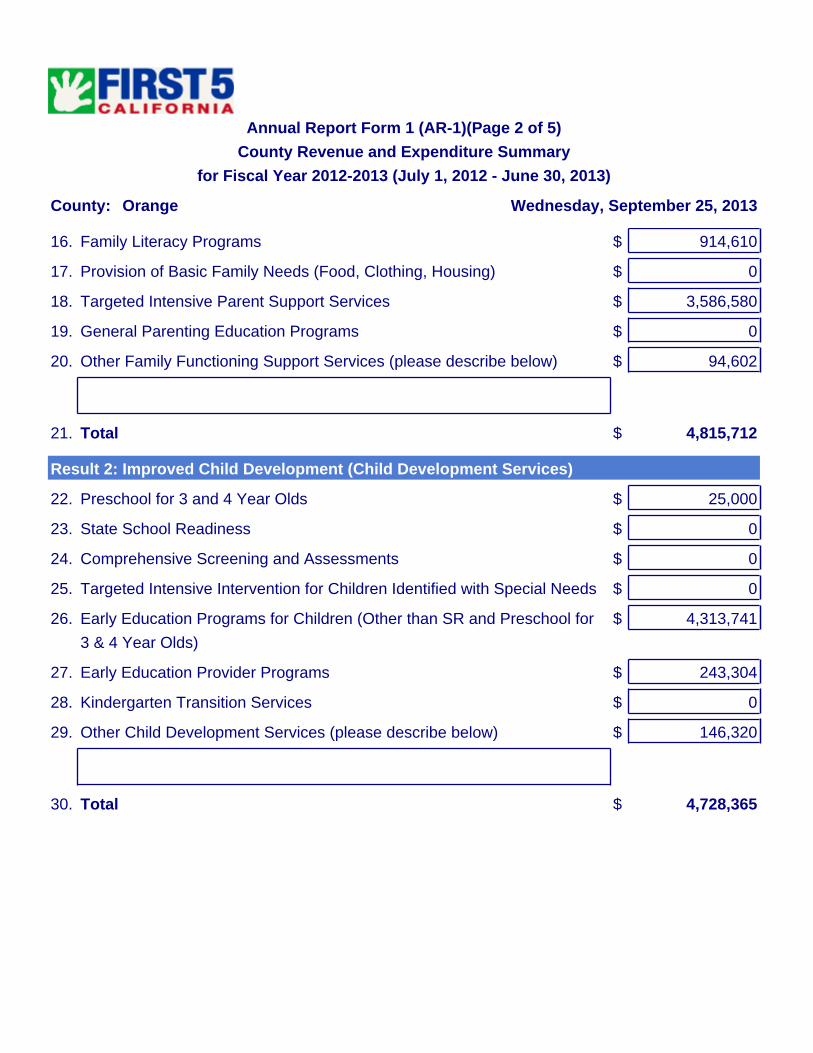
Annual Report Form 1 (AR-1)(Page 2 of 5)
County Revenue and Expenditure Summary
for Fiscal Year 2012-2013 (July 1, 2012 - June 30, 2013)
Wednesday, September 25, 2013County: Orange
20. Other Family Functioning Support Services (please describe below) $ 94,602
21. Total $ 4,815,712
19. General Parenting Education Programs $ 0
17. Provision of Basic Family Needs (Food, Clothing, Housing) $ 0
16. Family Literacy Programs $ 914,610
18. Targeted Intensive Parent Support Services $ 3,586,580
28. Kindergarten Transition Services $ 0
27. Early Education Provider Programs $ 243,304
3 & 4 Year Olds)
29. Other Child Development Services (please describe below) $ 146,320
30. Total $ 4,728,365
23. State School Readiness $ 0
22. Preschool for 3 and 4 Year Olds $ 25,000
26. Early Education Programs for Children (Other than SR and Preschool for $ 4,313,741
25. Targeted Intensive Intervention for Children Identified with Special Needs $ 0
24. Comprehensive Screening and Assessments $ 0
Result 2: Improved Child Development (Child Development Services)
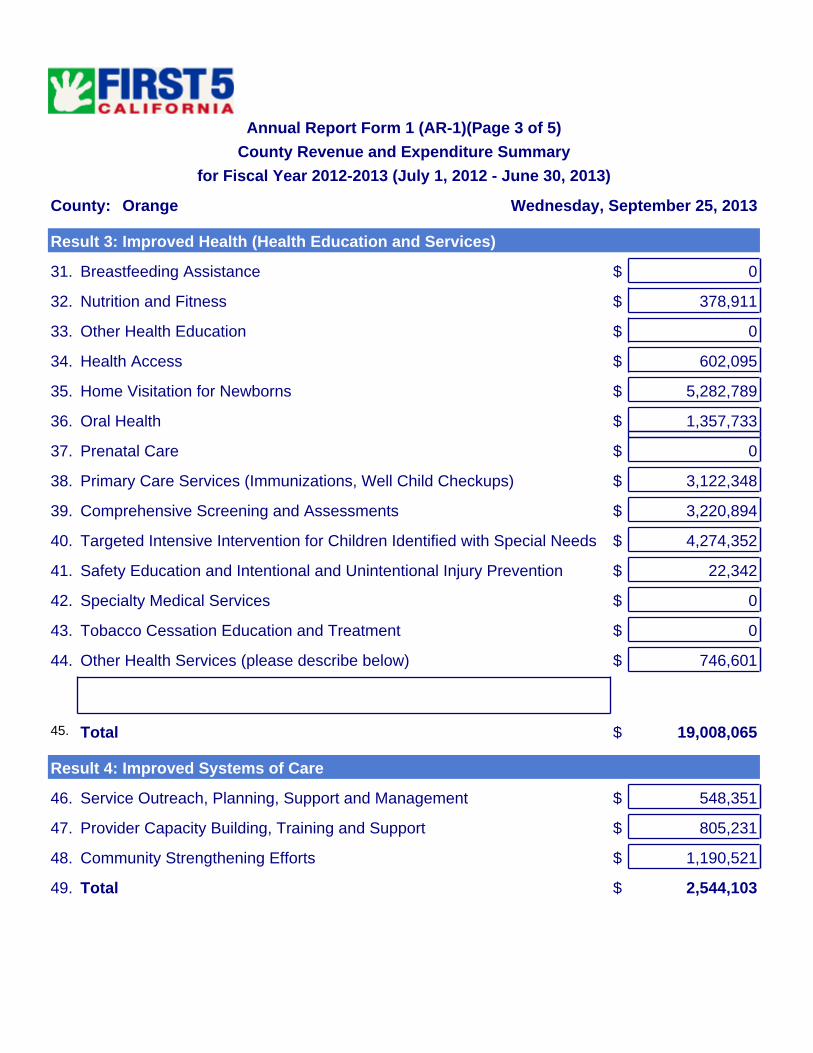
Annual Report Form 1 (AR-1)(Page 3 of 5)
County Revenue and Expenditure Summary
for Fiscal Year 2012-2013 (July 1, 2012 - June 30, 2013)
Wednesday, September 25, 2013County: Orange
49. Total $ 2,544,103
48. Community Strengthening Efforts $ 1,190,521
47. Provider Capacity Building, Training and Support $ 805,231
46. Service Outreach, Planning, Support and Management $ 548,351
Result 4: Improved Systems of Care
40. Targeted Intensive Intervention for Children Identified with Special Needs $ 4,274,352
41. Safety Education and Intentional and Unintentional Injury Prevention $ 22,342
45. Total $ 19,008,065
39. Comprehensive Screening and Assessments $ 3,220,894
44. Other Health Services (please describe below) $ 746,601
42. Specialty Medical Services $ 0
43. Tobacco Cessation Education and Treatment $ 0
32. Nutrition and Fitness $ 378,911
33. Other Health Education $ 0
38. Primary Care Services (Immunizations, Well Child Checkups) $ 3,122,348
31. Breastfeeding Assistance $ 0
36. Oral Health $ 1,357,733
37. Prenatal Care $ 0
34. Health Access $ 602,095
35. Home Visitation for Newborns $ 5,282,789
Result 3: Improved Health (Health Education and Services)

Annual Report Form 1 (AR-1)(Page 4 of 5)
County Revenue and Expenditure Summary
for Fiscal Year 2012-2013 (July 1, 2012 - June 30, 2013)
Wednesday, September 25, 2013County: Orange
52. FY 2012-2013 Evaluation Expenditures $ 894,496
54. Excess (Deficiency) Of Revenues Over (Under) Expenses $ -6,752,445
53. Total Expenditures $ 35,050,291
50. FY 2012-2013 Program Expenditures $ 31,096,245
51. FY 2012-2013 Administrative Expenditures $ 3,059,550
Expenditure Detail
57. Total Other Financing Sources $ 0
56. Other: Specify Source Below $ 0
55. Sale(s) of Capital Assets $ 0
Other Financing Sources
60. Net Change In Fund Balance $ -6,752,445
59. Fund Balance - Ending, June 30, -2013 $ 71,964,399
58. Fund Balance - Beginning, July 1, 2012 $ 78,716,844
Net Change in Fund Balance
64. Assigned $ 21,350,266
66. Total Fund Balance $ 71,964,399
65. Unassigned $ 0
61. Non Spendable $ 243,435
63. Committed $ 50,370,698
62. Restricted $ 0
FY 2012-2013Fund Balance
Annual Report Form 1 (AR-1)(Page 5 of 5)
County Revenue and Expenditure Summary
for Fiscal Year 2012-2013 (July 1, 2012 - June 30, 2013)
Wednesday, September 25, 2013County: Orange
Phone
Name
I hereby certify the information submitted herein is accurate and complete to the best of my knowledge. I further certify that I have the authority to submit this information. I make these certifications via my name, phone number and e-mail address entered below. I acknowledge that the data in this submission may be subject to verification at a later date.
Expenditure Notes: Please use this space to document any issues with the information provided on this spreadsheet and to explain any significant variances from prior year's expenses that is not related to revenue growth. Please identify if any line includes significant capital expenditures. If yes, identify the line and the capital amount included.

Supplement to Orange County’s Annual Report to the State FY 12/13
1
Supplement to Orange County’s Annual Report to the State July 2012 – June 2013
During Fiscal Year 2012‐2013 (FY 12/13), the Children and Families Commission of Orange County (Commission) funded 92 organizations to implement 161 individual programs serving children, families, and providers. This report provides details on the numbers of children and family members served by Commission‐funded programs and the services that were provided to them. The information is provided first for the Commission as a whole, and then by Commission goal area and funding subcategory. For each funding subcategory, the following data are provided along with the data source(s):
Data Data Source(s) Number of children ages 0‐5, family members, and service providers receiving services from Commission‐funded programs
• Grants and Evaluation Management System (GEMS)
• Group/Aggregate Services Module Number of services provided to children, family members, and service providers Number of children with client level data • GEMS and Bridges Connect System data
for Children 0‐5 Client Level Data on children receiving intensive services and whose parents consent to data collection
Age breakouts of children with client level data Ethnicity of children with client level data Primary Language of children with client level data Poverty level of children with client level data Numbers of different types of services provided to children, family members, and service providers
• GEMS Group/Aggregate Services Module
Key Service Outcomes • Service Outcome Questionnaires (SOQs) in GEMS and Bridges Connect
The Table of Contents on the following page contains a list of the Commission goal areas and funding subcategories presented in this report with the page numbers where their data can be found. A list of acronyms used throughout this report is also provided on the following page.
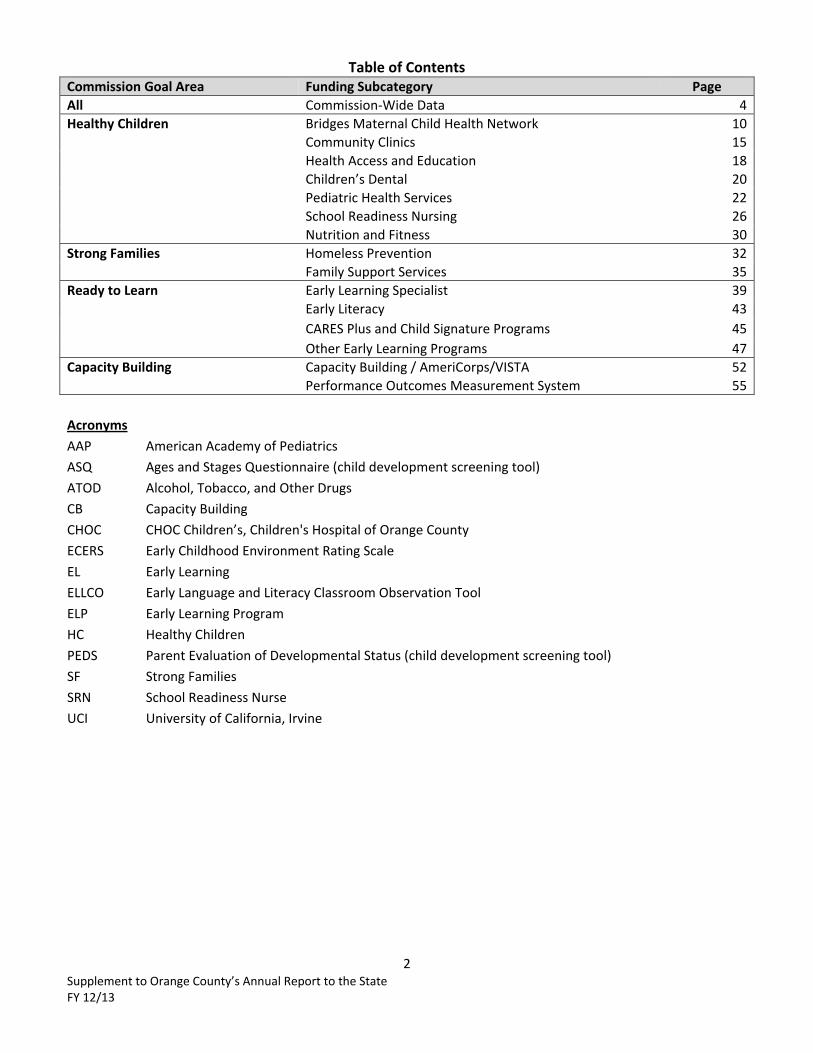
Supplement to Orange County’s Annual Report to the State FY 12/13
2
Table of Contents Commission Goal Area Funding Subcategory Page All Commission‐Wide Data 4Healthy Children Bridges Maternal Child Health Network 10
Community Clinics 15Health Access and Education 18Children’s Dental 20Pediatric Health Services 22School Readiness Nursing 26Nutrition and Fitness 30
Strong Families Homeless Prevention 32Family Support Services 35
Ready to Learn Early Learning Specialist 39Early Literacy 43CARES Plus and Child Signature Programs 45Other Early Learning Programs 47
Capacity Building Capacity Building / AmeriCorps/VISTA 52Performance Outcomes Measurement System 55
Acronyms
AAP American Academy of Pediatrics ASQ Ages and Stages Questionnaire (child development screening tool) ATOD Alcohol, Tobacco, and Other Drugs CB Capacity Building CHOC CHOC Children’s, Children's Hospital of Orange County ECERS Early Childhood Environment Rating Scale EL Early Learning ELLCO Early Language and Literacy Classroom Observation Tool ELP Early Learning Program HC Healthy Children PEDS Parent Evaluation of Developmental Status (child development screening tool) SF Strong Families SRN School Readiness Nurse UCI University of California, Irvine

Supplement to Orange County’s Annual Report to the State FY 12/13
3
The Children and Families Commission of Orange County (Commission) California voters passed Proposition 10, the California Children and Families First Act (The Act) in 1998. The Act provided for a 50 cent per pack excise tax on cigarettes. The monies collected are restricted to funding parent education, health and early care programs that promote early childhood development from the prenatal stage through age five. The Act enabled the Board of Supervisors in each county to establish its own Commission. On December 15, 1998, the Orange County Board of Supervisors adopted County Ordinance No. 98‐18, creating the Children and Families Commission of Orange County. In February 2000, the Children and Families Commission of Orange County adopted its first Strategic Plan to become eligible for Proposition 10 tobacco tax revenue allocations. The Strategic Plan outlined the Commission’s goals, outcomes, indicators and objectives, and guides its funding decisions. In May 2006, the Commission adopted an update to the Strategic Plan, highlighting linkages between the Strategic Plan and other planning efforts and expanded program‐specific measures to better reflect the diverse services the Commission funds. The Strategic Plan is updated annually in a public hearing. The Commission’s mission is to: Provide leadership, funding and support for programs that achieve the vision that all children are healthy and ready to succeed when they enter school. The Commission has identified four goals in its Strategic Plan:
1. Healthy Children: Ensure the overall physical, social, emotional and intellectual health of children during the prenatal period through age five.
2. Strong Families: Support and strengthen families in ways that promote good parenting for the optimal
development of young children. 3. Ready to Learn: Provide early care and education opportunities for young children to maximize their
potential to succeed in school. 4. Capacity Building: Ensure an effective delivery system for child and family services.
In FY 12/13, the Commission implemented a standardized set of funded services to address each of the Commission’s targeted outcomes and objectives. The “Services Provided by” tables in this report detail the services provided for each subcategory and include three columns: the first two columns list the Strategic Plan outcomes and services used by Commission‐funded programs and the third column lists the number of services accomplished. Under these revised reporting guidelines, providers were asked to report the number of new clients served, the number of repeat clients served, and the total number of services (numbers completed). Although progress has been made to standardize data collection across programs, there remain some inconsistencies in the methods providers use to count the number of clients and number of services. In most cases, only the number of new clients (i.e., Children 0‐5, Family Members, and Service Providers) is reported. When the number of services is listed, the service description in the second column of the service table specifies the service being reported. In FY 12/13, there were 171,426 new Children 0‐5, 170,221 new Family Member and 14,411 new Service Providers served by Commission‐Funded programs. The Children 0‐5 received over 1.2 million services, while their Family Members received almost 800,000 services (see Table 1). Almost 25,000 services were provided to Service Providers during FY 12/13. There was a 26% increase in the number of Children 0‐5 and 8% in the number of Family Members served from FY 11/12 to FY 12/13. During the same time, there was a 10% decrease in the
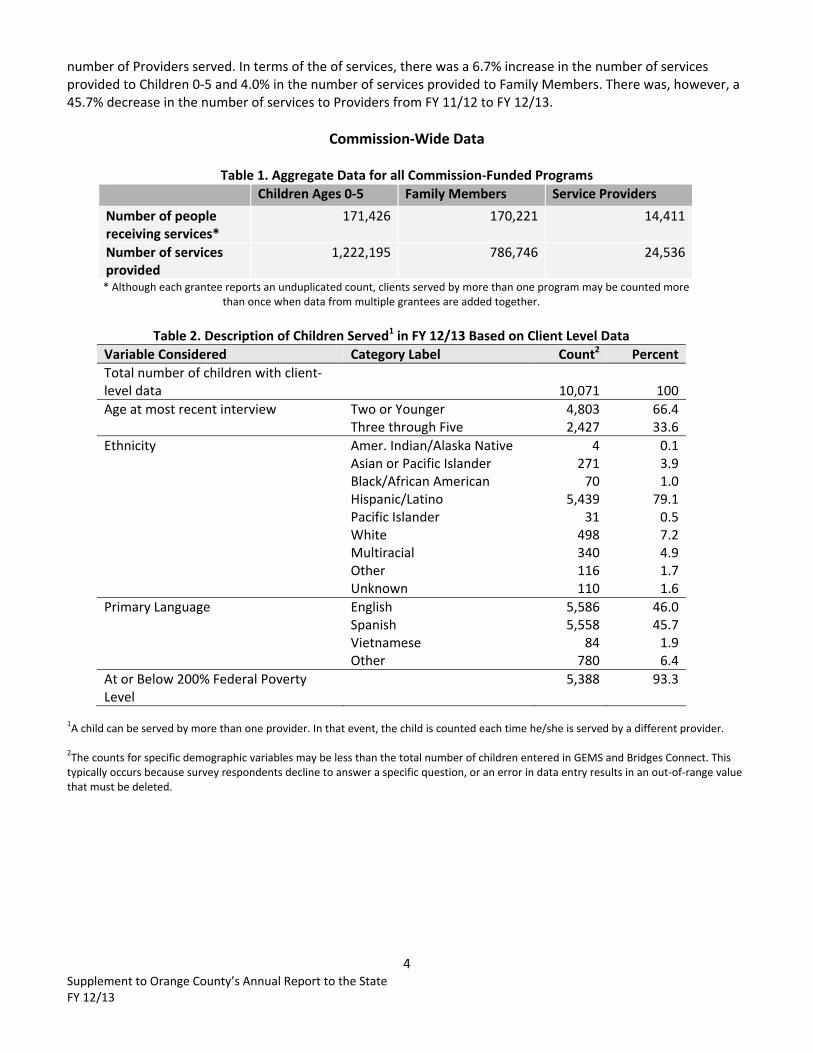
Supplement to Orange County’s Annual Report to the State FY 12/13
4
number of Providers served. In terms of the of services, there was a 6.7% increase in the number of services provided to Children 0‐5 and 4.0% in the number of services provided to Family Members. There was, however, a 45.7% decrease in the number of services to Providers from FY 11/12 to FY 12/13.
Commission‐Wide Data
Table 1. Aggregate Data for all Commission‐Funded Programs
Children Ages 0‐5 Family Members Service Providers Number of people receiving services*
171,426 170,221 14,411
Number of services provided
1,222,195 786,746 24,536
* Although each grantee reports an unduplicated count, clients served by more than one program may be counted more than once when data from multiple grantees are added together.
Table 2. Description of Children Served1 in FY 12/13 Based on Client Level Data
Variable Considered Category Label Count2 PercentTotal number of children with client‐level data
10,071 100
Age at most recent interview Two or Younger Three through Five
4,803 2,427
66.433.6
Ethnicity Amer. Indian/Alaska Native Asian or Pacific Islander
Black/African American Hispanic/Latino Pacific Islander White Multiracial Other Unknown
4 271 70
5,439 31
498 340 116 110
0.13.91.0
79.10.57.24.91.71.6
Primary Language English Spanish Vietnamese Other
5,586 5,558
84 780
46.045.71.96.4
At or Below 200% Federal Poverty Level
5,388 93.3
1A child can be served by more than one provider. In that event, the child is counted each time he/she is served by a different provider.
2The counts for specific demographic variables may be less than the total number of children entered in GEMS and Bridges Connect. This typically occurs because survey respondents decline to answer a specific question, or an error in data entry results in an out‐of‐range value that must be deleted.
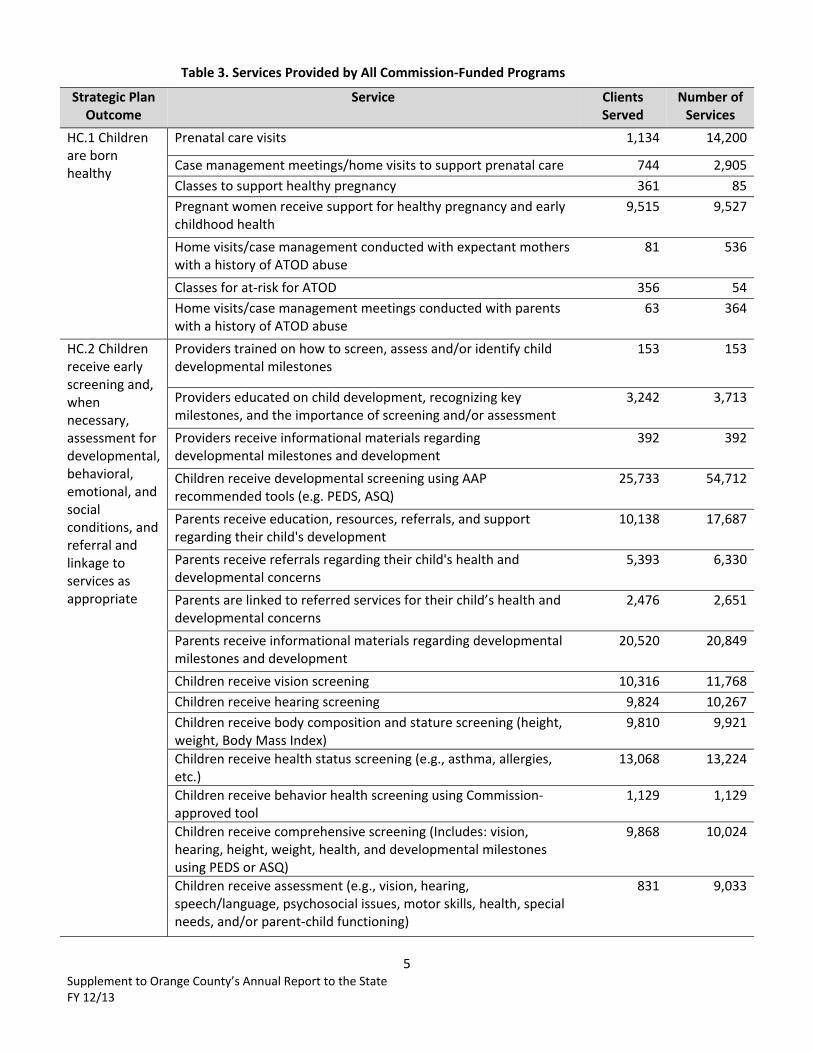
Supplement to Orange County’s Annual Report to the State FY 12/13
5
Table 3. Services Provided by All Commission‐Funded Programs
Strategic Plan Outcome
Service Clients Served
Number of Services
HC.1 Children are born healthy
Prenatal care visits 1,134 14,200
Case management meetings/home visits to support prenatal care 744 2,905Classes to support healthy pregnancy 361 85Pregnant women receive support for healthy pregnancy and early childhood health
9,515 9,527
Home visits/case management conducted with expectant mothers with a history of ATOD abuse
81 536
Classes for at‐risk for ATOD 356 54Home visits/case management meetings conducted with parents with a history of ATOD abuse
63 364
HC.2 Children receive early screening and, when necessary, assessment for developmental, behavioral, emotional, and social conditions, and referral and linkage to services as appropriate
Providers trained on how to screen, assess and/or identify child developmental milestones
153 153
Providers educated on child development, recognizing key milestones, and the importance of screening and/or assessment
3,242 3,713
Providers receive informational materials regarding developmental milestones and development
392 392
Children receive developmental screening using AAP recommended tools (e.g. PEDS, ASQ)
25,733 54,712
Parents receive education, resources, referrals, and support regarding their child's development
10,138 17,687
Parents receive referrals regarding their child's health and developmental concerns
5,393 6,330
Parents are linked to referred services for their child’s health and developmental concerns
2,476 2,651
Parents receive informational materials regarding developmental milestones and development
20,520 20,849
Children receive vision screening 10,316 11,768Children receive hearing screening 9,824 10,267Children receive body composition and stature screening (height, weight, Body Mass Index)
9,810 9,921
Children receive health status screening (e.g., asthma, allergies, etc.)
13,068 13,224
Children receive behavior health screening using Commission‐approved tool
1,129 1,129
Children receive comprehensive screening (Includes: vision, hearing, height, weight, health, and developmental milestones using PEDS or ASQ)
9,868 10,024
Children receive assessment (e.g., vision, hearing, speech/language, psychosocial issues, motor skills, health, special needs, and/or parent‐child functioning)
831 9,033
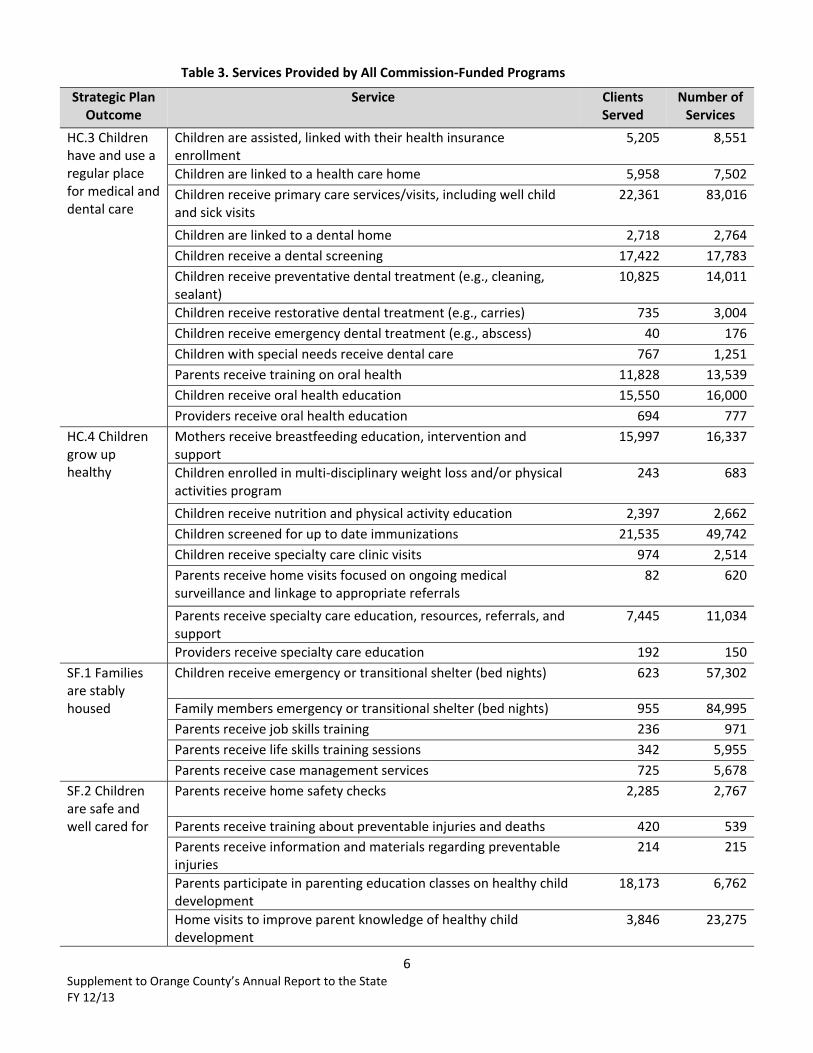
Supplement to Orange County’s Annual Report to the State FY 12/13
6
Table 3. Services Provided by All Commission‐Funded Programs
Strategic Plan Outcome
Service Clients Served
Number of Services
HC.3 Children have and use a regular place for medical and dental care
Children are assisted, linked with their health insurance enrollment
5,205 8,551
Children are linked to a health care home 5,958 7,502Children receive primary care services/visits, including well child and sick visits
22,361 83,016
Children are linked to a dental home 2,718 2,764Children receive a dental screening 17,422 17,783Children receive preventative dental treatment (e.g., cleaning, sealant)
10,825 14,011
Children receive restorative dental treatment (e.g., carries) 735 3,004Children receive emergency dental treatment (e.g., abscess) 40 176Children with special needs receive dental care 767 1,251Parents receive training on oral health 11,828 13,539Children receive oral health education 15,550 16,000Providers receive oral health education 694 777
HC.4 Children grow up healthy
Mothers receive breastfeeding education, intervention and support
15,997 16,337
Children enrolled in multi‐disciplinary weight loss and/or physical activities program
243 683
Children receive nutrition and physical activity education 2,397 2,662Children screened for up to date immunizations 21,535 49,742Children receive specialty care clinic visits 974 2,514Parents receive home visits focused on ongoing medical surveillance and linkage to appropriate referrals
82 620
Parents receive specialty care education, resources, referrals, and support
7,445 11,034
Providers receive specialty care education 192 150SF.1 Families are stably housed
Children receive emergency or transitional shelter (bed nights) 623 57,302
Family members emergency or transitional shelter (bed nights) 955 84,995Parents receive job skills training 236 971Parents receive life skills training sessions 342 5,955Parents receive case management services 725 5,678
SF.2 Children are safe and well cared for
Parents receive home safety checks 2,285 2,767
Parents receive training about preventable injuries and deaths 420 539Parents receive information and materials regarding preventable injuries
214 215
Parents participate in parenting education classes on healthy child development
18,173 6,762
Home visits to improve parent knowledge of healthy child development
3,846 23,275

Supplement to Orange County’s Annual Report to the State FY 12/13
7
Table 3. Services Provided by All Commission‐Funded Programs
Strategic Plan Outcome
Service Clients Served
Number of Services
Office visits to improve parent knowledge of healthy child development
9,966 12,898
Children receive health education classes 8,575 1,716Providers receive consultations to improve provider knowledge of healthy child development
615 627
SF.3 Caregivers have ready access to family support services and resources
Kits for New Parents distributed 22,435 22,435
Mothers are screened with the Bridges Screening Tool 13,496 13,496
Parents receive referrals to services 26,071 31,993Providers receive referrals to services 2,917 2,872Parents receive referrals to MCHN programs 2,512 2,512Parents receive referrals to non‐MCHN programs 2,719 2,872Parents receive follow up on referrals and services are accessed 15,168 26,226
SF.4 Families have resources to support the management and treatment their child’s behavioral health needs
Children receive behavioral health treatment services 550 4,048
Providers are educated to increase awareness and identification of behavioral health issues
760 1,365
Providers receive training on behavioral health treatment services for children 0‐5
166 19
Parents receive education, resources, referrals, and support regarding their child's behavioral health issues
247 1,244
Parents receive behavioral health screening 588 588EL.1 Children have the developmental skills* to be proficient learners in school *Early literacy/ numeracy, self‐regulation, social expression, and self‐care and motor skills
Children read to at physician’s offices or clinics 29,898 33,204
Parents participate in a program designed to increase the frequency of reading at home
10,998 362,019
Children participate in a program designed to increase the frequency of reading at home
40,654 403,321
Parents receive literacy information/assistance in waiting rooms or community events
28,589 32,179
Provider will recruit and support pediatrician offices to participate in Reach Out Read National Program
5 6
Books distributed to children 5,709 173,182New and used books collected for distribution 784 146,946Children participating in early math programs 7,223 476,657Parents receive speech and language services 1,402 476,657Children receive speech and language services 1,408 4,358Providers receive training on speech and language services 26 26Providers will conduct classroom assessments using an established tool such as ECERS or ELLCO
361 416

Supplement to Orange County’s Annual Report to the State FY 12/13
8
Table 3. Services Provided by All Commission‐Funded Programs
Strategic Plan Outcome
Service Clients Served
Number of Services
Providers are given resources and early intervention strategies for appropriate early care
1,884 5,953
Providers receive CARES Plus Trainings 859 989
Children receive center‐based early care and education services other than preschool
906 37,033
Children receive comprehensive Commission‐funded preschool services
412 60,444
Children receive enhanced school readiness services through other preschool programs
380 4,306
Parents participate in a drop‐in, family‐focused early learning program (i.e., Learning Link)
3,823 47,153
Children participate in a drop‐in, family‐focused early learning program (i.e., Learning Link)
3,194 49,630
EL.2 Schools are ready for children when they enter kindergarten
Children visit Kindergarten classrooms prior to start of school year 6,776 6,701
Children's health and development records are transferred to their elementary school prior to entering kindergarten
7,131 7,790
Children's records are entered into the computerized district system prior to entering kindergarten
2,088 2,880
EL.3 Parents have the supports that contribute to children's readiness for school success
Parents receive tools, resources, information and/or training needed to transition their child to school
17,488 70,312
CB.1 Increase sustainability
Number of volunteers recruited 1,807 1,871
CB.2 Increase access and efficiency, quality and effectiveness
Children with special needs served 7,804 8,829
Providers receive trainings to build the capacity of the agency to increase quality services
1,709 637
Parents receive transportation to health or social services 817 2,155Children 0‐5 receive transportation to health or social services 396 823Children 0‐5 received specialized child care 316 379
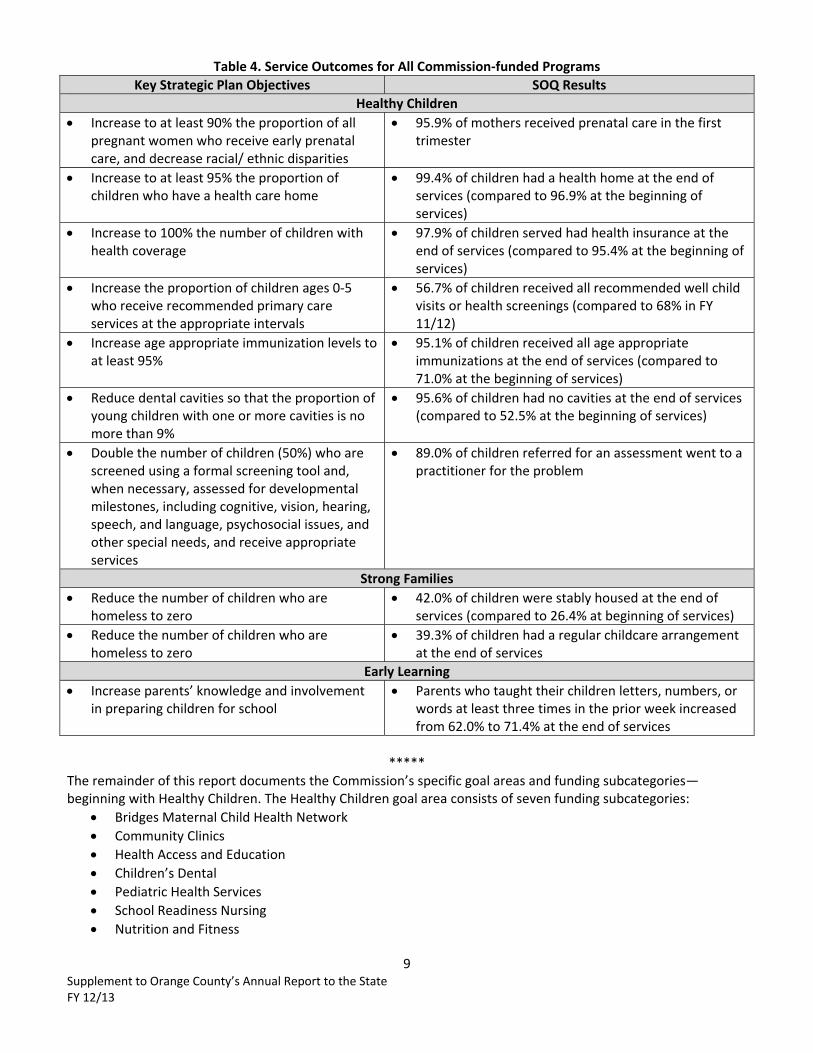
Supplement to Orange County’s Annual Report to the State FY 12/13
9
Table 4. Service Outcomes for All Commission‐funded Programs Key Strategic Plan Objectives SOQ Results
Healthy Children • Increase to at least 90% the proportion of all
pregnant women who receive early prenatal care, and decrease racial/ ethnic disparities
• 95.9% of mothers received prenatal care in the first trimester
• Increase to at least 95% the proportion of children who have a health care home
• 99.4% of children had a health home at the end of services (compared to 96.9% at the beginning of services)
• Increase to 100% the number of children with health coverage
• 97.9% of children served had health insurance at the end of services (compared to 95.4% at the beginning of services)
• Increase the proportion of children ages 0‐5 who receive recommended primary care services at the appropriate intervals
• 56.7% of children received all recommended well child visits or health screenings (compared to 68% in FY 11/12)
• Increase age appropriate immunization levels to at least 95%
• 95.1% of children received all age appropriate immunizations at the end of services (compared to 71.0% at the beginning of services)
• Reduce dental cavities so that the proportion of young children with one or more cavities is no more than 9%
• 95.6% of children had no cavities at the end of services (compared to 52.5% at the beginning of services)
• Double the number of children (50%) who are screened using a formal screening tool and, when necessary, assessed for developmental milestones, including cognitive, vision, hearing, speech, and language, psychosocial issues, and other special needs, and receive appropriate services
• 89.0% of children referred for an assessment went to a practitioner for the problem
Strong Families • Reduce the number of children who are
homeless to zero • 42.0% of children were stably housed at the end of
services (compared to 26.4% at beginning of services) • Reduce the number of children who are
homeless to zero • 39.3% of children had a regular childcare arrangement
at the end of services Early Learning
• Increase parents’ knowledge and involvement in preparing children for school
• Parents who taught their children letters, numbers, or words at least three times in the prior week increased from 62.0% to 71.4% at the end of services
*****
The remainder of this report documents the Commission’s specific goal areas and funding subcategories— beginning with Healthy Children. The Healthy Children goal area consists of seven funding subcategories:
• Bridges Maternal Child Health Network • Community Clinics • Health Access and Education • Children’s Dental • Pediatric Health Services • School Readiness Nursing • Nutrition and Fitness

(a Component Unit of the County of Orange, California)
● ● ● www.occhildrenandfamilies.com
● ● ●
Comprehensive Annual Financial Report For the Fiscal Year Ended June 30, 2013
CHILDREN AND FAMILIES COMMISSION OF ORANGE COUNTY
(a Component Unit of the County of Orange, California)
COMPREHENSIVE ANNUAL FINANCIAL REPORT For the Fiscal Year Ended June 30, 2013
Prepared by:
Michael Garcell, CPA

CHILDREN AND FAMILIES COMMISSION OF ORANGE COUNTY (a Component Unit of the
County of Orange, California)
COMPREHENSIVE ANNUAL FINANCIAL REPORT
For the Year Ended June 30, 2013
Michael Garcell, CPA
Finance Manager

CHILDREN AND FAMILIES COMMISSION
OF ORANGE COUNTY FOR THE YEAR ENDED JUNE 30, 2013
Table of Contents INTRODUCTORY SECTION: Page(s)
Letter of Transmittal………………………………………………………………………………………. i
Board of Commissioners…………………………………………………………………………............... iv
Organization Chart………………………………………………………………………………………… v
FINANCIAL SECTION:
Independent Auditors’ Report……...…………………………………………………………….……….. 1
Management’s Discussion and Analysis (Required Supplementary Information).........................……….. 3
Basic Financial Statements:
Statement of Net Position………………………………………………………………………..…….. 15
Statement of Activities………………………………………………………………………………… 16
Governmental Fund Balance Sheet……………………………………………………………………. 17
Reconciliation of the Governmental Fund Balance Sheet to the Statement of Net Position………….…………………………………………………………
18
Governmental Fund Revenues, Expenditures and Changes in Fund Balance…………………………………………..…….………
19
Reconciliation of the Change in Fund Balance to the Changes in Fund Balance to the Statement of Activities………………………..……………
20
Statement of Revenues, Expenditures and Changes in Fund Balance – Budget and Actual……………..………………………..………………..…………
21
Notes to Basic Financial Statements…………………………………………………………………… 22
OTHER SUPPLEMENTARY INFORMATION:
Schedule of First 5 California Funding………………………………………………………………… 34
STATISTICAL SECTION:
Financial Trends
Net Position by Component………………………………………………….………………………… 36
Changes in Net Position..………………………………………………………………………………. 38
Fund Balances – General Fund………………………………………………………………………… 40
Changes in Fund Balance – General Fund……………………………………………………………... 42
Revenue Capacity
First 5 California County Tax Revenue Capacity……………………………………………………… 44
State of California-Cigarette Taxes and Other Tobacco Products Surtax Revenue…………………... 45
State of California-Cigarette Distributions and Per Capita Consumption……………………………... 46
Demographic Information
Demographic Data……………………………………………………………………………………... 47
Live Births, California Counties……………………………………………………………………….. 48
Children’s Score Card Orange County...………………………………………………………………. 49

STATISTICAL SECTION (Continued):
Operating Information
Capital Assets Statistics………………………………………………………………………………... 50
Principal Employers……………………………………………………………………………………. 51
Employees by Function………………………………………………………………………………… 52
COMPLIANCE SECTION:
Independent Auditors’ Report on Internal Control Over Financial Reporting and On Compliance and Other Matters Based on an Audit of Financial Statements Performed in Accordance with Government Auditing Standards………………………………… 54
Independent Auditors’ Report on State Compliance…………………………………………………... 56
i
17320 Red Hill Avenue, Suite 200 Irvine, California 92614 714-834-5310 FAX: 949-474-2243
October 2, 2013 Board of Commissioners Children and Families Commission of Orange County 17320 Redhill Avenue Suite 200 Irvine, CA 92614 Dear Commissioners, The Comprehensive Annual Financial Report (CAFR) of the Children and Families Commission of Orange County (the Commission) is hereby submitted. This report contains financial statements that have been prepared in conformity with United States generally accepted accounting principles (GAAP) prescribed for governmental entities. Responsibility for the accuracy of the data and the completeness and fairness of the presentation, including all disclosures, rests with the management of the Commission. To the best of our knowledge and belief, the enclosed data is accurate in all material aspects and is reported in a manner that presents fairly the financial position and changes to the financial position of the Children and Families Commission of Orange County. All disclosures necessary to enable the reader to gain an understanding of the Commission’s financial activities have been included. The CAFR has been audited by the independent certified public accounting firm of Vavrinek, Trine, Day & Co., LLP. The goal of the independent audit was to provide reasonable assurance about whether the basic financial statements of the Commission for the year ended June 30, 2013, are free of material misstatement. The independent certified public accounting firm has issued an unmodified (“clean”) opinion on the Commission’s financial statements as of and for the year ended June 30, 2013. The independent auditors’ report is located at the front of the financial section of this report. This letter of transmittal is designed to complement and should be read in conjunction with the Management’s Discussion and Analysis (MD&A) that immediately follows the independent auditors’ report. The MD&A provides a narrative introduction, overview, and an analysis of the basic financial statements. Profile of the Commission The Commission was established by the Orange County Board of Supervisors in September 1999 following the passage of Proposition 10, through which California voters made an unprecedented investment in early childhood development. Our activities have been built to develop, adopt, promote and implement early childhood development. Since inception, the Commission has made a lasting positive impact in Orange County through its expenditures of approximately $616 million toward grants, programs and operations that improve the well-being of young children and families in Orange County.
ii
Relevant Financial Policies Financial Plan The Long-Term Financial Plan was reviewed and revised in April 2013 to address current economic issues, emerging program needs, and future demand on Commission resources. The revised Long-Term Financial Plan includes one-time catalytic funding investments focused on key Commission priorities. The goal of catalytic funding is to reduce or eliminate future ongoing support for several major programs. First round catalytic investments totaling $45 million were made to support Autism/Early Developmental programs, Children’s Dental, Emergency Shelters, Early Literacy & Math, Healthy Child Development, and VISTA program transition. Round two catalytic funding priorities consist of investments in Partnerships for Children’s Health, Prevention Program Planning, Nutrition and Fitness, Vision Screening and Capacity Building. Staff will continue to monitor and report on the total $55 million catalytic allocation as expenses are realized. The FY 2013-2014 Operating Budget, presented in April 2013, includes the funding actions taken earlier this year to fund catalytic programs and renew funding for core programs that support the four goal areas. The step-down approach continues to be embedded in the approved Long-Term Financial Plan, and assumes a reduction of base budget program spending from $30 million to $27.6 million in FY 2013/14 and $25.1 million in FY 2014/15. The budget plan continues the reduction of program spending gradually, depending on actual revenue, to bring the total budget in line with the forecasted revenue and a reduction in fund balance not already allocated to Catalytic funding. Strategic Plan Although changes in the long-term funding plan were made, the Commission will continue to utilize the Strategic Plan adopted in April 2013 for fiscal year 2013-2014 detailing our continuing commitment to partnering with the Orange County community to improve the lives of expectant parents, children from the prenatal stage through age 5 and their families. This will be the guide by which we will plan, develop, implement and evaluate our activities through 2014. Other Financial Information Internal Control The management of the Commission is responsible for establishing and maintaining internal controls designed to ensure that the assets of the public entity are protected from loss, theft, or misuse. Management is also responsible for ensuring that adequate accounting data are compiled to allow for the preparation of the basic financial statements in conformity with accounting principles generally accepted in the United States of America. Internal controls are designed to provide reasonable, but not absolute, assurance that these objectives are met. The concept of reasonable assurance recognizes that: (1) the cost of a control should not exceed the benefits likely to be derived; and (2) the valuation of costs and benefits requires estimates and judgments by management.

iii
Budgetary Control The objective of budgetary control is to ensure that spending is limited to the total amount authorized by the Board of Commissioners. The initial budget for fiscal year 2012-2013 was adopted on April 4, 2012 with subsequent adjustments approved in November 7, 2012 and April 3, 2013. The Executive Director has the discretion to adjust the budget as defined within the budget policy of the Board of Commissioners. Monthly financial highlights are provided to the Board of Commissioners. Risk Management The Commission manages its risk exposure in part through the purchase of Workers Compensation, Property, General Liability, Auto, Crime and Directors and Officers insurance through the County of Orange. Awards and Acknowledgements The Government Finance Officers Association of the United States and Canada (GFOA) awarded a Certificate of Achievement for Excellence in Financial Reporting to the Commission for its Comprehensive Annual Financial Report (CAFR) for the fiscal year ended June 30, 2012. This was the third consecutive year that the government has achieved this prestigious award. In order to be awarded a Certificate of Achievement, the government must publish an easily readable and efficiently organized CAFR. This report must satisfy both accounting principles generally accepted in the United State of America and applicable legal requirements. A Certificate of Achievement is valid for a period of one year only. We believe that our current CAFR continues to meet the Certificate of Achievement program’s requirements and we are submitting it to the GFOA to determine its eligibility for another certificate. I would like to express my sincere appreciation to Commission staff and the staff of the certified public accounting firm of Vavrinek, Trine, Day & Co., LLP. I hope this report will be of interest and use to those in the County of Orange, other governmental agencies, and the public interested in the financial activity of the Commission. Sincerely,
Christina Altmayer Executive Director

CHILDREN AND FAMILIES COMMISSION OF ORANGE COUNTY
BOARD OF COMMISSIONERS FOR THE FISCAL YEAR ENDED JUNE 30, 2013
iv
BOARD MEMBERS (9)
Michael L. Riley, Ph.D. (M)
Social Services Agency Chair
Kimberly Cripe (A) Vice Chair
Sandra Barry (A) Chair Pro-tem
Katherine Ahn, DDS (A)
Hugh Hewitt (A)
Maria E. Minon, M.D. (A)
Janet Nguyen (M) Board of Supervisors
Mark Refowitz (M) Health Care Agency
Sandra Pierce (A)
(M) Mandatory members (A) At-large members

CHILDREN AND FAMILIES COMMISSION OF ORANGE COUNTY ORGANIZATION CHART FISCAL YEAR 2012-2013
v

vi
1
INDEPENDENT AUDITORS’ REPORT
To the Board of Commissioners Children and Families Commission of Orange County Report on the Financial Statements We have audited the accompanying financial statements of the governmental activities and the general fund of the Children and Families Commission of Orange County (Commission), a component unit of the County of Orange, California, as of and for the year ended June 30, 2013, and the related notes to the financial statements, which collectively comprise the Commission’s basic financial statements as listed in the table of contents. Management’s Responsibility for the Financial Statements Management is responsible for the preparation and fair presentation of these financial statements in accordance with accounting principles generally accepted in the United States of America; this includes the design, implementation, and maintenance of internal control relevant to the preparation and fair presentation of financial statements that are free from material misstatement, whether due to fraud or error. Auditors’ Responsibility Our responsibility is to express opinions on these financial statements based on our audit. We conducted our audit in accordance with auditing standards generally accepted in the United States of America and the standards applicable to financial audits contained in Government Auditing Standards, issued by the Comptroller General of the United States. Those standards require that we plan and perform the audit to obtain reasonable assurance about whether the financial statements are free from material misstatement. An audit involves performing procedures to obtain audit evidence about the amounts and disclosures in the financial statements. The procedures selected depend on the auditor’s judgment, including the assessment of the risks of material misstatement of the financial statements, whether due to fraud or error. In making those risk assessments, the auditor considers internal control relevant to the entity’s preparation and fair presentation of the financial statements in order to design audit procedures that are appropriate in the circumstances, but not for the purpose of expressing an opinion on the effectiveness of the entity’s internal control. Accordingly, we express no such opinion. An audit also includes evaluating the appropriateness of accounting policies used and the reasonableness of significant accounting estimates made by management, as well as evaluating the overall presentation of the financial statements. We believe that the audit evidence we have obtained is sufficient and appropriate to provide a basis for our audit opinions. Opinions In our opinion, the financial statements referred to above present fairly, in all material respects, the respective financial position of the governmental activities and general fund of the Commission as of June 30, 2013, and the respective changes in financial position thereof and the respective budgetary comparison for the General Fund for the year then ended in accordance with accounting principles generally accepted in the United States of America.
Vavrinek, Trine, Day & Co., LLPCertified Public Accountants
VALUE THE D IFFERENCE
FRESN O • L AGUN A H I L LS • PALO ALTO • P LEASANTON • RAN C HO CUC AMON GA • R I v E R S I d E • SACRAMENTO
25231 Paseo De Alicia, Suite 100 Laguna Hills, CA 92653 Tel: 949.768.0833 Fax: 949.768.8408 www.vtdcpa.com
2
Emphasis of Matter As described in Note 1 to the financial statements, the Commission adopted Governmental Accounting Standards Board (GASB) Statement No. 63, Financial Reporting of Deferred Outflows of Resources, Deferred Inflows of Resources, and Net Position, effective July 1, 2012. Our opinion is not modified with respect to this matter. Other Matters Required Supplementary Information Accounting principles generally accepted in the United States of America require that the Management’s Discussion and Analysis on pages 3 through 14 be presented to supplement the basic financial statements. Such information, although not a part of the basic financial statements, is required by the Governmental Accounting Standards Board, who considers it to be an essential part of financial reporting for placing the basic financial statements in an appropriate operational, economic, or historical context. We have applied certain limited procedures to the required supplementary information in accordance with auditing standards generally accepted in the United States of America, which consisted of inquiries of management about the methods of preparing the information and comparing the information for consistency with management’s responses to our inquiries, the basic financial statements, and other knowledge we obtained during our audit of the basic financial statements. We do not express an opinion or provide any assurance on the information because the limited procedures do not provide us with sufficient evidence to express an opinion or provide any assurance. Other Information Our audit was conducted for the purpose of forming opinions on the financial statements that collectively comprise the Commission’s basic financial statements. The Introductory Section, Schedule of First 5 California Funding (Schedule), and Statistical Section are presented for purposes of additional analysis and are not a required part of the basic financial statements. The Schedule is the responsibility of management and was derived from and relates directly to the underlying accounting and other records used to prepare the basic financial statements. Such information has been subjected to the auditing procedures applied in the audit of the basic financial statements and certain additional procedures, including comparing and reconciling such information directly to the underlying accounting and other records used to prepare the basic financial statements or to the basic financial statements themselves, and other additional procedures in accordance with auditing standards generally accepted in the United States of America. In our opinion, the Schedule is fairly stated in all material respects in relation to the basic financial statements as a whole. The introductory and statistical sections have not been subjected to the auditing procedures applied in the audit of the basic financial statements and, accordingly, we do not express an opinion or provide any assurance on them. Other Reporting Required by Government Auditing Standards In accordance with Government Auditing Standards, we have also issued our report dated September 27, 2013, on our consideration of the Commission’s internal control over financial reporting and on our tests of its compliance with certain provisions of laws, regulations, contracts, and grant agreements and other matters. The purpose of that report is to describe the scope of our testing of internal control over financial reporting and compliance and the results of that testing, and not to provide an opinion on internal control over financial reporting or on compliance. That report is an integral part of an audit performed in accordance with Government Auditing Standards in considering the Commission’s internal control over financial reporting and compliance. Laguna Hills, California September 27, 2013

CHILDREN AND FAMILIES COMMISSION OF ORANGE COUNTY MANAGEMENT’S DISCUSSION AND ANALYSIS
(UNAUDITED) JUNE 30, 2013
3
As management of the Children and Families Commission of Orange County (Commission), we offer readers of the Commission’s Comprehensive Annual Financial Report this overview and analysis of the financial activities for the fiscal year ended June 30, 2013. Please read in conjunction with the Commission’s basic financial statements and accompanying notes.
Financial Highlights
The assets of the Commission exceeded its liabilities by $72 million at the end of the current fiscal year, a decrease of $6.57 million (8.3%) from the prior fiscal year. The decrease is due to Round 1 and 2 Catalytic expenditures above the Commission’s annual program budget.
As of June 30, 2013, the Commission’s governmental fund statements reported an ending fund balance totaling $72 million, a decrease of $6.75 million (8.6%) from the prior fiscal year.
The total ending fund balance of $72 million was classified into three categories. The Commission’s breakdown is as follows: $5.62 million as non-spendable, $49.99 million as committed, $21.35 as assigned.
Overview of the Financial Statements
This comprehensive annual financial report consists of two parts, this management’s discussion and analysis and the basic financial statements, including government-wide financial statements, governmental fund financial statements and notes to the basic financial statements. The Commission’s financial statements, prepared in accordance with generally accepted accounting principles (GAAP), offer key, high-level financial information about the activities during the reporting period. Government-Wide Financial Statements. The government-wide financial statements are designed to provide readers with a broad overview of the Commission’s finances and activities. These statements are prepared using the full accrual basis of accounting and a total economic resource measurement focus, in order to provide both long-term and short-term information about the Commission’s overall financial status. A detailed definition of these methods is described in Note 1 of the basic financial statements. The Statement of Net Position presents information on all of the Commission’s assets and liabilities with the difference between assets and liabilities reported as net position. Changes in net position may serve as a useful indicator of whether the financial position of the Commission is improving or declining. The Statement of Activities presents changes in the Commission’s net position during the fiscal year. All changes in net position are reported as soon as the underlying event giving rise to the change occurs, regardless of the timing of related cash flows. Thus, revenues and expenses are reported in this statement for some items that will only result in cash flows in future fiscal periods (e.g., uncollected taxes and earned but unused vacation leave).

CHILDREN AND FAMILIES COMMISSION OF ORANGE COUNTY MANAGEMENT’S DISCUSSION AND ANALYSIS
(UNAUDITED) JUNE 30, 2013
4
Fund Financial Statements. A fund is a grouping of related accounts that is used to maintain control over resources that have been segregated for specific activities or objectives. Fund accounting is used to ensure and demonstrate compliance with finance-related and legal requirements. All of the Commission’s activities are accounted for in the general fund. Governmental funds are used to account for essentially the same functions reported as governmental activities in the government-wide financial statements. However, unlike the government-wide financial statements, governmental fund financial statements focus on near-term inflows and outflows of spendable resources, as well as on balances of spendable resources available at the end of the year. Such information may be useful in evaluating the Commission’s near-term financing requirements. Because the focus of government funds is narrower than that of the government-wide financial statements, it is useful to compare the information presented for governmental funds with similar information presented for governmental activities in the government-wide financial statements. By doing so, readers may better understand the long-term impact of the Commission’s near-term financial decisions. Reconciliations are presented for the Balance Sheet of governmental funds and the Statement of Revenues, Expenditures and Changes in Fund Balances of governmental funds to facilitate comparison between governmental funds and governmental activities. Governmental Fund Financial Statements are prepared on a modified accrual basis, which means that they measure only current financial resources and uses. Capital assets and long-term liabilities are not presented in the Governmental Fund Financial Statements, as they do not represent current available resources or obligations. The Commission adopts an annual appropriated budget for the general fund. A budgetary comparison statement for the general fund is presented in the basic financial statements to demonstrate compliance with the adopted budget. Notes to the Financial Statements. The notes provide additional information that is essential to a full understanding of the data provided in the government-wide and fund financial statements. The notes to the financial statements can be found immediately following the basic financial statements.
Analysis of the Commission’s Government-wide Financial Statements
Net Position. Net position may serve over time as a useful indicator of a government’s financial position. In the case of the Commission, net position was $72.41 million at the end of the current fiscal year, an 8% decrease from the prior fiscal year. Following is a summary of the government-wide Statement of Net Position comparing balances at June 30, 2013 and June 30, 2012.

CHILDREN AND FAMILIES COMMISSION OF ORANGE COUNTY MANAGEMENT’S DISCUSSION AND ANALYSIS
(UNAUDITED) JUNE 30, 2013
5
The Commission’s net position as of June 30, 2013 is considered unrestricted because their use is not for a purpose narrower than the purpose of the Commission and were comprised of the following:
Percent Increase FY 2012-13 FY 2011-12 (Decrease)
Assets: Cash and investments $69,280,830 $83,017,827 -17% Imprest cash 15,000 15,000 -
Interest receivable 19,931 71,795 -72% Deposit with others 5,380,606 93,625 +5,647% Due from County of Orange 881 3,738 -76% Due from other governments 5,836,164 6,151,327 -5% Prepaid expense 243,435 65,657 +271% Total assets $80,776,847 $89,419,968 -10%
Liabilities: Accounts payable and accrued liabilities $2,847,704 $3,862,837 -26% Due to County of Orange 9,593 77,574 -88% Due to other governments 3,673,252 3,898,071 -6% Retentions payable 1,634,093 2,384,936 -31% Accrued wages and benefits 70,254 76,718 -8% Compensated absences: Payable within one year 77,336 87,838 -12% Payable after one year 53,482 46,509 15% Total liabilities 8,365,714 10,434,483 -20% Net Position: Unrestricted 72,411,134 78,985,485 -8% Total net position $72,411,134 $78,985,485
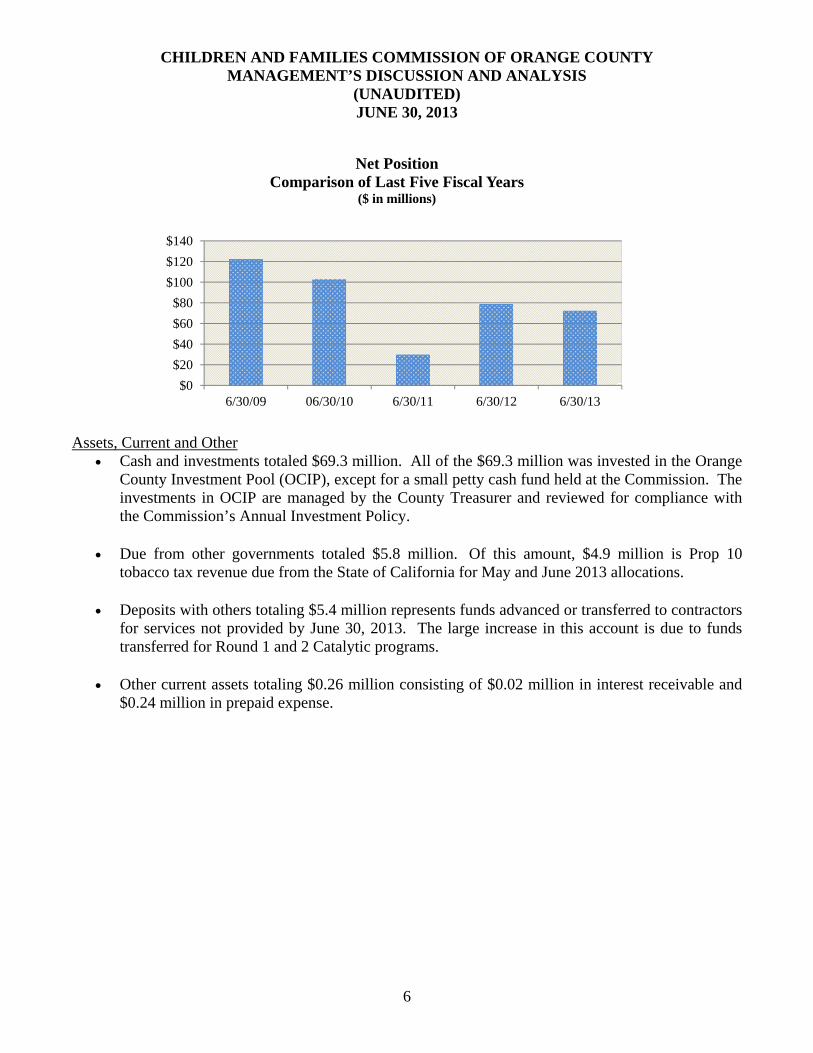
CHILDREN AND FAMILIES COMMISSION OF ORANGE COUNTY MANAGEMENT’S DISCUSSION AND ANALYSIS
(UNAUDITED) JUNE 30, 2013
6
Assets, Current and Other
Cash and investments totaled $69.3 million. All of the $69.3 million was invested in the Orange County Investment Pool (OCIP), except for a small petty cash fund held at the Commission. The investments in OCIP are managed by the County Treasurer and reviewed for compliance with the Commission’s Annual Investment Policy.
Due from other governments totaled $5.8 million. Of this amount, $4.9 million is Prop 10 tobacco tax revenue due from the State of California for May and June 2013 allocations.
Deposits with others totaling $5.4 million represents funds advanced or transferred to contractors for services not provided by June 30, 2013. The large increase in this account is due to funds transferred for Round 1 and 2 Catalytic programs.
Other current assets totaling $0.26 million consisting of $0.02 million in interest receivable and $0.24 million in prepaid expense.
$0
$20
$40
$60
$80
$100
$120
$140
6/30/09 06/30/10 6/30/11 6/30/12 6/30/13
Net PositionComparison of Last Five Fiscal Years
($ in millions)
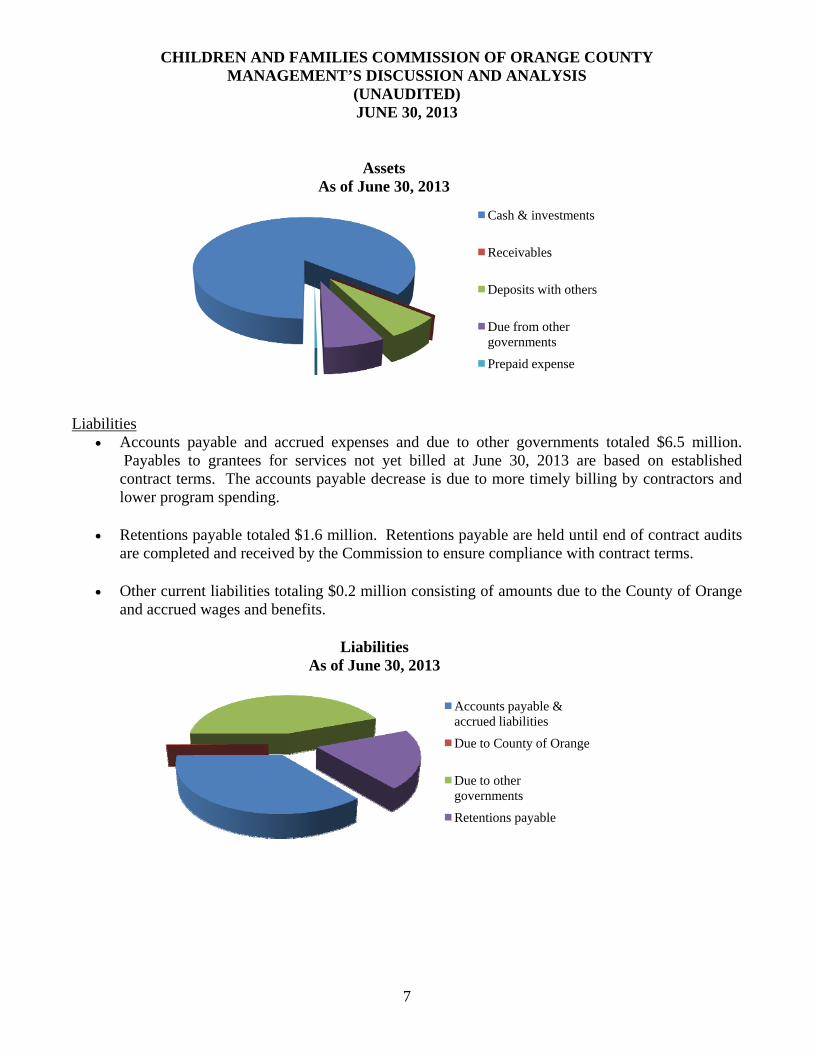
CHILDREN AND FAMILIES COMMISSION OF ORANGE COUNTY MANAGEMENT’S DISCUSSION AND ANALYSIS
(UNAUDITED) JUNE 30, 2013
7
Liabilities Accounts payable and accrued expenses and due to other governments totaled $6.5 million.
Payables to grantees for services not yet billed at June 30, 2013 are based on established contract terms. The accounts payable decrease is due to more timely billing by contractors and lower program spending.
Retentions payable totaled $1.6 million. Retentions payable are held until end of contract audits are completed and received by the Commission to ensure compliance with contract terms.
Other current liabilities totaling $0.2 million consisting of amounts due to the County of Orange and accrued wages and benefits.
AssetsAs of June 30, 2013
Cash & investments
Receivables
Deposits with others
Due from other governments
Prepaid expense
LiabilitiesAs of June 30, 2013
Accounts payable & accrued liabilities
Due to County of Orange
Due to other governments
Retentions payable

CHILDREN AND FAMILIES COMMISSION OF ORANGE COUNTY MANAGEMENT’S DISCUSSION AND ANALYSIS
(UNAUDITED) JUNE 30, 2013
8
Changes in Net Position. For the year ended June 30, 2013, current year operations decreased the Commission’s net position by $6.57 million. The following is a summary of the Commission’s Statement of Activities comparing revenues, expenses and changes in net position for the fiscal years ended June 30, 2013 and June 30, 2012. Percent Increase FY 2012-13 FY 2011-12 (Decrease) Revenues: Program Revenues Tobacco taxes $27,024,505 $28,988,350 -6.77% Other State operating grants and contributions 327,675 435,487 -24.76% Interest income earned on tobacco taxes at the 9,588 11,612 -17.43% Federal operating grants and other 828,941 768,246 7.90% Total program revenues 28,190,709 30,203,695 -6.66% General Revenues Investment income 122,358 481,976 -74.61% Other revenues 159,344 90,786 75.52% Total general revenues 281,702 572,762 -50.82% Total revenues 28,472,411 30,775,457 -7.49% Expenses: 0-5 Child development programs 33,341,947 31,155,315 7.02% Salaries and benefits 1,704,815 2,068,926 -17.60% Total expenses 35,046,762 33,224,241 5.49% Extraordinary item: Reversal of AB99 liability 0 51,369,439 -100% Change in net position: (6,574,351) 48,921,655 Net position – July 1 78,985,485 30,063,830 Net position – June 30 $72,411,134 $78,985,485 -8.32%

CHILDREN AND FAMILIES COMMISSION OF ORANGE COUNTY MANAGEMENT’S DISCUSSION AND ANALYSIS
(UNAUDITED) JUNE 30, 2013
9
Total revenues The Commission’s total revenues are comprised of both program revenues, which are restricted to one or more specific program uses, and general revenues.
Program revenues
The Commission’s program revenues totaled $28.2 million in FY 2012-13 and accounted for 98.4% of total revenues. This represented a decrease of $2.1 million (-6.6%) from FY 2011-12 program revenues. Tobacco Tax revenue includes revenues from taxes levied on tobacco products by the State
of California and distributed amongst all counties based on the percentage of county birthrates as established in Proposition 10. This revenue decreased by $1.96 million (-6.77%) from the prior fiscal year.
o The California Children and Families Commission (First 5 California) forecasted a decline of 3-5% each fiscal year in the tobacco tax revenue allocation models. These models are calculated using birthrate data and tobacco sales and usage.
Other State operating grants and contributions includes revenue from the state-wide CARES Plus
grant and Child Signature Program. The Commission applied for and was awarded these grants for FY 2012-13 and therefore, the revenue decreased by $108 thousand (24.76%) from the prior fiscal year. A portion of the revenues were deferred for FY 2012-13 as they were not available to the Commission by June 30, 2013. The revenue will be recognized in FY 2013-14.
Federal operating grants includes revenues from federal grant programs of VISTA, MAA
(Medical Administrative Activities), and ARRA Health Research grant. These revenues increased by $0.06 million (7.90%). This increase is due to slightly higher reimbursable claims though MAA and slightly higher VISTA program reimbursements.
$0
$5
$10
$15
$20
$25
$30
Prop 10 Tobacco
Tax
Other State grants
Federal grants
Investment income
Other revenues
Total RevenuesComparison of Current and Prior Fiscal Year
($ in millions)
FY 2012-13
FY 2011-12

CHILDREN AND FAMILIES COMMISSION OF ORANGE COUNTY MANAGEMENT’S DISCUSSION AND ANALYSIS
(UNAUDITED) JUNE 30, 2013
10
General revenues The Commission’s general revenues totaled $282 thousand in FY 2012-13 and accounted for 1% of total revenues. General revenues include all revenues that do not qualify as program revenues, such as investment income and other miscellaneous revenues.
Investment income, decreased by $0.36 million (75%) from the prior fiscal year. The
decrease in investment income from the Orange County Investment Pool (OCIP), which is administered by the County Treasurer, is due to the overall lower returns in the fixed income markets combined with less available investable cash balances as well as a negative fair value adjustment posted for the Commission’s proportionate share in the county investment pool at year end.
Governmental Activities Expenses Total expenses increased by $1.8 million (5.5%) from the prior fiscal year. The increase is due to Catalytic Round 1 and 2 program funding. $4.6 million in Catalytic funding was expensed during the fiscal year. FY 2012-13 was the first year for Round 1 and 2 Catalytic funding. Other zero-to-five child development programs totaling $28.7 million decreased by $2.4 million or 7.8%.
Zero-to-five child development programs decreased by $2.2 million (7.02%) from the prior fiscal year to fund programs serving children and families within the Commission’s four strategic goal areas of Healthy Children, Ready to Learn, Strong Families and Capacity Building. Reduced program spending is a component of the Commission’s long-term financial plan. Prop 10 tobacco tax revenue has been and will continue as a declining revenues source. To focus on sustainability and service delivery while allowing for decreased revenue, the long-term financial plan incorporates a step-down approach to annual program funding over the next ten years. Two specific program areas that account for a significant portion of reduced spending in FY 2012-13 were Children’s Dental and Early Literacy. Both of these program areas received Catalytic funding which offset ongoing program funding.
Salaries and benefits decreased by $0.39 million (18%) from the prior fiscal year due to eliminated staff positions resulting in salary savings which were slightly offset by increases in retirement and benefit costs in the current fiscal year.
$0
$10
$20
$30
$40
0-5 Child development
programs
Salaries & benefits
Total ExpensesComparison of Current and Prior Fiscal Year
($ in millions)
FY 2012-13
FY 2011-12

CHILDREN AND FAMILIES COMMISSION OF ORANGE COUNTY MANAGEMENT’S DISCUSSION AND ANALYSIS
(UNAUDITED) JUNE 30, 2013
11
Analysis of the Commission’s Governmental Fund Statements As noted earlier, the Commission uses fund accounting to ensure and demonstrate compliance with finance-related legal requirements. Governmental Funds. The child development functions are contained in the general fund of the Commission. The focus of the Commission’s governmental funds is to provide information on near-term inflows, outflows and balances of spendable resources. Such information is useful in assessing the Commission’s financing requirements. In particular, fund balance may serve as a useful measure of a government’s net resources, both committed and available for future operational needs. As of the end of the current fiscal year, the Commission’s general fund reported total ending fund balance of $71.9 million, a decrease of $6.8 million (8.6%) in comparison with the prior fiscal year. Total fund balance decreased due to the initial distributions of Catalytic funding in the amount of $4.6 million. The remaining decrease of $2.2 million was fund balance used to bridge the gap between current year revenue and expenditures as planned for in the Commission’s financial plan.
$0
$5
$10
$15
$20
$25
$30
$35
$40
$45
Fund Balance ClassificationsAs of June 30, 2013
($ in millions)
Nonspendable
Committed
Assigned

CHILDREN AND FAMILIES COMMISSION OF ORANGE COUNTY MANAGEMENT’S DISCUSSION AND ANALYSIS
(UNAUDITED) JUNE 30, 2013
12
General Fund Budgetary Highlights Budget Amendments. The budget amendments are approved annually during the fiscal year for the General Fund in order to reflect the most current revenue trends and to account for shifts in funding objectives.
Total budgeted revenues were increased by $1.85 million in the Prop 10 tobacco tax revenue line item. The increase was based on a higher projection of tobacco tax distributions by the California Department of Finance and the establishment of budgeted revenues for CARES Plus, VISTA and ARRA Health Research grants.
o Tobacco tax revenues – increase of $1.2 million based on prior-year receipts. FY 2011-
12 revenue actually increased from the prior-year. Budgeted tobacco tax revenues were adjusted to reflect a 3.5% decline from the higher FY 2011-12 tobacco tax revenue receipts.
o Other program revenues – increase of $.65 million was due to First 5 California, federal grant revenues, and partner reimbursements to be received through program grants.
Total budgeted appropriations were increased by $1.8 million in the 0-5 child development
program expenditures line item. The major components of the increase are summarized as follows:
o Healthy Children – increase of $1.37 million mostly for the carryover of prior year
unspent funds in Community Clinics and Pediatric Health Services programs.
o Strong Families – increase of $0.3 million for the carryover over of prior year unspent funds in Homeless Prevention programs.
o Early Learning - decrease of $0.4 million of funding set-aside in Early Literacy programs.
o Capacity Building – increase of $0.54 million comprised of $0.13 million of carryover of
prior year unspent funds in Capacity Building Grants and $0.41 million in new appropriations to VISTA for reimbursable expense though the federal grant award.
Budget to Actual Comparisons. This section contains an explanation of the significant differences between the Commission’s Final Budget amounts and actual amounts recorded for revenues and expenditures for FY 2012-13 as detailed on the Statement of Revenues, Expenditures and Changes in Fund Balance – Budget and Actual.
Total actual revenues were less than budgeted revenues in FY 2012-13 by $1.27 million. A decrease in actual Prop 10 tobacco tax revenues of 6.77% from the prior year was most of the variance.

CHILDREN AND FAMILIES COMMISSION OF ORANGE COUNTY MANAGEMENT’S DISCUSSION AND ANALYSIS
(UNAUDITED) JUNE 30, 2013
13
Total budgeted appropriations exceeded actual expenditures in FY 2012-13 by $48.4 million largely due to the timing of Catalytic program implementations and funding.
o 0-5 child development program expenditures were less than budgeted appropriations by $4.27 million. The variance is due to an accumulation of various program under-spending and the timing of program cost recognition. Budgeted funding amounts for programs delayed or extended will be carried over into the following year’s budget.
o Salaries and benefits actual expenditures were less than budgeted appropriations by $0.06 million due to savings from eliminated positions during the current fiscal year.
o Catalytic expenditures were $4.6 million compared to the final budget of $48.7 million. FY2012-13 was the first year Round 1 and 2 catalytic funds were disbursed. A total funding amount of $55 million was approved by the Commission as detailed below. Expenditures will be recognized as services are provided and deliverables met for each separate Catalytic program. At budget adoption, the timing of fund distributions and expense recognition were not known. Each Catalytic program has a unique scope and budget. Final payment terms are included in the contracts approved by the Commission for each Catalytic program. The remaining $50.4 million in Catalytic funding will be carried forward into future year budgets as defined in the related Catalytic contract payment and deliverable schedules.
Commission Catalytic funding Round 1: Children’s Dental Programs $20,000,000 Early Developmental Services / Autism Program 7,000,000 Year Around Emergency Shelter 7,000,000 Early Literacy and Math 5,000,000 Healthy Child Development 5,500,000 VISTA/AmeriCorps transition feasibility 500,000 $45,000,000 Round 2: Capacity Building $3,500,000 Partnership for Children’s Health 3,000,000 Prevention Services 500,000 Nutrition and Fitness 500,000 Pediatric Vision Services 1,500,000 New Capacity Building 500,000 Implementation for Capacity Building Projects 500,000 $10,000,000

CHILDREN AND FAMILIES COMMISSION OF ORANGE COUNTY MANAGEMENT’S DISCUSSION AND ANALYSIS
(UNAUDITED) JUNE 30, 2013
14
Related Events The State projects a continuing decrease of State Tax Allocations revenue and a decrease in the share allocated to the Children and Families Commission of Orange County due to a proportionally lower birth rate combining for a projected annual revenue decrease estimated at 3.5% per year. The Commission’s financial plan will continue planned reductions in annual program funding to account for declining revenues. While the financial plan does assume portions of fund balance will be used in future years to bridge some of the gap between needed services and projected revenue, the Commission still maintains a minimum fund balance of 25% of the annual operating budget.
Requests for Financial Information This comprehensive annual financial report is intended to provide the public with an overview of the Commission’s financial operations and condition for the fiscal year ended June 30, 2013. Questions concerning any of the information provided in this report or requests for additional financial information should be addressed to the Executive Director, Children & Families Commission of Orange County, 17320 Red Hill Avenue, Suite 200, Irvine, California 92614.

CHILDREN AND FAMILIES COMMISSION OF ORANGE COUNTY STATEMENT OF NET POSITION
JUNE 30, 2013
See accompanying notes to the basic financial statements.
15
ASSETSCash and investments in County Treasury 69,280,830$ Imprest cash 15,000 Interest receivable 19,931 Deposits with others 5,380,606 Due from County of Orange 881 Due from other governments 5,836,164 Prepaid expense 243,435
TOTAL ASSETS 80,776,847
LIABILITIES
Accounts payable and accrued liabilities 2,847,704 Due to County of Orange 9,593 Due to other governments 3,673,252 Retentions payable 1,634,093 Accrued wages and benefits 70,254 Compensated absences:
Payable within one year 77,336 Payable after one year 53,482
TOTAL LIABILITIES 8,365,714
NET POSITIONUnrestricted 72,411,134
TOTAL NET POSITION 72,411,134$
GOVERNMENTALACTIVITIES

CHILDREN AND FAMILIES COMMISSION OF ORANGE COUNTY STATEMENT OF ACTIVITIES
FOR THE YEAR ENDED JUNE 30, 2013
See accompanying notes to the basic financial statements.
16
Program Revenues
Operating GrantsExpenses And Contributions
Governmental Activities:Child development 35,046,762$ 28,190,709$ (6,856,053)$
General Revenues:Investment income 122,358 Miscellaneous 159,344
Total General Revenues 281,703
Change in Net Position (6,574,351)
Net Position, July 1 78,985,485
Net Position, June 30 72,411,134$
Net (Expense) Revenueand Changes in Net Position
Governmental Activities
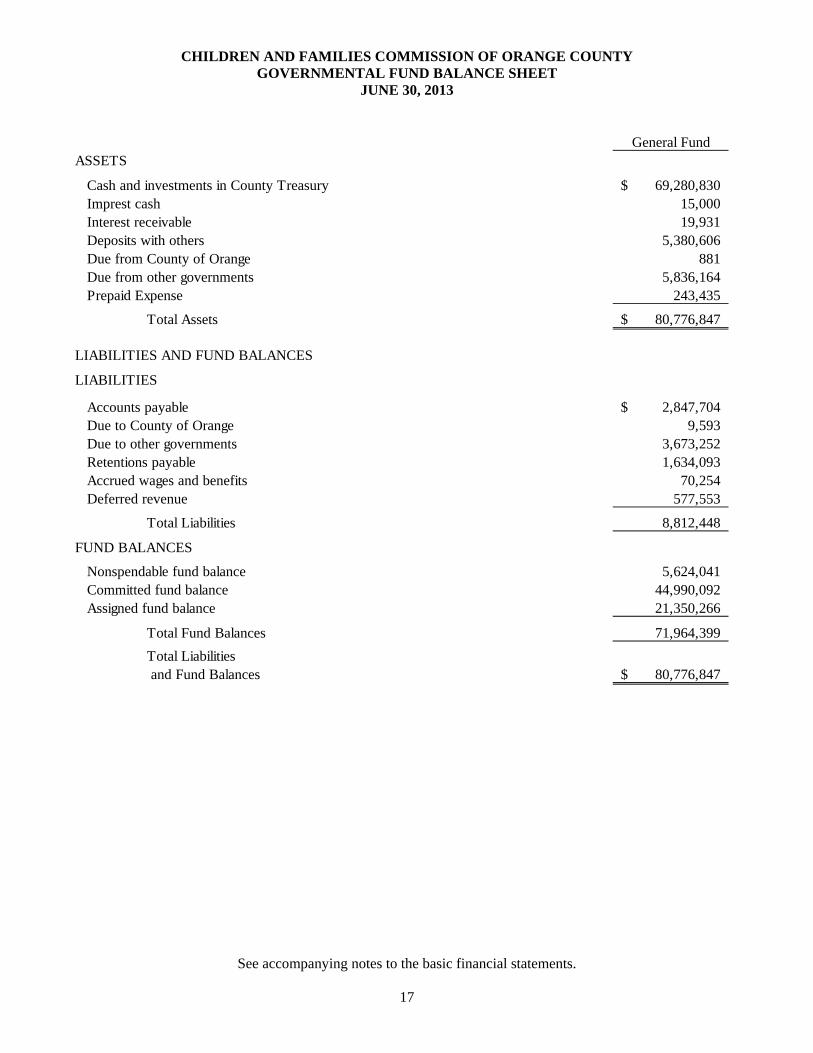
CHILDREN AND FAMILIES COMMISSION OF ORANGE COUNTY GOVERNMENTAL FUND BALANCE SHEET
JUNE 30, 2013
See accompanying notes to the basic financial statements.
17
ASSETS
Cash and investments in County Treasury 69,280,830$ Imprest cash 15,000 Interest receivable 19,931 Deposits with others 5,380,606 Due from County of Orange 881 Due from other governments 5,836,164 Prepaid Expense 243,435
Total Assets 80,776,847$
LIABILITIES AND FUND BALANCES
LIABILITIES
Accounts payable 2,847,704$ Due to County of Orange 9,593 Due to other governments 3,673,252 Retentions payable 1,634,093 Accrued wages and benefits 70,254 Deferred revenue 577,553
Total Liabilities 8,812,448
FUND BALANCES
Nonspendable fund balance 5,624,041 Committed fund balance 44,990,092 Assigned fund balance 21,350,266
Total Fund Balances 71,964,399
Total Liabilities and Fund Balances 80,776,847$
General Fund

CHILDREN AND FAMILIES COMMISSION OF ORANGE COUNTY RECONCILIATION OF GOVERNMENTAL FUND BALANCE SHEET
TO THE STATEMENT OF NET POSITION JUNE 30, 2013
See accompanying notes to the basic financial statements.
18
Fund balances of governmental funds 71,964,399$
Amounts reported for governmental activities in the Statement of Net Position are different because:
(130,818)
577,553
Net Position of governmental activities 72,411,134$
Long-term liabilities are not due and payable in the current period and therefore are not reported in the funds.
Certain revenues in the governmental funds are deferred because they are not collected within the prescribed time period after year-end. However, the revenues are included on the accrual basis used in the government-wide statements.
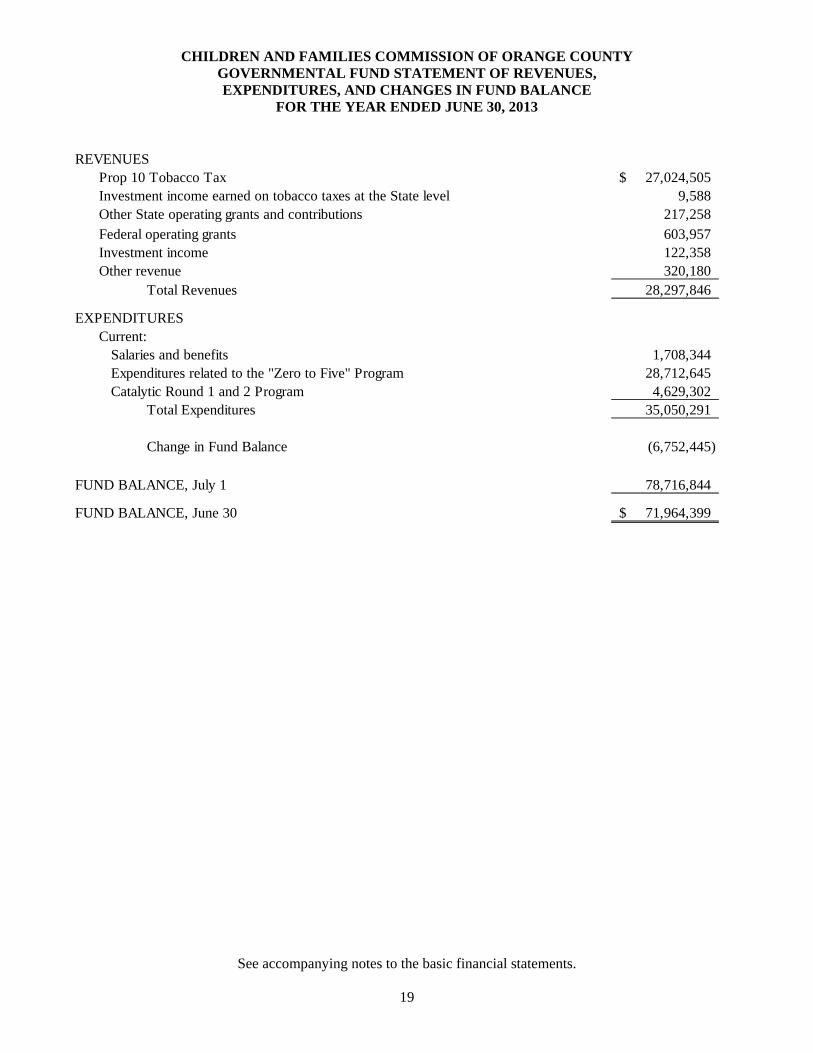
CHILDREN AND FAMILIES COMMISSION OF ORANGE COUNTY GOVERNMENTAL FUND STATEMENT OF REVENUES, EXPENDITURES, AND CHANGES IN FUND BALANCE
FOR THE YEAR ENDED JUNE 30, 2013
See accompanying notes to the basic financial statements.
19
REVENUESProp 10 Tobacco Tax 27,024,505$ Investment income earned on tobacco taxes at the State level 9,588 Other State operating grants and contributions 217,258
Federal operating grants 603,957 Investment income 122,358 Other revenue 320,180
Total Revenues 28,297,846
EXPENDITURESCurrent:
Salaries and benefits 1,708,344 Expenditures related to the "Zero to Five" Program 28,712,645 Catalytic Round 1 and 2 Program 4,629,302
Total Expenditures 35,050,291
Change in Fund Balance (6,752,445)
FUND BALANCE, July 1 78,716,844
FUND BALANCE, June 30 71,964,399$
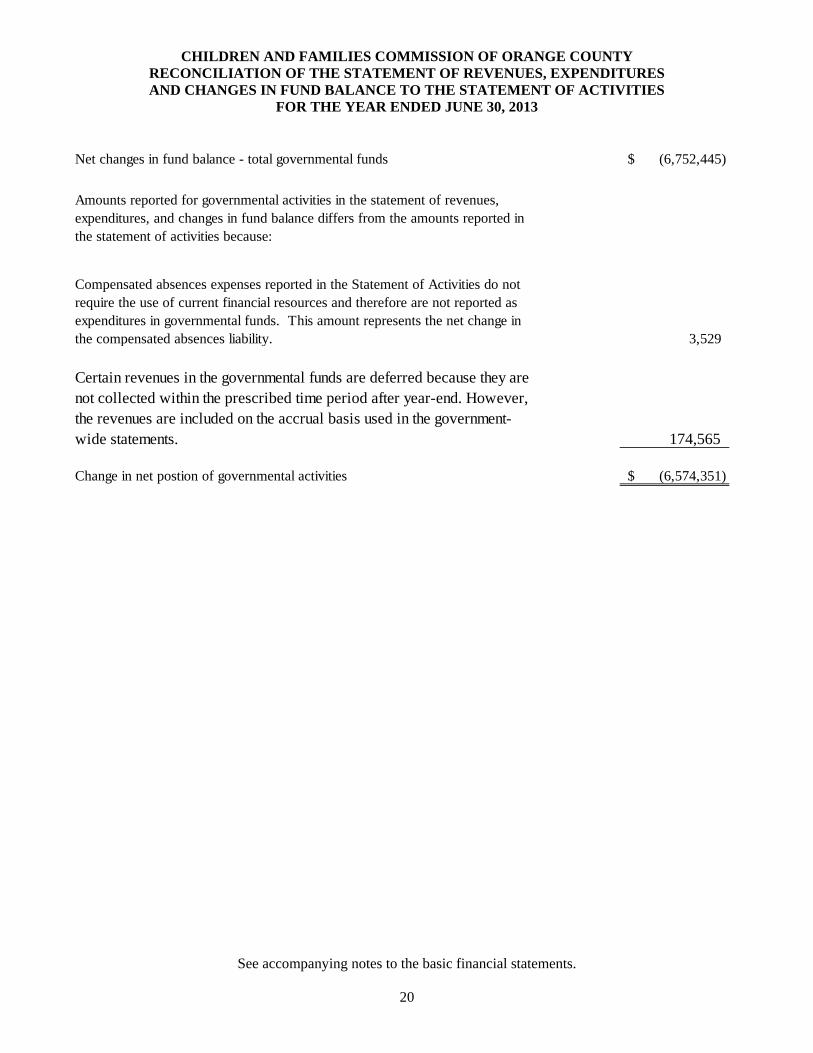
CHILDREN AND FAMILIES COMMISSION OF ORANGE COUNTY RECONCILIATION OF THE STATEMENT OF REVENUES, EXPENDITURES AND CHANGES IN FUND BALANCE TO THE STATEMENT OF ACTIVITIES
FOR THE YEAR ENDED JUNE 30, 2013
See accompanying notes to the basic financial statements.
20
Net changes in fund balance - total governmental funds (6,752,445)$
3,529
174,565
Change in net postion of governmental activities (6,574,351)$
Certain revenues in the governmental funds are deferred because they are not collected within the prescribed time period after year-end. However, the revenues are included on the accrual basis used in the government-wide statements.
Amounts reported for governmental activities in the statement of revenues, expenditures, and changes in fund balance differs from the amounts reported in the statement of activities because:
Compensated absences expenses reported in the Statement of Activities do not require the use of current financial resources and therefore are not reported as expenditures in governmental funds. This amount represents the net change in the compensated absences liability.
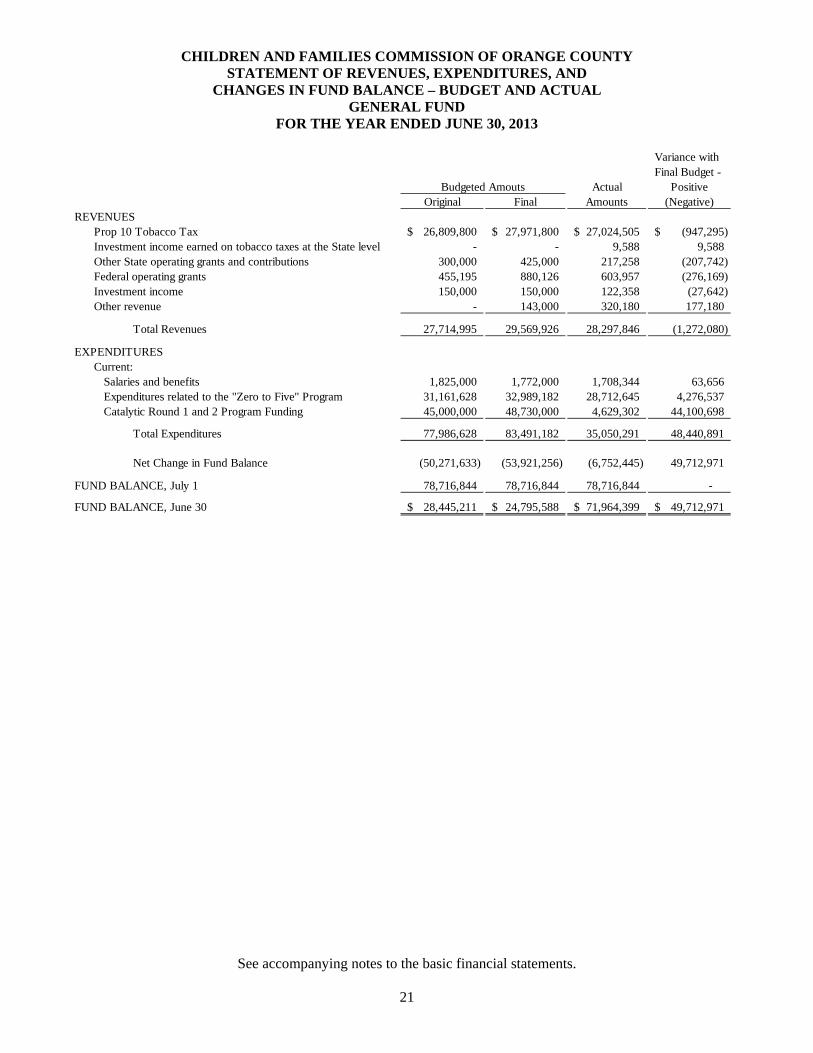
CHILDREN AND FAMILIES COMMISSION OF ORANGE COUNTY STATEMENT OF REVENUES, EXPENDITURES, AND
CHANGES IN FUND BALANCE – BUDGET AND ACTUAL GENERAL FUND
FOR THE YEAR ENDED JUNE 30, 2013
See accompanying notes to the basic financial statements.
21
Variance withFinal Budget -
Actual Positive Original Final Amounts (Negative)
REVENUESProp 10 Tobacco Tax 26,809,800$ 27,971,800$ 27,024,505$ (947,295)$ Investment income earned on tobacco taxes at the State level - - 9,588 9,588 Other State operating grants and contributions 300,000 425,000 217,258 (207,742) Federal operating grants 455,195 880,126 603,957 (276,169) Investment income 150,000 150,000 122,358 (27,642) Other revenue - 143,000 320,180 177,180
Total Revenues 27,714,995 29,569,926 28,297,846 (1,272,080)
EXPENDITURESCurrent:
Salaries and benefits 1,825,000 1,772,000 1,708,344 63,656 Expenditures related to the "Zero to Five" Program 31,161,628 32,989,182 28,712,645 4,276,537 Catalytic Round 1 and 2 Program Funding 45,000,000 48,730,000 4,629,302 44,100,698
Total Expenditures 77,986,628 83,491,182 35,050,291 48,440,891
Net Change in Fund Balance (50,271,633) (53,921,256) (6,752,445) 49,712,971
FUND BALANCE, July 1 78,716,844 78,716,844 78,716,844 -
FUND BALANCE, June 30 28,445,211$ 24,795,588$ 71,964,399$ 49,712,971$
Budgeted Amouts

CHILDREN AND FAMILIES COMMISSION OF ORANGE COUNTY NOTES TO BASIC FINANCIAL STATEMENTS
FOR THE YEAR ENDED JUNE 30, 2013
22
NOTE 1 – ORGANIZATIONS AND SUMMARY OF SIGNIFICANT ACCOUNTING POLICIES Reporting Entity The Children and Families Commission of Orange County (Commission) was established by the Orange County Board of Supervisors in 1999 under the provisions of the California Children and Families Act of 1998 (Act). The Commission is a public entity legally separate and apart from the County. The purpose of the Commission is to develop, adopt, promote and implement early childhood development and school readiness programs in the County of Orange consistent with the goals and objectives of the Act. The Commission’s programs are funded primarily by taxes levied by the State of California on tobacco products. A governing board of nine members, which are appointed by the County Board of Supervisors, oversees the Commission. Three members are considered Mandatory Members, comprised of representatives of the County Health Care Agency, Social Services Agency and Board of Supervisors. Other members are considered At-Large Members. The Board of Supervisors Mandatory Member serves for a one-year term without limitation on the number of terms he/she may serve. Other Mandatory Members serve until removed by the Board of Supervisors. At-Large Members serve for terms ranging from two to four years, not to exceed eight consecutive years. The County Board of Supervisors may remove any Commission Member at any time. The Commission is considered a component unit of the County of Orange. Upon termination of the commission, all assets of the Commission shall be returned to the State of California. The liabilities of the Commission shall not become liabilities of the County upon either termination of the Commission or the liquidation or disposition of the Commission’s remaining assets. Basis of Accounting and Measurement Focus The basic financial statements of the Commission are composed of the following:
Government-wide financial statements
Fund financial statements
Notes to the basic financial statements
Government-Wide Financial Statements Government-wide financial statements consist of the statement of net position and the statement of activities. These statements are presented on an economic resources measurement focus. All economic resources and obligations of the reporting government are reported in the financial statements. The government-wide financial statements have been prepared on the accrual basis of accounting. Under the accrual basis of accounting all assets and liabilities of the Commission are included on the statement of net position. The difference between the Commission’s assets and liabilities is its net position. Net position represent the resources the Commission has available for use in providing services. The Commission’s net position is classified as:
Net Investment in Capital Assets – This amount represents the Commission’s capital assets, net of accumulated depreciation.
Unrestricted – This category represents neither restrictions or invested in capital assets and may be used by the Commission for any purpose though they may not be necessarily liquid.
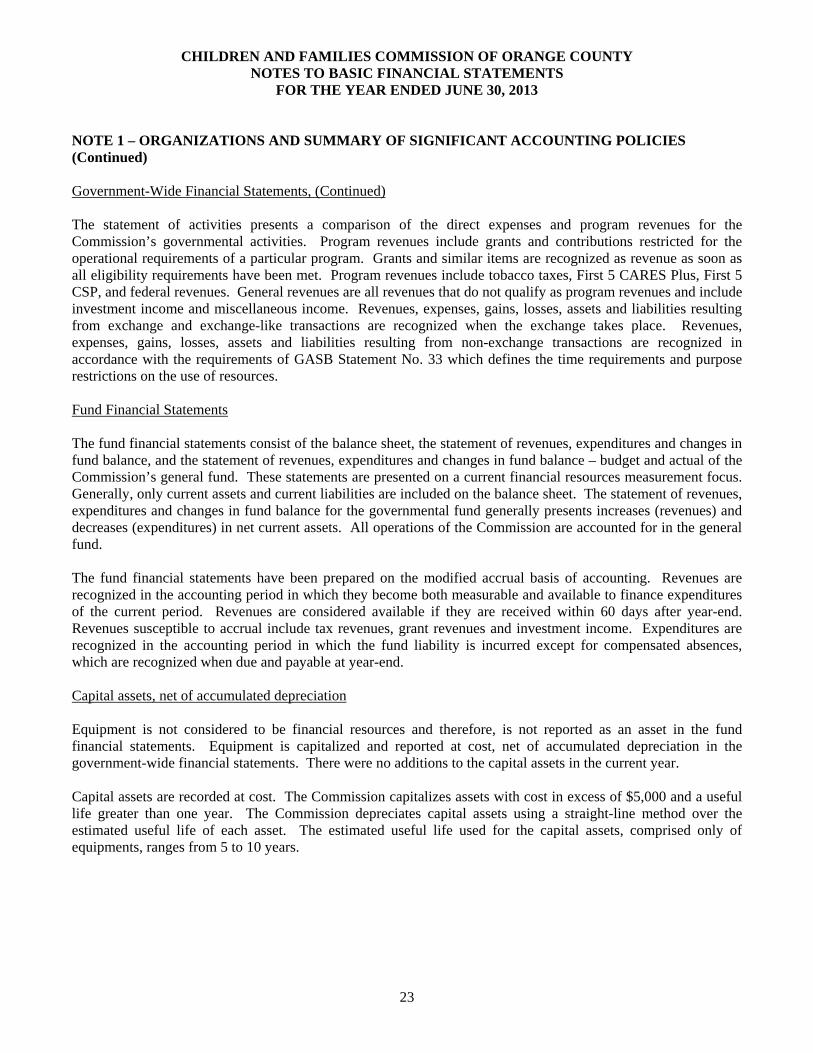
CHILDREN AND FAMILIES COMMISSION OF ORANGE COUNTY NOTES TO BASIC FINANCIAL STATEMENTS
FOR THE YEAR ENDED JUNE 30, 2013
23
NOTE 1 – ORGANIZATIONS AND SUMMARY OF SIGNIFICANT ACCOUNTING POLICIES (Continued) Government-Wide Financial Statements, (Continued) The statement of activities presents a comparison of the direct expenses and program revenues for the Commission’s governmental activities. Program revenues include grants and contributions restricted for the operational requirements of a particular program. Grants and similar items are recognized as revenue as soon as all eligibility requirements have been met. Program revenues include tobacco taxes, First 5 CARES Plus, First 5 CSP, and federal revenues. General revenues are all revenues that do not qualify as program revenues and include investment income and miscellaneous income. Revenues, expenses, gains, losses, assets and liabilities resulting from exchange and exchange-like transactions are recognized when the exchange takes place. Revenues, expenses, gains, losses, assets and liabilities resulting from non-exchange transactions are recognized in accordance with the requirements of GASB Statement No. 33 which defines the time requirements and purpose restrictions on the use of resources. Fund Financial Statements The fund financial statements consist of the balance sheet, the statement of revenues, expenditures and changes in fund balance, and the statement of revenues, expenditures and changes in fund balance – budget and actual of the Commission’s general fund. These statements are presented on a current financial resources measurement focus. Generally, only current assets and current liabilities are included on the balance sheet. The statement of revenues, expenditures and changes in fund balance for the governmental fund generally presents increases (revenues) and decreases (expenditures) in net current assets. All operations of the Commission are accounted for in the general fund. The fund financial statements have been prepared on the modified accrual basis of accounting. Revenues are recognized in the accounting period in which they become both measurable and available to finance expenditures of the current period. Revenues are considered available if they are received within 60 days after year-end. Revenues susceptible to accrual include tax revenues, grant revenues and investment income. Expenditures are recognized in the accounting period in which the fund liability is incurred except for compensated absences, which are recognized when due and payable at year-end. Capital assets, net of accumulated depreciation Equipment is not considered to be financial resources and therefore, is not reported as an asset in the fund financial statements. Equipment is capitalized and reported at cost, net of accumulated depreciation in the government-wide financial statements. There were no additions to the capital assets in the current year. Capital assets are recorded at cost. The Commission capitalizes assets with cost in excess of $5,000 and a useful life greater than one year. The Commission depreciates capital assets using a straight-line method over the estimated useful life of each asset. The estimated useful life used for the capital assets, comprised only of equipments, ranges from 5 to 10 years.

CHILDREN AND FAMILIES COMMISSION OF ORANGE COUNTY NOTES TO BASIC FINANCIAL STATEMENTS
FOR THE YEAR ENDED JUNE 30, 2013
24
NOTE 1 – ORGANIZATIONS AND SUMMARY OF SIGNIFICANT ACCOUNTING POLICIES (Continued) Adjustments Between Fund Financial Statements and Government-Wide Financial Statements Deferred Revenue Under the modified accrual basis of accounting, revenue is recognized in the fund financial statements if it has been collected after year-end within the Commission’s established availability period of 60 days. All other accrued revenues due the Commission are deferred at year-end in the fund financial statements. Deferred revenue of $577,553 at June 30, 2013 was recognized as revenue in the government-wide financial statements. Long-Term Liabilities Compensated absence obligations are considered long-term in nature and are reported in the fund financial statements as expenditures in the period paid or when due and payable at year-end under the modified accrual basis of accounting. The compensated absences have been accrued in the government-wide financial statements and are included in long-term liabilities. The compensated absences are liquidated by the general fund. Deposits with Others The Deposits with Others account includes funds that were transferred or advanced to program providers, but the related services were not provided before June 30, 2013. Due to Other Governments Due to other governments represents amounts owed to grantees and governmental agencies for services provided to the Commission in accordance with the Commission’s strategic plan. Retentions Payable The Commission retains a percentage of amounts billed by grantees and vendors in accordance with executed contracts. Upon fulfilling the requirements of the grantee agreement or contract, the amounts are released. Use of Estimates The preparation of financial statements in conformity with generally accepted accounting principles in the United States requires management to make estimates and assumptions that affect the amounts reported in the financial statements and accompanying notes. Actual results could differ from those estimates. The Commission’s significant estimates are recorded in accounts payable and due to other governments and pertain to accruals for services provided by grantees and vendors but not invoiced as of June 30, 2013. Budget and Budget Reporting The Commission is required by County ordinance to prepare a budget each year based on estimates of revenues and expected expenditures. The Commission’s Board of Commissioners adopted an annual budget of expenditures for the year ended June 30, 2013, which is prepared on the modified accrual basis of accounting. The accompanying statement of revenues, expenditures and changes in fund balance – budget and actual includes the budgeted expenditures for the year, along with management’s estimate of revenues for the year. The legal level of budgetary control is at the total fund level.

CHILDREN AND FAMILIES COMMISSION OF ORANGE COUNTY NOTES TO BASIC FINANCIAL STATEMENTS
FOR THE YEAR ENDED JUNE 30, 2013
25
NOTE 1 – ORGANIZATIONS AND SUMMARY OF SIGNIFICANT ACCOUNTING POLICIES (Continued) Fund Balance GASB Statement No. 54, Fund Balance Reporting and Governmental Fund Type Definitions statement established fund balance classifications that comprise a hierarchy based primarily on the extent to which a government is bound to observe constraints imposed upon the use of the resources reported in governmental funds. The Commission established the following classifications and definitions of fund balance:
Nonspendable – Resources that cannot be spent because they are not in an expendable form (e.g. prepaid asset, inventory) or must be maintained intact (e.g. endowment principal). Restricted – Resources that are constrained to specific purposes by an external provider (e.g. grantors, contributors, governmental laws and regulations) or by constitutional provisions or enabling legislation. Committed – Resources with self-imposed limitations, evidenced by the Commission’s formal action (resolution), and require both the approval of the highest level of decision making authority (Board of Commissioners) and the same formal action to remove or modify the limitations. Includes legally enforceable multi-year contracts not yet spent, specific agreements approved but not yet executed. Assigned – Resources with self-imposed limitations but do not require approval by the highest level of decision making authority (may be a body, committee or individual designated by Board of Commissioners) or the same level of formal action to remove or modify limitations. Includes appropriation of a portion of existing fund balance sufficient to eliminate subsequent year’s budget deficit, resources assigned to specific program for which there is an approved budget, and resources approved by the Commission for a long range financial plan.
Unassigned – Resources that cannot be reported in any other classification. The Commission’s spending priority is to spend restricted fund balance first, followed by committed, assigned and unassigned fund balance.
Minimum Fund Balance Policy The policy of the Commission is to maintain a minimum fund balance equal to 25% of the Commission’s annual operating budget. The fund balance will be used to mitigate the impact on contracted services due to unanticipated circumstances and events, provide adequate resources for cash flow, and to mitigate short-term effects of revenue shortages. The amount of the minimum fund balance is subject to approval by the Board of Commissioners as part of the annual budget adoption. Encumbrances The Commission utilizes an encumbrance system as a management control technique to assist in controlling expenditures. Unencumbered appropriations lapse at the end of the fiscal year.

CHILDREN AND FAMILIES COMMISSION OF ORANGE COUNTY NOTES TO BASIC FINANCIAL STATEMENTS
FOR THE YEAR ENDED JUNE 30, 2013
26
NOTE 1 – ORGANIZATIONS AND SUMMARY OF SIGNIFICANT ACCOUNTING POLICIES (Continued) Effect of New Governmental Accounting Standards Board (GASB) Pronouncements GASB Statement No. 60 – In December 2010, GASB issued Statement No. 60, Accounting and Financial Reporting for Service Concession Arrangements. This statement is to improve financial reporting by addressing issues related to service concession arrangements. This statement was effective July 1, 2012. The Commission has determined that this statement did not have a material impact on the financial statements. GASB Statement No. 61 – In December 2010, GASB issued Statement No. 61, The Financial Reporting Entity: Omnibus. The objective of this statement is to improve financial reporting for governmental financial reporting entities. This statement modifies certain requirements for inclusion of component units in the financial reporting entity and amends the criteria for reporting component units as if they were a part of the primary government in certain circumstances. This statement was effective July 1, 2012. The Commission has determined that this statement does not have a material impact on the financial statements. GASB Statement No. 62 – In June 2011, GASB issued Statement No. 62, Codification of Accounting and Financial Reporting Guidance Contained in Pre-November 30, 1989 FASB and AICPA Pronouncements. The objective of this statement is to incorporate into the GASB’s authoritative literature certain accounting and financial reporting guidance that is included in FASB and AICPA pronouncements issued on or before November 30, 1989 which does not conflict with our contradict GASB pronouncements. This statement was effective July 1, 2012. The Commission has determined that this statement did not have a material impact on the financial statements. GASB Statement No. 63, Financial Reporting of Deferred Outflows of Resources, Deferred Inflows of Resources, and Net Position, was issued in June 30, 2011. This statement provides financial reporting guidance for deferred outflows of resources and deferred inflows of resources. This statement also amends the net asset reporting requirements in Statement No. 34, Basic Financial Statements—and Management’s Discussion and Analysis—for State and Local Governments, and other pronouncements by incorporating deferred outflows of resources and deferred inflows of resources into the definitions of the required components of the residual measure and by renaming that measure as net position, rather than net assets. The Commission implemented this statement effective July 1, 2012. GASB Statement No. 65 – In March 2012, GASB issued Statement No. 65, Items Previously Reported as Assets and Liabilities. This statement establishes accounting and financial reporting standards that reclassify, as deferred outflows of resources, certain items that were previously reported as assets and liabilities and recognizes, as outflows of resources or inflows of resources, certain items that were previously reported as assets and liabilities. This statement is effective for periods beginning after December 15, 2012. The Commission has not determined the effect of this statement. GASB Statement No. 66 – In March 2012, GASB issued Statement No. 66, Technical Corrections – 2012 – an amendment of GASB Statement No. 10 and No. 62. This statement is to improve accounting and financial reporting for a governmental financial reporting entity by resolving conflicting guidance that resulted from the issuance of two pronouncements, Statement No. 54, Fund Balance Reporting and Governmental Fund Type Definitions, and No. 62, Codification of Accounting and Financial Reporting Guidance Contained in Pre-November 30, 1989 FASB and AICPA Pronouncements. This statement is effective for financial statements beginning after December 15, 2012. The Commission has not determined the effect of this statement.

CHILDREN AND FAMILIES COMMISSION OF ORANGE COUNTY NOTES TO BASIC FINANCIAL STATEMENTS
FOR THE YEAR ENDED JUNE 30, 2013
27
NOTE 1 – ORGANIZATIONS AND SUMMARY OF SIGNIFICANT ACCOUNTING POLICIES (Continued) Effect of New Governmental Accounting Standards Board (GASB) Pronouncements (Continued) GASB Statement No. 67 – In June 2012, GASB issued Statement No. 67, Financial Reporting for Pension Plans – an amendment of GASB Statement No. 25. This statement results from a comprehensive review of the effectiveness of existing standards of accounting and financial reporting for pensions with regard to providing decision-useful information, supporting assessments of accountability and interperiod equity, and creating additional transparency. This statement is effective June 30, 2014. The Commission has not determined the effect of this statement. GASB Statement No. 68 – In June 2012, GASB issued Statement No. 68, Accounting and Financial Reporting for Pensions – an amendment of GASB Statement No. 27. This Statement replaces the requirements of Statements No. 27 and No. 50 related to pension plans that are administered through trusts or equivalent arrangements. The requirements of Statements No. 27 and No. 50 remain applicable for pensions that are not administered as trusts or equivalent arrangements. The requirements of this Statement are effective for financial statements for fiscal years beginning after June 15, 2014. The Commission has not determined the effect of this statement. GASB Statement No. 69 – In January 2013, GASB issued Statement No. 69, Government Combinations and Disposals of Government Operations. This Statement establishes accounting and financial reporting standards related to government combinations and disposals of government operations. This Statement is effective for periods beginning after December 31, 2013. The Commission has not determined the effect of this statement. GASB Statement No. 70 – In April 2013, GASB issued Statement No. 70, Accounting and Financial Reporting for Nonexchange Financial Guarantees. This Statement improves accounting and financial reporting by state and local governments that extend and receive nonexchange financial guarantees. This Statement is effective for periods beginning after June 15, 2013. The Commission has not determined the effect of this statement. NOTE 2 – CASH AND INVESTMENTS Cash and investments are classified in the financial statements as follows: Cash and investments in County Treasury 69,280,830$ Imprest Cash 15,000
Total Cash and Investments 69,295,830$
Cash and investments consisted of the following at June 30, 2013: Orange County Investment Pool:
Equity in pooled Money Market fund 69,280,830$ Imprest Cash 15,000
Total Cash and Investments 69,295,830$
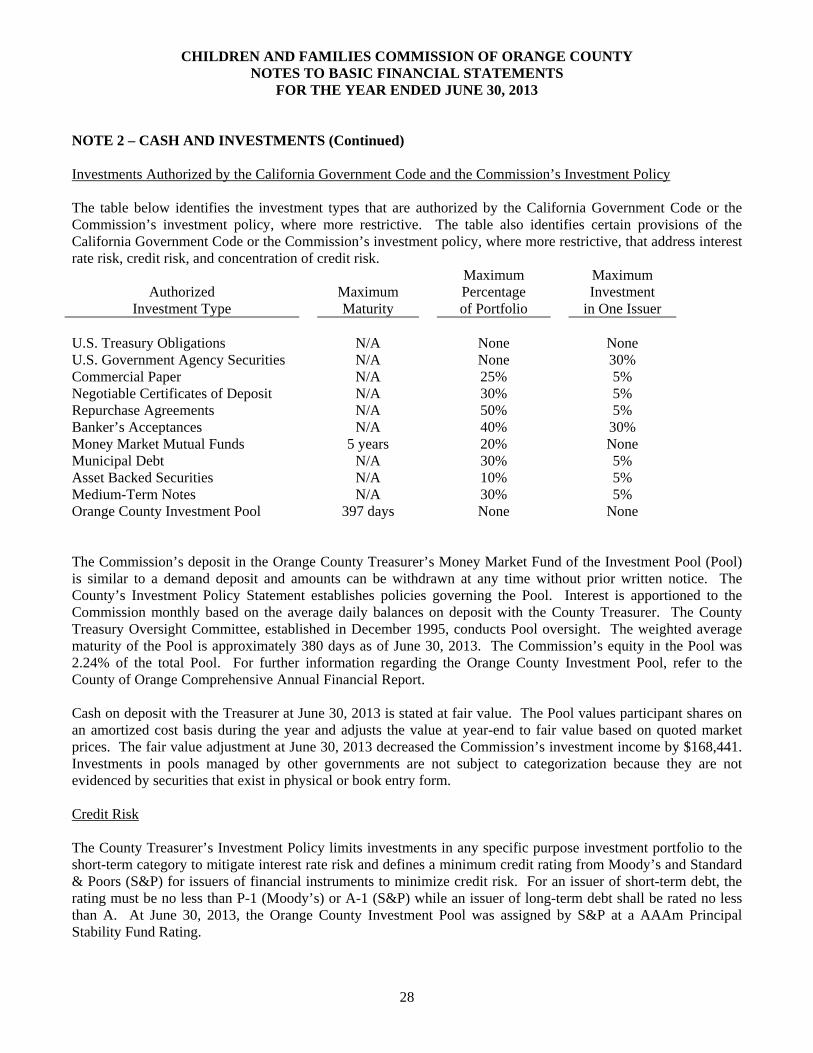
CHILDREN AND FAMILIES COMMISSION OF ORANGE COUNTY NOTES TO BASIC FINANCIAL STATEMENTS
FOR THE YEAR ENDED JUNE 30, 2013
28
NOTE 2 – CASH AND INVESTMENTS (Continued) Investments Authorized by the California Government Code and the Commission’s Investment Policy The table below identifies the investment types that are authorized by the California Government Code or the Commission’s investment policy, where more restrictive. The table also identifies certain provisions of the California Government Code or the Commission’s investment policy, where more restrictive, that address interest rate risk, credit risk, and concentration of credit risk.
Authorized Investment Type
Maximum Maturity
Maximum Percentage of Portfolio
Maximum Investment
in One Issuer U.S. Treasury Obligations U.S. Government Agency Securities
N/A N/A
None None
None 30%
Commercial Paper Negotiable Certificates of Deposit Repurchase Agreements Banker’s Acceptances Money Market Mutual Funds Municipal Debt Asset Backed Securities Medium-Term Notes Orange County Investment Pool
N/A N/A N/A N/A
5 years N/A N/A N/A
397 days
25% 30% 50% 40% 20% 30% 10% 30% None
5% 5% 5%
30% None 5% 5% 5%
None
The Commission’s deposit in the Orange County Treasurer’s Money Market Fund of the Investment Pool (Pool) is similar to a demand deposit and amounts can be withdrawn at any time without prior written notice. The County’s Investment Policy Statement establishes policies governing the Pool. Interest is apportioned to the Commission monthly based on the average daily balances on deposit with the County Treasurer. The County Treasury Oversight Committee, established in December 1995, conducts Pool oversight. The weighted average maturity of the Pool is approximately 380 days as of June 30, 2013. The Commission’s equity in the Pool was 2.24% of the total Pool. For further information regarding the Orange County Investment Pool, refer to the County of Orange Comprehensive Annual Financial Report. Cash on deposit with the Treasurer at June 30, 2013 is stated at fair value. The Pool values participant shares on an amortized cost basis during the year and adjusts the value at year-end to fair value based on quoted market prices. The fair value adjustment at June 30, 2013 decreased the Commission’s investment income by $168,441. Investments in pools managed by other governments are not subject to categorization because they are not evidenced by securities that exist in physical or book entry form. Credit Risk The County Treasurer’s Investment Policy limits investments in any specific purpose investment portfolio to the short-term category to mitigate interest rate risk and defines a minimum credit rating from Moody’s and Standard & Poors (S&P) for issuers of financial instruments to minimize credit risk. For an issuer of short-term debt, the rating must be no less than P-1 (Moody’s) or A-1 (S&P) while an issuer of long-term debt shall be rated no less than A. At June 30, 2013, the Orange County Investment Pool was assigned by S&P at a AAAm Principal Stability Fund Rating.

CHILDREN AND FAMILIES COMMISSION OF ORANGE COUNTY NOTES TO BASIC FINANCIAL STATEMENTS
FOR THE YEAR ENDED JUNE 30, 2013
29
NOTE 3 – DUE FROM OTHER GOVERNMENTS The due from other governments account represents amounts due to the Commission from the California Children and Families Commission (“State Commission”) for Prop 10 related revenues and other governmental agencies. The amounts due to the Commission at June 30, 2013, were as follows: Due from State Commission:
Prop 10 revenue for:May 2013 2,363,228$ June 2013 2,545,910
Surplus Money Investment Fund Allocations 9,588 First 5 CARES Plus Program 310,246 First 5 Child Signature Program 90,171
Due from other governmental agencies for:Medi-Cal Administrative Activities (MAA) 143,954 ARRA Health Research Grant 223,120 Vista funds 149,947
Total Due from Other Governments 5,836,164$
NOTE 4 – DUE TO OTHER GOVERNMENTS The due to other governments account represents amounts due to the State of California and other local governmental agencies. The amounts due to the other governments at June 30, 2013, were as follows: Due to local government agencies:
FY 2012-2013 Contract Payment Accruals 3,673,252$
Total Due to Other Governments 3,673,252$
NOTE 5 – COMPENSATED ABSENCES The vested compensated absences liability balance at June 30, 2013 consists of the following activity:
Balance Balance Due WithinJuly 1, 2012 Increases Decreases June 30, 2013 One Year
134,347$ 161,881$ 165,408$ 130,818$ 77,336$

CHILDREN AND FAMILIES COMMISSION OF ORANGE COUNTY NOTES TO BASIC FINANCIAL STATEMENTS
FOR THE YEAR ENDED JUNE 30, 2013
30
NOTE 6 – FUND BALANCE Fund balance is classified using a hierarchy based primarily on the extent to which a government is bound to observe constraints imposed upon the use of the resources reported in governmental funds. Fund balance at June 30, 2013 consists of the following:
June 30, 2013Nonspendable:
Prepaid retirements 243,435$ Deposits with Others 5,624,041
Committed for:Contractual obligations 44,990,092
Assigned for:Budgeted programs 21,350,266
Total Due from Other Governments 71,964,399$
Fund Balance Category Descriptions Nonspendable – consists of prepaid retirement contributions for FY 2013-2014. Refer to Note 8 for further details. Also included are the amounts transferred to contractors for services not provided by June 30, 2013. Committed for contractual obligations – consists of contract amounts approved by Commission action as of June 30, 2013 for FY 2013-2014 and future years of Commission Round 1 and 2 Catalytic funding. Assigned for budgeted programs – consists of FY 2013-2014 contracts that were approved by Commission action and included in the FY 2013-2014 Operating Budget. NOTE 7 – CONTINGENCIES The Commission is involved in various legal proceedings from time to time in the normal course of business. In management’s opinion, the Commission is not involved in any legal proceeding that will have a material adverse effect on financial position or changes in financial position of the Commission. NOTE 8 – DEFINED BENEFIT PENSION PLAN Plan Description. All full-time employees of the Commission participate in the Orange County Employees Retirement System (OCERS), which is a cost-sharing, multiple-employer, defined benefit pension plan. OCERS provides for retirement, death, disability and cost-of-living benefits, and is subject to the provisions of the County Employees Retirement Act of 1937 and other applicable statutes.

CHILDREN AND FAMILIES COMMISSION OF ORANGE COUNTY NOTES TO BASIC FINANCIAL STATEMENTS
FOR THE YEAR ENDED JUNE 30, 2013
31
NOTE 8 – DEFINED BENEFIT PENSION PLAN (Continued) Members employed by the County of Orange or a participating agency prior to September 21, 1979, are designated as Tier I members. Members employed after September 21, 1979 are designated as Tier II members. The establishment of Tier II resulted in a reduced allowance beginning at age 50. A member’s retirement allowance is based upon the member’s age at retirement, final compensation and the total years of service under the system. If an employee terminates before rendering five years of service under the system, the employee forfeits the right to receive benefits and is entitled to withdraw employee contributions made together with accumulated interest. If an employee terminates after five years of service, the employee may elect to leave the accumulated deposits in the retirement fund and be granted a deferred retirement allowance at the time the member would have been entitled to the allowance if service had been continued. OCERS issues a stand-alone annual financial report, which can be obtained by writing to the Orange County Employees Retirement System, 2223 Wellington Avenue, Santa Ana, California 92702. Funding Policy. In accordance with County Board of Supervisors resolutions establishing contribution rates, the Commission makes periodic contributions to OCERS in amounts such that, when combined with employees’ contributions and investment income, will fully provide for all employees’ benefits by the time they retire. The Commission’s contribution rate as a percentage of payroll for General members was 28.80% for the year ended June 30, 2013. Members are required to contribute a percentage of their annual compensation to OCERS as a condition of employment. For Tier I members, the normal rate of contribution is based on the member’s age at entry in OCERS, and is calculated to provide an annual annuity equal to 1/200 of the member’s “final compensation” for each year of service rendered at age 60 for General members. For Tier II General members, the rate of contribution is calculated to provide an annual annuity equal to 1/120 of the member’s “final compensation” for each year of service rendered at age 60. The member average contribution rate was approximately 6.45% for the year ended June 30, 2013. The Commission’s annual required contribution to OCERS was $345,038 for the year ended June 30, 2013. The Commission’s actual and actuarially required contributions were as follows:
Fiscal Year Ending
Annual Required Contributions
(ARC)Percentage of
ARC Contributed6/30/2011 431,625$ 100.00%6/30/2012 412,774 100.00%6/30/2013 345,038 100.00%
Prepayment of 2013-2014 contributions. In August 2012, the OCERS Board of Retirement authorized the offer of a 7.75% discount to plan sponsors for the early payment of their employer contributions for FY 2013-2014. Subsequently, the Commission authorized the pre-payment of $270,213 in January 2013. As of June 30, 2013, $243,435 remained in the prepayment account and will be applied towards the Commission’s employer required OCERS contributions for FY 2013-2014.

CHILDREN AND FAMILIES COMMISSION OF ORANGE COUNTY NOTES TO BASIC FINANCIAL STATEMENTS
FOR THE YEAR ENDED JUNE 30, 2013
32
NOTE 9 – COMMITMENTS The Commission leases office space from a third party under a long-term operating lease. The latest lease expires on October 31, 2016 (FY 2016-17). The future minimum rental payments due under the lease are as follows.
FY 2013-14 111,470$ FY 2014-15 68,607 FY 2015-16 68,607 FY 2016-17 22,869
271,553$
Rent expense was $197,196 for the year ended June 30, 2013. NOTE 10 – RELATED PARTY TRANSACTIONS The Commission contracts with the County to provide accounting, banking and investment, purchasing, human resources, risk management and other administrative services. The Commission participates in the County’s risk management programs (commercial and self-insurance programs) for general and automobile liability insurance, public official liability, rental interruption, personal property, worker’s compensation, group health indemnified plans, group salary continuance plan, group dental plan and unemployment benefit plan. The Commission records its portion of related insurance premiums charged by the County as an expense. Insurance expense for the year ended June 30, 2013 was $60,895. The Commission incurred expenses totaling $569,307 for all other County services provided during the year ended June 30, 2013. The amount owed to the County of Orange for related party transactions at June 30, 2013 was $9,593. The Commission paid $1,688,636 of service provider grants to organizations which are represented by two members of the Board of Commissioners, although both members abstain from all votes regarding funding to the organization represented. NOTE 11 – PROGRAM EVALUATION In accordance with the Standards and Procedures for Audits of California Counties Participating in the California Children and Families Program, issued by the California State Controller, the Commission is required to disclose the amounts expended during the fiscal year on program evaluation. Program evaluation costs pertain to those activities undertaken to support the collection, production, analysis and presentation of evaluation information for Commission management, Commissioners and other interested parties. For the year ended June 30, 2013, the Commission expended $894,496 for program evaluation.

CHILDREN AND FAMILIES COMMISSION OF ORANGE COUNTY NOTES TO BASIC FINANCIAL STATEMENTS
FOR THE YEAR ENDED JUNE 30, 2013
33
NOTE 12 – RETIREE MEDICAL PLAN – OTHER POSTEMPLOYMENT BENEFITS Plan Description. In accordance with the Commission’s participation agreement entered into in July 2007, the Commission is a participant in the County of Orange Retiree Medical Plan (the Plan). The County of Orange has established the Plan as a single-employer defined benefit retiree medical plan. The Plan provides a grant for medical benefits to eligible retirees and their dependents and lump-sum payments for employees separating from employment prior to being eligible for the grant. The County Board of Supervisors maintains the authority to establish and amend the Plan’s benefit provisions. The financial statements and required supplementary information of the Plan are included in the County of Orange’s fiscal year 2012-2013 Comprehensive Annual Financial Report (CAFR). The Commission is reported in the County’s CAFR as a discretely presented component unit. That report may be obtained by contacting the County of Orange, Auditor Controller, 12 Civic Center Plaza, Room 200, Santa Ana, California 92702. Funding Policy. The contribution requirements of plan members and the Commission are those established for the County of Orange and may be amended by the County Board of Supervisors. For the fiscal year ended June 30, 2013, the Commission was required to contribute 3.32% of covered payroll. The contractually required contribution was determined by the County of Orange, as the percentage actuarially determined in accordance with the parameters of GASB 45. The Annual Required Contribution (ARC) represents a level of funding that , if paid on an ongoing basis, is projected to cover normal cost each year and amortize any unfunded actuarial liabilities (or funding excess) of the plan over a period of thirty years. The Commission’s contributions to the Plan for the fiscal year ended June 30, 2013 were $42,646 which equaled the required contributions.
Fiscal Year Ending
Annual Required Contributions
(ARC)Percentage of
ARC Contributed6/30/2011 38,023$ 100.00%6/30/2012 33,639 100.00%6/30/2013 42,646 100.00%
Plan members are currently not required to contribute to the plan but retirees are required to pay for the cost of retiree medical benefits in excess of their grant amount. For additional details, actuarial assumptions, funded status of the plan and required supplementary information refer to the County’s CAFR. NOTE 13 – FIRST 5 CALIFORNIA CARES PLUS AND CHILD SIGNATURE PROGRAM CARES Plus is designed to improve the quality of early learning programs by focusing on increasing the quality, effectiveness, and retention of early educators. As a statewide professional development program, its main objectives are to improve both the quality of early learning programs, and ultimately, learning and developmental outcomes for young children. Commission claimed $310,246 in CARES Plus Phase II reimbursable expenses for the period ending June 30, 2013. Phase II funds have three to one Commission match to each dollar of First 5 funding. The Child Signature Program primary purpose in Orange County is to increase quality in early learning programs for children zero to five in identified Early Childhood Education centers where the educational divide is greatest. The program focuses on providing quality improvement support through training and technical assistance to local centers. The Commission participated in Child Signature Program (CSP) RFA #2 and claimed reimbursable expenses of $90,171 to First 5 California for the period ending June 30, 2013.

OTHER SUPPLEMENTARY INFORMATION

CHILDREN AND FAMILIES COMMISSION OF ORANGE COUNTY SCHEDULE OF FIRST 5 CALIFORNIA FUNDING
YEAR ENDED JUNE 30, 2013
34
First 5 California Program Funding Revenue Program Title F5CA Funds Expenditures CARES Plus Phase II F5CA Program Funds $310,246 $310,246 County, Local Funds 930,738 930,738 CSP RFA #2 F5CA Program Funds 90,171 90,171 County, Local Funds - - * For the purpose of this schedule, the revenue reported, in amount of $310,246 for CARES Plus Phase II and $90,171for Child Signature Program RFA 2 represents the amount claimed by the Commission. For financial reporting purposes, this amount was included in deferred revenue as it did not meet the Commission’s period of availability as described in Note 1.

CHILDREN AND FAMILIES COMMISSION OF ORANGE COUNTY STATISTICAL SECTION
(UNAUDITED)
35
The information in this section is not covered by the Independent Auditor’s Report, but it is presentedas supplemental data for the benefit of the readers of the comprehensive annual financial report. Theobjectives of statistical section information are to provide financial statement users with additionaldetailed information as a context for understanding what the financial statements, notes to financialstatements, and required supplementary information say about the Commission's economic condition.
PagesFinancial TrendsThese schedules contain trend information to help the reader understand how the 36Commission’s financial performance and well-being have changed over time.
Revenue CapacityThese schedules contain trend information to help the reader assess the Commission’s 44most significant revenue base.
Demographic InformationThese schedules offer economic and demographic indicators to help the reader 47understand how the information in the Commission’s financial report relates to theservices the Commission provides and the activities it performs.
Operating InformationThis schedule contains infrastructure data to help the reader understand how the 50Information in the Commission’s financial report relates to the services theCommission performs.
Sources: Unless otherwise noted, the information in these schedules is derived from thecomprehensive annual financial reports for the relevant years.
(1) Since certain data (i.e. total personal income , per capita personal income and unemployment)
are not considered relevant to Commission operations, substitute information specific to theCommission is presented.
CHILDREN AND FAMILIES COMMISSION OF ORANGE COUNTYSTATISTICAL SECTION (1)
(UNAUDITED)

CHILDREN AND FAMILIES COMMISSION OF ORANGE COUNTY NET POSITION BY COMPONENT
LAST NINE FISCAL YEARS*
36
2013 2012 2011 2010
Net investment in capital assets -$ -$ 235$ 798$
Unrestricted 72,411,134 78,985,485 30,063,595 102,842,804
Total net position 72,411,134$ 78,985,485$ 30,063,830$ 102,843,602$
* Statistical information is presented as of the first fiscal year that GASB 34 was implemented.
Fiscal Year

37
2009 2008 2007 2006 2005
2,301$ 5,121$ 7,942$ 11,419$ 16,213$
122,720,258 142,142,025 151,578,753 152,265,738 146,184,260
122,722,559$ 142,147,146$ 151,586,695$ 152,277,157$ 146,200,473$
Fiscal Year

CHILDREN AND FAMILIES COMMISSION OF ORANGE COUNTY CHANGES IN NET POSITION LAST NINE FISCAL YEARS*
38
2013 2012 2011 2010
Expenses:Governmental activities:
Salaries and benefits 1,704,815 2,094,872 2,290,308 2,415,467 Expenses related to "Zero to 33,341,947 31,129,369 49,431,678 46,836,184 Services and supplies for State 6,844,534
Extraordinary Item: Accrual of AB99 liability
51,369,439
Total expenses 35,046,762 33,224,241 103,091,425 56,096,185
Program revenues:Governmental activities:
Operating grants and contributionsProp 10 Tobacco taxes 27,024,505$ 28,988,350$ 28,809,921$ 29,706,126$ Prop 10 State School Readiness 4,349,489 First 5 CARES Plus 237,504 435,487 First 5 Child Signature Program 90,171 Other State operating grants and 145,834 Federal operating grants 668105 592,725 641,124 752,152
General revenuesInvestment income earned on 9,588 11,612 15,331 82,000 Investment income 122,358 481,976 818,294 1,141,118 Other revenue 320,180 265,632 26,983 40,509
Extraordinary Item: Reversal of AB99 liability
51,369,439
Total revenues 28,472,411$ 82,145,221$ 30,311,653$ 36,217,228$
Net (expense) revenue (6,574,351)$ 48,920,980$ (72,779,772)$ (19,878,957)$
* Statistical information is presented as of the first fiscal year that GASB 34 was implemented.
Fiscal Year

39
2009 2008 2007 2006 2005
2,439,415 2,323,471 2,258,080 2,241,058 1,675,442 54,377,591 51,331,591 42,972,440 36,171,992 46,969,598 5,660,307 5,959,517 5,856,371 4,921,544 4,232,963
62,477,313 59,614,579 51,086,891 43,334,594 52,878,003
33,396,055$ 35,494,096$ 37,356,314$ 39,332,323$ 40,175,154$ 4,294,144 4,114,774 1,706,125 2,554,681 3,698,878
104,166 352,597 669,897 330,598 476,537 1,020,269 1,020,556 2,237,302 307,741 4,601,132
82,479 190,332 430,669 203,588 871,949 3,944,954 8,854,562 7,954,594 6,506,090 3,499,075
210,659 148,113 41,527 176,257 210,602
43,052,726$ 50,175,030$ 50,396,428$ 49,411,278$ 53,533,327$
(19,424,587)$ (9,439,549)$ (690,463)$ 6,076,684$ 655,324$
Fiscal Year
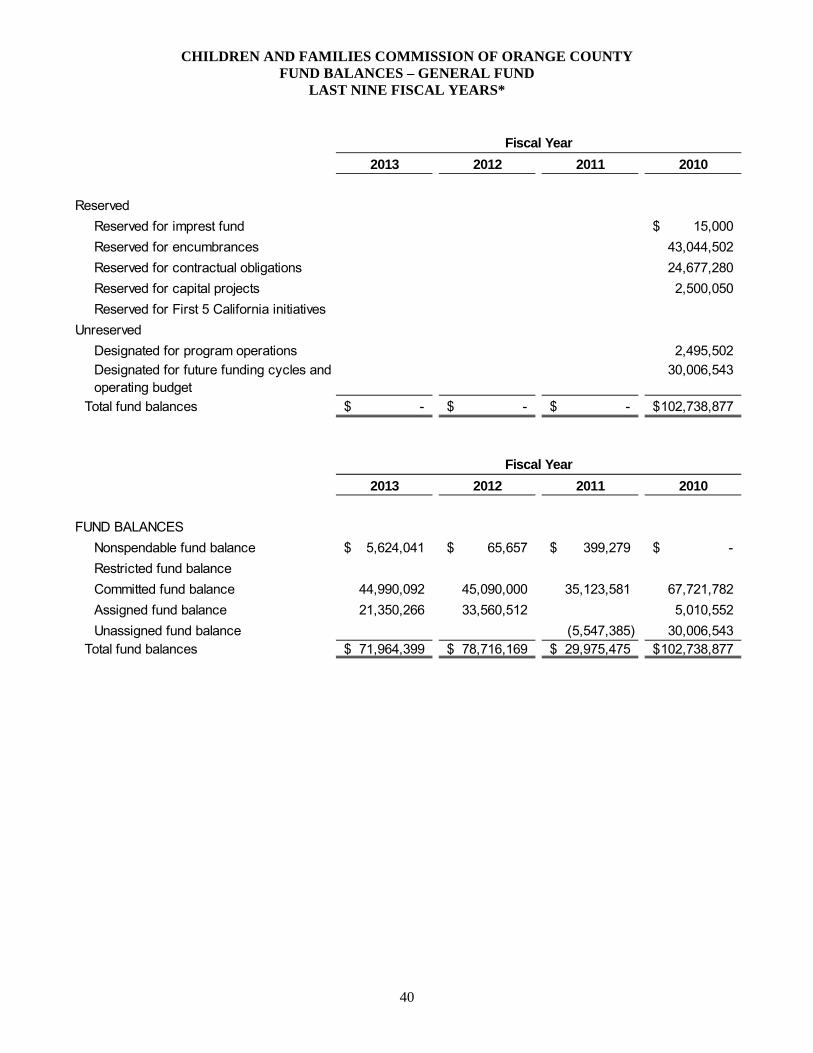
CHILDREN AND FAMILIES COMMISSION OF ORANGE COUNTY FUND BALANCES – GENERAL FUND
LAST NINE FISCAL YEARS*
40
2013 2012 2011 2010
Reserved
Reserved for imprest fund 15,000$
Reserved for encumbrances 43,044,502
Reserved for contractual obligations 24,677,280
Reserved for capital projects 2,500,050
Reserved for First 5 California initiatives
Unreserved
Designated for program operations 2,495,502
Designated for future funding cycles and operating budget
30,006,543
Total fund balances -$ -$ -$ 102,738,877$
2013 2012 2011 2010
FUND BALANCES
Nonspendable fund balance 5,624,041$ 65,657$ 399,279$ -$
Restricted fund balance
Committed fund balance 44,990,092 45,090,000 35,123,581 67,721,782
Assigned fund balance 21,350,266 33,560,512 5,010,552
Unassigned fund balance (5,547,385) 30,006,543 Total fund balances 71,964,399$ 78,716,169$ 29,975,475$ 102,738,877$
Fiscal Year
Fiscal Year
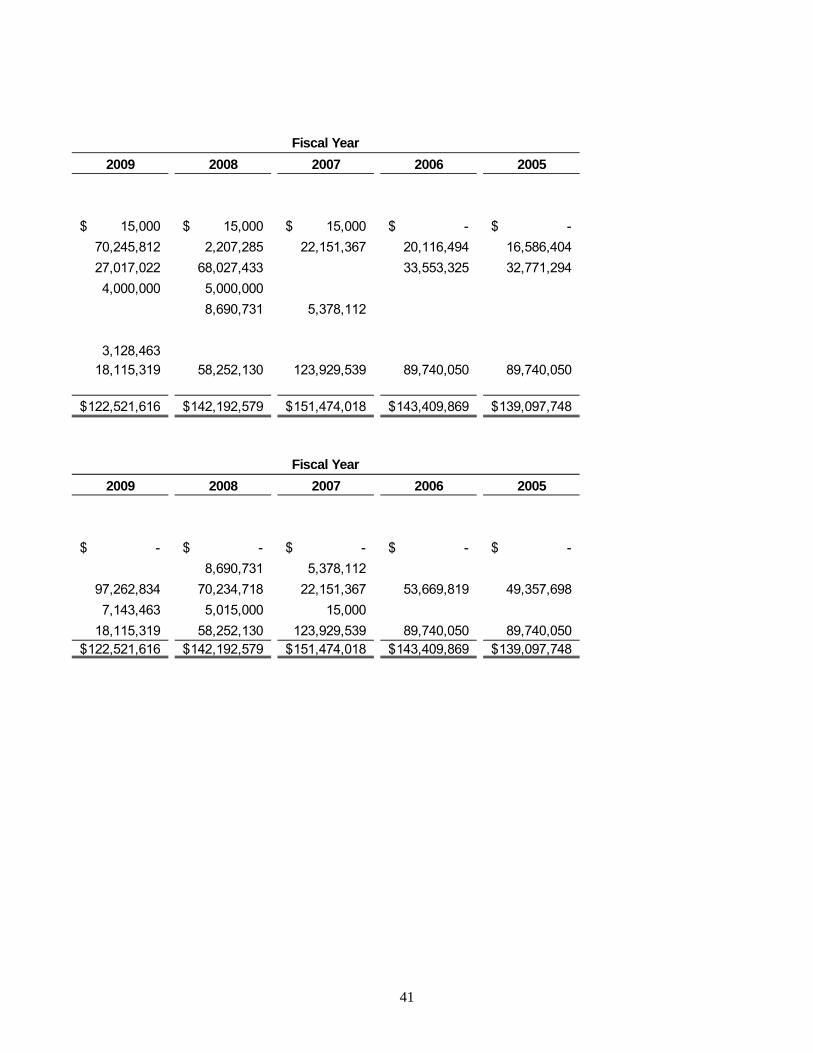
41
2009 2008 2007 2006 2005
15,000$ 15,000$ 15,000$ -$ -$
70,245,812 2,207,285 22,151,367 20,116,494 16,586,404
27,017,022 68,027,433 33,553,325 32,771,294
4,000,000 5,000,000
8,690,731 5,378,112
3,128,463
18,115,319 58,252,130 123,929,539 89,740,050 89,740,050
122,521,616$ 142,192,579$ 151,474,018$ 143,409,869$ 139,097,748$
2009 2008 2007 2006 2005
-$ -$ -$ -$ -$
8,690,731 5,378,112
97,262,834 70,234,718 22,151,367 53,669,819 49,357,698
7,143,463 5,015,000 15,000
18,115,319 58,252,130 123,929,539 89,740,050 89,740,050 122,521,616$ 142,192,579$ 151,474,018$ 143,409,869$ 139,097,748$
Fiscal Year
Fiscal Year
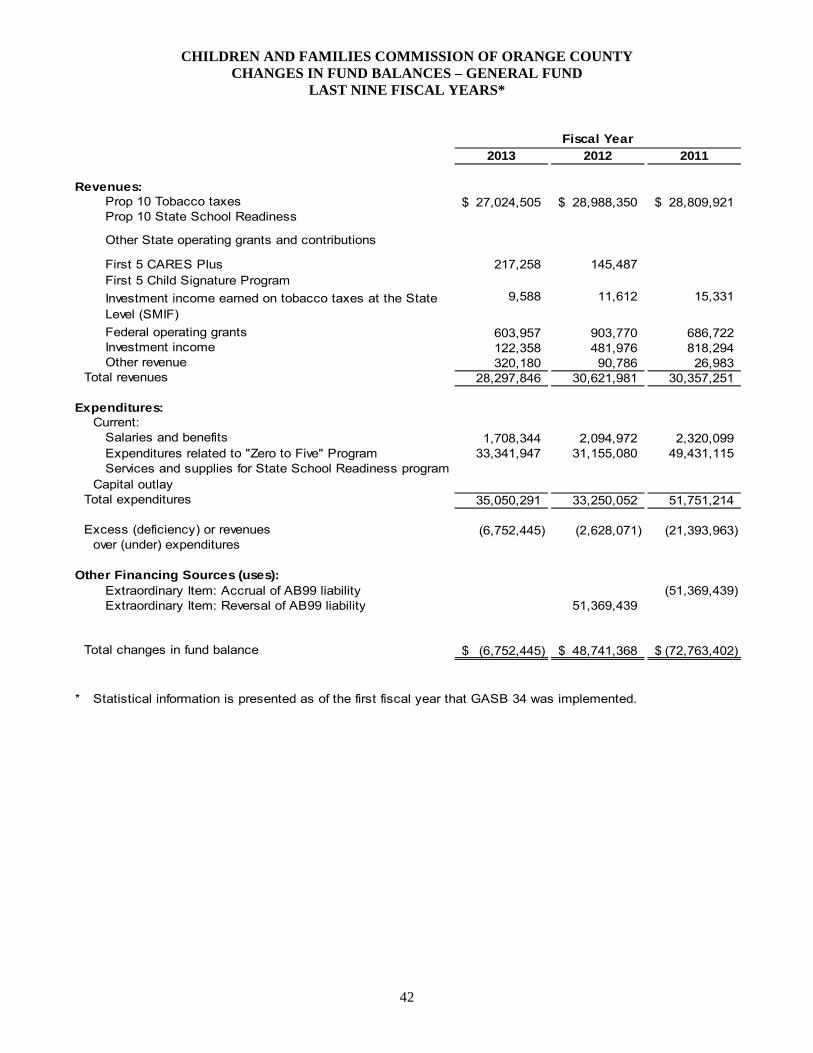
CHILDREN AND FAMILIES COMMISSION OF ORANGE COUNTY CHANGES IN FUND BALANCES – GENERAL FUND
LAST NINE FISCAL YEARS*
42
2013 2012 2011
Revenues:Prop 10 Tobacco taxes 27,024,505$ 28,988,350$ 28,809,921$ Prop 10 State School Readiness
Other State operating grants and contributions
First 5 CARES Plus 217,258 145,487 First 5 Child Signature Program
Investment income earned on tobacco taxes at the State Level (SMIF)
9,588 11,612 15,331
Federal operating grants 603,957 903,770 686,722 Investment income 122,358 481,976 818,294 Other revenue 320,180 90,786 26,983
Total revenues 28,297,846 30,621,981 30,357,251
Expenditures:Current:
Salaries and benefits 1,708,344 2,094,972 2,320,099 Expenditures related to "Zero to Five" Program 33,341,947 31,155,080 49,431,115 Services and supplies for State School Readiness program
Total expenditures 35,050,291 33,250,052 51,751,214
Excess (deficiency) or revenues (6,752,445) (2,628,071) (21,393,963) over (under) expenditures
Other Financing Sources (uses):Extraordinary Item: Accrual of AB99 liability (51,369,439) Extraordinary Item: Reversal of AB99 liability 51,369,439
Total changes in fund balance (6,752,445)$ 48,741,368$ (72,763,402)$
* Statistical information is presented as of the first fiscal year that GASB 34 was implemented.
Capital outlay
Fiscal Year

43
2010 2009 2008 2007 2006 2005
29,706,126$ 33,396,055$ 35,527,837$ 37,356,314$ 39,332,323$ 40,175,154$ 4,349,489 4,294,144 4,114,774 10,461,757
145,834 104,166 352,597 669,897 311,792 193,567
82,000 82,479 190,332 430,669 871,949
840,427 757,061 1,130,638 2,237,302 1,432,084 1,848,076 1,141,118 3,944,954 8,854,562 7,954,594 6,506,090 3,499,075
40,509 210,659 148,113 41,527 36,867 181,836 36,305,503 42,789,518 50,318,853 59,152,060 47,619,156 46,769,657
2,409,027 2,425,403 2,312,004 2,262,578 2,218,293 1,670,398 46,834,681 54,374,771 51,328,771 42,968,962 36,167,198 46,965,745 6,844,534 5,660,307 5,959,517 5,856,371 4,921,544 4,232,963
11,286 56,088,242 62,460,481 59,600,292 51,087,911 43,307,035 52,880,392
(19,782,739) (19,670,963) (9,281,439) 8,064,149 4,312,121 (6,110,735)
(19,782,739)$ (19,670,963)$ (9,281,439)$ 8,064,149$ 4,312,121$ (6,110,735)$
Fiscal Year
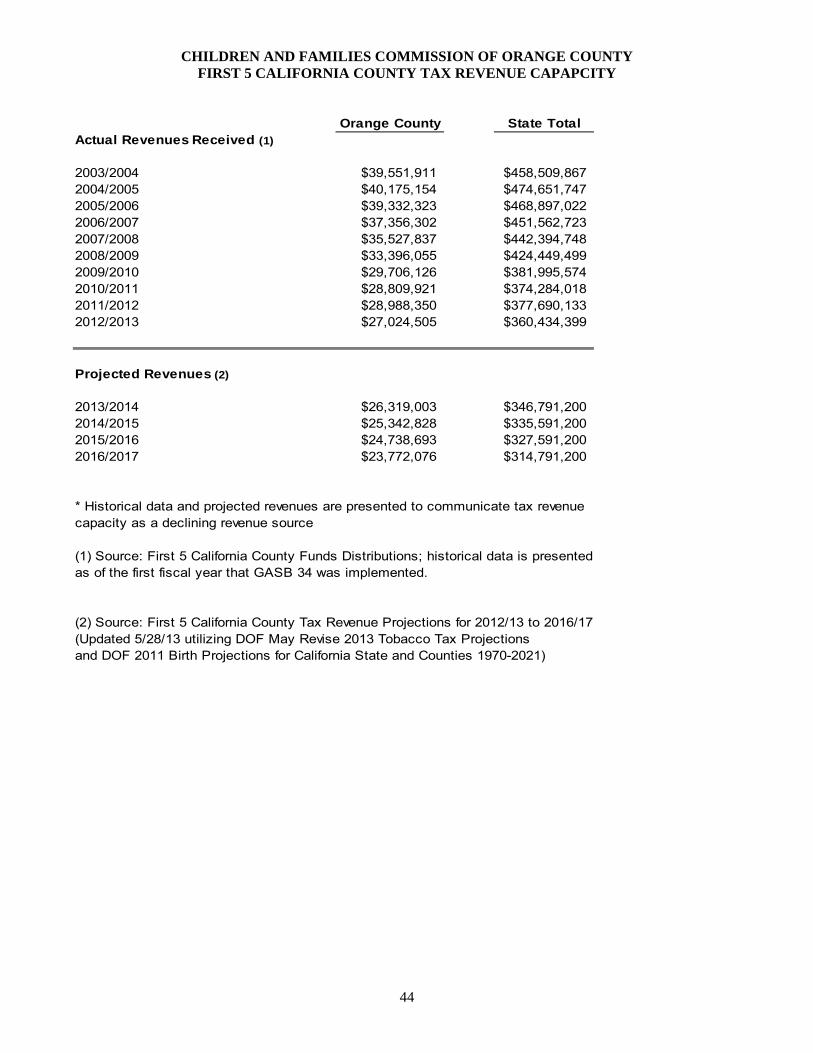
CHILDREN AND FAMILIES COMMISSION OF ORANGE COUNTY FIRST 5 CALIFORNIA COUNTY TAX REVENUE CAPAPCITY
44
Orange County State TotalActual Revenues Received (1)
2003/2004 $39,551,911 $458,509,8672004/2005 $40,175,154 $474,651,7472005/2006 $39,332,323 $468,897,0222006/2007 $37,356,302 $451,562,7232007/2008 $35,527,837 $442,394,7482008/2009 $33,396,055 $424,449,4992009/2010 $29,706,126 $381,995,5742010/2011 $28,809,921 $374,284,0182011/2012 $28,988,350 $377,690,1332012/2013 $27,024,505 $360,434,399
Projected Revenues (2)
2013/2014 $26,319,003 $346,791,2002014/2015 $25,342,828 $335,591,2002015/2016 $24,738,693 $327,591,2002016/2017 $23,772,076 $314,791,200
* Historical data and projected revenues are presented to communicate tax revenuecapacity as a declining revenue source
(1) Source: First 5 California County Funds Distributions; historical data is presentedas of the first fiscal year that GASB 34 was implemented.
(2) Source: First 5 California County Tax Revenue Projections for 2012/13 to 2016/17(Updated 5/28/13 utilizing DOF May Revise 2013 Tobacco Tax Projectionsand DOF 2011 Birth Projections for California State and Counties 1970-2021)
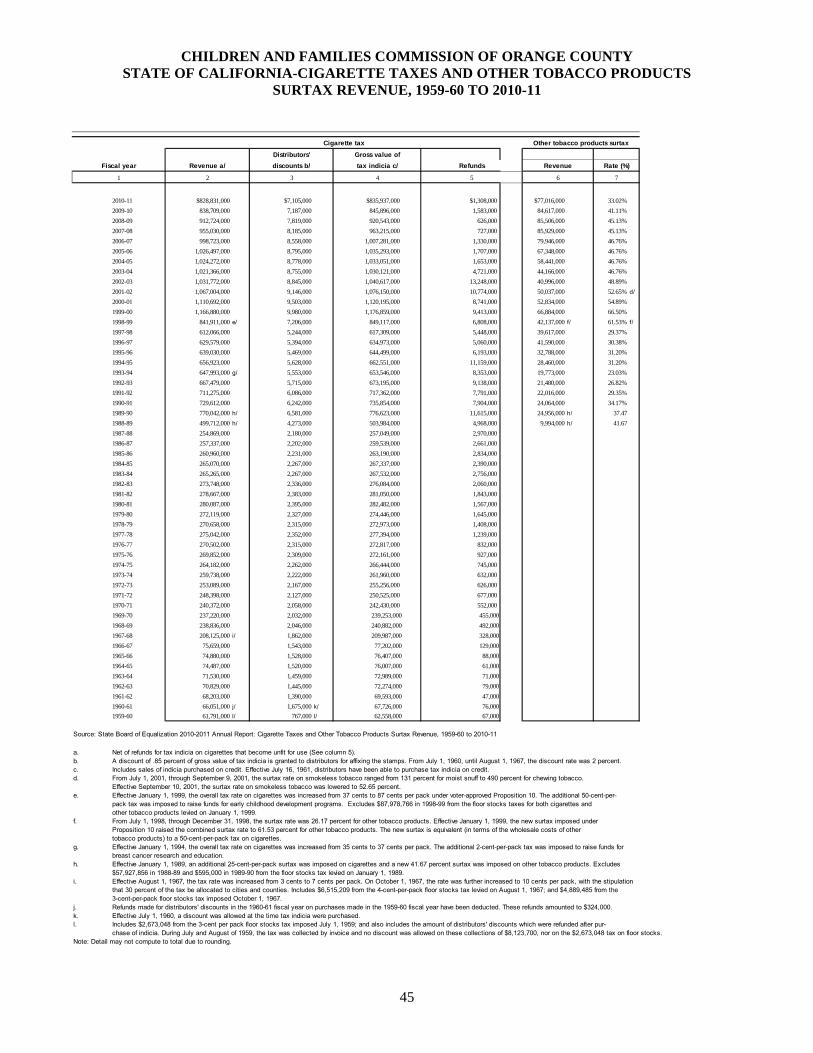
CHILDREN AND FAMILIES COMMISSION OF ORANGE COUNTY STATE OF CALIFORNIA-CIGARETTE TAXES AND OTHER TOBACCO PRODUCTS
SURTAX REVENUE, 1959-60 TO 2010-11
45
Cigarette tax Other tobacco products surtax
Distributors' Gross value of
Fiscal year Revenue a/ discounts b/ tax indicia c/ Refunds Revenue Rate (%)
1 2 3 4 5 6 7
2010-11 $828,831,000 $7,105,000 $835,937,000 $1,308,000 $77,016,000 33.02%
2009-10 838,709,000 7,187,000 845,896,000 1,583,000 84,617,000 41.11%
2008-09 912,724,000 7,819,000 920,543,000 626,000 85,506,000 45.13%
2007-08 955,030,000 8,185,000 963,215,000 727,000 85,929,000 45.13%
2006-07 998,723,000 8,558,000 1,007,281,000 1,330,000 79,946,000 46.76%
2005-06 1,026,497,000 8,795,000 1,035,293,000 1,707,000 67,348,000 46.76%
2004-05 1,024,272,000 8,778,000 1,033,051,000 1,653,000 58,441,000 46.76%
2003-04 1,021,366,000 8,755,000 1,030,121,000 4,721,000 44,166,000 46.76%
2002-03 1,031,772,000 8,845,000 1,040,617,000 13,248,000 40,996,000 48.89%
2001-02 1,067,004,000 9,146,000 1,076,150,000 10,774,000 50,037,000 52.65% d/
2000-01 1,110,692,000 9,503,000 1,120,195,000 8,741,000 52,834,000 54.89%
1999-00 1,166,880,000 9,980,000 1,176,859,000 9,413,000 66,884,000 66.50%
1998-99 841,911,000 e/ 7,206,000 849,117,000 6,808,000 42,137,000 f/ 61.53% f/
1997-98 612,066,000 5,244,000 617,309,000 5,448,000 39,617,000 29.37%
1996-97 629,579,000 5,394,000 634,973,000 5,060,000 41,590,000 30.38%
1995-96 639,030,000 5,469,000 644,499,000 6,193,000 32,788,000 31.20%
1994-95 656,923,000 5,628,000 662,551,000 11,159,000 28,460,000 31.20%
1993-94 647,993,000 g/ 5,553,000 653,546,000 8,353,000 19,773,000 23.03%
1992-93 667,479,000 5,715,000 673,195,000 9,138,000 21,480,000 26.82%
1991-92 711,275,000 6,086,000 717,362,000 7,791,000 22,016,000 29.35%
1990-91 729,612,000 6,242,000 735,854,000 7,904,000 24,064,000 34.17%
1989-90 770,042,000 h/ 6,581,000 776,623,000 11,615,000 24,956,000 h/ 37.47
1988-89 499,712,000 h/ 4,273,000 503,984,000 4,968,000 9,994,000 h/ 41.67
1987-88 254,869,000 2,180,000 257,049,000 2,970,000
1986-87 257,337,000 2,202,000 259,539,000 2,661,000
1985-86 260,960,000 2,231,000 263,190,000 2,834,000
1984-85 265,070,000 2,267,000 267,337,000 2,390,000
1983-84 265,265,000 2,267,000 267,532,000 2,756,000
1982-83 273,748,000 2,336,000 276,084,000 2,060,000
1981-82 278,667,000 2,383,000 281,050,000 1,843,000
1980-81 280,087,000 2,395,000 282,482,000 1,567,000
1979-80 272,119,000 2,327,000 274,446,000 1,645,000
1978-79 270,658,000 2,315,000 272,973,000 1,408,000
1977-78 275,042,000 2,352,000 277,394,000 1,239,000
1976-77 270,502,000 2,315,000 272,817,000 832,000
1975-76 269,852,000 2,309,000 272,161,000 927,000
1974-75 264,182,000 2,262,000 266,444,000 745,000
1973-74 259,738,000 2,222,000 261,960,000 632,000
1972-73 253,089,000 2,167,000 255,256,000 626,000
1971-72 248,398,000 2,127,000 250,525,000 677,000
1970-71 240,372,000 2,058,000 242,430,000 552,000
1969-70 237,220,000 2,032,000 239,253,000 455,000
1968-69 238,836,000 2,046,000 240,882,000 492,000
1967-68 208,125,000 i/ 1,862,000 209,987,000 328,000
1966-67 75,659,000 1,543,000 77,202,000 129,000
1965-66 74,880,000 1,528,000 76,407,000 88,000
1964-65 74,487,000 1,520,000 76,007,000 61,000
1963-64 71,530,000 1,459,000 72,989,000 71,000
1962-63 70,829,000 1,445,000 72,274,000 79,000
1961-62 68,203,000 1,390,000 69,593,000 47,000
1960-61 66,051,000 j/ 1,675,000 k/ 67,726,000 76,000
1959-60 61,791,000 l/ 767,000 l/ 62,558,000 67,000
Source: State Board of Equalization 2010-2011 Annual Report: Cigarette Taxes and Other Tobacco Products Surtax Revenue, 1959-60 to 2010-11
a. Net of refunds for tax indicia on cigarettes that become unfit for use (See column 5). b. A discount of .85 percent of gross value of tax indicia is granted to distributors for affixing the stamps. From July 1, 1960, until August 1, 1967, the discount rate was 2 percent. c. Includes sales of indicia purchased on credit. Effective July 16, 1961, distributors have been able to purchase tax indicia on credit. d. From July 1, 2001, through September 9, 2001, the surtax rate on smokeless tobacco ranged from 131 percent for moist snuff to 490 percent for chewing tobacco.
Effective September 10, 2001, the surtax rate on smokeless tobacco was lowered to 52.65 percent. e. Effective January 1, 1999, the overall tax rate on cigarettes was increased from 37 cents to 87 cents per pack under voter-approved Proposition 10. The additional 50-cent-per-
pack tax was imposed to raise funds for early childhood development programs. Excludes $87,978,766 in 1998-99 from the floor stocks taxes for both cigarettes and other tobacco products levied on January 1, 1999.
f. From July 1, 1998, through December 31, 1998, the surtax rate was 26.17 percent for other tobacco products. Effective January 1, 1999, the new surtax imposed under Proposition 10 raised the combined surtax rate to 61.53 percent for other tobacco products. The new surtax is equivalent (in terms of the wholesale costs of other tobacco products) to a 50-cent-per-pack tax on cigarettes.
g. Effective January 1, 1994, the overall tax rate on cigarettes was increased from 35 cents to 37 cents per pack. The additional 2-cent-per-pack tax was imposed to raise funds for breast cancer research and education.
h. Effective January 1, 1989, an additional 25-cent-per-pack surtax was imposed on cigarettes and a new 41.67 percent surtax was imposed on other tobacco products. Excludes $57,927,856 in 1988-89 and $595,000 in 1989-90 from the floor stocks tax levied on January 1, 1989.
i. Effective August 1, 1967, the tax rate was increased from 3 cents to 7 cents per pack. On October 1, 1967, the rate was further increased to 10 cents per pack, with the stipulation that 30 percent of the tax be allocated to cities and counties. Includes $6,515,209 from the 4-cent-per-pack floor stocks tax levied on August 1, 1967; and $4,889,485 from the 3-cent-per-pack floor stocks tax imposed October 1, 1967.
j. Refunds made for distributors' discounts in the 1960-61 fiscal year on purchases made in the 1959-60 fiscal year have been deducted. These refunds amounted to $324,000. k. Effective July 1, 1960, a discount was allowed at the time tax indicia were purchased. l. Includes $2,673,048 from the 3-cent per pack floor stocks tax imposed July 1, 1959; and also includes the amount of distributors' discounts which were refunded after pur-
chase of indicia. During July and August of 1959, the tax was collected by invoice and no discount was allowed on these collections of $8,123,700, nor on the $2,673,048 tax on floor stocks. Note: Detail may not compute to total due to rounding.

CHILDREN AND FAMILIES COMMISSION OF ORANGE COUNTY STATE OF CALIFORNIA-CIGARETTE DISTRIBUTIONS AND PER CAPITA CONSUMPTION,
1959-60 TO 2010-11
46
Reported distributions Apparent per capita consumption (a.)
Fiscal year Total Tax paid Tax exempt (In packages)1 2 3 4 5
2010-11 989 961 28 26.4
2009-10 1,002 972 30 26.9 r.
2008-09 1,090 1,058 32 28.5
2007-08 1,131 1,107 24 29.9
2006-07 1,177 1,158 20 31.3
2005-06 1,209 1,190 19 32.5
2004-05 1,224 1,187 37 33.3
2003-04 1,234 1,184 50 34.0
2002-03 1,227 1,196 31 34.5
2001-02 1,271 1,237 34 36.3
2000-01 1,324 1,288 37 38.5
1999-00 1,390 1,353 38 41.2
1998-99 1,568 1,523 45 47.3
1997-98 1,717 1,668 48 52.6
1996-97 1,777 1,716 61 55.2
1995-96 1,811 1,742 69 56.9
1994-95 1,871 1,791 80 59.2
1993-94 1,903 1,824 79 60.6
1992-93 2,010 1,923 86 64.5
1991-92 2,144 2,050 94 69.8
1990-91 2,196 2,102 93 72.8
1989-90 2,311 2,219 92 78.2
1988-89 2,431 2,353 78 84.7
1987-88 2,657 2,570 87 94.9
1986-87 2,690 2,595 95 98.4
1985-86 2,730 2,632 98 102.3
1984-85 2,781 2,673 108 106.7
1983-84 2,792 2,675 117 109.9
1982-83 2,889 2,761 128 115.8
1981-82 2,947 2,811 136 120.4
1980-81 2,966 2,825 141 123.6
1979-80 2,892 2,744 148 122.9
1978-79 2,887 2,730 157 125.1
1977-78 2,940 2,774 166 130.0
1976-77 2,900 2,728 172 130.9
1975-76 2,909 2,722 187 133.7
1974-75 2,857 2,664 193 133.7
1973-74 2,827 2,620 207 134.4
1972-73 2,762 2,553 209 133.2
1971-72 2,720 2,505 215 132.9
1970-71 2,635 2,424 211 130.5
1969-70 2,594 2,393 201 130.2
1968-69 2,616 2,409 207 133.0
1967-68 2,596 2,383 213 134.0
1966-67 2,737 2,573 164 143.8
1965-66 2,706 2,547 159 144.9
1964-65 2,679 2,534 145 146.7
1963-64 2,564 2,433 131 144.3
1962-63 2,545 2,409 136 147.9
1961-62 2,450 2,320 130 147.3
1960-61 2,382 2,258 124 147.8
1959-60 2,190 2,085 105 139.7
a. Based on reported distributions and latest estimate of January 1 population for each fiscal year.
r. Revised.
Note: Detail may not compute to total due to rounding.
Source: State Board of Equalization 2010-2011: Annual Report Table 30B - Cigarette Distributions and Per Capita Consumption,1959-60 to 2010-11
(Millions of packages)

CHILDREN AND FAMILIES COMMISSION OF ORANGE COUNTY DEMOGRAPHIC DATA
47
2011** 2010** 2009* 2008* 2007* 2006* 2005* 2004* 2003* 2002* 2001*
Total Population 3,047,120 3,017,327 2,998,820 2,982,790 2,965,829 2,955,425 2,957,137 2,956,473 2,939,733 2,914,419 2,889,905
White 1,334,890 1,336,843 1,363,087 1,383,364 1,392,586 1,405,485 1,423,283 1,439,227 1,447,963 1,453,276 1,458,041
Hispanic 1,032,608 1,010,752 1,008,604 986,104 972,550 961,383 953,194 943,436 928,977 912,149 894,753
Asian & Pacific Islander 554,923 549,149 510,352 499,281 488,521 478,200 471,594 466,022 457,035 445,830 436,407
Black 47,714 45,894 44,641 44,520 44,336 44,328 44,454 44,504 44,397 44,230 44,064
Other/Multi-Race 76,985 74,689 72,136 69,521 67,836 66,029 64,612 63,284 61,361 58,934 56,640
Female 1,540,252 1,526,396 1,512,752 1,505,167 1,496,612 1,491,352 1,491,824 1,490,897 1,482,044 1,469,077 1,456,254
Male 1,506,868 1,490,931 1,486,068 1,477,623 1,469,217 1,464,073 1,465,313 1,465,576 1,457,689 1,445,342 1,433,651
Under 5 years 190,153 190,574 194,723 200,988 202,945 206,581 211,862 215,185 216,027 215,595 215,302
5-9 years 196,567 197,334 200,944 206,588 209,284 211,386 214,222 218,740 222,701 226,100 228,607
10-14 years 208,217 210,213 209,260 218,622 222,735 226,066 228,892 229,527 226,559 221,305 214,550
15-19 years 226,967 228,147 222,780 219,706 215,560 211,947 209,182 206,124 202,996 200,166 198,376
20-24 years 220,121 215,348 209,857 210,065 209,122 208,119 207,329 205,261 201,562 197,484 194,730
25-34 years 420,397 414,942 411,027 407,538 406,889 410,873 420,513 433,062 444,037 454,288 464,427
35-44 years 433,018 436,662 447,102 463,117 468,042 472,297 477,416 481,743 482,978 482,564 481,660
45-54 years 448,793 444,935 443,950 431,378 422,705 413,346 405,181 397,440 388,866 380,310 372,891
55-59 years 185,367 177,331 172,474 165,260 163,804 161,041 157,034 152,133 146,880 140,817 133,371
60-64 years 154,221 148,668 142,894 132,056 125,167 120,075 116,676 113,220 108,649 103,451 99,290
65-74 years 197,489 189,614 183,812 171,707 166,405 162,709 160,296 158,012 154,978 151,806 149,338
75-84 years 114,165 113,374 111,930 111,338 110,392 109,762 108,681 107,286 105,784 103,938 101,841
85+ 51,645 50,184 48,067 44,427 42,779 41,223 39,853 38,740 37,716 36,595 35,522
Sources: *
** State of California, Department of Finance, Report P-2 - State and County Population Projections by Race/Ethnicity and 5-year Age Groups, 2010-2060 (by year), Jan 2013.
State of California, Department of Finance, Race/Ethnic Population with Age and Sex Detail, 2000–2050. Sacramento, CA, May 2012.

CHILDREN AND FAMILIES COMMISSION OF ORANGE COUNTY LIVE BIRTHS, CALIFORNIA COUNTIES, 2002-2011 (By Place of Residence)
48
2002 2003 2004 2005 2006 2007 2008 2009 2010 2011CALIFORNIA 529,245 540,827 544,685 548,700 562,157 566,137 551,567 526,774 509,979 502,023 ALAMEDA 21,802 21,574 20,919 20,902 21,058 21,519 20,972 20,320 19,302 19,002 ALPINE 11 14 8 15 13 13 13 4 4 6 AMADOR 260 299 262 288 274 294 288 295 272 269 BUTTE 2,268 2,382 2,354 2,451 2,633 2,519 2,518 2,439 2,454 2,392 CALAVERAS 338 323 322 371 393 397 373 338 346 326 COLUSA 307 330 345 381 389 386 367 361 338 302 CONTRA COSTA 13,315 13,210 13,279 13,143 13,565 13,485 13,136 12,680 12,352 12,057 DEL NORTE 288 299 285 327 365 356 312 333 372 337 EL DORADO 1,765 1,751 1,897 1,930 2,036 1,881 1,814 1,719 1,618 1,629 FRESNO 14,766 15,401 15,896 15,936 16,876 17,291 16,760 16,273 16,281 16,157 GLENN 408 431 398 431 455 434 472 424 434 391 HUMBOLDT 1,420 1,444 1,509 1,598 1,643 1,599 1,601 1,542 1,551 1,448 IMPERIAL 2,662 2,908 2,861 3,058 3,127 3,148 3,221 3,145 3,072 3,075 INYO 173 198 214 205 250 212 226 239 192 213 KERN 12,211 12,888 13,455 14,022 15,104 15,328 15,315 14,827 14,416 14,287 KINGS 2,311 2,365 2,549 2,554 2,683 2,781 2,710 2,644 2,507 2,565 LAKE 636 684 686 728 695 742 705 726 721 715 LASSEN 301 300 301 289 259 264 323 325 322 300 LOS ANGELES 151,167 152,192 151,504 150,377 151,837 151,813 147,684 139,679 133,160 130,312 MADERA 2,147 2,291 2,346 2,349 2,622 2,611 2,535 2,390 2,434 2,401 MARIN 2,772 2,830 2,792 2,785 2,734 2,819 2,716 2,495 2,368 2,385 MARIPOSA 130 135 150 122 159 141 147 155 145 132 MENDOCINO 1,078 1,102 1,125 1,121 1,106 1,145 1,168 1,100 1,059 1,061 MERCED 4,030 4,278 4,296 4,470 4,742 4,650 4,423 4,407 4,248 4,281 MODOC 67 89 85 81 80 80 92 85 119 87 MONO 138 139 170 153 192 161 175 139 151 156 MONTEREY 7,119 7,423 7,396 7,501 7,474 7,551 7,434 7,068 6,764 6,814 NAPA 1,571 1,676 1,604 1,658 1,754 1,665 1,671 1,653 1,525 1,572 NEVADA 823 821 818 819 804 844 871 758 793 761 ORANGE 44,796 45,366 45,060 44,065 44,231 44,026 42,456 40,431 38,237 38,100 PLACER 3,484 3,639 3,797 3,823 3,892 4,051 4,035 3,804 3,824 3,832 PLUMAS 183 180 173 176 172 186 175 154 170 165 RIVERSIDE 26,691 28,028 29,545 31,509 33,659 34,556 32,866 31,601 30,659 30,610 SACRAMENTO 19,243 20,424 20,836 21,184 21,952 22,110 21,389 20,426 20,055 19,998 SAN BENITO 920 869 887 892 885 882 816 752 735 772 SAN BERNARDINO 29,696 30,824 31,914 33,075 34,675 35,193 33,788 31,984 31,367 30,573 SAN DIEGO 43,951 45,368 45,758 45,897 46,876 47,545 46,742 44,960 44,838 43,621 SAN FRANCISCO 8,361 8,659 8,579 8,403 8,609 9,125 9,104 8,807 8,800 8,813 SAN JOAQUIN 10,162 10,455 11,010 11,495 11,782 11,592 11,030 10,872 10,593 10,328 SAN LUIS OBISPO 2,368 2,620 2,694 2,664 2,727 2,884 2,737 2,614 2,736 2,632 SAN MATEO 10,091 10,179 10,089 9,938 9,808 9,910 9,765 9,452 9,193 9,047 SANTA BARBARA 5,698 5,800 6,209 6,192 6,166 6,289 6,319 6,039 5,819 5,803 SANTA CLARA 27,060 26,997 26,537 26,553 26,942 27,484 26,730 25,200 23,936 23,652 SANTA CRUZ 3,334 3,453 3,399 3,385 3,600 3,571 3,538 3,301 3,190 3,232 SHASTA 1,963 2,060 2,046 2,123 2,191 2,230 2,186 2,069 2,136 2,021 SIERRA 30 30 18 35 14 24 22 21 23 23 SISKIYOU 411 493 467 470 493 512 498 477 434 472 SOLANO 5,851 5,818 5,688 5,737 5,801 5,847 5,607 5,392 5,047 5,158 SONOMA 5,679 5,843 5,964 5,613 5,896 5,742 5,761 5,683 5,391 5,150 STANISLAUS 7,929 8,022 8,061 8,445 8,728 8,826 8,549 7,941 7,804 7,737 SUTTER 1,263 1,352 1,342 1,484 1,577 1,497 1,468 1,433 1,360 1,326 TEHAMA 711 758 700 872 818 765 790 814 767 728 TRINITY 106 105 110 120 122 117 126 116 107 123 TULARE 7,419 7,602 7,957 8,168 8,284 8,505 8,533 8,362 8,155 7,966 TUOLUMNE 442 468 477 446 495 474 486 425 487 430 VENTURA 11,606 12,008 11,954 12,160 12,453 12,194 12,076 11,353 11,147 10,656 YOLO 2,384 2,434 2,404 2,453 2,646 2,522 2,669 2,483 2,426 2,340 YUBA 1,129 1,196 1,184 1,258 1,341 1,349 1,264 1,245 1,223 1,282
Source: State of California, Department of Public Health, Birth Records
YEARCOUNTY
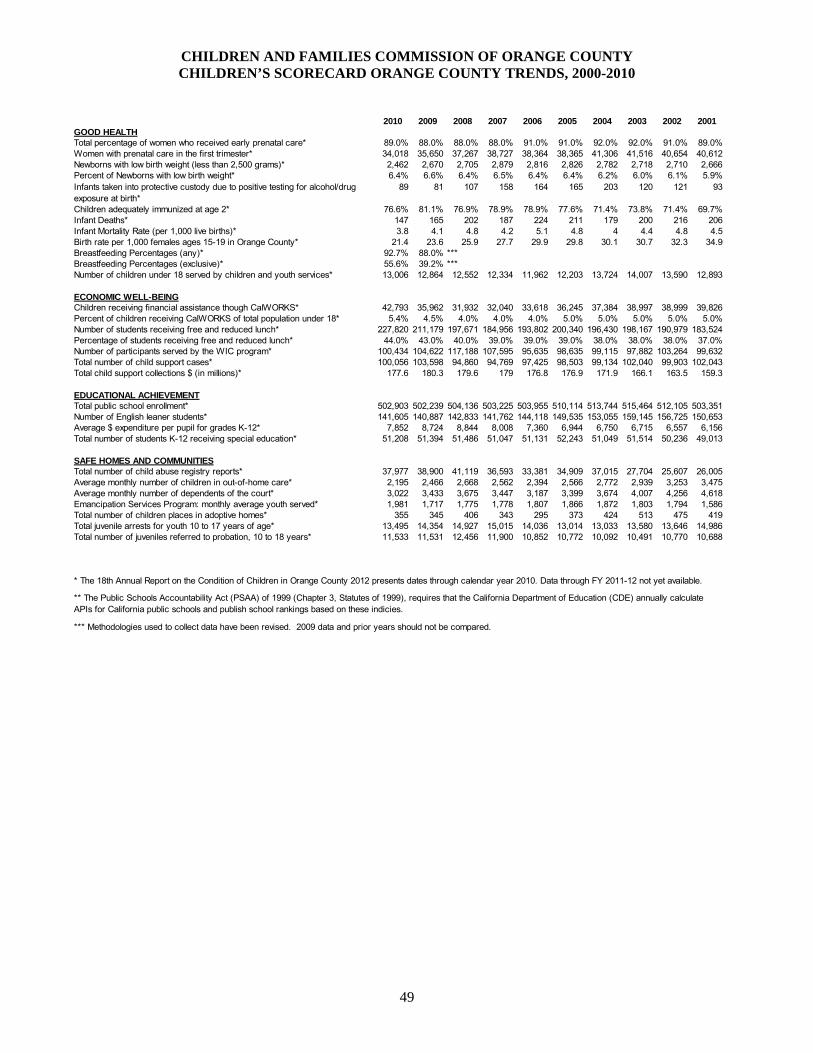
CHILDREN AND FAMILIES COMMISSION OF ORANGE COUNTY CHILDREN’S SCORECARD ORANGE COUNTY TRENDS, 2000-2010
49
2010 2009 2008 2007 2006 2005 2004 2003 2002 2001GOOD HEALTHTotal percentage of women who received early prenatal care* 89.0% 88.0% 88.0% 88.0% 91.0% 91.0% 92.0% 92.0% 91.0% 89.0%Women with prenatal care in the first trimester* 34,018 35,650 37,267 38,727 38,364 38,365 41,306 41,516 40,654 40,612Newborns with low birth weight (less than 2,500 grams)* 2,462 2,670 2,705 2,879 2,816 2,826 2,782 2,718 2,710 2,666Percent of Newborns with low birth weight* 6.4% 6.6% 6.4% 6.5% 6.4% 6.4% 6.2% 6.0% 6.1% 5.9%Infants taken into protective custody due to positive testing for alcohol/drug exposure at birth*
89 81 107 158 164 165 203 120 121 93
Children adequately immunized at age 2* 76.6% 81.1% 76.9% 78.9% 78.9% 77.6% 71.4% 73.8% 71.4% 69.7%Infant Deaths* 147 165 202 187 224 211 179 200 216 206Infant Mortality Rate (per 1,000 live births)* 3.8 4.1 4.8 4.2 5.1 4.8 4 4.4 4.8 4.5Birth rate per 1,000 females ages 15-19 in Orange County* 21.4 23.6 25.9 27.7 29.9 29.8 30.1 30.7 32.3 34.9Breastfeeding Percentages (any)* 92.7% 88.0% ***Breastfeeding Percentages (exclusive)* 55.6% 39.2% ***Number of children under 18 served by children and youth services* 13,006 12,864 12,552 12,334 11,962 12,203 13,724 14,007 13,590 12,893
ECONOMIC WELL-BEINGChildren receiving financial assistance though CalWORKS* 42,793 35,962 31,932 32,040 33,618 36,245 37,384 38,997 38,999 39,826Percent of children receiving CalWORKS of total population under 18* 5.4% 4.5% 4.0% 4.0% 4.0% 5.0% 5.0% 5.0% 5.0% 5.0%Number of students receiving free and reduced lunch* 227,820 211,179 197,671 184,956 193,802 200,340 196,430 198,167 190,979 183,524Percentage of students receiving free and reduced lunch* 44.0% 43.0% 40.0% 39.0% 39.0% 39.0% 38.0% 38.0% 38.0% 37.0%Number of participants served by the WIC program* 100,434 104,622 117,188 107,595 95,635 98,635 99,115 97,882 103,264 99,632Total number of child support cases* 100,056 103,598 94,860 94,769 97,425 98,503 99,134 102,040 99,903 102,043Total child support collections $ (in millions)* 177.6 180.3 179.6 179 176.8 176.9 171.9 166.1 163.5 159.3
EDUCATIONAL ACHIEVEMENTTotal public school enrollment* 502,903 502,239 504,136 503,225 503,955 510,114 513,744 515,464 512,105 503,351Number of English leaner students* 141,605 140,887 142,833 141,762 144,118 149,535 153,055 159,145 156,725 150,653Average $ expenditure per pupil for grades K-12* 7,852 8,724 8,844 8,008 7,360 6,944 6,750 6,715 6,557 6,156Total number of students K-12 receiving special education* 51,208 51,394 51,486 51,047 51,131 52,243 51,049 51,514 50,236 49,013
SAFE HOMES AND COMMUNITIESTotal number of child abuse registry reports* 37,977 38,900 41,119 36,593 33,381 34,909 37,015 27,704 25,607 26,005Average monthly number of children in out-of-home care* 2,195 2,466 2,668 2,562 2,394 2,566 2,772 2,939 3,253 3,475Average monthly number of dependents of the court* 3,022 3,433 3,675 3,447 3,187 3,399 3,674 4,007 4,256 4,618Emancipation Services Program: monthly average youth served* 1,981 1,717 1,775 1,778 1,807 1,866 1,872 1,803 1,794 1,586Total number of children places in adoptive homes* 355 345 406 343 295 373 424 513 475 419Total juvenile arrests for youth 10 to 17 years of age* 13,495 14,354 14,927 15,015 14,036 13,014 13,033 13,580 13,646 14,986Total number of juveniles referred to probation, 10 to 18 years* 11,533 11,531 12,456 11,900 10,852 10,772 10,092 10,491 10,770 10,688
* The 18th Annual Report on the Condition of Children in Orange County 2012 presents dates through calendar year 2010. Data through FY 2011-12 not yet available.
*** Methodologies used to collect data have been revised. 2009 data and prior years should not be compared.
** The Public Schools Accountability Act (PSAA) of 1999 (Chapter 3, Statutes of 1999), requires that the California Department of Education (CDE) annually calculate APIs for California public schools and publish school rankings based on these indicies.

CHILDREN AND FAMILIES COMMISSION OF ORANGE COUNTY CAPITAL ASSETS STATISTICS
50
Capital Assets (equipment) are used by the Commission for general operating and administrative functions.Proposition 10 funds (tobacco taxes) were not used to purchase any capital assets.
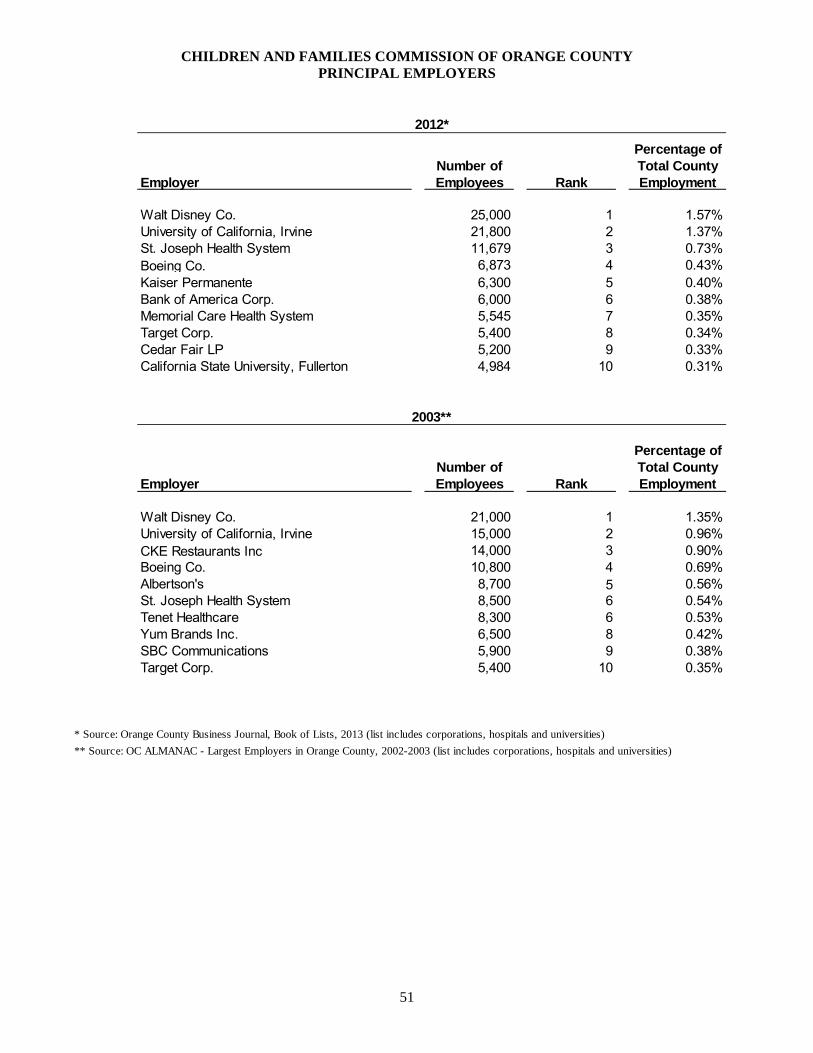
CHILDREN AND FAMILIES COMMISSION OF ORANGE COUNTY PRINCIPAL EMPLOYERS
51
Percentage ofNumber of Total County
Employer Employees Rank Employment
Walt Disney Co. 25,000 1 1.57%University of California, Irvine 21,800 2 1.37%St. Joseph Health System 11,679 3 0.73%Boeing Co. 6,873 4 0.43%Kaiser Permanente 6,300 5 0.40%Bank of America Corp. 6,000 6 0.38%Memorial Care Health System 5,545 7 0.35%Target Corp. 5,400 8 0.34%Cedar Fair LP 5,200 9 0.33%California State University, Fullerton 4,984 10 0.31%
Percentage ofNumber of Total County
Employer Employees Rank Employment
Walt Disney Co. 21,000 1 1.35%University of California, Irvine 15,000 2 0.96%CKE Restaurants Inc 14,000 3 0.90%Boeing Co. 10,800 4 0.69%Albertson's 8,700 5 0.56%St. Joseph Health System 8,500 6 0.54%Tenet Healthcare 8,300 6 0.53%Yum Brands Inc. 6,500 8 0.42%SBC Communications 5,900 9 0.38%Target Corp. 5,400 10 0.35%
* Source: Orange County Business Journal, Book of Lists, 2013 (list includes corporations, hospitals and universities)
** Source: OC ALMANAC - Largest Employers in Orange County, 2002-2003 (list includes corporations, hospitals and universities)
2012*
2003**
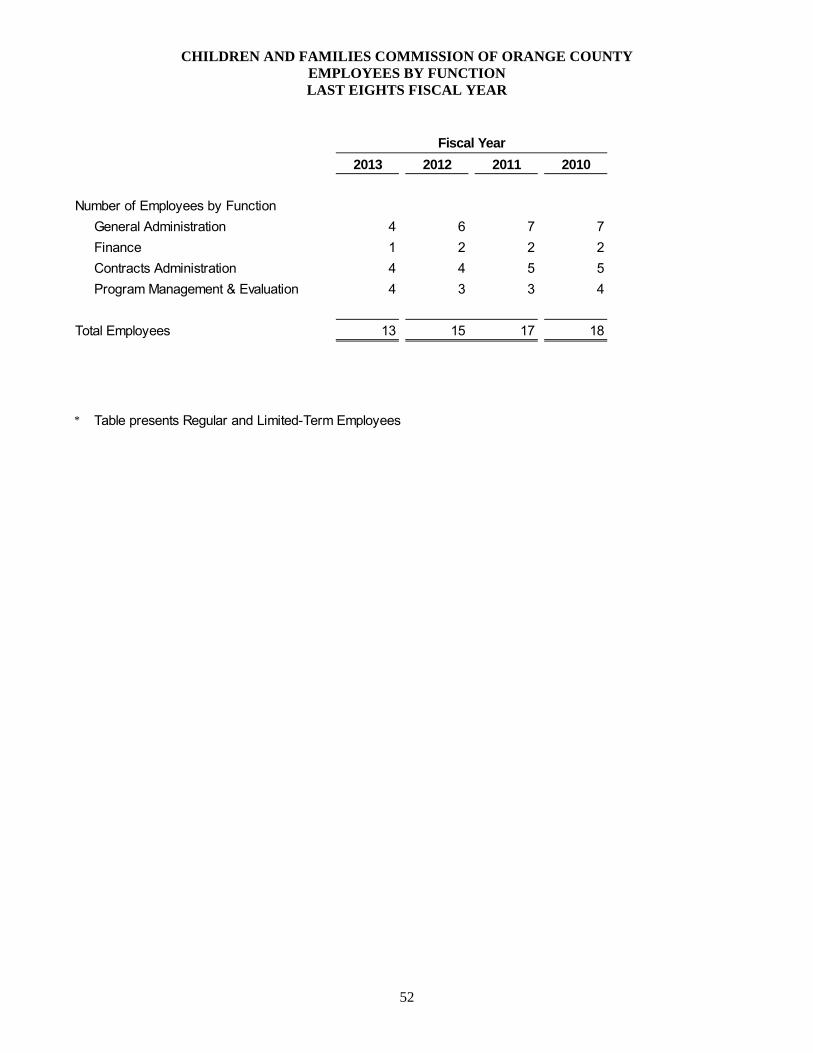
CHILDREN AND FAMILIES COMMISSION OF ORANGE COUNTY EMPLOYEES BY FUNCTION LAST EIGHTS FISCAL YEAR
52
2013 2012 2011 2010
Number of Employees by Function
General Administration 4 6 7 7
Finance 1 2 2 2
Contracts Administration 4 4 5 5
Program Management & Evaluation 4 3 3 4
Total Employees 13 15 17 18
* Table presents Regular and Limited-Term Employees
Fiscal Year

53
2009 2008 2007 2006 2005
7 8 7 8 8
2 1 2 3 2
5 5 5 5 2
4 4 2 2 2
18 18 16 18 14
Fiscal Year
54
INDEPENDENT AUDITORS’ REPORT ON INTERNAL CONTROL OVER FINANCIAL REPORTING AND ON COMPLIANCE AND OTHER MATTERS BASED ON AN AUDIT OF
FINANCIAL STATEMENTS PERFORMED IN ACCORDANCE WITH GOVERNMENT AUDITING STANDARDS
To the Board of Commissioners Children and Families Commission of Orange County We have audited, in accordance with the auditing standards generally accepted in the United States of America and the standards applicable to financial audits contained in Government Auditing Standards issued by the Comptroller General of the United States, the financial statements of the governmental activities and the general fund of the Children and Families Commission of Orange County (Commission) as of and for the year ended June 30, 2013, and the related notes to the financial statements, which collectively comprise the Commission’s basic financial statements, and have issued our report thereon dated September 27, 2013. Our report included an emphasis-of-matter regarding the Commission’s adoption of Governmental Accounting Standards Board (GASB) Statement No. 63, Financial Reporting of Deferred Outflows of Resources, Deferred Inflows of Resources, and Net Position, effective July 1, 2012. Internal Control Over Financial Reporting In planning and performing our audit of the financial statements, we considered the Commission’s internal control over financial reporting (internal control) to determine the audit procedures that are appropriate in the circumstances for the purpose of expressing our opinions on the financial statements, but not for the purpose of expressing an opinion on the effectiveness of the Commission’s internal control. Accordingly, we do not express an opinion on the effectiveness of the Commission’s internal control. A deficiency in internal control exists when the design or operation of a control does not allow management or employees, in the normal course of performing their assigned functions, to prevent, or detect and correct, misstatements on a timely basis. A material weakness is a deficiency, or a combination of deficiencies, in internal control, such that there is a reasonable possibility that a material misstatement of the entity’s financial statements will not be prevented, or detected and corrected on a timely basis. A significant deficiency is a deficiency, or a combination of deficiencies, in internal control that is less severe than a material weakness, yet important enough to merit attention by those charged with governance. Our consideration of internal control was for the limited purpose described in the first paragraph of this section and was not designed to identify all deficiencies in internal control that might be material weaknesses or, significant deficiencies. Given these limitations, during our audit we did not identify any deficiencies in internal control that we consider to be material weaknesses. However, material weaknesses may exist that have not been identified.
Vavrinek, Trine, Day & Co., LLPCertified Public Accountants
VALUE THE D IFFERENCE
FRESN O • L AGUN A H I L LS • PALO ALTO • P LEASANTON • RAN C HO CUC AMON GA • R I v E R S I d E • SACRAMENTO
25231 Paseo De Alicia, Suite 100 Laguna Hills, CA 92653 Tel: 949.768.0833 Fax: 949.768.8408 www.vtdcpa.com
55
Compliance and Other Matters As part of obtaining reasonable assurance about whether the Commission’s financial statements are free from material misstatement, we performed tests of its compliance with certain provisions of laws, regulations, contracts, and grant agreements, noncompliance with which could have a direct and material effect on the determination of financial statement amounts. However, providing an opinion on compliance with those provisions was not an objective of our audit, and accordingly, we do not express such an opinion. The results of our tests disclosed no instances of noncompliance or other matters that are required to be reported under Government Auditing Standards. Purpose of this Report The purpose of this report is solely to describe the scope of our testing of internal control and compliance and the results of that testing, and not to provide an opinion on the effectiveness of the entity’s internal control or on compliance. This report is an integral part of an audit performed in accordance with Government Auditing Standards in considering the Commission’s internal control and compliance. Accordingly, this communication is not suitable for any other purpose. Laguna Hills, California September 27, 2013

56
INDEPENDENT AUDITORS’ REPORT ON STATE COMPLIANCE
To the Board of Commissioners Children and Families Commission of Orange County Compliance We have audited the basic financial statements of the Children and Families Commission of Orange County (Commission), a component unit of the County of Orange, California as of and for the year ended June 30, 2013 and have issued our report thereon dated September 27, 2013. Our report included an emphasis-of-matter regarding the Commission’s adoption of Statement of Governmental Accounting Standard (GASB) Statement No. 63, Financial Reporting of Deferred Outflows of Resources, Deferred Inflows of Resources, and Net Position, effective July 1, 2012. We conducted our audit in accordance with auditing standards generally accepted in the United States of America and the standards applicable to financial audits contained in Government Auditing Standards, issued by the Comptroller General of the United States. We have also audited the Commission’s compliance with the requirements specified in the State of California’s Standards and Procedures for Audits of Local Entities Administering the California Children and Families Act, issued by the State Controller’s Office, applicable to the Commission’s statutory requirements identified below for the year ended June 30, 2013. Management’s Responsibility Compliance with the requirements referred to above is the responsibility of the Commission’s management. Auditor’s Responsibility Our responsibility is to express an opinion on the Commission’s compliance based on our audit. We conducted our compliance audit in accordance with auditing standards generally accepted in the United States of America; the standards applicable to financial audits contained in Government Auditing Standards issued by the Comptroller General of the United States; and the State of California’s Standards and Procedures for Audits of Local Entities Administering the California Children and Families Act, issued by the State Controller’s Office. Those standards and the State of California’s Standards and Procedures for Audits of Local Entities Administering the California Children and Families Act require that we plan and perform the audit to obtain reasonable assurance about whether noncompliance with the compliance requirements referred to above that could have a material effect on the statutory requirements listed below occurred. An audit includes examining, on a test basis, evidence about the Commission’s compliance with those requirements and performing such other procedures as we considered necessary in the circumstances. We believe that our audit provides a reasonable basis for our opinion. Our audit does not provide a legal determination of the Commission’s compliance with those requirements.
Vavrinek, Trine, Day & Co., LLPCertified Public Accountants
VALUE THE D IFFERENCE
FRESN O • L AGUN A H I L LS • PALO ALTO • P LEASANTON • RAN C HO CUC AMON GA • R I v E R S I d E • SACRAMENTO
25231 Paseo De Alicia, Suite 100 Laguna Hills, CA 92653 Tel: 949.768.0833 Fax: 949.768.8408 www.vtdcpa.com
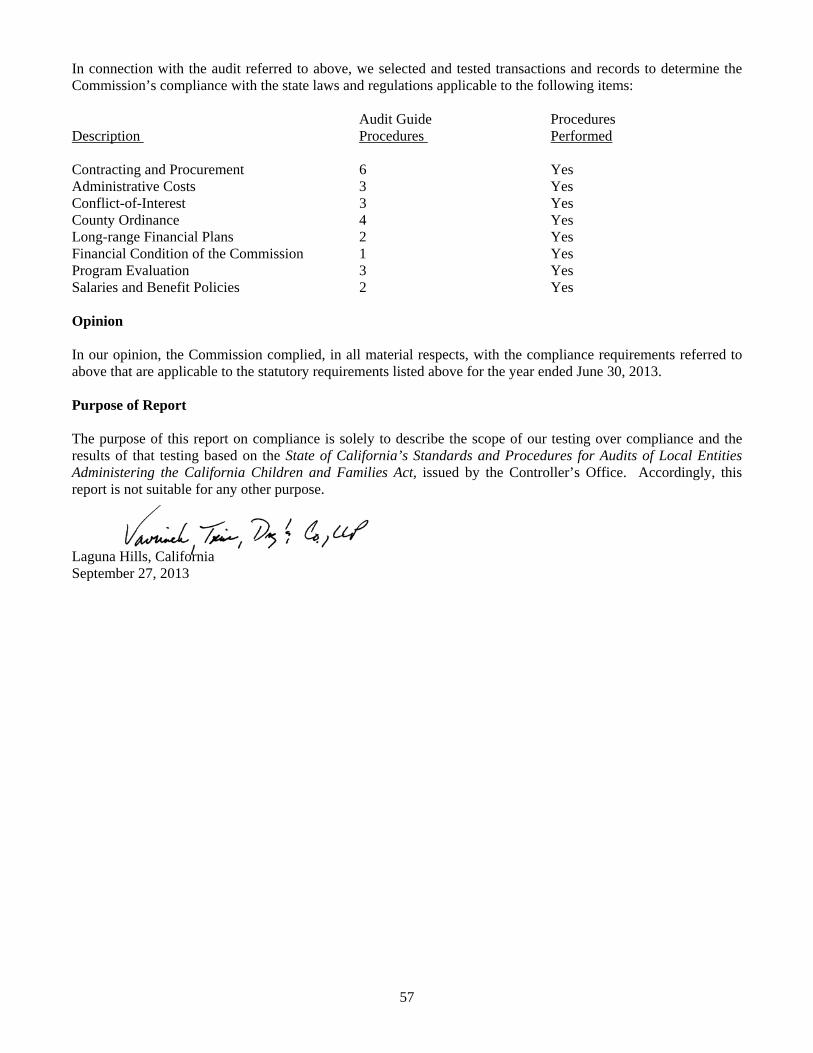
57
In connection with the audit referred to above, we selected and tested transactions and records to determine the Commission’s compliance with the state laws and regulations applicable to the following items:
Audit Guide Procedures Description Procedures Performed Contracting and Procurement 6 Yes Administrative Costs 3 Yes Conflict-of-Interest 3 Yes County Ordinance 4 Yes Long-range Financial Plans 2 Yes Financial Condition of the Commission 1 Yes Program Evaluation 3 Yes Salaries and Benefit Policies 2 Yes Opinion In our opinion, the Commission complied, in all material respects, with the compliance requirements referred to above that are applicable to the statutory requirements listed above for the year ended June 30, 2013. Purpose of Report The purpose of this report on compliance is solely to describe the scope of our testing over compliance and the results of that testing based on the State of California’s Standards and Procedures for Audits of Local Entities Administering the California Children and Families Act, issued by the Controller’s Office. Accordingly, this report is not suitable for any other purpose. Laguna Hills, California September 27, 2013

CHILDREN AND FAMILIES COMMISSION OF ORANGE COUNTY
SINGLE AUDIT REPORT
FOR THE FISCAL YEAR ENDED JUNE 30, 2013

CHILDREN AND FAMILIES COMMISSION OF ORANGE COUNTY FISCAL YEAR ENDED JUNE 30, 2013
TABLE OF CONTENTS
PAGE Independent Auditors' Report on Internal Control Over Financial Reporting and on Compliance and Other Matters Based on an Audit of Financial Statements Performed in Accordance with Government Auditing Standards
1 Independent Auditors' Report on Compliance for Each Major Federal Program; Report on Internal Control Over Compliance; and Report on Schedule of Expenditures of Federal Awards Required by OMB Circular A-133 3 Schedule of Expenditures of Federal Awards 5 Notes to Schedule of Expenditures of Federal Awards 6 Schedule of Findings and Questioned Costs
I. Summary of Auditors’ Results 7
II. Financial Statement Findings 8
III. Federal Award Findings and Questioned Costs 9
Schedule of Prior Year Audit Findings and Recommendations 10
1
INDEPENDENT AUDITORS’ REPORT ON INTERNAL CONTROL OVER FINANCIAL REPORTING AND ON COMPLIANCE AND OTHER MATTERS BASED ON AN
AUDIT OF FINANCIAL STATEMENTS PERFORMED IN ACCORDANCE WITH GOVERNMENT AUDITING STANDARDS
To the Board of Commissioners Children and Families Commission of Orange County We have audited, in accordance with the auditing standards generally accepted in the United States of America and the standards applicable to financial audits contained in Government Auditing Standards issued by the Comptroller General of the United States, the financial statements of the governmental activities and the general fund of the Children and Families Commission of Orange County (Commission) as of and for the year ended June 30, 2013, and the related notes to the financial statements, which collectively comprise the Commission’s basic financial statements, and have issued our report thereon dated September 27, 2013. Our report included an emphasis-of-matter regarding the Commission’s adoption of Governmental Accounting Standards Board (GASB) Statement No. 63, Financial Reporting of Deferred Outflows of Resources, Deferred Inflows of Resources, and Net Position, effective July 1, 2012. Internal Control Over Financial Reporting In planning and performing our audit of the financial statements, we considered the Commission’s internal control over financial reporting (internal control) to determine the audit procedures that are appropriate in the circumstances for the purpose of expressing our opinions on the financial statements, but not for the purpose of expressing an opinion on the effectiveness of the Commission’s internal control. Accordingly, we do not express an opinion on the effectiveness of the Commission’s internal control. A deficiency in internal control exists when the design or operation of a control does not allow management or employees, in the normal course of performing their assigned functions, to prevent, or detect and correct, misstatements on a timely basis. A material weakness is a deficiency, or a combination of deficiencies, in internal control, such that there is a reasonable possibility that a material misstatement of the entity’s financial statements will not be prevented, or detected and corrected on a timely basis. A significant deficiency is a deficiency, or a combination of deficiencies, in internal control that is less severe than a material weakness, yet important enough to merit attention by those charged with governance. Our consideration of internal control was for the limited purpose described in the first paragraph of this section and was not designed to identify all deficiencies in internal control that might be material weaknesses or, significant deficiencies. Given these limitations, during our audit we did not identify any deficiencies in internal control that we consider to be material weaknesses. However, material weaknesses may exist that have not been identified.
Vavrinek, Trine, Day & Co., LLPCertified Public Accountants
VALUE THE D IFFERENCE
FRESN O • L AGUN A H I L LS • PALO ALTO • P LEASANTON • RAN C HO CUC AMON GA • R I v E R S I d E • SACRAMENTO
25231 Paseo De Alicia, Suite 100 Laguna Hills, CA 92653 Tel: 949.768.0833 Fax: 949.768.8408 www.vtdcpa.com

2
Compliance and Other Matters As part of obtaining reasonable assurance about whether the Commission’s financial statements are free from material misstatement, we performed tests of its compliance with certain provisions of laws, regulations, contracts, and grant agreements, noncompliance with which could have a direct and material effect on the determination of financial statement amounts. However, providing an opinion on compliance with those provisions was not an objective of our audit, and accordingly, we do not express such an opinion. The results of our tests disclosed no instances of noncompliance or other matters that are required to be reported under Government Auditing Standards. Purpose of this Report
The purpose of this report is solely to describe the scope of our testing of internal control and compliance and the results of that testing, and not to provide an opinion on the effectiveness of the entity’s internal control or on compliance. This report is an integral part of an audit performed in accordance with Government Auditing Standards in considering the Commission’s internal control and compliance. Accordingly, this communication is not suitable for any other purpose. Laguna Hills, California September 27, 2013

3
INDEPENDENT AUDITORS' REPORT ON COMPLIANCE FOR EACH MAJOR FEDERAL PROGRAM; REPORT ON INTERNAL CONTROL OVER COMPLIANCE; AND REPORT ON
SCHEDULE OF EXPENDITURES OF FEDERAL AWARDS REQUIRED BY OMB CIRCULAR A-133
To the Board of Commissioners Children and Families Commission of Orange County Report on Compliance for Each Major Federal Program We have audited the Children and Families Commission of Orange County’s (the Commission) compliance with the types of compliance requirements described in the OMB Circular A-133 Compliance Supplement that could have a direct and material effect on each of the Commission’s major federal programs for the year ended June 30, 2013. The Commission’s major federal programs are identified in the summary of auditor’s results section of the accompanying schedule of findings and questioned costs. Management’s Responsibility Management is responsible for compliance with the requirements of laws, regulations, contracts, and grants applicable to its federal programs. Auditor’s Responsibility Our responsibility is to express an opinion on compliance for each of the Commission’s major federal programs based on our audit of the types of compliance requirements referred to above. We conducted our audit of compliance in accordance with auditing standards generally accepted in the United States of America; the standards applicable to financial audits contained in Government Auditing Standards, issued by the Comptroller General of the United States; and OMB Circular A-133, Audits of States, Local Governments, and Non-Profit Organizations. Those standards and OMB Circular A-133 require that we plan and perform the audit to obtain reasonable assurance about whether noncompliance with the types of compliance requirements referred to above that could have a direct and material effect on a major federal program occurred. An audit includes examining, on a test basis, evidence about the Commission’s compliance with those requirements and performing such other procedures as we considered necessary in the circumstances. We believe that our audit provides a reasonable basis for our opinion on compliance for each major federal program. However, our audit does not provide a legal determination of the Commission’s compliance. Opinion on Each Major Federal Program In our opinion, the Commission, complied, in all material respects, with the types of compliance requirements referred to above that could have a direct and material effect on each of its major federal programs for the year ended June 30, 2013.
Vavrinek, Trine, Day & Co., LLPCertified Public Accountants
VALUE THE D IFFERENCE
FRESN O • L AGUN A H I L LS • PALO ALTO • P LEASANTON • RAN C HO CUC AMON GA • R I v E R S I d E • SACRAMENTO
25231 Paseo De Alicia, Suite 100 Laguna Hills, CA 92653 Tel: 949.768.0833 Fax: 949.768.8408 www.vtdcpa.com
4
Report on Internal Control Over Compliance Management of the Commission is responsible for establishing and maintaining effective internal control over compliance with the types of compliance requirements referred to above. In planning and performing our audit of compliance, we considered the Commission’s internal control over compliance with the types of requirements that could have a direct and material effect on each major federal program to determine the auditing procedures that are appropriate in the circumstances for the purpose of expressing an opinion on compliance for each major federal program and to test and report on internal control over compliance in accordance with OMB Circular A-133, but not for the purpose of expressing an opinion on the effectiveness of internal control over compliance. Accordingly, we do not express an opinion on the effectiveness of the Commission’s internal control over compliance. A deficiency in internal control over compliance exists when the design or operation of a control over compliance does not allow management or employees, in the normal course of performing their assigned functions, to prevent, or detect and correct, noncompliance with a type of compliance requirement of a federal program on a timely basis. A material weakness in internal control over compliance is a deficiency, or combination of deficiencies, in internal control over compliance, such that there is a reasonable possibility that material noncompliance with a type of compliance requirement of a federal program will not be prevented, or detected and corrected, on a timely basis. A significant deficiency in internal control over compliance is a deficiency, or a combination of deficiencies, in internal control over compliance with a type of compliance requirement of a federal program that is less severe than a material weakness in internal control over compliance, yet important enough to merit attention by those charged with governance. Our consideration of internal control over compliance was for the limited purpose described in the first paragraph of this section and was not designed to identify all deficiencies in internal control over compliance that might be material weaknesses or significant deficiencies. We did not identify any deficiencies in internal control over compliance that we consider to be material weaknesses. However, material weaknesses may exist that have not been identified. The purpose of this report on internal control over compliance is solely to describe the scope of our testing of internal control over compliance and the results of that testing based on the requirements of OMB Circular A-133. Accordingly, this report is not suitable for any other purpose. Report on Schedule of Expenditures of Federal Awards Required by OMB Circular A-133 We have audited the financial statements of the governmental activities and the general fund of the Commission a as of and for the year ended June 30, 2013, and the related notes to the financial statements, which collectively comprise the Commission’s basic financial statements. Our report included an emphasis-of-matter regarding the Commission’s adoption of Governmental Accounting Standards Board (GASB) Statement No. 63, Financial Reporting of Deferred Outflows of Resources, Deferred Inflows of Resources, and Net Position, effective July 1, 2012. We issued our report thereon dated September 27, 2013, which contained unmodified opinions on those financial statements. Our audit was conducted for the purpose of forming our opinions on the financial statements that collectively comprise the basic financial statements. The accompanying schedule of expenditures of federal awards is presented for the purposes of additional analysis as required by OMB Circular A-133, and is not a required part of the financial statements. Such information is the responsibility of management and was derived from and relates directly to the underlying accounting and other records used to prepare the basic financial statements. The information has been subjected to the auditing procedures applied in the audit of the financial statements and certain additional procedures, including comparing and reconciling such information directly to the underlying accounting and other records used to prepare the financial statements or to the basic financial statements themselves, and other additional procedures in accordance with auditing standards generally accepted in the United States of America. In our opinion, the schedule of expenditures of federal awards is fairly stated in all material respects in relation to the basic financial statements as a whole. Laguna Hills, California September 27, 2013
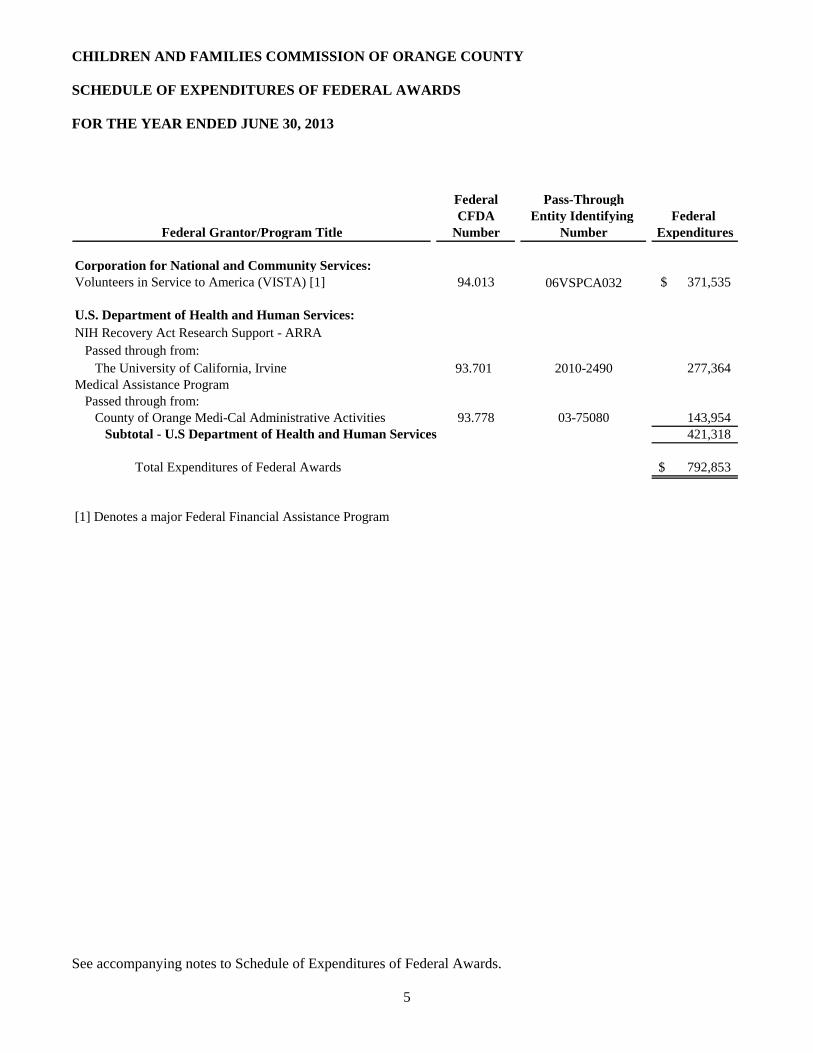
CHILDREN AND FAMILIES COMMISSION OF ORANGE COUNTY SCHEDULE OF EXPENDITURES OF FEDERAL AWARDS FOR THE YEAR ENDED JUNE 30, 2013
See accompanying notes to Schedule of Expenditures of Federal Awards.
5
Federal Pass-ThroughCFDA Entity Identifying Federal
Federal Grantor/Program Title Number Number Expenditures
Corporation for National and Community Services:Volunteers in Service to America (VISTA) [1] 94.013 06VSPCA032 371,535$
U.S. Department of Health and Human Services:NIH Recovery Act Research Support - ARRA
Passed through from:The University of California, Irvine 93.701 2010-2490 277,364
Medical Assistance ProgramPassed through from:
County of Orange Medi-Cal Administrative Activities 93.778 03-75080 143,954 Subtotal - U.S Department of Health and Human Services 421,318
Total Expenditures of Federal Awards 792,853$
[1] Denotes a major Federal Financial Assistance Program

CHILDREN AND FAMILIES COMMISSION OF ORANGE COUNTY NOTES TO SCHEDULE OF EXPENDITURES OF FEDERAL AWARDS FOR THE YEAR ENDED JUNE 30, 2013
6
NOTE #1 – SUMMARY OF SIGNIFICANT ACCOUNTING POLICIES A. General
The accompanying Schedule of Expenditures of Federal Awards presents the activity of all federal award programs of the Children and Families Commission of Orange County (Commission). The Commission's reporting entity is defined in Note #1 of the Commission's basic financial statements. All federal awards received directly from federal agencies as well as federal awards passed through from other government agencies are included on the Schedule of Expenditures of Federal Awards.
B. Basis of Accounting
The accompanying Schedule of Expenditures of Federal Awards is presented using the modified accrual basis of accounting, which is described in Note #1 of the Commission's Financial Statements.
C. Medi-Cal Administrative Activities
The Schedule of Expenditures of Federal Awards includes expenditures incurred for Medi-Cal Administrative Activities (CFDA No. 93.778) in the fiscal year 2011-2012, which were approved for reimbursement by the grantor agency in the fiscal year 2012-2013.
D. Relationship to Basic Financial Statements
Federal awards revenues are generally reported within the Commission's financial statements under the financial statement caption "Federal Operating Grants" for the Governmental Fund.
E. Relationship to Federal Financial Reports
Amounts reported in the accompanying Schedule of Expenditures to Federal Awards agree with the amounts reported in the related federal financial reports. However, certain federal financial reports are filed based on cash expenditures. As such, certain timing differences may exist in the recognition of revenues and expenditures between the Schedule of Expenditures of Federal Awards and the federal financial reports.

CHILDREN AND FAMILIES COMMISSION OF ORANGE COUNTY SCHEDULE OF FINDINGS AND QUESTIONED COSTS FOR THE YEAR ENDED JUNE 30, 2013 I. SUMMARY OF AUDITORS’ RESULTS
7
FINANCIAL STATEMENTSUnmodified
NoNone reported
No
FEDERAL AWARDS
NoNone reported
Unmodified
No
CFDA Number(s) Name of Federal Program or Cluster94.013 Volunteers in Service to America (VISTA)
300,000$ Auditee qualified as low-risk auditee? Yes
Material weaknesses identified?
Type of auditors' report issued:Internal control over financial reporting:
Material weaknesses identified?
Internal control over major programs:
Significant deficiencies identified not considered to be material weaknesses?Noncompliance material to financial statements noted?
Type of auditors' report issued on compliance for major programs:
Significant deficiencies identified not considered to be material weaknesses?
Any audit findings disclosed that are required to be reported in accordance with Circular A-133, Section .510(a)
Identification of major programs:
Dollar threshold used to distinguish between Type A and Type B programs:

CHILDREN AND FAMILIES COMMISSION OF ORANGE COUNTY SCHEDULE OF FINDINGS AND QUESTIONED COSTS FOR THE YEAR ENDED JUNE 30, 2013 II. FINANCIAL STATEMENT FINDINGS
8
None noted.

CHILDREN AND FAMILIES COMMISSION OF ORANGE COUNTY SCHEDULE OF FINDINGS AND QUESTIONED COSTS FOR THE YEAR ENDED JUNE 30, 2013 III. FEDERAL AWARD FINDINGS AND QUESTIONED COSTS
9
None noted.

CHILDREN AND FAMILIES COMMISSION OF ORANGE COUNTY SCHEDULE OF PRIOR YEAR AUDIT FINDINGS AND RECOMMENDATIONS FOR THE YEAR ENDED JUNE 30, 2013
10
None noted.
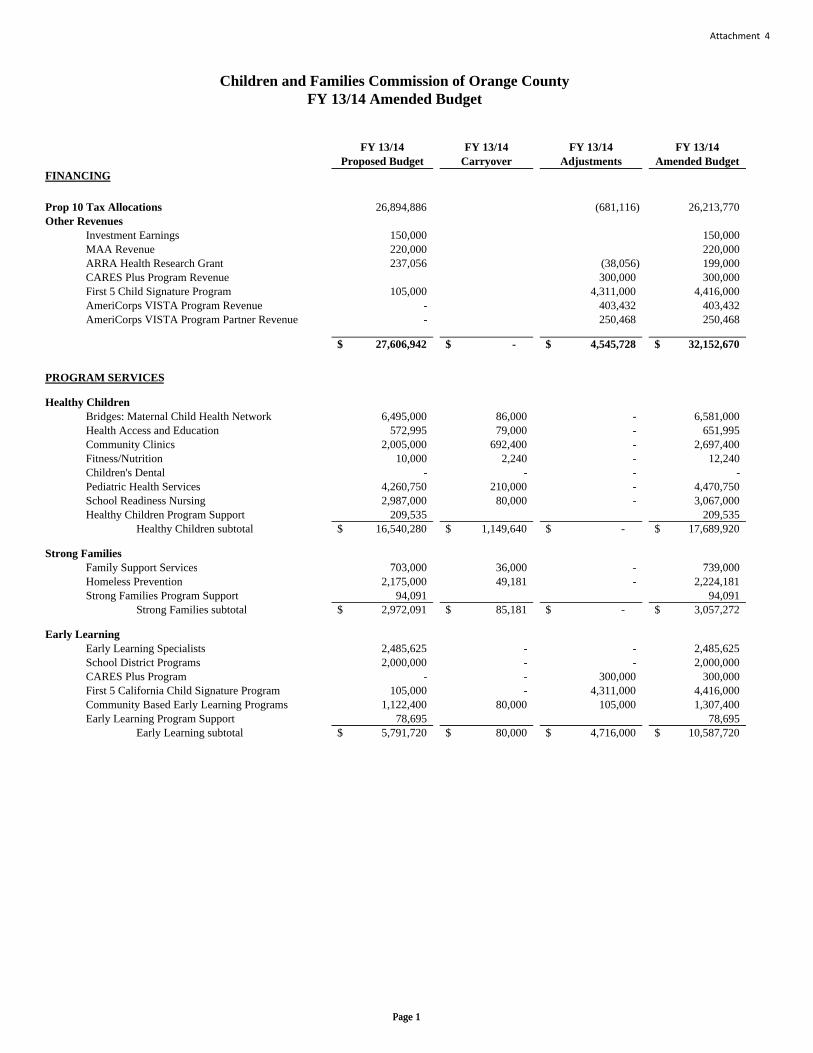
Attachment 4
FY 13/14 Proposed Budget
FY 13/14 Carryover
FY 13/14 Adjustments
FY 13/14 Amended Budget
FINANCING
Prop 10 Tax Allocations 26,894,886 (681,116) 26,213,770 Other Revenues
Investment Earnings 150,000 150,000 MAA Revenue 220,000 220,000 ARRA Health Research Grant 237,056 (38,056) 199,000 CARES Plus Program Revenue 300,000 300,000 First 5 Child Signature Program 105,000 4,311,000 4,416,000 AmeriCorps VISTA Program Revenue - 403,432 403,432 AmeriCorps VISTA Program Partner Revenue - 250,468 250,468
27,606,942$ -$ 4,545,728$ 32,152,670$
PROGRAM SERVICES
Healthy ChildrenBridges: Maternal Child Health Network 6,495,000 86,000 - 6,581,000 Health Access and Education 572,995 79,000 - 651,995 Community Clinics 2,005,000 692,400 - 2,697,400 Fitness/Nutrition 10,000 2,240 - 12,240 Children's Dental - - - - Pediatric Health Services 4,260,750 210,000 - 4,470,750 School Readiness Nursing 2,987,000 80,000 - 3,067,000 Healthy Children Program Support 209,535 209,535
Healthy Children subtotal 16,540,280$ 1,149,640$ -$ 17,689,920$
Strong FamiliesF il S S i 703 000 36 000 739 000
Children and Families Commission of Orange CountyFY 13/14 Amended Budget
Page 1
Family Support Services 703,000 36,000 - 739,000 Homeless Prevention 2,175,000 49,181 - 2,224,181 Strong Families Program Support 94,091 94,091
Strong Families subtotal 2,972,091$ 85,181$ -$ 3,057,272$
Early LearningEarly Learning Specialists 2,485,625 - - 2,485,625 School District Programs 2,000,000 - - 2,000,000 CARES Plus Program - - 300,000 300,000 First 5 California Child Signature Program 105,000 - 4,311,000 4,416,000 Community Based Early Learning Programs 1,122,400 80,000 105,000 1,307,400 Early Learning Program Support 78,695 78,695
Early Learning subtotal 5,791,720$ 80,000$ 4,716,000$ 10,587,720$
Page 1

Attachment 4
PROGRAM SERVICES continuedFY 13/14
Proposed BudgetFY 13/14
CarryoverFY 13/14
AdjustmentsFY 13/14
Amended Budget
Capacity Building `AmeriCorps/VISTA 1,096,930 - 653,900 1,750,830 AmeriCorps/VISTA Program Support 5,196 5,196 Performance Outcomes Management System 928,631 - (38,056) 890,575 Evaluation Program Support 47,141 47,141 Technical Assistance 45,000 - - 45,000 Capacity Building Grants & Matching Funds - 250,000 - 250,000 Capacity Building Support & Fund Development 125,000 - 20,500 145,500 Capacity Building Program Support 47,141 47,141
Capacity Building subtotal 2,295,039$ 250,000$ 636,344$ 3,181,383$
Total Program 27,599,130$ 1,564,821$ 5,352,344$ 34,516,295$
Administrative FunctionsCommission Staffing 1,342,281 1,342,281 Strategic Communications 190,000 5,000 - 195,000 Professional and Technical Services 578,000 17,000 - 595,000 Office, Training & Operating Costs 414,021 5,000 - 419,021
2,524,302$ 27,000$ -$ 2,551,302$
Total Annual Operating Budget 30,123,432$ 1,591,821$ 5,352,344$ 37,067,597$
Admin. % of Budget 8.38% 6.88%
Children and Families Commission of Orange CountyFY 13/14 Amended Budget
Page 2Page 2

Attachment 4
Catalytic Funding: Round 1 & 2Total Catalytic
Allocation (a)
FY 12/13 Expenses*
(b)
FY 13/14 Amended Budget**
Remaining Catalytic Funding (a - b)
Round 1 Catalytic FundingHealth Children Catalytic Funding
Children's Dental Program 20,000,000 1,380,977 18,619,023 For OC Kids Autism 7,000,000 2,000,000 5,000,000
Strong Families Catalytic FundingHealthy Child Developmental Resources 5,500,000 12,500 5,487,500 Emergency Shelter 6,250,000 6,250,000 HomeAid and Shelter projects 750,000 750,000
Early Learning Catalytic FundingEarly Literacy & Math 5,000,000 250,000 4,750,000
Capacity Building Catalytic FundingVista Program Transition 500,000 10,000 490,000
Round 1 Subtotal 45,000,000 3,653,477 41,346,523
Round 2 Catalytic FundingHealth Children Catalytic Funding
Partnership for Children's Health 3,000,000 38,762 2,961,238 Fitness/Nutrition 350,000 5,000 345,000 Breastfeeding Support 150,000 150,000
Strong Families Catalytic FundingPrevention and Child Welfare Program 500,000 15,000 485,000
Capacity Building Catalytic FundingNew Program and Capital FacilityExpansion 3,500,000 917,064 2,582,936
Pediatric Vision Program Catalytic FundingPediatric Vision Program 1,500,000 1,500,000 Unallocated Round 2 Catalytic** 1,000,000 1,000,000
Round 2 Subtotal 10 000 000 975 826 9 024 174
Children and Families Commission of Orange CountyFY 13/14 Amended Budget
Page 3
Round 2 Subtotal 10,000,000 975,826 9,024,174
Total Catalytic Funding 55,000,000 4,629,303 50,370,697
* Total expenses represent only costs realized on the Commission's financial statements. An additional $5 million in catalyic funding has been disbursed, and the related expenses will be recognized when services are provided.
** Total budgeted catalytic expenditures for FY 2013/14 will be revised to match the current year budget with the timing of service delivery.
Page 3
Attachment 5
CHILDREN AND FAMILIES COMMISSION OF ORANGE COUNTY
RESOLUTION NO. ___-13-C&FC
October 2, 2013
A RESOLUTION OF THE CHILDREN AND FAMILIES COMMISSION OF ORANGE COUNTY ADOPTING THE AMENDED FISCAL YEAR 2013-14 OPERATING BUDGET
WHEREAS, at its meeting of April 3, 2013, the Commission conducted a public hearing and reviewed and adopted the following documents prepared and recommended by staff and identified in the staff report for the April 3, 2013 Commission meeting: The Strategic Plan, the Annual Operating Budget for the Fiscal Year 2013-14, and the Business Plan for Fiscal Year 2013-14 including the Administrative Budget; and
WHEREAS, at its meeting of October 2, 2013, the Commission reviewed and adopted an Amended Annual Operating Budget for the Fiscal Year 2013-14 prepared and recommended by staff and identified in the staff report for the October 2, 2013 Commission meeting as Attachment 4.
NOW, THEREFORE BE IT RESOLVED BY THE COMMISSIONERS OF THE CHILDREN AND FAMILIES COMMISSION OF ORANGE COUNTY AS FOLLOWS:
Section 1 The Commission finds and determines the foregoing Recitals are true and correct and are a substantive part of this Resolution.
Section 2 The Commission hereby adopts the Amended Annual Operating Budget for Fiscal Year 2013-14.
Section 3 Notwithstanding the approval of the amended budget, no expenditures from the line item categories for grant funding for Program Services (or any subcategory within such categories) is authorized or may be approved except by subsequent action of the Board of Commissioners; no category is required to be funded at any particular level; no grant funding decisions for individual applicants or types of applicant will be made except in connection with specific grant processes, and no ceiling or floor for such categories is established by this budget.
Section 4 Approval by the Board of Commissioners is required to increase or decrease the existing total amount of budgeted appropriations, revenues, and/or reserves as adopted by the Board of Commissioners. The Executive Director, or designee, is authorized to transfer existing budgeted appropriations mid-fiscal year between existing budget categories and accounts in order to pay for required operating expenses. In accordance with the Commission’s Budgetary Control policy, the Commission renews its delegation of authority to approve budgetary transfers to the Executive Director for Fiscal Year 2013-14.
Section 5 The Clerk of the Commission shall append to this Resolution a copy of the Amended Annual Operating Budget for Fiscal Year 2013-14, identifying it as Exhibit A which shall correspond to Attachment 4 of the October 2, 2013 staff report. By this reference such exhibit is incorporated as though fully set forth herein.
Page 1 of 3
Section 6 Severability. If any section, subsection, subdivision, paragraph, sentence, clause or phrase in this Resolution or any part thereof is for any reason held to be unconstitutional or invalid or ineffective by any court of competent jurisdiction, such decision shall not affect the validity or effectiveness of the remaining portions of this resolution or any part thereof. The Commission Board hereby declares that it would have passed each section, subsection, subdivision, paragraph, sentence, clause or phrase thereof irrespective of the fact that any one (1) or more subsections, subdivisions, paragraphs, sentences, clauses of phrases be declared unconstitutional, or invalid, or ineffective.
Section 7 The Clerk of the Commission shall certify to the adoption of this Resolution.
Page 2 of 3 October 2, 2013

The foregoing resolution was passed and adopted by the following vote of the Children and Families Commission of Orange County on October 2, 2013 to wit:
AYES Commissioners:
NOES: Commissioner(s):
EXCUSED: Commissioner(s):
ABSTAINED: Commissioner(s)
_________________________________________ CHAIR
STATE OF CALIFORNIA ) ) COUNTY OF ORANGE )
I, SUSAN NOVAK, Clerk of the Commission of Orange County, California, hereby certify that a copy of this document has been delivered to the Chair of the Commission and that the above and foregoing Resolution was duly and regularly adopted by the Children and Families Commission of Orange County.
IN WITNESS WHEREOF, I have hereto set my hand and seal.
_____________________________________ SUSAN NOVAK
Clerk of the Commission, Children and Families Commission of Orange County, County of Orange, State of California
Resolution No: __-13-C&FC
Agenda Date: October 2, 2013
Item No.__
I certify that the foregoing is a true and correct copy of the Resolution adopted by the
SUSAN NOVAK, Clerk of the Commission
By:_____________________________________________
Deputy
Page 3 of 3 October 2, 2013

EXHIBIT A TO RESOLUTION OF COMMISSION
AMENDED ANNUAL OPERATING BUDGET FOR FISCAL YEAR 2013-14
(attached)
EXHIBIT A TO RESOLUTION OF COMMISSION Page 1 of 1 October 2, 2013
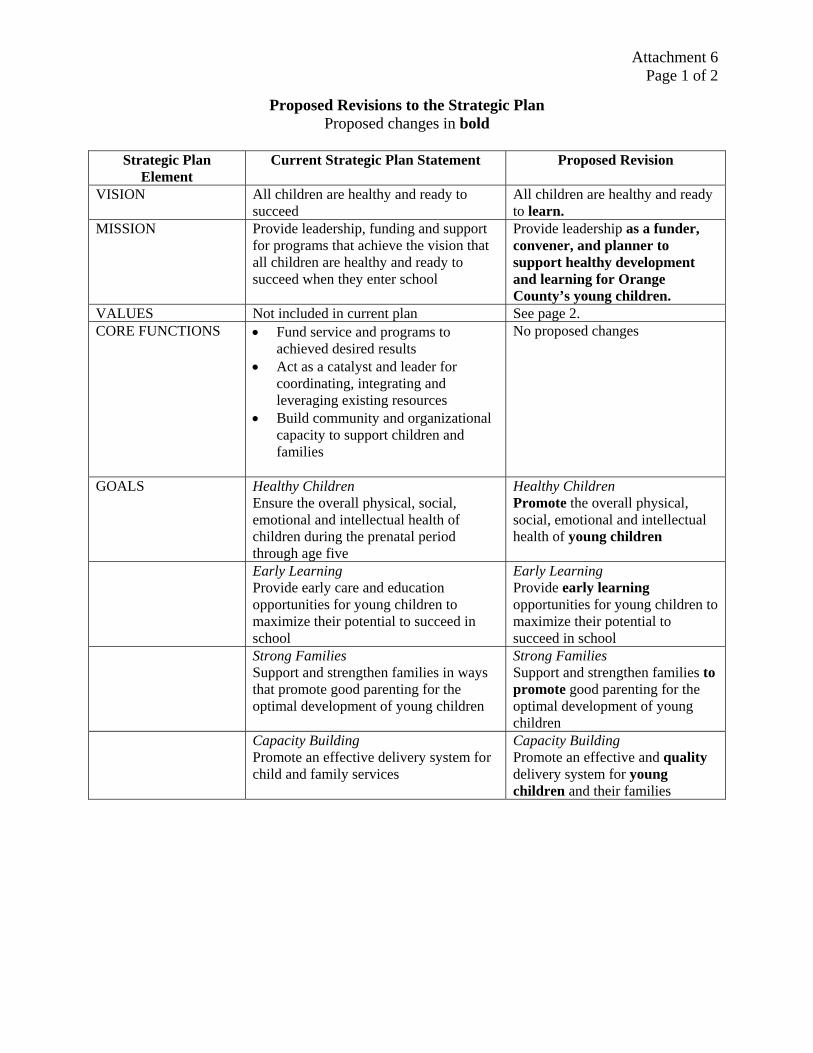
Attachment 6 Page 1 of 2
Proposed Revisions to the Strategic Plan Proposed changes in bold
Strategic Plan
Element Current Strategic Plan Statement Proposed Revision
VISION All children are healthy and ready to succeed
All children are healthy and ready to learn.
MISSION Provide leadership, funding and support for programs that achieve the vision that all children are healthy and ready to succeed when they enter school
Provide leadership as a funder, convener, and planner to support healthy development and learning for Orange County’s young children.
VALUES Not included in current plan See page 2. CORE FUNCTIONS • Fund service and programs to
achieved desired results • Act as a catalyst and leader for
coordinating, integrating and leveraging existing resources
• Build community and organizational capacity to support children and families
No proposed changes
GOALS Healthy Children Ensure the overall physical, social, emotional and intellectual health of children during the prenatal period through age five
Healthy Children Promote the overall physical, social, emotional and intellectual health of young children
Early Learning Provide early care and education opportunities for young children to maximize their potential to succeed in school
Early Learning Provide early learning opportunities for young children to maximize their potential to succeed in school
Strong Families Support and strengthen families in ways that promote good parenting for the optimal development of young children
Strong Families Support and strengthen families to promote good parenting for the optimal development of young children
Capacity Building Promote an effective delivery system for child and family services
Capacity Building Promote an effective and quality delivery system for young children and their families

Attachment 6 Page 2 of 2
Guiding Principles (Previously adopted by the Commission) In all of its operations, the Commission is committed to the following principles which guide its investments in early childhood health and development: 1. Promote and fund high quality services modeled after research-based, proven strategies
which have planned publicly accountable outcomes. 2. Maximize and leverage the existing system of public and private agencies concerned with
young children and families and promote the integration of services through local, convenient and family-friendly access points.
3. Create family-based culturally and linguistically appropriate services which enrich the child within the context of the whole family by incorporating parents, other caregivers, and siblings in the service design.
4. Foster sustainability by building community capacity to support families and focusing on policy-level issues and decisions.
5. Engage in an open decision-making process that makes funding decisions based on: Commission vision, goals, and outcomes; compelling community need; and, positive data supported outcomes.
Proposed Organizational Values 1. Integrity: We adhere to the highest standards, ensuring public trust through transparency
in decision-making and commitment to the voters’ intent. 2. Excellence: We support high quality programs and services, continually striving to
optimize operational practices. 3. Collaboration: We work with community partners, sharing knowledge and
accomplishing shared goals. 4. Results-Oriented: We are responsible for achieving positive outcomes for young
children, establishing demanding metrics of success for all programs and services. 5. Innovation: We constantly challenge ourselves and our partners to advance creative
solutions to benefit young children and their families.

Attachment 7
CHILDREN AND FAMILIES COMMISSION OF ORANGE COUNTY
RESOLUTION NO. ___-13-C&FC
October 2, 2013
A RESOLUTION OF THE CHILDREN AND FAMILIES COMMISSION OF ORANGE COUNTY APPROVING FINAL PROPOSED REVISIONS TO THE STRATEGIC PLAN
WHEREAS, at its meeting of April 3, 2013, the Commission conducted a public hearing and reviewed and adopted the following documents prepared and recommended by staff and identified in the staff report for the April 3, 2013 Commission meeting: The Strategic Plan, the Annual Operating Budget for the Fiscal Year 2013-14, and the Business Plan for Fiscal Year 2013-14 including the Administrative Budget; and
WHEREAS, at its meeting of October 2, 2013, the Commission reviewed and approved the final proposed revisions to the Strategic Plan prepared and recommended by staff and identified in the staff report for the October 2, 2013 Commission meeting as Attachment 6.
NOW, THEREFORE BE IT RESOLVED BY THE COMMISSIONERS OF THE CHILDREN AND FAMILIES COMMISSION OF ORANGE COUNTY AS FOLLOWS:
Section 1 The Commission finds and determines the foregoing Recitals are true and correct and are a substantive part of this Resolution.
Section 2 The Commission hereby approves the final proposed revisions to the Strategic Plan.
Section 3 The Clerk of the Commission shall append to this Resolution a copy of the approved final proposed revisions to the Strategic Plan, identifying it as Exhibit A which shall correspond to Attachment 6 of the October 2, 2013 staff report. By this reference such exhibit is incorporated as though fully set forth herein.
Section 4 Severability. If any section, subsection, subdivision, paragraph, sentence, clause or phrase in this Resolution or any part thereof is for any reason held to be unconstitutional or invalid or ineffective by any court of competent jurisdiction, such decision shall not affect the validity or effectiveness of the remaining portions of this resolution or any part thereof. The Commission Board hereby declares that it would have passed each section, subsection, subdivision, paragraph, sentence, clause or phrase thereof irrespective of the fact that any one (1) or more subsections, subdivisions, paragraphs, sentences, clauses of phrases be declared unconstitutional, or invalid, or ineffective.
Section 5 The Clerk of the Commission shall certify to the adoption of this Resolution.
Page 1 of 2

The foregoing resolution was passed and adopted by the following vote of the Children and Families Commission of Orange County on October 2, 2013 to wit:
AYES Commissioners:
NOES: Commissioner(s):
EXCUSED: Commissioner(s):
ABSTAINED: Commissioner(s)
_________________________________________ CHAIR
STATE OF CALIFORNIA ) ) COUNTY OF ORANGE )
I, SUSAN NOVAK, Clerk of the Commission of Orange County, California, hereby certify that a copy of this document has been delivered to the Chair of the Commission and that the above and foregoing Resolution was duly and regularly adopted by the Children and Families Commission of Orange County.
IN WITNESS WHEREOF, I have hereto set my hand and seal.
_____________________________________ SUSAN NOVAK
Clerk of the Commission, Children and Families Commission of Orange County, County of Orange, State of California
Resolution No: __-13-C&FC
Agenda Date: October 2, 2013
Item No.__
I certify that the foregoing is a true and correct copy of the Resolution adopted by the
SUSAN NOVAK, Clerk of the Commission
By:_____________________________________________
Deputy
Page 2 of 2 October 2, 2013

EXHIBIT A TO RESOLUTION OF COMMISSION
APPROVED FINAL REVISIONS TO THE STRATEGIC PLAN
(attached)
EXHIBIT A TO RESOLUTION OF COMMISSION Page 1 of 1 October 2, 2013