a comparative study of valuation methods on selected
TRANSCRIPT
Dr. Disha Shah, Assistant Professor, VESIMSR, MumbaiNikhil Shinde, Management Student, VESIMSR, Mumbai
Abstract: was the fourth largest Auto Industry in the world
with sales increasing 9.5 percent year-on-year Indian Automobile Industry has been at the forefront of units (excluding two wheelers) in 2017. It was the growth for the last decade. This has made it one of the
seventh largest manufacturer of commercial preferred sectors for long term investors in India.
However, at present Indian Automobile Industry is vehicles in 2018. In addition, two-wheeler
going through a slowdown due to a metamorphosis with segment dominates the Industry and made up 81
the dawn of new business, manufacturing practices, percent share in the domestic Automobile sales in
consumer expectations and regulators. This research FY19 as per SIAM reports. However, in 2019 The focuses on the relationship between Company Indian Automobile Industry is in a bad spot right Valuations & Share Price movements. This study now as the production and sales numbers are further identifies & tests the empirical evidence for such continuously to drop month on month due to a relationship in selected two and three-wheeler which it shows a downtrend growth in this sector companies of Automobile Industry listed on National but Automobiles have become the necessity for Stock Exchange (NSE). This paper studies the various everyone owing to there is a scope for valuation methods so as to calculate the accurate share Automobiles in India.price of the selected companies from Automobile
There are different types of segments in Industry. As quoted by Phillip Fisher “the stock market
Automobile Industry. In which two wheelers is filled with individuals who know the price of
segment leads the Indian Automobiles market everything, but the value of nothing.” This paper
with more than 80% market share owing to a focuses on this concept by attempting to find the most growing young and middle-class populations befitting valuation model for the Two and Three-then followed by passenger vehicle segment and Wheeler Segment of Automobile Industry taking into three-wheeler segment. The top companies like accounts the economic factors.Maruti Suzuki, Hyundai Motors, M&M, Tata
Keywords:Motors, Ashok Leyland, Hero MotoCorp, TVS,
Intrinsic Value, Valuations, Stock Price, P/E Ratio, Bajaj Auto and Piaggio etc. with their expensive
PEG Ratio, Automobile Industry, NSE. dealing networks, promotional, convenient
1. Introduction customer services have played a key role in the According to the IBEF (Indian Brand Equity growth and development of the Automobile Foundations) report, Indian Automobile Industry Industry in India. contributes more than 7.5 % in India's GDP. India
A Comparative Study of Valuation Methods onSelected Automobile Companies
Dr. Disha Shah, Mr. Nikhil Shinde
Journal of Development Research
50
Vivekanand Education SocietyInstitute of ManagementStudies & Researchwww.vesim.ves.ac.in
A Comparative Study of Valuation Methods on Selected Automobile Companies
51
JDR Volume 13 Issue 2 (2020)
2. Segmentation of Industry
Automobile Productions Trend:
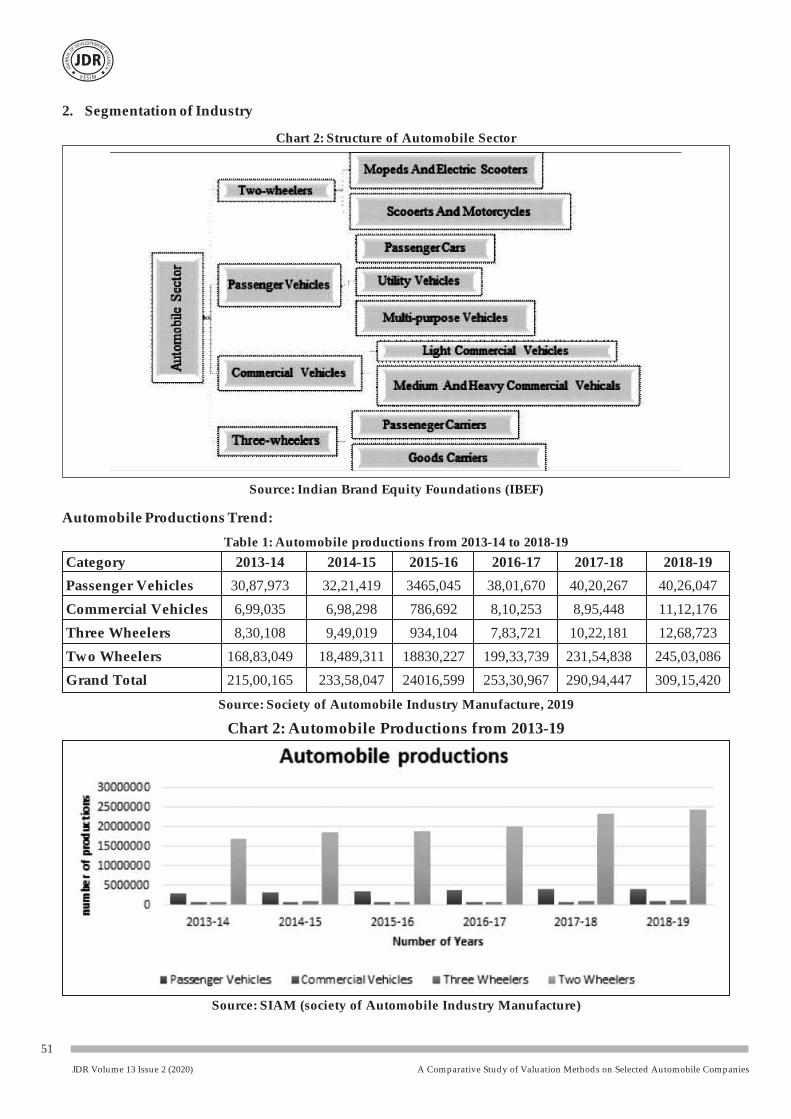
Chart 2: Structure of Automobile Sector
Source: Indian Brand Equity Foundations (IBEF)
Table 1: Automobile productions from 2013-14 to 2018-19
Category 2013-14 2014-15 2015-16 2016-17 2017-18 2018-19
Passenger Vehicles 30,87,973 32,21,419 3465,045 38,01,670 40,20,267 40,26,047
Commercial Vehicles 6,99,035 6,98,298 786,692 8,10,253 8,95,448 11,12,176
Three Wheelers 8,30,108 9,49,019 934,104 7,83,721 10,22,181 12,68,723
Two Wheelers 168,83,049 18,489,311 18830,227 199,33,739 231,54,838 245,03,086
Grand Total 215,00,165 233,58,047 24016,599 253,30,967 290,94,447 309,15,420
Source: Society of Automobile Industry Manufacture, 2019
Chart 2: Automobile Productions from 2013-19
Source: SIAM (society of Automobile Industry Manufacture)
A Comparative Study of Valuation Methods on Selected Automobile Companies
52
JDR Volume 13 Issue 2 (2020)
From the above chart, we can study that vehicles and commercial vehicles, which shows a
Production of Automobile has a CAGR of 6.09 % raising trend up to 2018-19. In three wheelers
from 2013-14 to 2018-19.The production of two- category up to 2018-19, production was showing
wheeler vehicles has continuously increased from an upward trend, but the production from 2016-17
2013-14 to 2018-19 then followed by passenger to 2017-18 has shown a decline.
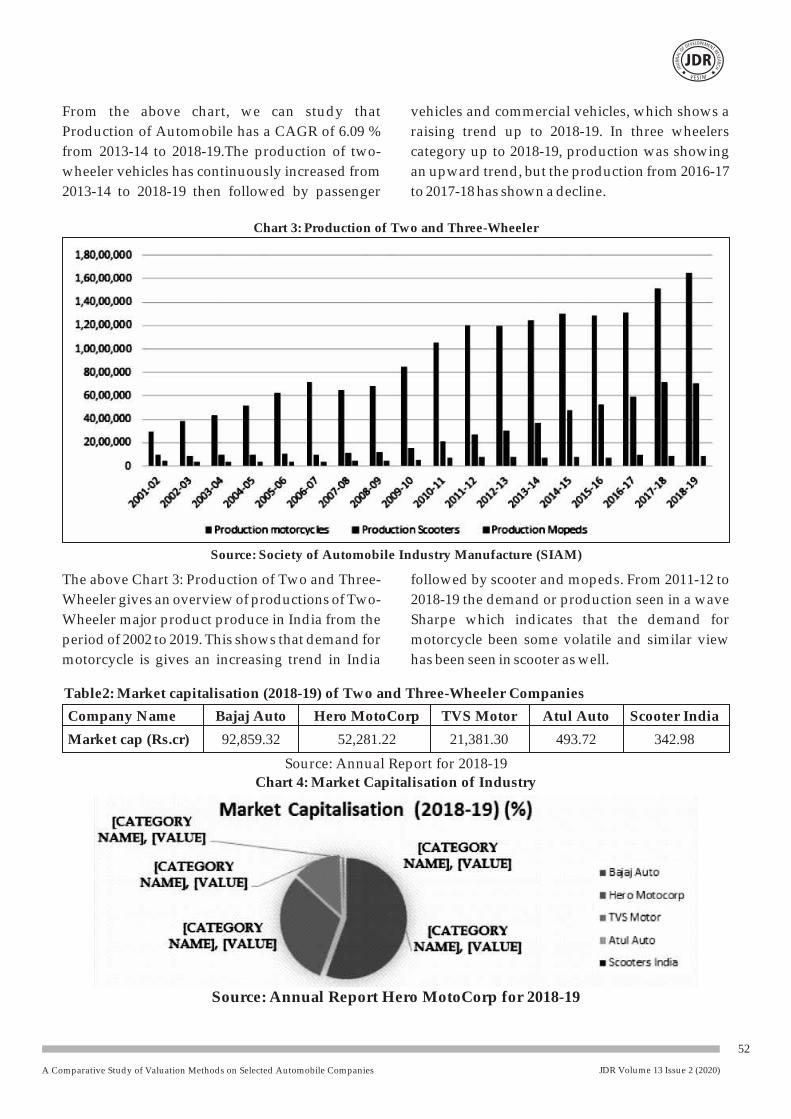
Chart 3: Production of Two and Three-Wheeler
Source: Society of Automobile Industry Manufacture (SIAM)
The above Chart 3: Production of Two and Three- followed by scooter and mopeds. From 2011-12 to
Wheeler gives an overview of productions of Two- 2018-19 the demand or production seen in a wave
Wheeler major product produce in India from the Sharpe which indicates that the demand for
period of 2002 to 2019. This shows that demand for motorcycle been some volatile and similar view
motorcycle is gives an increasing trend in India has been seen in scooter as well.
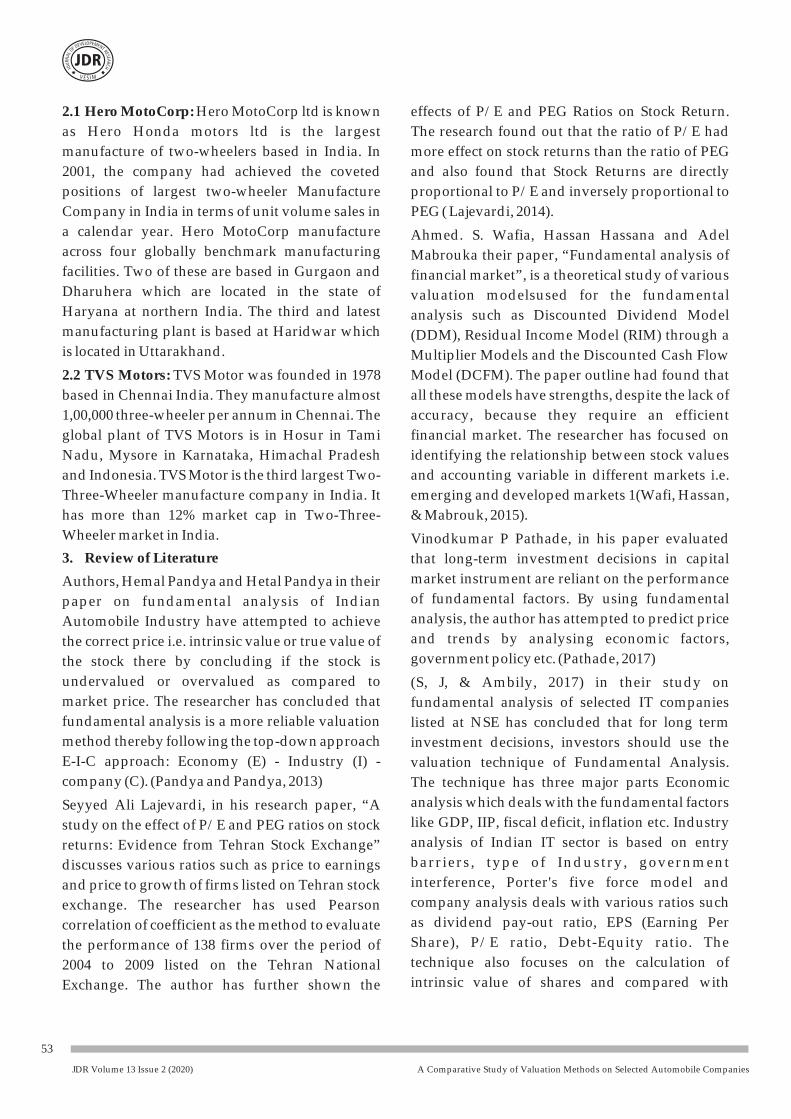
Table2: Market capitalisation (2018-19) of Two and Three-Wheeler Companies
Company Name Bajaj Auto Hero MotoCorp TVS Motor Atul Auto Scooter India
Market cap (Rs.cr) 92,859.32 52,281.22 21,381.30 493.72 342.98
Source: Annual Report for 2018-19
Chart 4: Market Capitalisation of Industry
Source: Annual Report Hero MotoCorp for 2018-19
A Comparative Study of Valuation Methods on Selected Automobile Companies
53
JDR Volume 13 Issue 2 (2020)
2.1 Hero MotoCorp: Hero MotoCorp ltd is known effects of P/E and PEG Ratios on Stock Return.
as Hero Honda motors ltd is the largest The research found out that the ratio of P/E had
manufacture of two-wheelers based in India. In more effect on stock returns than the ratio of PEG
2001, the company had achieved the coveted and also found that Stock Returns are directly
positions of largest two-wheeler Manufacture proportional to P/E and inversely proportional to
Company in India in terms of unit volume sales in PEG ( Lajevardi, 2014).
a calendar year. Hero MotoCorp manufacture Ahmed. S. Wafia, Hassan Hassana and Adel across four globally benchmark manufacturing Mabrouka their paper, “Fundamental analysis of facilities. Two of these are based in Gurgaon and financial market”, is a theoretical study of various Dharuhera which are located in the state of valuation modelsused for the fundamental Haryana at northern India. The third and latest analysis such as Discounted Dividend Model manufacturing plant is based at Haridwar which (DDM), Residual Income Model (RIM) through a is located in Uttarakhand. Multiplier Models and the Discounted Cash Flow
2.2 TVS Motors: TVS Motor was founded in 1978 Model (DCFM). The paper outline had found that
based in Chennai India. They manufacture almost all these models have strengths, despite the lack of
1,00,000 three-wheeler per annum in Chennai. The accuracy, because they require an efficient
global plant of TVS Motors is in Hosur in Tami financial market. The researcher has focused on
Nadu, Mysore in Karnataka, Himachal Pradesh identifying the relationship between stock values
and Indonesia. TVS Motor is the third largest Two- and accounting variable in different markets i.e.
Three-Wheeler manufacture company in India. It emerging and developed markets 1(Wafi, Hassan,
has more than 12% market cap in Two-Three- & Mabrouk, 2015).
Wheeler market in India. Vinodkumar P Pathade, in his paper evaluated
3. Review of Literature that long-term investment decisions in capital
market instrument are reliant on the performance Authors, Hemal Pandya and Hetal Pandya in their of fundamental factors. By using fundamental paper on fundamental analysis of Indian analysis, the author has attempted to predict price Automobile Industry have attempted to achieve and trends by analysing economic factors, the correct price i.e. intrinsic value or true value of government policy etc. (Pathade, 2017)the stock there by concluding if the stock is
undervalued or overvalued as compared to (S, J, & Ambily, 2017) in their study on
market price. The researcher has concluded that fundamental analysis of selected IT companies
fundamental analysis is a more reliable valuation listed at NSE has concluded that for long term
method thereby following the top-down approach investment decisions, investors should use the
E-I-C approach: Economy (E) - Industry (I) - valuation technique of Fundamental Analysis.
company (C). (Pandya and Pandya, 2013) The technique has three major parts Economic
analysis which deals with the fundamental factors Seyyed Ali Lajevardi, in his research paper, “A like GDP, IIP, fiscal deficit, inflation etc. Industry study on the effect of P/E and PEG ratios on stock analysis of Indian IT sector is based on entry returns: Evidence from Tehran Stock Exchange” barriers, type of Industry, government discusses various ratios such as price to earnings interference, Porter's five force model and and price to growth of firms listed on Tehran stock company analysis deals with various ratios such exchange. The researcher has used Pearson as dividend pay-out ratio, EPS (Earning Per correlation of coefficient as the method to evaluate Share), P/E ratio, Debt-Equity ratio. The the performance of 138 firms over the period of technique also focuses on the calculation of 2004 to 2009 listed on the Tehran National intrinsic value of shares and compared with Exchange. The author has further shown the
A Comparative Study of Valuation Methods on Selected Automobile Companies
54
JDR Volume 13 Issue 2 (2020)
Market value and find out the undervaluation and secondary data which is collected from various
overvaluation of the shares. books, journals, annual reports of the companies
and various other articles & websites. The data are Mohammad Reza Ghaeli, in his research paper has collected from the past company annual financial focused on price to earnings ratio as a primary tool Reports were namely balance sheet, profit & loss to evaluate the stock price of the firms, Account. The variables that are taken into characteristics. The author has also discussed the consideration in the study are Price to Earnings merits of P/E ratio and attempted to predict the Ratio, Forward price to earnings ratio, Price to market value and identifying bull and bear session Book and Return on Equity model, EV-EBITDA, with the help of several studies which is given by PEG ratio, Price to Earnings valuation model and the different researcher on the relationship Movement of stock price in respect to price to between P/E ratio and stock performance, earnings ratio. The study covers the period of 8 estimation of transaction data, insider transaction, years i.e. from 2012 to 2019.future growth, firm size, interest ratio, book-to-
6. Scope of the Studymarket equity, etc.(Ghaeli, 2017)
4. Objective of Research The study is done through top two companies of
Automobile Company of Two and Three-Wheeler The main purpose of this paper is to study segment namely Hero MotoCorp and TVS Motors. fundamental factors impacting the Automobiles The study is limited to financial data of last 8 years. companies of Two-Three-Wheeler Segment and to The companies are selected with respect to their scrutinize the financial positions for estimated the market capitalization, revenue, sales and intrinsic value with an objective to identify the performance. Researchers have analysed new under-priced or over-priced securities in the norms of Automobile Industry and their impact market so that the Investor can invest their money on price movement of the stock.on the basis of results of Fundamental Analysis.
7. Data Analysis?To make comparative analysis of within the
7.1 Price Earnings (P/E) Ratio: The P/E ratio financials of major Two and Three - Wheelers
measures the amount investors are willing to pay Automobile segment.
for each rupee of earnings. In estimating the ?To forecast the fair price of the stock. earnings normally sustainable earnings associated
5. Research Methodology with the assets are taken into account. The ratio
In the study was made to measure, evaluate and gives an idea to assess a firm's performance to the
compare the financial performance of the top Industry performance. The ratio is always
Companies in Two-Three-Wheeler Automobile denoted in multiples. (Chandra, 2016)
segment i.e. Hero MotoCorp & TVS Motors with P/E Ratio=Market Price of Share
the help of various valuation models & key Earnings Per Share (corporate finance
financial ratios. The study is based purely on institute.com, 2019)
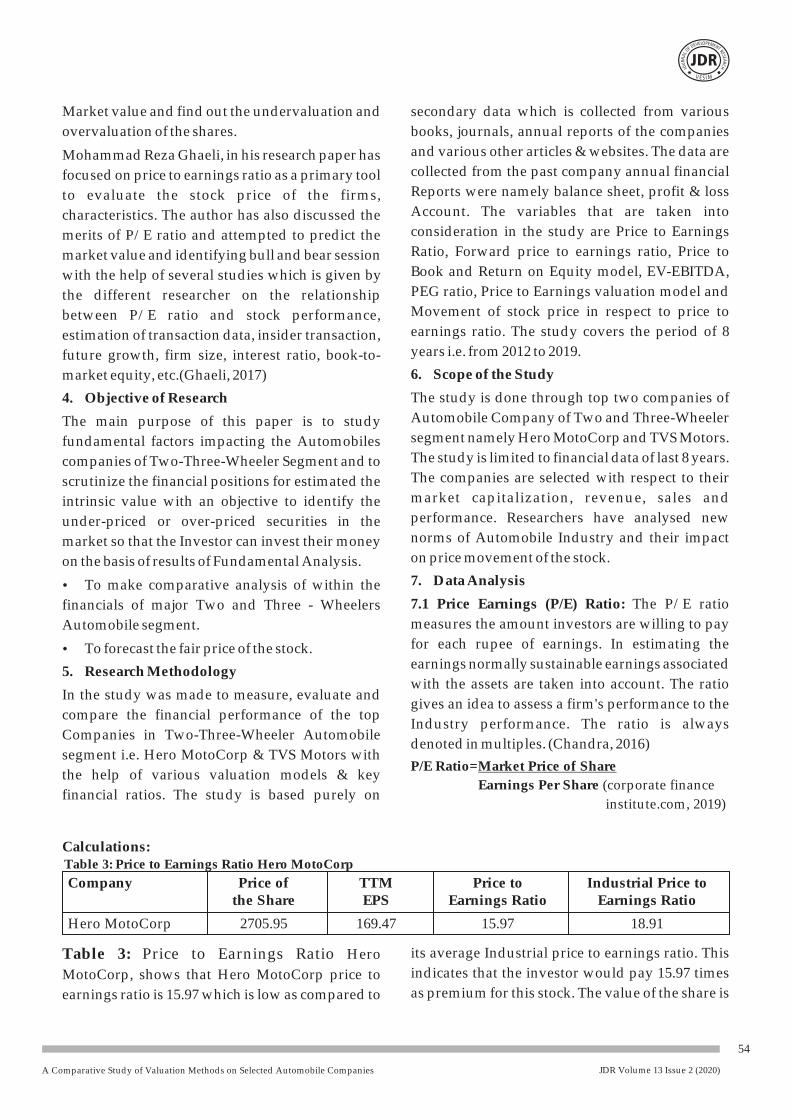
Calculations:Table 3: Price to Earnings Ratio Hero MotoCorp
Company Price of TTM Price to Industrial Price to the Share EPS Earnings Ratio Earnings Ratio
Hero MotoCorp 2705.95 169.47 15.97 18.91
its average Industrial price to earnings ratio. This Table 3: Price to Earnings Ratio Hero
indicates that the investor would pay 15.97 times MotoCorp, shows that Hero MotoCorp price to
as premium for this stock. The value of the share is earnings ratio is 15.97 which is low as compared to
A Comparative Study of Valuation Methods on Selected Automobile Companies
55
JDR Volume 13 Issue 2 (2020)
undervalued as it is low then the average overvalued or undervalued based on the earnings.
industrial ratio or the investor think that there is As this create an opportunity to investor to buy at
low growth potential in future earnings. low or sell that at premium. Stocks that are valued
below the P/E ratio levels are undervalued and 7.2 Price to Earnings and Closing Price Relations: those which valued above the P/E ratio are A stock that is valued should have a P/E ratio that overvalued. (Chandra, 2016)justifies its price. However, most of the stock is
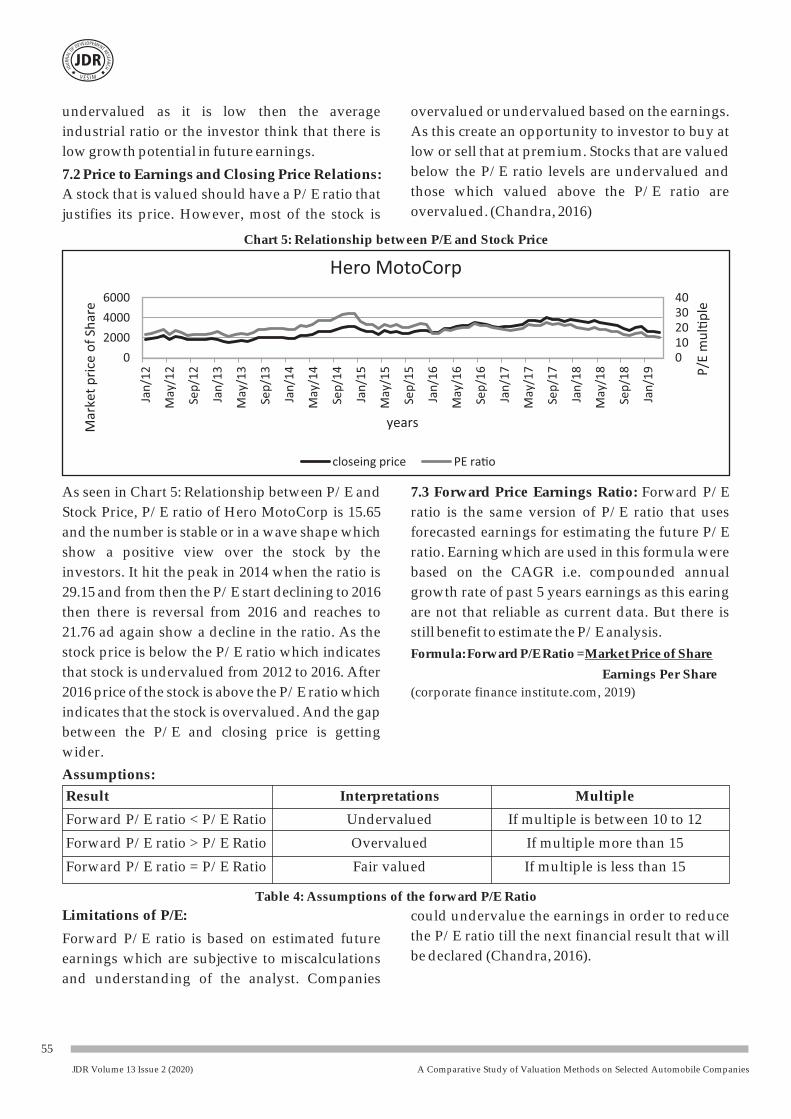
Chart 5: Relationship between P/E and Stock Price
As seen in Chart 5: Relationship between P/E and 7.3 Forward Price Earnings Ratio: Forward P/E
Stock Price, P/E ratio of Hero MotoCorp is 15.65 ratio is the same version of P/E ratio that uses
and the number is stable or in a wave shape which forecasted earnings for estimating the future P/E
show a positive view over the stock by the ratio. Earning which are used in this formula were
investors. It hit the peak in 2014 when the ratio is based on the CAGR i.e. compounded annual
29.15 and from then the P/E start declining to 2016 growth rate of past 5 years earnings as this earing
then there is reversal from 2016 and reaches to are not that reliable as current data. But there is
21.76 ad again show a decline in the ratio. As the still benefit to estimate the P/E analysis.
stock price is below the P/E ratio which indicates Formula: Forward P/E Ratio =Market Price of Share
that stock is undervalued from 2012 to 2016. After Earnings Per Share
2016 price of the stock is above the P/E ratio which (corporate finance institute.com, 2019)
indicates that the stock is overvalued. And the gap
between the P/E and closing price is getting
wider.
Assumptions:
Table 4: Assumptions of the forward P/E Ratio
Limitations of P/E: could undervalue the earnings in order to reduce
the P/E ratio till the next financial result that will Forward P/E ratio is based on estimated future be declared (Chandra, 2016).earnings which are subjective to miscalculations
and understanding of the analyst. Companies
Result Interpretations Multiple
Forward P/E ratio < P/E Ratio Undervalued If multiple is between 10 to 12
Forward P/E ratio > P/E Ratio Overvalued If multiple more than 15
Forward P/E ratio = P/E Ratio Fair valued If multiple is less than 15
A Comparative Study of Valuation Methods on Selected Automobile Companies
56
JDR Volume 13 Issue 2 (2020)
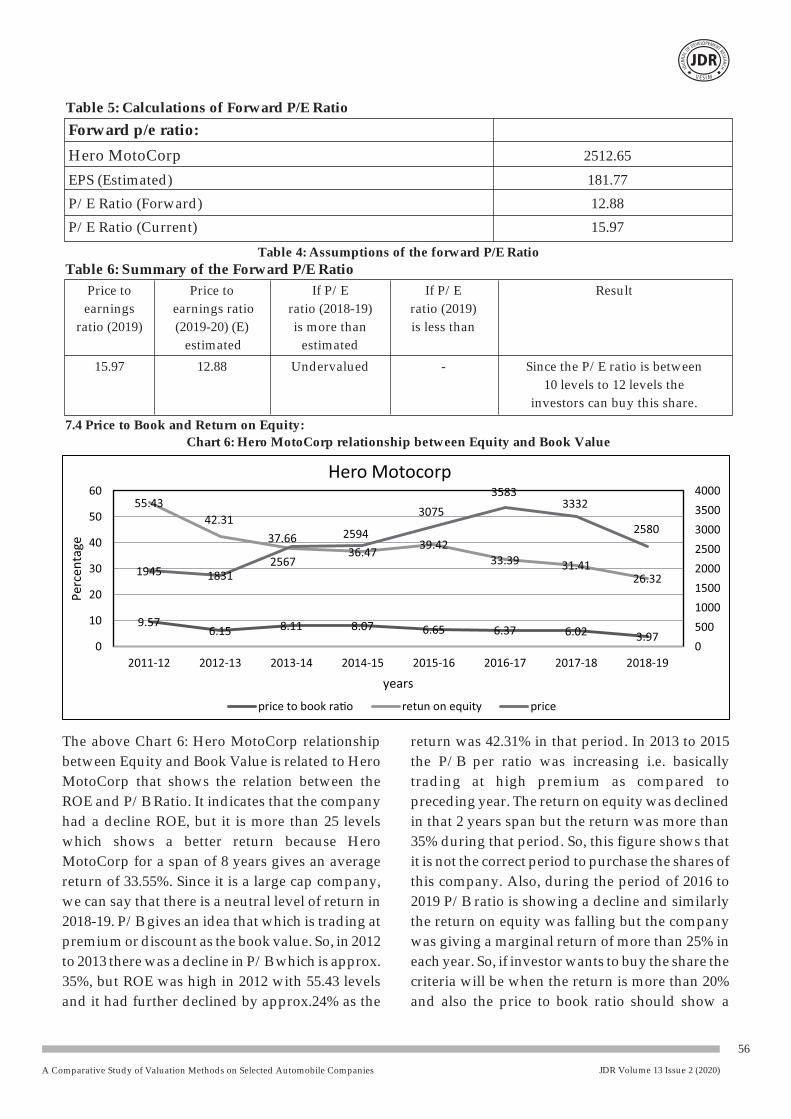
The above Chart 6: Hero MotoCorp relationship return was 42.31% in that period. In 2013 to 2015
between Equity and Book Value is related to Hero the P/B per ratio was increasing i.e. basically
MotoCorp that shows the relation between the trading at high premium as compared to
ROE and P/B Ratio. It indicates that the company preceding year. The return on equity was declined
had a decline ROE, but it is more than 25 levels in that 2 years span but the return was more than
which shows a better return because Hero 35% during that period. So, this figure shows that
MotoCorp for a span of 8 years gives an average it is not the correct period to purchase the shares of
return of 33.55%. Since it is a large cap company, this company. Also, during the period of 2016 to
we can say that there is a neutral level of return in 2019 P/B ratio is showing a decline and similarly
2018-19. P/B gives an idea that which is trading at the return on equity was falling but the company
premium or discount as the book value. So, in 2012 was giving a marginal return of more than 25% in
to 2013 there was a decline in P/B which is approx. each year. So, if investor wants to buy the share the
35%, but ROE was high in 2012 with 55.43 levels criteria will be when the return is more than 20%
and it had further declined by approx.24% as the and also the price to book ratio should show a
Table 5: Calculations of Forward P/E Ratio
Table 4: Assumptions of the forward P/E Ratio
Forward p/e ratio:
Hero MotoCorp 2512.65
EPS (Estimated) 181.77
P/E Ratio (Forward) 12.88
P/E Ratio (Current) 15.97
Table 6: Summary of the Forward P/E Ratio
7.4 Price to Book and Return on Equity:
Chart 6: Hero MotoCorp relationship between Equity and Book Value
Price to Price to If P/E If P/E Result
earnings earnings ratio ratio (2018-19) ratio (2019)
ratio (2019) (2019-20) (E) is more than is less than
estimated estimated
15.97 12.88 Undervalued - Since the P/E ratio is between
10 levels to 12 levels the
investors can buy this share.
A Comparative Study of Valuation Methods on Selected Automobile Companies
57
JDR Volume 13 Issue 2 (2020)
7.5 EV/EBITDA (Hero MotoCorp):Calculations – Table 7: EV/EBITDA from the period of 2011-12 to 2018-19
Particular 2011-12 2012-13 2013-14 2014-15 2015-16 2016-17 2017-18 2018-19
EV/EBITDA 10.54 8.39 11.36 13.04 12.12 12.46 12.17 9.056
Table 8: Calculations of entry and target price by EV/EBITDA method
Table 5: Calculations of Forward P/E ratio
Table 4: Assumptions of the forward P/E Ratio
Expected EBITDA 6006.31
Forecasting EV 54394.07
Shares outstanding 19.97
Target price 2723.79
Entry price 1815.86
EV/EBITDA is an ideal multiple for financial Formula: PEG Ratio =Market Price of Share= 1.49
analysis. A company with below 10 levels which Earnings per Share
will be considered as better company to Since hero MotoCorp price to earnings growth invest,(Damodaran). In the above Table 7: rate (PEG) is more than one which indicate that the EV/EBITDA from the period of 2011-12 to 2018- company is trading at a premium. Estimated EPS 19, EV/EBITDA more than 10 level from the growth rate of past 5years is 10.39%. This ratio period of 2014 to 2018 which shows that the says that the investor is paying 1.49 times more for company is trading at a premium. In 2019 each earnings of the company. Since there is a company EV/EBITDA is lower than 10 levels so liquidity problem in the economy if such points this shows that the company is trading at a are considered then the PEG should be at least 1.1. discount. So, at this point investor can invest in But the PEG is 1.49 which shows that the company this stock. If the investor wants to invest in this has an overvalued stock.stock then the target price will be 2,723.79 and the 7.7 Price to Earnings Valuationsentry price will be 1,815.86, as seen in Table 8:
7.7.1 Assumptions:Calculations of entry and target price by
?This model assumes that the P/E of a stock will EV/EBITDA method. Also, if we analyse EBITDA
always return to its average levels.of the company it is at an increasing trend which
?Different periods i.e. (7 years, 4 years) P/E gives a positive view towards its earnings. ratio data's assuming that the stock P/E will 7.6 Price to Earnings Growth: return to average levels.
The PEG is a stock's P/E ratio divided by the Target and entry price are calculated for different growth rate of its earnings for a specified time performance scenarios, which allows us to project period. The PEG ratio is considered to be an a better target and entry price. (corporate finance indicator of a stock's true value, and similar to the institute.com, 2019)P/E ratio, a lower PEG may indicate that a stock is
undervalued or vice-versa (Chandra, 2016)
decreasing trend or in the range of 2 or 3 levels. In compared to the preceding year of price to book
2019 at this time investors can buy the share value and return is also more than 20%.
because company is trading at fewer premiums as
A Comparative Study of Valuation Methods on Selected Automobile Companies
58
JDR Volume 13 Issue 2 (2020)
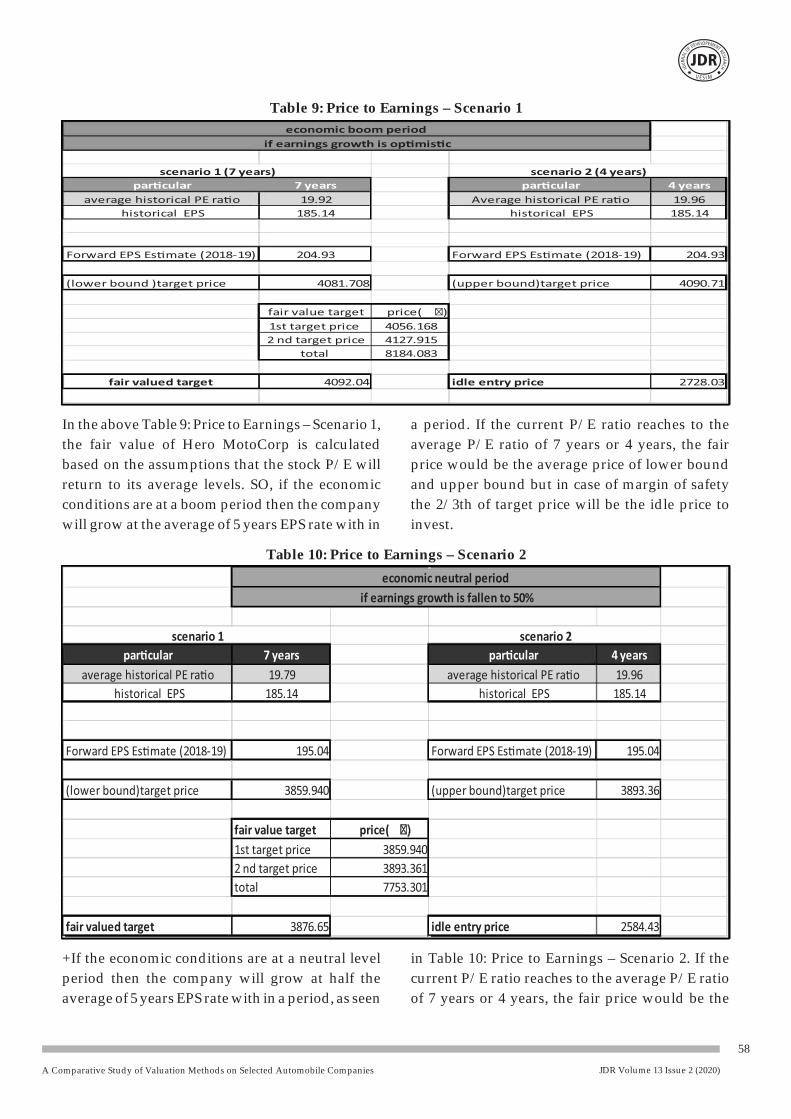
In the above Table 9: Price to Earnings – Scenario 1, a period. If the current P/E ratio reaches to the
the fair value of Hero MotoCorp is calculated average P/E ratio of 7 years or 4 years, the fair
based on the assumptions that the stock P/E will price would be the average price of lower bound
return to its average levels. SO, if the economic and upper bound but in case of margin of safety
conditions are at a boom period then the company the 2/3th of target price will be the idle price to
will grow at the average of 5 years EPS rate with in invest.
Table 9: Price to Earnings – Scenario 1
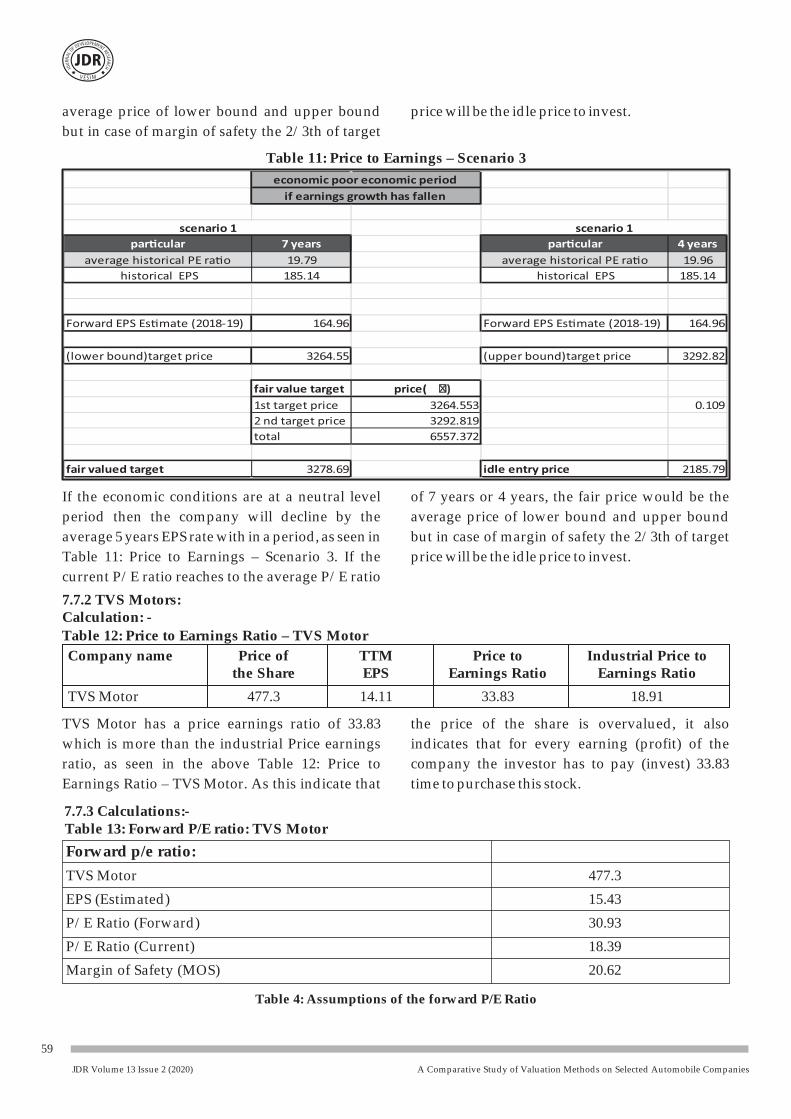
Table 10: Price to Earnings – Scenario 2
+If the economic conditions are at a neutral level in Table 10: Price to Earnings – Scenario 2. If the
period then the company will grow at half the current P/E ratio reaches to the average P/E ratio
average of 5 years EPS rate with in a period, as seen of 7 years or 4 years, the fair price would be the
A Comparative Study of Valuation Methods on Selected Automobile Companies
59
JDR Volume 13 Issue 2 (2020)
Table 12: Price to Earnings Ratio – TVS Motor
average price of lower bound and upper bound price will be the idle price to invest.
but in case of margin of safety the 2/3th of target
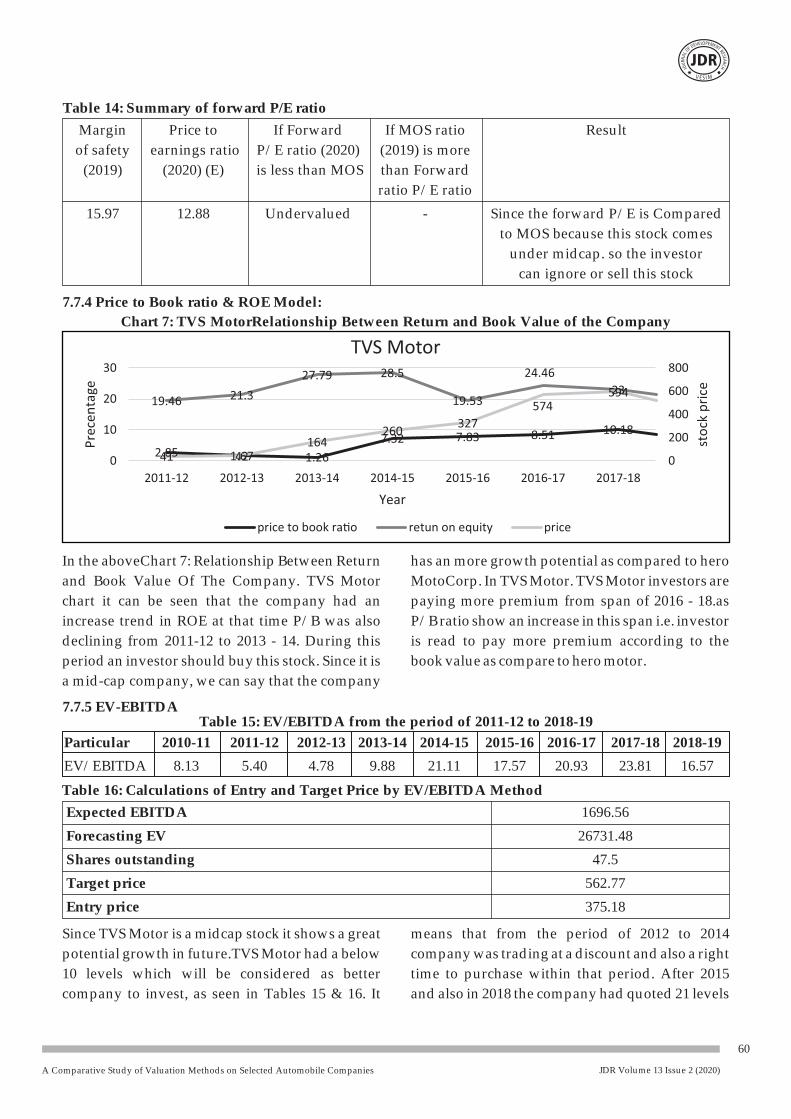
Table 11: Price to Earnings – Scenario 3
If the economic conditions are at a neutral level of 7 years or 4 years, the fair price would be the
period then the company will decline by the average price of lower bound and upper bound
average 5 years EPS rate with in a period, as seen in but in case of margin of safety the 2/3th of target
Table 11: Price to Earnings – Scenario 3. If the price will be the idle price to invest.
current P/E ratio reaches to the average P/E ratio
7.7.2 TVS Motors:Calculation: -
Company name Price of TTM Price to Industrial Price to the Share EPS Earnings Ratio Earnings Ratio
TVS Motor 477.3 14.11 33.83 18.91
TVS Motor has a price earnings ratio of 33.83 the price of the share is overvalued, it also
which is more than the industrial Price earnings indicates that for every earning (profit) of the
ratio, as seen in the above Table 12: Price to company the investor has to pay (invest) 33.83
Earnings Ratio – TVS Motor. As this indicate that time to purchase this stock.
7.7.3 Calculations:- Table 13: Forward P/E ratio: TVS Motor
Table 4: Assumptions of the forward P/E Ratio
Forward p/e ratio:
TVS Motor 477.3
EPS (Estimated) 15.43
P/E Ratio (Forward) 30.93
P/E Ratio (Current) 18.39
Margin of Safety (MOS) 20.62
A Comparative Study of Valuation Methods on Selected Automobile Companies
60
JDR Volume 13 Issue 2 (2020)
Particular 2010-11 2011-12 2012-13 2013-14 2014-15 2015-16 2016-17 2017-18 2018-19
EV/EBITDA 8.13 5.40 4.78 9.88 21.11 17.57 20.93 23.81 16.57
Table 14: Summary of forward P/E ratio
Margin Price to If Forward If MOS ratio Result
of safety earnings ratio P/E ratio (2020) (2019) is more
(2019) (2020) (E) is less than MOS than Forward
ratio P/E ratio
15.97 12.88 Undervalued - Since the forward P/E is Compared
to MOS because this stock comes
under midcap. so the investor
can ignore or sell this stock
7.7.4 Price to Book ratio & ROE Model:
Chart 7: TVS MotorRelationship Between Return and Book Value of the Company
7.7.5 EV-EBITDATable 15: EV/EBITDA from the period of 2011-12 to 2018-19
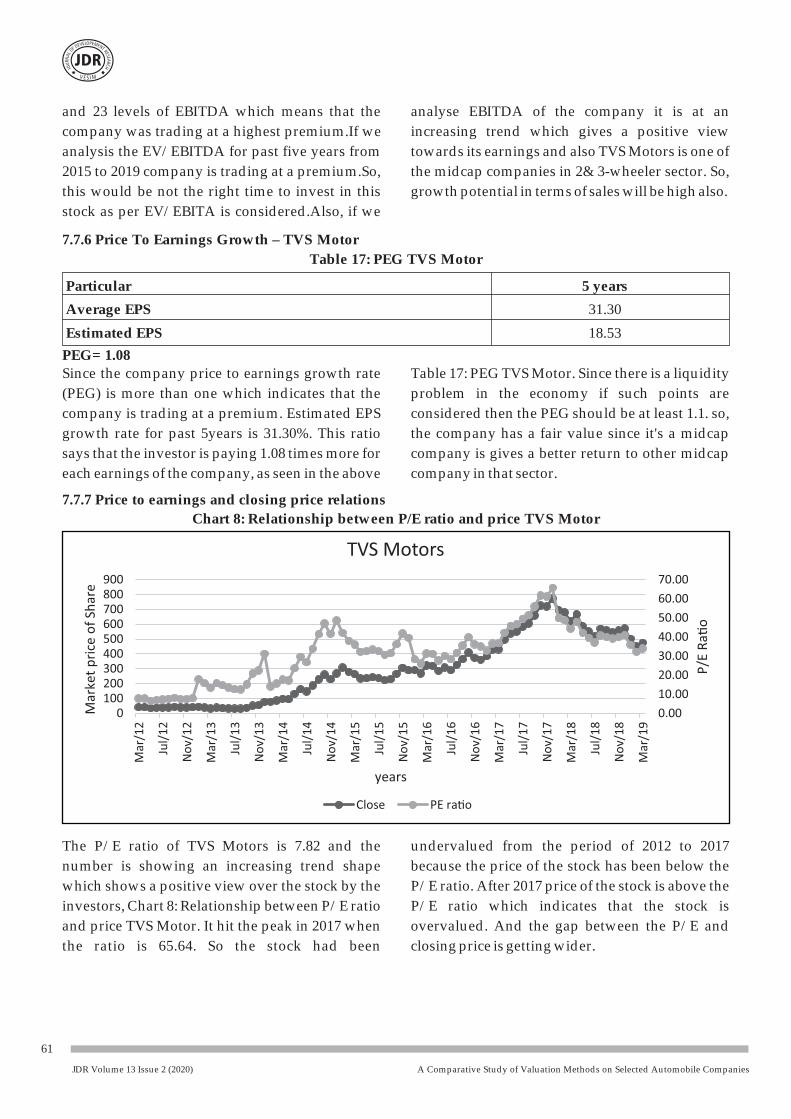
In the aboveChart 7: Relationship Between Return has an more growth potential as compared to hero
and Book Value Of The Company. TVS Motor MotoCorp. In TVS Motor. TVS Motor investors are
chart it can be seen that the company had an paying more premium from span of 2016 - 18.as
increase trend in ROE at that time P/B was also P/B ratio show an increase in this span i.e. investor
declining from 2011-12 to 2013 - 14. During this is read to pay more premium according to the
period an investor should buy this stock. Since it is book value as compare to hero motor.
a mid-cap company, we can say that the company
Table 16: Calculations of Entry and Target Price by EV/EBITDA Method
Expected EBITDA 1696.56
Forecasting EV 26731.48
Shares outstanding 47.5
Target price 562.77
Entry price 375.18
Since TVS Motor is a midcap stock it shows a great means that from the period of 2012 to 2014
potential growth in future.TVS Motor had a below company was trading at a discount and also a right
10 levels which will be considered as better time to purchase within that period. After 2015
company to invest, as seen in Tables 15 & 16. It and also in 2018 the company had quoted 21 levels
A Comparative Study of Valuation Methods on Selected Automobile Companies
61
JDR Volume 13 Issue 2 (2020)
and 23 levels of EBITDA which means that the analyse EBITDA of the company it is at an
company was trading at a highest premium.If we increasing trend which gives a positive view
analysis the EV/EBITDA for past five years from towards its earnings and also TVS Motors is one of
2015 to 2019 company is trading at a premium.So, the midcap companies in 2& 3-wheeler sector. So,
this would be not the right time to invest in this growth potential in terms of sales will be high also.
stock as per EV/EBITA is considered.Also, if we
7.7.6 Price To Earnings Growth – TVS Motor
Table 17: PEG TVS Motor
Particular 5 years
Average EPS 31.30
Estimated EPS 18.53
PEG= 1.08Since the company price to earnings growth rate Table 17: PEG TVS Motor. Since there is a liquidity
(PEG) is more than one which indicates that the problem in the economy if such points are
company is trading at a premium. Estimated EPS considered then the PEG should be at least 1.1. so,
growth rate for past 5years is 31.30%. This ratio the company has a fair value since it's a midcap
says that the investor is paying 1.08 times more for company is gives a better return to other midcap
each earnings of the company, as seen in the above company in that sector.
7.7.7 Price to earnings and closing price relations
Chart 8: Relationship between P/E ratio and price TVS Motor
The P/E ratio of TVS Motors is 7.82 and the undervalued from the period of 2012 to 2017
number is showing an increasing trend shape because the price of the stock has been below the
which shows a positive view over the stock by the P/E ratio. After 2017 price of the stock is above the
investors, Chart 8: Relationship between P/E ratio P/E ratio which indicates that the stock is
and price TVS Motor. It hit the peak in 2017 when overvalued. And the gap between the P/E and
the ratio is 65.64. So the stock had been closing price is getting wider.

A Comparative Study of Valuation Methods on Selected Automobile Companies
62
JDR Volume 13 Issue 2 (2020)
7.7.8 Price to Earnings Valuations: (TVS Motors)Table 17: Price to Earnings – Scenario 1
In the above Table 17: Price to Earnings – Scenario a period. If the current P/E ratio reaches to the
1, the fair value of TVS Motors is calculated based average P/E ratio of 7 years or 4 years. The fair
on the assumptions that the stock P/E will return price would be the average price of lower bound
to its average levels. SO, if the economic and upper bound but in case of margin of safety
conditions are at a boom period then the company the 2/3th of target price will be the idle price.
will grow at the average of 5 years EPS rate with in
Table 18: Price to Earnings – Scenario 2
If the economic conditions are at a neutral level average price of lower bound and upper bound
period then the company will grow at half the but in case of margin of safety the 2/3th of target
average of 5 years EPS rate with in a period. If the price will be the idle price to invest; as seen in
current P/E ratio reaches to the average P/E ratio Table 18: Price to Earnings – Scenario 2.
of 7 years or 4 years. The fair price would be the
A Comparative Study of Valuation Methods on Selected Automobile Companies
63
JDR Volume 13 Issue 2 (2020)
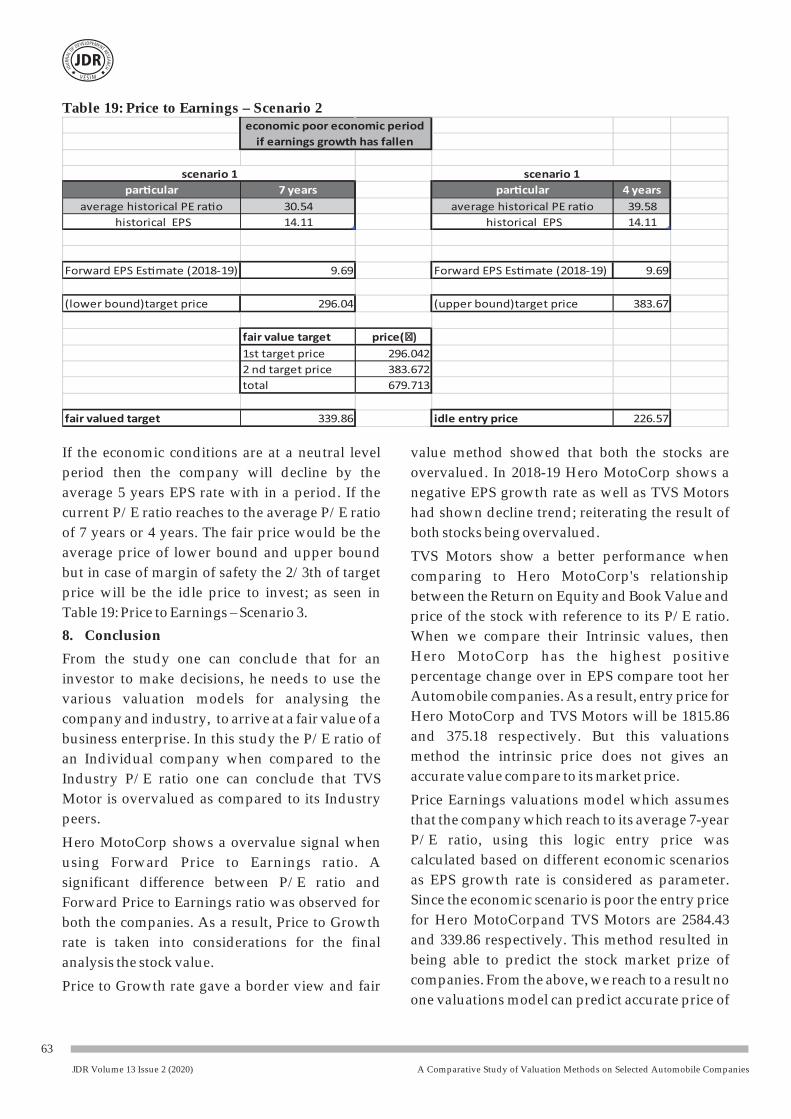
Table 19: Price to Earnings – Scenario 2
If the economic conditions are at a neutral level value method showed that both the stocks are
period then the company will decline by the overvalued. In 2018-19 Hero MotoCorp shows a
average 5 years EPS rate with in a period. If the negative EPS growth rate as well as TVS Motors
current P/E ratio reaches to the average P/E ratio had shown decline trend; reiterating the result of
of 7 years or 4 years. The fair price would be the both stocks being overvalued.
average price of lower bound and upper bound TVS Motors show a better performance when but in case of margin of safety the 2/3th of target comparing to Hero MotoCorp's relationship price will be the idle price to invest; as seen in between the Return on Equity and Book Value and Table 19: Price to Earnings – Scenario 3. price of the stock with reference to its P/E ratio.
8. Conclusion When we compare their Intrinsic values, then
Hero MotoCorp has the highest positive From the study one can conclude that for an percentage change over in EPS compare toot her investor to make decisions, he needs to use the Automobile companies. As a result, entry price for various valuation models for analysing the Hero MotoCorp and TVS Motors will be 1815.86 company and industry, to arrive at a fair value of a and 375.18 respectively. But this valuations business enterprise. In this study the P/E ratio of method the intrinsic price does not gives an an Individual company when compared to the accurate value compare to its market price. Industry P/E ratio one can conclude that TVS
Motor is overvalued as compared to its Industry Price Earnings valuations model which assumes
peers. that the company which reach to its average 7-year
P/E ratio, using this logic entry price was Hero MotoCorp shows a overvalue signal when calculated based on different economic scenarios using Forward Price to Earnings ratio. A as EPS growth rate is considered as parameter. significant difference between P/E ratio and Since the economic scenario is poor the entry price Forward Price to Earnings ratio was observed for for Hero MotoCorpand TVS Motors are 2584.43 both the companies. As a result, Price to Growth and 339.86 respectively. This method resulted in rate is taken into considerations for the final being able to predict the stock market prize of analysis the stock value.companies. From the above, we reach to a result no Price to Growth rate gave a border view and fair one valuations model can predict accurate price of
A Comparative Study of Valuation Methods on Selected Automobile Companies
64
JDR Volume 13 Issue 2 (2020)
at NSE. Adv. Research in Dynamical and Control Systems, the company without considering economic pp.1-10.scenarios and factors impacting the Industry.
Soni , S., & Chandak, G. (2017). Fundamental Analysis The study concludes that cruelty the Two-three-of Car Manufacturing Companies in India for 1.4.2005 wheeler Automobile Industry stocks are to 31.3.2016. International Research Journal of
overvalued and based on Price Earnings Management, IT & Social Sciences (IRJMIS), pp.34-45.
valuations model gives a better result rather than Wafi, A. S., Hassan, H., & Mabrouk, A. (2015).
other valuations method which are used in this Fundamental Analysis Models in Financial Markets.
research for valuations of Automobile company.Procedia Economics and Finance 30, pp.939-947.
References Hema, J and Ariram, V. (2016). Fundamental Analysis Lajevardi, S. A. (2014). A study on the effect of P/E and with special reference to pharmaceutical companies PEG ratios on stock returns: Evidence from Tehran listed in NSE, International journal of management, 7(2), Stock Exchange. Management Science Letters, 4, pp.1401- pp. 123-1331410. Tiwari, P. and Verma, H. A.(2009). Fundamental Pandya, H., & Pandya, H. (2013). Fundamental analysis analysis of public sector banks in India, Indian journal of of Indian automobile industry. International Journal of finance, 3(1).Current Research Vol. 5, Issue, 5, pp.1273-1286. Kulkarni, S. (2011). A study on fundamental analysis of Pathade, V. P. (2017). Equity research: Fundamental ONGC, International journal of multi disciplinary research, analysis for long term investment. International Journal 8(1), pp 383-392.of Applied Research 2017; 3(4), pp. 678-682. Venkatesh,C.K. and Tyagi,M.(2011). Fundamental Ghaeli, M. R. (2017). Price-to-earnings ratio: A state-of- analysis as a method of share valuation in comparison art review. Accounting 3 (2017), pp.131-136. with technical analysis, Bangladesh research publications
journal, 5(3), pp. 167-174IBEF (2018). Retrieved from India Brand Equity
www.ibef.org
S, S. K., J, A. J., & Ambily, D. S. (2017). A study on
Fundamental Analysis of Selected IT companies Listed