comparative study of selected non destructive testing...
TRANSCRIPT

32 Transportation Research Record 852
Comparative Study of Selected Non destructive
Testing Devices MARIO S. HOFFMAN AND MARSHALL R. THOMPSON
An extensive program of flexible-pavement nondestructive testing (NDTI was conducted by the Illinois Department of Transportation (I DOT) in cooperation with the University of Illinois. Different !mostly in-service) pavements were tested. Conventional granular base and stabilized base material sections were studied. NOT rlAvi~"' uMUI were the IDOT road rater model 2008, the Benkel· man beam, and the falling-weight deflectometer. An accelerometer was used to measure surface pavement deflections under moving trucks. The main find· ings of the comparative NOT program are reported. Deflection-basin parameters for structural pavement evaluation are defined. Correlations and comparisons between the different devices are presented. Overall, the falling-weight deflect· ometer is the best NOT device for simulating pavement response under moving wheel loads. The road rater, because of its harmonic loading without rest periods and the static preload, induces pavement deflections lower than those achieved with the falling-weight deflectometer and moving wheel loads. Finally, the quasistatic loading in Benkelman beam measurements induces the highest pavement deflections.
There is general agreement among pavement engineers and researchers that pavement surface deflection-basin measurements provide valuable information for structural evaluation. Pavement deflections, however, are highly dependent on loading mode (vibratory, impulse, vehicular) and magnitude. The ideal responses for structural pavement evaluation are thus surface deflections under moving design loads. One of the main goals of this study was to determine the nondestructive testing (NOT) equipment and procedure that best simulate pavement response under moving loads.
With that goal i."1 mind, th" Illinois Department of Transportation (IDOT) in cooperation with the University of Illinois has developed an extensive flexible-pavement evaluation method based on the interpretation of measured surface deflections (l,.£l. The first stage of the program included the collection of 11 000 deflection measurements over a period of three years on different !mostly in-service) pavements.
Throughout the deflection data collection, different selected NOT devices and methods were used. These included the Benkelman beam (BB) , IDOT road rater (RR), falling-weight deflectometer (FWD), and an accelerometer implanted in the pavement's surface to measure deflections under different moving trucks at varying speeds.
The different types of pavements tested in the program (see Table 1) included the following:
1. Conventional flexible pavements: asphalt-concrete (AC) surface over granular bases and subbases;
2. Stabilized pavements: AC surface over a stabilized base including cement aggregate mixture (CAM), pozzolanic aggregate mixture (PAM), and bitumen aggregate mixture (BAM);
3. Surface treatments: a nominal asphalt and chips covering over a granular base; and
4. Test sections: selected flexible sections in Loop 1 of the American Association of State Highway Officials (AASHO) Test Road in Ottawa, Illinois.
Except for the sections on Loop 1 of the AASHO Test Road, all the sections are in-service pavements. The effects of the following factors on surface deflections were investigated: RR load and driving frequency, FWD load, seasonal effects, vehicle weight and speed, and loading mode--quasistatic (BB) , steady-state (RR) , impulse (FWD), and
vehicular (moving trucks) • In addition to the deflection data collection, most pavement sections in the program were sampled for subsequent laboratory testing.
This pap@r pr@a@nta th@ main f indinga of th@ comparative study of selected NOT devices. A detailed description of this study and a full summary of the results have been presented elsewhere <1l· An extensive literature review of other deflection studies has also been given elsewhere 11 1.£).
NOT EQUIPMENT AND PROCEDURES
To facilitate the direct comparison of the different NOT devices, soil type and existing pavement conditions were kept uniform. Measurements were made on 20 points in each 100-ft-long section of pavement. The same 20 points (10 on each traffic lane, 10 ft apart) were tested at different times during a three-year period.
Benkelman Beam
A truck that had an 18-kip rear axle with dual tires (70-80 psi tire pressure) was used in the BB rebound method. The rebound deflection of the pavement was measured when the truck moved away from the testing point at creep speed.
Road Rater
The RR !model 2008) used in the study is an electrohydraulic vibrator capable of generating harmonic loads of up to 8 kips (peak to peak) at driving frequencies between 6 and 60 Hz. When the vibrator is set over the testing point, a static preload of 5 kips is applied through the 12-in-diameter circular loading plate. The desired peak-to-peak load is then generated at the preselected driving frequency, and peak-to-peak deflections are recorded with velocity transducers (geophones). The !DOT RR has four deflection sensors, located at the center of
Table 1. Description of pavement sections.
Sectio n
Bement
Coffeen Deland Hillsboro
Midlothian "A"
Midlothian "B"
Monticello Neoga North Neoga South Pana Sherrard Viola AASH0-845
AASH0-872 AASH0-874
Cross Section
Asphalt concrete, 4 in ; field-mixed soil cement, 6 in
Asphalt concrete, 3 in; lime-fly ash, I 0 in Surface treatment; granular base B, 8 in Asphalt concrete, 6.3 in; seal treatment, 2 in;
crushed gravel, 6 in Asphalt concrete, 5 in; lime-fly ash, 6 in; gravel,
lOin Asphalt concrete, 7 in; gravel , 7 in ; lime-fly ash , 6in
Asphalt concrete, 3.5 in; plant-mixed CAM, 8 in Asphalt concrete, 5.5 in; BAM, 7 in Asphalt concrete, 2.5 in; BAM, 7 in Asphalt concrete, 5.5 in; BAM (MC-800), 10 in Asphalt concrete, 4 in; crushed stone, 14 in BAM (HFE-300), 9 in Asphalt concrete, 3 in; crushed stone, 6 in ;
sandy gravel, 8 in Asphalt concrete, 5 in; crushed stone, 6 in Asphalt concrete, 5 in; crushed stone, 6 in; sandy gravel, 16 in
Sub grade Classification (AASHTO)
A-7-6(24)
A-4(5) A-7-6(21) A-7-6(18)
A-6(14)
A-6(10)
A-6(8) A-7-6(18) A-6(8) A-7-6(16) A-4(6) A-6(9) A·6(6)
A-6(6) A-6(6)

Transportation Research Record 852
the loading plate and 1, 2, and 3 ft away from the center.
Fall i ng- Weight Defle ctome t er
The FWD is a deflection-testing device operating on the impulse-loading principle. A mass is dropped from a preselected height onto a footplate that is connected to a baseplate by a set of springs. The baseplate (12 in in diameter) is placed in contact with the pavement surface over the testing point. By varying the drop height, the impulse load was varied from 2 to 11 kips. The duration of the impulse loading ranges from 30 to 40 ms.
FWD deflections are measured with v e locity transducers (geophones). One of these sensors is located at the center of the loading plate. Two additional sensors are movable and can be placed at any desired
Figure 1. Deflectionbasin characterization.
DO
uo
•AREA"
AREA ClllCH) • 6 Cl + 2 Dl + 2 D2
DO DO
Figure 2. BB versus RR coefficients of variability.
45,......--,...........,,...........,,...........,,.........,.,.........,.,.........,.,.........,.,........,,
/ 40 • /
a!?- / 35 /
c: / Line of .!! -~ 30 • • / Equal it
0 / • / > 2~ • • 0 / • / c 20 ••• ~ . !!! / . ~ • 15 -· ./ • Q; 0 / u 10 /
,• =0.01 m e/ • • m _Jj /
/
10 15 20 25 30 35 40 45
RR Coefficient of Variation, %
D3
DO
D3
DO
Table 2. Variables in stepwise multiple-regression analysis of BB and RR deflections.
Variable Considered
BB: Benkelman-beam deflection (mils) RR: road rater dertection• (mils) Fl: RR shape factor 1 F2: RR shape factor 2 Area: RR deflection-basin area (in) T: surface pavement temperature ('F) Tac: thickness of AC layer (in) Tgr: thickness of granular layer (in) Tsta: thickness of sta bilized layer (in) Sta: Flag = I if stabilized layer in section; 0 if not Seas: Flag = I i[ spring measurement; 0 if other
a8-kip peak-to-peak load; 15-Hz driving frequency.
Ra nge o[ Values
Max
194.0 99.0 1.68 1.83 3 1.4 115 8 .0 14.0 10 .0
Min
8.0 5,8 0.15 0.20 15.7 64 0.0 0.0 0.0
33
distance away from the center of the plate. During this testing program, the FWD sensors were placed 1, 2, and 3 ft away from the center of the loading plate, the same spacing used for the RR.
Accelerometer Measurements
An accelerometer was implanted in the surface of selected AASHO Test Road (Loop 1) sections (sections 845, 872, and 874) to measure deflections under moving trucks and under the FWD's loading plate. The accelerometer was placed in a hole 2 in in diameter by 2 in deep in the outer wheelpath. The single wire coming off the accelerometer was buried in a slot 1 in deep and 3/ 8 in wide sawed perpendicular to the direction of travel.
The following trucks were used in the testing :
Truck Light Medium Heavy
Rear-Axle Wei ght (lb)
5 100 9 000
18 000
The trucks distributed the rear-axle weight shown through a single-axle, dual-wheel configuration. Truck speeds ranged from 8 to 30 mph.
DEFLECTION-BASIN CHARACTERIZATION
The deflection basin, measured with the RR and FWD, is characterized as follows:
1. DO, centerline plate deflection; 2. Dl, D2, D3, surface deflections at 1, 2, and 3
ft, respectively; 3. Deflection-basin area, parameter combining all
measured deflections in basin (see Figure 1), defined as Area (in) 6 (1 + 2Dl/DO + 2D2/ DO + D3 / DO); and
4. Fl, F2, basin shape factors (dimensionless), Fl = (DO - D2)/Dl and F2 = (Dl - D3)/D2.
The deflection-basin area ranges from a calculated practical minimum of 11 in (Boussinesq approximation) to a maximum of 36 in (maximum by definition). Also, the area increases with increasing pavement stiffness Ill· The basin shape factors are analogous to a derivative of the deflection-basin curves, representing the variation of surface deflection with lateral distance from the centerline. In general, stiff pavements have lower shape factors I.!) •
RESULTS
Compa ri s on of BB a nd RR De f l ections
The comparative study between BB and RR deflections was performed on 12 different in-service pavement sections. Nine of the sections were tested twice at different times of the year for a total of 21 cases. The RR followed the BB at routine RR testing conditions of 8-kip peak-to-peak load and 15-Hz driving frequency. The same 20 points pee section were evaluated at each testing date . The following results were obtained:
1. Without exception, mean BB deflections were higher than mean RR deflections; the ratio of mean BB and mean RR deflections ranged from 1.1 to 5.8.
2. The variability of the BB deflections was generally larger than that of the RR (18 of 21 cases). The mean coefficient of variation with the BB data was 19 percent and that of the RR data was 14 percent (Figure 2). There is no linear correlation between the BB and RR coefficients of variation
34 Transportation Research Record 852
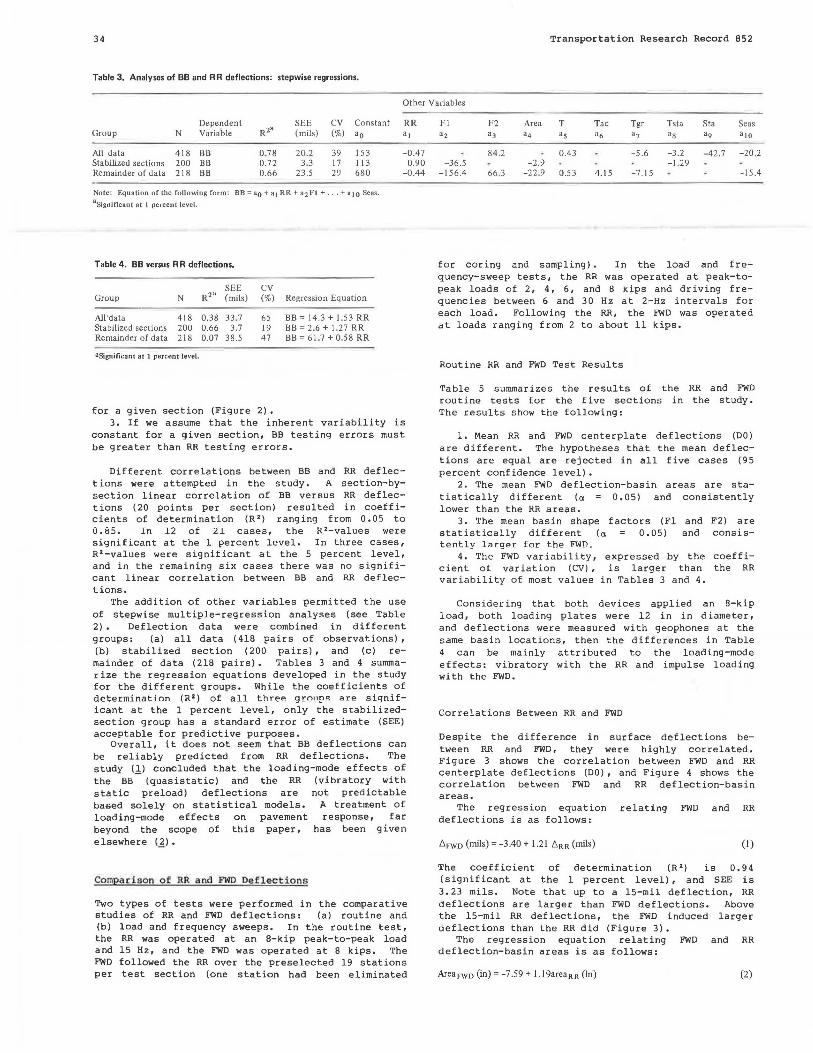
Table 3. Analyses of BB and RR deflections : stepwise regressions.
Other Variables
Dependent SEE CV Constant RR Group N Variable R1• (mils) (%) •o • 1
All data 418 BB 0.78 20.2 39 153 -0.47 Stabilized sections 200 BB 0.72 3.3 17 113 0.90 Remainder of data 218 BB 0.66 23.5 29 680 -0.44
Note: Equation of the following fol"m: BB ;ao + a1 RR + a2FI + ... + a10 Seas.
aSignificant at 1 percent level.
Table 4. BB versus RR deflections.
SEE CV Group N R1• (mils) (%) Regression Equation
All'data 418 0.38 33.7 65 BB= 14.3 + 1.53 RR Stabilized sections 200 0.66 3.7 19 BB= 2.6 + 1.27 RR Remainder of data 218 O.D7 38.5 47 BB= 61.7 + 0.58 RR
3Significant at l percent level.
for a given sect i on (Figure 2 ) . 3. If we assume that the inherent variability is
constant for a given section, BB testing errors must be greater than RR testing errors.
Different correlations between BB and RR deflect ions were attempted in the study. A section-bysection linear correlation of BB versus RR deflections (20 points per section) resulted in coefficients of determination (R') ranging from 0.05 to 0.85. ln 12 of 21 cases, the R'-values were significant at the 1 percent level. In three cases, R'-values were significant at the 5 percent level, and in the remaining six cases there was no significant linear correlation between BB and RR deflections.
The addition of other variables permitted the use of stepwise multiple-regression analyses (see Table 2) • Deflection data were combined in different groups: (a) all data (418 pairs of observations), (b) stabilized section (200 pairs), and (c) remainder of data (218 pairs). Tables 3 and 4 summarize the regression equations developed in the study for the different groups. While the coefficients of determination (R2) of a ll three g r oups are significant at the 1 percent level, only the stabilizedsection group has a standard error of estimate (SEE) acceptable for predictive purposes.
Overall, it does not seem that BB deflections can be reliably predicted from RR deflections. The study (1) concluded that the loading-mode effects of the BB- (quasistatic) and the RR (vibratory with static preload) deflections are not predictable based solely on statistical models. A treatment of loading-mode effects on pavement response, far beyond the scope of this paper, has been given elsewhere (]).
Comparison of RR a nd FWD De f l e ctions
Two types of tests were performed in the comparative studies of RR and FWD deflections: (a) routine and (b) load and frequency sweeps. In the routine test, the RR was operated at an 8-kip peak-to-peak load and 15 Hz, and the FWD was operated at 8 kips. The FWD followed the RR over the preselected 19 stations per test section (one station had been eliminated
Fl F2 Area T Tac Tgr Tsta Sta Seas a1 a3 a4 as .6 a7 •s •9 •10
84.2 0.43 -5.6 -3.2 -42.7 -20.2 -36 .5 -2.9 -1.29
-156.4 66.3 -22 .9 0.5 3 4.15 -7.15 -15.4
for coring and sampling). In the load and frequency-sweep tests, the RR was operated at peak-topeak loads of 2, 4, 6, and 8 kips and driving frequencies between 6 and 30 Hz at 2-Hz intervals for each load. Following the RR, the FWD was operated at loads ranging from 2 to about 11 kips.
Routine RR and FWD Test Results
Table 5 summarizes the results of the RR and FWD routine tests for the five sections in the study. The results show the following:
1. Mean RR and FWD centerplate deflections (DO) are different. The hypotheses that the mean deflections are equal are rejected in all five cases (95 percent confidence level).
2. The mean FWD deflection-basin areas are sta-tistically different (a 0.05) and consistently lower than the RR areas.
3. The mean basin shape factors (Fl and F2) are statistically different (a 0.05) and consis-tently larger for the FWD"
4. The FWD variability, expressed by the coefficient of variation (CV), is larger than the RR variability of most values in Tables 3 and 4.
Considering that both devices applied an 8-kip load, both loading plates were 12 in in diameter, and deflections were measured with geophones at the same basin locations, then the differences in Table 4 can be mainly attributed to the loading-mode effects: vibratory with the RR and impulse loading with the FWD .
Correlations Between RR and FWD
Despite the difference in surface deflections between RR and FWD, they were highly correlated. Figure 3 shows the correlation between FWD and RR centerplate deflections (DO) , and Figure 4 shows the correlation between FWD and RR deflection-basin areas.
The regression equation relating FWD and RR deflections is as follows:
/::,.FWD (mils)= -3.40 + 1.21 /::,.RR (mils) (l)
The coefficient of determination (R 2 ) is 0.94 (significant at the 1 percent level), and SEE is 3.23 mils. Note that up to a 15-mil deflection, RR deflections are larger than FWD deflections. Above the 15-mil RR deflections, the FWD induced larger deflections than the RR did (Figure 3).
The regression equation relating FWD and RR deflection-basin areas is as follows:
Area FWo (in)= -7.59 + l.l9areaRR (in) (2)

Transportation Research Record 852
Table 5. Summary of FWD and RR deflections.
DO
Pavement Deflec· Tempera tu re Measurement lion SD CV
Section Date (°F) Device (mils) (mils) (%)
Bement 10/17/79 83 RR 14.92 2.59 17.40 FWD 12.93 2.91. 22.50
Deland 10/17/79 67 RR 40.50 3.53 8.70 FWD 43.47 5.34 12.30
Monticello 10/17/79 60 RR 14.39 2.55 17.70 FWD 12.04 3.00 24.90
Sherrard 10/19/79 83 RR 16.24 0.61 3.70 FWD 17 .85 0.77 4.30
Viola 10/19/79 65 RR 28.21 3.92 13.90 FWD 34.64 4.37 12.60
Shape Factor
Fl
CV Value SD (%)
Bement 10/17/79 83 RR 0.44 0.10 22.10 FWD 0.56 0.16 29.30
Deland 10/17/79 67 RR 1.08 0.05 4.90 FWD 1.89 0.15 7.70
Monticello 10/17/79 60 RR 0.47 0.13 26.70 FWD 0.65 0.17 26.10
Sherrard 10/19/79 83 RR 0.74 0.06 8.00 FWD 1.09 0.12 11.10
Viola 10/19/79 65 RR 1.44 0.14 9.50 FWD 2.23 0.36 16.30
Notes: RR at 8001'.rlb peak-to-peak load, 1 S Hz, 19 stations per section. FWO at 8000-lb ±5 percent, I 9 stations per section.
Figure 3. Correlation between FWD and RR deflections.
so~~-.-B~E-M_E_N_T~~--.~~~~~~~~~~--.~~--.~~~
c .!! u ~
~ 40
.. .. e 0
~ 30 6; Q
.. c
~ 10
0 0
• DELAND / / • MONTICELLO / I o SHERR ARO / • • VIOLA /• //
10
/ •/ · / ,,. / "/
/ •. / &/ .. •• /. ~
. I . ....... / • • 1
3.23 mils
RA al S.OOOlb peok lo peak load; 15 Hz
FWD al 8 0000 lb ! 5 'l'o
20 30 40
Rood Rallr Deflection, mill
50
where the coefficient of determination is O. 95 and SEE is l.14 in (Figure 4).
From the point of view of evaluation of structural pavement, pavements are stiffer when evaluated from RR data. The stiffening effect of the- RR can be attributed to the static RR preload and the harmonic loading without rest periods <1>. A summary of regression relations between FWD and RR deflection-basin parameters is given in Table 6.
60
35
DI D2 DJ
Deflec- Deflec- Deflec-lion SD CV lion SD CV lion SD CV (mils) (mils) (%) (mils) (mils) (%) (mils) (mils) (%)
11.91 1.66 13.90 9.51 0.91 9.60 7.61 0.70 9.20 9.96 1.66 16.7 0 7.20 0.77 10.60 5.22 0.45 8.60
24.08 2.25 9.30 14.45 0.76 5.30 11.16 0.50 4 .50 19.07 2.98 15.60 7.55 0.24 3.20 5.33 0.19 3.50 11.39 1.75 15.30 8.87 0.79 8.90 7.25 0.42 5.80 8.74 1.52 17.40 6.16 0.72 11.70 4.29 0.31 7 .30
11.61 0.57 4 .90 7.71 0.30 3.90 4.45 0.23 4.20 10.69 0.53 5.00 6.20 0.38 6.20 4.18 0.15 3.70 14.11 2.11 14.90 8.00 1.37 17.20 6.16 1.12 18.20 13.18 2.03 15.40 5.72 0.92 16.00 3.77 0.80 21.10
Area
F2 Deflec-ti on
CV Basin SD CV Value SD (%) (in) (in) (%)
0.45 0.12 26.30 26.53 1.58 5.90 0.65 0.18 28.40 24.81 2.34 9.50 0.89 0.13 14.80 19.10 0.46 2.40 1.82 0.41 22.50 14.12 0.55 3.90 0.46 0.15 31 .60 26.18 1.91 7.30 0.71 0.14 19.70 23.46 2.15 9.20 0.80 0.D? 8.60 22.30 0.70 3.10 1.05 0.o7 7.00 18.78 0.88 4.70 1.01 0.20 20.30 16.72 0.76 4.50 1.64 0.16 9.80 13 .22 0.95 7.20
Figure 4. Correlation between FWD and RR areas.
32
• BEMENT / 30 • DELANO
/ . MONTICELLO
c SHERRARD / / 28
a .. .:; 26
.. 24 .. E 2 22 u . .
Q 20
.c
: 18 ;it
~ 16
o ... 14
12
VIOLA
'Areo~WD(lnl •-7.59 • l.19'Areo"R~in.l
n a 95
f-• 0.95(s1Qnificonl ol I "lo)
. / .•.. ·t.· .:,; • ... ,. .
. ... :.J .. • /
• Y• ;/r RR 01 8,DDO lb peok to peok; 15 Hz / / FWD ol e 000 lb ! 5 "'4.
12 14 16 18 20 22 24 26 28
Rood Roter'1 11 Areo'\ in .
RR and FWD Load and Frequency-Sweep Tests
/ / .
3D 32
Figure 5 shows results of typical RR and FWD load and frequency-sweep tests. The left-hand side of Figure 5 shows the variation of centerplate RR deflections with load and driving frequency. The right-hand side shows the variation of RR and FWD centerplate deflections with load. Numerous data similar to those in Figure 5 were gathered in the study; they are summarized elsewhere (!,).
Figure 5 shows that

36 Transportation Research Record 852
1. The different sections show a distinct RR peak deflection at different driving frequencies;
3. For the Monticello section, RR and FWD centerplate deflections agree at a driving frequency of 22-24 Hz for all load magnitudes; and 2. For a given section, the driving frequency
corresponding to the peak RR deflection is the same for all peak-to-peak loads;
4. For the Sherrard and Deland sections, the FWD induces larger deflections than the RR at all loads and driving frequencies.
Table 6. Correlations between FWD and RR deflections. To investigate the erratic response of different
pavements to RR and FWD load and frequency tests, it is necessary to use pavement models capable of incorporating time or rate-of-loading variables. Hoffman used dynamic and viscous pavement models to that effect (1_). That study concluded that it is theoretically alffluult tu predict pavement response under one loading mode based on the response measured under a different loading mode, i.e., impulse response (FWD) from vibratory response (RR) • The main reason for that discrepancy is that the derived pavement parameters are dependent on loading mode and device (]) .
Mean Mean Dependent FWD
2" FWD RR
Variable A B R SEE Value Value
DO (111il~) -3.40 1.21 0.94 3.23 24 .19 22.8, DI (mils) 1.68 0.72 0.92 1.13 12.24 14.62 D2(m1ls) 3.98 0.27 0.54 0.64 6.57 9.71 D3(mils) 2.69 0.25 0.48 0.55 4.56 7 .52 Area (in) -7 .59 1.19 0.95 1.14 18 .88 22.17 Fl -0.15 1.73 0.93 0.19 1.29 0.84 F2 0.03 1.57 0.72 0.26 1.16 0.72
Notes: 1-"WO (var iable)= A+ Bx RR (variable), Area = 6(00 + 2Dl/DO + 202/00 + 03), Fl= (DO - D2)/Dl, F2 =(DI - D3)/D2.
RR at 8-kip peak-to-peak load and 15-Hz driving frequency; FWD at 8 kips ±S percent; N = 95.
Accele r ometer Test Results
8 Significant at 1 percent level.
Figure 5. RR versus FWD deflections.
An accelerometer was used to check the FWD data-ac-
"" I I -~~ 11 1--+--+--of----t--+---t--I STA TlON I! 1---1--t---t--i.-,, _Fw,-0__,._-t---;
.. P•l~lpo1 )
••l--+---t~t:::::-t---t~-t-->-.=="""'~1.._.,b.=;1-~1--u'r';+--+---1r--1----1 ..... i-.. r--... SHERRARD ///
14 t--+- -1--+---t--"-- -t--I 4 In AC ~ 14 In Cnrohd SI . ,,If~ V
~ 121----l-'*--~--1--+.-=:t.---l>====r="=:i::==i===+-,t.~l/~,.q: ' "'74--1----+- -1---I ~ 10 r K J /IV' k"r--... ,. 10 Hz:} t--
~ 1~ ._I-- V ;V V "''1"- ,.16 Hz RR ~ I -
~ 41 1--+...,.,:.:r:-..• '1"4[ -= ...... ..d.o--+--l--·I- • ~ V 1'1°30 Hz I I"' -re- ,7}, fY
4 t--t--_1---1-z--1--1---t--1--~~~~._1---+--1--+--1--1--o1---t--1
2 ~-t·!:'.'.· :+:~l!=~,,.._.j. ..... .l-__j~...f:2:::....j__j___j._-+--.l--t--l--+--t-_j 0
20
18 1--4--1--+--t--1---t--I STATION 13 t---tr--+--t---11----f"--f--irl---1
/ I t6 t--t--r-1i=~;:-o.t.;;:--1-~===i==1 ===1 ~1=:=;t--r-t--j--j--,.1Fwo -
/ P•Bktp• MONTICELLO / / 14 1--4- ....... ._+---4[\--1---t--I 3.51n AC
vi ( 8 In Plant CAM _AV v/ E 12 j__,~/ -1---Jr:~~-l--i==:r==:r==F=t--~,~~l~X',4-.-J--I-~
~ ~ 6 ......... /. ( )<(/<
~ 1: 1---1-.._.oi:::{ '--. //-:·) :/< ""' '\... f • 18 Hz}-
.,.......,, 4
/ ~~/ '" '- t•20Hz llll
~ 61--tl---, ,..,......,_"""'"nr-"-.-1--t-+--t-:~,.,,.l"-vrl--t--+--t"'-, i ·2s Hz -4 1--~~~+--t---!l---t--+~t----t-;?/~·./'-l-~t----t---t~-f--t---t~-t---J
__..2 ~ 2~~~+:=:~.+-..J..-l--f'::::_i-~-t---l--l-~--+-1---1---l 0
eo II I I • 451---t--+--#1+: -T-\P•~B_k_l~p•~_.,..--; STATIOM t, 1---1--~F-W~D~/+-+'-t---11---1---f--l / ,~~ / I •Ot--t-;;of---t-i--r--t-r='1=='==dl===k.-i-7f---¥--fl:---~--i--t--t 35 1---1-1/r-1---1---1-~11 s~~~ ~.~.?.. ... -- /~ l -l,..,.f.,_,_.,_.._.,_-+-1
BlnGr . BaHB / V'), E 301---1-111--J-+-. .,,-....._. 6 c
11 r "\ __. l) [/ t( "'-..,' '• 16 Hz} o 25 ! , / . /? ""- ' r• 8 Hz RR -
u / ~ °"' f•24Hz
~ 20 1, ...../ !'-..: /V -~ 1S l-+11_,..q=-1-=>-t-+..~-l--+--/4'/"->Yll".---l-+--l--+--l-~l-1---l
I 0 l--t--+-t--t-+-i- -l--+l/-A/ ,.,__ 1---1---1--1- - -- f---1--+---I ___..._..~2 f?'
5J--~~=t.:~---J..-+--t---f'.-+~l---l--t--l--t~l---l--t-~ n
0 & 10 • 15 20 25 3C 0 Or 1v1n g
Frequency,Hz
2 6 8 10 12 L o a d , P, k 1 ps

Transportation Research Record 852
quisition system and generate deflection data moving trucks at varying speeds. All tests performed on selected AASHO Test Road sections 1).
under were
(Loop
The simultaneous measurement of FWD deflections with the accelerometer and the FWD centerplate sensor showed almost identical results (Figure 6). The agreement indicates that both measuring techniques provide reliable results.
Accelerometer outputs were used to generate acceleration, velocity, and deflection signals under moving trucks (Figure 7) and blows of the FWD (Figure 8). Note in Figures 7 and 8 the vertical and horizontal scales for signal amplitude and time duration, respectively. From additional data similar to Figures 7 and 8, the study (1) concluded that (a) truck signals have a longer duration than FWP signals; typical truck "pulse" durations at 50 mph were estimated at 120 ms whereas FWD pulses are of the order of 30 ms; and (b) as an approximation, truck signals start at the edge of the deflection
Figure 6. FWD versus accelerometer deflections.
80
70 . e
60
~ c . 50 VI a ~ u. 40
E
~ 30 c 0
u 20 ..
'; a
10
0 0
• AASHO 874
o AASHO 872
• AASHO 845
10 20 30
line of equality
"' 17 r2~ 0,99
40 50 60 70
Def I eel ion rrom Accelerometer , mils
80 90
Figure 8. Typical FWD acceleration and deflection signals. First Blow
I~·
Bounce
a) Acceleration
AASH0-874
I"·A 20cm Drop
bl Dolloclian
37
basin zone of influence. Thus, the stiffer the pavement, the longer the equivalent truck pulse duration.
Pulse duration is relevant to the theoretical treatment of pavement response under different loading modes (]_). Bohn and others (~) performed
Figure 7. Acceleration, velocity, and deflection signals under moving trucks.
front axle
a) Accelerotion Signal
b) Velocity Signal
cl Dolltclian Signal
First BIO'tof
Bounce
a) Acceleration
AASH0-872
I,,,,. ~ 6 cm Drop
bl Dolleclion
rear axle
0.1 soc{all)
F AASH0-845
Medium Truck
v•l9.I mph
First Blow
Bounce
a) Accelerotion
AASH0-845
3.5 cm Drop
FA bl Delloclian
38
numerous moving-truck and FWD deflection measurements, and they also concluded that moving-truck signals were much longer than FWD deflection signals.
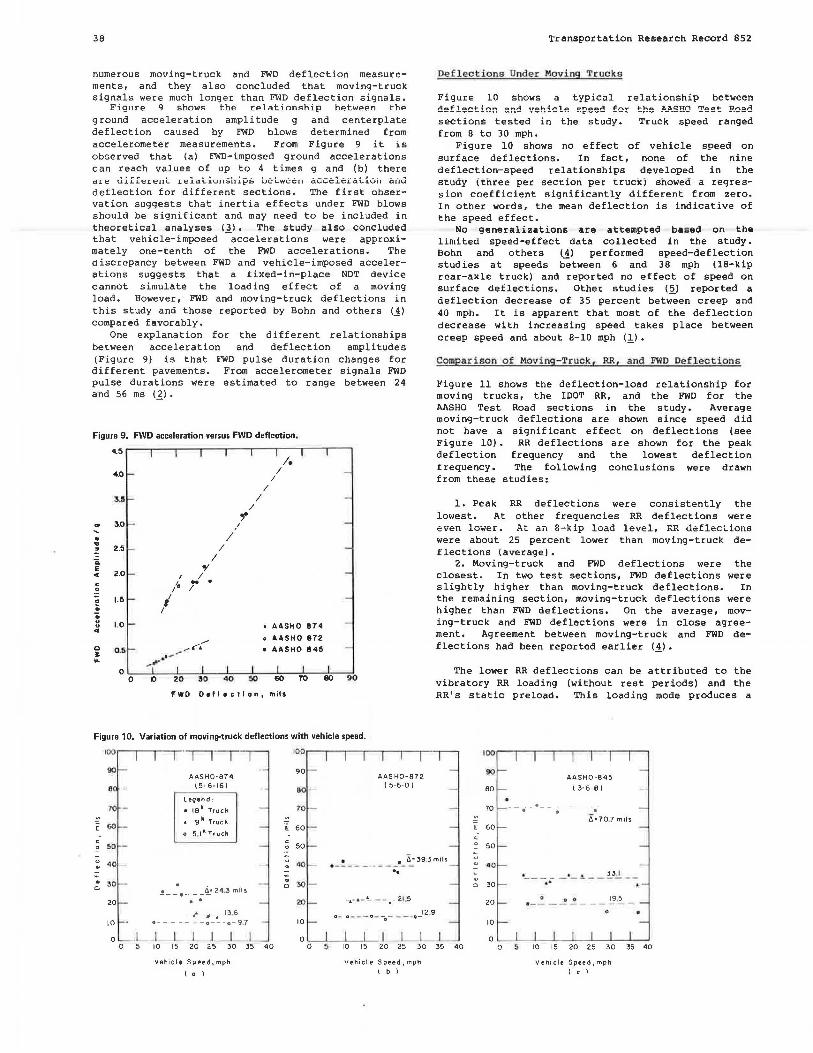
Figure 9 shows the relationship between the ground acceleration amplitude g and centerplate deflection caused by FWD blows determined from accelerometer measurements. From Figure 9 it is observed that (a) FWD-imposed ground accelerations can reach values of up to 4 times g and (b) there ar e differ ent relationships between acceleration and deflection for different sections. The first observation suggests that inertia effects under FWD blows should be significant and may need to be included in theoretical analyses C3). The study also concluded that vehicle-imposed -accelerations were approximately one-tenth of the FWD accelerations. The discrepancy between FWD and vehicle-imposed accelerations suggests that a fixed-in-place NOT device cannot simulate the loading effect of a moving load. However, FWD and moving-truck deflections in this study and those reported by Bohn and others (~)
compared favorably. One explanation for the different relationships
between acceleration and deflection amplitudes (Figure 9) is that FWD pulse duration changes for different pavements. From accelerometer signals FWD pulse durations were estimated to range between 24 and 56 ms (_~) .
Figure 9. FWD acceleration versus FWD deflection .
4.5 ;.
4.0 I I
I 3.5 I
I
3.0 /
,. . I ...
~~ / Ci. I E
,, .. 2.0 I I c ,;,, .. . 0 I 0 1.5 I ;; I . :l 1.0 • AASHO 874 ..
,.,. o AASHO 872 0 0 .5 -~ "· • AASHO 845 ~ .,.,,,.,. 11111• -IL
0 0 IO zo 30 40 50 60 70 80 90
FWD Otfltctlon, mils
Figure 10. Variation of movin!l"truck deflections with vehicle speed.
IQO
90
8
70 -
E 60
0 50
AASH0-874 (5-6-16)
Leo end:
18k Truck
9 111 Truck
o 5 1k Truch e c 0
100
90
6
10
60
50
AASH0-872 ( 5-6-0 I
Transportation Research Record 852
Def l ections Under Moving Truc ks
Figure 10 shows a typical relationship between deflection and vehicle speed fer the .P-Jt..SHO Test Road sections tested in the study. Truck speed ranged from B to 30 mph.
Figure 10 shows no effect of vehicle speed on surface deflections. In fact, none of the nine deflection-speed relationships developed in the study (three per section per truck) showed a regress i on c oeff ic ient signif i cant l y d i fferent f r om zero. In other words, the mean deflection is indicative of the speed effect.
No generalizations are attempted bas ed on the limited speed-effect data collected in the study. Bohn and others (~) performed speed-deflection s t udies a t speeds bet ween 6 and 38 mph (18-kip rear-axle truck) and reported no effect of speed on surface deflections. Other studies (.~.> reported a deflection decrease of 35 percent between creep and 40 mph. It is apparent that most of the deflection decrease with increasing speed takes place between creep speed and about B-10 mph (!.) •
comparison of Mov ing-Truck , RR , and FWD Deflec tions
Figure 11 shows the deflection-load relationship for moving trucks, the IDOT RR, and the FWD for the AASHO Test Road sections in the study. Average moving-truck deflections are shown since speed did not have a significant effect on deflections (see Figure 10) • RR deflections are shown for the peak deflection frequency and the lowest deflection frequency. The following conclusions were drawn from these studies:
1. Peak RR deflections were consistently the lowest. At other frequencies RR deflections were even lower. At an 3~kip load level, RR deflections were about 25 percent lower than moving-truck def lectlons \average).
2. Moving-truck and FWD deflections were the closest. In two test sections, FWD deflections were slightly higher than moving-truck deflections. In the remaining section, moving-truck deflections were higher than FWD deflections. On the average, moving-truck and FWD deflections were in close agreement. Agreement between moving-truck and FWD deflections had been reported earlier (_1_).
The lower RR deflections can be attributed to the vibratory RR loading (without rest periods) and the RR's static preload. This loading mode produces a
100
90
80
70 - - • -·- -~
E 60
0 50
AASH0-845
( 3·6-8)
-· 0=70.7 mHs
u 40 oO • • °0: =39.3mils
~ 40 ~ . 30 0
20
10
0 0
_! __ •-- __ ii• 24,3 mil!!. .. - -.. "- ~-.. -13,6
-o- 9 .7
10 15 20 25 30 35 40
Vehicle Speed, mph
( o I
~
30 0
20
10
0 0 5
. .... __ __ ·-- ---.. -. . .. .. ~ - - .... 2 1.5
o ... o .. - - o- -0 - - - · o-12r9
10 15 20 25 30 35 40
Uehicle Speed,mph I b I
~
0 30
20
10
0 0 s
• 1. 1. 33.I -- ~ .. - -~---~---
o--- ~..! - - - ~·~ -. 10 15 20 25 30 35 40
Vehicle Speed,mph
I c l

Transportation Research Record 852
Figure 11. Variation of movin1>-truck, RR, and FWD deflections with load.
90 50
45 A'lerao1 Mo"ttftQ Truck& 01tlection1 4!1 .. _ ... FWD Deflec1ton1 - RR 40
Oefl1ction1
35 se
~ 30 ~ so E ,I' E c" 2!1 ,, ,, - 2!1 ~ ,, c:: ,,. 0 ,, 1•20 Hz .;:: 20
,,.~ p / ,
. / ,' / /
/ , / ,tt'
,, ./ t•ZOHz ,/' .,,," ( peok I
// / " f• 8 Hz ,, / , JI'
39
100
90
llO
70
~ 60 E c:"!IO ~ u ~ 20 .,,. / ,,,,.,.,,. ...
~ l!I ,,,,..,,."' ,,,.;r
-;.-:...- " ( peok I u
"' f• 30 Hr <; l!I
0
// ,,' ,, "'
;- ' ~/
~
~ 3
10 10
!I AASH0-674 !I ( 5· 6· 16)
0 0 0 4 6 e 10 0 4 6
AASH0-872 ( !1• 6·0 1
8
20
10
0 10 0 2 4 6
AASH0-845 I 3· 6 · 8 I
e 10 Load, Kips Loo d, Kips Lo ad, Kips
(o)
stiffening e f fect and thus lower pavement deflections. The study concluded that the FWD is the best NDT device to simulate pavement response (deflect ions) under moving loads.
Influence o f Load on Surface Deflections
The influence of load on surface deflections was investigated with the RR and the FWD. RR loads ranged from 2 to 8 kips peak to peak and FWD loads varied from 2 to 11 kips. Load effects were analyzed by using the pavement-stiffness concept. Stiffness is defined as the load needed to cause a un i t deflection (spring constant). The main findings of the study are as follows (Tables 7 and 8):
1. Most pavements showed a decrease in stiffness with increasing load (RR and FWD) • A decrease in stiffness with increasing load means that the pavements soften (deflections increase faster than the load).
2. The ratio between the maximum and minimum pavement stiffness ranged from 1.0 to 2.5 (most values between 1.2 and 1.6) with th e RR and from 1.03 to 1.26 (most values between 1.1 and 1.2) with the FWD. RR stiffness values were computed at the peak deflectio n frequency.
3. The deflection-basin area is less sensitive to loa d than centerplate deflections. RR (at a given driving frequency) and FWD areas varied within 10 percent for the range of loads considered. The deflection-basin area is thus a strong characterizing pavement parameter.
Influence of Driving Frequency on RR Def lecti ons
The effect of driving frequency on RR deflections was investigated in frequency-sweep tests for driving frequencies varying from 6 to 30 Hz at 2-Hz intervals. The study indicated the following points:
1. Different deflection at Figure 5) •
sections different
show one distinct driving frequencies
peak (see
2. For a given section, the driving frequency at the peak deflection is roughly the same a t different peak-to-peak loads.
3. The ratio between the peak deflection and the minimum deflection in the sweeps ranged from 1.3 to 3 . 9 . Rigid pavements are more susceptible to driving frequency than are conventional flexible pavements.
4. The deflection-basin area reaches a peak at the same driving frequency as the peak deflections.
(b) ( c)
Table 7. Influence of load magnitude on RR deflections.
Driving Stiffness at Peak-to-Peak Load Shown (kips/in)
Frequency -----------Section (Hz) 2 Kips 4 Kips 6 Kips 8 Kips
Bement• 18 625 558 547 508 Deland• 16 296 245 224 197 Monticello• 18 723 597 549 522 Sherrard• 10 706 597 483 468 Viola• 8 400 343 281 267 AASH0-874 20 541 500 435 396 AASH0-872 20 400 333 275 275 AASH0-845 J 6b 250 200 182 100<
~Average or thr~t ~t 1uloos. Not pentc dcflec 1lo 11 rrcquoncy.
cUnstabk t~adJnss it~ lhc.';,C com.litions.
Table 8. Influence of load magnitude on FWD deflections.
Stiffness at Load Shown (kips/in)
Section 3 Kips 6 Kips 8 Kips >8 Kips
Bement• 783 779 736 711 Deland• 175 172 170 Monticello• 677 647 639 617 Sherrard• 500 458 439 Viola• 316 276 261 261 AASH0-874 273 306 296 313 AASH0-872 273 273 265 257 AASH0-845 100 II 0 110
~Avc.n1ge of ihrec stations. lnC'teiuing salffnrss with increasing load.
Stiffness max Stiffness min
1.23 I.SO 1.39 l.51 I.SO 1.37 l .45 2.50
:rnrrnc5S max Stiffness min
1.10 1.03 I.I 0 I.I 4 1.21 I.I 5b 1.06 !. !Ob
5. The ratio between the maximum and minimum areas in a sweep never exceeded 1. 36; most ratios were between 1.1 and 1.2.
6. The combined effects of load and frequency on pavement stiffness can be substantial. A typical flexible pavement with a stiffness of 1000 kips/ in at a 2-kip peak-to-peak load and 8-Hz driving frequency can have a stiffness of only 500 kips/in or less at B kips and the peak deflection frequency. This illustrates the inconvenience of using low-load fixed-frequency NDT device s for structural pavement evaluation.
Seasonal Effects on Surface Deflections
Routine RR deflections 15-Hz driving frequency)
(8-kip peak-to-peak load, were measured four to six

40
Table 9. Analysis of variance of RR deflections with testing date.
Section N
Bement 120
Coffeen 99
Deland I JO
Hillsboro 99
Midlothian "A" 139
Midlothian "B" 139
Monticello 120
Neoga "N" 80
Neoga "S" 73
Pana 100
Sherrard 116
Viola 78
aSignificant at o: = o.os.
F-ratio
2.02
37 .s1•
34.32"
106.483
20.198
20.958
14.398
61.11 a
122.96'
251.11 8
134.763
117.41 3
Grand Total
Mean/:;. (mils)
15.34
9.93
43.55
24.98
7 .95
14.08
I 7.13
28.67
21.87
20.71
21.05
39.11
SD (mils)
2.84
1.98
7.76
6.86
1.90
2 .06
3.78
12.66
6.33
8.69
7 .66
23.04
Table 10. Analysis of variance of RR basin area with testing date.
Section N
Bement 120
Coffeen 99
Deland 110
Hillsboro 99
Midlothian "A" 140
Midlothian "B" 140
Monticello 120
Neoga "N" 80
73
Pana JOO
Sherrard 116
Viola 78
3Significant at O'. = o.os .
F-ratio3
8.00
4.89
30.13
112 .81
62 .25
84.63
5.2
106 .90
43 .50
254.62
63.34
15.19
Grand Total
Mean Area (in)
27.12
29.24
18.40
26.90
24.61
23.91
25.85
22.75
25.15
23.74
20.88
16.61
SD (in)
1.88
1.75
1.24
2.29
2.19
1.60
1.91
2.42
1.65
2.47
1.33
1 05
CV(%)
18.5
20.0
17.8
27 .5
23.9
14.6
22.0
44.2
29.0
42.0
36.4
59.0
CV(%)
6.9
6.0
6.7
8.5
8.9
6.7
7.4
10.6
6.6
10.4
6.4
6.3
Transportation Research Record 852
Duncan Multiple-Range Test
Group Mean/:;.
Group Mean b.
Group Mean 6.
Group Mean b.
Group Mean /:;.
Group Mean b.
Group Mean b.
Group Mean b.
Group Mean b.
Group Mean 6.
Group Mean b.
Group Mean/:;.
Oct. 78 14.32
Oct. 78 7.21
Oct. 78 33.76
Oct. 78 14.08
Nov. 78 5.60
Nov. 78 11.08
June 78 14.51
Oct. 79 14.92
May 78 15.34
Sept. 78 Ap r. 79 May 78 9 .46 _1 o~._52 ___ 1_0~.6~7-
Apr. 79 15.63
Aug. 79 11.74
Oct. 79 Sept. 79 May 78 Apr. 79 4_0~·.:..50~--4~1_.4~2- ~4~7-~3~0 __ .:..5.:..0.-'4~0-
May 78 25.16
Sept. 78 Apr. 79 25.55 27.00
Aug.79 33.I I
Sept . 79 16.89
June 78 51.25
May 79 Sept. 79 Aug. 78 Sept. 77 June 78 .:..6 . ..:..9.:..5 _ _ -'7-".8'""0__ 8.32 8.58 9.79
May 79 13.76
Aug. 78 Sept. 79 Sept. 77 June 78 14.J I 14.44 14.80 15.63
Oct. 79 Oct. 78 May 78 Sept. 79 June 78 Apr. 79 .:.14-"'"'-3"-9 __ ..:..14-" . ..:..9..:..J __ .:..16"'.""24"'- 16.93 19.36 20.66
Oct. 78 11.84
Oct. 78 12.61
Oct. 78 9.24
Nov. 78 13.23
Nov. 78 21. I 6
Aug. 79 28.08
Aug. 78 24.28
May 78 I 6.71
Ocl . 79 16.24
Apr. 79 34.97
Aug. 79 25.29
Apr. 79 18.41
Aug. 78 39.83
Apr. 79 27.15
Sept. 78 Aug 79 25.7 I 33.50
Sepl. 79 May 78 July 78 22.18 19.47 20.41
Oct. 79 Sept. 79 May 79 .:..28.:..._2_1 __ 3~2_.2_6_ 7 3.90
May 79 36.03
Duncan Multiple-Range Test
Group Mean area
Group Mean area
Group Mean area
Group Mean area
Group Mean area
Group Mean area
Group Mean area
Group Mean area
Group Mean area
Group Mean area
Group Mean area
Group Mean area
Sept. 79 Oct. 78 Oct. 79 26 50 25.95 26.25
Aug. 79 28.59
May 78 17.21
Aug. 79 24.64
June 78 22.71
Sept. 77 22.85
Sept. 79 24.82
Aug. 78 19.49
Aug. 78 23.47
Sept . 78 Oct. 78 28 ,78 28 .85
June 78 17.43
Oct. 78 18.12
Sept . 78 May 78 25.01 26.31
Aug. 78 23.17
Aug. 78 23.00
Oct. 78 24.89
Aug. 79 22 .32
Aug. 79 24.58
Sept. 77 23.80
June 78 23.17
June 78 25.62
Apr . 79 23.91
Oct. 78 26.25
Sept. 78 Aug . 79 May 78 23 .62 20.80 21 .58
July 78 18.80
Sept. 79 May 79 20.47 20.57
May 78 27.41
May 78 29.44
Oct. 79 19.10
Apr. 79 28.74
Sept. 79 24.83
Sept. 79 23.96
Oct. 79 26.18
Oct. 78 25.30
Apr. 79 26.92
Apr. 79 25.86
May 78 21.51
Sept . 79 Oct. 79 Nov . 78 May 79 15.55 16.72 16.81 17.31 -----====-----
June 78 28.07
Apr. 79 30.78
Apr. 79 28.52
Sept. 79 Apr. 79 19.52 19.65
Oct. 78 29.91
Nov. 78 25 .43
Nov. 78 24.75
May 78 26.54
Oct. 78 26.86
Nov. 78 21.71
May 79 28.56
May 79 26.91
Apr. 79 27.04
Oct . 79 22.30

Transportation Research Record 852
times in a two-year period on the 12 primary in-service sections of the program. Tables 9 and 10 show the analyses of variance of RR deflections and area with date of testing, respectively.
In addition to the F-ratio, which indicates whether the deflections and area changed with testing date, Tables 9 and 10 include the results of the Duncan multiple-range test. In this test, means that are statistically equal (95 percent confidence level) are grouped together and are underlined. Tables 9 and 10 indicate the following findings:
1. Except for the Bement section (deflections), mean RR deflections and area did change with testing date;
2. Within the testing period, mean RR deflections for a given section changed by factors of 1.4-3.6;
3. Within the testing period, mean RR area for a given section changed by factors of 1.07-1.30;
4. Without exception, the lowest mean RR deflection was measured in the fall (October or November) ;
5. The highest mean RR deflection was obtained either in the summer or the spring; and
6. There is no specific time of the year when the area is the highest or lowest in any given section.
SUMMARY AND CONCLUSIONS
This paper presented the main findings and conclusions of a comparative study of selected NDT devices for the structural evaluation of Illinois flexible pavements. The devices used were the Benkelman beam, the road rater (model 2008) , the fallingweight deflectometer, and an accelerometer to measure surface deflections under moving trucks. The different (mostly in-service) pavements tested were selected to reflect typical flexible pavement constructions over a wide variety of subgrade soils throughout Illinois. Comparisons and correlations (where applicable) between different NDT devices were presented. The following conclusions were drawn:
1. Overall, BB deflections cannot be reliably predicted from RR deflections.
2. RR deflections ( 8-kip, 15-Hz) and FWD deflections (8-kip) are significantly different (statistically) for all pavements tested. However, RR and FWD deflections and areas are highly correlated.
3. Surface deflections are highly sensitive to the RR load and driving frequency. Low-load fixedfrequency vibrators can overestimate the pavement stiffness by factors of 2 or more.
4. Overall, the FWD is the best NDT device to simulate pavement response under moving loads. The RR, because of its harmonic loading without rest periods and static preload, induces pavement deflect ions lower than those achieved with the FWD and moving loads.
5. FWD deflections and deflection-basin areas at a 9-kip load level or converted RR deflections and area at 8 kips and 15 Hz (by using the FWD-RR correlations proposed) are recommended for structural flexible-pavement evaluation.
41
ACKNCMLEDGMENT
This paper is based on the results of Project IHR-508: Load Response Characteristics of Flexible Pavements. Project IHR-508 is a cooperative study. Project planning and development were joint efforts of !DOT and the University of Illinois. IDOT (P. Dierstein, J.S. Dhamrait, and K.W. Wicks) assumed responsibility for all NDT testing. Various IDOT districts aided in the field sampling. The Soils Laboratory of the Bureau of Materials and Physical Research under the supervision of T.S. Lewis conducted routine soil tests. Specialized soils and materials tests were conducted by the University of Illinois. v.J. McDonald, Research Engineer at the University of Illinois, and the IDOT Instrumentation Development Group of the Physical Research Section were responsible for accelerometer data acquisition and data processing. Data reduction, structural modeling analyses, and the development of procedures for analyzing NDT data were activities conducted by the University of Illinois.
Special thanks are extended to the various IDOT districts, County Superintendents of Highways, and Township Commissioners who willingly agreed to provide test pavement sites and general aid.
IHR-508 was sponsored by the Illinois Department of Transportation (Division of Highways) and the Federal Highway Administration, U.S. Department of Transportation.
REFERENCES
1. M.S. Hoffman and M.R. Thompson. Nondestructive Testing of Flexible Pavements--Field Testing Program Summary. Univ. of Illinois at UrbanaChampaign, Transportation Engineering Series 31, Illinois Cooperative Highway and Transportation Research Program Series 188, June 1981.
2. M.S. Hoffman and M.R. Thompson. Mechanistic Interpretation of Nondestructive Pavement Testing Deflections. Univ. of Illinois at Urbana-Champaign, Transportation Engineering Series 32, Illinois Cooperative Highway and Transportation Research Program Series 190, June 1981.
3. M.S. Hoffman. Mechanistic Interpretation of Nondestructive Pavement Testing Deflections. Department of Civil Engineering, Univ. of Illinois at Urbana-Champaign, Ph.D. thesis, Sept. 1980.
4. A. Bohn, P. Ullidtz, R. Stubstad, and A. Sorenson. Danish Experiments with the French Falling Weight Deflectometer. Proc., 3rd International Conference on the Structural Design of Asphalt Pavements, Univ. of Michigan, Ann Arbor, Vol. 1, 1972, pp. 1119-1128.
5. AASHO Road Test. HRB, Special Repts. 61 and 73, 1962.
Publication of this paper sponsored by Committee on Pavement Condition Evaluation.