comparision between destructive and non-destructive … · 2019-10-10 · between destructive and...
TRANSCRIPT

International Research Journal of Engineering and Technology (IRJET) e-ISSN: 2395-0056
Volume: 06 Issue: 10 | Oct 2019 www.irjet.net p-ISSN: 2395-0072
© 2019, IRJET | Impact Factor value: 7.34 | ISO 9001:2008 Certified Journal | Page 264
COMPARISION BETWEEN DESTRUCTIVE AND NON-DESTRUCTIVE TEST
ON CONCRETE
MURTUZA S. ALI1, GAURI G. KAKPURE2
1Assistant Professor, Civil Engineering Department, Prof. Ram Meghe Institute of Technology & Research, Badnera - Amravati, Maharashtra (India)
2Assistant Professor, Civil Engineering Department, G. H. Raisoni College of Engineering & Management, Anjangaon Bari Road, Amravati, Maharashtra (India)
---------------------------------------------------------------***----------------------------------------------------------------Abstract: This work presents a study on the comparison between destructive and non-destructive testing techniques (Rebound Hammer and Ultrasonic Pulse Velocity). Tests were performed to compare the accuracy between the rebound hammer and the ultrasonic pulse velocity method in estimating the strength of concrete. Twenty seven samples (cubes of 150 × 150 × 150 mm) were prepared using mix design of 1:2.21:3.6 with a constant w/c ratio of 0.45 and were tested at 7, 14, and 28 days. The slump test was between 37- 42 mm. The results obtained from the non-destructive testing methods were correlated with the compressive strength results which showed that a higher correlation existed between the Rebound Hammer and the compressive strength than the Ultrasonic Pulse Velocity. The rebound hammer readings had a correlation coefficient of 1.63, 2.25, and 2.52 for 7 days, 14 days, and 28 days respectively. While the ultrasonic pulse velocity had a correlation coefficient of 1.11, 1.05, and 1.00 for 7 days, 14 days, and 28 days respectively.
1. INTRODUCTION:
Concrete is the most used material in today’s world, in the construction industry. It is continuously being used in the construction of countless number of public structure and building. These structures include; deep foundations, high rise buildings, earthquake-proof bridges, dams among others. Human being has been using concrete in their pioneering architectural feats for millennia. The first recorded concrete-based structures were constructed in some parts of Jordan and Syria, around 6500 BC by the Nabataea traders. Around 3000 BC, the ancient Egyptians used lime mortars and gypsum in constructing the Pyramids. The Pantheon, Rome, is the world’s largest non-reinforced concrete structure and is more than 2000 years old (constructed in126 AD) and stands at a height of 46m.
Today’s concrete is made using Portland cement, coarse and fine aggregates of stone and sand, and water. Although there were exceptions, during the 19th century, concrete was used mainly for industrial buildings. Admixtures are chemicals added to the concrete mix to control its setting properties and are
used primarily when placing concrete during environmental extremes, such as high or low temperatures, windy conditions, etc. Before Portland cement was discovered, and for some years afterward, large quantities of natural cement were used, which were produced by burning a naturally occurring mixture of lime and clay. Because the ingredients of natural cement are mixed by nature, its properties vary widely. Modern Portland cement is manufactured to detailed standards. Some of the many compounds found in it are important to the hydration process and the chemical characteristics of cement. It’s manufactured by heating a mixture of limestone and clay in a kiln to temperatures between 1,300° F and 1,500° F. Up to 30% of the mix becomes molten but the remainder stays in a solid state, undergoing chemical reactions that can be slow. Eventually, the mix forms a clinker, which is then ground into powder. A small proportion of gypsum is added to slow the rate of hydration and keep the concrete workable longer. Between 1835 and 1850, systematic tests to determine the compressive and tensile strength of cement were first performed, along with the first accurate chemical analyses. It wasn’t until about 1860 that Portland cements of modern composition were first produced.
It is important to remember that cement is the powder that reacts with water to form cement paste, a hard, solid material that forms the matrix for the concrete composite. The addition of sand (fine aggregates) that are up to a few millimeters in diameter makes mortar, and the addition of rocks (coarse aggregates) of up to a few centimeters in diameter makes concrete. It has always been known that concrete is a porous material, whose properties depend on its pore space. There are many different kinds of pores in concrete, ranging from the air voids that are entrapped in the mixing process, which can be quite large, up to a few millimeters in diameter, to the capillary pores, which are essentially the space occupied by the leftover water from mixing, down to the nanometer-scale pores that exist in some of the hydration products produced by the cement-water chemical reaction.

International Research Journal of Engineering and Technology (IRJET) e-ISSN: 2395-0056
Volume: 06 Issue: 10 | Oct 2019 www.irjet.net p-ISSN: 2395-0072
© 2019, IRJET | Impact Factor value: 7.34 | ISO 9001:2008 Certified Journal | Page 265
Concrete is a composite material produced by the combination of aggregates (fine/coarse), cement and admixture if any. By suitably adjusting the proportion of various ingredients, concrete with sufficient compressive strength can be developed. Constructed structures have to be investigated for evaluating the serviceability and safety from time to time. The most important property of concrete is its strength which can be determined by destructive and non-destructive testing. It is important to have regular schedule for testing concrete structure, in order to have a safe and efficient operation of these structures. This schedule may vary depending on the structure use. DT is a method of testing to determine specimen’s failure. The main objective of performing destructive testing is to determine the service life of the specimen and to detect weakness of design that might not be shown under normal working conditions. NDT comprises of testing methods that are used to analyse the concrete specimen or structure without damaging or destroying it which is generally performed to investigate the material integrity of the specimen. NDT test are used worldwide to detect variation in structures, infinitesimal changes in surface finish and location of cracks or other physical discontinuities. There are various destructive and non-destructive test that can be employed for concrete. They are as follows:
Rebound hammer test
Ultrasonic pulse velocity test
Compression test by using CTM
1.1 NON-DESTRUCTIVE TEST:
The NDT of concrete in today’s scenario has received a great importance in terms of practical and engineering value. The subject has received a growing attention during recent years, especially the quality characterization of damaged structure made of concrete using NDT testing. Non-Destructive testing is defined as the course of inspecting, testing or evaluating materials, components or assemblies without destroying the serviceability of the part or system. The purpose of NDT is to determine the quality and integrity of materials, components or assemblies without affecting the ability to perform their intended functions. The NDT method is only one predominant method to find the strength of existing concrete and concrete structure, and to judge the quality of concrete. The NDT test include rebound hammer, ultrasonic pulse velocity test, penetration test, radiography test, sonic integrity test etc. However, the two most commonly used techniques are rebound hammer test for strength and ultrasonic pulse velocity test for quality. These are generally used together as the former is able to predict the strength of the concrete on the surface while later can detect the quality in the core.
Hence, they form an ideal combination. Moreover, these techniques can be conveniently used in the laboratory as well as at the construction site.
Rebound hammer test is one of the popular surface hardness method used to estimate either existing strength of concrete or for comparing concrete quality. This is conducted around all the points of observation on all accessible faces of the structural element. Concrete surfaces are thoroughly cleaned before taking any measurement. The rebound number are influenced by a number of factors like type of cement and aggregate, surface condition and moisture content, age of concrete and extent of carbonation of concrete. The rebound of rider weight from the plunger due to hammering action is measured. This distance of rebound of rider weight is measured on a scale, which is proportional to the surface hardness of concrete. Ultrasonic pulse Velocity is a versatile and most reliable method of testing to assess the existing strength of hardened concrete, porosity, voids, width of crack, depth of crack, inclination of cracks etc. Smoothness of contact surface under test effects the measurement of ultrasonic pulse velocity. For most concrete surfaces the finish is usually sufficient smooth to ensure good acoustical contact by the use of coupling medium and by pressing the transducers against the concrete surface. When the concrete surface is rough and uneven, it is necessary to smooth the surface to make the pulse velocity measurement possible or it will give wrong values. The ultrasonic pulse velocity concrete is mainly related to its identity and modulus of elasticity, this in turn depends upon the material and mixed proportions used in making concrete and as well as the method of placing, compaction and curing of concrete.
1.2 DESTRUCTIVE TEST:
In case of destructive test, the concrete specimens (cubes, cylinders, beams, etc.) are loaded till destruction in the laboratory and the strength properties of concrete are determined from the test result. The durability, impermeability and other characteristics can be roughly interpreted from the test result.
The destructive testing method is suitable and economically beneficial for the concrete specimens that are produced at a large scale. The main aims to investigate the service life and detect the weakness of design which might not show under normal working conditions. It includes methods where the concrete specimen is broken so as to determine mechanical properties i.e. hardness and strength. This type of testing is very easy to carry out, easier to interpret and yield more information. Some popular destructive methods for determining mechanical properties of concrete using the universal testing machine are tensile test, bending test, compressive test. In destructive method to determine the hardness Brinell test and Rockwell test

International Research Journal of Engineering and Technology (IRJET) e-ISSN: 2395-0056
Volume: 06 Issue: 10 | Oct 2019 www.irjet.net p-ISSN: 2395-0072
© 2019, IRJET | Impact Factor value: 7.34 | ISO 9001:2008 Certified Journal | Page 266
are carried out. Also, for Impact testing pendulum test and drop weight test are carried out. Destructive testing includes mechanical testing (bending, impact tests, tensile), macro/ micro hardness testing as well as metallographic examination.
The compressive strength of concrete is the most common performance measure used by the engineer in designing buildings and other structure. Concrete is a construction material which has always been meant to resist compressive stresses most efficiently. The compressive strength depends upon number of factors such as type of cement and its quality, curing water-cement ratio, time of hardening, temperature at which the concrete hardened. In DT the compressive strength of concrete is determined by using compression testing machine (CTM).
1.3 SCOPE OF THE STUDY:
It is important to know the properties of concrete in its final form in the structure. The conventional method to know the quality of concrete is to test the number of control specimens mainly for compressive strength. The control specimens have the same composition (mix proportion) as the concrete going into structure. However, two more important steps in the production of concrete compaction and curing, could be quite different. That is why the properties of concrete in the structure may be quite different from those indicated by the control specimens. So, it is desirable to have some method of testing the concrete structure without damaging it. This is possible with the help of NDT.
The word concrete comes from Latin term concretus, which means to grow. Strength and some other properties of concrete depend on the cement hydration products that continue to form for several years and the strength is proportional to the hydration process. Hence theoretically strength gain of concrete is continued for several years, but as the ingress of different pollutants (e.g. Carbon dioxide, Chloride, Sulphur products etc.) The quality of the concrete continues to deteriorate, also repeated stress causes deterioration. Hence the strength also decreases. There are several NDT methods from which the diagnosis of the quality of the reinforced structure is possible. According to this diagnosis the most economic, efficient and durable repair strategy can be adopted.
When we are dealing with rehabilitation project, one of the most challenging tasks is the definition of the damage pattern and its local quantitative value. As example after fire the properties of concrete can be predicted by means of NDT techniques like ultrasonic pulse velocity measurement. Which will give an idea
about the concrete, weather rehabilitation of that structure is needed or not.
1.4 OBJECTIVE OF THE STUDY:
To obtain a relationship between concrete compressive strength and rebound number as well as the relationship between compressive strength and ultrasonic velocity.
To study about non-destructive testing (U.P.V.) method for evaluating the compressive strength of concrete.
To propose a method for determining the compressive strength of concrete by measuring UPV and density of concrete.
To propose a correlation between UPV and compressive strength of concrete.
To inspect a component in a safe, reliable, and cost-effective manner without causing damage to the equipment.
1.5 ADVANTAGES OF NON-DESTRUCTIVE TESTING:
Strength of existing structure can be found out without damaging or destroying them.
NDT is a quicker method of the inspection of faults
The test component is not destructed, hence the same is used for several tests.
Non-Destructive test helps in testing of quality of concrete of completed structure i.e. finished work.
With the help of NDT, it is possible to investigate the crack depth, durability, strength, of the existing structure.
Since these tests are non-destructive no wastage of concrete takes place.
This test is simple in use and with this test strength of existing old concrete structure can be detected.
Specimen is not damaged during test.
It helps to reduce failures, accidents and costs.
carried on these concrete members. To achieve this purpose, study results given by various authors are

International Research Journal of Engineering and Technology (IRJET) e-ISSN: 2395-0056
Volume: 06 Issue: 10 | Oct 2019 www.irjet.net p-ISSN: 2395-0072
© 2019, IRJET | Impact Factor value: 7.34 | ISO 9001:2008 Certified Journal | Page 267
2. LITERATURE REVIEW
2.1 INTRODUCTION:
Literature review of relevant literature published earlier, technical papers by various agencies is carried out. In this literature review attention is given about the behavior of concrete members. The purpose of this literature review is getting an overview about behavior of concrete members over non-destructive and destructive tests mentioned here in this literature review.
2.2 REVIEW OF TECHNICAL PAPERS
Mohammadreza Hamidian, Ali Shariati, M. M. Arabnejad Khanouki, in this paper author studied the concept of nondestructive testing (NDT) to obtain material properties of “in place” specimens without the destruction of the specimens and to do the structural health monitoring. Ultrasonic pulse velocity (UPV) used together with Schmidt Rebound Hammer (SRH) tests give a combined test method for health assessment by a suitable correlation between these two tests along with test by compressive testing machine.
The author has concluded that, the structural health monitoring by use of nondestructive testing such as ultrasonic pulse velocity and Schmidt Rebound Hammer were being carried out. The experimental investigation showed that a good correlation exists between compressive strength, Schmidt Rebound Hammer and ultrasonic pulse velocity.
Deepak Jain, V.V. Singh, In this paper authors studied the use of non-destructive testing (NDT) methods have received growing attention during recent years, especially during the rising need for quality characterization of damaged constructions made of concrete.
The authors have concluded that, next to the UPV parameter to estimate the compressive strength, density parameter has also been taken into consideration. When the density, which can be easily determined, has been taken into account, it has been useful for more accurate prediction of concrete strength.
Siddharth Shankar, Hikmat Raj Joshi, this paper deals with the determination of compressive strength of concrete which are destructive tests (DT) and non-destructive tests (NDT). The NDT test methods include rebound hammer, ultrasonic pulse velocity test, penetration test, radiography test, sonic integrity tests etc. The DT of concrete is not always appropriate method to find compressive strength of concrete and concrete structures because it affects the durability and lifespan of concrete.
The analysis concluded that, at present stage the NDTs are suitable only for controlling and estimating the compressive strength within the specified range of the target object.
Mohammadreza Mahmoudipour, authors investigated constructed structures for evaluating the serviceability and safety from time to time. Also structures which are suspected to any strength failure are to be tested to maintain sustainability evaluation. Non-destructive tests are used to evaluate the serviceability and safety of the structures. Schmidt hammer and ultrasonic pulse velocity tests are very common in evaluating concrete strength.
The author has concluded that, Schmidt hammer test and ultrasonic test are very convenient and can execute anywhere. These tests have their own limitation and these limitations may result in errors. Applying proper correction factor is a must to get the reliable results. Despite all the corrections some of the errors are unavoidable. Combined method can reduce these errors and give more reliable results.
Muhammad Azhar Saleem, Zahid Ahmad Siddiqi, objective of nondestructive testing (NDT) is to assess the condition of structure without affecting its performance [1]. NDT methods have seen significant developments during recent decades [2, 3]. However, most of the civil engineering programs have not yet incorporated NDT in their concrete education.
In the light of the test results, it can be concluded that the strength and quality of concrete is reasonable. Although the structure has been exposed to severe weather for several years but still the concrete is in good shape and the structure can be put to service in future. At few isolated locations, for instance in one of the columns in the basement, the strength of concrete is below the requirement.
3. EXPERIMENTAL PROGRAM
3.1 INTRODUCTION:
The experimental program consists of two of non-destructive tests and one type of destructive test. The non-destructive tests are Schmidt hammer test and ultrasonic pulse velocity test. The destructive test is compressive strength test. The program consists of total 27 nos. of specimens with M: 30 grade of concrete.
Total 27 nos. of specimens consist 9 nos. cubes for 7 days, 9 nos. cubes for 14 days, 9 nos. cubes for 28 days, cubes for 27 days.

International Research Journal of Engineering and Technology (IRJET) e-ISSN: 2395-0056
Volume: 06 Issue: 10 | Oct 2019 www.irjet.net p-ISSN: 2395-0072
© 2019, IRJET | Impact Factor value: 7.34 | ISO 9001:2008 Certified Journal | Page 268
3.2 MATERIALS AND THEIR QUALITY TESTS:
It is very important to know the properties and characteristics of constituent materials of concrete, as we know, concrete is a composite material made up a several different materials such as aggregate, sand, water, cement and admixture These materials have properties and different characteristics such as Unit weight, Specific gravity, size gradation and water content.
The necessary tests were conducted in the laboratory.
3.2.1 Aggregate Quality Tests:
3.2.1.1 Specific gravity of aggregate:
Specific gravity is defined as the ratio of the weight of a unit volume of aggregate to the weight of an equal volume of water. Specific gravity expresses the density of the solid fraction of the aggregate in concrete mixes as well as to determine the volume of pores in the mix. The specific gravity of aggregate is to determine the volume of aggregates in a concrete mix as well as to determine the volume of pores in the mix.
[Specific Gravity (S.G.) = (density of solid) / (density of water)]
The specific gravity of coarse and fine aggregate is shown in table 3.1
Table 3.1: Specific gravity of aggregates
Coarse Aggregate (10mm) 2.822 Coarse Aggregate (20mm) 2.895 Fine Aggregate 2.731
3.2.1.2 Moisture content of aggregate:
Since the aggregates can absorb moisture. The water content also affects aggregate proportioning (because it contributes to aggregate weight). As the atmosphere was warm throughout the period of casting, condition of aggregate was considered as dry.
3.2.1.3 Sieve Analysis of Aggregate:
The size of aggregate particles differs from aggregate to another, and for the same aggregate the size is different. So, in this test we will determine zone of aggregate by combined sieve analysis. From this test, aggregates were found to belong to Zone I as per (IS 383-1970).
3.2.1.4 Cement:
Standard ISI mark cement was used. Testing report of the batch was procured from the manufacturer.
3.2.1.5 Water
Tap water was used in concrete mixtures and in the curing.
3.3 EQUIPMENTS
3.3.1 Digital Compression Testing Machine (DCTM)
The cubes were kept on the Digital Compression Testing Machine with setup to check ultimate compressive strength of concrete.
Fig. 3.1: Digital Compression Testing Machine (DCTM)
3.4 MIX PROPORTIONS
Concrete consists of different ingredients. The ingredients have their different individual properties. Strength, workability and durability of the concrete depend heavily on the Concrete mix proportion of the individual ingredients. In this study M30 grade of concrete were used.
Design Requirements
1. Characteristic cube concrete strength (fck) 30 N/mm²
2. Max water cement ratio (w/c) 0.45
3. Max Aggregate Size 20mm
4. Slump 40mm
The following tables illustrate the mix of concrete
Table 3.2: Concrete mix
Materials
M30 Weight per one cubic meter kg/m3
Cement 351

International Research Journal of Engineering and Technology (IRJET) e-ISSN: 2395-0056
Volume: 06 Issue: 10 | Oct 2019 www.irjet.net p-ISSN: 2395-0072
© 2019, IRJET | Impact Factor value: 7.34 | ISO 9001:2008 Certified Journal | Page 269
Water 158 Fine Aggregate (Sand)
775.83
Coarse Aggregate (10mm)
518.9
Coarse Aggregate (20mm)
778.35
Proportion 1:2.21:3.6
Table 3.3: Details of M30 Grade concrete specimens
M30 Grade concrete
Specimens 7 days
14 days 28 days Total
Cube 9 9 9 27
3.5 CASTING AND CURING
3.5.1 Casting procedure
The fresh concrete was prepared as per concrete mix proportion seen previously. The entire constituent was homogenously mixed with the help of concrete mixer.
3.5.1.1 Cube Mould
The Cube moulds are made up of steel of standard size 150x150x150mm.The interior surfaces of the mould were thinly coated with mould oil to prevent adhesion of concrete.
Fig.3.2: Cube Moulds (Size 150mmx150mmx150mm)
3.5.2 Compacting
The test specimens shall be made as soon as practicable after mixing, and in such a way as to produce full compaction of the concrete with neither segregation nor excessive laitance. The concrete shall be filled into the mould in layers approximately 5 cm deep. In placing each scoopful of concrete, the scoop shall be moved around the top edge of the mould as the concrete slides from it, in order to ensure a symmetrical distribution of the concrete within the mould each layer shall be compacted either by hand or by vibration as described below. After the top layer has been compacted, the surface of the concrete shall be finished level with the top of the mould, using a trowel.
3.5.2.1 Compacting by hand:
When compacting by hand, the standard tamping bar shall be used and the strokes of the bar shall be distributed in a uniform manner over the cross-section of the mould. The number of strokes per layer required to produces specified conditions will vary according to the type of concrete. For cubical specimens, in no case shall the concrete be subjected to less than 35 strokes per layer for 15 cm cubes or 25 strokes per layer for 10 cm cubes. Rod shall penetrate into the underlying layer and the bottom layer shall be rodded throughout its depth. Where voids are left by the tamping bar, the sides of the mould shall be tapped to close the voids.
3.5.2.2 Compacting by vibration:
When compacting by vibration, each layer shall be vibrated by means of an electric or pneumatic hammer or vibrator or by means of a suitable vibrating table until the specified condition is attained.
NOTE - Mode and quantum of vibration of the laboratory specimen shall be as nearly the same as those adopted in actual concreting operations.
3.5.3 Curing
After the fresh concrete has hardened, all samples were submerged completely in water for 7 days, 14 days and 28 days.
Fig. 3.3: Curing of specimens
3.6 LABORATORY TESTS
For determining various mechanical properties of concrete following tests were conducted.
3.6.1 Non-destructive Tests (NDTs):
3.6.1.1 Introduction:
Non-destructive test on concrete said so because these tests can be performed in situ as well as in laboratory without destructing the concrete member & results about strength and durability can be obtained. These tests have been in use for about four decades & are considered as - powerful method for evaluating existing concrete structures with regard to their strength and durability and also for assessment and control of quality

International Research Journal of Engineering and Technology (IRJET) e-ISSN: 2395-0056
Volume: 06 Issue: 10 | Oct 2019 www.irjet.net p-ISSN: 2395-0072
© 2019, IRJET | Impact Factor value: 7.34 | ISO 9001:2008 Certified Journal | Page 270
of hardened concrete without a significant damage to the structure. In certain cases, the investigation of crack depth, micro crack and progressive deterioration are also studied by these methods.
Non-destructive testing methods are simple to perform but the analysis and interpretation of test results are not so easy. In these methods, the specimens are not loaded to failure and as such the strength estimated may not be very accurate. These methods attempt to measure some other properties of concrete from which an estimate of its strength, durability and elastic parameters are obtained. Some such properties of concrete are hardness, resistance to penetration, rebound number, resonant frequency and ability to allow ultrasonic pulse velocity to propagate through it.
3.6.1.2 Importance of non - destructive testing:
The test is in non-destructive in nature. No wastage of concrete takes place. The strength of existing old concrete structures can
also be evaluated by these methods. Hair cracks, micro test cracks and deep cracks in
concrete structure can be detected. Moisture content, density, thickness and cement
content of a concrete member can be estimated by these methods.
3.6.1.3 Schmidt hammer test:
Rebound Hammer test is a Non-destructive testing method of concrete which provide a convenient and rapid indication of the compressive strength of the concrete. The rebound hammer is also called as Schmidt hammer that consist of a spring-controlled mass that slides on a plunger within a tubular housing.
This test measures the elastic rebound of concrete and is primarily used for determination of concrete strength and for comparative investigations.
Fig. 3.4: Schmidt Hammer
3.6.1.3.1 Objectives:
Assessing the likely compressive strength of concrete with the help of suitable correlations between rebound index and compressive strength.
Assessing the uniformity of concrete. Assessing the quality of the concrete in relation to
standard requirements. Assessing the quality of one element of concrete in
relation to another.
3.6.1.3.2 Principle:
When the plunger of rebound hammer is pressed against the surface of concrete, a spring-controlled mass with a constant energy is made to hit concrete surface to rebound back. The extent of rebound, which is a measure of surface hardness, is measured on a graduated scale. This measured value is designated as Rebound Number (a rebound index). A concrete with low strength and low stiffness will absorb more energy to yield in a lower rebound value.
Fig. 3.5: Operation of Schmidt Hammer
3.6.1.3.3 Test procedure: (As per IS 13311 Part-2-1992)
1. For testing, smooth, dean and dry surface is to be selected. If loosely adhering scale is present, this should be rubbed off with a grinding wheel or stone. Rough surfaces resulting from incomplete compaction, loss of grout, spaded or tooled surfaces do not give reliable results and should be avoided.
2. The point of impact should be a least 20 mm away from any edge or shape discontinuity.
3. For taking a measurement, the rebound hammer should be held at right angles to the surface of the concrete member. The test can thus be conducted horizontally or vertical surfaces or vertically upwards or downwards on horizontal surfaces. If the situation demands, the rebound hammer can be held at intermediate angles also, but in each case, the rebound number will be different for the same concrete.

International Research Journal of Engineering and Technology (IRJET) e-ISSN: 2395-0056
Volume: 06 Issue: 10 | Oct 2019 www.irjet.net p-ISSN: 2395-0072
© 2019, IRJET | Impact Factor value: 7.34 | ISO 9001:2008 Certified Journal | Page 271
4. Rebound hammer test is conducted around all the points of observation on all accessible surfaces are thoroughly cleaned before taking any measurement. Around each point of observation, six readings of rebound indices are taken 2nd average of these readings after deleting outliers as per IS 8900: 1978 becomes the rebound index for the point of observation.
3.6.1.3.4 Impact Energy for Rebound Hammers for Different Applications as per IS: 13311(2)-1992
The impact energy required for the rebound hammer is different for different applications. Approximate Impact energy levels are mentioned in the table 3.5 below for different applications.
Table 3.5: Impact Energy for Rebound Hammers for Different Applications as per IS: 13311(2)-1992
Sr. No.
Applications
Approximate Impact Energy for Rebound Hammer in Nm
1 For Normal Weight Concrete
2.25
2
For light weight concrete / For small and impact resistive concrete parts.
0.75
3
For mass concrete testing eg: In roads, hydraulic structures and pavements
30
3.6.1.3.5 Points to Remember in Rebound Hammer Test
1. The concrete surface should be smooth, clean and dry.
2. Ant loose particles should be rubbed off from the concrete surface with a grinding wheel or stone, before hammer testing.
3. Rebound hammer test should not be conducted on rough surfaces as a result of incomplete compaction, loss of grout, spalled or tooled concrete surface.
4. The point of impact of rebound hammer on concrete surface should be at least 20mm away from edge or shape discontinuity.
5. Six readings of rebound number are taken at each point of testing and an average of value of the readings is taken as rebound index for the corresponding point of observation on concrete surface.
3.6.1.3.6 Influence of test conditions:
The rebound numbers are influenced by a number of factors like types of cement and aggregate, surface condition and moisture content, age of concrete and extent of carbonation of concrete.
1. Influence of type of cement:
Concretes made with high alumina cement can give strengths 100 percent higher than that with ordinary Portland cement. Concretes made with super sulphated cement can give 50 percent lower strength than that with ordinary Portland cement.
2. Influence of type of aggregates:
Different types of aggregate used in concrete give different correlations between compressive strength and rebound numbers. Normal aggregates such as gravels and crushed rock aggregates give similar correlations, but concrete made with lightweight aggregates require special calibration
3. Influence of surface condition and moisture content of concrete:
The rebound hammer method is suitable only for close texture concrete. Open texture concrete typical of masonry blocks, honeycombed concrete or no-fines concrete are unsuitable for this test. All correlations assume full compaction, as the strength of partially compacted concrete bears no unique relationship to the rebound numbers. Troweled and floated surfaces are harder than moulded surfaces, and tend to overestimate the strength of concrete. A wet surface will give rise to underestimation of the strength of concrete calibrated under dry conditions. In structural concrete, this can be about 20 percent lower than in an equivalent dry concrete.
4. Influence of curing and age of concrete:
The relationship between hardness and strength varies as a function of time. Variations in initial rate of hardening, subsequent curing and conditions of exposure also influence the relationship. Separate calibration curves are required for different curing regimes but the effect of age can generally be ignored for concrete between 3 days and 3 months old.
5. Influence of carbonation of concrete surface:
The influence of carbonation of concrete surface on the rebound number is very significant. Carbonated concrete gives an overestimate of strength which in extreme cases can be up to 50 percent. It is possible to establish correction factors by removing the carbonated layer and

International Research Journal of Engineering and Technology (IRJET) e-ISSN: 2395-0056
Volume: 06 Issue: 10 | Oct 2019 www.irjet.net p-ISSN: 2395-0072
© 2019, IRJET | Impact Factor value: 7.34 | ISO 9001:2008 Certified Journal | Page 272
testing the concrete with the rebound hammer on the non-carbonated concrete.
Fig. 3.6: Laboratory procedure For Schmidt hammer test.
3.6.1.3.7 Limitations of Schmidt hammer test:
Although, this test provides a quick inexpensive means of checking uniformity of concrete, it has serious limitations and this must be recognized.
The results are affected by:
Smoothness of the surface under test. Size, shape and rigidity of the specimen. Age of specimen. Surface and internal moisture condition of the
concrete. Type of coarse aggregate. Type of cement. Carbonation of concrete surface.
Table 3.6: Assessment of concrete quality from Rebound number
Quality of Concrete from Rebound number Average Rebound Number
Quality of Concrete
>35 Excellent 30 to 35 Very Good 25 to 30 Good 20 to 25 Fair 15 to 20 Poor ≤15 Very Poor
3.6.1.4 Ultrasonic pulse velocity test:
Ultrasonic scanning is a recognized non-destructive evaluation test to qualitatively assess the homogeneity and integrity of concrete. When the pulse generated is transmitted into the concrete from the transducer using a liquid coupling material such as grease or cellulose
paste, it undergoes multiple reflections at the boundaries of the different material phases within the concrete. A complex system of stress waves develops, which include both longitudinal and shear waves, and propagates through the concrete. The first waves to reach the receiving transducer are the longitudinal waves, which are converted into an electrical signal by a second transducer. Electronic timing circuits enable the transit time T of the pulse to be measured. IS 13311 Part-1 explains the procedure and the interpretation of the test results.
3.6.1.4.1 Objectives:
The ultrasonic pulse velocity method could be used to establish:
The homogeneity of concrete. The presence of cracks, voids and other
imperfections. Changes in the structure of the concrete which may
occur with time. The quality of the concrete in relation to standard
requirements. The quality of one element of concrete in relation to
another. The values of dynamic elastic modulus of the
concrete.
3.6.1.4.2 Principle:
The ultrasonic pulse is generated by an electroacoustical transducer. When the pulse is induced into the concrete from a transducer, it undergoes multiple reflections at the boundaries of different material phases within the concrete. A complex system Df stress waves is developed which includes compressional (longitudinal), shear (transverse) and surface (Rayleigh) waves. The receiving transducer detects the onset of the longitudinal waves, which is the fastest. Because the velocity of the pulses is almost independent of the geometry of the material through which they pass and depends only on its elastic properties, pulse velocity method is a convenient technique for investigating structural concrete. The underlying principle of assessing the quality of concrete is that comparatively higher velocities are obtained when the quality of concrete in terms of density, homogeneity and uniformity is good. In case of poorer quality, lower velocities are obtained. If there is a crack, void or flaw inside the concrete which comes in the way of transmission of the pulses, the pulse strength is attenuated and it passes around the discontinuity, thereby making the path length longer. Consequently, lower velocities are obtained. The actual pulse velocity obtained depends primarily upon the materials and mix proportions of concrete. Density and modulus of elasticity of aggregate also significantly affect the pulse velocity.
International Research Journal of Engineering and Technology (IRJET) e-ISSN: 2395-0056
Volume: 06 Issue: 10 | Oct 2019 www.irjet.net p-ISSN: 2395-0072
© 2019, IRJET | Impact Factor value: 7.34 | ISO 9001:2008 Certified Journal | Page 273
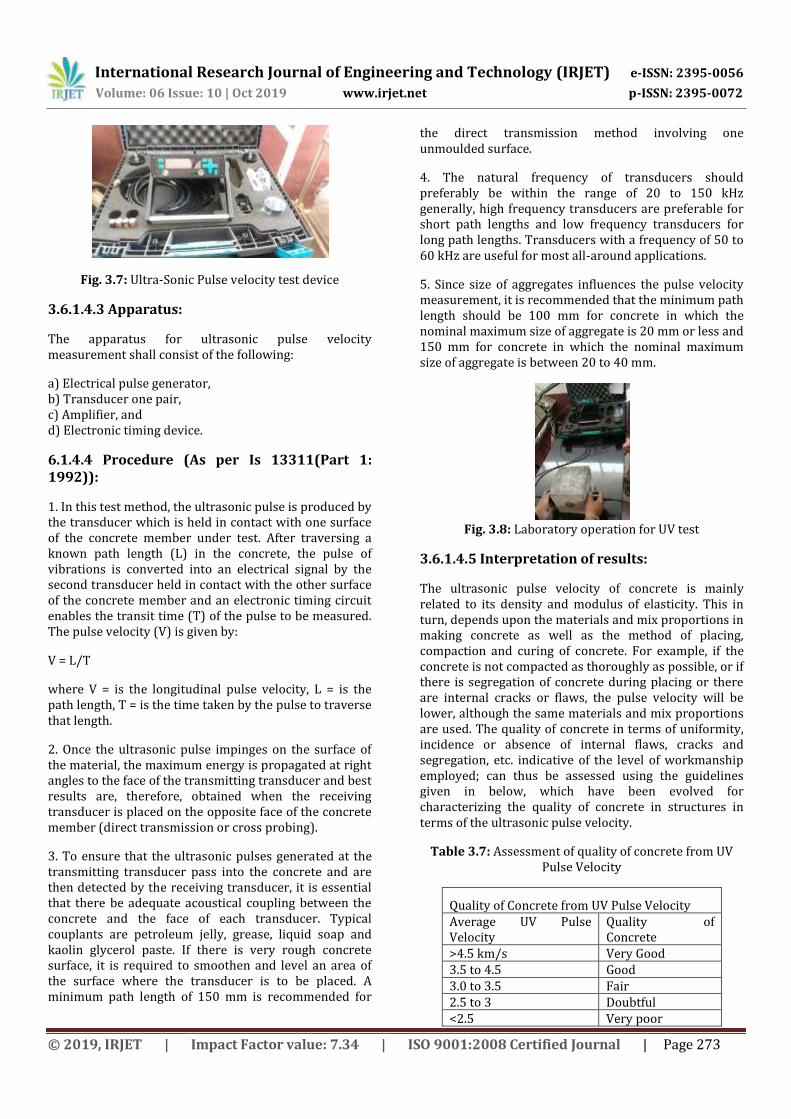
Fig. 3.7: Ultra-Sonic Pulse velocity test device
3.6.1.4.3 Apparatus:
The apparatus for ultrasonic pulse velocity measurement shall consist of the following:
a) Electrical pulse generator, b) Transducer one pair, c) Amplifier, and d) Electronic timing device.
6.1.4.4 Procedure (As per Is 13311(Part 1: 1992)):
1. In this test method, the ultrasonic pulse is produced by the transducer which is held in contact with one surface of the concrete member under test. After traversing a known path length (L) in the concrete, the pulse of vibrations is converted into an electrical signal by the second transducer held in contact with the other surface of the concrete member and an electronic timing circuit enables the transit time (T) of the pulse to be measured. The pulse velocity (V) is given by:
V = L/T
where V = is the longitudinal pulse velocity, L = is the path length, T = is the time taken by the pulse to traverse that length.
2. Once the ultrasonic pulse impinges on the surface of the material, the maximum energy is propagated at right angles to the face of the transmitting transducer and best results are, therefore, obtained when the receiving transducer is placed on the opposite face of the concrete member (direct transmission or cross probing).
3. To ensure that the ultrasonic pulses generated at the transmitting transducer pass into the concrete and are then detected by the receiving transducer, it is essential that there be adequate acoustical coupling between the concrete and the face of each transducer. Typical couplants are petroleum jelly, grease, liquid soap and kaolin glycerol paste. If there is very rough concrete surface, it is required to smoothen and level an area of the surface where the transducer is to be placed. A minimum path length of 150 mm is recommended for
the direct transmission method involving one unmoulded surface.
4. The natural frequency of transducers should preferably be within the range of 20 to 150 kHz generally, high frequency transducers are preferable for short path lengths and low frequency transducers for long path lengths. Transducers with a frequency of 50 to 60 kHz are useful for most all-around applications.
5. Since size of aggregates influences the pulse velocity measurement, it is recommended that the minimum path length should be 100 mm for concrete in which the nominal maximum size of aggregate is 20 mm or less and 150 mm for concrete in which the nominal maximum size of aggregate is between 20 to 40 mm.
Fig. 3.8: Laboratory operation for UV test
3.6.1.4.5 Interpretation of results:
The ultrasonic pulse velocity of concrete is mainly related to its density and modulus of elasticity. This in turn, depends upon the materials and mix proportions in making concrete as well as the method of placing, compaction and curing of concrete. For example, if the concrete is not compacted as thoroughly as possible, or if there is segregation of concrete during placing or there are internal cracks or flaws, the pulse velocity will be lower, although the same materials and mix proportions are used. The quality of concrete in terms of uniformity, incidence or absence of internal flaws, cracks and segregation, etc. indicative of the level of workmanship employed; can thus be assessed using the guidelines given in below, which have been evolved for characterizing the quality of concrete in structures in terms of the ultrasonic pulse velocity.
Table 3.7: Assessment of quality of concrete from UV Pulse Velocity
Quality of Concrete from UV Pulse Velocity Average UV Pulse Velocity
Quality of Concrete
>4.5 km/s Very Good 3.5 to 4.5 Good 3.0 to 3.5 Fair 2.5 to 3 Doubtful <2.5 Very poor

International Research Journal of Engineering and Technology (IRJET) e-ISSN: 2395-0056
Volume: 06 Issue: 10 | Oct 2019 www.irjet.net p-ISSN: 2395-0072
© 2019, IRJET | Impact Factor value: 7.34 | ISO 9001:2008 Certified Journal | Page 274
3.6.1.4.6 Influence of test conditions:
1. Influence of surface conditions and moisture content of concrete:
Smoothness of contact surface under test affects the measurement of ultrasonic Pulse velocity. For most concrete surfaces, the finish is usually sufficiently smooth to ensure good acoustical contact by the use of a coupling medium and by pressing the transducer against the concrete surface. When the concrete surface is rough and uneven, it is necessary to smoothen the surface to make the pulse velocity measurement possible.
In general, pulse velocity through concrete increases with increased moisture content of concrete. This influence is more for low strength concrete than high strength concrete. The pulse velocity of saturated concrete may be up to 2 percent higher than that of similar dry concrete. In general, drying of concrete may result in somewhat lower pulse velocity.
2. Influence of path length, shape and size of the concrete member:
As concrete is inherently heterogeneous, it is essential that path lengths be sufficiently long so as to avoid any error introduced due to its heterogeneity. In field work, this does not pose any difficulty as the pulse velocity measurements are carried out on thick structural concrete members. However, in the laboratory where generally small specimens are used, the path length can affect the pulse velocity readings. The shape and size of the concrete member do not influence the pulse velocity unless the least lateral dimension is less than a certain minimum value, for example the minimum lateral dimension of about 80 mm for 50 kHz natural frequency of the transducer.
3. Influence of temperature of concrete:
Variations of the concrete temperature between 5 and 30°C do significantly affect the pulse velocity measurements in concrete. At temperatures between 30 to 60°C that can be reduction in pulse velocity up to 5 percent. Below freezing temperature, the free water freezes within concrete, resulting in an increase in pulse velocity up to 7.5 percent.
3.6.1.4.7 Factors affecting measurement of pulse velocity:
The measurement of pulse velocity is affected by a number of factors regardless of the properties of the concrete they are as follows:
Smoothness of concrete surface under test.
Influence of path length on pulse velocity.
Temperature of concrete.
Moisture conditions of concrete.
Presence of reinforcing steel.
3.6.2 Destructive Tests:
3.6.2.1 Compressive Strength:
For compressive strength testing, the bearing surfaces of the testing machine were wiped clean and the cubes were placed in the machine in such a manner that the load is applied to opposite sides of the cubes as cast. The axis of the specimen was carefully aligned with the centre of thrust of the spherically seated plate. The spherically seated block was brought to bear on the specimen and the load was applied without shock and continuously at a rate approximately 140 kg/cm2 /minute until failure of specimen. Figure Shows Test setup for compressive strength and crack pattern. The maximum load applied to the specimen until failure was recorded.
Compressive stress = ultimate load/bearing area
Fig 3.9: Compression testing of cube

International Research Journal of Engineering and Technology (IRJET) e-ISSN: 2395-0056
Volume: 06 Issue: 10 | Oct 2019 www.irjet.net p-ISSN: 2395-0072
© 2019, IRJET | Impact Factor value: 7.34 | ISO 9001:2008 Certified Journal | Page 275
4. SCRUTINY OF RESULTS
4.1 OBSERVATIONS
Table to find Strength from Rebound Number or Rebound Index
Fig. 4.1 Rebound Index
Graph to find Strength from Ultrasonic Pulse Velocity
Fig.4.2: Specified Cube Strength for Pulse Velocity (Km/s)
4.1.1 Results after 7 Days curing.
Table 4.1: Results of Compressive Strength, Rebound Hammer and UPV Tests
Cube No.
Compressive Strength (N/mm2)
Rebound Number or Rebound Index
Strength From Rebound Index (N/mm2)
Ultrasonic Pulse Velocity (Km/s)
Strength From UPV (N/mm2)
1 19.4 21.77 13.8 4.12 23.8 2 19.8 19.67 12.3 4.16 23 3 20 17.44 12.3 4.16 21.8
4 20.1 19 12.3 4.12 22.5
5 20.7 20.77 13.2 4.13 24.2 6 20.8 18.67 12.3 4.16 22.5
7 20.8 19.89 12.3 4.1 24 8 22.1 20.22 12.4 4.15 24 9 23.3 21 13.2 4.16 23.1
Average
20.77
12.67
23.21
Compressive strength is calculated by testing cube specimen on DCTM to failure for 7 days. Results obtained from the compressive strength test on cube are presented in table 4.1.
We take one reading of rebound number (or rebound index) at each face of cube. We take average of that six readings for each cube specimen for 7 days. At the end average reading for each day is calculated below. Results obtained from the Schmidt Hammer test on cube are presented in table 4.1.
Two readings of velocity are taken for each cube with direct transmission. Average of two readings are taken for each cube for 7 days. At the end average reading for each day is calculated below. Results obtained from the Ultrasonic Pulse Velocity test on cube are presented in table 4.1.
4.1.2 Result after 14 Days curing
Table 4.2: Results of Compressive Strength, Rebound Hammer and UPV Tests
Cube No.
Compressive Strength (N/mm2)
Rebound Number or Rebound Index
Strength From Rebound Index (N/mm2)
Ultrasonic Pulse Velocity (Km/s)
Strength From UPV (N/mm2)
1 23.9 21.33 12.3 4.23 28
2 26.8 17 13.2 4.27 27
3 27.1 19.33 12.3 4.27 25.3
4 27.7 19.55 12.3 4.25 26.5
5 28.3 19.22 12.3 4.23 26
6 28.6 21 12.3 4.2 26
7 28.8 18.44 12.3 4.23 28
8 31.3 20 12.3 4.02 28
9 31.9 18.22 13.53 4.27 26
Average
28.26
12.53
26.75
Compressive strength is calculated by testing cube specimen on DCTM to failure for 14 days. Results obtained from the compressive strength test on cube are presented in table 4.2.

International Research Journal of Engineering and Technology (IRJET) e-ISSN: 2395-0056
Volume: 06 Issue: 10 | Oct 2019 www.irjet.net p-ISSN: 2395-0072
© 2019, IRJET | Impact Factor value: 7.34 | ISO 9001:2008 Certified Journal | Page 276
We take one reading of rebound number (or rebound index) at each face of cube. We take average of that six readings for each cube specimen for 14 days. At the end average reading for each day is calculated below. Results obtained from the Schmidt Hammer test on cube are presented in table 4.2.
Two readings of velocity are taken for each cube with direct transmission. Average of two readings are taken for each cube for 14 days. At the end average reading for each day is calculated below. Results obtained from the Ultrasonic Pulse Velocity test on cube are presented in table 4.2.
4.1.3 Results after 28 Days curing
Compressive strength is calculated by testing cube specimen on DCTM to failure for 28 days. Results obtained from the compressive strength test on cube are presented in table 4.3.
We take one reading of rebound number (or rebound index) at each face of cube. We take average of that six readings for each cube specimen for 28 days. At the end average reading for each day is calculated below. Results obtained from the Schmidt Hammer test on cube are presented in table 4.3 in this chapter.
Two readings of velocity are taken for each cube with direct transmission. Average of two readings are taken for each cube for 28 days. At the end average reading for each day is calculated below. Results obtained from the Ultrasonic Pulse Velocity test on cube are presented in table 4.2 in this chapter.
Table 4.3: Results of Compressive Strength, Rebound Hammer and UPV Tests
Cube No.
Compressive Strength (N/mm2)
Rebound Number or Rebound Index
Strength From Rebound Index (N/mm2)
Ultrasonic Pulse Velocity (Km/s)
Strength From UPV (N/mm2)
1 28 21 13.64 4.38 34.3 2 29.9 20.22 12.7 4.33 33 3 32.2 20.44 13.2 4.27 32.5 4 32.3 21.44 14.2 4.35 32.9 5 32.4 20.67 13.75 4.36 34.3 6 35 21.55 12.9 4.35 35 7 36.2 22.22 13.42 4.37 33 8 36.8 21.11 12.5 4.37 32.8 9 39.4 22 13.31 4.37 33
Average
33.57
13.3
33.42
4.2 COMPARISON
4.2.1 Comparison of Rebound Hammer test and Compressive Strength test
4.2.1.1 Result for 7 Days curing
Results obtained from the Schmidt Hammer test on cube are presented in table 4.4.
Table 4.4: Compressive Strength & Rebound Hammer (7 Days)
Cubes X
Axis(Compression) Y Axis
(Rebound)
1 19.4 12.5
2 19.8 12.3
3 20 12.3
4 20.1 13.9
5 20.7 13.2
6 20.8 12.3
7 20.8 12.3
8 22.1 12.3
9 23.3 13
Average 20.77 12.67
The 7 days specified cube strength in N/mm²
= (20.77/12.67)*100
=164% of Rebound Hammer
Fig 4.3: Comparison between Compressive strength and Rebound Hammer (7 Days)
Above graph (fig. 4.3) shows that the relation between Compressive Strength and Rebound Hammer Strength we tested 9 specimens each and it shows that when average rebound strength is 12.67 N/mm² then compressive strength is 20.77 N/mm² on 7 days of curing.
International Research Journal of Engineering and Technology (IRJET) e-ISSN: 2395-0056
Volume: 06 Issue: 10 | Oct 2019 www.irjet.net p-ISSN: 2395-0072
© 2019, IRJET | Impact Factor value: 7.34 | ISO 9001:2008 Certified Journal | Page 277
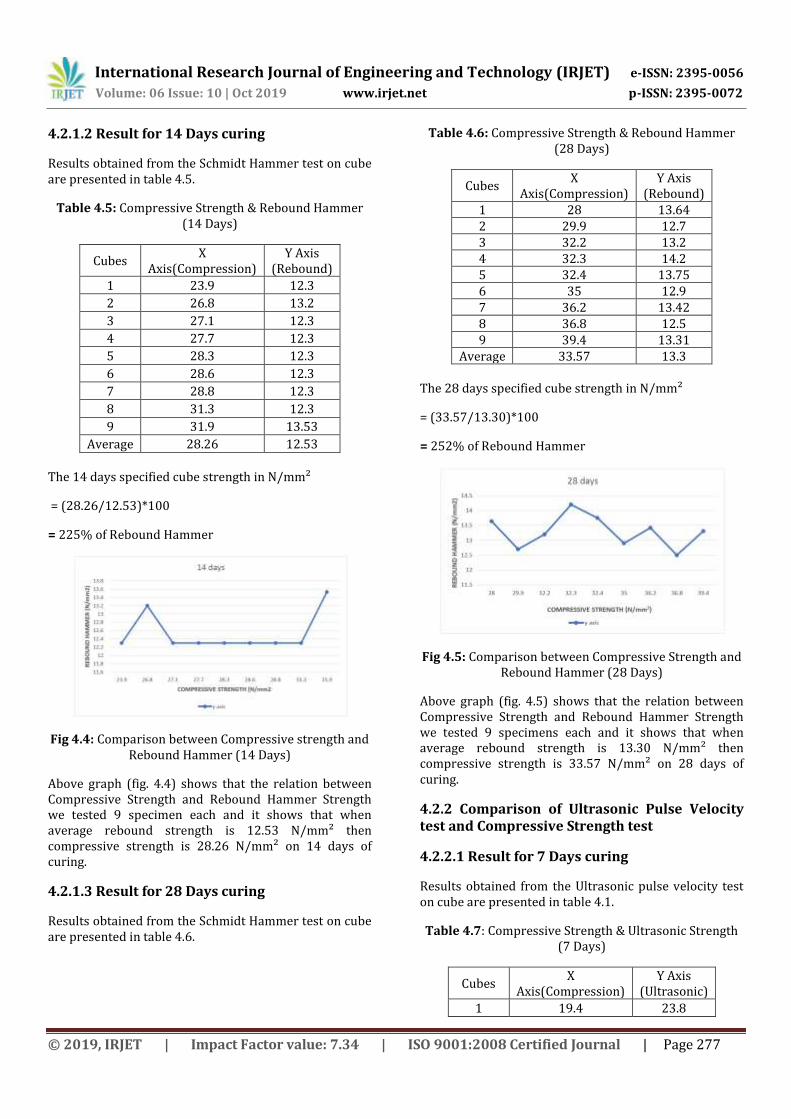
4.2.1.2 Result for 14 Days curing
Results obtained from the Schmidt Hammer test on cube are presented in table 4.5.
Table 4.5: Compressive Strength & Rebound Hammer (14 Days)
Cubes X
Axis(Compression) Y Axis
(Rebound)
1 23.9 12.3
2 26.8 13.2
3 27.1 12.3
4 27.7 12.3
5 28.3 12.3
6 28.6 12.3
7 28.8 12.3
8 31.3 12.3
9 31.9 13.53
Average 28.26 12.53
The 14 days specified cube strength in N/mm²
= (28.26/12.53)*100
= 225% of Rebound Hammer
Fig 4.4: Comparison between Compressive strength and Rebound Hammer (14 Days)
Above graph (fig. 4.4) shows that the relation between Compressive Strength and Rebound Hammer Strength we tested 9 specimen each and it shows that when average rebound strength is 12.53 N/mm² then compressive strength is 28.26 N/mm² on 14 days of curing.
4.2.1.3 Result for 28 Days curing
Results obtained from the Schmidt Hammer test on cube are presented in table 4.6.
Table 4.6: Compressive Strength & Rebound Hammer (28 Days)
Cubes X
Axis(Compression) Y Axis
(Rebound) 1 28 13.64 2 29.9 12.7 3 32.2 13.2 4 32.3 14.2 5 32.4 13.75 6 35 12.9 7 36.2 13.42 8 36.8 12.5 9 39.4 13.31
Average 33.57 13.3 The 28 days specified cube strength in N/mm²
= (33.57/13.30)*100
= 252% of Rebound Hammer
Fig 4.5: Comparison between Compressive Strength and Rebound Hammer (28 Days)
Above graph (fig. 4.5) shows that the relation between Compressive Strength and Rebound Hammer Strength we tested 9 specimens each and it shows that when average rebound strength is 13.30 N/mm² then compressive strength is 33.57 N/mm² on 28 days of curing.
4.2.2 Comparison of Ultrasonic Pulse Velocity test and Compressive Strength test
4.2.2.1 Result for 7 Days curing
Results obtained from the Ultrasonic pulse velocity test on cube are presented in table 4.1.
Table 4.7: Compressive Strength & Ultrasonic Strength (7 Days)
Cubes X
Axis(Compression) Y Axis
(Ultrasonic)
1 19.4 23.8

International Research Journal of Engineering and Technology (IRJET) e-ISSN: 2395-0056
Volume: 06 Issue: 10 | Oct 2019 www.irjet.net p-ISSN: 2395-0072
© 2019, IRJET | Impact Factor value: 7.34 | ISO 9001:2008 Certified Journal | Page 278
2 19.8 23
3 20 21.8
4 20.1 22.5
5 20.7 24.2
6 20.8 22.5
7 20.8 24
8 22.1 24
9 23.3 23.1
Average 20.77 23.21
The 7 days specified cube strength in N/mm²
= (20.77/23.21)*100
= 90% of Ultrasonic Strength
Fig 4.6: Comparison between Compressive strength and UPV test (7 Days)
Above graph (fig. 4.6) shows that the relation between Compressive Strength and Ultrasonic Pulse Velocity Strength we tested 9 specimen each and it shows that when average Ultrasonic Pulse velocity strength is 23.21 N/mm2 then compressive strength is 20.77 N/mm2 on 7 days of curing.
4.2.2.2 Result for 14 Days curing
Results obtained from the Ultrasonic pulse velocity test on cube are presented in table 4.8.
Table 4.8: Compressive Strength & Ultrasonic Strength (14 Days)
Cubes X
Axis(Compression) Y Axis
(Ultrasonic)
1 23.9 28
2 26.8 27
3 27.1 25.3
4 27.7 26.5
5 28.3 26
6 28.6 26
7 28.8 28
8 31.3 28
9 31.9 26
Average 28.26 26.75
The 14 days specified cube strength in N/mm²
= (28.26/26.75)*100
= 106% of Ultrasonic Strength
Fig 4.7: Comparison between Compressive strength and UPV test (14 Days)
Above graph (fig. 4.7) shows that the relation between Compressive Strength and Ultrasonic Pulse Velocity Strength we tested 9 specimen each and it shows that when average Ultrasonic Pulse velocity strength is 26.75 N/mm2 then compressive strength is 28.26 N/mm2 on 14 days of curing.
4.2.2.3 Result for 28 Days curing
Results obtained from the Ultrasonic pulse velocity test on cube are presented in table 4.9.
Table 4.9: Compressive Strength & Ultrasonic Strength (28 Days)
Cubes X
Axis(Compression) Y Axis
(Ultrasonic)
1 28 34.3
2 29.9 33
3 32.2 32.5
4 32.3 32.9
5 32.4 34.3
6 35 35
7 36.2 33
8 36.8 32.8
9 39.4 33
Average 33.57 33.42
The 28 days specified cube strength in N/mm²
= (33.57/33.42)*100

International Research Journal of Engineering and Technology (IRJET) e-ISSN: 2395-0056
Volume: 06 Issue: 10 | Oct 2019 www.irjet.net p-ISSN: 2395-0072
© 2019, IRJET | Impact Factor value: 7.34 | ISO 9001:2008 Certified Journal | Page 279
= 101% of Ultrasonic Strength
Fig 4.8: Comparison between Compressive strength and UPV test (28 Days)
Above graph (fig. 4.8) shows that the relation between Compressive Strength and Ultrasonic Pulse Velocity Strength we tested 9 specimen each and it shows that when average Ultrasonic Pulse velocity strength is 33.42 N/mm2 then compressive strength is 33.57 N/mm2 on 28 days of curing.
5. CONCLUSIONS
1) Test results for hardened concrete show a reasonable correlation of compressive strength with the rebound hammer and Ultrasonic Pulse Velocity.
2) The sensitivity of the pulse velocity test in measuring strength is selected by the concrete age, as the concrete matures, the sensitivity of the Ultrasonic Pulse Velocity to strength achieved by the concrete increases.
3) The results shows that the 7, 14 and 28 days specified cube strength in (N/mm²) is 164%, 225% and 252% of Rebound Hammer respectively.
4) The result shows that the 7, 14 and 28 days specified cube strength in (N/mm²) is 90%, 106% and 101% of Ultra sonic pulse velocity strength respectively.
5) Interpretation of the average Rebound Hammer test results show that the concrete used at the site was of good quality.
6) The experimental investigation showed that a good correlation exists between compressive strength, Rebound Hammer and „ultrasonic pulse velocity‟.
7) The use of rebound hammer is suitable to estimate and predict the strength of big mobility concrete, which makes engineering judgment quite easy. The use of the rebound hammer methods yields more reliable and closer results to the actual strength.
6. REFERENCES
1. Mohammadreza Hamidian, Ali Shariati, M. M. Arabnejad Khanouki, “Application of Schmidt rebound hammer and ultrasonic pulse velocity techniques for structural health monitoring.” Scientific Research and Essays Vol. 7(21), pp. 1997-2001, 7 June, 2012.
2. Akash Jain, Ankit Kathuria, Adarsh Kumar, “Combined Use of Non-Destructive Tests f or Assessment of Strength of Concrete in Structure.” 2013 Published by Elsevier Ltd.
3. Deepak Jain, V.V. Singh, “Comparative Study of Compressive Strength of Concrete Cubes with Silica Fumes Based on Ultrasonic Pulse Velocity (U.P.V) and its Density.” International Journal of Mechanical and Production Engineering, ISSN: 2320-2092, Volume- 5, Issue-11, Nov.-2017.
4. Siddharth Shankar, Hikmat Raj Joshi, “Comparison of Concrete Properties determined by Destructive and Non-Destructive Tests.” Journal of the Institute of Engineering, Vol. 10, No. 1, pp. 130–139.
5. Sakshi Gupta, “Comparison of Non-Destructive and Destructive Testing on Concrete.” Department of Civil Engineering, ASET, Amity University Haryana. Published: September 21, 2018
6. Mohammadreza Mahmoudipour, “Statistical Case Study On Schmidt Hammer, Ultrasonic And Core Compression Strength Tests Results Performed On Cores Obtained From Behbahan Cement Factory In Iran” Geotechnical Department, SANO Consulting Engineers, No.11.”
7. Dr. S.K. Sohani, Deepshikha Shukla, “Construction Quality Monitoring By Deploying Digital Rebound Hammer and Ultrasonic Pulse Velocity Methods – A Case Study of Indore Region.” International Journal of Engineering Technology Science and Research IJETSR.
8. Muhammad Azhar Saleem, Zahid Ahmad Siddiqi, “Ultrasonic Pulse Velocity and Rebound Hammer Testing for Nondestructive Evaluation of Existing Concrete Structure.” Department of Civil Engineering, University of Engineering and Technology, Lahore.
9. Ammar S. Khazaal, “Technical Report on Schmidt Hammer Test.” College of Engineering/Tikrit University (ECB).
10. Ismail Ozgur Yaman, Gokhan Inei, Nazli Yesiller, “Ultrasonic Pulse Velocity in Concrete Using Direct and Indirect Transmission.” ACI Materials Journal/November-December 2001.

International Research Journal of Engineering and Technology (IRJET) e-ISSN: 2395-0056
Volume: 06 Issue: 10 | Oct 2019 www.irjet.net p-ISSN: 2395-0072
© 2019, IRJET | Impact Factor value: 7.34 | ISO 9001:2008 Certified Journal | Page 280
11. Alexandre Lorenzi, Francisco Teston Tisbierek, “Ultrasonic Pulse Velocity Analysis in Concrete Specimens.” UFRGS Porto Alegre, Rio Grande do Sul, CEP 90035-190, Brazil.
12. Md. Roknuzzaman, Md. Belal Hossain, Md. Ibrahim Mostazid, “Application of Rebound Hammer Method for Estimating Compressive Strength of Bricks.” Journal of Civil Engineering Research 2017, 7(3): 99-104.
13. Huai-Shuai Shang, Ting-Hua Yi, Lu-Sheng Yang, “Experimental Study on the Compressive Strength of Big Mobility Concrete with Non-destructive Testing Method.” School of Civil Engineering, Qingdao Technological University, Qingdao 266033, China.
14. Jason Maximino C. Ongpeng, “Ultrasonic Pulse Velocity Test of Reinforced Concrete with Induced Corrosion.” ASEAN Engineering Journal Part C, Vol 6 No 1, ISSN 2286-8150 p.5
15. Rafah R. Abdulmajeed, Dilshad K. Ameen, Nazik K. Hasan, “Comparative analysis of the rebound hammer & ultrasonic pulse velocity in testing concrete with multi – variation equation.” International Review of Civil Engineering (I.RE.C.E.), Vol. 7, N. 6 ISSN 2036-99