comparative analysis of selected scales to assess...
TRANSCRIPT
Can J Gastroenterol Hepatol Vol 29 No 6 August/September 2015 299
oRiginal aRtiClE
©2015 Pulsus Group Inc. All rights reserved
Comparative analysis of selected scales to assess prognosis in acute pancreatitis
Dorota Koziel PhD2, Stanislaw Gluszek Prof1,2, Jaroslaw Matykiewicz Md PhD1,2, Piotr Lewitowicz MD PhD2, Zuzanna Drozdzak MA3
1Clinical General, Oncological and Endocrinological Surgery, Regional Hospital; 2Faculty of Health Sciences, Jan Kochanowski University, Kielce; 3Centre for Evaluation and Analysis of Public Policies, Jagiellonian University, Cracow, Poland
Correspondence and reprints: Dr Dorota Koziel, Al IX Wieków Kielc 19, 25-317 Kielce, Poland. E-mail [email protected] for publication October 16, 2014. Accepted February 3, 2015
Acute pancreatitis (AP) is the sudden inflammation of the pan-creas and, to a varied degree, involves local tissues or distant
organs. The morbidity rate in the adult Polish population has not been precisely specified; however, data from the National Health Insurance Fund and the National Department of Hygiene report it to be 70 to 76.2 per 100,000 (1,2). A prospective study (3) conducted in the Kielce region of Poland suggested that AP occurs in 99.9 per 100,000 inhabitants, with first-time events occurring in 79 per 100,000 inhabitants. Diagnosis of pancreatitis is based on clinical characteris-tics, primarily observation of the presence of two of three symptoms: abdominal pain typical of AP; at least threefold increase in serum lip-ase (or amylase) activity; and characteristic changes seen on computed tomography (CT) with contrast medium. More rarely, diagnosis is con-firmed using magnetic resonance imaging or percutaneous ultrasound-guided pancreatic biopsy. Confirmation using CT is not necessary when the diagnosis has been based on the presence of abdominal pain and
increase in enzyme activity (4). The accuracy of CT in prognosticating a severe course of AP is comparable with the clinical scoring systems; therefore, it is not recommended for evaluation of disease severity (5).
The majority of patients experience a mild form of the disease; how-ever, in approximately 20% of patients, a severe form develops, in which the length of hospitalization is considerably longer and mortality is extremely high. Necrotic pancreatitis develops in 5% to 10% of patients (4). According to the revised Atlanta classification published in 2012 (4), there are three degrees of severity: mild, moderate and severe. Distinguishing the three AP categories enables the classification of patients into homogenous severity groups, in which the duration of hospitalization in the severe and moderate forms of the disease is similar; however, mortality due to severe AP is considerably higher (6).
Early identification of patients with a moderate or severe course of disease is very important because it enables optimization of treatment, leading to improved outcomes. Many prognostic scales and individual
D Koziel, S Gluszek, J Matykiewicz, P Lewitowicz, Z Drozdzak. Comparative analysis of selected scales to assess prognosis in acute pancreatitis. Can J Gastroenterol Hepatol 2015;29(6):299-303.
OBJECTIVE: To evaluate the utility of selected scales to prognosticate the severity and risk for death among patients with acute pancreatitis (AP) according to the revised Atlanta classification published in 2012.METHODS: Prospective data regarding patients hospitalized due to AP were analyzed. The final analysis included a total of 1014 patients. The bedside index for severity in acute pancreatitis (BISAP), Panc 3 scores and Ranson scales were calculated using data from the first 24 h of admission.RESULTS: Mild AP was diagnosed in 822 (81.1%) cases, moderate in 122 (12%) and severe in 70 (6.9%); 38 (3.7%) patients died. The main causes of AP were cholelithiasis (34%) and alcohol abuse (26.7%). Recurrence of AP was observed in 244 (24.1%) patients. In prognosticating the severity of AP, the most useful scale proved to be the Acute Physiology and Chronic Health Evaluation (APACHE) II (area under the curve [AUC] 0.724 [95% CI 0.655 to 0.793]), fol-lowed by BISAP (AUC 0.693 [95% CI 0.622 to 0.763]). In prognos-ticating a moderate versus mild course of AP, the CT severity index proved to be the most decisive (AUC 0.819 [95% CI 0.767 to 0.871]). Regarding prognosis for death, APACHE II had the highest predic-tive value (AUC 0.726 [95% CI 0.621 to 0.83]); however, a similar sensitivity was observed using the BISAP scale (AUC 0.707 [95% CI 0.618 to 0.797]). CONCLUSIONS: Scoring systems used in prognosticating the course of the disease vary with regard to sensitivity and specificity. The CT severity index scoring system showed the highest precision in prognos-ticating moderately severe AP (as per the revised Atlanta criteria, 2012); however, in prognosticating a severe course of disease and mortality, APACHE II proved to have the greatest predictive value.
Key Words: Acute pancreatitis; Scales; Severity of illeness index
L’analyse comparative d’échelles sélectionnées pour évaluer le pronostic de pancréatite aiguë
OBJECTIF : Évaluer l’utilité d’échelles sélectionnées pour établir le pronostic de gravité et de risque de décès chez les patients ayant une pancréatite aiguë (PA) selon la classification révisée de l’Atlanta publiée en 2012.MÉTHODOLOGIE : Les chercheurs ont analysé les données prospec-tives relatives aux patients hospitalisés en raison d’une PA. L’analyse finale incluait 1 014 patients. Ils ont calculé l’indice clinique de gravité de pancréatite aiguë (ICGPA), les scores Panc 3 et les échelles de Ranson au moyen des données tirées des 24 premières heures suivant l’hospitalisation.RÉSULTATS : Une PA bénigne a été diagnostiquée dans 822 cas (81,1 %), une PA modérée dans 122 cas (12 %) et une PA grave dans 70 cas (6,9 %), tandis que 38 patients (3,7 %) sont décédés. La cholé-lithiase (34 %) et la consommation excessive d’alcool (26,7 %) étaient les principales causes de PA. Les chercheurs ont observé une récurrence de PA chez 244 patients (24,1 %). Pour établir le pronostic de gravité de la PA, l’évaluation de l’état de santé chronique et physiologique aiguë (APACHE) II (aire sous la courbe [ASC] 0,724 [95 % IC 0,655 à 0,793]) était l’échelle la plus utile, suivie de l’ICGPA (ASC 0,693 [95 % IC 0,622 à 0,763]). Pour établir le pronostic d’une PA à évolution modérée ou bénigne, l’indice de gravité tomodensitométrique s’est révélé le plus décisif (ASC 0,819 [95 % IC 0,767 à 0,871]). À l’égard du pronostic de décès, le score APACHE II avait la valeur prédictive la plus élevée (ASC 0,726 [95 % IC 0,621 à 0,83]). Cependant, les chercheurs ont observé que l’échelle ICGPA (ASC 0,707 [95 % IC 0,618 à 0,797]) avait une sensibilité similaire. CONCLUSIONS : Les systèmes de pointage pour établir le pronostic de l’évolution pathologique varient en matière de sensibilité et de spécificité. Le système d’indice de gravité tomodensitométrique établis-sait le pronostic de PA modérément bénin de la manière la plus précise (conformément aux critères révisés de l’Atlanta, 2012). Cependant, pour établir le pronostic de grave évolution de la maladie et de mortalité, l’échelle APACHE II avait la meilleure valeur prédictive.
Koziel et al
Can J Gastroenterol Hepatol Vol 29 No 6 August/September 2015300
indicators are known, but their sensitivity and specificity, as well as their prognostic value, remain the subject of debate. One of the first multifactorial prognostic tests is the scale based on the Ranson cri-teria. The presence of >2 risk factors prognosticates a severe form of AP. The Acute Physiology and Chronic Health Evaluation (APACHE) II scoring system is characterized by high sensitivity and specificity. The final assessment reflects the sum of scores from 13 evalu-ated parameters, each of which may be scored on a scale of 0 to 4. An APACHE II score ≥8 prognosticates a severe course of disease. The appli-cation of the proposed scales is often limited by their complexity; further-more, some hospitals may have only limited access to certain scales. The Panc 3 score is a simple scoring system that evaluates hematocrit, body mass index (BMI) and pleural effusion. It was proposed that hematocrit >44%, BMI >30 kg/m2 and the presence of pleural effusion prognosticate a severe course of AP (7). Another simple, highly specific diagnostic test prognosticating a mild course of AP involves the evaluation of peritonitis, hematocrit value and creatinine level. According to Oskarsson et al (8) and Lankisch et al (9), a lack of peritonitis symptoms, hematocrit value <43% in men and <39.6% in women, and creatinine level ≤2 mg/dL (≤176.8 μmol/L) indicates a mild disease course. Another simple diagnos-tic test is the bedside index for severity in acute pancreatitis (BISAP). This index is calculated within the first 24 h after admission to hospital, and is based on five variables: blood urea nitrogen (azotemia) >25 mg/dL (>8.9 mmol/L); consciousness disorders (Glasgow coma scale <15); sys-temic inflammatory response syndrome (the presence of ≥2 of the follow-ing parameters: body temperature <36°C or >39°C; respiratory rate >20 breaths/min or partial pressure of carbon dioxide <32 mmHg; heart rate >90 beats/min; and white blood cell count <4.0×10⁹/L or >12.0×10⁹/L); age >60 years; and the presence of pleural effusion (10).
Given the lack of the consensus regarding the predictive value of the above-mentioned scales, the present study aimed to evaluate the utility of the selected scales in prognosticating the severity and risk for death among patients with AP according to the revised Atlanta clas-sification published in 2012 (4).
METHODSData from 1014 patients hospitalized due to AP from 16 surgical wards in the Kielce region of Poland between December 2010 and December 2011 were analyzed with regard to admission details, disease course and treatment outcome. The final sample should be regarded as com-plete because all cases of AP are presumably subject to inpatient care. The criterion for inclusion in the study was the diagnosis of AP according to the revised Atlanta classification. The Atlanta classifica-tion is based on a joint interpretation of the symptoms obtained in medical history, physical examination and targeted laboratory tests. The panel of diagnostic tests performed during treatment depended on the clinical state of the patient. Demographic characteristics, results of laboratory and imaging tests, the course and outcome of treatment, and duration of hospitalization, were reported in previously prepared documentation forms. The BISAP, Panc 3 score and Ranson scales were calculated based on data from the first 24 h of hospitalization in the ward, irrespective of the time of occurrence of the first symptoms of AP. The APACHE II score was calculated only for patients who required additional laboratory tests, which was usually related to a deteriorating state. Cut-off points for prognostication of mild, moderate and severe AP were BISAP >2, Panc 3 ≥2, Ranson ≥2 and APACHE ≥8. The CT severity index (CTSI) was performed and subsequently analyzed only in patients who required CT because of the following clinical indications (n=208): organ failure, fever or chills, long-lasting abdominal pain and recurrent increase in serum amylase activity. Results from CT performed between day 4 and day 7 of the disease were taken into consideration. In some patients, CT was not possible due to early death during the first hours of hospitalization.
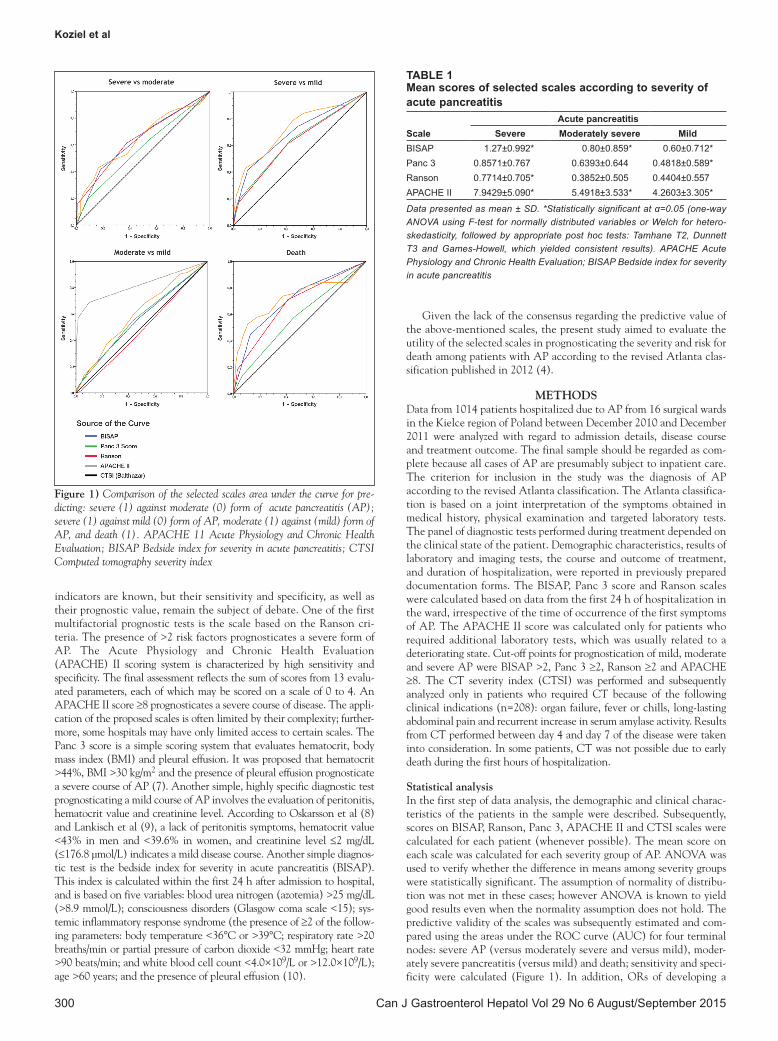
Statistical analysisIn the first step of data analysis, the demographic and clinical charac-teristics of the patients in the sample were described. Subsequently, scores on BISAP, Ranson, Panc 3, APACHE II and CTSI scales were calculated for each patient (whenever possible). The mean score on each scale was calculated for each severity group of AP. ANOVA was used to verify whether the difference in means among severity groups were statistically significant. The assumption of normality of distribu-tion was not met in these cases; however ANOVA is known to yield good results even when the normality assumption does not hold. The predictive validity of the scales was subsequently estimated and com-pared using the areas under the ROC curve (AUC) for four terminal nodes: severe AP (versus moderately severe and versus mild), moder-ately severe pancreatitis (versus mild) and death; sensitivity and speci-ficity were calculated (Figure 1). In addition, ORs of developing a
Figure 1) Comparison of the selected scales area under the curve for pre-dicting: severe (1) against moderate (0) form of acute pancreatitis (AP); severe (1) against mild (0) form of AP, moderate (1) against (mild) form of AP, and death (1). APACHE 11 Acute Physiology and Chronic Health Evaluation; BISAP Bedside index for severity in acute pancreatitis; CTSI Computed tomography severity index
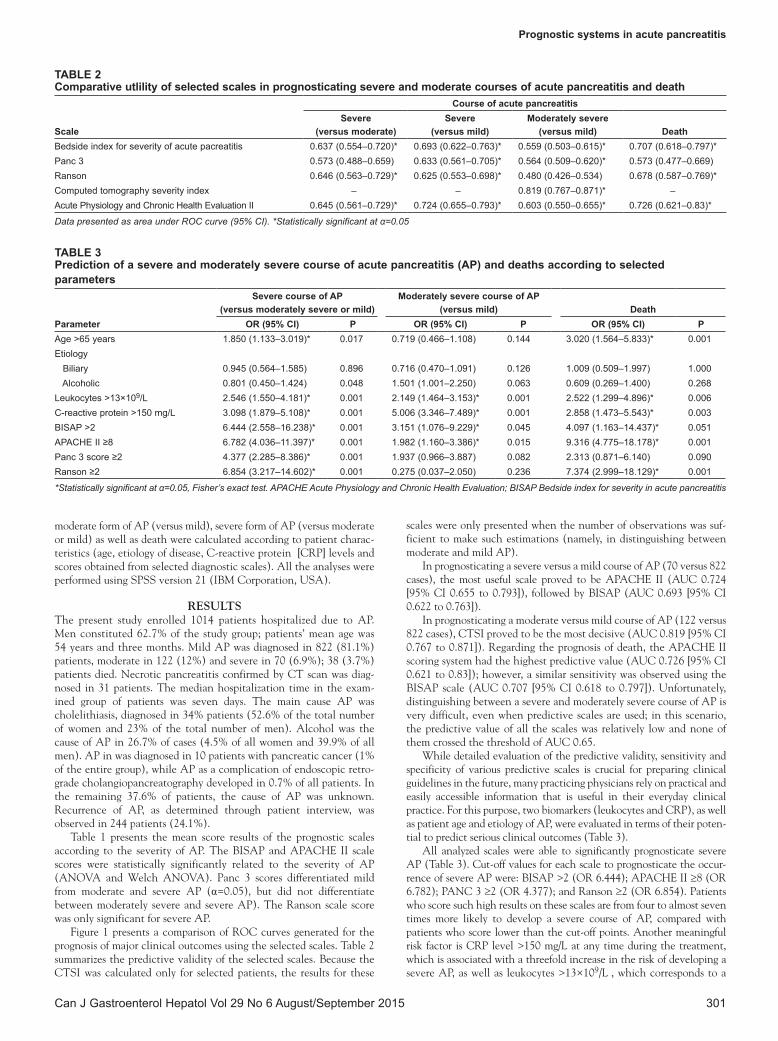
Table 1Mean scores of selected scales according to severity of acute pancreatitis
Scaleacute pancreatitis
Severe Moderately severe MildBISAP 1.27±0.992* 0.80±0.859* 0.60±0.712*Panc 3 0.8571±0.767 0.6393±0.644 0.4818±0.589*Ranson 0.7714±0.705* 0.3852±0.505 0.4404±0.557APACHE II 7.9429±5.090* 5.4918±3.533* 4.2603±3.305*
Data presented as mean ± SD. *Statistically significant at α=0.05 (one-way ANOVA using F-test for normally distributed variables or Welch for hetero-skedasticity, followed by appropriate post hoc tests: Tamhane T2, Dunnett T3 and Games-Howell, which yielded consistent results). APACHE Acute Physiology and Chronic Health Evaluation; BISAP Bedside index for severity in acute pancreatitis
Prognostic systems in acute pancreatitis
Can J Gastroenterol Hepatol Vol 29 No 6 August/September 2015 301
moderate form of AP (versus mild), severe form of AP (versus moderate or mild) as well as death were calculated according to patient charac-teristics (age, etiology of disease, C-reactive protein [CRP] levels and scores obtained from selected diagnostic scales). All the analyses were performed using SPSS version 21 (IBM Corporation, USA).
RESULTSThe present study enrolled 1014 patients hospitalized due to AP. Men constituted 62.7% of the study group; patients’ mean age was 54 years and three months. Mild AP was diagnosed in 822 (81.1%) patients, moderate in 122 (12%) and severe in 70 (6.9%); 38 (3.7%) patients died. Necrotic pancreatitis confirmed by CT scan was diag-nosed in 31 patients. The median hospitalization time in the exam-ined group of patients was seven days. The main cause AP was cholelithiasis, diagnosed in 34% patients (52.6% of the total number of women and 23% of the total number of men). Alcohol was the cause of AP in 26.7% of cases (4.5% of all women and 39.9% of all men). AP in was diagnosed in 10 patients with pancreatic cancer (1% of the entire group), while AP as a complication of endoscopic retro-grade cholangiopancreatography developed in 0.7% of all patients. In the remaining 37.6% of patients, the cause of AP was unknown. Recurrence of AP, as determined through patient interview, was observed in 244 patients (24.1%).
Table 1 presents the mean score results of the prognostic scales according to the severity of AP. The BISAP and APACHE II scale scores were statistically significantly related to the severity of AP (ANOVA and Welch ANOVA). Panc 3 scores differentiated mild from moderate and severe AP (α=0.05), but did not differentiate between moderately severe and severe AP). The Ranson scale score was only significant for severe AP.
Figure 1 presents a comparison of ROC curves generated for the prognosis of major clinical outcomes using the selected scales. Table 2 summarizes the predictive validity of the selected scales. Because the CTSI was calculated only for selected patients, the results for these
scales were only presented when the number of observations was suf-ficient to make such estimations (namely, in distinguishing between moderate and mild AP).
In prognosticating a severe versus a mild course of AP (70 versus 822 cases), the most useful scale proved to be APACHE II (AUC 0.724 [95% CI 0.655 to 0.793]), followed by BISAP (AUC 0.693 [95% CI 0.622 to 0.763]).
In prognosticating a moderate versus mild course of AP (122 versus 822 cases), CTSI proved to be the most decisive (AUC 0.819 [95% CI 0.767 to 0.871]). Regarding the prognosis of death, the APACHE II scoring system had the highest predictive value (AUC 0.726 [95% CI 0.621 to 0.83]); however, a similar sensitivity was observed using the BISAP scale (AUC 0.707 [95% CI 0.618 to 0.797]). Unfortunately, distinguishing between a severe and moderately severe course of AP is very difficult, even when predictive scales are used; in this scenario, the predictive value of all the scales was relatively low and none of them crossed the threshold of AUC 0.65.
While detailed evaluation of the predictive validity, sensitivity and specificity of various predictive scales is crucial for preparing clinical guidelines in the future, many practicing physicians rely on practical and easily accessible information that is useful in their everyday clinical practice. For this purpose, two biomarkers (leukocytes and CRP), as well as patient age and etiology of AP, were evaluated in terms of their poten-tial to predict serious clinical outcomes (Table 3).
All analyzed scales were able to significantly prognosticate severe AP (Table 3). Cut-off values for each scale to prognosticate the occur-rence of severe AP were: BISAP >2 (OR 6.444); APACHE II ≥8 (OR 6.782); PANC 3 ≥2 (OR 4.377); and Ranson ≥2 (OR 6.854). Patients who score such high results on these scales are from four to almost seven times more likely to develop a severe course of AP, compared with patients who score lower than the cut-off points. Another meaningful risk factor is CRP level >150 mg/L at any time during the treatment, which is associated with a threefold increase in the risk of developing a severe AP, as well as leukocytes >13×109/L , which corresponds to a
Table 2Comparative utlility of selected scales in prognosticating severe and moderate courses of acute pancreatitis and death
Scale
Course of acute pancreatitisSevere
(versus moderate) Severe
(versus mild) Moderately severe
(versus mild) DeathBedside index for severity of acute pacreatitis 0.637 (0.554–0.720)* 0.693 (0.622–0.763)* 0.559 (0.503–0.615)* 0.707 (0.618–0.797)*Panc 3 0.573 (0.488–0.659) 0.633 (0.561–0.705)* 0.564 (0.509–0.620)* 0.573 (0.477–0.669)Ranson 0.646 (0.563–0.729)* 0.625 (0.553–0.698)* 0.480 (0.426–0.534) 0.678 (0.587–0.769)*Computed tomography severity index – – 0.819 (0.767–0.871)* –Acute Physiology and Chronic Health Evaluation II 0.645 (0.561–0.729)* 0.724 (0.655–0.793)* 0.603 (0.550–0.655)* 0.726 (0.621–0.83)*
Data presented as area under ROC curve (95% CI). *Statistically significant at α=0.05
Table 3Prediction of a severe and moderately severe course of acute pancreatitis (aP) and deaths according to selected parameters
Parameter
Severe course of aP (versus moderately severe or mild)
Moderately severe course of aP (versus mild) Death
OR (95% CI) P OR (95% CI) P OR (95% CI) PAge >65 years 1.850 (1.133–3.019)* 0.017 0.719 (0.466–1.108) 0.144 3.020 (1.564–5.833)* 0.001Etiology Biliary 0.945 (0.564–1.585) 0.896 0.716 (0.470–1.091) 0.126 1.009 (0.509–1.997) 1.000 Alcoholic 0.801 (0.450–1.424) 0.048 1.501 (1.001–2.250) 0.063 0.609 (0.269–1.400) 0.268Leukocytes >13×109/L 2.546 (1.550–4.181)* 0.001 2.149 (1.464–3.153)* 0.001 2.522 (1.299–4.896)* 0.006C-reactive protein >150 mg/L 3.098 (1.879–5.108)* 0.001 5.006 (3.346–7.489)* 0.001 2.858 (1.473–5.543)* 0.003BISAP >2 6.444 (2.558–16.238)* 0.001 3.151 (1.076–9.229)* 0.045 4.097 (1.163–14.437)* 0.051APACHE II ≥8 6.782 (4.036–11.397)* 0.001 1.982 (1.160–3.386)* 0.015 9.316 (4.775–18.178)* 0.001Panc 3 score ≥2 4.377 (2.285–8.386)* 0.001 1.937 (0.966–3.887) 0.082 2.313 (0.871–6.140) 0.090Ranson ≥2 6.854 (3.217–14.602)* 0.001 0.275 (0.037–2.050) 0.236 7.374 (2.999–18.129)* 0.001
*Statistically significant at α=0.05, Fisher’s exact test. APACHE Acute Physiology and Chronic Health Evaluation; BISAP Bedside index for severity in acute pancreatitis
Koziel et al
Can J Gastroenterol Hepatol Vol 29 No 6 August/September 2015302
2.5 times higher risk of severe AP. Age >65 years increases the risk of severe AP by 85%.
In evaluating the risk of developing moderate AP (compared with mild), composite scales can be helpful. Selected cut-off points of APACHE II ≥8 and BISAP >2 are, in fact, related to a greater risk of developing a moderate course of AP (from nearly twofold to threefold increase, respectively); however, these complex scales are unlikely to be used on patients who appear to be stable and undergoing the treat-ment without apparent complications. In such a case, CRP >150 mg/L may be very helpful because it is associated with a fivefold increase of risk. Another indication that mild AP is worsening to moderate might be leukocytosis (OR 2.149; P<0.006).
In the prediction of death, APACHE II ≥8 can be particularly helpful (OR 9.316), followed by Ranson ≥2 (OR 7.374); the BISAP scale is also useful (OR 3.151; P<0.045). Age is also acknowledged to be an independent risk factor of death during the course of AP. In the present analysis, age >65 years was significantly related with the risk for death (OR 3.02; P<0.001).
Patients with CRP levels >150 mg/L were approximately 2.5 more times likely to die than those whose levels of CRP never exceeded the threshold. Among single markers of death, leukocytosis may also be helpful. Analysis of collected clinical data indicated that leukocytes >13×109/L carried a significant prognosis for death (OR 2.522).
The etiology of AP did not prove to be predictive of any of the clinical outcomes under investigation.
The results summarized in Table 3 suggest that composite scales provide a better estimate of whether a patient is at risk for a more severe course of AP and death. Single biomarkers, however, such as CRP and leukocytes, can also be helpful, especially in clinical settings where diagnostic capabilities are limited or time is crucial. For these reasons, a clinical application of these biomarkers should not be neg-lected, at least in some cases.
DISCUSSIONReports in the literature have described the progressive increase in hospitalizations due to AP in recent years. Currently, there are no epidemiological data regarding the incidence of AP in Poland. Annual observation of AP cases enables highly reliable verification of the diagnosis and classification of AP severity according to the modified Atlanta classification. Results of our studies indicate that the AP inci-dence rate in the Kielce region is significantly higher (99.9 per 100,000) than reported in other countries. The high percentage of unexplained causes of AP reported in the present study is likely related to insufficient medical history taking concerning alcohol abuse, and inadequate diagnosis of microcholecystitis in some patients. A high incidence rate was also recorded for first episodes of AP (79.7 per 100,000) (3).
Recently, a revision of the Atlanta classification was published (4). The revision was prompted by advances in knowledge concerning the pathophysiology of the disease and improvement in imaging diagnos-tics. Due to the lack of uniform criteria for defining the severe form of AP used in the literature to date, it is difficult to fully evaluate the actual sensitivity of the markers applied in prognosticating the course of the disease. In the present study, we attempted to evaluate the util-ity of selected scales for prognosticating severe and moderate courses of AP (according to the revised Atlanta classification) and risk for death. To date, many reports have been published evaluating the effective-ness of the prognostic scales applied to the assessment of the risk of severe AP and death. However, there are few studies evaluating the utility of the scales in prognosticating moderate AP. The difficulty in using the scales is associated mainly with the complexity of the instru-ments applied. More than 80% of cases of AP have a mild course; therefore, simple indexes that enable rapid selection of patients for whom there is no need to perform costly and complicated procedures are needed. One such scale is the harmless acute pancreatitis score, which uses hematocrit and creatinine levels, and the presence or absence of peritoneal symptoms (9). In the present study, APACHE II
scores ≥8 were successful in prognosticating severe AP and death; however, the CTSI index proved to be better at prognosticating a moderate course (AUC 0.819 [95% CI 0.767 to 0.871]). According to the current definition, moderate AP is characterized by transient organ failure and local and/or systemic complications. Until recently, these patients have most frequently been classified as having severe pancreatitis (11). However, recent insight into the pathophysiology AP, as well as the development of modern imaging techniques, has enabled standardized reporting on research and facilitated communi-cation among clinicians (4). Furthermore, updated classification now recognizes two phases of AP (early and late) and has redefined the mild, moderate and severe severity criteria (4). In the first phase, the intensity of AP is related to multiple organ dysfunction, secondary to the inflammatory response, and not necessarily pancreatic necrosis. The scope of morphological changes in the pancreas and the peripan-creatic tissues is not always proportional to the severity of the clinical course with or without organ dysfunction (12). The presence of necro-sis indicates the risk of infection, but does not necessarily identify patients with a severe course of the disease (13). The present study confirms that CTSI is a good index for prognosticating local complica-tions, but does not always prognosticate a severe course of the disease, and death.
The study confirmed previous observations that the use of APACHE II scale, even at the lowest cut-off point (>6), may be a good instrument for prognosticating organ failure and death (14). It is noteworthy that the use of APACHE II scale requires the evaluation of many variables, which considerably limits its usability. In addition, similar to other studies, its low sensitivity in the detection of local complications was confirmed (15).
The present study confirmed that, compared with APACHE II, the BISAP scale is easier to use, with similar sensitivity and specificity in prognosticating severe and moderate AP, and risk of death. Comprehensive population studies of early predictors of mortality due to AP did not show any statistically significant differences in predict-ive validity between BISAP and APACHE II (16) and, in the present study, AUCs for BISAP and APACHE II in prognosticating the risk of death were similar (0.707 versus 0.726). Recent Chinese studies (17,18) indicated the BISAP scale is valid instrument in prognosticat-ing severe AP. Ease of data collection facilitates use of the BISAP in any hospital, for all patients. Increased mortality seen in patients who score high on the the APACHE II scale (scores eight times higher than the total population) may be attributed to selection of severely ill patients, in whom the use of APACHE II is more prevalent (16). This observation was also made in the present study. BISAP predicts sever-ity in relation to immune response to damage or older age, while the Ranson scoring system seems to be more precise in predicting persis-tent organ dysfunction within 48 h (19). For the Ranson criteria, ≤2 positive variables predicted approximately 4% mortality, three or four positive variables predicted 10%, five or six variables predicted 36%, and seven or eight variables predicted >50% mortality (20). The present study confirmed a good predictive value of the Ranson scale in prognosticating severe AP and mortality; however, it was insufficient for predicting moderate AP (AUC 0.625; AUC 0.678 versus AUC 0.480). Previously research (21) has shown that prognosis of AP, based on Ranson and APACHE II scales, was burdened with a significant error. Most patients who developed severe AP were initially diagnosed with mild AP (21).
In the present study, sensitivity and specificity were evaluated on a simple scale (the Panc 3) that uses routine clinical parameters such as hematocrit, BMI, and the presence or absence of pleural effusion on radiological examination. The Panc 3 score is a sensitive instrument for prognosticating severe and moderate AP; however, no significant relationship was confirmed with prognosticating mortality. Considerably better results were obtained by the authors of the method, who confirmed that Panc 3 score prognosticates a severe course in 98% (7). A biomarker that may prognositicate severity of AP is CRP, which reaches maximum concentration in blood after 72 h.
Prognostic systems in acute pancreatitis
Can J Gastroenterol Hepatol Vol 29 No 6 August/September 2015 303
However, there is no agreement concerning its cut-off value. Patients with CRP values <110 mg/L are at low risk for development of necro-sis (22). Determination of the concentration of CRP in combination with multivariate prediction systems increases the effectiveness of diagnosing the disease. In the present study, CRP >150 mg/dL was correlated with mild pancreatitis. The white blood cell count is a simple test performed in patients with AP; in the present study, leukocytes >13×109/L was statistically significantly predictive of severe and moderate disease, and death. Several clinical studies con-firmed the role of cytokines and leukocytes in predicting the development and course of AP (23,24).
CONCLUSIONSOur results, for the most part, confirm earlier observations concerning the effectiveness of the scales applied in prognosticating the severity of AP. A newly implemented revision in the classification of AP (4) now includes a ‘moderate’ course of the disease, in addition to mild and severe, thus necessitating the need for scales that distinguish among the three categories. It is suggested that there is a demand for studies of prognostic factors that take into acount the new classification (25).
It should be stated that none of the scales examined in the present study is a sufficiently valid instrument in prognosticating the course of AP. A higher sensitivity and specificity is usually related to scales that are used to evaluate more clinically severe patients, and require diffi-cult-to-collect variables (eg, APACHE II); hence the necessity to seek new, simple and more sensitive prognostic indexes.
SUMMARYScoring systems used in the prognosis of the course of the disease vary with regard to sensitivity and specificity. The CTSI scoring system showed the highest precision in prognosticating moderately severe AP (Atlanta 2012); however, in prognosticating a severe course of the disease and mortality, APACHE II proved to possess the greatest predictive value.
AUTHOR CONTRIBUTIONS: D Koziel and S Gluszek designed the study;JMatykiewiczandPLewitowiczperformedtheresearch;SGłuszekandDKoziełanalyzedthedata;SGłuszekandDKoziełwrotethemanu-script; Z Drozdzak performed the statistical analysis.
REFERENCES1. <https://prog.nfz.gov.pl/APP-JGP/Start.aspx> (Accessed September
9, 2012).2. <http://www.statystyka.medstat.waw.pl/wyniki/
TabelaEurostat2010szac.htm> (Accessed September 9, 2012).3. Gluszek S, Koziel D. Prevalence and progression of acute
pancreatitis in the Świętokrzyskie Voivodeship population. Pol Przegl Chir 2012;84:618-25.
4. Banks PA, Bollen TL, Dervenis C, et al. Acute Pancreatitis Classification Working Group. Classification of acute pancreatitis – 2012: Revision of the Atlanta classification and definitions by international consensus. Gut 2013;62:102-11.
5. Bollen TL, VK Singh, Maurer R, et al. A comparative evaluation of radiologic and clinical scoring systems in the early prediction of severity in acute pancreatitis. Am J Gastroenterol 2012;107:612-9.
6. Talukdar R, Clemens M, Vege SS. Moderately severe acute pancreatitis: Prospective validation of this new subgroup of acute pancreatitis. Pancreas 2012;41:306-9.
7. Brown A, James-Stevenson T, Dyson T, et al. The Panc 3 score: A rapid and accurate test for predicting severity on presentation in acute pancreatitis. J Clin Gastroenterol 2007;41:855-8.
8. Oskarsson V, Mehrabi M, Orsini N, et al. Validation of the harmless acute pancreatitis score in predicting nonsevere course of acute pancreatitis. Pancreatology 2011;11:464-8.
9. Lankisch PG, Weber-Dany B, Hebel K, et al. The harmless acute pancreatitis score: A clinical algorithm for rapid initial stratification of nonsevere disease. Clin Gastroenterol Hepatol 2009;7:702-5.
10. Gompertz M, Fernández L, Lara I, et al. Bedside index for severity in acute pancreatitis (BISAP) score as predictor of clinical outcome in acute pancreatitis: Retrospective review of 128 patients. Rev Med Chil 2012;140:977-83.
11. Vege SS, Gardner TB, Chari ST, et al. Low mortality and high morbidity in severe acute pancreatitis without organ failure: A case for revising the Atlanta classification to include “moderately severe acute pancreatitis”. Am J Gastroenterol 2009;104:710-5.
12. Thoeni RF. The revised Atlanta classification of acute pancreatitis: Its importance for the radiologist and its effect on treatment. Radiology 2012;262:751-64.
13. Uomo G. Do we really need a new category of severity for patients with acute pancreatitis? JOP 2009;10:583-4.
14. Johnson CD, Abu-Hilal M. Persistent organ failure during the first week as a marker of fatal outcome in acute pancreatitis. Gut 2004;53:1340-4.
15. Gürleyik G, Emir S, Kiliçoglu G. Computed tomography severity index, APACHE II score, and serum CRP concentration for predicting the severity of acute pancreatitis. JOP 2005;6:562-7.
16. Wu BU, Johannes RS, Sun X, et al. The early prediction of mortality in acute pancreatitis: A large population-based study. Gut 2008;57:1698-703.
17. Chen L, Lu G, Zhou Q, et al. Evaluation of the BISAP score in predicting severity and prognoses of acute pancreatitis in Chinese patients. Int Surg 2013;98:6-12.
18. Wang AJ, Xu S, Hong JB, et al. The comparison of different clinical scoring systems for predicting prognosis in acute pancreatitis based on the revised Atlanta classification. Zhonghua Nei Ke Za Zhi 2013;52:668-71.
19. Papachristou GI, Muddana V, Yadav D, et al. Comparison of BISAP, Ranson’s, APACHE-II, and CTSI scores in predicting organ failure, complications, and mortality in acute pancreatitis. Am J Gastroenterol 2010;105:435-41.
20. Spitzer AL, Barcia AM, Schell MT, et al. Applying Ockham’s razor to pancreatitis prognostication: A four-variable predictive model. Ann Surg 2006;243:380-8.
21. GłuszekS,MatykiewiczD,DudekA.Complicationsandprognosisin severe acute pancreatitis. Pol Przegl Chir 2006;78:139-50.
22. Bezmarević M, Kostić Z, Jovanović M et al. Procalcitonin and BISAP score versus C-reactive protein and APACHE II score in early assessment of severity and outcome of acute pancreatitis. Vojnosanit Pregl 2012;69:425-31.
23. Granger J, Remick D. Acute pancreatitis: Models, markers, and mediators. Shock 2005;(24 Suppl 1):45-51.
24. Moreno-Osset E, López A, de la Cueva L, et al. 99mTc-hexamethylpropylene amineoxime leukocyte scintigraphy in acute pancreatitis: An alternative to contrast-enhanced computed tomography? Am J Gastroenterol 2005;100:153-61.
25. Kapoor K, Banks PA. Early prognostic evaluation of acute pancreatitis: An on-going challenge. JOP 2013;14:109-11.

Submit your manuscripts athttp://www.hindawi.com
Stem CellsInternational
Hindawi Publishing Corporationhttp://www.hindawi.com Volume 2014
Hindawi Publishing Corporationhttp://www.hindawi.com Volume 2014
MEDIATORSINFLAMMATION
of
Hindawi Publishing Corporationhttp://www.hindawi.com Volume 2014
Behavioural Neurology
EndocrinologyInternational Journal of
Hindawi Publishing Corporationhttp://www.hindawi.com Volume 2014
Hindawi Publishing Corporationhttp://www.hindawi.com Volume 2014
Disease Markers
Hindawi Publishing Corporationhttp://www.hindawi.com Volume 2014
BioMed Research International
OncologyJournal of
Hindawi Publishing Corporationhttp://www.hindawi.com Volume 2014
Hindawi Publishing Corporationhttp://www.hindawi.com Volume 2014
Oxidative Medicine and Cellular Longevity
Hindawi Publishing Corporationhttp://www.hindawi.com Volume 2014
PPAR Research
The Scientific World JournalHindawi Publishing Corporation http://www.hindawi.com Volume 2014
Immunology ResearchHindawi Publishing Corporationhttp://www.hindawi.com Volume 2014
Journal of
ObesityJournal of
Hindawi Publishing Corporationhttp://www.hindawi.com Volume 2014
Hindawi Publishing Corporationhttp://www.hindawi.com Volume 2014
Computational and Mathematical Methods in Medicine
OphthalmologyJournal of
Hindawi Publishing Corporationhttp://www.hindawi.com Volume 2014
Diabetes ResearchJournal of
Hindawi Publishing Corporationhttp://www.hindawi.com Volume 2014
Hindawi Publishing Corporationhttp://www.hindawi.com Volume 2014
Research and TreatmentAIDS
Hindawi Publishing Corporationhttp://www.hindawi.com Volume 2014
Gastroenterology Research and Practice
Hindawi Publishing Corporationhttp://www.hindawi.com Volume 2014
Parkinson’s Disease
Evidence-Based Complementary and Alternative Medicine
Volume 2014Hindawi Publishing Corporationhttp://www.hindawi.com