a chironomid based palaeoecological investigation of late
TRANSCRIPT

Geog. Bsc.(hons.) 5831914
1
A Chironomid Based Palaeoecological Investigation of Late Glacial Climate Change in North Wales
Student ID: 5831914
Submitted to the School of Environment and Development, University of Manchester in partial fulfilment of the
Geography Bsc.(hons.) course requirements, 31st of January 2009.
14,538 words

Geog. Bsc.(hons.) 5831914
2
School of Environment and Development: Geography
STATEMENT ON PLAGIARISM In Submission of work for assessment, I affirm my familiarity with the guidelines on plagiarism laid down by the University of Manchester including: (1) Coursework, dissertations and essays submitted for assessment must be the student’s own
work, unless in the case of group projects a joint effort is expected and is indicated as such. (2) Direct copying from the work of another person is an unfair practice unless the material quoted
is acknowledged. This applies of copying from other students’ work and from sources such as books, reports, journal articles and the world wide web.
(3) An exact quotation should be indicated by the use of quotation marks. A quotation or para-
phrase from another person’s work should acknowledge the source of material by giving the author, year of publication and page numbers. The full reference must then be included in the bibliography at the end of the piece of work.
(4) Submitting the same piece of work for different course units is not permitted. This is known as
self-plagiarism. I understand that this document will be held on file in the School of Geography and will be
taken to relate to all work submitted by me for assessment.
Registration Number: 5831914 Degree Course: Geography Bsc(hons.) Date: 31/01/2009

Geog. Bsc.(hons.) 5831914
3
Abstract
There is a need to improve our understanding of past climate change as past changes offer consider-
able insight into the functioning of the climate system. Although extensive, reconstructions of the last
deglaciation in north-west Europe (10-17ka yrs. B.P.) have not fully resolved the nature of the short
fluctuations that characterised this period. Non-biting midges (Chironomids) have been shown to be
effective in recreating summer temperatures, and so a Chironomid based temperature reconstruction
for a late-glacial lacustrine sequence from North Wales is presented and compared with existing re-
constructions for the British Isles. An existing temperature transfer function has been applied to the
results and they are evaluated against existing evidence of late-glacial climate. The climate throughout
the late glacial is unstable, and at least one cooling episode during the Windermere Interstadial can be
identified. The results from this study are used to reconstruct precipitation at a nearby site once sup-
porting a Younger Dryas cirque glacier, which is in general agreement with existing reconstructions,
reinforcing the findings of others who argue that the Younger Dryas in Wales was characterised by
high annual rainfall, comparable with modern precipitation. The study concludes that late-glacial cli-
mate change in the British Isles is likely to be considerably more complicated than previously found,
and it seems likely that there are close parallels with the Greenland ice core and continental terrestrial
records, and that seasonality is likely to have played an important role in the nature of this change.

Geog. Bsc.(hons.) 5831914
4
Acknowledgments
I would like to acknowledge the support of the staff of the Geography Department at Manchester Uni-
versity during the course of preparing this dissertation, particularly Jeff Blackford for first introducing
me to Chironomids and Phil Hughes for providing invaluable information on the study site and his re-
cent work on glacier modelling. Tim Allot introduced to me many of the statistical techniques used in
this study. I thank John Moore and Pete Ryan for their assistance in the laboratory. Special thanks are
due to Steve Brooks of the Natural History Museum, London for his invaluable assistance in providing
the temperature reconstructions.
I would also like to thank Andy Parker for his assistance in the field and lengthy discussions about the
direction of the work. Thanks are also due to Louise Richardson for her numerous second opinions on
Chironomid taxonomy and advice about the site. Thomas Hammant patiently explained the finer points
of PCA to me in a language I could understand.
Geog. Bsc.(hons.) 5831914
5
Contents
Title Page Plagiarism Statement
Acknowledgements Contents Lists of figures & tables Ch 1 Introduction to the Late Glacial 1.1 Glacial/interglacial cycles 1.2 The last deglaciation 1.3 The last interstadial 1.4 The last stadial Ch 2 Climate Change Past and Present 2.1 The relevance of the last glacial 2.2 Problems with current proxies 2.3 Advantages of Chironomid proxies Ch 3 Aims & Objectives of the study Ch 4 Site description and History 4.1 Vegetation and topography 4.2 Previous onsite research 4.3 Previous local research Ch 5 Methods 5.1 Core extraction and sub-sampling 5.2 Loss on ignition measurements 5.3 Chironomid sorting and mounting 5.4 Chironomid taxonomy 5.5 Temperature transfer function Ch 6 Data Presentation & Description 6.1 Visual stratigraphy and LOI results 6.2 Chironomid counts & stratigraphy 6.3 Temperature transfer function Ch 7 Data Analysis & Discussion 7.1 Interpretation of stratigraphy and loss on ignition 7.2 Environmental interpretation of Chironomid results 7.3 Comparison with other records of the late glacial Ch 8 Precipitation reconstruction 8.1 Explanation/introduction 8.2 Application 8.3 Discussion Ch 9 Conclusions & Directions for Further Research 9.1 Contribution to understanding in the British Isles 9.2 Contribution to understanding Climate Change 9.3 Future uses of Chironomid studies 9.4 Proposal for expansion of this study List of References Appendix
1 2
4 5 6 7 20 26 27 30 35 42 56 58 62 74
Page No.
Abstract 3

Geog. Bsc.(hons.) 5831914
6
List of Figures
1.1 Schematic of temperature change during the Late Glacial (p8)
1.2 Table of stratigraphic units for the Late Glacial (p9)
1.3 Ice core oxygen isotope records for the Late Glacial (p10)
1.4 Schematic of movements of the polar front during the Late Glacial (p10)
1.5 Table of Dates of the Younger Dryas (p13)
1.6 Map of Coleopteran temperature reconstructions for the Younger Dryas (p15)
1.7 Vegetation inferred temperatures for the Younger Dryas (p15)
1.8 Proposed Lake Agassiz Drainage routes (p17)
4.1 Topographic map of Fridd-y-Fawnog (p28)
4.2 Detailed survey map of Fridd-y-Fawnog, showing core locations (p28)
4.3 Photograph of a previously retrieved core from Fridd-y-Fawnog (p27)
4.4 Table summarising temperature reconstructions applicable to North Wales (p29)
5.1 Procedure for Chironomid preparation used in this study (p31)
5.2 Micrographs of Chironomids encountered in this study (p33)
5.3 Annotated micrograph of Pseudochironomus (p32)
5.4 Table to compare of chironomid based temperature transfer functions (p34)
6.1 Loss-on-ignition stratigraphic diagram (p35)
6.2 Constrained cluster analysis results tree diagram (p37)
6.3 Graph of the taxa diversity (p37)
6.4 Chironomid stratigraphic diagram arranged by taxonomic group (p38)
6.5 Graph of the temperature transfer function results (p41)
7.1 LOI comparison diagram (p43)
7.2 Graph of the principle component analysis scores (p44)
7.3 Pollen stratigraphic diagram for Fridd-y-Fawnog (p45)
7.4 Chironomid stratigraphic diagram arranged by temperature preference (p46)
7.5 Table of Chironomid taxa and their temperature preferences (p47)
7.6 Chironomid stratigraphic diagram arranged by trophic indicator species (p50)
7.7 Chironomid stratigraphic diagram summarising the results (p55)
8.1 Rainfall map of North Wales

Geog. Bsc.(hons.) 5831914
7
Chapter 1: Introduction to The Last Glaciation in north-west Europe
1.1. Glacial/interglacial cycles
Throughout the Quaternary (2.6-1.8m yrs. B.P. - present) there have been regular switches between
periods with extensive global glacier ice and cooler temperatures, termed “glacials”, and periods with
significantly less ice cover and higher global surface temperatures, termed “interglacials” (Benn & Ev-
ans, 1998). In the British Isles the last glacial period, known as the Devensian (Mitchell et al., 1973)
lasted from 110-12k yrs. B.P., with the maximum extent of ice growth between 27-20k 14C yrs. B.P.
(Fretwell et al., 2007) when there was extensive ice cover over much of Northern Europe and North
America, referred to collectively as the Palaeoartic. The main ice sheet over the British Isles flowed
southward from the north of Ireland, south Scotland and northern England across the British Midlands
and much of Wales, covering the Arctic Sea and the British Isles as far south as London (Benn & Ev-
ans, 1998). An ice dome centred over the higher reliefs of North Wales varied between a state of con-
junction and independence from the main ice flow, although there is considerable debate regarding the
size, centre and direction of flow from this ice dome (McCarrol & Ballantyne, 2000).
This dissertation is concerned with the termination of the Devensian glaciation and the transition to the
current interglacial period of the present day, which started around 10.2k yrs. B.P. (Taylor et al., 1997).
As temperatures increased, driven by long term variations in the Earths orbit, the ice melted between
17-13k yrs. B.P. (Woodcock & Stracken, 2000), and England and Wales were completely ice free by
13k yrs. B.P., although Bradwell et al., (2008) argue for the existence of glaciers in Scotland at this
time. This period of glacier retreat across the Palaeoartic, or “Late-Glacial period” was not linear and
was characterised by unstable and rapidly fluctuating temperatures, as described in figure 1.1 and in
detail in the following sections.
1.2 The last deglaciation
Immediately following deglaciation in the British Isles warmer conditions allowed the development of
open scrubland, followed by open woodland characterised by Juniperus (Juniper) and Salix (Willow).
In the British Isles this warm period is termed the Windermere Interstadial. Although warm these condi-
tions were variable, and in parts of Europe at least one cold fluctuation termed the Older Dryas has
been identified (Lowe & Walker, 1997). Johnsen et al. (1992) delineate no less than two large deterio-
rations in climate during the interstadial in ice cores from Greenland. This warm period ended abruptly
with the onset of a sharp deterioration of climate that caused the reappearance of valley glaciation in

Geog. Bsc.(hons.) 5831914
8
Figure 1.1. A schematic of the temperature changes through the Late G
lacial. M
odified from W
alker, 1995 & Johnsen et al., 1993. The blue
lines denote the tim
escale of this study. Note the difference between radiocarbon and calendar age dates.
CO
LD
ER
- W
AR
ME
R

Geog. Bsc.(hons.) 5831914
9
the British Isles and parts of north-west Europe for around 1k yrs. (Brauer et al., 2000); this deteriora-
tion is termed the Loch Lomond Re-advance in Britain (Benn & Evans, 1998). The climate amelioration
that followed the Loch Lomond Re-advance marked the start of the Holocene, the interstadial that runs
to the present day (Roberts, 1998). Regional nomenclature differs and a brief guide is presented in
figure 1.2.
Some of the best evidence of this period of deglaciation comes from oxygen isotope and other geo-
chemical evidence from the Greenland ice cores, which clearly show the characteristic course of ini-
tially warm temperatures immediately after deglaciation, followed by a slow decline in temperatures,
culminating in a prolonged period of cold temperatures (e.g. Johnsen et al., 1992; see figure 1.3). This
sequence has been recognised from studies in Greenland, the British Isles, Western Europe and North
America, and there is evidence for a similar oscillations in climate in a number of other locations
throughout the Northern Hemisphere and possibly the globe, although the latter two are the subjects of
considerable debate (see Roberts, 1998).
Björk et al. (1998a) have advocated the use of the GRIP ice core record as the type-sequence for the
Late Glacial in north-west Europe, but although most north-west European records agree on the key
events present in the GRIP record there is significant regional variation and ambiguities in European
and the British terrestrial records when they are compared, particularly with regard to the exact timing
Stratigraphic Unit Date
(Illustrative) General term
British Isles Ireland NW Europe Greenland
Early Holocene Early
Holocene Early
Holocene Early Holocene GI-0 10k-present
Younger Dryas stadial
Loch Lomond stadial
Woodgrange Interstadial
Younger Dryas GS-1 11-10k
Late Glacial inter-stadial
Windermere Interstadial
Nahanagan stadial
Bolling oscillation GI-1a GI-1b GI-1c GI-1d GI-1e
13-11k Older Dryas
Allerod oscillation
Pleniglacial Devensian termination
Devenisan termination
Wiechelian Termination/pleniglacial
GS-2 17-13k
Figure 1.2. Stratigraphic units for the last glacial-interglacial transition. Note the abbreviations GS for “Greenland stadial number” and GI for “Greenland interstadial number”. After Lowe & Walker (1997) &

Geog. Bsc.(hons.) 5831914
10
Fig. 1.4: Movements of the polar front
through the Late-G
lacial. From Tolan-
Smith (1998).
Fig. 1.3: Oxygen isotope records for the G
reenland G
ISP2 core. Shifts
to the left indicate colder conditions & vice versa. The stadials and inter-
stadials are labelled. From Hoek & Bos (2007).
CO
LD
ER
- W
AR
ME
R

Geog. Bsc.(hons.) 5831914
11
and extent of smaller oscillations in climate present throughout the GRIP record.
There are also regional variations in the response of vegetation and other biota to changes during the
Late Glacial (Walker et al., 1994). As a result of these differences the specific details of conditions dur-
ing the Windermere Interstadial and Loch Lomond Re-advance are the subject of considerable re-
search, debate and disagreement. The following sections outline some of the differences and dis-
agreements between sources and identify areas of the literature that would benefit from further study.
It concludes by introducing the importance of understanding how climate changed throughout the Late
Glacial, and introduces recent techniques that have opened up new possibilities to improve the record.
1.3 The Late Glacial Interstadial
Across north-west Europe there is clear evidence of a return to warm conditions following the retreat of
glaciation to more northerly latitudes in the region. These changes were driven by the northerly shift of
the Polar Front as ice receded (see figure 1.4). Across Great Britain the initial an open-scrub habitat
was succeeded by a Juniperus, Salix and Pinus open woodland habitat through the Windermere Inter-
stadial (Sparks & West, 1972). In north-west Europe the flora changed from a sparse steppe habitat to
a forest of Betula and Salix, followed by Pinus, although the period was punctuated by a short lived
return to an open steppe habitat (Brauer et al., 2000) at least once, and possibly twice. The expression
of these short returns to cold conditions (termed the Older and Oldest Dryas in Europe) is debated in
records from the British Isles, where some workers find evidence for a single fluctuation (e.g. Burrows,
1974; Crabtree, 1972) whilst others argue that no ecotonal boundaries were crossed during the inter-
stadial (e.g. Seddon, 1962; Simpkins, 1974). However much of this work was based on pollen studies
and vegetation response is known to lag behind climate change; this may explain the suppressed ex-
pression of climate changes in these records. Some workers have used assemblages of Coleoptera
(beetles), which are highly responsive to temperature change, to reconstruct past temperatures, but
these have not fully resolved the events during the interstadial, with different sites yielding different
numbers of events of varying magnitude through the interstadial (e.g. Atkinson et al., 1987).
More recent work with Chironomid (non-biting midge) based proxies has suggested that the intersta-
dial in the British Isles is even more complex, with some studies showing two main cooling events (e.g.
Walker et al., 2003; Bedford et al., 2004) and others up to three (e.g. Brooks & Birks, 2000). None
have been positively correlated with the north-west European stratigraphy, although some are superfi-
cially similar. Some reconstructions do show some affinity with the Greenland ice core stratigraphy
Geog. Bsc.(hons.) 5831914
12
(Mayle et al., 1999) they are far from analogous, and there is no clear indication that changes in the
British Isles follow the Greenland or European stratigraphy closely.
The Greenland ice cores suggest an early peak in temperature, followed by a stepped decline punctu-
ated by three short, rapid cooling events (Johnsen et al., 1992). Although the Greenland ice core re-
cord provides arguably the most detailed record of climate change through the Late Glacial it lacks the
scope to infer the nature of change elsewhere, which must be resolved with further use of in-situ ter-
restrial proxy records. Given that the European Older Dryas has been correlated with a cooling event
in the Greenland ice cores (Johnsen et al., 1992) it would seem likely that this cooling also occurred in
the British Isles, but as yet no conclusive timeline of events during the Interstadial in the British Isles
can be agreed (Mayle et al., 1999).
These disagreements could represent a regional difference in the expression of climate changes
through the interstadial, or it could be the case that the changes were very similar but that our interpre-
tations are limited by the quality of our terrestrial records of change. Further research is needed to clar-
ify the timing, magnitude and geographical extent of these changes in order to understand the nature
of change during the interstadial. This is because all proxy records have a certain amount of noise and
it is only by combining, comparing and expanding the literature that any synchronous, wide spread
climatic events can be identified.
1.4 The Late Glacial Stadial in Europe
The Younger Dryas was a ~1,000yr period of rapid cooling that followed the warming of the Winder-
mere Interstadial. The existence of the Younger Dryas in Europe “has been known for most of the cen-
tury” (Anderson, 1997 p230), and the expansion and diversification of palaeoecological records has
revealed it may well be hemispheric or global in nature (Peteet, 1995), although the wealth of evidence
comes from the north Atlantic region. The cooling was large enough to cause glacial advances over
much of northern Europe and North America, and there is evidence of the effects of cooling on a hemi-
spheric and possibly global scale (Roberts, 1998). The period is important because it represents an
interruption of deglaciation, and does not fit with the Milankovitch cycles that are dominant in control-
ling the glacial-interglacial cycle (discussed fully in chapter 2). Rather, it seems to represent instability
in the climate system at this time, although the causes of the perturbation are heavily debated.
Geog. Bsc.(hons.) 5831914
13
Although a number of climatic deteriorations have been identified during the Late Glacial, the perturba-
tion is unique within the late quaternary in both its magnitude, with mean annual temperature reduc-
tions of ~7-8°c and its rapid onset, in the order of 30-200 cal. yrs. (Alley et al., 1993). This has led to it
being described as the “canonical example of abrupt climate change” (Carlson et al., 2007, p. 6556),
and the focus of much research within the community.
1.4.1 Records of the Stadial
The onset of the Younger Dryas was very rapid, with the reversal completed in the order of ~50 yrs.
(Alley et al., 1993), although other proxy records tend to show a slower response in the order of 50-
200 years. Although the Younger Dryas is conventionally dated to between 11-10k 14C yrs. B.P. (Bell &
Walker, 2005), the identification of 14C dating plateaux, or systemic bias around these dates means
they are difficult to calibrate to better than a few hundred calendar years (Lowell & Kelly, 2008; Reimer,
2004). Precisely dating the Younger Dryas has important implications if geographically separate re-
cords are found not to be synchronous; it could indicate lags in the chosen proxies response, the
change in climate in an area or even question theories that attempt to explain the Younger Dryas,
which are critically reliant on accurate dating (e.g. Knutti et al., 2004). The exceptionally well con-
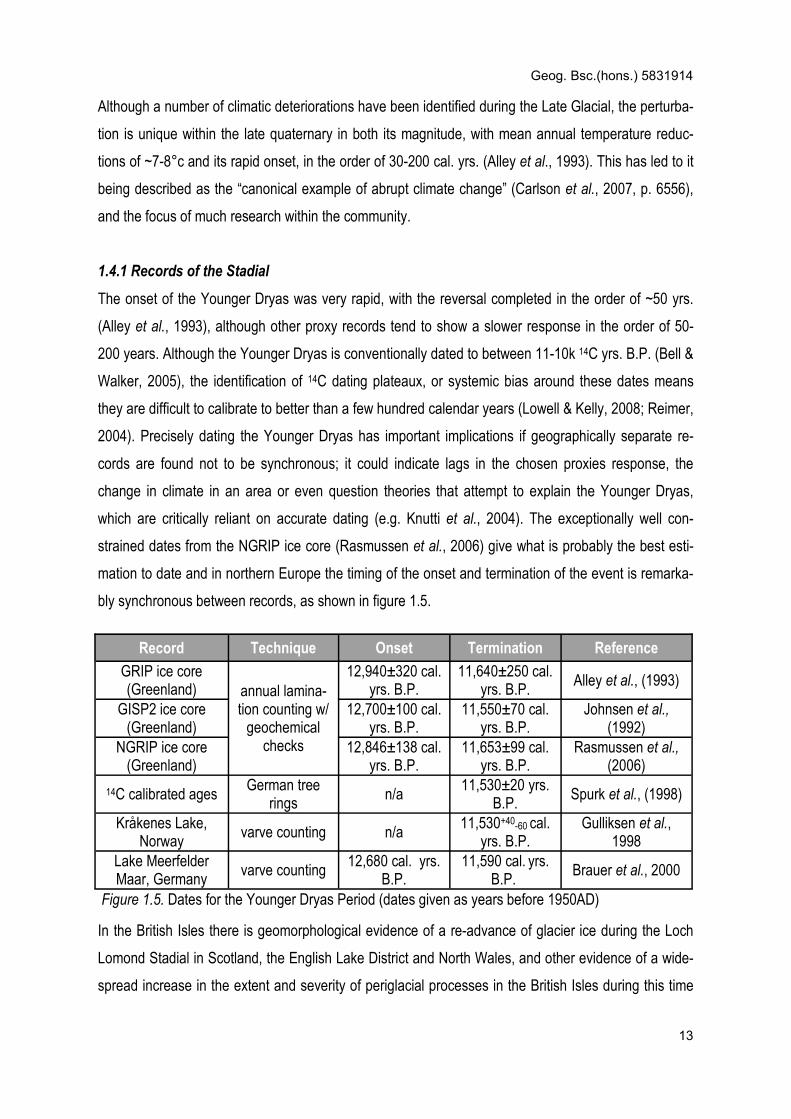
strained dates from the NGRIP ice core (Rasmussen et al., 2006) give what is probably the best esti-
mation to date and in northern Europe the timing of the onset and termination of the event is remarka-
bly synchronous between records, as shown in figure 1.5.
In the British Isles there is geomorphological evidence of a re-advance of glacier ice during the Loch
Lomond Stadial in Scotland, the English Lake District and North Wales, and other evidence of a wide-
spread increase in the extent and severity of periglacial processes in the British Isles during this time
Record Technique Onset Termination Reference
GRIP ice core (Greenland) annual lamina-
tion counting w/ geochemical
checks
12,940±320 cal. yrs. B.P.
11,640±250 cal. yrs. B.P.
Alley et al., (1993)
GISP2 ice core (Greenland)
12,700±100 cal. yrs. B.P.
11,550±70 cal. yrs. B.P.
Johnsen et al., (1992)
NGRIP ice core (Greenland)
12,846±138 cal. yrs. B.P.
11,653±99 cal. yrs. B.P.
Rasmussen et al., (2006)
14C calibrated ages German tree
rings n/a
11,530±20 yrs. B.P.
Spurk et al., (1998)
Kråkenes Lake, Norway
varve counting n/a 11,530+40-60 cal.
yrs. B.P. Gulliksen et al.,
1998 Lake Meerfelder Maar, Germany
varve counting 12,680 cal. yrs.
B.P. 11,590 cal. yrs.
B.P. Brauer et al., 2000
Figure 1.5. Dates for the Younger Dryas Period (dates given as years before 1950AD)

Geog. Bsc.(hons.) 5831914
14
(Harrison et al., 2008). The pollen record generally agrees that the habitat changed to open-steppe
tundra, with discontinuous vegetation cover dominated by Artemisia and Rumex (Pennington, 1977).
Pollen and macrofossil evidence suggest mean summer temperatures in the British Isles were around
10-12°c during the stadial (Isarin & Bohncke, 1999; see figure 1.7), which is in line with geomor-
phological evidence (e.g. Harrison et al., 2008) and glacier reconstructions (e.g. Hughes, 2002). The
terrestrial biological record is particularly useful in tracing the rapid onset of the Loch Lomond Stadial
and in reconstructing the exact temperatures; Coleoptera based proxies have indicated mean summer
and winter temperatures of ~+10°c and ~-20°c respectively (Atkinson et al., 1987; see figure 1.6).
More recent data from Chironomid based proxies in Scotland indicate a similar mean summer tem-
perature (Brooks & Birks, 2000).
One key disagreement in the literature is over the nature of precipitation during the Loch Lomond Sta-
dial; interpretation of past vegetation often suggest low levels of precipitation during the period (Isarin
et al., 1998), and this position is supported by recent evidence from relic rock glaciers (Harrison et al.,
2008) and some climate models (Renssen et al., 2001). However, evidence from glacier reconstruc-
tions suggests that the period must have had a rainfall comparable to modern climate (Grey, 1982;
Hughes, 2002). Although the theory of longer winters and correspondingly shorter summers (see
Denton et al., 2005) could go some way to settling these differences there is a considerable need for
clarification of this important aspect of climate through the stadial. There is evidence of a southerly
shift in the course of winter storm tracks (Isarin et al., 1998; Brauer et al., 2008), but it is ambiguous as
to whose case, if any, this supports.
Key to the periglacial and glacial inferences of precipitation are a prior knowledge of temperatures,
because their models are based on relationships between altitude, temperature and precipitation; if
temperature can be constrained, precipitation can be predicted (Sutherland, 1984; Hughes &
Braithwaite, 2008). In the British Isles the Coleoptera based record is widely used to constrain palaeo-
temperature, although this method may have a fairly low precision because of the wide temperature
tolerances of many species. It produces only a possible range of temperatures, and the actual summer
and winter values within that range are estimated by comparison with a limited number of modern
sites. Coleoptera based reconstructions remain largely untested by comparison with independent alter-
native proxies, limiting the certainty of any precipitation reconstruction in the British Isles and beyond.

Geog. Bsc.(hons.) 5831914
15
Figure 1.6: Coleoptera-inferred summer temperatures (Tmax) for the Younger Dryas. Temperatures are in degrees celcius, and the thick black lines indicate the limits of major glaciation. From Coope et al. (1998).
Figure 1.7a: Minimum mean temperature of the warmest month during the Younger Dryas inferred from flora as-semblages. From Isarin et al. (1998).
a
b Figure 1.7b: Annual tempera-ture ranges for the Younger Dryas (bold) and difference to the present day (italic). From Isarin et al. (1998).

Geog. Bsc.(hons.) 5831914
16
Taking a broader perspective, a similar response is evident across much of Northern Europe, where
light demanding, cold tolerant species dominated (Isarin & Bohncke, 1999) to form a treeless habitat,
with shrub and herb communities characterised by Juniper, Salix, Cyperaceae (sedges), Chenopodi-
aceae and Gramineae (grasses) in much of west and central Europe (Goslar et al., 1993; Isarin & Boh-
ncke, 1999; Litt & Stebich, 1999), although there may have been more extensive tree cover then previ-
ously thought (Kullman, 2002). There were glacial advances in the Alps and other mountainous re-
gions of Europe (e.g. Kerschner et al., 2000), as well as re-advances of the Fennoscandian ice sheet
(Bell & Walker, 2005).
There is some evidence for hemispheric response, including evidence of renewed glacier activity in
North America that is coeval with the European Younger Dryas (Bell & Walker, 2005), and small cirque
glaciers have been found to have developed in Greece (Hughes et al., 2006). Other studies find the
effects may have been global, where advances in Patagonian glaciers (Ackert et al., 2008) and high
resolution pollen sequences from China showing a reduction in forest cover have been well dated to
the same period (Stebich et al., in press). The record of changes in many southern hemisphere re-
gions are either absent or a subject of debate (e.g. New Zealand, see Barrows et al., 2007; Applegate
et al., 2008), and suggests that if anything, a change in weather patterns, rather than a temperature
depression affected these regions during the stadial.
Alley (2006) has summarises the Younger Dryas as “a cold event across much of the Northern Hemi-
sphere, but especially centered on the northeastern Atlantic, with anomalously dry conditions in broad
monsoonal regions of Africa and Asia, tropical atmospheric circulation shifted southward especially in
the Americas, and southern warmth.” (p247). However the explanations of the cause of such a large
perturbation of the climate system are controversial and “investigation of the forcing of such an ex-
treme environmental state offers a new view of climate change” (Mayewski et al., 1993, p197).
1.4.2 Causes of the Stadial
There has recently been a re-energising of debate surrounding the mechanisms that caused the
Younger Dryas, and although some workers have proposed some radical new theories the sum con-
clusions of the new research have been to strengthen the weight of much of the previous literature
(Colman, 2007). Berger (1990) outlines three possible broad mechanisms for the Younger Dryas:
Geog. Bsc.(hons.) 5831914
17
• Positive feedbacks within the climate system (ocean circulation etc.)
• An internal threshold feedback (e.g. collapse of the ice sheets)
• External forcing of the climate system (e.g. volcanism, solar radiation)
The generally accepted theory is that some freshwater perturbation caused a weakening or cessation
of the process of North Atlantic Deep Water Formation (NADW), causing a corresponding weakening
of the Meridonal Overturning Circulation (MOC, also known as the thermohaline circulation). This led
to a southerly shift of the Polar Front because of a weakened receipt of warm North Atlantic Drift
(NAD) water from the equatorial regions and caused terrestrial temperature shifts consistent with a
reduced ocean surface temperature. This mode of forcing has been implicated in other events, such as
the “Finse/8.2ka event” (Alley et al., 1997; Barber et al., 1999). However, there is still no consensus on
the origin of the freshwater flux needed to disrupt the NADW, and so a summary of the main proposed
theories follows, along with a brief overview of the proposals that do not implicate changes in MOC
directly.
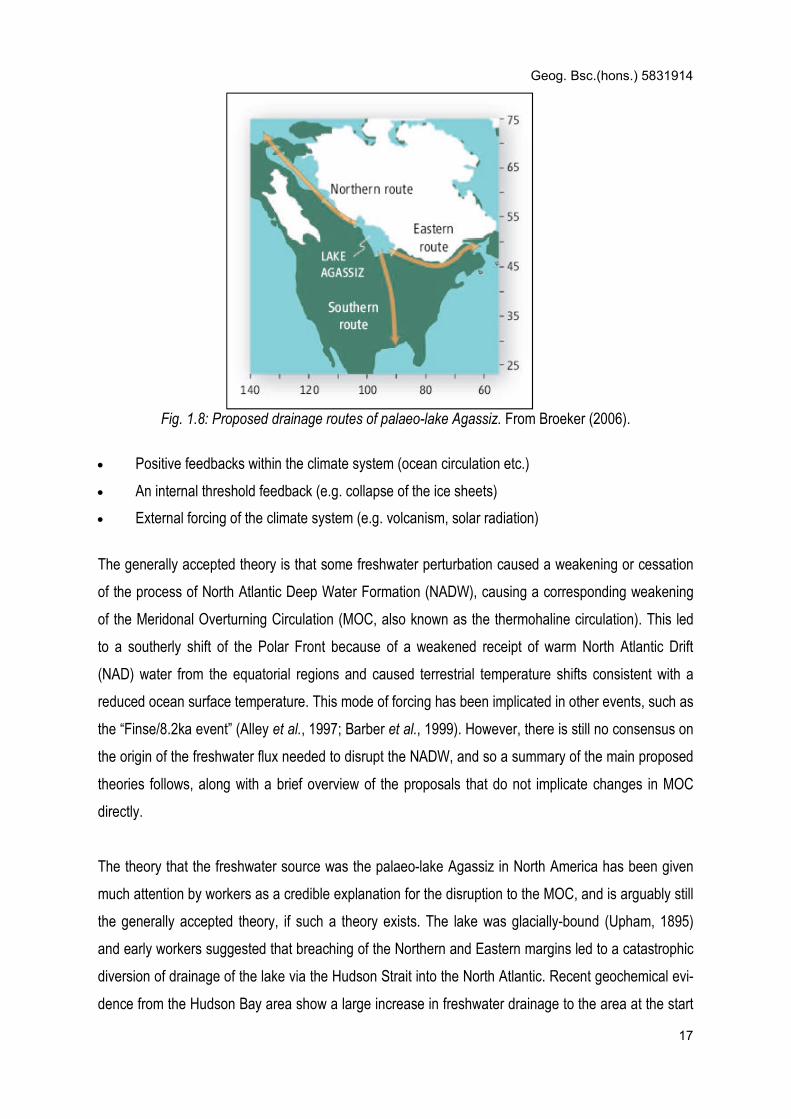
The theory that the freshwater source was the palaeo-lake Agassiz in North America has been given
much attention by workers as a credible explanation for the disruption to the MOC, and is arguably still
the generally accepted theory, if such a theory exists. The lake was glacially-bound (Upham, 1895)
and early workers suggested that breaching of the Northern and Eastern margins led to a catastrophic
diversion of drainage of the lake via the Hudson Strait into the North Atlantic. Recent geochemical evi-
dence from the Hudson Bay area show a large increase in freshwater drainage to the area at the start
Fig. 1.8: Proposed drainage routes of palaeo-lake Agassiz. From Broeker (2006).

Geog. Bsc.(hons.) 5831914
18
of the Younger Dryas that can be traced using geochemical “fingerprinting” to the proposed Eastern
(Hudson Bay) drainage route of Lake Agassiz (Carlson et al., 2007); this provides some of the strong-
est proof yet for the Agassiz/Eastern route hypothesis (see fig. 1.8).
However there is no geomorphological evidence for any catastrophic drainage from Lake Agassiz at
this time (Broecker, 2006), although this could be explained by theory that the drainage occurred within
the ice, leaving no traces following deglaciation. The lack of geomorphic evidence for such a large dis-
charge has given rise to alternative theories for the origin of the freshwater pulse. Some workers have
suggested alternative drainage routes to the North from palaeo-lake Agassiz into the Arctic (Broecker,
2006), or the source of freshwater was from another glacially bounded lake, for example in the Rus-
sian Highlands (Spielhagen et al., 2005). Another potential source of freshwater is from the mobilisa-
tion of a large sea of floating ice in the Arctic Ocean (Bradley & England, 2008). Although these propo-
sitions are plausible a lack of sedimentary evidence means that these theories remains poorly sup-
ported. The Northern drainage hypothesis requires further investigation – although there is baymetric
and geomorphological evidence of large scale drainage from Russian highlands (Spielhagen et al.,
2005) the nature of this drainage is not understood and the linkages to the North Atlantic remain un-
proven.
Renssen et al. (2000) have suggested that there was a period of reduced solar insolation at the start of
the Younger Dryas, and speculate that this caused cooling and subsequent destabilisation of the ice
sheets, leading to increased iceberg discharges and changes in the NADW formation, although it is
only through an amplifying mechanism like that of the proposed change in NADW formation that the
changes in solar insolation are great enough to explain the magnitude of cooling. Renssen et al.
(2000) also suggest that an increase in cloud cover cooled the earth through increased reflectance,
although a sceptic might argue that this does not account for the magnitude of cooling during the
Younger Dryas.
Recently Firestone et al. (2007) proposed that a previously unknown extraterrestrial impact across
North America caused the destabilisation of part of the Laurentide ice sheet which lead to the freshwa-
ter perturbation of the North Atlantic, although this has proved controversial and strong arguments
against the theory have subsequently been published (e.g. Buchanan et al., 2008).

Geog. Bsc.(hons.) 5831914
19
Although the case for disruption of the NADW/MOC during the Younger Dryas is theoretically sound
and well supported by climate modelling and by evidence from the North Atlantic region, the lack of
evidence for the origin and/or passage of the massive freshwater flux at best weakens the theory. The
stability of the system is crucial to our understanding of its operation, and some workers have sug-
gested it is an inherently unstable system (e.g. Broecker et al., 1985; Praetorius et al., 2008).

Geog. Bsc.(hons.) 5831914
20
Chapter 2: Climate Change Past & Present
2.1 The relevance of the last glacial
The driver of the glacial-interglacial cycles are well explained by orbital forcing, or “Milankovitch The-
ory” (Imbrie & Imbrie, 1979; Hays et al., 1976) but short, rapid climate change events ranging from
centuries to millennia cannot be explained by orbital forcing theory alone (Walker & Lowe, 2007). The
Late Glacial is the most geologically recent example of the unstable nature of global climate, and as
such these rapid and often short lived climate oscillations provides a unique insight into the stability of
the climate system. “The Lateglacial therefore constitutes a ‘virtual laboratory’ in which the complex
forcing mechanisms that drive climatic change can be investigated” (Walker et al., 2003, p475).
By studying climate change during the Late Glacial we can understand the complex interactions be-
tween different parts of the climate system, both in space and time. This is essential to our understand-
ing of future climate change; if the climate does not respond in a linear fashion to climate forcing we
need to understand the thresholds that can cause switches to different modes of operation, as the ef-
fects of a switch would be potentially catastrophic for society. Alternatively, if these sub-Milankovitch
climate variations are part of some as yet unexplained regular climate oscillation (e.g. Renssen et al.,
2000) this will have wide ranging implications for our understanding of the earth’s climate (Benn & Ev-
ans, 1998).
There is an increasing concern about rapid variations in future climate and the effect of anthropogenic
activity on the climate system (Houghton, 2004), although our predictions regarding the nature of fu-
ture change require considerable improvement (IPCC, 2007). Our understanding of Earth processes is
crucial in mitigating the effects of future climate change and much of our current knowledge of Earth
processes is derived from the study of past climates.
Many of the predictions made regarding anthropogenic perturbation of the climate system have been
derived through climate modelling, where our knowledge of all aspects of the climate system are
mathematically systemised and computer models are used to predict change on global and regional
scales for a number of different scenarios (Houghton, 2004; Giorgi & Mearns, 1991; e.g. Randall et al.,
2007). Palaeoecological studies not only enhance our understanding of climate processes, but provide
historical data needed to test models to assess the validity of their predictions; if a model cannot accu-
rately predict historical climate change its use in simulating future climates may be limited (Stute et al.,

Geog. Bsc.(hons.) 5831914
21
2001; Cronin, 1999).
The instrumental record is temporally and spatially poor, extending to ~150-200 years before present
and mainly limited to old cities in Europe and North America, with further problems in the accuracy and
homogeneity of the data (Parker et al., 2000). There is then a need to increase the geographical and
temporal breadth of the climatic record in order to improve the climate models (Cronin, 1999; Jansen
et al., 2007); this is particularly important in understanding rapid climate change, which modellers can
have difficulty resolving within GCM’s (Jansen et al., 2007). Improved reconstructed temperatures,
rainfall data etc. derived from palaeoclimatic research are therefore of use in improving climate change
predictions.
Palaeoclimatic data can also be used to understand mechanisms that explain predicted climate
change by identifying and detailing former climatic states that are not analogous to any observed phe-
nomena today. “The use of palaeoclimate data – model comparisons are becoming standard fare in
the investigations of climate change” (Cronin, 1999, p7), where they assist in explaining past rapid cli-
mate oscillations (Isarin & Renssen 1999).
However, palaeoecological records are limited in both geographical extent, the nature of the informa-
tion they give and the accuracy of that information. There is a need to improve records of past climate
change so that they might be used to inform our understanding of climate change and climate sys-
tems. The concern over the depth of our understanding is such that there has been a considerable
research investment in recent years, particularly to develop new palaeoecological proxy techniques
and absolute dating methods (see Oliver et al., 1999).
2.2 Problems with proxy records
The development of pollen environmental reconstructions underpinned much of the initial research into
the last glacial, and these methods are still essential to many modern reconstructions. However, there
are considerable problems given the relatively low local production of pollen at the time, leading to a
considerable confounding input of foreign material for many sites. The response of vegetation is also
known to lag considerably behind environmental change, show be sensitive to other factors, e.g. pre-
cipitation.

Geog. Bsc.(hons.) 5831914
22
The Coleoptera based models are useful but limited in their precision, using the mutual climatic range
method to predict only the possible range of temperatures and some modern analogues from a small
number of sites to predict the most likely value given the range. The very high resolution geochemical
records from the Greenland ice have demonstrated the degree of variability in climate through the late
glacial, but their use is limited by their remote geographical location, in many ways removed from the
climate systems that affect areas like the British Isles and Europe.
Given the development of Chironomid based transfer functions that are both complementary and in
some ways superior to the Coleoptera-based and other previously used methods there is a need to
expand the use of Chironomid based studies to improve the literature on seasonal temperature
through the late glacial interstadial.
This need is particularly important given the continued need for such records in climate modelling and
in precipitation reconstructions from glacial and periglacial evidence. Through enhanced understanding
of seasonal temperatures in the Late Glacial workers will be able to better understand precipitation
responses to climate change, vegetation response to seasonality and the way in which regional and
global climate functions through climate modelling.
2.3 Advantages/limits of Chironomid proxies
The non-biting midges (Chironomidae) are a family of insects of the order true flies (Insecta: Diptera);
they are found in a diverse range of environments and some species can tolerate very low tempera-
tures, extremes of acidity and are present in lakes of all trophic statuses (Cranston, 1995a; Armitage et
al., 1995); “there are species that thrive in almost every conceivable freshwater habitat” (Pinder, 1995
p107). They are frequently encountered in lentic, lotic and even some terrestrial environments and
their chitinous larval head capsules are well preserved in lake sediments (Porinchu & MacDonald,
2003), where they are often the most numerous biological remains (Walker, 1987). The morphology of
the larval head capsules is distinctive between species allowing the identification of fossil specimens to
an often high taxonomic resolution (Brooks et al., 2007).
Many of the thousands of species fill specific ecological niches and so Chironomid population assem-
blages are sensitive indicators of climate and ecology, leading to their use in limnology. The earliest
use was in lake classification (Porinchu & MacDonald, 2003), and early work based on Chironomid
communities have been referred to as the “beginning stages…of limnology as a modern sci-
Geog. Bsc.(hons.) 5831914
23
ence” (Saether, 1979 p65). Characteristic species were used as indicators of trophic status (e.g.
Wiederholm, 1979; Wiederholm & Eriksson, 1978) and in pollution monitoring (McGill et al., 1979;
Kansamen, 1985). These earlier studies were always qualitative and limited by the ecological informa-
tion and statistical techniques available for performing analysis.
More recent studies have seen a sharp increase in Chironomid based methods in palaeolimnology,
using computer based statistical techniques to infer absolute values for past lake conditions. These
include salinity (Mousavi, 2002), trophic status (Langdon et al., 2004), acidification (Brodin & Grans-
berg, 1993) and oxygen supply (Clerk et al., 2000). Currently, one of the most widespread uses of Chi-
ronomids in palaeolimnology is to reconstruct past temperatures, as Chironomids are particularly sen-
sitive to mean seasonal temperatures and mean annual temperature (Lotter et al., 1997; Boggero et
al., 2006). Walker et al. (1991) found that mean summer surface water temperature best explained
variation in Chironomid populations. The criticisms of Hann et al. (1992) who argued that the influence
of depth, transparency and substrate were more important in explaining variation have largely been
refuted by subsequent studies, the wealth of which have concluded mean summer temperature or
mean July temperature explains the variation of modern Chironomid populations well (e.g. Larocque et
al., 2001; Brooks et al., 2001; Luoto, 2008). Chironomid populations are far less affected by winter
temperature, although seasonality may well have an influence on the length of the breeding season for
those species that breed more than once a year (see Tokeshi, 1995).
The first temperature transfer function (Walker et al., 1991) was criticized for using single measure-
ments to represent mean summer temperatures (Hann et al., 1992), and more recent studies have
used local weather stations corrected for altitude to provide a more realistic estimate, along with a
broad range of measurements of other geochemical and environmental variables, although the accu-
racy of the original work remains good (Walker et al., 1992). All Chironomid transfer functions use
weighted average partial least squares regression (WA-PLS), a statistical technique that uses modern
populations to calculate the optimum value and tolerance range of particular taxa in relation to a spe-
cific environmental variable (e.g. summer temperature; see ter Braak & Juggins, 1993). The sensitivity
of the proxies response to environmental variables is usually tested using multivariate ordination tech-
niques, and the predictive power is calculated using “jackknifing” and “bootstrapping”. Similar methods
have proved extremely valuable in diatom based palaeolimnology for several years (see Battarbee,
1994). A three component WA-PLS model has been shown for Chironomid based reconstructions to
be the most accurate at inferring temperature compared to WA, PLS or the modern analogue tech-
Geog. Bsc.(hons.) 5831914
24
nique (Lotter et al., 1999). It also does not suffer from the limitations of other techniques like “key indi-
cator species” or “mutual climatic range (MCR)” used in Coleoptera and pollen reconstructions.
Although the statistical techniques used have been available for several years (ter Braak & Juggins,
1993), Chironomid based studies have been limited by the poor taxonomic resolution of the family for
sub-fossil larval specimens. Chironomid taxonomy has been far from harmonious between workers
(Murray, 1980; Porinchu & MacDonald, 2003), and until the publication of a more complete guide by
Brooks et al. (2007) sub-fossil Chironomid taxonomy for species encountered in the palaeoarctic was
limited mainly to the works of Wiederholm (1983) and Oliver & Roussel (1983); both are limited in the
number of species described and the taxonomic detail. The only other more recent guide available
prior to Brooks et al. (2007) focused primarily on North American species (Walker, 2007) and being
web-based was constantly updated, rendering it unsuitable for use in constructing training sets. The
only guides written specifically for the British Isles (e.g. Cranston, 1982) are based on diagnostic fea-
tures rarely present in sub-fossil specimens and do not include several species encountered in Late
Glacial samples that are no longer present in the British Isles.
Brooks et al. (2007) has been considered the first comprehensive taxonomic guide focussed on sub-
fossil specimens encountered in the palaeoartic (Brodersen, 2008) and is the compatible with the tax-
onomy used in the training set in this study (S. J. Brooks, pers. comm.). It is imperative that the same
taxonomy is used in both the modern training set and samples under investigation if the transfer func-
tion is to be applied correctly (Brodersen, 2008). The publication widens the possibilities for new work-
ers to use Chironomid based reconstructions in palaeolimnology and palaeoclimatology.
There are a rapidly growing number of Chironomid based temperature transfer functions that have
been developed for use in the European Palaearctic (e.g. Olander et al., 1999; Brooks & Birks, 2001;
Luoto, 2008). A wider temperature gradient, better taxonomic resolution and improved temperature
data make the Norwegian dataset (Brooks and Birks, 2001) perform better than the Fennoscandian
model (Olander et al., 1999). Although some studies (e.g. Luoto, 2008) present lower errors, the
Brooks & Birks (2001) model has the widest temperature range, is geographically relevant to the Brit-
ish Isles and has been proven to be effective in reconstructing temperatures in the British Isles in sedi-
ments dating to the late glacial (Brooks & Birks, 2001). A comparison of the models is given in table
5.4.

Geog. Bsc.(hons.) 5831914
25
Chironomid evidence of late glacial climate has been published from only two sites in the British Isles,
namely Whitrig Bog, SE Scotland (Brooks & Birks, 2000) and Hawes Water, NW England (Beford et
al., 2004). The Whitrig Bog study identified at least two climate oscillations during the late glacial inter-
stadial, and the Hawes Water study identified four from the same period. Both broadly agreed on the
temperature ranges through the Late Glacial, which were in keeping with previous research. Although
attempts have been made to correlate these sequences with the Greenland ice core stratigraphy, any
definite conclusions are hampered by need for more studies to elucidate the regional geography of
Late Glacial climate change.
Chironomid proxies can improve on summer temperature records inferred from other biological evi-
dence, and add a new dimension to records of mean annual temperature from geomorphological or
pollen evidence in the British Isles. The improved resolution of Chironomid proxies can assist in resolv-
ing the degree of variability of the late glacial interstadial in the British Isles, as well as providing local
reconstructions of temperature, which can inform research on glacial and periglacial landforms.

Geog. Bsc.(hons.) 5831914
26
Chapter 3: Aims of Research
Chapter 1 identified some of the gaps in our understanding of the late glacial, and discussed the need
for palaeoecologists to be able to better understand past environmental change. Chapter 2 outlined the
increasingly pressing questions of anthropogenic influences on future climate and has shown that al-
though Chironomid analysis has been shown to have the potential to contribute to resolving these
problems, “Widespread use of Chironomid analysis is relatively recent” (Porinchu & MacDonald, 2003
p379), so there is considerable research potential in the British Isles.
Some questions raised by the literature are:
• What is the nature of change during the Windermere Interstadial in the British Isles?
• What were the changes in temperature, seasonality and precipitation during the Loch Lomond
stadial in the British Isles?
• How can Chironomid proxies add to our understanding of palaeoecology?
There is considerable potential for clarifying the palaeoecological record in the British Isles using a
Chironomid based proxy, particularly in helping to resolve the particulars of climate during the Younger
Dryas, and to identify the timing and magnitude of change during the Windermere interstadial.
In addition, during the past five years there have been a number of studies using Chironomidae prox-
ies to reconstruct past air temperatures, and although some have compared them to other local proxy
records few explicitly evaluate their use. Further palaeoecological studies using modern techniques
are desirable simply because they allow comparison with the existing literature, testing the methods
and adding to the continual improvement of research methods.
This dissertation aims to:
• Inform the debate on the late glacial climate oscillations in the British Isles.
How?: By applying a modern quantitative Chironomid based temperature inference model to a Late
Glacial lake sediment stratigraphy.
• Evaluate the Chironomid based temperature reconstructions against other relevant studies that
have inferred temperatures for the same region.
How?: By comparing the reconstruction with the existing literature.
• Inform the debate on the level of precipitation during the Younger Dryas.
How?: By using Chironomid inferred temperatures as part of a glacier mass balance model.
It will conclude with a brief assessment of the methods used and the future use of Chironomid based
temperature reconstructions in the British Isles.

Geog. Bsc.(hons.) 5831914
27
Chapter 4: Site Description
4.1 Location, Vegetation & Topography
The chosen site for coring is a ~400 m2 area of mire called Ffridd-y-Fawnog, located approximately
8km west-north-west of Y Bala, Wales in Great Britain (figs. 4.1 & 4.2). It is level at +370m m.s.l and
currently covered by mire vegetation (as defined by Rodwell, 1991), with Sphagnum spp. and Eriopho-
rum spp. dominating the flora and correspondingly high water table (pers. obs.). The surroundings are
mountainous, with the Arenig range surrounding the site and the highlands of Snowdonia National
Park to the North. The site is common land used for low density sheep grazing.
4.2 Previous Onsite Research
The site is known to have formerly been a small lake basin (Hughes, 2000), draining a small catch-
ment of approximately 1.5 km2. The bedrock is made up of volcanic rocks and there is a drift of diamic-
ton of Devensian origin (BGS, 2008). There is a four part stratigraphic sequence of sedimentation of
the palaeo-lake, which has been shown to represent the Late Glacial climate oscillation at this site
(Hughes, 2000) and is analogous to other sites in the British Isles that are know to date to the Late
Glacial (e.g. Walker, 1980; Ince, 1983; Hill et al. 2008). The sequence is as follows:
Figure 4.3: Photograph of the 2002 core from Fridd-y-Fawnog. Annotations represent the findings of Hughes (2000). Courtesy of P. Hughes.
Younger Dryas grey clays
Windermere interstadial organic lake sediment
Late-Devensian clay/diamicton matrix
Holocene organic lake sediments
Holocene peats

Geog. Bsc.(hons.) 5831914
28
Arenig Fawr
F-y-F
Above: Figure 4.1. Topographical
map of Ffridd-y-Fawnog showing
the possible catchment. Contours
are drawn every 10m.
Right: Figure 4.2. Detailed map of
the core site, showing the locations
of coring.
Delineates watershed
F-y-F Location of study
Core site
Preliminary investigations
Bala
N
Geog. Bsc.(hons.) 5831914
29
The pollen record for the bottom Fridd-y-Fawnog sediment profile is presented by Hughes (2000), and
is a classic late glacial vegetation sequence synonymous with a large number of sites in the British
Isles that date to the late glacial (Walker et al., 2003; Isarin & Bohncke 1999; Walker, 1980; Ince,
1983); it is described fully in Chapter 7. The topmost peat sequence has been studied and found to
represent a sequence of lake sediment and peats transition from lake to terrestrial peat sediment that
date to the Holocene (L. Richardson, pers. comm.).
4.3 Previous Local Research
In areas where a high number of pollen studies have been conducted and dated using radiocarbon
dating it is sometimes possible to coarsely date sediment using the pollen profile alone (see Walker,
2005). The pollen zones in the British Isles are distinctive and well constrained by radiocarbon (14C)
dating of material in a number of local studies (e.g. Walker, 1980; Ince, 1983; Isarin & Bohncke 1999;
Walker et al, 2003), and although 14C dating would allow a more reliable framework for dating (see
Walker, 2005) is not available to this study. The pollen based chronology in Hughes (2002) can robus-
tly date the sediment to the level of accuracy needed for this project (Davis, 1984).
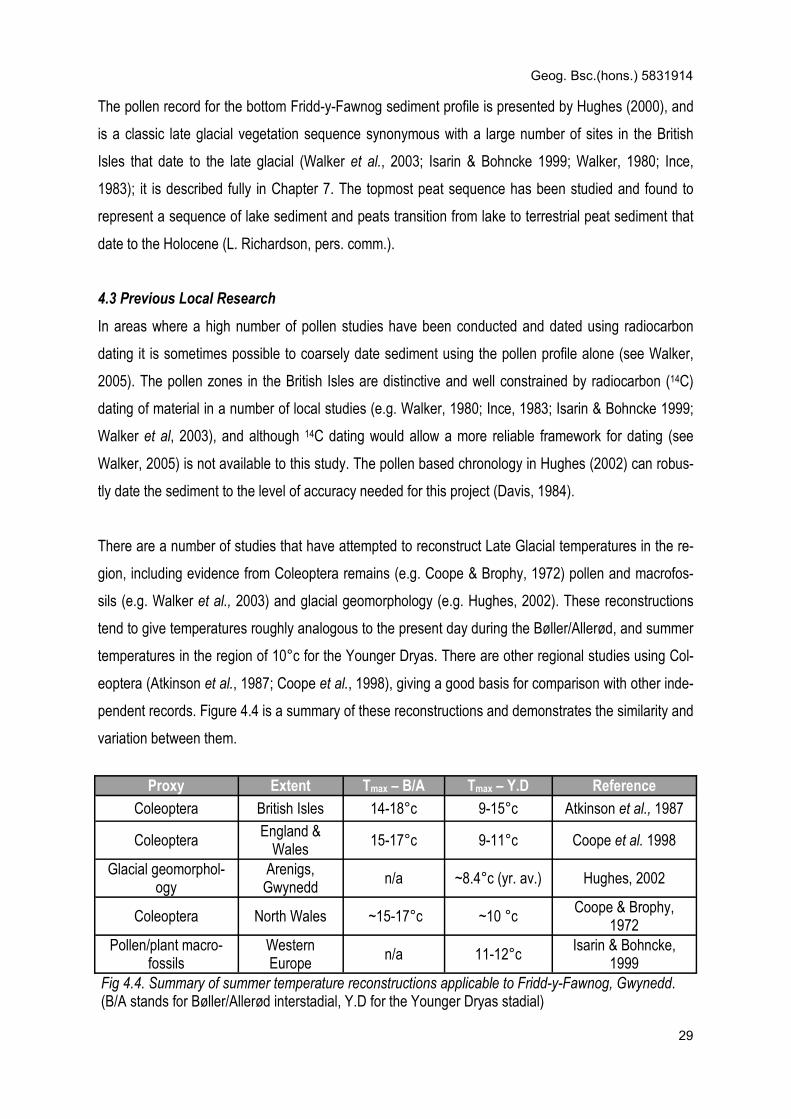
There are a number of studies that have attempted to reconstruct Late Glacial temperatures in the re-
gion, including evidence from Coleoptera remains (e.g. Coope & Brophy, 1972) pollen and macrofos-
sils (e.g. Walker et al., 2003) and glacial geomorphology (e.g. Hughes, 2002). These reconstructions
tend to give temperatures roughly analogous to the present day during the Bøller/Allerød, and summer
temperatures in the region of 10°c for the Younger Dryas. There are other regional studies using Col-
eoptera (Atkinson et al., 1987; Coope et al., 1998), giving a good basis for comparison with other inde-
pendent records. Figure 4.4 is a summary of these reconstructions and demonstrates the similarity and
variation between them.
Proxy Extent Tmax – B/A Tmax – Y.D Reference
Coleoptera British Isles 14-18°c 9-15°c Atkinson et al., 1987
Coleoptera England &
Wales 15-17°c 9-11°c Coope et al. 1998
Glacial geomorphol-ogy
Arenigs, Gwynedd
n/a ~8.4°c (yr. av.) Hughes, 2002
Coleoptera North Wales ~15-17°c ~10 °c Coope & Brophy,
1972 Pollen/plant macro-
fossils Western Europe
n/a 11-12°c Isarin & Bohncke,
1999 Fig 4.4. Summary of summer temperature reconstructions applicable to Fridd-y-Fawnog, Gwynedd. (B/A stands for Bøller/Allerød interstadial, Y.D for the Younger Dryas stadial)

Geog. Bsc.(hons.) 5831914
30
Chapter 5: Methods
5.1 Core extraction and sub-sampling
The coring site was chosen as the location most likely to be the deepest part of the palaeo-lake based
on the modern surface topography and test cores made at strategic locations thought to represent to
represent the palaeo-lake shoreline. Sampling should be from a deeper point of a lake as the Chi-
ronomid fauna varies by lake depth; the sediments from the deepest parts of a shallow lake provide a
good representative sample of the dominant fauna of the whole lake (Heiri, 2004). This is also likely
the area of highest sedimentation, so producing the most material per unit time for analysis (Glew et
al., 2001) and hence better resolution. A high voltage electricity pylon and its fittings were accommo-
dated and the site was well away from the pylon, power lines and the area between the pylon and the
road, where heavy machinery may have been operated to build both the road and the pylon and dis-
turbed the sediments.
A sequence of 500mm cores were extracted using a Russian-type corer for the soft lake and peat sedi-
ments, and a gauge auger was used to extract the more consolidated clays. The total depth was
710cm below surface level. Additional cores were taken at obvious stratigraphic boundaries to provide
extra material for analysis/preliminary tests if necessary.
The cores were extruded on site and transported horizontally in 4 inch gauge semicircular PVC pipe
covered by LDPE plastic wrap. The cores were sub-sampled at ~30mm intervals, the actual length
depending on the volume of material retrieved. All samples were stored in glass receptacles at +4ºc
and sealed in LDPE film.
5.2 Loss on Ignition Measurements
Loss on ignition measurements were performed at approx. 10cm intervals, depending on the availabil-
ity of material. The samples were dried at +105ºc for 16 hours and weighed to four decimal places,
then ignited for 2 hours at 550ºc and reweighed. The percentage loss between the two is expressed as
the loss-on-ignition; this is the standard method described by Bengtsson & Enell (1986). The loss-on-
ignition measurements help correlate the stratigraphy of the core with the pollen chronology of Hughes
(2002) as well as expressing any relative changes in the organic content of the samples.

Geog. Bsc.(hons.) 5831914
31
5.3 Chironomid sorting & slide mounting
The methodology for processing Chironomid remains generally follows a standard procedure of heat-
ing the sediment in Potassium Hydroxide (10% KOH) to disaggregate organic material bound by humic
acids, assisted by gentle agitation. The sediment is then separated by sieving to allow hand picking of
the Chironomid remains (as per Walker & Paterson, 1985), although some workers have used ultra-
sonic bath processing (e.g. Lang et al., 2003) and kerosene flotation (Rolland & Larocque, 2007).
The chosen method is often dependent on the type of sediment being prepared, so a preliminary test
was conducted on a redundant section of the retrieved clays. There was no significant difference in the
total number or relative abundance of Chironomid remains between ultrasonically processed sediment
or sediment prepared using the standard KOH method, contrary to the conclusions of Lang et al.
(2003), so a method minimising the possibly of damaging the capsules or introducing preferential pres-
ervation was used. The kerosene flotation method was not appropriate for the departmental lab envi-
ronment, and so was not evaluated.
The method described by Brooks et al. (2007) was followed, although the clay sediments were sub-
jected to a longer KOH bath as used by others (e.g. Olander et al., 1999). The exact method used is
described in fig. 5.1.
The two size fractions were sorted at x20+ magnification under a stereomicroscope with fine forceps
and needles, and the Chironomid head capsules from each sample were separated from other matter
and stored in a shallow petri dish in deionised water (as per Walker, 2001). The Chironomid head cap-
sules were then carefully air dried and mounted on glass slides in Euparal© mounting fluid with stan-
dard 22x22mm glass cover slips (as per Porinchu & MacDonald, 2003).
Instruction Notes/reason 1. Place subsample in 100m beaker Keep airtight in cold store
2. Decant 50ml 10% KOH into beakers To deflocculate the sediment
3. Place on hotplate at ~70°c 4. Occasionally gently agitate and remove after 20 minutes (30m for minerogenic sediments)
5. Sieve to 125 & 250 micron fractions To exclude fine fractions
6. Decant fractions to petri dish in solution of deionised H2O To allow analysis under sterio-
scope 7. Save contents of wash bucket & condense w/ centrifuge For possible pollen analysis
Fig. 5.1. Procedure used to prepare samples for chironomid analysis

Geog. Bsc.(hons.) 5831914
32
5.4 Chironomid taxonomy
As previously discussed, Chironomid taxonomy is far from harmonious between workers. The taxo-
nomic guide employed (Brooks et al., 2007) is compatible with the taxonomy employed by Brooks &
Birks (2001; S.J. Brooks, pers. comm.), the transfer function used in this study. This guide is consid-
ered to be the most comprehensive and simplest to use, and in any case it is imperative that the same
taxonomy is used in both the modern training set and samples under investigation if the transfer func-
tion is to be applied correctly. Examples of some of the specimens encountered are given in figure 5.2.
Prepared Chironomid slides were viewed under x40-100 magnification under a transmitted light micro-
scope. Interference optics were occasionally used to elucidate detail in the specimens. Each specimen
was identified to the best possible level of taxonomic resolution with notes taken on the size and condi-
tion of each capsule encountered (see appendix a). Micrographs were employed to compare speci-
mens where appropriate.
Identification is based mainly on the morphology of the mentum, ventromental plates and the number
and condition of teeth on the manibles (see figure 5.3). A number of Tanypodinae can also be differen-
tiated on the basis of the arrangement of the cephalic setae (Rieradevall & Brooks, 2001). Species
were identified to the highest possible taxonomic resolution, and where there was uncertainty the lower
resolution was always recorded.
Figure 5.3. A micrograph of a Pseudochironomus sub-fossil larval head cap-sule, with the parts of the anatomy important to identification labelled.
Pedestal
Ventromental plate
Mandible
Mentum
Setae

Geog. Bsc.(hons.) 5831914
33
Figure 5.2a-f: Examples of the chironomid taxonomy used in this study
Transmitted light micrographs of a) Tanypodinae, b) Einfeldia pagana, c) Glyptoten-
dipes pallens, d) Microtendipes pedellus, e) Thienemannimyia-type, f) Psuedochi-
ronomus
b a
d
e f
c

Geog. Bsc.(hons.) 5831914
34
5.5 Temperature transfer function
The transfer function used is a three component, weighted average, partial least squares (WA-PLS)
regression model constructed from data collected from 109 Norwegian lakes covering a July tempera-
ture range (Tj) of 3.5-15.6°c (Brooks & Birks, 2001); further details are given in figure 5.4, along with
the details of other transfer functions. It can be seen from these figures this model is best suited to the
study. Dr. Steve Brooks of The Natural History Museum, London kindly agreed to run the temperature
transfer functions from unpublished data described in Brooks & Birks (2001). This model has been pre-
viously used in the British Isles (Brooks & Birks, 2000; Bedford et al., 2004) and Norway (Brooks &
Birks, 2001).
It is generally accepted that a minimum of around 45 head capsule counts per sample is generally re-
quired, because there is evidence that suggests under this number there is considerable error in the
ability to gain a realistic sample of the population (Heiri & Lotter 2001). Samples can be bulked to-
gether if they fall under this, but this obviously leads to a decrease in temporal resolution.
Brooks & Birks, 2001
Walker, 1997 Olander et al., 1999
Larocque et al., 2001
Luoto, 2008
Area Norway Canada Finland N. Swedish
Lapland Finland
No. of lakes 109 39 53 100 77
No. of taxa 119 34 38 85 110
Range 0.3-23.0 6-27 6.1-15.4 7-14.7 17-11.3
RMSEP 2.13 2.26 1.53 1.13 0.721
Max. bias 2.84 2.4 3.88 2.1 0.794
WA-PLS components
3 2 1 2 1
Figure 5.4. Table showing statistics relating to chironomid based summer temperature transfer
functions.The transfer function used in this study is marked in bold.

Geog. Bsc.(hons.) 5831914
35
Chapter 6: Data Presentation & Description
6.1 Visual stratigraphy and loss on ignition results
Figure 6.1 shows the loss on ignition results and visual stratigraphy, showing the same tripartite se-
quence that characterised earlier work on the site (Hughes, 2000). The top of the core is made up of
terrestrial peats, including several fragments of woody debris. The LOI results have a wide range from
just 3% to over 87%, and there are rapid changes between some samples, the greatest change being
52% over 188mm. The size of the variation is too large to be attributed to the confounding effects of
different sediment types (Santisteban et al., 2004), although these effects may preclude the use of this
dataset to quantitatively calculate organic content. The results still provide a robust qualitative meas-
ure. The major stratigraphic boundaries correlate well with the main Chironomid faunal zones.
530
540
550
560
570
580
590
600
610
620
630
640
650
660
670
680
690
700
Depth (cm)
FyF-ch1
FyF-ch2a
FyF-ch2b
FyF-ch2c
FyF-ch2d
FyF-ch3
FyF-ch4
0 50 100
%
Organic Content
Organic lake sediment
Grey, plastic clay
Brown organics w/ clay
Dark organic sediment
Grey clay with clasts
Figure 6.1. The loss on ignition re-sults. The chironomid faunal zones are marked along with the visual stratigraphy. Note the thee part se-quence.

Geog. Bsc.(hons.) 5831914
36
6.2 Chironomid counts & stratigraphy
The bottom section of core which was examined yielded a total of 698 individual head capsules, 590
(85%) of which could be identified to at least tribe level. The number of capsules varied greatly be-
tween samples, with a standard deviation of 17.26. The highest head counts (n=64.5) were encoun-
tered in the in organic material, and the lowest densities (n=0) in the minerogenic sediments, although
the necessary use of a gauge auger to retrieve the clays limited the total volume of sediment, and
hence the number of remains retrieved from the lower parts of the sequence.
There were 51 different taxonomic groups, most of which were species level groupings (although some
were at genus/tribe level, a full list is given in appendix c). However, 32 of these taxa had less than 5%
abundance and less than 5 occurrences. Although these taxa provide important information about spe-
cies richness and diversity, individually they are of limited use in the reconstructions, so where possi-
ble they have been bulked into larger taxonomic groups, otherwise they have been grouped together.
There are no strict rules regarding cut off values for reconstructions, so all taxa were included in the
transfer function, but in stratigraphic diagrams rare taxa, as defined above were bulked together.
6.2.1 Zone Descriptions
The grouping was based initially on a number of different constrained cluster analyses (shown in fig.
6.2), adjusted slightly after manual analysis. The zones are prefixed FyF-ch so they are differentiated
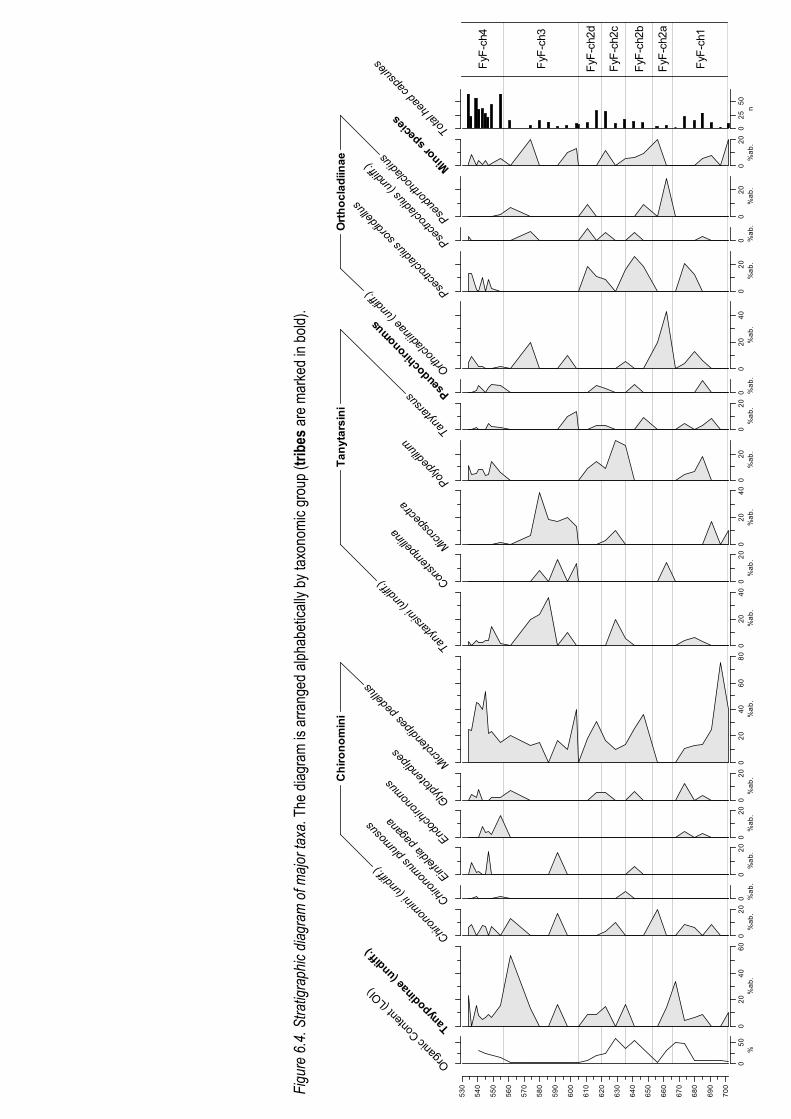
from the pollen stratigraphic zones for the site in Hughes (2000). A stratigraphic diagram of all major
taxa is shown in figure 6.4 to which the following zone descriptions refer to.
The diversity is shown in figure 6.3. The diagram shows a gradual increase in diversity, punctuated by
small extinction events, although the fauna remains relatively diverse throughout the section. The spe-
cies diversity is discussed more fully in chapter 7.
Zone FyF-ch1 (700-666cm)
This zone could be divided into two sections on the basis of a distinct faunal change at 687cm, but
because of very low count sums for the oldest section there can be no guarantee that this is not a
purely statistical artefact.
For the first section of the zone there are very low count sums which add caution to any descriptions of
the fauna derived from these samples. However, the lake appears to be species poor, the fauna being

Geog. Bsc.(hons.) 5831914
37
05
10
15
20
25
30
530
555
580
605
630
655
680
705
De
pth
(cm
)
Taxa (n)
Diversity
Extic
tion
Orgination
Above: F
igure 6.3. Species diversity plotted against depth.
Right: F
igure 6.2. Constrained
cluster analysis of chironomid stratigraph
y.
The
mod
el u
sed
is a
pai
red
grou
p al
gorit
hm u
sing
the
“Hor
n” m
easu
re o
f si
mila
rity.
The
ana
lysi
s w
as p
erfo
rmed
usi
ng “P
AST”
(Rya
n et al.
1995
)
Geog. Bsc.(hons.) 5831914
38
Figure 6.4. Stratigraph
ic diagram
of m
ajor taxa. T
he d
iagr
am is
arra
nged
alp
habe
tical
ly b
y ta
xono
mic
gro
up (tribes a
re m
arke
d in
bol
d).
530
540
550
560
570
580
590
600
610
620
630
640
650
660
670
680
690
700
FyF
-ch1
FyF
-ch2a
FyF
-ch2b
FyF
-ch2c
FyF
-ch2d
FyF
-ch3
FyF
-ch4
050
%
Org
anic
Con
tent
(LO
I)
020
40
60
%ab.
Tanyp
odinae
(undi
ff.)
020
%ab.
Chi
rono
min
i (un
diff.
)
0 %ab.
Chi
rono
mus
plu
mos
us
020
%ab.
Ein
feld
ia p
agan
a
020
%ab.
End
ochi
rono
mus
020
%ab.
Gly
ptot
endi
pes
020
40
60
80
%ab.
Mic
rote
ndip
es p
edel
lus
020
40
%ab.
Tany
tars
ini (
undi
ff.) 0
20
%ab.
Con
stem
pellin
a
020
40
%ab.
Mic
rosp
ectra
020
%ab.
Pol
yped
ilum
020
%ab.
Tany
tars
us
0 %ab.
Pse
udochir
onomus
020
40
%ab.
Orth
ocla
diin
ae (u
ndiff
.) 020
%ab.
Pse
ctro
clad
ius
sord
idel
lus
0 %ab.
Pse
ctro
clad
ius
(und
iff.)
020
%ab.
Pse
udor
thoc
ladi
us
020
%ab.
Min
or s
pecie
s
025
50
n
Tota
l hea
d ca
psul
es
Ch
iro
no
min
iT
an
yta
rsin
iO
rth
oc
lad
iin
ae

Geog. Bsc.(hons.) 5831914
39
dominated by Microtendipes pedellus and Microspectra and a number of poorly preserved remains.
At 687cm there is a distinct change in the fauna; Microtendipes pedellus makes a significant but drasti-
cally reduced contribution, with the first appearances of a large number of predominantly thermophilic
taxa contributing to the large increase in species diversity and total head capsules. There are signifi-
cant populations of Psectrocladius sordidellus and Polypedilum, whilst the presence of Glyptotendipes
and Polypedilum are also recorded. The state of preservation remains poor with many remains only
identifiable to a coarse taxonomic resolution.
Zone FyF-ch2 (666-605cm)
This zone is characterised by unstable populations and a changing fauna, the initial appearance of
several species and a gradual increase in the total volume of head capsules. Defining the dominant
faunal zones is difficult given the unstable populations, as revealed by the variations revealed by the
constrained cluster analysis, and the following subzones represent the most significant changes.
FyF-ch2a (653-666cm)
The start of this zone is marked by a decline in total head capsules. The fauna is dominated by
poorly preserved undifferentiated Orthocladiinae and Tanypodinae, and a smaller but significant
contribution from undifferentiated Chironomidae. Of the species that could be identified Pseudortho-
cladius, Constempellina and Cricotopus intersectus were common.
FyF-ch2b (635-653cm)
There is a gradual increase in the total number of head capsules throughout this zone. This section
contains a rise and fall of the Microtendipes pedellus population, with an optima of 35% at 645cm,
followed closely by Psectrocladius sordidellus, with an optima of 30% at 637cm and a number of
minor taxa following a similar pattern. The latter part of the zone shows a small rise in Einfeldia pa-
gana and Polypedilum sordens.
FyF-ch2c (620-635cm)
There is a general trend of increasing numbers of head capsules punctuated by a short decline at
626cm. There is a marked decline and following rise in populations of Psectrocladius sordidellus
and Microtendipes pedellus, and an inverse proliferation and subsequent waning of Polypedilum
and later and to a lesser extent Tanytarsini and Microspectra. Some taxa are only present at the
Geog. Bsc.(hons.) 5831914
40
beginning and end of the zone including Pseudochironomus and Glyptotendipes. There is the first
occurrence of Chironomus plumosus in this zone.
FyF-ch2d (605-620cm)
There is a pronounced increase and stabilisation of head capsule numbers, followed by a decline.
This stage is marked by the complete disappearance of the Tanytarsini and of Microspectra. There
are significant contributions from Microtendipes pedellus, Psectrocladius sordidellus and Polypedi-
lum although the large numbers of species present demonstrate a diverse population. This diverse
population declines rapidly towards the end of the zone although the exact speed is not known be-
cause it is seemingly completed within a few centimetres.
Zone FyF-ch3 (605-557cm)
Head densities declined considerably in this zone to ~5 per sample. The zone is marked by the ap-
pearance of Microspectra and Constempellina. The Tanytarsini increase considerably. These taxa de-
cline significantly at the onset of FyF-ch4. Many of the taxa seen in previous zones disappear at the
start of the zone, and some others, for example the species Microtendipes pedellus persists through-
out most of the zone at drastically reduced levels, although even this population disappears at two
points (585cm & 564cm). At the same time as these collapses there are peaks in the number of undif-
ferentiated Chiromini; the first of these could be tentatively correlated to a peak in Microspectra, and
the second correlates well to a peak in Microspectra and weakly to the appearance of some other oc-
currences of associated taxa.
Zone FyF-ch4 (557-520cm)
The onset of FyF-ch4 is marked by a rapid and large change in the total number of head capsules,
along with the return of a number of thermophilic taxa seen in FyF-ch2 and the disappearance of the
cold water taxa that characterised FyF-ch3. The beginning of the zone is characterised by the prolif-
eration of Endochironomus albipennis and Pseudochironomus. The upper section shows two obvious
short lived changes in the assemblages at 545cm & 535cm; the dominant Endochironomus, Pseudo-
chironomus & Polypedilum fauna declines and Einfeldia pagana increases briefly. The first oscillation
at 545cm is the most obvious but both are clearly defined.

Geog. Bsc.(hons.) 5831914
41
6.3: Temperature transfer function
The transfer function for 11 bulked samples was performed by S. J. Brooks using WAPLS v.1.5
(Juggins & ter Braak, 2002), as described in chapter 5; the results are shown in figure 6.5. The mean
sample error was 1.25ºc (RANGE=0.37 ºc). The need to bulk the samples has led to a reduced resolu-
tion (the minimum sample size is 45 full head capsules), but the sample specific errors are low. The
resolution is good in the early part of the Holocene and lowest during the period of inorganic sedimen-
tation throughout zone FyF-ch3. The results will be fully discussed in chapter 7.
Figure 6.5. Reconstructed mean July temperatures for Fridd-y-Fawnog. Error bars represent sample specific errors as calculated using “WA-PLS” (Juggins & ter Braak, 2002). The grey line represents the modern July average at the site (Met Office, 2008a).
8 10 12 14 16 18 20
520
560
600
640
680
720
Average July Temperature (deg. C)
Depth (cm)
Geog. Bsc.(hons.) 5831914
42
Chapter 7: Data Analysis & Discussion
7.1 Environmental interpretation of stratigraphy & LOI results
The visual stratigraphy and loss on ignition showed the same tripartite sequence frequently encoun-
tered in Late Glacial lake sediments, and that characterised earlier work on the site (Hughes, 2000;
shown in figure 7.1). These studies have shown the bottom-most clay/diamicton matrix date to the ter-
mination of the Devensian ice sheet - the organic layer deposited on top of these clays date to the
Windermere Interstadial. The grey clays found on top of these date the Loch Lomond re-advance, and
the highly organic period the follows these represents the Holocene. The top of the core is made up of
Holocene age terrestrial peats, including several fragments of woody debris, where the basin has filled
and the terrestrial mire has accumulated.
The core extracted for use in this study can be correlated with the core extracted from the same site by
Hughes (2000) on the basis of visual stratigraphy and LOI measurements. The section is longer than
that extracted by Hughes (2000), suggesting that it represents a zone of higher sedimentation; this
seems likely given the likelihood that the location was further towards the centre of the palaeo-lake
than the core presented by Hughes (P. Hughes, pers. comm.). This is backed up by the extraction of a
superficially identical but compacted sequence from the edge of the bog (site marked in figure 4.2).
The only inconsistency is the presence of a period of inorganic deposition from 653-656cm. This is
based on only one measurement, but as adjoining measurements suggest a downward trend and as
there is no reason to doubt the measurement it has been included, but should be approached with
caution as there are many explanations for an anomalously low result. Alternatively the measurement
could represent an episode of inorganic deposition that was not recorded in the shorter cores because
of their lower resolution; further investigation of the composition of the sediments using a wider variety
of techniques and better resolution would resolve the uncertainty over this particular result, and a thor-
ough investigation into the basin morphology would help in interpreting differences in sedimentation.
From the LOI/visual stratigraphy and Hughes (2000) sections of the core can be dated with reasonable
confidence to the key climatic episodes during the Late Glacial; this is shown in figure 7.1. It is on this
basis that the sediment has been dated.

Geog. Bsc.(hons.) 5831914
43
Figu
re 7
.1. C
ompa
rison
of t
he L
OI s
tratig
raph
y (ri
ght)
with
Hug
hes
(200
0; le
ft). T
he b
lue
lines
repr
esen
t the
poi
nts
whe
re c
hang
es c
an b
e co
r-re
late
d.

Geog. Bsc.(hons.) 5831914
44
7.2 Environmental interpretation of Chironomid stratigraphy
If the changes in the Chironomid fauna are to be interpreted as changes in the climate there should be
reasonable confidence that the changes do not represent other variables, like a change in trophic
status. Principle component analysis (PCA) is a technique whereby variations within a population is
explained by a number of hypothetical variables (Harper, 1999). PCA of the core concluded that 64%
of the variance in the Chironomid stratigraphy is explained by the first hypothetical variable; the second
hypothetical variable explained 10% (see appendix d). This suggests that the populations observed
are responding predominantly to a single factor: figure 7.2 shows the first and second axis eigenvec-
tors for individual taxa, demonstrating the relationship of many taxa with this first hypothetical variable
(component 1). If the variance was well explained by several factors it would confound the ability to
make inferences from the data regarding just one environmental variable. Although there is no way of
knowing for certain what the hypothetical variable this dataset is responding to, as discussed in chap-
ter 2, studies of modern analogues have shown populations to be strongly responsive to temperature
(e.g. Larocque et al., 2001 & 2009), and so it is suggested that component 1 represents temperature.
C
D
EF
GIK
L
M
N
O
P
QR
STU
V
W
X
YZ AA
ABACADAEAF
AGAHAI
AJ
AKAL
AMANAOAPAQARASAT
AU
AVAWAXAY
A02
A04
A06
A20A22
A24
A30
A32
A50
A54
A55
A56
A57
A58
A61
-0.6 -0.3 0.3 0.6 0.9 1.2 1.5 1.8
Component 1
-0.6
-0.3
0.3
0.6
0.9
1.2
1.5
1.8
Component 2
Fig 7.2. Principle component analysis of the chironomid count sums. Components 1 and 2 account for 64.2% and 10.6% of the total variance respectively. Black dots represent samples, green lines taxa. See appen-dix d for further details.

Geog. Bsc.(hons.) 5831914
45
Given that the changes in the fauna are likely to be largely the result of temperature, a diagram show-
ing the key temperature indicator species is given in figure 7.4. Qualitative ecological data for the taxa
were collected from a number of sources (see figure 7.5 for a full list), and no major differences were
found between interpretations of individual taxa response to temperature in the literature, although for
ecological information for some species was unobtainable or poor. The pollen stratigraphy by Hughes
(figure 7.3) has been used to contextualise the results following correlation using loss on ignition re-
sults.
7.2.1 The post-Devensian
The pollen stratigraphy for this zone is dominated by Poaceae and Cyperaceae with low Betula and
Pinus counts, suggesting an open-steppe habitat and some pioneering tree populations. Exact correla-
tion with this study should be tentative because of differences in the sedimentation rate at the two core
sites, but given its stratigraphic position, the presence of diamicton clays and the pollen evidence FyF-
ch1 is likely to represent the post-Devensian transition.
Fig 7.3. Pollen stratigraphy for Fridd-y-Fawnog. From Hughes (2000)

Geog. Bsc.(hons.) 5831914
46
Fig 7.4. C
hironomid stratigraph
y from
Fridd-y-Faw
nog show
ing indicator species for tempe
rature
.
530
540
550
560
570
580
590
600
610
620
630
640
650
660
670
680
690
700
Depth (cm)
FyF
-ch1
FyF
-ch2a
FyF
-ch2b
FyF
-ch2c
FyF
-ch2d
FyF
-ch3
FyF
-ch4
050
100
%
Loss
on
igni
tion
040
% ab.
Col
d wat
er ta
xa (s
um)
020
40
% ab.
Tany
tars
ini (
undi
ff.) 0
20
40
% ab.
Mic
rosp
ectra
020
% ab.
Tany
tars
us
020
% ab.
Ein
feld
ia p
agan
a
050
% ab.
Inte
rmed
iate
taxa
(sum
)
020
% ab.
Pse
ctro
clad
ius
sord
idel
lus
020
40
60
80
% ab.
Mic
rote
ndip
es p
edel
lus
025
50
% ab.
Therm
ophili
c ta
xa (s
um)
020
% ab.
End
ochi
rono
mus
0 % ab.
Pse
udoc
hiro
nom
us
0 % ab.
Pse
ctro
clad
ius
(und
iff.)
0 % ab.
Chi
rono
mus
plu
mos
us
020
% ab.
Pol
yped
ilum
020
% ab.
Gly
ptot
endi
pes
050
100
% ab.
Oth
er ta
xa (s
um)
020
40
60
80
n
Tota
l hea
d ca
psul
es (u
ndiff
. ins
et)
Cold water taxa
Interm
ediate taxa
Therm
ophilic taxa

Geog. Bsc.(hons.) 5831914
47
Figure 7.5. Table showing the temperature preferences of the taxa in this study. (a) Brooks et al., 2007. (b) Bedford et al., 2004. (c) Larocque et al., 2001. (d) Cranston, 1995.
Taxa Indicator Ablabesmyia Thermophilica/eurytopicb
Chironomus anthracinus-type thermophilicabc Chironomus plumosus-type thermophilicabc
Constempellina ? Corynoneura artica-type cold stenothermab
Cricotopus (isocladius) intersectus-type intermediate stenothermab Cricotopus bicinctus-type intermediate stenothermab Dicrotendipes undiff. thermophilicab
Dicrotendipes nervosus-type thermophilicabc Einfeldia pagana-type cold stenotherma
Endochironomus albipennis-type thermophilicb Endochironomus impar-type thermophilicb Eukiefferiella fittkaui-type eurythermica Glptotendipes pallens-type thermophilicab
Glyptotendipes barbipes-type thermophilicab Glyptotendipes severini-type thermophilicab
Heterotrissocladius maeaeri-type cold stenothermabc Microspectraundiff. ?
Microspecta insignilobus-type cold stenothermac Microspectra pallidula-type thermophilica Microspectra radialis-type cold stenothermacd Microtendipes pedellus-type intermediate stenothermabd
Omisus thermophilica Paracricotopus ? Paramerina eurythermic/thermophilica
Paratanytarsus cold stenothermc Paratendipes nudisquama-type ? Polypedilum nubeculosum-type thermophilicab
Polypedilum sordens-type thermophilicab Procladius intermediate/eurytopicab
Propsilocerus thermophilica Psectrocladius undiff. thermophilica
Psectrocladius barbatipes-type thermophilicabcd Psectrocladius calcaratus-type intermediateab/thermophiliccd Psectrocladius sordidellus-type intermediateab/thermophiliccd
Pseudochironomus thermophilica Pseudodiamesa cold stenothermabc Pseudorthocladius ? Pseudosmittia thermophilicb Sergentia cold stenothermbd
Tanytarsus undiff. warma/cold stenothermc Tanytarsus lactescens-type temperatea/cold stenothermc Tanytarsus lugens-type cold stenothermacd
Tanytarsus pallidicornis-type warma/cold stenothermc Thienemannimyia-type warmb/cold stenotherma Chironomidae undiff. Generally thermophilice Chironomini undiff. warm stenotherma Diamesinae undiff. cold stenotherme
Oorthocladiinae undiff. cold stenotherme Tanypodinae undiff. ? Tanytarsini undiff. ?
Geog. Bsc.(hons.) 5831914
48
The first half of the Chironomid zone initially has very low count sums, so any inferences made from
these assemblages should be approached with caution with regard to their validity. Initially the interme-
diate taxa dominate the fauna, although they subsequently decline as there is an increase in the cold
water taxa Microspectra and Tanytarsus centred around 688cm. This could represent a short cold os-
cillation during the post-Devensian warming, but given the low count sums this should be approached
with caution, as most studies indicate rapid and constant warming immediately following deglaciation.
This possible short cooling is followed by a sharp increase in the thermophilic and intermediate taxa
together with a rise in the total number of head capsules. This probably represents the transition to the
full interstadial conditions of the Windermere Interstadial given the rise in productivity and temperature.
The temperature transfer function gives an average temperature of around 12.9ºc for this period, which
is consistent with the rapid warming at the termination of the Devensian ice sheet, but the need to bulk
samples is likely to have obscured some of the changes within this zone. However, there is an early
peak in temperatures and subsequent decline, followed by a small amelioration. This suggests an
early peak in temperatures and gradual cooling, punctuated by a cold event.
7.2.2 Windermere Interstadial
Through the zone of organic deposition in FyF-ch2 the macrofossils of fruits of Najas and other organic
matter are found (pers. obs.), although the significant inorganic element in the LOI results suggests
unstable tills and/or stream incision into Devensian tills within the catchment. The pollen zones FF-2/3
can be correlated to this zone, which show the rise of Betula, Salix & Juniperus and reductions in
Poaceae & Cyperaceae, suggesting the development of an open woodland environment. It is on this
basis this section has been identified as representing the entire Windermere Interstadial.
The zone starts with a possible cold fauna in FyF-ch2a, although this is difficult to assert fully. This is
followed by intermediate, slowly rising temperatures in FyF-ch2b. These intermediate temperatures are
continued in FyF-ch2c, followed by a brief warming and subsequent return to intermediate tempera-
tures in FyF-ch2d, although there may have been a possible short cold period following the climatic
optima in FyF-ch2c. The increased organic deposition probably reflects a combination of increased
productivity, local soil development and slope stabilisation. There is considerable variation within the
zone, and as such the sub-divisions are treated separately below.

Geog. Bsc.(hons.) 5831914
49
FyF-ch2a
This zone has very low Chironomid counts and is dominated by the Orthocladiinae, and Tanypodi-
nae. The dominant Orthocladiinae are known the feed on diatoms (Pinder, 1995), and could be con-
sidered to be cold stenotherms (Brooks et al., 2007, Pinder, 1995). Some Psuedorthocladius spp. &
other Orthocladiinae spp. inhabit terrestrial habitats (Pinder, 1995) opening the possibility they may
be allocondronous, although this is impossible to prove without analysing further samples. The only
known European species of Constempellina, C. Brevicosta (Brooks et al., 2007) has flourished in
cold climates (Grimås & Wiederholm, 1979). Accompanied by the reduction in organic deposition,
suggesting periglacial weathering of tills during this zone it may represent a return to cold condi-
tions. The Orthocladiinae are, however, a diverse and poorly understood genus (Cranston, 1995b)
and so a cautious inference that the zone represents a pioneering, cold stenothermic fauna is ham-
pered by the lack of information on the genus.
FyF-ch2b
There is a gradual rise of Chironomid abundance throughout this zone, indicating increased lake
productivity. The zone is dominated by the intermediate taxa, whilst cold water taxa are present in
the first half of the zone their populations reduce as the thermophilic taxa appear at low levels to-
wards the end of the zone. This suggests intermediate, slowly rising temperatures throughout the
zone.
FyF-ch2c
This zone encompasses the collapse of the dominant intermediate fauna and increases in the ther-
mophilic taxa Polypedilum, suggesting a rise to warmer temperatures. However, there is also a
smaller rise in Tanytarsini and Microspectra which are cold water taxa. The undifferentiated Tany-
tarsini and Microspectra might represent specific species within those sub-genii that are warm
stenotherms (e.g. Tanytarsus lactescens or Microspectra pallidula), and the higher numbers of head
capsules supports the case for a warmer, more productive lake through this period. It may also indi-
cate a specific seasonal regime where such a diverse fauna could exist, but the exact emergence
patterns of particular species are poorly understood.
Alternatively there could be a short lived cold period within this zone that is disguised by the resolu-
tion of the sampling or record. This zone would benefit from higher resolution sampling to establish
the exact succession of the fauna, but there is certainly the possibility of a short lived cold stage dur-

Geog. Bsc.(hons.) 5831914
50
ing this period. The termination of the zone is marked by a return of the intermediate species at the
expense of the thermophilic species, suggesting cooling. This warm interlude centred on 625cm
could be interpreted as the climatic optimum of the Windermere Interstadial, although the timing
seems a little late compared to other records.
FyF-ch2d
This zone is dominated by intermediate and thermophilic taxa, suggesting warm conditions. The
head capsule counts are significantly higher during this zone, suggesting it may represent the period
of highest productivity during the Interstadial. The populations are also predominantly meso-
eutrophic indicators (see figure 7.6) which reflect the richer vegetation both in and around the lake.
The July temperature from the transfer function suggest summer temperatures very similar, or
slightly higher than the present day, for which the July average is 15.4ºc (Met Office, 2008a); as-
suming an environmental lapse rate of 0.6°c/100m, this equates to 13.1ºc at the site altitude.
530
540
550
560
570
580
590
600
610
620
630
640
650
660
670
680
690
700
Depth (cm)
0 20 40 60 80 100
%
LOI
0 20 40
% ab.
Microspectra
0
% ab.
Pseudochironomus
0 20
% ab.
Glyptotendipes
0 20
% ab.
Polypedilum sordens
0 20
% ab.
Endochironomus
0 20
% ab.
Einfeldia pagana
0 20
% ab.
Polypedilum nubeculosum
0 20
% ab.
Tanytarsus
Ultra/oligotrophic Meso/eutrophic
Figure 7.6. Chironomid stratigraphy from Fridd-y-Fawnog showing indicator species for trophic status

Geog. Bsc.(hons.) 5831914
51
7.2.3 The Loch Lomond Re-advance
Hughes (2002) used the pollen sequence to attribute the grey clays at the site to the Loch Lomond Re-
advance; the pollen record (FF-4) is dominated by Poaceae and Cyperaceae, with a Betula contribu-
tion. In the later part of the chronon Pinus increases in abundance. This is suggestive of an open-
steppe grassland environment. There was a distinct lack of plant macrofossil material from this zone
(pers. obs.), suggesting low lake productivity.
Although the dating framework and resolution of this study precludes a confident assessment of the
rapidity of the onset of the Younger Dryas the shift in the proportion of cold adjusted taxa from 0% to
40% of the fauna over two samples is in keeping with the rapidity shown in other records. The transi-
tion is characterised by a collapse of the thermophilic fauna, and a contemporous rise and subsequent
fall in the intermediate fauna and finally an expansion of cold water taxa. This rapid and complete
change in the population is unlikely to be due to changes in substrate or food supply; for example, Mi-
crotendipes pedellus displays a preference for fine organics sediment (Brooks & Birks, 2001) so
should thrive in the Windermere Interstadial, but its populations are suppressed during this zone, pre-
sumably because Microtendipes temperature optima is intermediate (Brooks & Birks, 2001; Brooks et
al., 2007).
The Chironomid fauna throughout the zone is dominated by cold water taxa. The intermediate taxa
Microtendipes pedellus-type is present throughout most of the Loch Lomond Re-advance at low levels,
and thermophilic taxa are absent from all but the onset and termination of the chronon. Peaks in the
Microspectra population suggest there was some variation within the zone, although the general fauna
remains comparatively stable throughout the chronon.
The return of thermophilic species in the second half of the zone could suggest warming or a change
in the seasonality. The low number of Chironomid remains is usual in cold water lakes (Brooks et al.,
2007) and reflects the low productivity of cold water systems. An increased rate of sedimentation
would have further reduced the concentration of remains; based on the GRIP/NGRIP ice core chronol-
ogy (Rasmussen et al., 2006) a rough estimate of 37.7mm per century could be speculated.
7.2.4 The Holocene (sub-Boreal)
This zone is made up of sediment of increasingly organic composition, and the pollen record (FF-5/6)
shows a general decline of Poaceae and Cyperaceae, an increase in Juniperus followed by a decline

Geog. Bsc.(hons.) 5831914
52
as Betula, Pinus & Corylus populations expand. There is the first appearance of Quercus & Alnus at
the uppermost samples. This characteristic sequence represents the start of the Holocene in the Brit-
ish Isles (Sparks & West, 1972; Walker, 1982).
The Chironomid fauna changes completely – there is a rapid increase in the total number of head cap-
sules and the reappearance of the thermophilic taxa prevalent in FyF-ch2; the cold water taxa preva-
lent in FyF-ch3 disappear. This suggests a warmer lake, and the reconstructed July temperatures for
this section are correspondingly high, averaging 14.8ºc.
There are two possible cold oscillations at 545 and 535cm, given the decline in the thermophilic taxa.
Although this interpretation is limited by the lack of published data on the ecology of Einfeldia pagana,
Pseudochironomus and Polypedilum are both thermophilic and there is a definite reduction in their
populations. The decline in their populations could be tentatively interpreted as representing cooler
conditions.
It is known that chironomids are responsive to trophic status, and this zone marks the reappearance of
eutrophication, although the ecological niches for temperature and trophic status are intimately linked
in Chironomid populations.
7.3 Comparison with other Late Glacial Climate Interpretations
The Chironomid record from Fridd-y-Fawnog is in general agreement with our current understanding of
climate during the Late Glacial, although the very earliest sediments are difficult to interpret without
absolute dating or further coring. A summary of the key changes in the Chironomid population is pro-
vided in figure 7.7.
The period immediately following termination of the Devensian ice sheet is often poorly recorded in
most terrestrial proxies, and this record is no exception. There are Chironomid remains at the bottom
of the core, albeit in very low quantities, and it is only by coring down to sterile clays or bedrock that
the record can be fully understood. However, the possible temperature oscillation identified at the tran-
sition to the Windermere Interstadial could correlate with that identified by Bedford et al. (2004).
The Windermere Interstadial is notable in that the qualitative interpretation suggests optimal tempera-
tures late in the zone. The Greenland records suggest early warming followed by progressive cooling

Geog. Bsc.(hons.) 5831914
53
during the Windermere Interstadial period, and this is reflected in the Chironomid record of Brooks &
Birks (2000). The record presented here has greater affinity with the Chironomid stratigraphy of Bed-
ford et al. (2004), where initial warming is slower and interrupted by an early cooling event. If there are
two cold oscillations they could represent the Oldest Dryas and Older Dryas, but if only one is present
then it would seem more likely to represent the Older Dryas, suggesting the final warm period repre-
sents the Bølling. A cautious approach would only identify a single cold oscillation from this stratigra-
phy, and there is a need for absolute dating to confirm the timing of the events, but it seems likely that
this section represents a full European style Allerød-Older Dryas-Bølling sequence, rather than a sin-
gle “Windermere Interstadial” event.
The reconstructed temperatures from the interstadial are comparable with modern day temperatures at
the site and represent full interstadial conditions. This is in keeping with reconstructions from Coleop-
tera and our understanding of the flora at the time. The bulked sample covering the onset of the period
suggests peak temperatures at this time, in contrary to the qualitative interpretation of the data but
more in line with the majority of reconstructions from Europe that suggest an early peak to interstadial
temperatures. The gradual decline in temperatures fits with the majority of records from Europe and
Greenland, and the slight deterioration could represent the Older Dryas.
The transition from the Windermere Interstadial to the Loch Lomond Re-advance has been shown to
be particularly rapid in ice core records from Greenland (Johnsen et al., 1992) and central Europe
(Mangerud, 1987). The presence of an intermediate fauna in the period of decline at the beginning of
the Younger Dryas suggests a slower onset than is present in these records. Given the sensitivity of
the record at other periods (e.g. the pre-Boreal oscillations), this probably reflects a delayed tempera-
ture depression rather than a lag in the response of the population. This is in keeping with the conclu-
sions of Bedford et al. (2004) that suggest the transition had a defined faunal zone. There are some
suggestions in the literature of two distinct stages during the Younger Dryas, the initial very cold and
dry climate, followed by a warmer period (Walker, 1995). This is reflected to some extent in this strati-
graphy, where there is evidence for an amelioration of temperature in the second half of the stage.
The reconstructed temperature for the Younger Dryas agrees well with other British Isles temperature
reconstructions, being slightly lower than that inferred by pollen but consistent with other proxies. Any
detailed variation within the zone is obscured by the need to bulk samples, but the Tj of 9.98ºc from the
transfer function corresponds well with other Chironomid temperature reconstructions from the British
Geog. Bsc.(hons.) 5831914
54
Isles (Brooks et al., 2007; Bedford et al., 2004) as well as coleopteran studies (Atkinson et al., 1987)
and reconstructions based on relic periglacial features (Isarin et al., 1998). This is considerably higher
than temperatures inferred from Scottish glacier reconstructions (Ballantyne et al., 2007), although the
southerly latitude of the site may account for some of the difference. Climate modelling of the period
comes to similar conclusions regarding the temperature depression, assuming a shutdown of the
MOC.
The early Holocene lacustrine sediments show two distinct cooling events which may well correlate
with the early Holocene climate oscillations. These oscillations are recognised across much of the pa-
laeoartic (Björk et al., 1997b; Lotter et al. 1992) and date to 8.2ka and 11.2ka (Hoek & Bos, 2007).
They have also been recognised in the Chironomid record presented by Bedford et al. (2004). Recent
research has proposed two different mechanisms for their causes, namely a freshwater pulse for the
8.2ka event (Alley & Ágústsdóttir, 2005) and decreased solar forcing for the 11.2ka event (Björk et al.,
1998b).
The reconstructed temperatures for these events are 13.5 ºc and 15ºc for the 11.2ka and 8.2ka event
respectively. The ~1ºc temperature depression during the 8.2ka event seems plausible when com-
pared to evidence from France (Alley et al., 1997). The depression lasted ~160 yrs. in the Greenland
ice cores (Thomas et al., 2007), but only 37 years in an exceptionally well dated speleothem from Ire-
land (Baldini et al., 2002). To establish the length of the response in this record a very high resolution
dating framework would need to be constructed for this core, given its short length. The agreement of
this Chironomid stratigraphy with other records of the 8.2ka event directly contradicts Kurek et al.
(2004), who conclude that midge inferred temperature reconstructions lack the sensitivity to pick up the
8.2ka event, although it should be noted that the change is within the sample specific errors of the re-
construction.
The high summer temperature (16.59ºc) at the start of the zone may be anomalously high given other
Chironomid based reconstructions that use similar training sets (Brooks & Birks, 2000; Bedford et al.,
2004), although the temperature lies well within the range suggested from coleopteran proxies for
mean summer temperatures (Atkinson et al., 1987). The limits of the temperature range of the training
set used in the transfer function must be considered when assessing the accuracy of this value be-
cause of the possibility of a “no analogue” situation, although the methods used do not preclude an
accurate prediction beyond the sample range in the study.
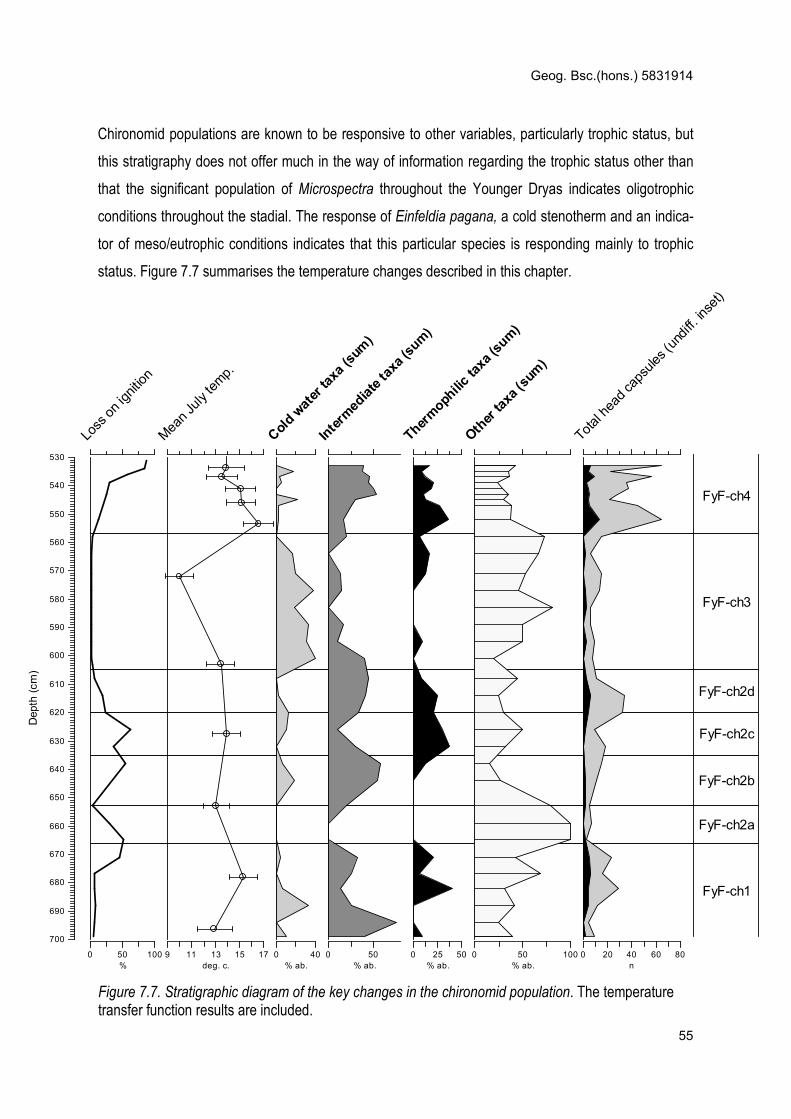
Geog. Bsc.(hons.) 5831914
55
Chironomid populations are known to be responsive to other variables, particularly trophic status, but
this stratigraphy does not offer much in the way of information regarding the trophic status other than
that the significant population of Microspectra throughout the Younger Dryas indicates oligotrophic
conditions throughout the stadial. The response of Einfeldia pagana, a cold stenotherm and an indica-
tor of meso/eutrophic conditions indicates that this particular species is responding mainly to trophic
status. Figure 7.7 summarises the temperature changes described in this chapter.
530
540
550
560
570
580
590
600
610
620
630
640
650
660
670
680
690
700
Depth (cm)
FyF-ch1
FyF-ch2a
FyF-ch2b
FyF-ch2c
FyF-ch2d
FyF-ch3
FyF-ch4
0 50 100
%
Loss on ignition
9 11 13 15 17
deg. c.
Mean July temp.
0 40
% ab.
Col
d wat
er ta
xa (s
um)
0 50
% ab.
Inte
rmed
iate
taxa
(sum
)
0 25 50
% ab.
Therm
ophili
c ta
xa (s
um)
0 50 100
% ab.
Oth
er ta
xa (s
um)
0 20 40 60 80
n
Total head capsules (undiff. inset)
Figure 7.7. Stratigraphic diagram of the key changes in the chironomid population. The temperature transfer function results are included.

Geog. Bsc.(hons.) 5831914
56
Chapter 8: Precipitation Reconstruction
8.1 How can temperatures help reconstruct precipitation?
One direct application of the Chironomid based temperature reconstruction for the Younger Dryas is to
help enlighten discussions around the precipitation during the Younger Dryas (as discussed in chapter
2).
Using measurements from modern glaciers it has been shown that there is a relationship between pre-
cipitation and temperature at the equilibrium line altitude (ELA) on a glacier (Ohmura et al., 1992). If
either of these values is known, the other can be calculated. Because the study site is so close to the
glacier the temperature at the ELA for the glacier can be calculated with good confidence, enabling the
estimation of precipitation.
Hughes (2002) described the geomorphological and sedimentary evidence for a localised cirque gla-
cier on the north-east side of Arenig Fawr, approximately 1km from the study site (but hydrologically
separated by an igneous outcrop). The ELA for this glacier has been calculated using statistical rela-
tionships between form and ELA from modern analogues (see Ballantyne, 2007; Carr & Coleman,
2007). The method is a statistical regression between the temperature at the ELA and the shape and
size of a glacier. The site of the glacier and the evidence of former glaciation is given in appendix b.
8.2 Application to Glacier Models
The July average temperature (Tj) from the Chironomid based reconstructions (9.98+/-1.21°c @
364m) was converted to the June-July-August average (Tmax) at the equilibrium line altitude (ELA,
511m) using an environmental lapse rate of 0.6°c/100m and a Tj to Tmax conversion factor of 0.97, as
per Ballantyne et al. (2007). The result is a reconstructed Tmax at the ELA of 8.76°c. Using the Ohmura
et al.(1992) regression the precipitation at the ELA is 3927+525-561mm/a. The more recent “degree-day
model” (Hughes & Braithwaite, 2008) was also applied, assuming a sinusoidal temperature distribution
and mean January temperature (Tjan) reconstructions from Renssen & Isarin (1998) cross checked with
annual temperature range (Trange) inferences from Isarin & Renssen (1999). The result was runoff from
the glacier of 4691mm/a water equivalent.
8.3 Discussion
Considering modern average precipitation for the region is between 2200-4700mm/a (Met Office
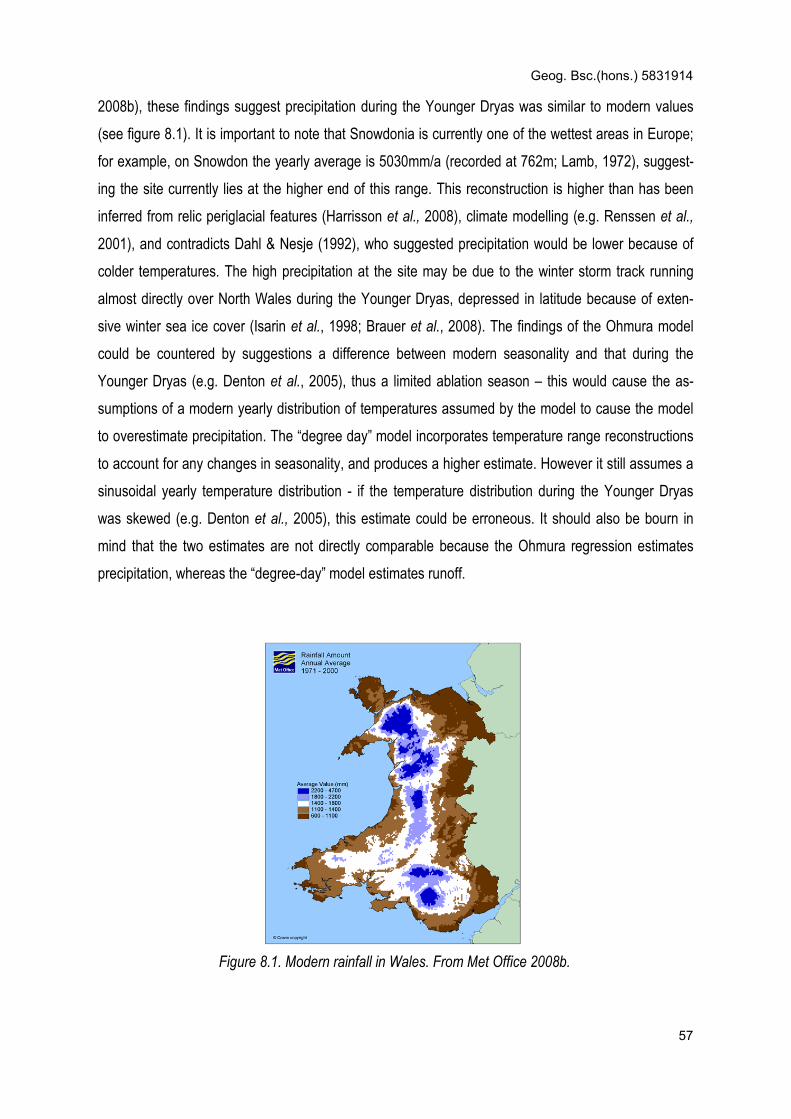
Geog. Bsc.(hons.) 5831914
57
2008b), these findings suggest precipitation during the Younger Dryas was similar to modern values
(see figure 8.1). It is important to note that Snowdonia is currently one of the wettest areas in Europe;
for example, on Snowdon the yearly average is 5030mm/a (recorded at 762m; Lamb, 1972), suggest-
ing the site currently lies at the higher end of this range. This reconstruction is higher than has been
inferred from relic periglacial features (Harrisson et al., 2008), climate modelling (e.g. Renssen et al.,
2001), and contradicts Dahl & Nesje (1992), who suggested precipitation would be lower because of
colder temperatures. The high precipitation at the site may be due to the winter storm track running
almost directly over North Wales during the Younger Dryas, depressed in latitude because of exten-
sive winter sea ice cover (Isarin et al., 1998; Brauer et al., 2008). The findings of the Ohmura model
could be countered by suggestions a difference between modern seasonality and that during the
Younger Dryas (e.g. Denton et al., 2005), thus a limited ablation season – this would cause the as-
sumptions of a modern yearly distribution of temperatures assumed by the model to cause the model
to overestimate precipitation. The “degree day” model incorporates temperature range reconstructions
to account for any changes in seasonality, and produces a higher estimate. However it still assumes a
sinusoidal yearly temperature distribution - if the temperature distribution during the Younger Dryas
was skewed (e.g. Denton et al., 2005), this estimate could be erroneous. It should also be bourn in
mind that the two estimates are not directly comparable because the Ohmura regression estimates
precipitation, whereas the “degree-day” model estimates runoff.
Figure 8.1. Modern rainfall in Wales. From Met Office 2008b.
Geog. Bsc.(hons.) 5831914
58
Chapter 9: Conclusions and directions for future research
9.1 A Proposal for Expanding the Study
The study site has been shown to be sensitive to past climate change, but there are two main limita-
tions to the study - the first is the limited dating framework. Whilst the main phases of the Late Glacial
have been picked out, individual events duration cannot be quantified and changes in the rate of sedi-
mentation cannot be assessed. Further studies at the site would benefit from a robust absolute dating
framework such as 14C dating; the local geology lends itself to traditional bulk organic matter methods,
although recent research suggests that Chironomid remains themselves may provide the best material
for nuclear isotope dating techniques (Langdon et al., 2007). This could go some way to account for
the burrowing activity of some species, the impact of which has not yet been assessed or accounted
for in any palaeolimnological studies, although some species are known to burrow up to 30cm (Pinder,
1980). A robust dating framework would allow better comparisons with the existing literature. The
search and identification of tephra horizons, particularly the “Vedde Ash” (Lowe & Turney, 1997) would
also be beneficial in understanding the rate of sedimentation.
Secondly, the clays proved difficult to extract using a Russian type corer, so a narrower gauge auger
was used providing less material for analysis. Although Chironomid based reconstructions use consid-
erably less material than other insect based methods, the low Chironomid densities encountered lim-
ited the resolution of this study. In order to fully resolve the shorter Chironomid population changes
throughout the core a larger volume of sediment needs to be extracted and sampled at a higher reso-
lution than this study; this would necessitate the use of a piston type corer (e.g. Livingstone type), or
ideally an excavation. This would increase the number of head capsules extracted and thus reduce the
need to bulk samples for use with the transfer function.
The Chironomid record can only be used to recreate mean July temperatures, which whilst making it
useful in particular studies would be of greater use if used in conjunction with other records. Further
study would benefit from a multi-proxy approach starting with a high resolution pollen & macrofossil
analysis from the same material as the Chironomid record. This would assist in comparing the core to
other local studies, and because pollen could be extracted from the wash from the Chironomid prepa-
ration, allow direct comparison of the two. A comparison with coleopteran assemblages would allow a
direct comparison of the two, along with an evaluation of seasonality at the site. Further investigation is
likely to yield further insight into climate change throughout the late glacial and into much of the early
Holocene.

Geog. Bsc.(hons.) 5831914
59
9.2 What was the nature of change during the Windermere Interstadial in North Wales?
Conditions before the rapid onset of the interstadial are difficult to assess because of low count sums,
but there is potential for a clearer record should more material be extracted from this site. Tempera-
tures peaked early during the interstadial, and seem to have been roughly analogous with modern day
temperatures, although at the peak of the interstadial they may have been slightly higher. The slow
decline of temperatures seen in most other records is not obvious from the Chironomid stratigraphy but
despite the coarse resolution the transfer function does reflect this slow decline.
The presence of a cold oscillation during the interstadial in this reconstruction seems likely from both
the changes in the Chironomid fauna and the results of the temperature transfer function, both of
which show a small downturn in temperatures. This would seem likely to correlate to the Older Dryas
(Greenland interstadial GI2b), the largest change observed across the continent and in Greenland at
this time. The multiple oscillations observed by other Chironomid workers (Bedford et al., 2004; Brooks
et al. 1997) are lent very limited support from these results, where there are unstable episodes where
small changes may have been obscured by the sample resolution. There is considerable potential for
further study of the site to assess the variability of the site through the Windermere Interstadial.
The temperature reconstructions fit with other records, and clearly demonstrate the lag of the pollen
record when compared to the pollen record of Hughes (2000). They lie well within the ranges of the
Coleoptera inferred temperature presented by Atkinson et al. (1987), although are slightly lower than
the temperatures inferred by Coope et al. (1998), even when adjusted for altitude.
9.3 What were the changes in temperature, seasonality and precipitation during the Loch Lo-
mond Stadial?
The rapid onset of the Younger Dryas is not unexpected given the considerable literature on the ex-
ceptional rapidity of the onset. The early return of some thermophilic taxa suggests that the return of
milder conditions in the second half of the stadial suggested by other workers (e.g. Isarin et al. 1998)
may hold some truth. The early Holocene warming is particularly obvious although some species
seem largely unaffected, which is surprising given the widespread changes in the general ecology of
the lake at the time. The temperature reconstruction for this period was hampered by low count sums,
but the estimate obtained is very similar to the results from a wide variety of sources. The tempera-

Geog. Bsc.(hons.) 5831914
60
tures are considerably colder than those proposed by Isarin & Bohncke (1999), who suggest minimum
July temperatures of around 12ºc for the first part of the Younger Dryas. They are well within the range
of the Coleoptera studies, and agree with the Coleoptera inferred temperatures in Coope et al. 1998.
Previous attempts to use glacier reconstruction models to calculate precipitation during the Younger
Dryas were often hampered by the necessity to use temperature reconstructions from sites that were
geographically removed enough as to leave doubt as to their relevance. The reinterpretation of
Hughes (2002) through the use of the temperature reconstruction can leave little doubt as to the appli-
cability of the temperature reconstruction given the two sites are less than 1km apart. This reinforces
the original conclusions of Hughes (2002) that precipitation during the Younger Dryas was comparable
to modern precipitation. This supports the view of many glaciologists, and counters that of other work-
ers. The solution may not lie in who is right and who is wrong, but in how the differing estimates can be
settled with each other – changes in seasonality during the Younger Dryas may hold the answer, with
longer winters being the prime candidate.
9.4 Implications for current climate
A study of this nature is not directly concerned with the current climate, but even a small study of this
nature has some implications for the current research on future climate change. The exact cause (or
causes) of the Younger Dryas are still the subject of considerable debate, but the majority of theories
relate in some way to a proposed instability of the MOC (as discussed in chapter 2). This has impor-
tant implications for modern climate, as small changes in the strength of course of these waters have
the potential to cause wide ranging temperature changes all around the Atlantic seaboard. It is also
important to understand the threshold response of the system, as although theories of a future catas-
trophic switch are no longer well accepted, understanding the behaviour and effects of the system un-
der extreme conditions allows workers (particularly climate modellers) an insight into the system. Even
relatively small temperature variations can have far reaching impacts for ecology and society, and our
ability to predict and mitigate these effects is reliant on a broad, detailed literature on past climate
change (Jansen et al., 2007).

Geog. Bsc.(hons.) 5831914
61
9.5 How can Chironomid proxies add to our understanding of the Late-Glacial?
This study has increased the resolution of the temperature record for the late glacial changes in the
British Isles, but also demonstrated the reliability of the method compared to other proxies. The possi-
bility of the 8.2 and 11.2ka events in this stratigraphy could indicate an important avenue for future
use, as the early Holocene would benefit from better proxy records (Hoek & Bos, 2007). The identifica-
tion of these events using chironomids would contradict Kurek et al. (2004) who argue the proxy is not
sensitive enough. Chironomids have been shown in this study, like others, to be sensitive indicators of
climate change, and by comparison to other records particularly accurate. The precision of the transfer
function is good, but a considerable number of capsules need to be retrieved and identified before ac-
curate reconstructions can be made. Chironomid analysis is particularly time consuming, and there
may be scope for developing new methods to reduce the time it takes to extract and prepare speci-
mens.
Given the likely heightening of debate regarding possible changes in seasonality during the Younger
Dryas, the ability to infer summer temperatures using chironomids will be of increasing importance.
Their use in reconstructing Younger Dryas summer temperatures has widespread potential in the
study of relic glacial and periglacial landforms because they can provide accurate local estimates of
temperature if appropriate sites can be located. The use of subfossil chironomid remains in providing
material for both nuclear isotope dating (Langdon et al., 2007) and in stable oxygen isotope analysis
(Wang et al., 2008), allowing reconstructions of mean annual temperature (e.g. Wooler et al., 2004)
are both interesting developments, and it seems likely that chironomid based methods will continue to
play an increasing role in limnology and palaeoecological studies.

Geog. Bsc.(hons.) 5831914
62
References
Ackert Jr., R.P., Becker, R.A., Singer, B. S., Kurz, M.D., Caffee, M. W. & Mickelson, D. M. (2008). Patagonian glacier response during the late glacial-holocene transition. In Science vol. 321(5887), pp. 392-395.
Alley, R. B. (2006). Wally was Right: Predictive Ability of the North Atlantic “Conveyor Belt” Hypothesis
for Abrupt Climate Change. In The Annual Review of Earth and Planetary Sciences vol. 35, pp. 241-72.
Alley, R. B. & Ágústsdóttir, A. M. (2005). The 8k event: cause and consequences of a major Holo-
cene abrupt climate change. In Quaternary Science Reviews vol. 24(10-11), pp. 1123-1149. Alley, R.B., Meese, D. A., Shuman, C.A., Gow, A. J., Taylor, K. C., Grootes, P. M., White, J. W. C., Ram, M., Waddington, E. D., Mayewski, P. A. & Zielinski, G. A. (1993). Abrupt increase in Greenland snow accumulation at the end of the Younger Dryas. In Nature vol. 362, pp. 527
Alley, R.B, P. A. Mayewski, T. Sowers, M. Stuiver, K. C. Taylor, and P. U. Clark (1997). Holocene
climatic instability; a prominent, widespread event 8200 yr ago. In Geology vol. 25(6), pp. 483-486. Anderson, D.E (1997). Younger Dryas research and its implications for understanding abrupt climate
change. In Progress in Physical Geography Vol. 21(2), pp. 230 – 249. Applegate, P.J., Lowell, T.V. & Alley, R. B. (2008). Comment on “absence of cooling in New Zealand
and the adjacent ocean during the Younger Dryas chronozone”. In Science, vol. 320(5877), p 746d. Armitage, P.D., Cranston, P.S. & Pinder, L.C. (eds.) (1995). The chironomidae: the biology and
ecology of non-biting midges. Chapman and Hall: London. Atkinson, T.C., Briffa, K.R. & Coope, G.R. (1987). Seasonal temperatures in Britain during the past
22,000 years, reconstructed using beetle remains. In Nature vol. 325, pp. 587. Baldini, J. U. L., McDermott, F. & Fairchild, I. J. (2002). Structure of the 8200-Year Cold Event Re-
vealed by a Speleothem Trace Element Record. In Science vol.296, pp. 2203-2206. Ballantyne, C. K. (2007). Loch Lomond Stadial glaciers in North Harris, Outer Hebrides, North-West
Scotland: glacier reconstruction and palaeoclimatic implications. In Quaternary Science Reviews vol. 26, pp. 3134-3149
Barber, D.C, A. Dyke, C. Hillaire-Marcel, A. E. Jennings, J. T. Andrews, M. W. Kerwin, G. Bilo-deau, R. McNeely, J. Southon, M. D. Morehead and J.-M. Gagnon (1999). Forcing of the cold event of 8,200 years ago by catastrophic drainage of Laurentide lakes. In Nature vol. 400, pp. 344-348
Barrows, T. T., Lehman, S. J., Fifield, L. K. & De Deckker, P. (2007). Absence of Cooling in New
Zealand and the Adjacent Ocean During the Younger Dryas Chronozone. In Science vol.318(5847), pp. 86-89.
Geog. Bsc.(hons.) 5831914
63
Battarbee, R. W. (1994). Diatoms, lake acidification and the Surface Water Acidification Programme (SWAP): a review. In Hydrobiologica vol. 274, pp. 1-7.
Bedford, A., Jones, R. T. Lang, B. Brooks, S. & Marshall, J. D. (2004). A Late-glacial chironomid
record from Hawes Water, northwest England. In Journal of Quaternary Science, vol. 19(3), pp. 281-290.
Bell, M. B. & Walker, M. J. C. (2005). Late Quaternary Environmental Change: Physical and Human
Perspectives. Pearson: Harlow Benn, D. I. & Evans, D. J. A. (1998). Glaciers & Glaciation. Arnold: London. Berger, W. H. (1990). The younger dryas cold spell – a quest for causes. In Palaeogeography, Pa-laeoclimatology, Palaeoecology vol. 89(3), pp. 219-237.
Bengtsson, L. & Enell, M. (1986). Chemical Analysis. In Berglund, B.E. (ed.). Handbook of Holocene
palaeoecology and palaeohydrology. Chichester : Wiley. BGS (2008). 1:50,000 Scale Geological Map of Fridd-y-Fawnog. Retrieved from Edina on 19/10/2008. Björck, S., Walker, M.J.C., Cwynar, L.C., Johnsen, S., Knudsen, K.L., Lowe, J.J., Wohlfarth, B., & INTIMATE members (1998a). An event stratigraphy for the Last Termination in the North Atlantic region based on the Greenland ice-core record: a proposal by the INTIMATE group. In the Journal of Quaternary Science vol. 13, pp283–292.
Björk, S., Rundgren, M., Ingolfsson, O. & Funder, S. (1998b). The Preboreal oscillation around the
Nordic Seas: terrestrial and lacustrine responses. In Journal of Quaternary Science vol. 12(6) pp.455-465.
Boggero, A., Füreder, L., Lencioni, V., Simcic, T., Thaler, B., Ferrarese, U., Lotter, A. F. & Et-tinger, R. (2006). Littoral chironomid communities of Alpine lakes in relation to environmental fac-tors. In Hydrobiologia vol. 562, pp. 145-165.
Bradley, R. S. & England, J. H. (2008). The Younger Dryas and the Sea of Ancient Ice. In Quaternary Research vol. 70, p1-10.
Bradwell, T., Fabel, D., Stoker, M., Mathers, H., McHargue, L. & howe, J. (2008). Ice caps existed
throughout the Lateglacial Interstadial in northern Scotland. In Journal of Quaternary Research vol.23(5), pp. 401-407.
Brauer, A., Endres, C & Negendank, J. F. W. (2000). Lateglacial calendar year chronology based on
annually laminated sediments from Lake Meerfelder Maar, Germany. In Quaternary International vol. 61(1), pp.17-25.
Brauer, A., Haug, G. H., Dulski, P., Sigman, D. M. & Negendank, J. F. W. (2008). An abrupt wind
shift in western Europe at the onset og the Younger Dryas cold period. In Nature Geoscience vol. 1, pp. 520-523 .
Brodersen, K. P. (2008). Book review: S.J. Brooks, P.G. Langdon & O. Heiri, The Identification and
use of Palaeartic Chironomidae Larvae in Palaeoecology. QRA Technical Guide No. 10. In Journal

Geog. Bsc.(hons.) 5831914
64
of Paleolimnology vol. 40, pp. 751-753. Brodin, Y-W. & Gransberg, M. (1993). Responses of insects, especially Chironomidae (Diptera), and
mites to 130 years of acidification in a Scottish lake. In Hydrobiologica vol. 250 pp. 201-212. Broecker, W. S. (2006). Was the Younger Dryas Triggered by a Flood. In Science, vol. 312 p1146-
1148. Broecker, W.S., Peteet, D.M. & Rind, D. (1985). Does the ocean-atmosphere system have more than
one stable mode of operation? In Nature vol. 315 p. 21. Brooks, S. J. & Birks, H. J. B. (2000). Chironomid-inferred Late-glacial air temperatures at Whitrig
Bog, southeast Scotland. In Journal of Quaternary Science vol. 15(8) pp. 759–764. Brooks, S.J & Birks, H. J. B. (2001) Chironomid inferred air temperatures from Lateglacial and Holo-
cene sites in north-west Europe: progress and problems. In Quaternary Science Reviews 20, pp. 1723-1741.
Brooks, S.J., Bennison, H. & Birks, H. J. B (2001). Tracing trophic lake history with a chironomid-
total phosphorus inference model. In Freshwater Biology vol. 46, pp. 513-533. Brooks, S.J., Langdon, P.G., Heiri, O. (2007). The Identification and Use of Palaeartic Chironomidae
Larvae in Palaeoecology. Quaternary Research Association: London. Buchanan, B., Collard, M. & Edinborough, K. (2008). Paleoindian demography and the extraterres-
trial impact hypothesis. In Proceedings of the National Academy of Sciences vol. 105(33), pp. 11651-11654.
Burrows, C. J. (1974). Plant Macrofossils from Late-Devensian Deposits at Nant Ffrancon, Caernar-
vonshire. In New Phytologist, vol. 73(5), pp. 1003-1033. Carlson, A. E., Clark, P. U., Haley, B. A., Klinkhammer, G. P., Simmons, K., Brook, E. J. & Melss-ner, K. J. (2007). Geochemical proxies of North American freshwater routing during the Younger Dryas cold event. In Proceedings of the National Academy of Sciences, vol. 104(16), pp. 6556-6561.
Carr, S. & Coleman, C. (2007). An improved technique for the reconstruction of former glacier mass-
balance and dynamics. In Geomorphology vol. 92, pp. 76-90. Clerk, S., Hall, R., Quinlan, R. & Smol, J. P. (2000). Quantitative inferences of past hypolimnetic an-
oxia and nutrient levels from a Canadian Precambrian Shield lake. In Journal of Paleolimnology vol. 23, pp. 319-336.
Colman, S. M. (2007). Conventional wisdom and climate history. In Proceedings of the National Acad-emy of Sciences, vol. 104(16), pp. 6500-6501.
Coope, G.R. & Brophy, J.A. (1972). Late Glacial environmental changes indicated by a coleopteran
succession from North Wales. In Boreas vol. 1, p. 97. Coope, G. R., Lemdahl, G., Lowe, J. J. & Walking, A. (1998). Temperature gradients in northern
Europe during the last glacial-Holocene transition (14-9 14C kyr BP) interpreted from coleopteran

Geog. Bsc.(hons.) 5831914
65
assemblages. In Journal of Quaternary Science vol. 13(5), pp. 419-433. Crabtree, K. (1972). Late-Glacial Deposits Near Capel Curig, Caernarvonshire. In New Phytologist
vol. 71(6), pp. 1233-1243. Cranston, P.S. (1982). A Key to the larvae of the British Orthocladiinae (Chironomidae). Scientific
Publications of the Freshwater Biological Association vol. 45, pp. 1-154. Cranston, P. S. (1995a). Introduction to the chironomidae. In Armitage, P. D., Cranston, P. D. &
Pinder, L. C. V(eds.) The Chironomidae: Biology & Ecology of non-biting midges. Chapman & Hall: London. Springer: Netherlands
Cranston, P.S. (1995b).Ch 4: Biogeography. In Armitage, P.D., Cranston, P.S. & Pinder, L. C. V.
(eds.) 1995. In The Chironomidae: Biology & Ecology of non-biting midges. Chapman & Hall: Lon-don.
Cronin, T. M. (1998). Principles of Paleoclimatology. Columbia University Press: New York. Dahl, S. O. & Nesje, A. (1992). Paleoclimatic implications based on equilibrium-line altitude depres-
sions of reconstructed Younger Dryas and Holocene cirque glaciers in inner Nordfjord, western Nor-way. In Palaeogeography, Palaeoclimatology and Palaeoecology vol.94(1-4), pp. 87-97
Davis, A. (1984). Dating With Pollen: Methodology, Applications, Limitations. In Developments in Pa-laeontology and Stratigraphy vol. 7 pp. 283-297.
Denton, G. H., Alley, R. B., Comer, G. C. & Broecker, W. S. (2005). The role of seasonality in abrupt
climate change. In Quaternary Science Reviews, vol. 24, pp.1159-1182. Firestone, R. B., West, A., Kennett, J.P., Becker, L., Bunch, T.E., Revay, Z. S., Schultz, P.H., Bel-gya, T., Kennett, D. J., Erlandson, J. M., Dickenson, O. J., Goodyear, A. C., Harris, R. S., How-ard, G. A., Kloosterman, J. B., Lechler, P., Mayewski, P. A., Montgomery, J., Poreda, R., Dar-rah, T., Que Hee, S. S., Smith, A. R., Stich, A., Topping, W., Wittke, J. H. & Wolbach, W. S. (2007). Evidence for an extraterrestrial impact 12,900 years ago that contributed to the megafaunal extinctions and the Younger Dryas cooling. In Proceedings of the National Academy of Sciences vol. 104(41), pp. 16016–16021.
Fretwell, P. T., Smith, D. E. & Harrison, S. (2008). The Last Glacial Maximum British-Irish Ice Sheet:
a reconstruction using digital terrain mapping. In Journal of Quaternary Science vol.23(3), pp. 241-248.
Giorgi, F. & Mearns, L. O. (1991). Approaches to the simulation of regional climate change: a review.
In Reviews of Geophysics vol. 29(2), pp.191-216. Glew, J.R., Smol, J.P. & Last, W.M. (2001). Sediment core collection and extrusion. In Smol, J.P,
Birks, H.J.B. & Last, W.M. (eds.) Tracking Environmental Change Using Lake Sediments Vol.1 Basin Analysis, Coring, and Chronological Techniques. Kluwer: London
Goslar, T., Kuc, T., Ralska-Jasiewiczowa, M., Rózánski, K., Arnold, M., Bard, E., van Geel, B., Pazdur, M. F., Szeroczyńska, K., Wicik, B., Więckowski, K. & Walanus, A. (1993). High-resolution lacustrine record of the late glacial/Holocene transition in central Europe. In Quaternary

Geog. Bsc.(hons.) 5831914
66
Science Reviews vol. 12, pp. 287-294. Gray, J. M. (1982). The last glaciers (Loch Lomond Advance) in Snowdonia, N. Wales. In Geological Journal vol. 17, pp. 111-133.
Grimås, U. & Wiederholm, T. (1979). Biometry and biology of Constempellina brevicosta
(Chironomidae) in a subarctic lake. In Holarctic Ecology vol. 2, pp. 119-124. Gulliksen, S., Birks, H. H., Possnert, G. & Mangerud, J. (1998). A calendar age of the Younger
Dryas-Holocene Boundary at Kråkenes, western Norway. In The Holocene vol. 8(3), p.249-259. Hann, B. J., Warner, B. G. & Warwick, W. F. (1992). Aquatic invertebrates and climatic change: A
comment on Walker et al. (1991). In Canadian Journal of Fisheries and Aquatic Science vol. 49 pp. 1274–1276.
Hammer, Ø., Harper, Harper, D.A.T., and Ryan, P. D. (2001). PAST: Paleontological Statistics Soft-
ware Package for Education and Data Analysis. In Palaeontologia Electronica vol. 4(1), p9. Harper, D. A. T. (ed.). (1999). Numerical Palaeobiology. Wiley: Chichester Harrison, S., Whalley, B. & Anderson, E. (2008). Relict rock glaciers and protalus lobes in the British
Isles: implications for Late Pleistocene mountain geomorphology and palaeoclimate. In Journal of Quaternary Science vol. 23, pp. 287–304.
Hays, J.D., Imbrie, J. & Shackleton, N. J. (1976). Variations in the Earth's Orbit: Pacemaker of the
Ice Ages. In Science vol. 194, pp. 4270. Heiri, O. & Lotter, A. F. (2001). Effect of low count sums on quantitative environmental reconstruc-
tions: an example using subfossil chironomids. In Journal of Paleolimnology vol. 26, p. 343. Heiri, O. (2004). Within-lake variability of subfossil chironomid assemblages in shallow Norwegian
lakes. In Journal of Paleolimnology vol. 32, pp. 67-84. Hill, T. C. B., Woodland, W. A., Spencer, C. D., Marriott, S. B., Case, D. J. & Catt, J. A. (2008). De-
vensian Late-glacial environmental change in the Gordano Valley, North Somerset, England: a rare archive for southwest Britain. In Journal of Paleolimnology, vol. 40 pp. 431-444.
Hoek, W. Z. & Bos, J. A. A. (2007). Early Holocene climate oscillations—causes and consequences.
In Quaternary Science Reviews vol. 26(15-16), pp. 1901-1906. Houghton, J. (2004). Global Warming: The Complete Briefing. Cambridge University Press: Cam-
bridge. Hughes, P.D. (2000). The Last Glaciers in the Aran and Arenig Mountains, North Wales. MPhil Thesis,
Darwin College, University of Cambridge. Hughes, P.D (2002). Loch Lomond Stadial glaciers in the Aran and Arenig Mountains, North Wales,
Great Britain. In The Geological Journal vol. 37, pp. 9-15. Hughes, P.D., Woodward, J. C. & Gibbard, P. L. (2006). The last glaciers of Greece. In Zeitschrift fur

Geog. Bsc.(hons.) 5831914
67
Geomorphologie vol. 50(1), pp.37-61. Hughes, P.D. & Braithwaite, R. J. (2008). Application of a degree-day model to reconstruct Pleisto-
cene glacial climates. In Quaternary Research vol. 69, pp. 110-116. Imbrie, J. & Imbrie, K.P. (1979). Ice Ages: Solving the Mystery. Macmillian: London Ince, J. (1983). Two postglacial pollen profiles from the uplands of Snowdonia, Gwynedd, North
Wales. In New Phytologist vol. 95, pp. 159-172. IPCC (2007). Summary for Policymakers. In Solomon, S., D. Qin, M. Manning, Z. Chen, M. Marquis,
K.B. Averyt, M.Tignor and H.L. Miller (eds.): Climate Change 2007: The Physical Science Basis. Contribution of Working Group I to the Fourth Assessment Report of the Intergovernmental Panel on Climate Change. Cambridge University Press: Cambridge
Isarin, R. F. B. & Bohncke, S. J. P. (1999). Temperatures during the Younger Dryas in Northwestern
and Central Europe as Inferred from Climate Indicator Plant Species. In Quaternary Research vol. 51, pp. 158-173.
Isarin, R. F. B. & Renssen, H. (1999). Reconstructing and modelling Late Weichselian climates: the
Younger Dryas in Europe as a case study. In Earth-Science Reviews vol. 48(1-2), pp. 1-38. Isarin, R. F. B., Renssen, H. & Vandenberghe, J. (1998). The impact of the North Atlantic Ocean on
the Younger Dryas climate in northwestern and central Europe. In Journal of Quaternary Science vol. 13, pp. 447–453.
Jansen, E., J. Overpeck, K.R. Briffa, J.-C. Duplessy, F. Joos, V. Masson-Delmotte, D. Olago, B. Otto-Bliesner, W.R. Peltier, S. Rahmstorf, R. Ramesh, D. Raynaud, D. Rind, O. Solomina, R. Villalba and D. Zhang (2007). Palaeoclimate. In Solomon, S., D. Qin, M. Manning, Z. Chen, M. Mar-quis, K.B. Averyt, M. Tignor and H.L. Miller (eds.). Climate Change 2007: The Physical Science Ba-sis. Contribution of Working Group I to the Fourth Assessment Report of the Intergovernmental Panel on Climate Change. Cambridge University Press: Cambridge
Johnsen, S.J., Clausen, H. B., Dansgaard, W., Fuhrer, K., Gundestrup, N., Hammer, C. U., Iversen, P., Jouzel, J., Stauffer, B. & Steffensen, J. P. (1992). Irregular glacial interstadials re-corded in a new Greenland ice core. In Nature vol. 359, pp. 311.
Juggins, S. & ter Braak, C. J. F. (2002). Program WAPLS version 1.51. Kansanen, P. H. (1985). Assessment of pollution history from recent sediments in Lake Vanajavesi,
southern Finland. II. Changes in Chironomidae, Chaoboridae and Cerapogonidae (Diptera) fauna. In Annales Fennici Zoologicii vol. 22, pp. 57-90.
Kerschner, H., Kaser, G. & Sailer, R. (2000). Alpine Younger Dryas glaciers as palaeo-precipitation
gauges. In Annals of Glaciology, vol. 31, p80-84. Knutti, R., Flückiger, J., Stocker, T. F. & Timmermann, A. (2004). Strong hemispheric coupling of
glacial climate through freshwater discharge and ocean circulation. In Nature vol. 430, p. 851. Kullman, L. (2002). Boreal tree taxa in the central Scandes during the Late-Glacial: implications for

Geog. Bsc.(hons.) 5831914
68
Late-Quaternary forest history. In Journal of Biogeography, vol. 29, pp. 1117-1124. Kurek, J., Cwynar, L. S. & Spear, R. W. (2004). The 8200 cal yr BP cooling event in eastern North
America and the utility of midge analysis for Holocene temperature reconstructions. In Quaternary Science Reviews vol. 23, pp. 627-639.
Lamb, H. H. (1972). Climate: Present, Past and Future: Vol. 1. Routeledge: London Lang, B., Bedford, A. P., Richardson, N. & Brooks, S.J. (2003). The use of ultra-sound in the prepa-
ration of carbonate and clay sediments for chironomid analysis. In Journal of Paleolimnology vol. 30, pp. 451-460.
Langdon, P. G., Barber, K. E. & Lomas-Clarke, S. H. (2004). Reconstructing climate and environ-
mental change in northern England through chironomid and pollen analysis: evidence from Talkin Tarn, Cumbria. In Journal of Paleolimnology vol. 32, pp. 197-213.
Langdon, P., Caseldine, C., Higham, T. & Croudace, I. (2007), Abstract for presentation at XVII IN-
QUA Congress 2007. Retrieved from http://www.icms.com.au/inqua2007/abstract/669.htm. Ac-cessed 08/01/09.
Larocque, I., Hall, R. I. & Grahn, E. (2001) Chironomids as indicators of climatic change: a 100-lake
training set from a subartic region of northern Sweden (Lapland). In Journal of Paleolimnology vol. 26, pp. 307-322.
Larocque, I., Grosjean, M., Heriri, O., Bigler, C. & Blass, A. (2009). Comparison between chi-
ronomid inferred July temperatures and meteorological data AD 1850-2001 from varved Lake Sil-vaplana, Switzerland. In Journal of Paleolimnology vol. 41(2), pp. 329-342.
Litt, T. & Stebich, M. (1999). Bio- and chronostratigraphy of the lateglacial in the Eifel region, Ger-
many. In Quaternary International vol. 61 pp. 5-16. Lotter, A.F., Eicher, U., Siegenthaler, U. & Birks, H. J. B. (1992). Late-glacial climatic oscillations as
recorded in Swiss lake sediments. In Journal of Quaternary Science vol. 7(3), pp. 187-204. Lotter, A. F., Birks, H. J. B., Hofmann, W. & Marchetto, A. (1997) Modern diatom, cladocera, chi-
ronomid, and chrysophyte cyst assemblages as quantitative indicators for the reconstruction of past environmental conditions in the Alps. I. Climate. In Journal of Paleolimnology vol. 18, pp. 395–420.
Lotter, A. F., Walker, I. R., Brooks, S.J. & Hofmann, W. (1999). An intercontinental comparison of
chironomid palaeotemperature inference models: Europe vs North America. In Quaternary Science Reviews vol. 18, pp. 717-735.
Lowe, J. J. & Turney, C. S. M. (1997). Vedde Ash layer discovered in a small lake basin on the Scot-
tish mainland. In Journal of the Geological Society vol. 154, p. 605. Lowe, J. J. & Walker, M. J. C. (1997). Reconstructing Quaternary Environments, 2nd edition. Pearson:
Harlow Lowell, T. V. & Kelly, M. A. (2008). Was the Younger Dryas Global? In Science vol. 321, p. 348.

Geog. Bsc.(hons.) 5831914
69
Luoto, T.P. (2008). Subfossil Chironomidae (Insecta: Diptera) along a latitudinal gradient in Finland: development of a new temperature inference model. In Journal of Quaternary Science (unpublished).
Mangerud, J. (1987). The Allerød/Younger Dryas boundary. In Berger, W. H. & Labeyrie, L. (eds.).
Abrupt Climatic Change - Evidence and Implications, pp.163-171. Reidel: Dordrecht. Mangerud, J., Andersen, S.T., Berglund, B.E. & Donner, J.J. (1974). Quaternary stratigraphy of
Norden, a proposal for terminology and classification. In Boreas vol. 3, p. 109. Mayewski, P. A., Meeker, L. D., Whitlow, S., Twickler, M.S., Morrison, M.C., Alley, R.B., Bloom-field, P. & Taylor, K. (1993). The Atmosphere During the Younger Dryas. In Science vol. 261, p. 195.
Mayle, F. E., Bell, M., Birks, H. H., Brooks, S. J., Coope, G. R., Lowe, J. J., Sheldrick, C., Shijie, L., Turney, C. S. M., Walker, M. J. C. (1999). Climate variations in Britain during the Last Glacial-Holocene transition (15.0-11.5 cal ka BP): comparison with the GRIP ice-core record. In Journal of the Geological Society, London vol. 156, pp. 411-423.
McCarrol, D & Ballantyne, C.K. (2000). The Last Ice Sheet in Snowdonia. In Journal of Quaternary
Science vol.15(8), pp. 765-778. McGill, J.D., Wilson, R.S. & Brake, A.M. (1979). The use of chironomid pupal exuviae in the surveil-
lance of sewage pollution within a drainage system. In Water Research vol.13, pp. 887-894. Met Office (2008a). England and Wales Mean Temperature (Degrees C): Areal Series, starting from
1914. Available online from www.metoffice.gov.uk. [Accessed 02/01/2009]. Met Office (2008b). Map of rainfall in Wales. Available online from www.metoffice.gov.uk. [Accessed
02/01/2009]. Mousavi, S. K. (2002). Boreal chironomid communties and their relations to environmental factors –
the impact of lake depth, size and acidity. In Boreal Environmental Research vol. 7, pp. 63-75. Murray, D. A. (1980). Chironomidae Ecology, Systematics, Cytology and Physiology: Proceedings of
the 7th International Symposium on Chironomidae. Pergammon Press: Dublin. Ohmura, A., Kasser, P. & Funk, M. (1992). Climate at the equilibrium line of glaciers. In Journal of Glaciology, vol. 38(130), pp. 397-411.
Olander, H., Birks, H. J. B., Korhola, A.. & Blom, T. (1999). An expanded calibration model for infer-
ring lakewater and air temperatures from fossil chironomid assemblages in northern Fennoscandia. In The Holocene vol. 9(3), pp. 279-294.
Oliver, D.R. & Roussel, M.E. (1983). The insects and arachnids of Canada, Part II: The genera of
larval midges of Canada-Diptera: Chironomidae. Agriculture Canada Publication 1746, pp1-263. Oliver, H. R., Chaloner, W. G. & Rose, J. (1999). TIGGER: NERC-stimulated research into geological
perspective of terrestrial global environmental research. In Journal of the Geological Society vol. 156(2), p. 341-344.

Geog. Bsc.(hons.) 5831914
70
Parker, D. E., Basnett, T. A., Brown, S. J., Grodon, M., Horton, E. B. & Rayner, N. A. (2000). Cli-mate observations – the instrumental record. In Space Science Reviews vol. 94, pp. 309-320.
Pennington, W. (1977). The Late Devensian flora and vegetation of Britain. In Philosophical transac-tions of the Royal Society B vol. 280, pp. 247-271.
Peteet, D. (1995). Global Younger Dryas? In Quaternary International vol. 28, pp. 93-104. Pinder, L. C. V. (1995). Ch 6: The habits of chironomid larvae. In Armitage, P.D., Cranston, P.S. &
Pinder, L. C. V. (eds.) 1995. In The Chironomidae: Biology & Ecology of non-biting midges. Chap-man & Hall: London.
Porinchu, D. F. & MacDonald, G. M. (2003). The use and application of freshwater midges
(Chironomidae: Insecta: Diptera) in geographical research. In Progress in Physical Geography vol. 27(3), pp. 378-422.
Praetorius, S.K., McManus, J.F., Oppo, D.W. & Curry, W.B. (2008). Episodic reductions in bottom-
water currents since the last ice age. In Nature Geoscience vol. 1, p. 449. Randall, D.A., R.A. Wood, S. Bony, R. Colman, T. Fichefet, J. Fyfe, V. Kattsov, A. Pitman, J. Shukla, J. Srinivasan, R.J. Stouffer, A. Sumi and K.E. Taylor, (2007). Climate Models and Their Evaluation. In Solomon, S., D. Qin, M. Manning, Z. Chen, M. Marquis, K.B. Averyt, M.Tignor and H.L. Miller (eds.). Climate Change 2007: The Physical Science Basis. Contribution of Working Group I to the Fourth Assessment Report of the Intergovernmental Panel on Climate Change. Cambridge University Press, Cambridge.
Rasmussen, S. O., Andersen, K. K., Svensson, A. M., Steffensen, J. P., Vinther, B. M., Clausen, H. B., Siggaard-Andersen, M.-L., Johnsen, S. J., Larsen, L. B., Dahl-Jensen, Bigler, D. M., Röthlisberger, R., Fischer, H., Goto-Azuma, K., Hansson, M. E. & Ruth, U. (2006). A new Greenland ice core chronology for the last glacial termination. In Journal of Geophysical Research vol. 111, p. D06102.
Reimer, P. J., Baillie, M. G. L., Bard, E., Bayliss, A., Beck, J. W., Bertrand, C. J. H., Blackwell, P. G., Buck, C. E., Burr, G. S., Cutler, K. B., Damon, P. E., Edwards, R. L., Fairbanks, R. G., Frie-drich, M., Guilderson, T. P., Hogg, A. G., Hughen, K. A., Kromer, B., McCormac, F. G., Man-ning, S. W., Ramsey, C. B., Reimer, R. W., Remmele, S., Southon, J. R., Stuiver, M., Talamo, S., Taylor, F. W., van der Plicht, J., and Weyhenmeyer, C. E. (2004). IntCal04 Terrestrial radiocarbon age calibration, 26 - 0 ka BP. In Radiocarbon vol. 46, pp. 1029-1058.
Renssen, H. & Isarin, R. F. B. (1998). Surface temperature in NW Europe during the Younger Dryas:
AGCM simulation compared with temperature reconstructions. In Climate Dynamics vol. 14, pp. 33-44.
Renssen, H. Isarin, R. F. B., Jacob, D., Podzun, R. & Vandenberghe, J. (2001). Simulation of the
Younger Dryas climate in Europe using a regional climate model nested in an AGCM: preliminary results. In Global and Planetary Change vol. 30, pp. 41-57.
Renssen, H., van Geel, B., var der Plicht, J. & Magny, M. (2000). Reduced solar activity as a trigger

Geog. Bsc.(hons.) 5831914
71
for the start of the Younger Dryas? In Quaternary Journal vol. 68-71, pp. 373-383. Rieradevall, M. & Brooks, S. J. (2001). An identification guide to subfossil Tanypodinae larvae
(Inseca: Diptera: Chironomidae) based on cephalic setation. In Journal of Paleolimnology vol. 25, pp. 81-99.
Roberts, N. (1998). The Holocene: An Environmental History, 2nd edition. Blackwell: Oxford. Rodwell, J.S. (ed.) (1991). British Plant Communities Vol. 2: Mires and Heaths. Cambridge University
Press: Cambridge. Rolland, N. & Larocque, I. (2007). The efficiency of kerosene flotation for extraction of chironomid
head capsules from lake sediment samples. In Journal of Paleolimnology vol. 37, pp. 565-572. Saether, O.A. (1979). Chironomid communities as water quality indicators. In Holartic Ecology vol. 2,
pp. 65-74. Santisteban, J.I., Mediavilla, R., López-Pamo, E., Dabrio, C.J., Blanca Ruiz Zapata, M., José Gil García, M., Castan, S. & Martínez-Alfaro, P.E. (2004). Loss on ignition: a qualitative or quantitative method for organic matter and carbonate mineral content in sediments? In Journal of Paleolimnology vol. 32, pp. 287–299.
Seddon, B. (1962). Late-glacial deposits at Llyn Dwythwch and Nant Ffrancon, Caernarvonshire. In Philosophical Transactions of the Royal Society B vol. 244, p. 459.
Simpkins, K. (1974). The Late-Glacial Deposits at Glanllynnau, Caernarvonshire. In New Phytologist
vol. 73, pp. 605-618. Sparks, B. W. & West, R. G. (1972). The Ice Age Britain. Methuen: London. Spielhagen, R. F., Erlenkeuser, H. & Siegert, C. (2005). History of freshwater runoff across the Lap-
tev Sea (arctic) during the last glaciation. In Global and Planetary Change vol. 48(1-3), pp. 187-207. Spurk, M., Friedrich, M., Hofmann, J., Remmele, S., Frenzel, B., Leuschner, H. H. & Kromer, B. (1998). Revisions and extension of the Hohenheim oak and pine chronologies: new evidence about the timing of the Younger Dryas/Preboreal Transition. In Radiocarbon vol. 40(3), pp. 1107-1116.
Stiebich, M., Mingram, J., Han, J. & Liu, J. (in press). Late Pleistocene spread of (cool) temperate
forests in Northeast China and climate changes synchronous with the North Atlantic region. In Global and Planetary Change.
Stute, M., Clement, A. & Lohmann, G. (2001). Global climate models: Past, present and future. In Proceedings of the National Academy of Sciences vol. 98(19), pp. 10529-10530.
Sutherland, D. G. (1984). Modern glacier characteristics as a basis for inferring former climates with
particular reference to the Loch Lomond stadial. In Quaternary Science Reviews vol. 3, pp. 291-309. Taylor, K. C., Mayewski, P. A., Alley, R. B., Brook, E. J., Gow, A. J., Grootes, P. M., Meese, D. A., Saltzman, E. S., Severinhaus, J. P., Twicker, M. S., White, J. W. C., Whitlow, S. & Zielinski, G. A. (1997). The Holocene-Younger Dryas Transition Recorded at Summit, Greenland. In Science vol.

Geog. Bsc.(hons.) 5831914
72
278(5339), pp. 825-827. ter Braak, C. J. F. & Juggins, S. (1993). Weighted averaging partial least squares regression (WA-
PLS): an improved method for reconstructing environmental variables from species assemblages. In Hydrobiologica vol. 269-270(1), pp. 485-502
Thomas, E. R., Wolff, E. W., Mulvaney, R., Steffnsen, J. P., Johnsen, S. J., Arrowsmith, C., White, J. W. C., Vaughn, B. & Popp, T. (2007). The 8.2ka event from Greenland ice cores. In Qua-ternary Science Reviews vol. 26, pp. 70-81.
Tokeshi, M. (1995). Life cycles and population dynamics. In Armitage, P. D., Cranston, P.S. & Pinder,
L. C. V., eds. (1995). The Chironomidae: Biology and Ecology of non-biting midges. Chapman & Hall: London.
Tolan-Smith, C. (1998). Radiocarbon chronology and the lateglacial and early postglacial resettlement
of the British Isles. In Quaternary international, vol. 49-50, pp. 21-27. Upham, W. (1895). The Glacial lake Agassiz. USGS: Washington. Walker, I. R. (2007). The WWW Field Guide to Fossil Midges. Available from (http://www.paleolab.ca/wwwguide/) Walker, I.R. (2001). Midges: Chironomidae and related diptera. In Smol, J.P, Birks, H.J.B. & Last,
W.M. (eds.) Tracking Environmental Change Using Lake Sediments Vol.4: Zoological Indicators. Kluwer: London.
Walker, I. R. & Paterson, C. G. (1985). Efficient separation of subfossil Chironomidae from lake sedi-
ments. In Hydrobiologica vol. 122(2), pp. 189-192. Walker, I.R., Smol, J.P., Engstrom, D.R. & Birks, H.J.B. (1991). An assessment of Chironomidae as
quantitative indicators of past climate change. In Canadian Journal of Fisheries and Aquatic Sci-ences vol. 48, pp. 975-987.
Walker, I.R., Smol, J.P., Engstrom, D.R. & Birks, H.J.B. (1992). Aquatic invertebrates, climate,
scale, and statistical hypothesis testing: a response to Hann, Warner, and Warwick. In Canadian Journal of Fisheries and Aquatic Sciences vol. 49, pp. 1276-1280.
Walker, M. & Lowe, J. (2007). Quaternary Science 2007: a 50-year retrospective. In Journal of the Geological Society, London vol. 164, pp. 1073-1092.
Walker, M. J. C. (1980). Late-Glacial history of the Brecon Beacons, South Wales. In Nature vol. 287,
pp. 133. Walker, M. J. C. (1982). The Late-Glacial and Early Flandrian Deposits at Traeth Mawr, Brecon Bea-
cons, South Wales. In New Phytologist vol. 90(1), pp. 177-194. Walker, M. J. C. (1987). Chironomidae (Diptera) in Paleoecology. In Quaternary Science Reviews vol.
6, pp. 29-40. Walker, M. J. C. (1995). Climate changes in Europe during the last glacial/interglacial transition. In

Geog. Bsc.(hons.) 5831914
73
Quaternary International vol. 28, pp. 63. Walker, M. J. C. (2005). Quaternary Dating Methods. Wiley: New York. Walker, M. J. C., Bohncke, S. J. P., Coope, G. R., O’Connell, M., Usinger, H. & Verbruggen, C. (1994). The Devensian/Weichselian Late-glacial in northwest Europe (Ireland, Britain, north Belgium, The Nethlands, northwest Germany). In Journal of Quaternary Science vol. 9(2), pp. 109-118.
Walker, M. J. C., Coope, G. R., Sheldrick, C., Turney, C. S. M., Lowe, J. J., Blockley, S. P .E., Harkness, D. D. (2003). Devensian Lateglacial environmental changes in Britain: a multi-proxy envi-ronmental record from Llanilid, South Wales, UK. In Quaternary Science Reviews vol. 22(5-7) pp. 475-520.
Wang, Y., Francis, D. R., O’Brien, D. M., Wooler, M. J. (2008). A protocol for preparing subfossil chi-
ronomid head capsules (Diptera: Chironomidae) for stable isotope analysis in paleoclimate recon-struction and considerations of contamination sources. In Journal of Paleolimnology vol. 40(3), pp. 771-781.
Wiederholm, T. & Eriksson, L. (1978). Subfossil chironomids as evidence of eutrophication in Ekoln Bay, Central Sweden. In Hydrobiologica vol. 62(3), pp. 195-208. Wiederholm, T. (1979). Chironomid remains in recent sediments of Lake Washington. In Northwest Science vol. 53, p251.
Wiederholm, T. (1983). Chironomidae of the Holarctic region. Keys and diagnoses. Part I. Larvae. In Entomologica Scandinavica Supplements vol.19, pp. 1-457. Woodcock, N. A. & Strachan, R. A. (2000). Geological History of Britain and Ireland. Blackwell: Lon-don. Wooler, M. J., Francis, D., Fogel, M. L., Miller, G. H., Walker, I. R. & Wolfe, A. P. (2004). Quantita-
tive palaeotemperature estimates from δ18O of chironomid head capsules preserved in arctic lake sediments. In Journal of Paleolimnology vol. 31, pp. 267-274.

Geog. Bsc.(hons.) 5831914
74
Appendix a: A sample chironomid count sheet S
am
ple
ID
: A
58
Slid
e n
o.:
1 (
left
co
ver)
Tri
be
Sp
ecie
s
Typ
e
Co
nd
itio
n
Siz
e
Wh
ole
?
No
tes
M
icrotendipes
pedellus
g
m
y
M
icrotendipes
pedellus
m
m
h
Tanypodinae
m
s
y
Einfeldia
pagana
m
s
h
M
icrotendipes
pedellus
m
m
h
Chironomini
p
m
h
G
lyptotendipes
palle
ns
m
m
y
?
p
m
y
poss. Microtendipes?
M
icrotendipes
pedellus
g
m
h

Geog. Bsc.(hons.) 5831914
75
1 km
Appendix b: The glacial evidence from the Llyn Arenig Fawr area. a) Diagram from Hughes, 2002. b) Digital 2½-D satellite image overlain on a DEM of the Llyn Arenig Fawr, from Google, 2008
a
b

Geog. Bsc.(hons.) 5831914
76
Appendix c. A full list of taxa encountered in the study Including generic groups and statistics.
Number of
samples presence Hill’s n2 diversity
index Mean value
Standard Deviation
Undiff. chironomid 30 3.80763 17.9722 Undiff. tanypodinae 22 3.67517 4.29412 12.3349 Thienemannimyia 2 2 0.058824 0.235294
paramerina 2 2 0.117647 0.470588 Procladius 2 2 0.058824 0.235294 Ablabesmyia 2 2 0.058824 0.235294
Undiff. chironomini 15 3.6608 1.5 4.31822 Microtendipes pedellus 29 3.74627 10.7353 30.5073 Endochironomus impar 3 2.46154 0.235294 0.842225
Endochironomus albipennis 6 2.57143 0.882353 3.08473 Einfeldia pagana 7 3.22581 0.588235 1.81688
Glptotendipes pallens 4 2.77778 0.294118 0.986062 Glyptotendipes barbipes 6 3.16129 0.411765 1.28607 Glyptotendipes severini 6 3.33333 0.294118 0.892103
Sergentia 3 2.57143 0.176471 0.616946 Chironomus plumosus 4 3 0.176471 0.567274
Dicrotendipes 3 2.66667 0.117647 0.403274 Dicrotendipes nervosus 2 2 0.058824 0.235294
Omisus 3 2.66667 0.117647 0.403274 Paratendipes nudisquama 2 2 0.058824 0.235294 Chironomus anthracinus 4 3 0.176471 0.567274 Polypedilum sordens 10 3.46154 0.882353 2.62078
Polypedilum nubeculosum 17 3.69515 2.35294 6.73831 Undiff. Tanytarsini 19 3.66369 1.88235 5.41656
Tanytarsus 6 3.33333 0.294118 0.892103 Microspectra 4 2.90909 0.235294 0.769217
Tanytarsus lactescens 2 2 0.058824 0.235294 Microspectra radialis 10 3.44898 0.764706 2.27595 Microspectra pallidula 2 2 0.058824 0.235294
Microspecta insignilobus 2 2 0.058824 0.235294 Propsilocerus 2 2 0.058824 0.235294 Paratanytarsus 5 3.2 0.235294 0.729981 constempellina 5 3.2 0.235294 0.729981
Tanytarsus pallidicornis 7 3.42857 0.352941 1.05391 Tanytarsus lugens 2 2 0.058824 0.235294 Pseudochironomus 11 3.53922 1.11765 3.27885
Undiff. Orthocladiinae 16 3.68345 1.41176 4.05018 Pseudorthocladius 6 3.27273 0.352941 1.08146
Heterotrissocladius maeaeri 2 2 0.058824 0.235294 Psectrocladius 3 2.66667 0.117647 0.403274
Cricotopus intersectus 3 2.66667 0.117647 0.403274 Cricotopus bicinctus 2 2 0.058824 0.235294 Corynoneura artica 2 2 0.058824 0.235294 Paracricotopus 2 2 0.058824 0.235294
Eukiefferiella fittkaui 2 2 0.058824 0.235294 Undiff. Diamesinae 3 2.66667 0.058824 0.201637
Psectrocladius sordidellus 15 3.64939 2.61765 7.54892 Psectrocladius calcaratus 5 3.2 0.235294 0.729981 Psectrocladius barbatipes 3 2.66667 0.117647 0.403274
Pseudodiamesa 3 2.66667 0.117647 0.403274 Pseudosmittia 2 2 0.058824 0.235294

Geog. Bsc.(hons.) 5831914
77
0 2 4 6 8 10 12 14 16 18
Component
0
8
16
24
32
40
48
56
64
Eigenvalue %
Appendix d: PCA analysis results and notes on the method.
All taxonomic groups were included in the PCA. PCA was performed using PAST (Hammer et al. 2001), although the inclusion of only group level taxonomic ranks does improve the scores. The top figure shows the PCA for samples, showing that the populations in each sample are respond-ing predominantly to the first axis. The bottom figure shows the drastic reduction in eigenvalue% for each subsequent axis after the first.
-1.0 0.0 1.0 2.0 3.0
-1.0
0.0
1.0
2.0
Component 1
Component 2
PCA Scores (samples)