palaeoecological studies of selected mires in the...
TRANSCRIPT

PALAEOECOLOGICAL STUDIES OF SELECTED MIRES IN THE CRAVEN
DISTRICT OF WEST YORKSHIRE WITH SPECIAL REFERENCE TO
THE LATE DEVENSIAN PERIOD AND THE ULMUS DECLINE
Submitted in accordance with the requirements for
the degree of Doctor of Philosophy
by
Ernel Oybak L..-
Department of Pure and Applied Biology
The University of Leeds
March 1993

PALAEOECOLOGICAL STUDIES OF SELECTED MIRES IN THE CRAVEN
DISTRICT OF WEST YORKSHIRE WITH SPECIAL REFERENCE TO
THE LATE DEVENSIAN PERIOD AND THE ULMUS DECLINE
Submitted in accordance with the requirements for
the degree of Doctor of Philosophy
by
Emel Oybak -,:...-
Department of Pure and Applied Biology
The University of Leeds
March 1993

Summary
Figures
Plates
Tables
CONTENTS
Tables and diagrams enclosed in pocket
Acknowledgements
1. INTRODUCTION
2. THE PHYSICAL BACKGROUND
2.1. Geology
2.1.1. The Pre-glacial Period
2.1.2. The Glacial Period
2.1.3. The Postglacial Period and the Present
Landscape
2.2. Climate
2.3. Soil 2.4. Vegetation
3. THE HISTORICAL BACKGROUND
4. MATERIALS AND METHODS
4.1. Collection and storage of samples
4.2. Macrofossil analyses
4.2.1. Determination of macrofossils
4.2.2. Presentation of macrofossils
4.3. Microfossil analyses
4.3.1. Preparation of samples for pollen counts
4.3.2. Counting procedure
4.3.3. Radiocarbon dates
4.3.4. Calculations and construction of the
pollen diagrams
4.4.4. Zonation of the pollen diagrams 5. SNIDDLE MOSS
5.1. Description of site
5.2. Stratigraphy
5.3. Macroscopic fossils
5.4. Microscopic fossils and local pollen
assemblage zones
i
ii
ii
iii
v
1
6
6
6
10
14
16
20
22
25
33
33 33
34
35
35
35
36
36
37
38
39
39
39 42
42

5.5. A tentative correlation of the local pollen
assemblage zones for the three cores from
Sniddle Moss
5.6. A reconstruction of the local vegetational
succession at Sniddle Moss
6. THIEVES' MOSS
6.1. Description of site
6.2. Stratigraphy
6.3. Macroscopic fossils
6.4. Microscopic fossils and local pollen
assemblage zones
6.4. A tentative correlation of the local pollen
assemblage zones for the three cores from
Thieves' Moss
6.6. A reconstruction of the local vegetational
succession at Thieves' Moss
7. SUNSET HOLE
7.1. Description of site
7.2. Stratigraphy
7.3. Macroscopic fossils
7.4. Microscopic fossils and local pollen
assemblage zones
7.5. A reconstruction of the local vegetational
succession at Sunset Hole
8. A RECONSTRUCTION OF THE REGIONAL VEGETATIONAL
SUCCESSION AND ENVIRONMENT
8.1. Lateglacial
8.2. Flandrian (Postglacial)
9. DISCUSSION
9.1. Lateglacial
9.2. Flandrian (Postglacial)
10 Conclusion
APPENDIX 1
APPENDIX 2
APPENDIX 3
APPENDIX 4
APPENDIX 5
APPENDIX 6
APPENDIX 7
56
60
67
67
67
71
71
76
78
82
82
82
83
83
85
88
88
97
116
116
124
136
139
140
142
143
146
147
148

APPENDIX 8 APPENDIX 9 APPENDIX 10 REFERENCES
149
150 152 169

Summary
(1) Percentage and absolute pollen diagrams are presented for a lowland si te, Sniddle Moss, and two upland si tes, Thieves' Moss and Sunset Hole, in the Ingleborough Region, the Craven District, north-west Yorkshire.
(2) The analysis of the earliest sediments of Sniddle Moss and Thieves' Moss suggests the existence of a Lateglacial sequence. A reconstruction of the regional vegetational succession mainly based on the Sniddle Moss 4 data reveals that at first a very open vegetation and a species-rich calcareous grassland were formed. The spread of juniper scrub preceded the expansion of tree birches. It is tentatively inferred that the early part of the Lateglacial is interrupted by a phase of deteriorating climate and that the relative warmth of the Lateglacial Interstadial gives way to a further and more prolonged deterioration. The climatic deterioration of the Younger Dryas Period is clearly registered by the decline of thermophilous taxa and the local severity of conditions demonstrated by the increased abundance of chianophilous taxa and other montane herbs in the profile of both Sniddle Moss (4) and Thieves' Moss (2).
(3) The ensuing amelioration in climate at the beginning of the Flandrian (early and middle) is traced.
(4) It is suggested that the woodland vegetation was being managed by the local Mesolithic and early Neolithic population prior to the first classical elm decline of the Atlantic/Sub-Boreal transition (c. 5000 BP).
(5) Pollen analysis involving continuous sampling across the elm decline at Sniddle Moss (9) and Sunset Hole permitted a detailed reconstruction of the vegetational changes and the observation of the nature of the elm curve. A chronology for Sniddle Moss (9) is provided by radiocarbon dating. The initial recovery of elms is dated to 4710±45 BP and the second elm decline to about 4520 BP. The possible factors contributing to the first classical elm decline and the changes in the elm curve immediately following the first decline are considered.

i
Figures
Figure 1.1. Map of the Craven District showing
the location of the study sites.
Figure 2.1.1. Geological sketch map of the
district around Ingleborough
(modified from Dunham et al., 1953).
Figure 2.1.2. Diagram showing the geological
succession of Carboniferous strata
forming the Ingleborough Massif
(taken from Swales, 1987).
Figure 2.1.3. Glacial features of the Settle
District (Source: Arthurton et al.,
1988).
Figure 2.1.4. Drumlins in the Ribble-Aire Valleys
(Source: Raistrick, 1930).
Page
2
7
9
12
13
Figure 2.2.1. Mean monthly precipitation, Malham 18
(1881-1915) (taken from Jones, 1977).
Figure 3.1. Map showing the position and age of 31
some archaeological remains in the
Ingleborough Region.
Figure 5.2.1. Stratigraphy across Sniddle Moss. 40
Figure 5.4.1. Deposition time (yr cm- 1 ) for Sniddle 51
Moss 9 (between 14-502 em). Also shown
are radiocarbon dates.
Figure 5.4.2. Total pollen influx (grains cm- 2 yr-1 ) 52
and radiocarbon years for Sniddle
Moss 9 (between 14-502 em).
Figure 5.5.1. A tentative correlation of the local 57
pollen assemblage zones from Sniddle
Moss and the (supposed) equivalent
Flandrian chronozones.
Figure 5.5.2. Graph of peat growth rates for the
Sniddle Moss 9 diagram (between
14-502 em).
Figure 6.2.1. A section of Thieves' Moss (taken
from Gosden, 1965).
Figure 6.5.1. A tentative correlation of the
59
69
77

ii
local pollen assemblage zones from
Thieves' Moss and the (supposed)
equivalent Flandrian chronozones.
Figure 8.1.1. Comparability of the local pollen
assemblage zones and sediment
stratigraphies for Sniddle Moss 4
Thieves' Moss 1 and 2.
Figure 8.2.1. A tentative correlation of the
Flandrian local pollen assemblage
zones of the study sites and the
(supposed) equivalent Flandrian
chronozones.
Figure 9.1.1. Locations of Lateglacial sites in
Britain and Ireland referred to in the
text.
Plates
Plate 1.1. Ingleborough overlooking SNIDDLE MOSS,
viewed from the south.
Plate 6.1.1. The basin of Thieves' Moss, viewed
Tables
from the west showing the three coring
sites.
Table 2.2.1. Daily mean temperatures around Malham
Tarn (taken from Jones, 1977).
Table 2.2.2. Average annual precipitation for the
Craven area (after Gosden, 1965).
Table 2.2.3. Average annual rainfall in Lowland
Craven (after Jones, 1977).
89
98
117
3
68
17
19
19
Table 8.1.1. Vegetational reconstruction of the 90
Lateglacial Period for the Ingleborough
Region on the observed pollen
stratigraphy of Sniddle Moss (and
Thieves' Moss).
Table 8.2.1. Sites frequently referred to in the
text.
Table 9.1.1. The proposed climatostratigraphic
correlation of the pollen sequence
at Sniddle Moss 4 (and Thieves' Moss)
with the scheme of Lowe and Gray (1980).
99
118

iii
Tables and diagrams enclosed in pocket
Table 5.3.1. Macroscopic fossils from SNIDDLE MOSS 4.
Table 5.3.2. Macroscopic fossils from SNIDDLE MOSS 9.
Table 5.3.3. Macroscopic fossils from other sampling
points, which have not been found in the
profiles of SM4 and SM9.
Table 6.3.1. Macroscopic fossils from THIEVES' MOSS.
Diagram 5.4.1. SNIDDLE MOSS 4 (Percentage Pollen Diagram).
Diagram 5.4.2. SNIDDLE MOSS 4 (Percentage Pollen Diagram/
Lateglacial). Diagram 5.4.3. SNIDDLE MOSS 4 (Concentration Pollen
Diagram/Lateglacial).
Diagram 5.4.4. SNIDDLE MOSS 4 (Percentage Pollen Diagram/
Flandrian). Diagram 5.4.5. SNIDDLE MOSS 4 (Concentration Pollen
Diagram/Flandrian).
Diagram 5.4.6. SNIDDLE MOSS 4a (Percentage Pollen
Diagram).
Diagram 5.4.7. SNIDDLE MOSS 4a (Concentration Pollen Diagram).
Diagram 5.4.8. SNIDDLE MOSS 9 (Percentage Pollen Diagram).
Diagram 5.4.9. SNIDDLE MOSS 9 (Influx Pollen Diagram).
Diagram 5.4.10. SNIDDLE MOSS 9 (Percentage Pollen Diagram/
The Ulmus Decline). Diagram 5.4.11. SNIDDLE MOSS 9 (Influx Pollen Diagram/The
Ulmus Decline).
Diagram 6.4.1. THIEVES' MOSS 1 (Percentage Pollen
Diagram).
Diagram 6.4.2. THIEVES' MOSS 1 (Concentration Pollen
Diagram).
Diagram 6.'4.3. THIEVES' MOSS 2 (Percentage Pollen
Diagram).
Diagram 6.4.4. THIEVES' MOSS 2 (Concentration Pollen Diagram).
Diagram 6.4.5. THIEVES' MOSS 3 (Percentage Pollen
Diagram).
Diagram 6.4.6. THIEVES' MOSS 3 (Concentration Pollen
Diagram).
Diagram 7.4.1. SUNSET HOLE (Percentage Pollen Diagram).

iv
Diagram 7.4.2. SUNSET HOLE (Concentration Pollen Diagram).
Diagram 7.4.3. SUNSET HOLE (Percentage Pollen Diagram/The
Ulmus Decline).
Diagram 7.4.4. SUNSET HOLE (Concentration Pollen Diagram/
The Ulmus Decline).

v
Acknowledgments
I am indebted to Dr D. D. Bartley, who is the supervisor
of this study, for his sustained interest, advice and
unlimited patience, and for his untiring help in field
work.
My thanks are due to Mr Paul Field for his invaluable
assistance in the field and in running the "Ti1ia Software
Package"; to Professor C. D. Pigott and M. E. Pigott
for bringing the Snidd1e Moss site to my attention and
access to the preliminary 1ihto10gica1 and pollen
analytical da ta; to Mr Tom B10ckee1 and Dr J. H. Dickson
for their help in identifying the mosses from Snidd1e
Moss; to Mr Albert Henderson for his encouragement during
the study of the fossil oospores of Characeae from the
study sites; to J. A. Moore and D. M. John of the British
Museum (Natural History) for useful discussions
and giving of their advice concerning Characeae oospores;
to Mr Adrian Hick for his invaluable assistance
in the SEM; to Cem Sara~ who drew Figure 5.2.1.; to the
Natural Environment Research Council, Dr D. D. Harkness
for the determination of the radiocarbon ages; to Mr
Peter Haw who allowed access to his land (Crummack Farm);
to my parents and friends for their psychological support
throughout, and to the University of Hacettepe (Ankara,
Turkey) for its sponsorship.

I N G L E B 0 R 0 UGH

1
1. INTRODUCTION
The Ingleborough Region, in which the study areas lie,
forms the western margin of the Craven District (Figure
1.1.). It displays strongly contrasting scenery with
a wide variety of geological formations and structures
due to the various geological events, which have shaped
the landscape over the years. The area to the north-east
dominated by the peaks of Whernside (NGR SD 7381), Pen
y-ghent (NGR SD 8373), and Ingleborough (NGR SD 7474)
shows an abundant limestone cliff scenery. The limestone
country is cut off abruptly by the dislocation of the
Craven Faults running north-west to south-east. South
of the faults lies the western part of the Craven
Lowlands which is mainly undulating pastoral country
shrouded in thick glaCial deposits, with the very minimum
of rock features.
The si tes selected for this study, wi th the exception
of Sniddle Moss, lie on the Ingleborough Massif within
the limestone upland. The Ingleborough Massif is situated
in the Yorkshire Dales National Park (NGR SD 77). It 2 spreads over an area of about 65 km • Above the plateau,
Ingleborough hill rises to 723 m (MSL), extending south
west and overlooking the lowlands e. g. Sniddle Moss
on Newby Moor near Clapham in the south of the
Ingleborough Region (Plate 1.1.).
Previous palaeobotanical investigations undertaken in
Upland Craven (Pigott & Pigot t, 1959 and 1963), in the
lowlands (Jones, 1977; Bartley et al., 1990) and on the
Ingleborough Massif (Gosden, 1965; Swales, 1987) have
provided data relating to the vegetational history of
parts of the Craven District, which has encompassed mainly
Flandrian events. It is particularly noticeable in most
of the diagrams from the region that there is a lack
of clear lithological evidence for deposits of Devensian

WHERNSIDE.
N t
tiT TON U Hat R S
Pl,ott , Pl •• tt. 1959 ond 1963 t. Tar" Ho •• C .. d ... 1965 Z. Halw1th Ko •• l. Ho~r.k. Rock. 4. "o •• hton r.ll 5. Scar Clo •• 6. Thi., •• ' Mo •• Jo •••• 1977; 8a.cl., ££ £1 .. 1990 7. Eahto. Tar. 8. Lhton Il1r .. 9. Marton. BO'b
10. Tbr.shfl.1d K ••• 11. WhiU :to .. Sval ... 1987
IZ. Allot ••• t Shootl., BOI 13. Ark. 14. arslth".it. Wife Holo 15. Hut Clrclo 16. Sl ••• Fell 17. SuH .. Pot 18. Su ... t Hole Author 6. Thie' •• ' Ho ••
18. Su .. ot Hole 19. S.iddl. Kos.
2
YORKSHIRE DALES
NATIONAL PARK
11·
PEN-Y-GHENT .-.
\ \ ..r
'\ ~\ \ ~ ~ 0;.
Figure 1.1. Map of the Craven District showing the location of
the study sites.

3
I ngleboroug h .1,
Plate 1.1. Ingleborough
SNIDDLE MOSS,
from the south .
overlooking
viewed

4
Lateglacial age (usually abbreviated to 'Lateglacial').
In spite of its brief duration (from c. 13,000 to 10,000
BP) the Lateglacial was an important transitional period
from the climatic regime of arctic severity that prevailed
for much of the Late Devensian to the markedly warmer
conditions of the Flandrian ('Postglacial') that followed.
In the study area only the findings from two upland sites,
Malham Tarn Moss (Pigott & Pigott, 1959 and 1963) at
c. 400 m and Thieves' Moss (Gosden, 1965) at c. 348 m
have shed some light on this period. It must however
be noted here that there is no concentration diagram
and, indeed, no published diagram from Thieves' Moss.
In the lowland part of the region only Sniddle Moss (at
c. 160 m) is known to contain deposits of the Lateglacial
Period. The data from a large number of Lateglacial sites
collectively suggest local differentiation in Lateglacial
vegetation patterns due to variations in plant response
to climatic change at different altitudes, and also to
such microscale factors as edaphic condi tions, exposure,
aspect and so on (Pennington, 1977). One of the main
aims of this study is therefore to look at Lateglacial
deposits of a valley bog at low altitude, Sniddle Moss
in an area of glacial drift and a raised bog, Thieves'
Moss on limestone at high altitude (c. 8 km from Sniddle
Moss):
(a) in order to provide some complementary and comparative
data for the region and
(b) to assess basically how short-lived climatic
fluctuations and environmental changes of this interesting
period (the Lateglacial) shaped the vegetation succession
of the Ingleborough Region.
The other aim is to look at the Ulmus (elm) decline.
Recent changes in elm populations brought about by Dutch
Elm Disease have raised questions about the nature of
the Neolithic Elm Decline, particularly its possible
association with human interference in the forest. It

5
was therefore decided to study the elm decline in detail
through close contiguous samples and radiocarbon dating
- again at low altitude and at higher altitude sites.
Because the elm decline is too close to the eroded surface , of Thieves' Moss, one other upland site on the
Ingleborough Massif, Sunset Hole at 393 m has been
selected. The sediments containing the desired periods
of this site and Sniddle Moss have been examined in detail
for this purpose.

6
2. THE PHYSICAL BACKGROUND
2.1. Geology
The geology of the Ingleborough Region constitutes a
very small part of a very complicated picture. Over most
of the area the rocks showing great contrasts are very
nearly horizontal and the significant breaks in the'
landform pattern are produced by major faults. The
Carboniferous Limestone dominates the Region, along with
Millstone Grit, and with some Coal Measures (Figure
2.1.1.).
The account of the geology of the area can be given in
three main sections, in time sequence, dealing with the
contribution of pre-glacial, glacial and post-glacial
periods to the present landscape.
2.1.1. The Pre-glacial Period
The main structural elements belonging to the Pre-Glacial
Period are the Askrigg Block lying to the north and the
Bowland Block which occupies much of the southern part
of the Ingleborough Region. The South Craven Fault is
usually taken as a boundary between these two blocks
which constituted two entirely different depositional
environments during the Carboniferous Period.
As defined in Figure 2.1.1. the Ingleton Group sediments
(sandstones, siltstones and conglomorates) are the oldest
rocks which were folded in pre-Ashgill times associated
with tectonism (early Arenig Age). The deformed Group
forms part of a belt of magnetic basement rocks, the
Fu'rness-Ingleborough-Norfolk Ridge (Wills, 1978). In
the Ingleborough Region it can be seen in two localities
in the north of the North Craven Fault - the Chapel-Ie
Dale inlier, near Ingleton and the Horton-in-Ribblesdale
inlier on the east, though there is no exposure

CARSOtIIf fROVS
I.M Co;..,o •••• t. Coal ......... .
. Kllhton. lI.it
'oredele a.4.
Or •• t &ear Lt ••• to".
Scale or miles o , 2
Figure 2.1.1.
IHU";'~-~;;;i '6 V&QIK{t II •• hin. for •• t IOfte . " .•
Auat.vlcta and A"co. . " for •• Uona N ~ 0,,-
C;::::::. SILURIAII
OAOO.1CUW ~ V7'7J'l1 ConlSlOft UndUfe .. e"t.hted ~ Ll •• ston_ Croup
~Jn.l.tO" fJrtJUP (A.h~1111 '~~~~ri~~~~Ii~~ L.:a.J (Ar."l.,
3 4 5
Geological sketch map of the district around Ingleborough (modified from Dunham et al., 1953).
......

_. _ff1lOU5
I· Rod CO~'lo .... to
Coal " ••• Ut ••
.. Kliletone fJrU
Votedel. a .. ct.
Oreat Sear Liaf-stone
Scale ormiles o t 2
Figure 2.1.1.
. __ .... A"
1:::~:~n;I~~r .. ttOh-'.''''"''''" Au.tvlc=k and Areo.
for •• tlon!t
Cru ••• c k 5 1 LUll All rOI' •• tlon r12"1tA
OROOYt CUtf ~
~ Conl,ton UndHf.nnthted ~ Llaeston. Group
(Ash4l1lJ
c----:1 ln,hton O"I)UP l-:.a.J (Aran 1,)
3 4 5
Geological sketch map of the district around T nn l .. hnrnlloh (modified from Dunham et al., 1953).
-....J

8
known within the study area.
The Ingleton Group is overlain by Lower Palaeozoic strata.
Both Ordovician and Silurian rocks are found and crop
out in a series of inliers ( the Craven Inliers), along
its southern margin. The Silurian formations,
particularly, cover considerable areas - mainly Silurian
grit and sandstones.
The interval from end-Silurian to early Carboniferous
times is unrepresented in the known sedimentary
succession. However, Leeder's study (1982) reveals that
in the late Devonian to early Carboniferous times the
main structural elements of the region, the Askrigg Block
and the Bowland Block, were areas of relatively high
crustal buoyancy as a result of crustal stretching.
Carboniferous rocks are widespread in the region. Lower
Carboniferous strata have been shown on the Askrigg Block
but their existence remains unproved beneath the Silesian
cover of the Bowland Block. On the Askrigg Block the
Carboniferous Limestone Series form a succession of
predominantly carbonate rocks up to 500 m thick, resting
unconformably on Lower Palaeozoic rocks and overlain
by Upper Carboniferous strata (Silesian). They are
unfolded; but show a gentle tilt (3_5 0 ) to the north-
north-east on the Ingleborough Massif (Figure 2.1.2.).
The two thousand feet (610 m) or so of Great Scar
Limestone and Yoredale Series replace the Carboniferous
Limestone, with comparatively little faulting. The plateau
of the Ingleborough Massif is formed by the upper eroded
surface of the Great Scar Limestone bed. The Yoredale
Series are well exposed on
and are responsible for
the flanks of
a broad-featured
step-topography in the north of the region.
Ingleborough
country of
The main outcrops of Upper Carboniferous strata are mainly
Millstone Grit Series and some Coal Measures on the
Bowland Block. On the Ingleborough Massif lying on the

Figure
wsw
limestone
sandstone & shales
CARBONIFEROUS
:.::":::: -ft- -;: -;-. . . . . . . .
Hi] lstone Grit ---~"-~J> Yoredalc Beds
Gl'cal. Scar l.imestonc_ r I UNCONFORHITY -:c:
-
2.1.2. Diagram showing the geological succession of strata forming the Ingleborough Massif (taken 1987).
ENE
Carboniferous from Swales.
\0

10
Askrigg Block, Millstone Grit Series form a small outlier ,
which caps the Yoredale Beds of Ingle borough. The
Westphalian strata dominate the western end of the region.
There is no direct evidence about the geological history
of the area during Mesozoic and Tertiary times. If
the formations of Mesozoic Period ever occurred they
have been removed by denudation and during the Tertiary
Period the region seems to have experienced prolonged
erosion. The summit of Ingleborough and surrounding hills
represent an ancient erosion surface at 610 m. The Glacial
and Recent deposits are thus the only records of
deposition within the area since the Permo-Triassic
Period.
2.1.2. The Glacial Period
Pleistocene
was occupied
deposits show
by ice-sheets
the Quaternary but only
that the Ingleborough Region
on several occasions during
the effects of the Last
Glacia tion can be recognised in the area. Pre-Devensian
deposi ts seem to be very limi ted in extent, since the
last glaciation destroyed almost all records of earlier
Pleistocene events and their deposits. In Victoria Cave
near Settle the Ipswichian interglacial sediments
containing mammalian faunas dated at about 114,000 to
135,000 BP are the only older deposits known in the area
(Arthurton et al., 1988).
Ice entered the area from the north and modified the
local landscapes considerably. Its deposits ('drift')
cover much of the area, and they take several forms,
of which the chief is the general irregular blanket of
boulder clay (till), erratics and drumlins.
Almost everywhere the deposits of boulder clay consist
of unstratified clay soil mixed with boulders and pebbles
of different sizes. Much of the debris is of local
composition derived largely from Carboniferous limestones

11
and sandstones with some Lower Palaeozoic clasts from
the Craven Inliers. It is spread generally over the region
but thickest in the lowlands where it may be more than
20 m thick. It is however patchy over much of the uplands
and absent above about 490 m O.D. The broad swathes of
head above this height suggest that the upward limit
of the boulder clay approximates to the margin of the
ice-sheet against the Pennine flanks (Arthurton II al.,
1988).
A sheet of boulder clay, which is commonly more than
10 m thick, occupies much of the Ri ver Wenning ca tchmen t
area on Newby Moor in the south-west \of the region. This
sheet thins out against the limestone escarpment of
Clapham and Austwick.
Boulders which were brought from a distance and carried
in or on the ice are called erratics. These blocks of
limestone and sandstone are common on some of the
Ingleborough platforms (e.g. Clapham Moor). On the west
side of Crummack Dale, north of Austwick, nearly all
the large erratic boulders of green slates and grits
(Norber erratics; Kendal & Wroot, 1924) carried by the
ice out of Crummackdale and Ribblesdale are now found
on a limestone pedestal of about ten inches in height.
This is a measure of the amount of limestone removed
since the retreat of the ice, by the sol vent action of
the rain (Rais trick & Illingworth, 1959). This subaerial
dissolution of limestone is, in fact, an important erosive
process in Postglacial times.
The drumlins are stream lined low hills with an oval
outline deposited beneath moving ice. They are formed
mainly of till, al though some contain lenses of gravel
or a rock core. The remarkable drumlin fields occupy
chiefly the lowlands of the region, and they trend
generally N-S (Figure 2.1.3.). The direction of their
long axis reflects local direction of glacier movement.
Their orientation (Figure 2.1.4.) mapped by Raistrick
I

12
/~; .. .:;;, '>., :.:\ ............. ; ,. • - ~ , .. ' #. J ..•..... \.. ' , " .• ' ~ • ' ••• ;" f" ." ......• .,...,- I, i
, .. { .............. ' y ~;r • '.. , ~ F .' ...... . ...... , '- . -;P:;; _ .\. :. .. ..' ... ",,'.. ":' ":......... .".::.:::::' .... c..f: p ~' ;~:-. .. '. " . ~'-, ' "" ~ • ••••.• .'. <>/.. ;. •.... "." .•• : ••
.~.~.: .... ~:: .... : .. "'( ....... ,..... ,. J"~
.. :' ... , ~ : ..•... : ", ',. i' '. .i I:' ,,' I '.>~ .... (1/ ..,,;," "t ''';'- ..... :,,,,': "'.,,.' 0 J I ....... .. ". , . ,.' . . ' (. a .~.. ~ ..... .". ,,~'''I.'O''' I') ........ ........ J'/, '~rf ;. /~t
. :;:' • J ,,;. . " . ' - -.. oJ' en '" .' •. ' .,'1'" .1' i"~ ,0" ...., ,7"" '~'--""""' .• ,.... ,( ., '" .~.. ..~. , __ / ....... ,,' < ' ... /".......... ,.J ~:.~. ': .... -I;' 0 .... ..,., .~ . .... . ...... ", /' ". .., .•. " /;: ~ .:" ",. E ~ \. ":,'" /.~ ... \ " ...... ~:II("'! ,,X,., :r'" (.; "
~' ..... rr " ./>:? '. >.:.Y, ;t::;~;r;:····;~/ ~ .' ''i' :g , ..... tJ '<. ~ ... ": .. ' /~/,"" :.." .' .:" ...... . 111 [,,'.,,' '2 · -' ,. _. . •.• , ". • .', I f'-?I "';"')"~ I ,:' I . ./ ~ en
..... 0 \ ;., :'~" ; •.. ;...... ',~ .< <':.; '"i.f"> g. ....". ....•.• ," , ... ,.,' I ., "1''' .... ', • ",. ,;; ....... ,. ....... . ... ' ......... ; ___ ............. / ;; ",.~ .;' .-i/~ , " .I. I" .~ :.0:::" en ~ ..... :.' () ... :.... ...... :.I' .I' "', :." i : '.1' ' , I " I .. ._. .' /. ., ,," . ! " '. .••.. .' ". I ":t'/' 1 '," , ;1' , ,1' I 5= . .., :.: ' .• ~ " '// .•• • 'J'
o .... '".,' = .... '. I; , . .,.' ,'I·r ' · ..:"'''' ,. ') ",.; "./' ~. . " ,f ~.," I,;" I' / ()' ,.,,, ' ,. ..•. ! _~ .. ::............... .., t.....,; 1 ~.' "/' I I \ . I I ' I ~'::'" • ~ ,
'" • \ " : ' II;' , ':.' .Y. I .... · .• · iii,. ;.. ... " • ~ • ."
ii il · G
_ _ -::::' ,,' ,_. / ..... ,. ;.,/7"// 1; ••. / / F' f!;"~ ~ ).......... -
_ ",.' ,I. C.... . ..... ;;: .. ~ ,~.D;.'/ j CJ '" \, ...... . .::.~,~:: -I' .;;...... .,..",.~.: d p~' •... t' '-, ' ", '; -- " .... ')!. .r....... ./ ~ """"'!..o};-. • .:. ,.... • • -- .;"
I: ;$::. ...... :;:.- .,.l .:.>";:6 .... " ... -.::: .. ,, ...... · ....... 1./ " , ~~~~/ ' r.: 11f...... -:. \) ._ .... _" ........ ,. ........ .' , - , __ .' t Je, J ' .>..... ...... """ .... , ....... "'" ",. ...... ~ .' ,.' . . ............ " ~~::.}~: ... ::::::~;;:;::; ........ :.::'.::.S?: ... , .": ... ~::::::.-".~: •• ' • .~~ o.~.~~ .~:£... \ ,,':, ;:, .. I!,·~·~l .. " "
• .... ,' ..... j • ... __ ..... .1' ., J'. '.' -~ .. • CIt • I: • ;; ii il • i3
,,! ! ,{).:::;'" c:}~~-~:~{ ... ~ .. ~.;~ .. ~:; .. ;.}..~'~'~.~wM:; .... · J.--";;": ~ . .: '; i ", ......... .. ~..... ..;;,..../.... eY' - ~ 0 '. ...... • ! -::.... ".. " _. ' 0 .. /' / ... :. •
(.:: , ......... ', .: ~..1?'\ ~ '-::.. - '. .... .,. o~ '!t, -;-;' \ .. '. • .••••• __ :-;.;. : / .... , 'Orr :.. ~'''''H-'''' ........ ",--- .. . ... >
.... 'j .... '~ .. :., 7\ ..... 'f?:;' - J~"'" .,;' J.' • .:..:. ...... - - - .:. .. ..: , ... ". .... _! • ~~ • / - ri'?, .:: ........ . "':.:: .:' .. . \ f), ....... ,.. ,-,' :-,' ~'" ; ,.'_ .... ..... ..' ,.' '7. ~ .... ..., ,~ _. ""..
.'. • " :._..' ......... " .... ":0'" .,' --, '. ; .. :.' ' ..... t. • '" /- J." ,,_.-
.::.. 6//;', ~"'· ..... S..Q. ' · "f" ...... ;.. ./;, 'I ........ . . ;.) ., .. t:, ~/"/'~.f'· l ~) .. : ... ~.::::::: ..... ,: ... '.:' "i::~- ---;~,'I .;' :.: yI!>-'/'; / .... ~ '" ~::::' . ..:.."':-:-....... . ........ - ~"" .' '0 ...• ,,' '. /, ... ~' = • - ". ....... . '.' __ ,.:.: al":.·.., .:....: / ~ .,:: :' .. ,,:
.... ' ./ •... ,. , .. ~, 1'" ' ,-.... ' ...... .; > / / '. '" .. , - .. , .. , ... - .... . . .:./ ~' ' ~, -' .... ;."
-<' ' {". .-~ . '--- \ .. -:".. ;" . ' . " ~~ .... - y'~.'1 I....... "' ...... ' ~~:/ ~ o en 1 ';::) '" ' " '. ': - ,....... -? '/. , ,',' " ..... ~::...:
; y ~~'; '. .' ... ~ .. ;." 11 .'~':i ~ g ~ , .. "" . ., .... ~ •.... ~.,
_ ..... . :.: ..... ,.". .....
::.'
,.. ... ... ..
-· ~ .. c
I
> ... ..
~I ~I
III o s.. =' o
CIl .....,
~ o
N

Scale of miles o 1 2 3 4
1 0' ,
13
.,.'7 Foun~dn. hll
\~ I ,<> \J
o V £ R FL 0 W C H " N N £ L~
DRUMLINS .-
IC! SCRATCH£S ......
IC! MOV£M£NT'---'
CONTOURS .-.-
Figure 2.1.4. Drumlins in the Ribble-Aire Valleys (Source: Raistrick, 1930).

14
(1930) sugges ts that ice funnelled in to the region from
the north and north-west and then moved down in a
southerly direction.
Landforms of glacial erosion are less apparent in the
Ingleborough Region. The solid rocks on the flanks of
some of the drumlins however seem to have been shaped
by moving ice.
The withdrawal of glacier-ice at about 13,000 BP was
followed by a gradual climatic amelioration towards the
close of the Devensian, and periglacial conditions
prevailed wi th widespread fluvial acti vi ty and
solifluction. Meltwater from the decaying ice-sheet
collected in subglacial streams and these incised
channels, extending over several kilometres, in the
underlying boulder clay and bedrock. Examples of glacial
drainage channels, which generally trend subparallel
to the direction of ice-movement are seen near Burn Moor
south of the River Wenning (Figure 2.1.3.). Their floors
are mainly covered by peat; but there are also channels
modified either by the deposition of alluvium or glacial
gravel or by erosion. Sand and gravel deposits are
associated with the channel systems and their landforms
are eskers and kames which consist largely of sand wi th
a veneer of clayey sand and gravel or stony clay. Mounds
of sand and gravel (NGR SD 728700) lie to the north-east
of Newby. Three kame-like mounds (NGR SD 706688; 710685
and 710684) are found on Newby Moor.
Deposits of head formed by solifluction under periglacial
conditions are common in the upland limestone outcrops,
whereas aprons of scree are present below the limestone
scars and cliff, for example those in the valley of
Clapham Beck (NGR SD 763697), north of Austwick.
2.1.3. The Postglacial Period and the Present Landscape
In the Ing1eborough Region the short record of Postglacial

15
time may be found in some deposits such as peats, alluvium
and calcareous tufa.
A blanket of peat resting on head or boulder clay occurs
on the gentler slopes and plateaux of the Ingleborough
Massif. On low ground peat is also present in poorly
drained hollows and mosses as at Sniddle Moss (NGR SD
707695).
In the ca tchmen t of the River Wenning south of Clapham
the alluvium forming the present-day flood plain is the
most extensive of the post-glacial deposi ts wi thin the
drumlin fields. In some areas peat is associated with
the alluvium as at Austwick Moss (NGR SD 761666).
It is largely believed that much of the characteristic
limestone pavement of Craven was developed in the post
glacial period.

16
2.2. Climate
There is no meteorological station within the study area,
but meteorological data have been produced by Manley
(1957) and Lockwood (1967) for several places in the
Craven District. Their results reveal that climatic
variables change with increasing altitude in the region.
Manley (1957) described the climate of the uplands around
Ma1ham Tarn at 395 m as windy, humid and cloudy. As can
be seen from Table 2.2.1. the uplands are cooler than
the lowlands throughout the year.
On the main limestone plateau the mean annual temperature
range is 11. 6 °C, being 2. 3 0 C lower than tha t for
the lowlands. There are, however, temperature inversions
in West Yorkshire. The minimum night temperatures of
the lowlands are often as low, or lower than, the Craven
Uplands.
Air frost in Upland Craven could be expected on about
90 days a year, whereas in the lowlands this is 70 days
of the year.
Winds are predominantly westerly and south-westerly.
Average windspeed for the uplands around Ma1ham Tarn
which is 16 km from the Ing1eborough Massif is 1.5 times
higher than that for Lowland Craven. According to Manley
(1957) under such condi tions local she1 ter in the area
assumes a greater importance for the vegetation.
The effect of altitude can also be seen in differences
in precipitation. The rainfall is more pronounced in
Upland Craven than in the lowlands, being at a minimum
in April-June (Figure 2.2.1. and Table 2.2.2.).

r
Table 2.2.1. Daily mean temperatures around Malham Tarn (taken from Jones, 1977).
Yearly JAN FEB MAR APR MAY JUNE JULY AUG SEPT OCT NOV DEC mean
Da11Y\M lh a am 1.5 1.7 3.4 5.4 8.4 11.6 13.5 13.1 10.8 7.6 4.1 2.2 (1921-50) ° mean I 7 C
t Lowlands 4 4 6 8 11 14 16 16 13 10 6 4 (1916-50) emp. 9.3 0 C
~
Mdeanl
Malham 3.7 3.8 6.5 9.4 13 15.3 17.2 16.5 12.9 10 6.3 4.2 10.1 oC ~ ai y~ ____________________________________________________________________________ _
max. Lowlands 7 7 9 12 16 19 21 20 17 13 9 713°C tern •
Mean Malham -0.7 -0.5 0.3 2.1 4.4 7.4 9.8 9.6 7.6 5.1 1.9 0.2 3.9 0 C daily~ ____________________________________________________________________________ =-
° ruin. Lowlands 2 1 2 3 7 10 12 11 9 7 3 2 5.8 C temp.

150mm
135
120
105 -E E -
90 c: 0
-e':S -0. 75 u 0 '-
Q.,
» 60 -..c: -c: 0 ~
45
30
IS
o
18
I
I J
I I I I I I I I I I. I Jan Feb Mar Apr May Jun Jul Aug Sep Oct f\bv Dec
Figure 2.2.1. Mean Monthly Precipitation, Malham
(1881-1915) (taken from Jones, 1977).

19
Table 2.2.2. Average annual precipitation for the Craven
area (after Gosden, 1965).
STATION NGR ALTITUDE ANNUAL PRECIPITATION
Malham Tarn SD 893672 395 1.53 m
Ribblehead SD 766789 312 2.00 m
Settle SD 702589 252 1.85 m
(Great Bridge)
The average annual rainfall on the limestone uplands
falls in measurable amounts on 220 days. In Lowland Craven
it shows a considerable decrease from west to east (Table
2.2.3.): - (after Jones, 1977)
Slaidburn SE 715549 192 1.57 m
Threshfield SD 995638 180 1.23 m
Gargrave SE 939549 140 1.15 m
Skipton SE 991518 112 0.89 m
(Town Hall)
The areas in the extreme west and at high altitudes
therefore could be more liable to intense soil leaching
and less potential evaporation.
Atmospheric pollution is a further climatic factor in
Craven. Bullock (1971) points out the effect of such
poIlu tion and says that it lowers the pH of rain and
increases weathering potential.

20
2.3. Soil
Crompton (1961) in a general account of the soils of
Yorkshire includes the soils of the Craven District in
two basic types, mountain limestone soils and moorland
soils. More detailed descriptions of soils in the Ma1ham
Tarn area were made by Barratt (1960), Wood (1963), Syers
(1964) and Bullock (1964 and 1971). Bullock (1971) also
gave information relevant to a further 300 km2 of the
Craven District.
The soils of the Ingleborough Region are mainly developed
in drift derived from the underlying rocks (local Silurian
shales, Carboniferous Limestone, Yoredale sandstones,
shales and limestones and Millstone Grit), and only thin
soils on Millstone Grit, and on scree slopes on limestone
are likely to be residual.
Soil types play an important part in determining the
scenery of the Region. The Great Scar Limestone, which
outcrops over so wide an area to the north and the
Millstone Grit of the south have each given rise to
a distinctive soil range.
The major soil groups of the Ingleborough Massif are
rendzinas (calcareous soils), brown earths, podzo1ized
soils, gley soils and organic soils. Transitional forms
also occur, such as brown rendzinas and eutrophic brown
earths which are intermediate between rendzinas and
mesotrophic brown earths. The distribution of the various
soil types in the area is very complex due to variations
in depth and nature of the drift, slope and aspect, though
their morphological grouping is clear. In general,
rendzinas and brown earths are found in thin drift, over
pavement clints or on stable limestone screes and ledges,
all of which receive bases from above compensating for
those lost by leaching. Podzolized soils and gley soils

21
are the most widespread in areas of thick drift where
acid peat surfaces are waterlogged. Even on shallow
soils over limestone there may be extensive acidification
of the surface because the high precipitation!
evapotranspiration ratio ensures intense leaching, with
lost material not replenished by weathering.
From the slopes of the Ingleborough Massif to the valleys
of Newby Moor on the Millstone Grit the drift becomes
deeper and heavier. Thick deposits of clay and clay loam
are common here. Most is poorly drained and strongly
acid with a variable thickness of peat.
At all sites under investigation the main soil types
largely belong to the acid members of the groups - peat
and peaty gleyed podzols, except at Thieves' Moss which
is surrounded by limestone pavements and grassland on
the rendzina soils.

22
2.4. Vegetation
No complete study of the vegetation of the Ingleborough
Region has been made but a very general account has been
given by Raistrick and Illingworth (1959), and a detailed
vegetation survey of the Ingleborough Massif has been
carried out by Bartley and Clark (1979).
A strong contrast between the limestone platform and
the Millstone Grit, which are brought into a sharp
juxtaposition by the faults of Craven, can also be seen
in the plant life. The limestone supports a very large
number of plants associated with a whole complex of soils.
The richness of the flora distinguishes the scenery of
the limestone platform from that of the neighbouring
Millstone Grit. Conversely, the latter favours the
complete dominance of a limited number of species forming
the moorland associations.
THE LIMESTONE PLATFORM
On the limestone trees are rare but they form small
to the
leaving
in Colt
patches on some pavements. This
destruction of the former forest
is attributed
cover
woodlands
Park Wood
only
(NGR
in
SD
certain places, e.g.
by man,
those
775775). Fraxinus excelsior is the
most dominant tree, associated with other trees and shrubs
such as Sorbus aucuparia and Prunus padus. Larch has
been introduced in considerable numbers. There is a rare
type of natural juniper scrub on Moughton (NGR SD 790710).
Ingleborough.
The greater part of the limestone is covered by grassland.
Festuca ovina and other small herbs - Helianthemum and
Thymus drucei become predominant due to intensive grazing.
mainly by sheep. Galium sterneri and Carex caryophyllea
are also characteristic species of the grassland.

..
The pavements of the
assemblage of species.
23
Ingleborough
Upon the
clints only crustose lichens and
the shaded and sheltered fissures
Massif bear a rich
soil-less surface of
mosses grow. Within
having a good soil
development there are, however, quite a number of species.
In the deeper grykes characteristic plants of limestone
woods may be found Actaea spicata, Allium ursinum
Ph!lli tis scolopendrium, Asplenium spp., Mercurialis
perennis, Polystichium aculeatum and Sanicula europaeus.
Shallow grykes support Sesleria albicans, Convallaria
majalis, Trollius europaeus, Geranium sanguineum and
G. lucidum.
Much of the lower slopes of Ingleborough, Pen-y-ghent
and Whernside are masked by a blanket of non-calcareous
glacial drift. Over considerable areas the typical
limestone vegetation is interrupted by the occurrence
of plants characteristic of the acid moorlands. This
on Ingleborough. On the deep is particularly
drift soils the
noticeable
main cover-formers are
Juncus sguarrosus, Molinia caerulea
Nardus stricta,
and Polytrichum
commune. On the wetter parts Nardus stricta and Juncus
sguarrosus communities are replaced by Molinia grassland.
In drier and shallower areas Calluna vulgaris and Empetrum
nigrum-dominated heaths may be found, but heaths are
not common on Ingleborough. Calluna along with Eriophorum
angustifolium tend to be removed by grazing.
Blanket bog communi ties also occur on the higher slopes
of Ingleborough. Deep peat deposits are particularly
dominated by Eriophorum communities.
On the summi ts of
a few species of
the hills of the Ingleborough Region
the Lateglacial flora may be found.
For example, on Ingleberough and Pen-y-ghent Saxifraga
oppositifolia has survived. Again, on Ingleborough Poa
alpina, Saxifraga aizoides and Draba incana grow •

24
THE MILLSTONE GRIT
As mentioned already, a journey down to the
Gri t would show the poverty of the moorland
Millstone
flora and
the dominance established by the more successful species
where there exists a covering of glacial drift of
non-calcareous origin.
Calluna
heath
of the
gallii,
vulgaris
on flat
occurs as a dominant species
or gently sloping ground. The
of the
members
associated flora, such as Erica cinerea, Ulex
Vaccinium myrtillus and V. vitis-idaea form
extensive patches.
Relatively steeper slopes are covered by a Nardus
grassland with Deschampsia flexuosa and Festuca ovina
and many of the moorland plants. In the flatter· and wetter
areas Nardus grassland gives way to Molinia
caerulea-dominated grassland, often on a peaty substrate.
On deep peat with thick textured glacial drift the heath
and grassland communities grade into the characteristic
cot ton-grass moors of the Millstone Gri t, known locally
as mosses - Eriophorum vaginatum and the associated flora,
Eriophorum angustifolium, Erica tetralix, Drosera
rotundifolia and Sphagnum may be found on the wetter
ground, Calluna, Empetrum nigrum and Vaccinium myrtillus
on the drier ,round.
The pattern of vegetation types in the whole region is
controlled by soil and climate but this pattern almost
entirely represents secondary communities. It is obvious
that man's influence has to a large extent overridden
that of climate and soil. Deterioration of soils, caused
by fores t clearance over a long period, together wi th
different grazing regimes would account for the present
distribution of the heath and grassland types.

25
3. THE HISTORICAL BACKGROUND
The Archaeology of the Ingleborough Region
During the cold phases of the glacial period at least
the North of England would have been an unattractive
place for Palaeolithic man. After the retreat of the
ice-sheet in the La teglacial Period there is, however,
the first evidence of human penetration into the Craven
District. Victoria Cave near Settle (I, SD 838650) is
a major site
implements of
BC) {Longworth,
which has yielded
the upper Palaeolithic
1965).
Magdalenian
phase (c.
bone
10,000
As the climate improved during the post-glacial period
the warmer conditions began to favour the development
of vegetation. These changes in climate and vegetation
produced some changes in the animal population and forced
men to find new ways to supplement their diet. New tools
and new forms of weapons were developed by Mesolithic
hunter-gatherers (Tardenoiseans). The frequent discoveries
of their characteristic implements - microlithic flints
- suggest the greater intensity of Mesolithic settlement
in the Craven District (c. 10,250-5650 BP). On the scars
of Ingleborough, particularly near Dowlas Moss some
microli ths have been seen (Swales, 1987). At Stump Cross
(7, SD 088635), near Grassington, on an eastward extension
of the Great Scar Limestone many implements have been
found under the blanket peat bog which may have been
deposited in the Boreal-Atlantic transition (Zone VII
a) or possibly later (Zone VII b) according to Godwin's
zonation. Malham Moor was also visited by Mesolithic
hunters - probably seasonally (Raistrick & Holmes, 1962).
Other finds in this region include a stag-antler harpoon
from Victoria Cave, Settle.
The transi tion from
permanent groups of
nomadic
Neolithic
hunting communities to
farmers was a slow
26
process but it was a tremendous step forward in man's
fight against nature.
The first farmers from the Continent began to reach
Britain during the mid 4th millennium BC (Megaw & Simpson,
1979). Remains of Neolithic settlements in Northern
England indicate that new types of stone and bone
implements gradually came into use. New forms of pottery
and burial customs appeared alongside· simple and old
traditions. Evidence of land· clearance is provided by
the appearance of cereal pollen along with the increase
in herb pollen and the refinement of hand-axe shapes
in flint and stone.
No satisfactory evidence of settlements of this phase
have yet been found in the Craven District. Only some
caves and rock shelters yielded evidence of occupation.
A highly decorated type of pottery assigned to the Late
Neolithic Peterborough Culture of the north has been
iden tified in inha bi ted caves, Swell's and Kinsey Caves,
near Settle and on the verges of the plateau in Elbolton
Cave near Linton (Longworth, 1965). However, Gilks (1973)
says that judging by the fabric of some fragments, the
pottery should be compared with the characteristic wares
of the Midlands and southern England. Other notable finds
come from a number of caves around Settle, such as
Jubilee, Lesser and Raven Scar. These are mostly burials
whose construe tion is similar to megali thic tombs found
in northern England (Gilks, 1973 and 1981). Giants' Graves
on Pen-y-ghen t (NGR SD 857746) (Bennett, 1936) and the
Bordley Circle on Malham Moor (Raistrick & Holmes, 1962)
are examples of such tombs.
On the Ingleborough Massif there are three major records
of Neolithic Age finds: -
(a) At Foxholes (NGR SD 75667147) (Ordnance Survey
Antiquity Number/OSAN SD 77 SE 5), a rock shelter near
Clap dale on the southern edge of the Massif yielded human
remains, bones of red deer, wild ox, wolf and boar,
27
traces of fire-places, charred bones, flint and chert
flakes, a hammer stone and sherds of ~ough pottery.
(b) A gryke on Over Pasture, about 0.7 km west of South
House Farm (NGR SD 787741) revealed a burial and polished
stone axe (OSAN SD 77 NE 11; Gilks & Lord, 1985). The
latter belongs to the Group VI Cumbrian axe type and
seems to be associated with the Late Neolithic and Early
Bronze Age pottery types, AII-Over-Cord, early style
Comb Decorated Beakers and Grooved Ware, covered the
period between c. 4050-3650 BP.
(c) A cairn resembling the megalithic tombs in plan (NGR
SD 75677836) is thought to belong to Late Neolithic times.
In the early Bronze Age (c. 2000 BC) new immigrants
of the Beaker Culture from the Continent introduced new
tastes in pottery and brought the custom of single burial
to Britain. They seem to have lived side by side with
the indigenous people or in mixed societies (Megaw & Simpson 1979). The south-eastern economy was probably
based on arable farming whereas in the north-west,
stock-raising was important. The major crops were Hordeum
spp. (barley), Triticum monococcum (einkorn wheat)
and T. dicoccum (emmer wheat). Pigs, cattle, sheep and
horse were domesticated ?nimals during the Late
Neolithic-Early Bronze Age. Later in the Bronze Age cattle
and particularly sheep became the most abundant ungulates.
The evidence from pottery and cairns suggests a prolonged
late Neolithic and early Bronze Age overlap in the
Pennines, though Beaker barrows on the chalk soils of
the Wolds and limestone hills indicate the use of the
Pennine passes, as at Lea Green near Grassington
(Longworth, 1965). It appears that the western uplands
were scarcely affected by the Beaker phase.
In the Craven area, once again many of the archaeological
finds including occupation and burial debris come from
the limestone caves. These span the Late Neolithic Period

28
through to Early Bronze Age, e. g. Raven Scar Cave (NGR
SO 730757) near Settle (Gilks, 1973 and 1981).
The identification of Bronze Age above-ground settlement
si tes presents difficul ties. Some of the huts and farm
patterns on Malham Moor may, however, date from this
period (Raistrick & Holmes, 1962).
The Bronze Age occupation on the Ingleborough Massif
is authenticated by a few records of finds: -
(a) Several metallic objects in typical Bronze Age fashion
- a looped spearhead (OSAN SD 77 SW 10) found near Scale
Mire Farm (NGR SO 721705).
(b) A flanged axe (OSAN SD 77 NW 2), a pin and a diamond
shaped plate dated to 700 BC (2650 BP) at Ingleton (King,
1970).
(c) A cairn called "Apron Full of Stones", near the head
of Kingsdale (NGR SO 709787), revealing an empty grave,
a cremation burial, a pit and several flints (King, 1978
a) •
After 700 BC in Bri tain the maj ority of artefacts were
still of bronze, but some were already of iron. Thus,
the in trod uc tion of metal, such as copper and bronze,
for tools along wi th long-distance trade in Bronze Age
times was to form the basis of the iron-using culture
of the Iron Age.
On the limestone uplands of the Craven District the Iron
Age occupation is represented by numerous archaeological
remains hu t circles, set tlemen ts, field systems t
burials, iron artefacts and fragments of early Native
and Later Romano-British pottery. It was shown through
radiocarbon dating that these elements belong to the
last stage of a long period of occupation.
According to Raistrick and Holmes (1962) old tradi tions
and constructions continued with slow and slight changes
over a long time. Megaw and Simpson (1979) also point

29
out the existence of more continuity between the Bronze
Age and Iron Age, particularly with respect to the
hillforts. In northern Bri tain pastoralism, wi th a great
proportion of cattle and flocks of sheep, retained a
dominant role in the economy (Cunliffe, 1978; Megaw' &
Simpson, 1979). The Iron Age infiltration and later
occupation of the Craven area was continuous, probably
from the 2nd century BC until the end of the Roman
invasion in the early 5th century AD. The chief resistance
to Roman oc~upation centred on a hill tribe, the Brigantes
of the North of England. In general, the most abundant
archaeological remains found in the Ingleborough Region
belong to Iron Age/Romano-British Period. A hillfort
da ted 300 BC-100 AD according to Longworth (1965) (King,
1970; OSAN SD77 SW1) on the summit of Ingleborough Hill
is one of the maj or Iron Age si tes. Many examples of
small farmsteads, surrounded by drystone walls, can be
seen near Ribblehead (NGR SO 7778). Some of them show
drove-ways wi th steep banks on either side. It is clear
that the construction of such settlements started in
the beginning of the 2nd century and continued in the
4th century (King, 1969). Similar cuI ti va tion si tes have
been recorded from Malham Moor and Grassington (Raistrick,
1936 and 1939; Raistrick & Holmes, 1962).
In Penigent Gill the settlements excavated by Bennett
(1938) yielded bones and teeth of horse, ox and sheep,
pottery pieces of c. 200 BC - 200 AD, a piece of Roman
ware of a much later date, pot boilers, fragments of
querns, rubbing stones. Caves around Settle revealed
Iron Age brooches and domestic items. A remarkable suite
of Romano-British objects of the second century was also
reported from several caves, such as Victoria, Attermire
and Sewell's Cave.
In the Dark Ages, all the Dales saw the gradual
penetration of Anglian and later Danish settlers from
the east. On Malham Moor the period is represented by
the isolated t Priest t sHouse t which is thought to have

30
been the house of an Anglian priest or hermit of 7th
century date, and by two coins of the ninth century from
Prior Rakes, coins of King Eanred (807-841 AD) (Raistrick
& Holmes, 1962). At a site consisting of the three
buildings at Ribblehead (NGR SD 766784) on the limestone
pa vemen t a long iron spearhead, knives and three bronze
coins of around the mid-9th century were identified (King,
1978b). These are accompanied by a knife and four coins
of the 9th century in Scandinavian fashion which suggest
the occupation of Ribblehead during the second half of
9th century by Scandinavian settlers (OSAN SD 77, NE
12).
In the tenth and eleventh centuries the uplands were
inhabited by Norsemen. The evidence is provided by their
typical farmsteads scattered over Malham Moor. ·N~rse
settlement in the Pennines can be also be traced in place
names and much of the local Dales dialect (Raistrick
& Holmes, 1962).
In the twelfth century the land was given over to the
monasteries of Fountains and Bolton under whom the Norse
settlers continued sheep-farming. The monasteries then
developed a new system of sheep-ranching in the uplands,
which continued until the time of Dissolution of the
monasteries in 1535. Several
be seen on the Ingleborough
SD 77 NW 6; SD 77, SW 5, 9).
medieval farmsteads can
Massif (OSAN SD 77 NE 6,
This sequence of archaeological sites covering a long
period of time may suggest an almost continuous occupation
of the limestone plateaux of Craven from the Mesoli thic
Period onwards (Figure 3.1.). Areas of Upland Craven
which are free from boulder clay seem rich in
archaeological remains. The nature of the soil and
vegetation cover should ensure the use of such areas
as permanent sheep run for many centuries.
Ingleborough Region and the Craven Area as
still grazed, mainly by sheep. Many small
Today the
a whole is
settlements

r
\ , , • J •
PEN-Y-G1IENT odd' ~
\>. . " . /j~. .. ~ ~ INGlEUOROUGl1 , '!.
~ ~
1!. ~ .+
~.
IIIGII BENTHAM
+/ ~
~
[ E Y T 0 S Y M B 0 L S
* Upper Palaeolithic
• Mesolithic
+ Neolithic
x Bronze Age
• Iron Age/Romano-British
o Norse
.t Medieyal
• Post-Medienl
b ~II .: \-"
~
AUSTWICK
'----I
I kill
., ., .. ", ~ ';-... t
If.,
"' ~*"" \; ~ ..,~\!~ l.\.
Figure 3.1. Map showing the position and age of some archaeological remains
in tile Ingleborough Region.
w .....

32
are located in the river valleys which are used as
pastoral and arable fields.

33
4. MATERIALS AND METHODS
4.1. Collection and storage of samples
Peat samples for analyses were collected by a "Russian"
type sampler (50 cm long). A "Hiller" type borer was
also employed to extract extremely stiff Lateglacial
deposits of Thieves' Moss (sampling point 1).
The depth and stratigraphy of the deposit of Sniddle
Moss were established at thirteen sampling points across
the deposit (see Figure 5.2.1.). The stratigraphy of
the deposits selected in the limestone upland was given
by earlier workers - Thieves' Moss by Gosden (1965) (see
Figure 6.2.1.) and Sunset Hole by Swales (1987). Coring
pain ts from each si te, which were believed to can tain
a sequence of the desired periods, were chosen and their
samples were examined for detailed pollen analyses along
wi th macrofossil analyses. Keys to symbols used in this
study for the lithology of both Thieves' Moss and Sunset
Hole are different from those presented by Gosden and
Swales.
Each core as it was taken was described in the field
and collected in plastic drain-pipes. It was then
labelled, including an indication of the site, boring
location and depth in the stratigraphic sequence, before
being wrapped and sealed in clean polythene to prevent
drying. All peat samples were stored at 2 0 C to inhi bi t
the development of microbial activity.
4.2. Macrofossil analyses
In the laboratory, subsamples from Sniddle Moss were
taken mainly at intervals of 10 cm (SM9) or at closer
intervals (SM4), taking into consideration the marked
changes in physical properties which had been recorded
in the field. Each subsample was treated wi th about 10%

34
nitric acid overnight and then strained through two sieves
with meshes 425 and 250 pm. For Thieves' Moss and Sunset
Hole, only the small amounts of sediment left after pollen
preparation were analysed. The washed samples were placed
on a Petri dish in small proportions in water in order
to separate macroscopic plant remains. Vegetative remains,
such as buds, frui ts and seeds, were examined under a
low power binocular microscope (x10 and x30) whilst
mosses, Juncus seeds, cuticles of monocots and sectioned
wood samples were studied using a high power microscope
(x100 and x400).
4.2.1. Determination of macrofossils
The determination of macrofossils was based on comparisons
with some vegetative parts of plants in reference
collec tions and iden tifica tion, manuals (Beij erinck, 1947 i
Dixon, 1954 i Jessen, 1955; Korber-Grohne, 1964 i Katz
et al., 1965 i Smi th, 1978; Bergrren, 1969 and 1981 i
Schweingruber, 1990). The identification of Betula female
catkin scales was mainly made from the illustrations
in Godwin (1975).
An achene of Cirsium ? hetero~hyllum/~alustre from SM8
(254-256 cm) is thought to belong to either .£. ?
hetero~hyllum or C. ? Ealustre. The same also applies
to fruits of Glyceria fluitans/declinata at SM5, leaf
remains of Drepanocladus fluitans/exannulatus at SM4,
and of Orthotrichum sp./Ulota sp. at SM9. Bryum sp./Mnium
sp. from SMI0 (208-210 em) refers to leaf remains
resembling Bryum sp. or Mnium sp. But, in the case of
other samples from Sniddle Moss and from Thieves' Moss
3 it was possi ble to separate the leaves of Bryum sp.
from Mnium
those which
with sharp
referred to
with almost
sp. Carex flava-type nuts were referred to
are trigonous, dark brown and broadly obovate
angles, whilst C. rostrata-type nuts were
those which are trigonous, broadly obovate
flat and verrucose faces and with a curved

35
stylar base and often a twisted base and a twisted beak.
Large numbers of Characeae oospores were found in the
deposi ts of Sniddle Moss and Thieves' Moss during the
examination of macrofossils. An account of both LM and
SEM studies of these oospore types is given in Appendix
10.
Nomenclature of vascular plants follows Clapham, Tutin
and Moore (1989) and of mosses follows Smith (1978).
4.2.2. Presentation of macrofossils
The macrofossils from Sniddle Moss (SM4 and SM9) and
Thieves' Moss (TM1, TM2 and TM3) are plotted against
a stratigraphic column. The taxa from SM4 and SM9 and
Thieves' Moss have been arranged according to
occurrence in the stratigraphic sequence and the
their
basis
of their known ecology. Those from other sampling points
of the Sniddle Moss si te, which have not been recorded
from SM4 and SM9, are in alphabetical order. The
assemblages have been zoned in the same manner as pollen
diagrams, excluding subzones.
4.3. Microfossil analyses
4.3.1. Preparation of samples for pollen counts
1 cm3 samples were first measured using a syringe after
cleaning of the sediment surface to avoid contamination.
In order to determine the concentration of pollen in
the sediment, tablets of Lycopodium clavatum were then
added to all samples according to the method described
by Stockmarr (1971).
Peat samples were treated with KOH solution (5 % w/v)
and some of those from Sniddle Moss were then subjected
to Erdtman's acetolysis to remove large amounts of plant
debris. The samples which were calcareous were treated
with 5% HCl and the pollen was separated from the mineral

36
material by bromoform-acetone flotation.
Two slides were prepared for each level (mounted in
glycerine-jelly).
4.3.2. Counting procedure
In most cases a minimum sum of 500 pollen grains was
counted per level, 250 from each of the duplicate slides.
The pollen content of some samples was low and pollen
was counted from traverses covering the whole slide and
extra slides. Even then some samples chiefly those
from several layers of the lake clays of Sniddle Moss
and Thieves' Moss - yielded less than 100 grains.
Pollen and spores were identified using the reference
collection in the Department. The pollen and spore types
used are defined in Faegri and Iversen (1989) and Moore,
Webb and Collinson (1991), except for Humulus
lupulus-type. Its identification has been made from
the reference slides and the descriptions in Punt and
Malotaux (1984). Microscopic algae were also counted
during the analyses. Routine (pollen) counting was carried
out at a magnification of x400, with x1000 used for more
detailed examinations and critical determination.
4.3.3. Radiocarbon dates
Subsamples
have been
deposits
from a number of levels
taken for
of Sniddle
radiocarbon
Moss and
of the study sites
dating. Lateglacial
Thieves' Moss were
carbonate-rich and not suitable for dating. The main
criteria in the selection of horizons for radiocarbon
dates.are as follows:
(a) horizons from peats showing no evidence of
contamination by calcium carbonate and modern roots
(b) the detailed pattern of the Ulmus (elm) decline which
is well defined at Sniddle Moss and at Sunset Hole by

37
sampling through and above the elm decline at 1 cm
intervals.
(c) important vegetational changes indicated in the pollen
diagrams
(d) marked changes in the nature of the peat for
calculating of rates of peat growth.
All the samples were sent to the NERC Radiocarbon
Laboratory at East Kilbride to be dated by Accelerator
Mass Spectrometry at the University of Arizona.
Radiocarbon dates for Sniddle Moss and Thieves' Moss
have been obtained (for a list of these dates see Appendix
1). An estimated time scale for Sniddle Moss 9 is
presented in Appendix 2. All radiocarbon dates are
expressed in conventional radiocarbon years BP (before
1950, according to Stuiver and Polach, 1977).
Unfortunately, the dates for Sunset Hole are not available
now.
4.3.4. Calculations and construction of the pollen
diagrams
The pollen data were handled by the Tilia Software
Package, designed and written by Eric Grimm of the
Illinois State Museum, USA. The calculation sum chosen
consisted of total land pollen (TLP) excluding Lycopodium
clava tum spores. Pollen of aquatic plants, spores, algae
and indeterminable pollen (most are corroded) were
excluded from the pollen sum. The frequencies of these
were calculated separately.
Both percentage and concentration diagrams have been
produced for the profiles of all selected sites. An influx
diagram has been constructed only for the Sniddle Moss
site (sampling point 9). Since the concent ra tion diagram
produced for SM9 is similar to the influx diagram, it
has not been included. A lithostratigraphical column
following radiocarbon dates has been placed at the
beginning of each diagram. The tree pollen curves followed
LEEDS UNIVERSITY UBRARY

38
by those for shrub pollen first have been presented in
order to facilitate comparisons with published and
unpublished diagrams. Herbaceous pollen curves are
presented next. In the percentage diagrams, a summary
diagram showing the proportions of tree, shrub and herb
pollen follows the curves for aquatics and algae. Some
selected pollen and spore types which occur rarely are
listed separately. In the concentration and influx
diagrams only selec ted taxa have been plot ted , followed
by indeterminables, total aquatic pollen and total land
pollen.
4.4.4. Zonation of the pollen diagrams
The pollen diagrams have been divided into local pollen
assemblage zones (LPAZ) by noting maj or changes in the
individual pollen curves in the percentage diagram. Each
zone boundary has been drawn where significant changes
were present in the values of major taxa. Boundary lines
were placed through the first level in which the changes
seem to have occurred. The subdivision was based on the
inherent features of the diagrams. The dotted lines in
zones SM9-III (Sniddle Moss) and SH-IV (Sunset Hole)
do not represent subzone boundaries. They have been used
to define the main stages related to changes in the elm
curve, along with other important elements of these zones.
The screen type dashed lines in the Sniddle Moss diagrams
(SM4 and SM4a) represent the assumed hiatuses.
In each pollen diagram the zones and subzones are prefixed
by the si te and the number of sampling point and are
numbered from the base to the top of the sequence.

39
5. SHIDDLE MOSS (NGR SD 707695)
5.1. Description of site
Sniddle Moss (54 07' N, 2 27' W) situated at an altitude
of c. 160 m is c. 4 km to the west of Clapham. The area
is bounded to the north by a trunk road, A65(T) (Clapham
to Ingle borough), to the south by the B 6480, Clapham
to High Bentham Road, and to the west by a few farms
(see Figure 1.1.).
The moss is almost oval in shape. It is surrounded by
drumlins and drift material giving an undulating relief.
At the northern end there is a permanent stream running
off the Moss. The present vegetation of the site consists
chiefly of low hummocks of Sphagna; namely Sphagnum
magellanicum and S. papillosum with Aulacomnium palustre,
Polytrichum commune, Calliergon cuspidatum, C. stramineum,
Carex species - C. curta, C. nigra, C. panicea and C.
rost ra ta - and some Eriophorum angust if oli um. There are
also smaller amounts of Filipendula ulmaria, Galium
palustre Juncus effusus, J. bulbosus, Polygala
serpyllifolia, Potentilla palustris, Viola palustris
and Rhytidiadelphus sguarrosus in wetter areas of the
bog surface. In the pools Eguisetum palustre, Hydrocotyle
vulgaris, Menyanthes trifoliata and Potamogeton
polygonifolius can be found. On the drier parts Calluna
vulgaris and Erica tetralix become common.
5.2. Stratigraphy
A series of borings showed that the deposits occupy a
basin which in the region of the section is some 8 m
deep near the middle and about 116 m across (Figure
5.2.1.).
According to preliminary work by Margaret Pigott with
an undergraduate in 1980, there is a basic sequence of

o South
SHU
2
J
s
6
9 metres
\ ",
""
I '::. \
\\ \ '::. \ \ ".':. \
1 \·.. \ \1 .,. \ '::. \ \ ~ '::'. \
SH9
------
A \
SMa SM'
----
I'
I /
I
I I
I /
I
I I
I
40
" "
, ,
"
I I
I " I ,
I I I ,
I I
I ,
SHi
I I K I I
I !ill Dovnvash cla,!
II
Ifort ..
SH' 5HZ SHl
..!. .. etre.
E y
:1:1: Honocot material vlth Ill11I111l1 Or"anle ela,!
"I [IT] / I '.' rplltJQnunt and erleolds _ ~ , /
I I I
I'!IlJ'l Wood peat vlth .. onoeot!ll 511' 1 1 I:U:!.l:J .. atetlai -'I organ e e a"
III Organic .. ud
_ Silty otl/anle .. ud A l~p.netr.ble .011d •• terial
Figure 5.2.1. Stratigraphy across Sniddle Moss (SM4a is
closer to SM4 than it is shown in the figure.
OnlY the upper parts of coring points have
been correlated since the lower parts show
great variation and it is difficult to correlate).

41
two lake clays separated by organic mud on each side
of the sec tion of the Moss. The present study, however,
suggests rather irregular preservation of these earlier
(Lateglacial) sediments since they appear to be only
very well developed on the northern side. In addition,
various layers of organic mud with marl and organic clay
between these two lake clays are not easy to correlate
from one core to the next. The lower lake clay, which
is predominantly grey in colour, presumably represents
the lake deposits from the closing stages of the last
major glaciation. The upper clay (fine-blue) with no
banding may indicate rapid deposition under uniform
conditions, possibly into quite deep water. The main
Postglacial deposits, above the upper clay, extend almost
continuously over the bed of the lake.
In most places the upper clay passes up into a mud of
increasing organic content, which is about 1.70 m thick
in the middle of the lake. This organic mud is overlain
by a very thick fen-carr peat. The lower part of the
peat has a zone of aquatic mosses, chiefly dominated
by Fontinalis antipyretica on the southern side. The
upper part contains wood with monocot material. This
is usually superseded by a layer wi th some Sphagna and
ericoid remains.
A typical Lateglacial sequence seen at SM4 yielded the
following:
cm
130-168 - organic mud
168-192 - organic mud with clay
192-238 - lake clay
238-244 - organic clay
244-248 silty organic mud
248-253 - marl
253-264 - silty organic mud
264-296 - marl
296-300 - clay

42
300-313 silty organic mud
313-367 - lake clay
A description of the
illustrate the nature
Flandrian:
cm
profile at SM9
of the various
will serve to
layers of the
0-50 - monocot material with Sphagnum and ericoid
remains
50-429 - wood peat with monocot material; charcoal
at 126-128 cm
429-500 - Fontinalis peat
500-548 - organic mud
In some cases (mainly on the northern side of the section)
bands of clay interrupt the Postglacial deposits, probably
as a result of periods of increased erosion, the possible
consequence of forest clearances.
The whole area is now very peaty in nature.
5.3. Macroscopic fossils
The resul ts of the examination of the macrofossils from
SM4 and SM9 are plotted in Tables 5.3.1. and 5.3.2. In
addi tion, finds of macroscopic plant remains from other
sampling points, which have not been found in the profiles
of SM4 and SM9 are listed in Table 5.3.3. Some of these
finds can be related to the phases of local vegetational
history defined for profiles SM4 and SM9.
5.4. Microscopic fossils and local pollen assemblage zones
The pollen
a record
diagram
of the
'Sniddle Moss
vegetational
4' seems to provide
history during the
Lateglacial and the early stages of the Flandrian Period
in the area (Diagrams 5.4.1.,5.4.2.,5.4.3.,5.4.4.,
5.4.5. and Appendix 3). It is believed that there is

43
an hiatus (between 79-90 cm where there is a tree trunk)
in the sequence of SM4 and much of the recent vegetational
record is not well-presented in the diagram. Consequently,
additional cores SM4a, a parallel core to SM4, and
SM9 in the centre of the basin - which are believed to
contain sequences of the desired periods have been
examined (Diagrams 5.4.6., 5.4.7., 5.4.8., 5.4.9.,
5.4.10.,5.4.11. and Appendix 4 and 5). Local pollen
assemblage zones are defined for each profile as follows:
SH4
SH4-1 Pinus-Gramineae LPAZ
(366-314 cm)
Zone SM4-1 represents a section of
low pollen concentration. Pinus
significant contributors to total
the profile of very
and Gramineae are
land pollen in the
percentage
both have
all taxa
diagram whereas in the concentration diagram
low values. The same also applies to almost
in the pollen record. Total land pollen
concentrations increase towards the top.
The terminal boundary: Salix and Rumex/Oxyria pollen
percentages rise, the curve for Pinus declines.
SH4-11 Gramineae-Cyperaceae-Salix-Rumex/Oxyria LPAZ
(314-306 cm)
This zone is characterized by an increase in total pollen
concentrations. A striking feature of the zone is the
persistence and further development of herbaceous taxa,
chiefly Gramineae, Cyperaceae and Rumex/Oxyria. A rise
in the Salix and Potamogeton curves also marks this zone.
The terminal boundary: Juniperus pollen percentages
increase and those for Salix and Rumex/Oxyria fall.

44
SH4-111 (306-274 cm)
The fluctuating values for juniper provide a basis for
di vision of this zone (subzones -IlIa, -IIIb and -IIIc).
Subzone SM-Illb has lower pollen concentrations than
either the underlying or overlying subzones.
5M4-111a Gramineae-Juniperus-Cyperaceae LPAZ
(306-302 cm)
The increased percentage and concentration values of
Juniperus and Betula pollen characterize this subzone.
The contribution of shrub pollen is higher than in the
preceding zone due largely to an initial increase in
juniper, but herbaceous pollen is still dominant.
The terminal boundary: Juniperus pollen declines.
5H4-I11b Gramineae-Cyperaceae LPAZ
(302-294 cm)
There is a decrease in pollen concentrations. Gramineae
dominates this subzone, regularly contributing 34.5-35.6% of TLP. Cyperaceae reaches its maximum value of c. 22%.
After its ini tial fall at 302 cm juniper pollen shows
a further decline in mid-zone and then increases abruptly
towards the top. Birch pollen also fluctuates. Other
herbaceous taxa characteristic of disturbed ground (such
as Artemisia, Helianthemum and Rumex/Oxyria) assume an
importance. Thalictrum is well-represented in this
subzone, though at low values.
The terminal boundary: Juniperus pollen increases
considerably.
SH4-1IIc Gramineae-Cyperaceae-Juniperus LPAZ
(294-274 cm)
This subzone is characterized by increased pollen

!tn
concentrations, by a rise
and by higher values of
Filipendula. Betula pollen
45
in Juniperus (up to 41.2%),
thermophilous taxa including
presents fluctuating values
by mid-zone and then increases suddenly, before decreasing
steeply towards the end of the subzone. Hippophae becomes
significant. Rumex/Oxyria and Artemisia have lower values
in this subzone than in the preceding subzone. The shrub
pollen contributes its maximum value of 43% of TLP, for
the first time.
The terminal boundary: A rise in the Betula curve defines
the terminal boundary.
SH4-IV (274-238 cm)
The zone is divided into four subzones, on the basis
of the Betula, Juniperus and Filipendula curves.
SH4-IVa Betula-Gramineae-Cyperaceae-Filipendula LPAZ
(274-264 cm)
Subzone SM4-IVa is distinguished by its high Betula
and Filipendula pollen values and by decreased pollen
values for Juniperus. Hippophae is well-represented,
though a t low values. Tree pollen comprises up to 46%
of TLP, but very high values of NAP are maintained (up
to 68%).
The terminal boundary: Betula pollen declines.
SH4-IVb Cyperaceae-Gramineae-Betula LPAZ
(264-256 cm)
The reduced values of Betula and Filipendula pollen and
the increased values for Cyperaceae and Gramineae mark
this subzone.
The terminal boundary: Betula, Juniperus and Filipendula
increase.

46
SH4-IVc Betula-Gramineae-Cyperaceae-Juniperus LPAZ
(256-248 cm)
Total land pollen concentrations of this subzone are
lower than in the preceding sub zones of SM4-IV.
Betula and Juniperus pollen first shows a slight rise.
The former increases abruptly at the end of the subzone,
while the latter peaks towards the top, before declining.
Gramineae pollen is still important. Cyperaceae pollen
values fall.
The terminal boundary: Juniperus pollen decreases.
SH4-IVd Betula-Gramineae-Cyperaceae-Filipendula LPAZ
(248-238 cm)
There is an increase in total land pollen concentrations.
Gramineae pollen is the main contributor of this subzone.
Although Betula displays fluctuations, it has high values,
between 20% and 29.2% of TLP. Juniperus pollen remains
in low quantities, before showing a slight increase at
the top. After an initial rise, Filipendula pollen
declines. Rumex/Oxyria pollen is well-represented.
The terminal boundary: Gramineae and Cyperaceae pollen
rises, Betula, Juniperus and Filipendula pollen values
decline.
SH4-V Gramineae-Cyperaceae-(Betula)-Artemisia LPAZ
(238-190 cm)
Low pollen concentrations are characteristic of this
zone. There are reductions in Betula, Juniperus, Hippophae
and Filipendula as Gramineae, Cyperaceae, Artemisia,
Ranunculaceae and other herbs become significant.
Selaginella assumes an importance in the beginning, before
declining gradually.
The terminal boundary: The Juniperus curve rises.

47
SH4-VI Gramineae-Juniperus-Cyperaceae
(190-180 cm)
This zone records a rise in pollen concentrations of
almost all taxa wi th the exceptions of Artemisia. NAP
is still the main contributor to the total land pollen.
Juniperus and Filipendula have higher pollen values than
in the preceding zone. Hippophae completely disappears
as Quercus first appears. Algae decline.
The terminal boundary: Betula pollen rises and the curve
for Juniperus declines.
SH4-VII Betula-Gramineae LPAZ
(180-170 cm)
Betula pollen dominates this zone. Juniperus becomes
less significant. Ulmus and Corylus pollen first occurs
in this zone.
The terminal boundary: Corylus pollen shows an increase
and Betula pollen falls.
SH4-VIII (170-92 cm) (Corylus Phase)
This succeeding zone is divided into two subzones,
primarily on the basis of changes in the pollen curve
of Cory Ius • There is a rise in concentration of
indeterminables.
SH4-Vllla Corylus-Betula LPAZ
(170-128 cm)
Corylus pollen accounts for 45-61% of TLP. Betula has
lower percentages than zone SM4-VII. Juniperus pollen
declines and disappears completely towards the top. Ulmus
forms a continuous curve and it is better represented
than Quercus. NAP is considerably lower than tree and
shrub pollen for the first time.

48
The terminal boundary: Corylus pollen values decrease.
SH4-VIIIb Corylus-Cyperaceae
(128-92 cm)
The most striking feature of this subzone is the decline
in pollen concentrations. Corylus pollen is still
dominant, but it has lower values than those in the
previous subzone as does Betula. Both percentages and
concentrations of Pinus increase towards the top. Alnus
pollen first appears in the subzone. Filicales spores
peak irregularly.
The terminal boundary: It is difficult to define the
terminal boundary precisely because there is a tree trunk
belonging to Salix sp. from 90 to 79 cm.
SH4-II (78-16 cm)
Zone SM-IX is characterized by major changes in the pollen
record. There is a rise in the values of
pollen-concentration.
A subdivision of this zone into two phases can be made
- subzone SM4-IXa and SM4-IXb.
SH4-IIa Cyperaceae-Betula-Alnus LPAZ
(78-24 cm)
NAP is over 60% of TLP with Cyperaceae the dominant type.
Betula and Alnus are the chief contributors to total
tree pollen. Ericales and Sphagnum become significant.
Pollen of cultural indicators (e.g. Cerealia-type and
Plantago lanceolata-type) is well-represented.
The terminal boundary: NAP shows a further rise and AP
values decline.

49
SH4-IIb Cyperaceae-Gramineae-Alnus LPAZ
(26-16 cm)
Cyperaceae and Gramineae have high
as non-herbaceous pollen falls.
pollen values
The terminal boundary: AP presents a further reduction.
SH4-X Cyperaceae-Gramineae LPAZ
At 16 cm, the beginning of zone SM4-X there are
substantial and abrupt falls in values of tree and shrub
pollen and total dominance of Gramineae and Cyperaceae
pollen on both percentage and concentration diagrams.
Deposits above 12 cm could not be analysed palynologically
due to the presence of large amounts of modern plant
fragments.
SH4a
SH4a-I Corylus-Cyperaceae LPAZ
(116-100 cm)
This zone is marked by low total land pollen
concentrations. Corylus, Cyperaceae, Pinus and Filicales
are important components of the assemblage.
The terminal boundary: Pinus pollen increases.
SH4a-II Pinus-Corylus-Cyperaceae LPAZ
(100-90 cm)
Total land pollen concentrations are still low.
is the most abundant pollen type, rising up to
but decreasing to 21% by the end of the zone.
Pinus
c.47%
The terminal boundary: Pinus and non-herbaceous pollen
declines.

so
SM4a-III Cyperaceae-Corylus-Gramineae-Ericales-Betula LPAZ
(90-68 cm)
There is a sharp increase in total pollen concentrations.
The herbaceous values are high J over 50% of TLP J with
Cyperaceae, Gramineae and Ericales the most important
contri butors. Corylus, Betula, Alnus and Quercus remain
relatively stable throughout the zone while Pinus and
Ulmus pollen shows very low
abundant than in SM4a-11.
SM9 (Figures 5.4.1. and 5.4.2.)
values. Sphagnum is more
SM9-1 Corylus-Betula-Pinus-Quercus LPAZ
(502-430 cm)
Non-herbaceous pollen dominates this zone wi th Cory Ius J
Betula, Pinus and Quercus the main types. Alnus pollen
first appears in this zone.
The terminal boundary: Alnus pollen rises.
SH9-II Alnus-Corylus-Quercus LPAZ
(430-118 cm)
In this zone the sedimentation rate increases from 7.3 -1 -1
yr cm to 4.5 yr cm and it decreases towards the top.
There is also a rise in total pollen influx values due
largely to the presence of high pollen producers such
as alder. Alnus pollen is the maj or tree pollen, but
exhibits fluctuations throughout. Corylus and Quercus
pollen also comprises considerable percentages of TLP.
Pinus and Salix are present throughout, but at low values.
Betula values decline dramatically, showing a peak at
334 cm. Ulmus pollen percentages are up to 7.7%. Ti lia
and Fraxinus appear sporadically. Gramineae is not well
represented while Cyperaceae fluctuates. Pteridium becomes
significant from 190 cm.

Radiocarbon Year BP 0, I Deposition time (yr em-I)
~
41 I 1>±45 -
go~~: 100
1:iO
~685fBO - 200
E 2:iO u -.... :S 611~O- g- 300 CI
3~
400
683(}j£5 -4:iO
7J05±60 -500
5:iO
"---
Figure 5.4.1. Deposition time (yr
-
-1 em ) for Sniddle Moss 9
(between 14-502 em). Also shown are radiocarbon
dates.
20
VI ......

r
Radiocarbon Year BP 0, I Tolal Pollen Influx (groins cmo2 yr-I) -' 50
4111>±45 -
~mlBa: 100
150
5685ii30 - 200
----E 250 u -
5115±£O - ~ 300 8
350
400
683D±6S-450
7305160-
~OO
500 1000 1500
~
Figure 5.4.2. Total pollen influx (grains cm-2 yr- 1 ) and radiocarbon
years for Sniddle Moss 9 (between 14-502 cm).
V1 tv

53
The terminal boundary: The first classical elm decline
is recognized.
SM9-II1 Alnus-Cyperaceae LPAZ
(118-26 cm)
As mentioned in Chapter 4., the dotted lines in this
zone (Diagrams 5.4.10. and 5.4.11) define the main phases
related to changes in the elm curve.
Five main phases have been distinguished:
Phase 1. A first elm decline (118-108 cm)
The first classical Ulmus decline is dated to SOSO±SO
BP at 118 cm where elm pollen falls to 1.6% of TLP, but
there is no change in its concentration and influx values.
At this level, though there is a fall in deposition time
from 8.2 to 9.2 (yr cm- 1 ), total pollen influx rate -2 1 (grains cm yr-) shows a rise. Arboreal pollen is still
dominant. At the onset of this phase Alnus, Corylus and
Quercus percentages fall temporarily because of high
percentages of Cyperaceae pollen. Corylus influx values
particularly display a definite rise. Betula is less
significant. Tilia and Fraxinus pollen rises up to 1%.
Salix pollen increases towards the top. Fi1ipendula pollen
peaks immediately after the elm decline, up to 7.8% at
116 cm - before declining gradually. Plantago lanceolata
pollen' appears at 114 cm for the first time, though
intermittently and at low values (0.2-0.4%).
Cerealia-type pollen also first occurs at 114 cm.
Pteridium spores are present frequently and reach a peak
of 1.8% at 111 cm.
Phase 2. (107-90 cm)
This phase is characterized by the absence of elm pollen
at 107 cm and low and fluctuating values at other levels.
There are also marked variations in pollen percentages

54
and influx values of major taxa, including Alnus, Corylus,
Quercus, Betula and Cyperaceae. The last-mentioned taxon
rises sharply towards the end. Filipendula peaks at 105
cm (4.7%) and then declines abruptly. Melampyrum appears
at 106 cm at a value of 2.8% and reaches 12.5% at 105
cm, before disappearing. Cerealia-type pollen occurs
intermittently.
Phase 3. A partial recovery of elm (88-76 cm)
Ulmus pollen recovers at 88 cm, rising from 0.2% at 90
cm to values over 0.9%, wi th a maximum of 2% at 82 cm.
In the beginning, total pollen influx values rise abruptly
and fall by the middle of this phase. As Cyperaceae
declines steeply, Alnus and Corylus pollen shows a
temporary increase. Towards the top, Cyperaceae rises
and Alnus and Cory Ius correspondingly decrease. Plantago
spp. pollen occurs very rarely. Cerealia-type pollen
disappears. Pteridium assumes some importance.
Phase 4. A secondary fall in elm (74-70 cm)
Ulmus pollen falls to 0.4% at 74 cm where there is an
increase in total pollen influx values. It has lower
values than in the preceding phase.
NAP becomes significant due largely to the percentage
contribution of Cyperaceae, though lower than total non
herbaceous pollen.
Phase 5. A renewed recovery of elm (66-26 cm)
This phase is distinguished by the recovery of elm pollen,
but its percentages and influx values are lower than
those in SM9-II and higher than those in the third phase.
Alnus pollen fluctuates greatly as does Cyperaceae pollen.
Quercus becomes more significant than Cory Ius towards
the top. Betula is better represented than in phase 3

55
and 4. Fraxinus rises up to c. 2% while Tilia is present
sporadically, reaching 1.4% of TtP. Cerealia-type pollen
reappears at 46 cm. Plantago lanceolata occurs again
at 42 cm. Pteridium peaks up to c. 6% at 38 cm.
The terminal boundary: Non-herbaceous pollen declines.
SM9-IV Cyperaceae-Betula-Gramineae LPAZ
(26-14 cm)
After a further decline at the onset of this zone, total
land pollen influx values rise and fluctuate throughout.
NAP increases up to c. 73% of TLP and non-herbaceous
pollen correspondingly falls. Betula, Gramineae, Ericales
and Sphagnum, in particular, become abundant.
Deposits above 14 cm were not available for pollen
analyses because for the reason mentioned previously
for the uppermost layers of SM4.

56
5.5. A tentative correlation of the local pollen
cores from Sniddle assemblage zones for the three
Moss
As seen in Figure 5.5.1., SM4 and the studied sequence
of SM4a have comparable assemblages, except for SM4a-II.
The differences in the pollen record between the two
sites are slight. In SM4-VIIIb Pinus pollen rises up
to 15.5%, whereas in SM4a-I it varies from 14.3% to 28.7%
of TLP. However, both zones represent similar
concentrations for Pinus up to 9.1x10³ grains cm-3 at 3 -3 SM4 and up to 7.2xlO grains cm at SM4a. In addition,
Corylus has higher values in SM4-VIIlb than in SM4a-I.
Quercus pollen never exceeds 5% of TLP in SM4-VIIIb,
whilst in SM4a-I it is slightly higher than in SM4-VIIIb,
bu t not over 10% of TLP. The following zone, presenting
high Pinus pollen values at SM4a is considered not to
have an equivalent at SM4. At first glance, fluctuations
in Pinus pollen concentrations, rising up to c. 18xl03
grains cm-3 in subzone SM4-VllIa might question this
assumption. A
fluctuations
concentrations,
rather than
Juniperus and
closer look however suggests
show a good coincidence
that these
with TLP
possibly indicating sedimentological
floristic changes. The persistence of
the absence of Alnus pollen in subzone
SM4-VlIIa may show that it is earlier than any part of
SM4a. In SM4a-II, Pinus pollen reaches about 47% of TLP
and 25xl03 grains cm-3 , while Corylus falls to a minimum
value of 15.4%. The maximum Pinus pollen marks the Late
Boreal Period of the Flandrian (before c. 7000 BP).
The base of the studied sequence of SM9 shows a section
between 430-502 cm with Corylus, Betula and Pinus pollen
predominant. The initial rise of Alnus pollen dated to
7305±60 BP and Quercus pollen up to 17.4% evidence that
SM9-I corresponds to the beginning of the Atlantic Period.

SM4 SM4a
LPAZ LPAZ
SM4-X
SM4-IXb SM4a-III
SM4-IXa 1------ r-----.-
HIATUS HIATUS
r-----SM4a-II
r-----SM-VlIIb SM4a-I
SM4-VIIIa
SM4-VII
SM4-VI
SH4-V
SM4-IVd
SM4-IVc
SM4-IVb
SH4-IVa
SM4-IIIc
SM4-IIIb
SM4-IIIa
SM4-II
SM4-1
57
Srt9 Radiocarbon
years(BP)
LPAZ
f-- ---
HIATUS
r-------SM9-IV
SM9-III
SM9-II
SM9-1
c tronozon
4710±45 4960±55 5050:1:50 6115:1:58 6830±65
7305:1:60
9130:1:65
F13
Fl2
Fll
De.,enslan Late
glacial
Figure 5.5.1. A tentative correlation of the local pollen assemblage zones from Sniddle Moss and the (supposed) equivalent Flandrian chronozones. ( •••• ) similarity; (----) the assumed hiatus boundary; (.) direct comparison
s

58
A considerable part of SM9-I1 is characterized by high
Alnus pollen quantities (the Atlantic Period), with a
range of dates between about 6830 BP and 5000 BP, which
do not appear at the two other sites. SM9 also records
the first classical elm decline at 118 cm dated to 5050±50
BP (the Atlantic/Sub-Boreal transition).
When using ·the estimated time scale based on the peat
growth rate for SM9-IV (12 yr cm- I ), the age of the peat
at 14 cm would be c. 3770 BP. A hiatus in peat growth
appears to have occurred so that the record in the profile
of SM9 is likely to be missing from the beginning of
the Sub-Boreal Period onwards (Figure 5.2.2.). However,
to-day there are no signs of erosion and the peat seems
to be acti vely growing. Since there
dates from the deposits above 78
observed sequence of SM4a above 90
are no radiocarbon
cm at SM4 and the
cm, it is difficult
to make a direc t comparison between the three profiles.
But it is obvious that there is an increase in NAP with
corresponding peaks in sedge, grass and ericaceous pollen
and Sphagnum spores in all sequences. Equally, there
is a fall in values of the formerly important tree
species, with the exception of Betula in SM9-II1 reaching
over 25% of TLP. The sudden changes in the pollen curves
in SM4-IX and SM4a-III support the possi bili ty of gaps
in the sequences of SM4 and SM4a and suggest that the
upper samples of these two si tes are post-Ulmus decline
and, conseq uen tly younger than 5000 BP. Both may
correspond to a period of forest clearance activities
in more intense form, culminating in more open landscape
near Sniddle Moss and in the Craven District as a whole.
SM4-X clearly represents the open habitat which exists
at the present day. A feature common to the upper parts
of the three profiles is that there is a rise in the
concentrations of indeterminable pollen, probably due
to poor pollen preservation.
Recent works based on multiple core approaches have shown
spatial variability in past vegetation and pollen

59
0
~
100
150
QJ In 0 200 -C ..... 0 QJ
Q.. 250 E e -
- 300 E u '-'
:[ 350 Q)
CI
400
450
500 2000 4000 8000
550
Radiocarbon Year BP
Figure 5.5.2. Graph of peat growth rates for the Sniddle
Moss 9 diagram (between 14-502 em).

60
dispersion pathways in a single basin (e.g. Edwards &
Thompson, 1984 ; Whit tington ~ al., 1991a). A synthesis
of the pollen histories of the studied Flandrian sequences
of Sniddle Moss profiles also reveals local variations
in the sediment record and pollen catchment area
processes. Al though SM4a is adj acen t to SM4, it displays
a marked difference - zone SM4a-II whose correspondence
is not identified in the profile of SM4 - possibly related
to variations in peat growth affected by the
micro-topography of the mire surface (cf. Turner et al.,
1989). The pollen record of the Atlantic Period, in
particular, seems to be missing at SM4 and SM4a near
the margin of the basin. The phenomenon of the occurrence
of hiatuses in the deposits of the Atlantic Period is
widespread in northern Europe (Rybnicek & Rybnickova,
1987; Bartley & Morgan, 1990). The preservation of such
deposits at SM9 suggest that erosion was not so severe
in the centre of the mire during the Atlantic Period.
5.6. A reconstruction of the local vegetational succession
at Sniddle Moss
Four main phases of the hydroseral succession
distinguished for the Sniddle Moss site as follows:
1. A lake with fringing swamp phase,
2. A rich (eutrophic) fen/swamp phase,
3. A mesotrophic fen/swamp carr phase,
4. A bog-heathland phase.
1. A lake with fringing swamp phase
SM4 zones from SM4-1 to SM4-V
SM9 the upper lake clay (642-548 cm)
may be
The local deposition of a grey clay (SM4) indicates that
there was a lake, on the spot, which originated in a
deep basin after the retreat stages of a glaciation •.
Abundant desmids, in particular, imply meso- to eutrophic
conditions (cf. Coesel, 1979a and b). Frequent moss

61
fragments in the basal clay suggest that immature and
base-rich soil profiles were colonized by bryophytes,
amongst which Homalotheci um sericeum and H. ni tens were
present. It appears that erosion was severe and
minerogenic material along with moss fragments washed
in to the lake from the unstable slopes surrounding it.
Macrophyte vegetation in the immediate area must have
been very sparse, wi th grasses and other herbs of open
areas (such as Chenopodiaceae, Helianthemum, Rumex/Oxyria
Geranium, Saxifraga granulata-type and .§.. oppositifolia
type), and receiving Pinus pollen through long-distance
transport. The regular occurrence of Artemisia pollen
completes the well known palynological reflection of
the vegetation of the early Lateglacial period (cf.
Iversen, 1954). Scattered grains of Filipendula and Ilex
must have been secondary pollen from the older deposits
over which the ice had passed.
Organic material then began to accumulate in the lake,
suggesting a distinct change in environmental conditions.
This was accompanied by a gradual diversification in
the flora. Potamogeton (a maximum of 20% of TLP) and
algae (*) (including Characeae) in abundance imply a rich
aquatic vegetation with Myriophyllum alterniflorum and
Typha angustifolia/Sparganium. The rise in Cyperaceae
pollen and Equisetum spores may point to the beginning
of the hydroseral invasion of the open water by the
lake-side vegetation. Gali um-type, Ranunculaceae and
Thalictrum were also present in this sedge-dominated
stand. Away from the lake itself, the ground seems to
have remained sparsely vegetated. Sphagna (spores)
tolerant of basic conditions may have occurred
sporadically on damper parts of the locality. Salix
(*) Pediastrum and Tetraedron were also recorded but
they have not been plotted in pollen diagrams due to
their scarcity.

62
(probably dwarf willow) may have become important in
the pioneer shrub-heath vegetation. A fruit of Betula
sp. found at 302 cm indicates the local presence of the
taxon at this time. Unfortunately, specific identification
is very difficult because of its poor preservation.
The clay (300-296 cm) overlying the organic mud in the
profile of SM4 does not show any marked change in the
local plant life. There is no strong evidence pointing
to the presence of retrogressive environmental factors
such as any climatic deterioration (see also discussion).
The lithology of local pollen assemblage zones SM4-II1
and SM4-IV is chiefly a highly calcareous organic mud
or marl which is often considered to be suggestive of
more stable conditions in and around the lake. The
macroscopic finds of Cratoneuron commutatum
this calcicole
occurrence of
species was present at this
Drepanocladus revolvens,
show that
time. The
Hy10comium
splendens and Racomi trium sp. was also ascertained. The
pollen spectra illustrate that on damper parts of the
site, sedges and willow carr may have expanded along
with tall herbs such as Filipendula cf. ulmaria, Caltha
palustris and Urtica with Eguisetum. On drier parts a
mosaic of species of base-rich areas was widespread
including Centaurea nigra-type, Epilobium, Helianthemum,
Plantago major/Po media, Succisa and other herbs. Female
catkin scales of Betula pubescens at 278 cm confirm its
local occurrence.
The composition of the local flora and vegetation
gradually began to change. The dominance of Gramineae
and Rumex/Oxyria is coupled with the deposition of
mineral-rich sediments in the lake, predominantly silty
organic mud with clay, which are suggestive of erosion.
In zone SM4-V and in the profile of SM9 (642-548 cm)
a clay was deposi ted as a resul t of solifluc tion and
slopewash from the surrounding land under severe climatic

63
conditions. The onset of climatic deterioration is most
likely to have led to the drastic decline of thermophilous
species. Aquatic vegetation became rare, with Menyanthes
t ri folia ta, Myriophyllum al terni florum, Potamogeton-type
and P. natans, but algae were of importance in the lake.
The sporadic occurrence of aquatic pollen during this
last stage of the Lateglacial is regarded as the result
of the freezing of the lake for long periods of time
under extreme climatic condi tions (Gray & Lowe, 1977) •
At almost all sampling points near the edges of the former
lake Calliergon giganteum, Drepanocladus exannulatus,
D. ? fluitans and Scorpidium scorpioides leaves first
appear in the upper clay. It might be inferred that the
margins of the lake were dominated by these aquatic brown
mosses. Dickson (1973) records these above-mentioned
taxa among the most frequently encountered species from
Lateglacial sites (Godwin zones II and III) in Britain.
A similar assemblage of species in Lateglacial/early
Holocene deposits were also shown from other parts of
Europe and North America (Vi t t & Kuhry, 1992). Sedges
wi th freq uen t Ranunculaceae (including Ranuncul us Sect.
Batrachium) and some Salix persisted around the lake
at this time. On the ground grasses expanded more widely
wi th a variety of taxa of open areas such as Armeria,
Artemisia, Rumex/Oxyria and Selaginella.
2. A rich (eutrophic) fen/swamp phase
SM4 zones from SM4-VI to SM4-VIII (and SM4a; zones
SM4a-I and -II)
SM9 organic mud (548-500 cm) and zone SM9-I
The deposits of this phase consisting largely of organic
material are made up of fragments of a fen/swamp
vegetation. The diminution of the mineral content suggests
reduced erosion, probably reflecting the development
of a more closed vegetation on the surrounding slopes
wi th the onset of climatic amelioration. In this phase

64
aquatic vegetation became rich with Menyanthes trifoliata,
Myriophyllum alterniflorum, M. spicatum, M. verticillatum,
Nymphaea alba, Typha angustifolia/Sparganium, T.
latifolia, Sparganium minimum, Potamogeton-type, P.
natans, P. praelongus and P. cf. zizii, pointing to an
increased producti vi ty in the lake. The margins of the
lake supported a sedge-dominated community, including
Cladium mariscus, Ranunculaceae and Thalictrum minus
along with willow carr. Caltha palustris, Filipendula,
Potentilla palustris, Sanguisorba officinalis and Solanum
dulcamara may have been part of a tall herb community
in damp grassland. It appears that Betula spp. (B. pendula
and B. pubescens) and Populus tremula were the principal
trees on the spot. Thus Anti trichia curtipendula,
Eurhynchium praelongum and Hypnum cupressiforme agg.
could have grown on the tree bases. Amblystegium ?
riparium, A. varium and Sphagna (S. Sect. Acutifolia
and S. Sect. Cuspida ta) may have been present in damp
habitats.
This phase also saw the spread of Fontinalis antipyretica.
The stratigraphic section reveals that this aquatic
species did not colonize the northern side of the lake.
Only occasional leaves were recorded from SM4 and the
adjacent
in the
sampling
aquatic
points. Calliergon
bryoflora. Alisma
Ceratophyllum demersum, Hippuris
Potamogeton perfoliatus, P. pusillus
joined the rich-aquatic vegetation.
or decreased in numbers, probably
giganteum existed
plantago-aquatica,
vulgaris, Nuphar,
and P. obtusifolius
Algae disappeared
as a result of a
decrease in water level through strong evaporation under
warm and dry climatic condi tions in the early Flandrian
Period (the Boreal Period).

65
3. A meso trophic fen/swamp carr phase
SM4 zones SM4-VIII and SM4-IX (and SM4a; zone SM4a
III)
SM9 zones SM9-I1 and SM9-II1
This phase is characterized by a decline in the eutrophic
aquatic plant taxa and a rise in pollen and macrofossils
of monocots. There can be no doubt that the lake was
gradually filled with vegetation. The appearance of Care x
diandra, C" echinata, C. Sect. Extensae, C. flava-type,
C. Sect. Paniculata, C. vesicaria and Eriophorum supports
the idea that marginal communities spread towards the
middle of the lake (terrestrialization) and the
accumulation of organic deposits (peat formation) took
place. This may have eventually resulted in the
establishment of Alnus glutinosa and Salix sp., and the
expansion of fen and fen carr species, such as Angelica
sylvestris, Caltha palustris, Cicuta virosa, Eupatorium
canna binum, Fi I i pend ula ulmaria, Frangula alnus, Gali urn
palustre, Lycopus europaeus, Ranunculus Sect. Ranunculus,
R. repens, Rumex hydrolapathum, Solanum dulcamara and
Viola palustris. Betula 'and Populus were still important
in the tree layer. A broken nut shell belonging to Corylus
avellana recovered at 139-141 cm (SMl1) indicates the
local presence of this taxon. Frequent occurrence of
Hedera pollen suggests that this woody climber was either
climbing in the wood or creeping along the ground.
Woodland herbs Ajuga reptans, ?Fragaria vesca, Stachys
sylvatica and Rubus idaeus would have played some role
in the plant community. Cirsium heterophyllum/palustre,
Melampyrum, Lotus, Pteridium, Rumex crispus, Taraxacum
officinale and Urtica dioica may have occupied open parts
of the local woodland. Botrychium lunaria-type,
Cryptogramma, Dryopteris-type, Polypodium and the other
representati ves of Filicales may have occupied the field
layer of the woodland. The shade-tolerant components
of the moss flora survived, whereas Fontinalis
antipyretica completely disappeared. Calliergon giganteum
was replaced by C. cuspidatum in this phase. Bryum sp.,

66
Bryum sp./Mnium sp., Dicranella schreberana, Neckera
complanata, N. pumila, Dicranum scoparium, D. fuscescens,
Plagiomnium affine, Thuidium tamariscinum and Zygodon
viridissimus were also found, probably growing on the
tree trunks and bases.
4. A bog-heathland phase
SM4 zones SM4-IX and SM4-X
SM9 zone SM9-IV
Towards the top of the profile the occurrence of Sphagnum
papillosum in combination with high Erica1es pollen
values, macroscopic remains of Erica tetralix and Calluna
vulgaris and the presence of Aulacomnium palustre,
Glyceria flui tans, Juncus bul bosus, Montia fon tana,
Potentilla erecta and Ranunculus Sect. Flammula illustrate
oligotrophic condi tions and a bog-heathland development
on the site. The disappearance of aquatic species other
than Potamogeton-type and Menyanthes trifoliata is likely
to be due in part to the increasing acidification of
the site. This last phase of hydrosera1 succession
coincides wi th massive deforestration in the surrounding
~rea reflected in the deposition of bands of clay.

67
6. THIEVES' MOSS (NGR SD 771736)
6.1. Description of site
Thieves' Moss (5409' N, 220' W) lies at about 348 m
on the north-west of Moughton Scars above Crummack Dale,
on the Great Scar Limestone of the Ingleborough Massif
(see Figure 1.1.).
The main basin is in an oval depression on the plateau
and it is bounded to the north by a semicircle of
limestone cliffs which are about 15 m high. On the
southern side this limestone is well exposed, and it
forms limestone pavements (Plate 6.1.1.). To-day, there
are two springs collecting into a stream which crosses
the bog and disappears into the limestone. The present
vegetation is dominated by tussocks of Eriophorum
vaginatum with Calluna vulgaris, Erica tetralix and many
lichens in drier areas. Eriophorum angustifolium, Festuca
rubra, Juncus effusus, Carex echinata,
Sphagnum papillosum, Aulacomnium palustre
commune are present on damper parts of the
6.2. Stratigraphy
C. panicea,
and Polytrichum
bog.
A detailed section of Thieves' Moss constructed by Gosden
(1965) shows an asymmetrical development of earlier
sediments in the main basin (Figure 6.2.1.). Gosden
attributed this to differences in the depth of the rock
strata of each side. The two lake clays are separated
by a layer of organic mud on the gentler southern slope.
The upper clay is overlain by a shell marl which does
not reach the extreme south of the Moss. The marl is.
in turn, superseded by swamp vegetation. Hypnum peat.
Sphagnum peat and mixed peat.

N
Plate 6.1 . 1 . The basin of Thieves' Moss, viewed from the west showing the three coring sites .
s
c o

.outh
N[UU
H _ _
north
10 10 )0 40 \0 10 70 10
... 11-· D ..... c.., -,'
lliIIIIl • w::r
§ ",Jf'III"" _ •• •• e'
L L LLLLLLLLLL
L L L L L L L l L L L L L L L LLLLLLLLLLLLLL
LLLI..LLLLLLL.LL L L L L L L L L L
L L L
~~II ............. . t. 1
t=:=:=J _ .. 4 . .. ,
Figure 6 . 2 . 1 . A section of Thieves' Moss (taken from Gosden ,
11
-.-
Th ictves Moss. 1965.
1965) .
Q\ \0

70
Three cores extracted for the present study yielded the
following:
TM1 cm
118-125 - lake clay
125-143 - organic mud
143-168 - lake clay
TM2 cm
138-150 - a gradual transition to marl
150-182 - marl
182-186 - dark-brown organic mud
186-200 - lake clay
200-215 - organic clay
215- no penetration
TM3 cm
0-26 - dark, very humified, amorphous peat
26-79 - lighter Sphagnum peat (darker between
71-79 cm)
79-83 - wood peat
83-93 - fibrous peat
93-175 - light, brown, coarse, swampy fibrous
peat
175-185 - wood peat (mossy between 183-185 cm)
185-220 - organic mud
220-250 - shell marl
250-277 the alternation of organic mud and
shell marl
277-295 - organic mud with clay, silty from
281-291 cm
The surface relief of this raised bog suggests that there
has been erosion, leaving older peat deposits exposed
at the surface.
considerably.
The centre has been dissected

71
6.3. Macroscopic fossils
The macrofossil assemblages from three sampling points
are shown in Table 6.3.1.
6.4. Microscopic fossils and local pollen assemblage
zones
Microscopic fossils are
6.4.2., 6.4.3., 6.4.4.,
presented in Diagrams 6.4.1.,
6.4.5., 6.4.6. and Appendix 6,
7 and 8. Local pollen assemblage zones are given below:
TMI
Samples from TM1 contained pollen grains of deciduous
trees (principally Corylus) which are sometimes in
considerable quantities. Since their presence must be
the result of contamination, the values of these tree
pollen grains are not included in the description of
LPAZ. This means also that the pollen spectra cannot
be regarded as completely reliable.
TMI-I Pinus-Betula-Gramineae LPAZ
(151-149 em)
Total land pollen concentration is low. In the percentage
diagram Pinus, Betula and Gramineae are the main
contributors, but they present low concentration values,
as do other taxa. Artemisia and Rumex/Oxyria pollen is
well-represented.
The terminal boundary: Betula pollen increases.
TMI-II (149-120 em)
This zone is divided into subzones, on the basis of the
Betula and Juniperus curves.

72
TMI-Ila Betula-Gramineae-Cyperaceae LPAZ
(149-145 cm)
Total land pollen concentrations are higher than in the
preceding zone. Betula pollen is the dominant type.
Gramineae and Cyperaceae assume an importance. Artemisia
and Rumex/Oxyria pollen falls, whereas Filipendula pollen
rises. Hippophae appears at the top for the first time.
The terminal boundary: Juniperus pollen rises and Betula
pollen shows a further increase.
TMI-Ilb Betula-Juniperus-Gramineae-Cyperaceae LPAZ
(145-134 cm)
Juniperus has higher pollen values than in the preceding
subzone, reaching its maximum value of c.18% before
falling at the top. Hippophae is well-represented,
comprising up to 1.5% of TLP.
The terminal boundary: Juniperus pollen declines.
THI-Ilc Betula-Cyperaceae-Gramineae LPAZ
(134-124 cm)
This subzone is characterized by high Betula pollen
values, and by lower values of Juniperus pollen than
in the preceding subzone.
The terminal boundary: Betula pollen falls.
THI-Ild Betula-Gramineae-Cyperaceae LPAZ
(124-120 cm)
Total land pollen concentrations exhibit an initial
decrease, before rising at the top of this subzone. Betula
has lower values than in subzone TMI-Ilc. There is an
increase in the abundance of herbaceous taxa such as
Artemisia, Rumex/Oxyria and Thalictrum. Selaginella
becomes significant.

73
TH2
TH2-I Betula-Gramineae-Cyperaceae LPAZ
(214-206 cm)
Zone TM2-I is marked by high NAP values, up to c. 58%
of TLP. Betula is the main tree pollen type. Hippophae
forms a continuous curve, with values of 0.4-1.1%.
Thalictrum pollen is well-represented, reaching a maximum
value of 7%.
The terminal boundary: Juniperus pollen declines.
TH2-I1 (206-182 cm)
Two subzones are defined, with respect to the Betula
curve.
TH2-IIa Betula-Cyperaceae-Gramineae-Artemisia LPAZ
(206-188 cm)
Almost all taxa have lower pollen concentrations than
in zone TM2-I, with the exception of Artemisia. In the
percentage diagram, Betula is still the dominant type.
The contribution of herbaceous pollen continues to rise,
with Cyperaceae, Gramineae and Artemisia predominant.
Hippophae pollen occurs sporadically. Caryophyllaceae
and Selaginella become significant, though at low values.
The terminal boundary: Betula pollen falls.
TH2-IIb Gramineae-Cyperaceae-Betula-Rumex/Oxyria LPAZ
(188-182 cm)
NAP shows a further rise and becomes more important than
in the preceding subzone while Betula declines.
Rumex/Oxyria and Ranunculaceae pollen increases before
falling at the top of the subzone where Filipendula peaks
and Empetrum rises slightly.
The terminal boundary: Betula pollen increases.

74
TM2-II1 (182-142 cm)
This zone is divided into two subzones on the basis of
the Juniperus curve.
TM2-IIIa Betula-Juniperus LPAZ
(182-162 cm)
There is a rise in total pollen concentrations. Betula
and Juniperus pollen dominates this zone as NAP exhibits
a gradual fall throughout. Filipendula is well-represented
The terminal boundary: Juniperus pollen decreases.
TM2-IIIb Betula-Gramineae LPAZ
(164-142 cm)
NAP falls to 11.6% of TLP for the first time. Corylus
and Quercus first appear in this subzone. Betula pollen
is the main type (up to c.73%) though it decreases towards
the top, whilst Cory Ius values progressively rise.
Juniperus pollen declines by mid-zone and disappears
completely.
The terminal boundary: Corylus pollen rises.
TM2-IV Cory Ius-Betula LPAZ (Cory Ius Phase)
(142-126 cm)
Total pollen concentrations of this zone are higher than
in the preceding subzone. The expansion of Corylus which
began in the underlying zone continues and reaches 58%
of TLP. Betula declines steeply towards the top.
TM3
TM3-1 Corylus-Betula LPAZ (Corylus Phase)
(218-182 cm)
Corylus is the dominant type though it decreases towards
the top of the zone. Filicales peaks at the end.
The terminal boundary: Pinus pollen rises.

75
TM3-II (182-50 cm)
This zone is divided into two subzones, mainly on the
basis of Pinus pollen values.
TM3-IIa Corylus-Pinus-Cyperaceae LPAZ
(182-106 cm)
This subzone is characterized by a fall in total pollen
concentrations.
rises. After
Corylus percentages decline, whilst Pinus
an initial increase Cyperaceae pollen
exhibits fluctuations as does Eguisetum.
The terminal boundary: Pinus pollen shows a further rise.
TM3-IIb Pinus-Cory Ius LPAZ
(106-50 cm)
There is a conside'rable decrease in total land pollen
concentrations. Pinus is the major tree pollen. Cyperaceae
peaks nearly in the mid-zone, while Ericales and Sphagnum
become significant towards the end of this zone. Filicales
spores assume an importance.
The terminal boundary: Pinus pollen declines.
TM3-II1 (50-2 cm)
This zone is characterized by an increase in total land
pollen concentrations. Two subzones are defined, on the
basis of the Ericales curve.
TM3-IIIa Corylus-Ericales LPAZ
(50-6 cm)
Pinus pollen shows an abrupt decline. Corylus pollen
values rise, reaching a maximum value of c. 69% of TLP,
but then its values fall towards the top of the zone
as do those of non-herbaceous taxa, e. g. Alnus, Ulmus
and Quercus. Ericales becomes more significant, almost
throughout, while Gramineae and Cyperaceae start to
increase towards the end.

76
The terminal boundary: Ericales pollen rises.
TH3-IIIb Ericales-Corylus LPAZ
(6-2 cm)
A further rise in total land pollen concentrations and
Ericales values marks this subzone. Corylus pollen is
still the dominant non-herbaceous type, whereas NAP
increases considerably, con tri bu ting up to c. 54% of
TLP.
6.5. A tentative correlation of the local pollen
assemblage zones for the three cores from Thieves'
Hoss
It is suggested that the three cores from Thieves' Moss
provide almost a continuous pollen record from the
Lateglacial Period to the beginning of
2 (Figure 6.5.1.). Even though the profile
from con tamina tion, it appears that
the Flandrian
of TMl suffers
its uppermost
(sub)zone TMl-IId has similar features with the lowermost
zones of TM2, TM2-I and TM2-IIa. It is, however, difficult
to make a direct comparison between TMI-IId and either
of TM2-I and TM2-IIa because TMl-IId presents a mixture
of pollen characters of the main types from each zone.
The possible problems arising from contamination at TMl
and the absence of radiocarbon dates also influence
confident correlation. But, it appears that TMl-IId has
some features of the Younger Dryas Period more similar
to those in TM2-IIa than in TM2-I - lower Juniperus pollen
quantities and more significant Pinus, Caryophyllaceae
and Selaginella.
Another correlation has been made between TM2-IV and
TM3-I. There seem to be similar patterns in the pollen
curves of the zones, bu t higher pollen values of the
major tree taxa - particularly Betula, Quercus and Ulmus
at TM3 than those at TM2 make a direct comparison
difficult. Gradually increasing values of Quercus and
Ulmus in TM2-IV may indicate the beginning of the

TH1 TM2
LPAZ LPAZ
-
. . . TM2-IV .
TM2-IIIb
TM2-IIIa
TM2-IIb
.. TM2-IIa .. .
77
TM3
LPAZ
TM3-IIIb
TM3-IIIa
TM3-lIb
TM3-IIa
TM3-I
Radiocarbon years (BP)
c tlronozone .-
F12
6200±60
672S±70
7830±80 Fll
Devensian
s
TlU-IId . . . . . . TM2-I
TM1-IIb
TM1-llc
Tf<ll-IIa
TM1-I
Figure 6.5.1.
Late
glacial
A ten ta t i ve correlation 0 f the local pollen assemblage zones from Thieves' Moss and the (supposed) equivalent Flandrian chronozones. ( •••••• ) similarity; (------) end of deposition

78
establishment of these thermophilous taxa in the area
in the early stages of Flandrian 1. TM3-I might, on the
other hand, reflect a further expansion of deciduous
trees, corresponding to a later stage of Fl1.
6.6. A reconstruction of the local vegetational succession
at Thieyes' Hoss
Four main phases of development can be distinguished
for the Thieves' Moss site:
1. A lake with fringing swamp,
2. A fen/swamp phase,
3. A raised S12hagnum bog phase,
4. A heathland phase.
1. A lake with fringing swamp
Zones from TM1-I to TM2-IV (and TM3-I)
It appears that a lake occupied the site in the early
stages of development, probably at the close of the Late-
Devensian Glaciation. There is no organic matter preservation in
151 cm. However,
the profile of sampling point TM1
towards the upper part of the
below
basal
clay organiC content gradually increases. In this phase
a community of aquatic plants inhabited the lake,
including microscopic algae, Myrio12hyllum alterniflorum,
M. s12icatum, Nym12haea, Potamogeton-type, TY12ha
angustifolia/S12arganium and T. latifolia-type. The edge
of the basin was probably occupied by a sedge stand with
Salix, Fili12endula, Ranunculaceae, Thalictrum, Galium-type
and Urtica. If abundant leaves of S12hagnum are not
contamination it might be inferred that it was present
on damper parts
likely. The dry
of the spot, but contamination is
ground supported characteristic
more
taxa
of the Lateglacial such as Em12etrum, Artemisia, Saussurea
type, Helian themum, Rumex/Oxyria and Saxifraga spp. The
local vegetation seems to have been 'open' in nature
at this time.

79
As a more dense vegetation cover developed in the
surrounding area wi th the onset of a further climatic
improvement, an organic material (organic mud) accumulated
in the Thieves' Moss lake. The earliest colonizers of
the locali ty still played an important role, e. g.
Filipendula and Thalictrum. Characeae oospores appear
at this time. Calliergon giganteum may have been present
in the moss layer of the swamp.
The following layer, lake clay, may indicate temporary
retardation of the hydroseral development under cooler
climatic conditions. The main components of the vegetation
remained but thermophilous taxa retreated. Grasses,
Artemisia, Caryophyllaceae, Rumex/Oxyria, Selaginella
and Racomitrium sp. became important. A nut of Carex
? lepidocarpa was recorded. The finds of moss fragments
in the profile of TM2 may show that unstable slopes around
the lake were invaded by mosses.
A return to warmer climatic conditions resulted in organic
material (organic mud and marl) deposition and expansion
of the thermophilous taxa on the site. A seed of Arenaria
norvegiea recovered at 186 em (TM2) is of special
interest. To-day two subspecies found in the British
Isles are rare and local plants of base-rich soils, A.
norvegica ssp. anglica being endemic to the limestone
of upper Ribblesdale (Clapham, Tutin & Moore, 1989).
The local occurrence of Betula was ascertained by the
finds of female catkin scales and fruits at several levels
of TM3. Sphagna (Sphagnum Sect. Acutifolia and S. Sect.
Cuspidata) were represented by occasional leaves and
spores. Their peat-forming function was probably not
very important at this time. The presence of Polytrichum
sp. was also recorded.
2. A fen/swamp phase Zone TM3-II (185-79 em)
In the second phase the mire saw a lowering of the ground

80
water table as a result of terrestralization. High
percentages of Cyperaceae pollen and Eguisetum spores
in the pollen spectrum and co-occurrence of macrofossil
finds of Carex sp., C. flava-type, C. Sect. Paniculatae
and Phragmi tes coincide wi th telma tic peat accumulation.
This was accompanied by the spread of birch (including
Betula pubescens) and the gradual establishment of Alnus
glutinosa on the mire surface. The members of the
aquatic community declined (except Potamogeton), but
brown mosses of wet areas (Calliergon giganteum,
Drepanocladus revolvens, Homalothecium cf. nitens and
Scorpidi um scorpio ides ) could find sui table places,
possibly by the shallower water. Bryum sp. and
representatives of Brachytheciaceae probably took some
part in the local woodland.
3. A raised Sphagnum bog phase
Zones TM3-II and TM3-III
The third phase was characterized by a rise in spores
and branch leaves of Sphagna, in combination with a
gradual rise in ericaceous pollen. As can be seen from
the sec tion of the site (F igure 6.2.1.) a raised bog
developed on the surface. It is likely that a considerable
increase of precipitation and humidity with the onset
of the Atlantic Period introduced suitable conditions
for the expansion of Sphagna (which occurred regularly
in earlier phases). The surface of the mire rose
considerably, due to the intensive growth of the deposit.
Thus the vegetation was isolated from mineral soil water,
which caused a lower nutrient status in the mire
(acidifica tion) and the disappearance of aquatic mosses
of rich-fens.
4. A heathland phase
Zone TM3-III (26-0 em)
The surface of the deposit reveals the development of
a heathland with abundant Ericales. Sphagna maintain
themselves, but in lower quantities. It might be inferred

81
that a decrease in precipitation at the end of the
Atlantic Period resulted in a drier bog surface which
stimulated the spread of low heath shrubs
(predominantly Ca11una vulgaris). Juncus sp. also entered
the community.
As mentioned before, the profile and the studied pollen
sequence show that erosion of parts of the upper peat
layer have taken place.

82
7. SUNSET HOLE (NGR SD 745759)
7.1. Description of site
The sampling site is approximately 0.3 km east of Sunset
Hole (54 11' N, 223' W) at an altitude of about 393
m (see Figure 1.1.). It is an eroded raised bog lying
on a drift-covered shelf on the lower slopes of the
Ingleborough Hill. The southern end of the site overlooks
the limestone pavements. A stream runs west-east through
the bog. The present vegetation consists of Sphagnum
on wetter parts, Eriophorum vaginatum, Erica tetralix
Trichophorum cespitosum and Vaccinium myrtillus on dry
parts and Deschampsia flexuosa in the very dry areas
of the site. The peat surface has been dissected by
erosion channels.
7.2. Stratigraphy
The stratigraphy, taken from a monolith, is as follows:
cm
0-30 - fine, highly humified Eriophorum
vagina tum-Call una-Sphagnum peat
30-50 - fibrous, lighter, humified Eriophorum
Call una-Sphagnum peat with Hypnum
cupressiforme agg.
50-210 - Eriophorum vagina tum peat with remains
of Sphagnum, Calluna and Aulacomnium
palustre, abundant charcoal from 145
to 160 cm. Wood remains appear at 95
cm
210-275 - wood peat with fruits of Betula sp.
275-278 - fine, silty material
278- solid material

83
7.3. Macroscopic fossils
The macroscopic fossils from one sampling point at Sunset
Hole have already been presented above, in connection
with the changes in the stratigraphic sequence.
7.4. Microscopic fossils and local pollen assemblage
zones
The pollen assemblages are shown in Diagrams 7.4.1.,
7.4.2.,7.4.3. and 7.4.4., while some rare pollen and
spore types are given in Appendix 9. Local pollen
assemblage zones are as follows:
SH-I (277-250 cm)
The Pinus curve provides a basis for division of this
zone - sub zones SH-Ia and SH-Ib.
SH-Ia Cory Ius-Pinus LPAZ
(277-260 cm)
Corylus and Pinus are the main types in this subzone.
Alnus, Tilia and Fraxinus are present at low values.
High quantities of Filicales spores occur.
The terminal boundary: Pinus pollen falls
SH-Ib Corylus-Betula LPAZ
(260-250 cm)
A further rise in Corylus and abrupt decline in Pinus
mark this zone. Betula pollen has higher values than
in the preceding subzone. Alnus pollen increases steeply.
The terminal boundary: Alnus pollen rises.
SH-II Alnus-Corylus LPAZ
(250-210 em)
Alnus pollen assumes a great importance t reaching over

84
50% of TLP. Corylus pollen is still significant, but
it has lower values than in SH-I.
The terminal boundary: Alnus pollen falls.
SH-III Alnus-Corylus-Betula LPAZ
(210-149.5 cm)
Alnus pollen has lower values than in the preceding zone.
Betula becomes important. Corylus pollen remains almost
constant. Ulmus pollen rises up to 5% of TLP. Tilia is
more frequent. Melampyrum, Filipendula and Ericales become
significant towards the middle of the zone where Fraxinus
pollen reappears. As Ericales declines, Gramineae,
Cyperaceae and Sphagnum become important. Towards the
top of this zone, Plantago spp. pollen first occurs.
The terminal boundary: The first elm decline is defined.
SH-IV Corylus-Ericales LPAZ
(149.5-10 cm)
The dotted lines in this zone (Diagrams 7.4.3 and 7.4.4.)
mark some important changes observed in the elm curve
and allow one to define five main phases.
Phase 1. A first elm decline (149.5-144 cm)
The first classical Ulmus decline is defined at 149.5
cm where elm pollen is at c. 0.8%. There is a rise in
TLP concentrations at the elm decline level. Corylus
is the dominant type. Tilia pollen is frequent. Gramineae
peaks in the middle while Cyperaceae and Ericales show
slight rise. Sphagnum spores are still abundant. Plantago
spp. pollen is significant, though at low values.
Phase 2. (143-137 cm)
Elm pollen falls considerably in this phase and it is
absent at 140 cm. Corylus and Gramineae peak in the middle
as Ericales falls. The last taxon along wi th Sphagnum

85
rises towards the top.
Phase 3. A partial recovery of elm (136-131 cm)
Elm pollen rises from 0.4% at 137 cm to 1.2% at 136 cm.
Corylus has lower percentage values than in the previous
phase. Alnus and Betula pollen falls as Ericales increases
considerably.
Phase 4. (130-120 cm)
Elm pollen shows a further rise in much of this phase.
Cory Ius becomes important again. Alnus and Betula pollen
values increase as Ericales declines.
Phase 5. (118.5-10 cm)
Elm pollen rises considerably in the beginning and then
it fl uc tua tes. Gramineae, Cyperaceae and Ericales pollen
also fluctuates; the last two taxa assume greater
importance. Corylus is predominant, along with Alnus.
Fraxinus pollen rises up to 3%. Tilia pollen occurs
regularly. Non-arboreal pollen increases towards the
top.
The terminal boundary: Ericales pollen rises.
SH-V Ericales-Corylus LPAZ
(10-5 cm)
There is a marked rise in total
concentrations. Ericales pollen dominates
Arboreal pollen is less significant.
land
this
pollen
zone.
7.5. A reconstruction of the local vegetational succession
at Sunset Hole
The stratigraphy and pollen spectra suggest
phases of development:
two main

86
1. A fen-carr phase,
2. An Eriophorum-Calluna-Sphagnum bog phase.
1. A fen-carr phase
Zones SH-I and SH-II
High Cory Ius and Pinus pollen percentages of zone SH
I may indicate that peat accumulation started in the
early stages of the Flandrian Period. Swales (1987)
reports an ancient radiocarbon date, 9400±100 BP, for
the basal peat of Sunset Hole. She adds that the true
age should lie between 8730 and 7450 BP, considering
the conventional values for the age of the rational rise
in the Corylus curve obtained from several sites in north
west England. The presence of Betula frui ts and Salix
wood fragments in the wood peat together with pollen
counts show that two taxa were growing on the spot.
Cory Ius may have been present locally or near the sampling
site. The pollen spectra suggest that there were openings
in the local woodland or scrub with Cyperaceae, Gramineae,
Filipendula, Melampyrum, Urtica, Chenopodiaceae,
Lycopodium, Pteridium and other light-demanding taxa.
High percentages of Filicales spores indicate the
importance of ferns as an undergrowth in the carr.
Halfway through the wood peat in the profile (zone SH
II) it appears that Alnus glutinosa spread into the area
under wetter conditions. At this time a more closed
tree canopy (including Betula) was established in the
locality.
2. An Eriophorum-Cal1una-Sphagnum bog phase
Zones SH-III, SH-IV and SH-V
The upper
reduction
boundary
in total
of the wood
land pollen
peat coincides with a
concentrations and the
beginning of the deposition of Eriophorum vaginatum peat,
along with Calluna, Sphagnum and Aulacomnium palustre
remains. An increased accumulation of organic matter
from the Eriophorum-dominated vegetation may have resulted

87
in faster rates of sedimentation leading to the dilution
of
by
pollen grains
a decline in
in the deposi t. This was accompanied
tree pollen and a rise in herbaceous
pollen. Almost complementary swings in the Ericales
(Calluna) and Cyperaceae and Gramineae curves which are
repeated several times throughout zones SH-III and -IV
could be explained by local changes on the bog surface
(Conway, 1954).
The first peak in Ericales pollen is coupled with an
increase in FiliQendula and MelamQlrum pollen and the
appearance of open ground taxa such as Artemisia,
Geranium, Plantago sp. , Teucrium, Trifolium· montanum-
type, Vicia-type and y. expansion of a heath and
the immediate area.
cracca-type, pointing to the
an opening up of the carr in
Aquatic pollen is not very
grains of HldrocotIle,
Potamogeton-type show that
well presented but scattered
MyrioQhyllum sQicatum and
shallow pools of the site
supported these taxa very occasionally.
Wood remains disappear above 95 cm, suggesting the removal
of the remaining elements of local carr, probably due,
in part, to an increased acidity on the site.
Higher up the profile HIQnum cUQressiforme agg. in
abundance between 30-50 cm indicates its association
wi th ericaceous plants a t this time. From 50 cm to the
top, ErioQhorum vaginatum is still the principal component
of the deposit and Cyperaceae pollen rises considerably.
However, there is an increase in remains of Calluna and
SQhagnum. It can be inferred that they became more
important in the bog development.

88
8. A RECONSTRUCTION OF THE REGIONAL VEGETATIONAL
SUCCESSION AND ENVIRONMENT
8.1. Lateglacial
The lowermost parts of the section from Sniddle Moss
4 and Thieves' Moss 2, and the upper part of the observed
sequence of Thieves' Moss 1 appear to provide some data
on flora and vegetation during the Lateglacial Period.
It is believed that the Thieves' Moss 1 pollen diagram
should be viewed with caution because as mentioned
elsewhere, the samples from this site suffer from
contamination. Therefore, the interpretation and
reconstruction of the regional vegetational development
and environment during the supposed early stages of the
Lateglacial Period are chiefly based on the Sniddle Moss
4 data. The studied sequence of Thieves' Moss 2 is taken
into consideration for the assumed later stages of this
period and it is tentatively correlated with SM4 (Figure
8.1.1. ) • Five main phases of the regional vegetational
succession are distinguished and the inferred vegetation
is summarized in Table 8.1.1.
PHASE 1. Very open vegetation
Since much of the basal clay of Thieves' Moss 1 lacks
any organic material (between 168 and 152 cm) it is
assumed that it may reflect a cold period prior to
establishment of a vegetation cover after deglaciation.
In zones Sniddle Moss SM4-I and Thieves' Moss TM1-I macro
and microfossils are found. Both have pollen at low
densities and seem to record the deposition of clays
in a very open, sparsely vegetated environment. They
may therefore be of a later age than the sterile sediments
of TM1. The presence of pollen of the oceanic Armeria
maritima at SM4 indicates that the mean January
temperature was not below _8 oC (Iversen, 1954). In damper
areas mosses become dominant while in drier areas

89
SM4 TM1 TM2
am -------__ u:lma:a,r----tm2-lIb
'-" '-"
.......
........ '-"
'-" -'-" '-" """
'-" '-" """
'-" '-" '-"
'-"
. . . . . sm-v
tm2-IIa
sm-Ivd tm2-1 · . . . . . . . . . . . . . . . . . . . . . . . . . . . . sm-IVC · . . . . . . . . . . . . . . . . . . . . . . .. . . . . . . . . . . . sm-lvb · . . . . . . . . . . . . . . . . . . . . . . . . . . . . . . . . . . sm-Iva
Sm-ll1C · . . . . . . . . . . . . . . . .. . . . . . . . . . . · . . \ \ \
sm-lllb ·sni-iu·a· sm-ll
\ sm-I \ \ \_--
. . . . . . . . . . . . . . . . .
tml-I
5
4
3
2
1
Figure 8.1.1. Comparability of the local pollen assemblage zones and sediment stratigraphies for Sniddle Moss 4 and Thieves' Moss 1 and 2.

Table 8.1.1. Ver,etnlJonnl recon~lrllclion of thc Lnlt'r.lncial Period for the
SNIUDLE ~IOSS LPAZ
Stl4-V
SM4-IV
SU4-1I1
Stl4-U
Stt4-1
1 n g Ie b 0 rOil g h Reg lOll 0 nth e () 11 ~ c r v e d I' 011 e.. 5 t rat i g r {) I'lt y 0 f Sniddle Moss (and Thieves' Moss).
TIIIEVES' tlOSS LI'AZ
nl2-llb nl2-lla
'nll-l
PIIASES
5
4
3
2
I
...: ~ P I-t IoJ 10
V) p ~ w ~ H Z P ..,
INFERREU VEGETATION
Upen grassland with abundant heliophy tes
0l,cn woodland wiLh tall herbs nnd increasing disturbed-soil species
Ollcn woodland wIth tall herbs
Open woodland
(Open) birch woodland
Partially closed grassland
Open grasslalHl
Open grassland with juniper and birch
Open grassland (herb rich grassland)
Very open .egelalion
_______ 2 ____ ==_=_==a=~a==_a====~=~=====s====s====:==_====m=========_=~=== ___ _
nil CI68-152cm) No organic material
\0 o

91
heliophytes began to assume importance. At this time,
deglaciated raw soils were rich in lime and slope
instability was common.
Very high percentages of particular taxa (e.g. Pinus
and Gramineae) are certainly the result of statistical
artefacts due to very low pollen deposition as seen in
the concentration diagram. Pennington (1970) stresses
the fact that Pinus pollen has been shown to be over
represented in many deposits of periods where local pollen
was sparse. Bartley (1967) reports the presence of Pinus
pollen grains from the surface samples of Arctic Quebec,
in an area some 885 km north of the forest. Where local
pollen production is low, as on ridge tops, the proportion
of coniferous pollen rises up to 16.6% of total pollen.
The low concentration values for Pinus in zones SM4-1
and TMI-I, in particular, indicate that this profilic
pollen producer cannot have been contributing materially
to the regional vegetation and its grains were merely
the product of long-distance transport. Both tree and
dwarf birch (the majority of Betula pollen grains belong
to tree birches) may have been present, but very sparse,
probably in shel tered locali ties. Juniperus and Empetrum
pollen can imply areas of a pioneer shrub-heath, perhaps
including dwarf birch and dwarf willow. The pollen of
Ephedra types (E. distachya and E. ? fragilis) is likely
to have been derived from long-distance dispersal from
the south, as shown by Birks (1973) at the present day.
PHASE 2. Open grassland (a transitional phase)
In the beginning of SM4-II a rise in total pollen
concentration values and organic content of the lake
sediment suggest an increase in biomass
of the ecosystem which resulted
and productivity
in soil humus
accumulation. The vegetation represented by this zone
wi th grasses,
Rumex/Oxyria
sedges, Salix (probably dwarf willow) and
pollen prominent was evidently open. Dwarf
willow in combination with Saxifraga types points to

92
a - light but never heavy snow cover during the winter
(Kolstrup, 1980). This may mean that the climate was
a limiting factor in this early phase of the regional
vegetational succession. However, an increase in the
productivity of aquatic vegetation with Potamogeton might
indicate that the climate was not severely limiting.
The pollen spectra, in fact, seem to represent a
transitional phase in vegetation development and soil
maturation, involving a gradual establishment of juniper
dominated scrub.
PHASE 3. Interrupted Juniperus phase
The beginning of this succeeding phase (SM4-IIIa) records
an initial development of juniper, along with a rise
in birch. But herbaceous taxa, predominantly grasses,
appear to have retained their importance. Salix and Rumex/
Oxyria were present, though there is a marked decline
in the latter. It is probable that the initial development
of juniper was interrupted by a climatic recession during
subzone SM4-IIIb. A drop in juniper pollen is accompanied
by a clay band along with increases in open- and
disturbed-ground taxa including Rumex/Oxyria, Artemisia,
Helianthemum and Thalictrum. The reduction in total land
pollen concentration values is marked, due probably to
a combination of reduced local pollen production and
increased sedimentation rate. It is -difficult to explain
the rise in Betula pollen at the time of the Juniperus
minimum. Betula nana perhaps comprises a reasonable
proportion of birch pollen. But this question will remain
uncertain unless dwarf birch pollen could be separated
quantitatively.
Pollen changes do not indicate major changes in vegetation
(both local and regional) but the presence of clay and
of taxa of open- ground suggest a change in vegetation
which allowed the erosion of mineral soils, i. e. a more
open vegetation with perhaps less scrub and grass.

93
Although the succeeding subzone SM4-IIIc also has abundant
grass pollen, its contrasting pollen flora and sediment
type with those of subzone SM4-IIIb provide strong
evidence for ecological changes. After a temporary
decline, juniper is likely to have colonized the
landscape. Hippophae and Empetrum also played a role
in the' scrub, the latter being less significant. As the
abundance of shrubs intolerant of shade demonstrates
an open landscape with some trees, so the presence of
many light-demanding herbs shows that the shrubs did
not form a complete cover. It seems that the climate
during this subzone became more favourable for
thermophilous juniper and Hippophae than in SM4-IIIa
and SM4-IIIb. According to Iversen (1954) these typical
heliophytes of pioneer woodlands demand a minimum July
temperature above 10 0 e. A rise in juniper and Hippophae
also indicate the presence of the tree-line and the
expansion of woodlands in the following phase when tree
birches spread over much of the region.
PHASE 4. Betula phase
Zone SM4-IV throughout demonstrates great fluctuations
in the birch curve along with the curves for other major
taxa. Pennington (1986) notices the close relationship
between the success of tree birches and the fluctuating
temperatures of the north-European Lateglacial. Tree
birch is generally considered to be sensitive to high
winds and low average temperatures. Sniddle Moss at low
altitude is an exposed site. In the light of these views,
it can be postulated that strong variations particularly
in tree birch values mirror the response of birch woods
to changes in temperature. Fluctuations in maj or taxa
frequencies in SM4-IV make interpretation difficult.
However, the sub zones of this zone chiefly based on birch
pollen values may allow one to draw a general picture
of the vegetation succession in the area during the birch
woodland phase.

--
94
It appears that a woodland dominated by tree Betula
(most Betula pollen are tree birch and the macroscopic
find of ~. pubescens at 278 cm at SM4 makes its presence
certain) developed in the beginning of this phase
(SM4-IVa). The frequent statoblasts of Cristatella mucedo
recovered support this context as .,g,. mucedo is absent
north of the timberline in Europe (Van Geel et al., 1980).
Juniper could have been suppressed due to the fact that
it became shaded out as tree density increased. At the
same time Filipendula assumed an importance in the tall
herb communi ties. This suggests a mean JUly temperature
of not less than 8-9 0 C (Kolstrup, 1979).
The following subzone SM4-IVb suggests that warmth-
demanding birch and Filipendula
and open-ground herbs showed an
in the vegetation cover is,
significantly reflected in the
became less important
expansion. This change
in fact, not very
pollen record and the
sedimentological change from marl to silty organic mud
does not help very much, though it might indicate lower
temperatures.
In subzone SM4-IVc birch and juniper appear to have
behaved in the way that Pennington (1975) suggested " •••
an interplay between birch and juniper wi thin a
fluctuating environment ••• " (p. 163). It is likely that
a temporary decline of birch trees in the previous subzone
introduced conditions in favour of juniper. Thus, juniper
could have penetrated into the open parts of the woodland.
But it would not have been able to flower freely as tree
birches spread widely at the end of this subzone.
Filipendula, on the other hand, became abundant in damper
areas.
It is thought that zone TM2-1 has, in general, similar
pollen features to much of subzone SM4-IVd. Both can
be interpreted as reflecting a transitional phase in
which warmth-demanding species began to decline as the
climate became more severe. This was coupled with an

95
increase in minerogenic material content. Open communities
became established gradually with an abundance of grasses,
sedges, Rumex/Oxyria and Artemisia. At Thieves' Moss
the Tha1ictrum representation is higher than at Sniddle
Moss, while Caryophy1laceae appears to have expanded
earlier at Sniddle Moss than at Thieves' Moss.
PHASE 5. Open grassland with abundant heliophytes
A fall in total land pollen concentration values in zone
SM4-V and subzones TM2-IIa and -lIb suggests a sparse
vegetation cover, although the lower concentration values
may, in part, have resul ted from rapid sediment
accumulation rates due to extensive inwashing of
minerogenic material. The significant reduction in the
thermophilous taxa (Betula, Juniperus, Hippophae and
Fi1ipendu1a) and further dominance of herb communities,
including cold-tolerant species such as Armeria and
Se1aginel1a, support the picture of the onset of climatic
deterioration.
The birch woods of the preceding phase may have contracted
considerably. However, some patches of birch woodland
may have survived in favoured localities, but they were
apparently of a more open nature. A reduced frequency
of Filipendula and Hippophae may indicate summer
temperature maxima somewhat below IOoC. An increase in
Artemisia pollen at both sites is noteworthy. This
increase appears to be a real rise since the
concentrations of this genus are higher in this
phase than in the preceding phase (4), in spite of low
local pollen deposition during the cold period. Iversen
(1954) says that species of Artemisia are usually
associated with dry and frost-disturbed soils. It is
less sensi ti ve to winter temperatures but it does not
to1era te much snow cover. Manley (1959), however, writes
of the local re-estab1ishment of small glaciers, which
must have required precipitation as snow, on Whernside
and Ing1eborough in the last episode of the Lateg1acla1

96
climatic oscillation. An increase in
of Artemisia in the lowlands is not
pollen deposition
so surprising but
in the Thieves' Moss area which is closer to the
re-established small glaciers of the Lateglacial Period
a rise in Artemisia pollen is particularly interesting.
This might be attributed to variations in snow cover,
even within very restricted area, probably related to
topography. Pennington (1980) considers the present
distribution of Artemisia in continental West Greenland.
She says "The parts of the mosaic where Artemisia borealis
grows today in Region 1 are relatively snow-free because
situated either on south-facing slopes or on ridges ••• "
(p. 197). In the Thieves' Moss area on well-drained scree
slopes facing south Artemisia may have assumed some
importance whereas the Ingleborough glaciers were probably
in the Arks above Sunset Hole, facing north.
Local differences in vegetation pattern between the study
areas during this cold phase appear to have been slight
and quanti ta ti ve rather than q uali ta ti ve. Both supported
a mosaic of vegetation types rich in species. In the
Sniddle Moss area Ranunculaceae along with Salix may
have been more significant than in the Thieves' Moss
area. Thalictrum was still more important at Thieves'
Moss than at Sniddle Moss. These small differences can
be at tri bu ted to variations in local en vi ronmen tal
conditions, competition and timing of population change.

97
8.2. Flandrian (Postglacial)
As explained in the Introduction palaeobotanical
investigations already carried out in the region have
provided da ta mainly on Flandrian events. Recent pollen
diagrams with associated radiocarbon dates from lowland
Craven particularly reveal variations in the vegetation.
Bartley et al. (1990) compare the vegetation sequences
from various locali ties in Craven in detail and discuss
the varying roles of climate, soil and human interference.
Swales (1987) gives some information about the
vegetational history of the Ingleborough Massif in
conj unction wi th archaeological evidence and radiocarbon
dates, Hence, a general picture of the Flandrian
vegetation development of the region is available. In
this study, the Flandrian pollen sequences of Sniddle
Moss and Thieves' Moss and the Sunset Hole pollen diagram
are used
to this
to add some complementary and compara ti ve data
picture. A brief account of the regional
vegetational succession with special reference to the
patterns of the Ulmus decline is presented below.
Tentative correlations of the Flandrian local pollen
assemblage zones from the study sites are summarized
in Figure 8.2.1. Sites frequently referred to in the
text are listed in Table 8.2.1.
Flandrian 1
The changes in the pollen curves show that the opening
of the Flandrian Period (c. 10,000 BP) corresponds to
the zones SM4-VI and TM2-IIIa. These curves demonstrate
that a more continuous vegetation cover consisting mainly
of juniper and grasses re-developed in the region. The
Sniddle Moss 4 pollen spectra show that the age of the
juniper maximum dated to 12,020±90 BP at 181 cm (Appendix
1) is too old because of the hard-water effect and it
is discounted. The continuing high values of total
herbaceous pollen in both zones mentioned above support

= ...... cc.. .:c:I w...., r: U fIl C w
.... til '; CU
~.... SM4
o SM4-X
1000 SM4-IXb SM4-IXa
..... ---2000
3000
4000
Hiatus
3000
6000
7000
8000 P-----
5~14-V:!:b
9000 S~l':' - \::!! a
S~14-r:::I
S~14-\'I
10000
SM4a
SM4a-!!!
~---
Hiatus
f-----
5M42-:!
S~14a-I
98
SM9 TM2 TM3
r-.---
Hiatus
f-----5119- IV
Sl19-II:i:
~---':'~13-!IIb
T!1.3-!!!a
S~!9-II I nIS-I!b
I S~19-1 I
!~13-IIa
TM3-I
nl::-Iv
TM:-IIIb
TM::-I!Ia
SH
----
SH-\'
SH-I\'
SH-III
SH-!!
SH-I
----
O'l CJ = C
c::I C ... N w C -cC c C = w .... .c "-u
F 13
-
F 12
~
F 11
L.-
Figure 8.2.1. A tentative correlation of the Flandrian local pollen assemblage zones of the study sites and the (supposed) equivalent Flandrian Chronozones. SM, Sniddle Moss; TM, Thieves' Moss; SH, Sunset Hole. (----) Beginning or end of deposition; (====) proposed boundary: ( ) radiocarbon-dated boundary.

Table 8.2.1. Sites frequently referred to in the text.
SITE ALTITUDE AUTHOR and DATE (MSL)
Helwith Moss (Ingleborough) 244 m Gosden 1963
Allotment Shooting Box (Ingleborough) 434 m
Arks (Ingleborough) 533 m
Braithwaite Wife Hole (Ingleborough) 354 m
Simon Fell (Ingleborough) 617 m
Tarn Moss (Malham, Craven) 381 m
Eshton Tarn (Lowland Craven) 144 m
Linton Mires (Lowland Craven) 190 m
Threshfield Moor (Lowland Craven) 282 m
White Moss (Lowland Craven) 190 m
Swales 1987
Swales 1987
Swales 1987
Swales 1987
Pigott & Pigott 1959 and 1963
Jones 1977; Bartley et a!. 1990
Jones 1977; Bartley et a!. 1990
Jones 1977; Bartley et a!. 1990
Jones 1977; Bartley et a!. 1990
\0 \0

100
the idea that the previous vegetation was only partially
replaced by pioneer woodland (open woodland). Many taxa
common during the preceding zones declined or disappeared
(e.g. Artemisia and Hippophae). However, some of the
members of the Lateglacial herbaceous flora such as
Helianthemum, Saxifraga types and Thalictrum persisted
into these zones. Saxifraga oppositifolia and ~. aizoides
are still growing on the limestone cliffs of Ingleborough
(Bartley & Clark, 1979). Penning ton (1964) also reports
the persistence of several Lateglacial herbs from the
Postglacial layers of Red Tarn in Langdale in the Lake
District. She concludes that this was the result of the
continuing active solifluction,
The organic sediments of zone
this implies the presence of
keeping the forest open.
SM4-VI contain clay and
erosion and inwashing of
minerogenic material. The range of species growing around
the study si tes is similar to those indicated by other
site localities, e.g. Arks II on Ingleborough, Ma1ham
Tarn Moss, Linton Mires and Threshfield Moor in the Craven
area. Clearly, there are also variations in the earliest
Flandrian vegetation pattern. For example, grasses appear
to have expanded more widely at Snidd1e Moss in the
boulder clay than at Thieves' Moss on the limestone.
In the succeeding zones SM4-VII and TM2-IIIb tree birches
spread and replaced the juniper-dominated scrub. At this
time both si tes saw the arrival and early expansion of
Corylus, as in much of the Craven area. Hazel may have
formed scrub or woodland in areas that Betula did not
colonize since it is intolerant of heavy shade and does
not flower effectively when light penetration is impaired
(Rackham, 1980). As at the Arks on the north-north-west
side of the Ingleborough Massif, at Thieves' Moss juniper
declines and disappears completely before Cory Ius rises
considerably in the following zone TM2-IV, whereas at
Sniddle Moss it persists into the Corylus-dominated
subzone SM4-Vllla. The coverage of birch woodland at
Thieves' Moss (birch pollen rises up to 80% of TLP) seems
to have been more dense than at Sniddle Moss, so juniper

101
scrub in the Thieves' Moss area may have thinned out
more rapidly due to dense shade cast by birch woods.
It is of special interest that scattered juniper bushes
can be found today on Mough ton, a bou t 1.5 km south-east
of Thieves' Moss.
According to Bartley ~ ale (1990) Pinus migrated into
the region and formed local stands in various parts of
Cra ven, especially on the well-drained limestone soils,
at least as early as 9430 BP. The very early establishment
of the Pinus before the Corylus phase has also been
identified at Helwith Moss situated on the eastern side
of the Ingleborough Massif. Bartley et ale make the point
that the early appearance of pine occurred in climatically
and edaphically fa voura ble sites. In addition to these
variables competition from birch woods may also have
been an important factor in the expansion of Pinus. For
ins tance, in the Thieves' Moss area, only c. 4.5 km from
Helwith Moss, Pinus pollen reaches only up to 20% (TM2-
IIIb). It appears that Pinus was unable to penetrate
into early Postglacial Betula woodland
sufficiently closed forest at Thieves' Moss.
forming a
At Sniddle Moss the last appearance of juniper is dated
at 9130±65 BP. This compares with the dates for the final
disappearance of juniper from the Arks (9240±90 BP) on
the Ingleborough Massif and Din Moss (9270±170 BP) lying
close to the Northumberland-Roxburghshire (Hibbert & Switsur, 1976). The Corylus expansion associated with
the fall in juniper is also synchronous at both Sniddle
Moss and Din Moss and the rational limit of Corylus has
been dated to 9120±170 BP at the latter site. As at
Thieves' Moss, at the Arks juniper declines before Corylus
increases. This trend suggests that hazel expanded later
in the upland areas than in the lowlands of the
Ingleborough Region.
In zones SM4-VIII, TM2-IV and TM3-1 Corylus becomes a
relatively important element of the woodland in the Boreal

102
Period. Although the percentages of Betula pollen decrease
at both sites, the concentrations do not, suggesting
that the' fall in pollen percentage is an artefact of
the percentage method due to the massive expansion of
Corylus pollen. Rackham (1980) says that Cory Ius pollen
dominance is likely to have emanated from Corylus canopy
woodland in the early Flandrian period. Thus in the region
birch and hazel may have been segregated, pro ba bly in
relation to the nutrient status of the soils. The
thermophilo~s Quercus and Ulmus could have gained a
foothold in suitable localities under warmer climatic
conditions,
at first,
landscape,
with Ulmus establishing itself more widely
possibly in better drained parts of the
e.g. at Eshton Tarn. Subzone SM4-Vlllb and
zones SM4a-I and TM3-1 record the arrival and sporadic
occurrence of Alnus. It must have begun to colonize wetter
places. The first appearance of alder at values of at
least 1% is dated to 7830±80 BP at Thieves' Moss 3 (TM
IIa). This date conforms well wi th the beginning of a
continuous curve for Alnus at an estimated date of c.
8000 BP at Crose Mere, Shropshire (Beales, 1980) and
White Moss, Craven.
In subzones SM4-Vlllb and TM3-IIa fluctuations in the
major taxa curves coincide with sedimentological and
consequent hydrological changes in the study site
localities. Additionally, there appear to have been
changes in the woodland cover. This is seen particularly
well in TM3-IIa with a number of conspicuous oscillations
in Pinus and Corylus pollen. These oscillations may point
to an interplay between pine and hazel in the forest.
With the beginning of subzones SM4a-II and TM3-IIb Pinus
assumes importance, after the rise in Corylus, following
the characteristic pattern of the Boreal Period in the
north and the west of England (Beales, 1980). Huntley
and Birks (1983) point out that values of pine pollen
> 25% probably reflect local presence of small areas
of pine in a forested landscape. Therefore. at both

103
Sniddle Moss and Thieves' Moss
to 50% would imply
The
at
maj or expansion
Thieves' Moss.
pine pollen rising up
local stands of pine.
place at 6725±70 BP
the spread of
of pine took
Other evidence from limestone areas
in the region also shows that pine was abundant on
limestone soils, e.g. at Tarn Moss (Malham), Linton Mires
and Threshfield Moor. According to Bennett (1984) such
soils may be too extreme for most deciduous species,
but Pinus syl vestris which is tolerant of such extreme
condi tions, would be favoured. Though Sniddle Moss lies
on poorly-drained soil, high pollen values of pine may
indicate that Pinus was established, perhaps on the slopes
of Newby. It is probable that soils around the Sniddle
Moss area became so dry that it was less favourable
to other trees and pine was able to colonize
Corylus-dominated woodland.
Flandrian 2
In the Atlantic Period the behaviour of Pinus and Alnus
in the study areas varies according to soil type as
described for the lowlands of Craven by Bartley ~ al.
(1990). At Thieves' Moss on drier (limestone) soil pine
declined by 6200±60 BP and it was (first) replaced by
Corylus (TM3-III) with a slight increase in Alnus, whereas
at Sniddle Moss on heavier soil it disappeared earlier,
at 6830±65 BP and Alnus rises to 20% (SM9-II) and then
to 40% or more with the increasing wetness of the Atlantic
Period. The beginning of a continuous curve for Alnus
is dated to 7305±60 BP at Sniddle Moss 9 (SM9-I). At
Thieves' Moss it dates from 7830±80 BP, and it seems
that alder grew very sparsely in the Thieves' Moss area,
for a long time before its main rise associated wi th
the increase in Corylus at c. 6200 BP. Well-drained soils
around Thieves' Moss are unlikely to have become wet
enough for Alnus and there was a long delay before it
increased to significant amounts. At Sniddle Moss in
the boulder clay the major expansion of Alnus, on the

104
other hand, occurred rapidly. Though radiocarbon dates
are not available for the Sunset Hole pollen diagram
now, it may be deduced that the pattern recognized at
Sniddle Moss 9 also applies to the Sunset Hole site lying
on a drift-covered shelf on the lower slopes of the
Ingleborough Hill. The fall in pine pollen in SH-Ib is
accompanied by an ini tial rise in Alnus and a slight
increase in Corylus. Unlike the Thieves' Moss 3 pollen
diagram, hazel never reaches more than 45% of TLP before
an abrupt rise in Alnus pollen with the beginning of
zone SH-II.
Despite the differences in the local pollen spectra,
taking the Ingle borough Region along wi th Craven as a
whole, in the Atlantic Period a mixed woodland has been
detec ted; oak/hazel wi th some elm on drier ground and
alder with birch and willow in damper places. Tilia pollen
appears in the pollen diagrams in small amounts. Greig
(1982) pOints out that lime may have been much more
important in the forests of the past. He says that values
of up to 30% corrected Tilia are considered small.
"Corrected" pollen values for Tilia are less than 30%
in the Ingleborough Region (e.g. about 13% at Sunset
Hole and 18% at Sniddle Moss) and in lowland Craven (e.g.
a bou t 13% at Whi te Moss), suggesting tha t lime was a
minor component of the mixed woodland.
This period was also marked by the initiation of bog
and heath development in upland areas (e.g. Thieves'
Moss and Tarn Moss). Before the onset of the following
chronozone, Flandrian 3, the forest seems to have been
more or less stable. There is however some evidence of
the activity of Mesolithic or early Neolithic people
in parts of the region. This will be taken up later in
the main discussion.

105
Flandrian 3 (Vegetational history in relation to human
interference)
The beginning of Flandrian 3 is conventionally defined
by the elm decline at a bou t 5000 BP. In this study, the
elm decline could be traced only at Sniddle Moss 9 and
Sunset Hole and it is dated at the former site. At
Thieves' Moss the elm decline is very close to the top
of the sediments and there is the possibility of erosion
and peat cutting. The date of 5050±50 from Sniddle Moss
9 is in good agreement with the dates obtained for the
first fall in elm pollen from other si tes in the region
- Arks I (5030±50 BP), Allotment Shooting Box (5160±60
BP), Eshton Tarn (5010±110) and White Moss (SOS8±100
BP). The pollen diagrams presenting the elm decline from
the site localities will be considered in relation to
changes in vegetation after the first classical elm
decline.
(a) From c. 5000-4000 BP
At Arks I zone AI3 (S030±SO - 3960±SO BP) and at Allotment
Shooting Box zone ASB2 (5160±60 4440±60 BP) are
characterized by a permanent decline in elm pollen
associated with increased representation of Corylus and
indicator species (Plantago 1anceolata, Rumex acetosa/
acetosella-type and Urtica) indicating pastoral farming.
At both sites at the elm decline level, there is a rise
in total pollen influx and concentration values. In zone
Arks .13 major changes in the composition of the woodland
are recorded. These changes include a temporary reduction
in birch and oak trees. At Allotment Shooting Box the
elm decline coincides with a decrease in arboreal pollen
percentages. The succeeding zone ASB3 of the Allotment
Shooting Box site marks a regeneration phase with a sharp
rise in non-herbaceous taxa percentages (up to 70% of
TLP) and a reduced number of clearance indicators. Swales
(1987) regards the increase in elm pollen dated to 4440±60
BP as a slight recovery of Ulmus which lasted c. 790
years. The end of zone ASB3 (3650±60 BP) shows a renewed

106
fall in elm pollen.
Bartley et al. (1990) recognize a series of clearance
phases in the Eshton Tarn zone ET5b, between the elm
decline (5010±10 BP) and the upper boundary of the zone
(3600±100 BP). Plantago lanceolata pollen appears
immediately after the elm decline and cereal pollen first
occurs in considerable amounts at an estimated date of
4500 BP. The same authors describe only low-level
interference in the woodland around Whi te Moss with
high values of non-herbaceous pollen (about 80% of TLP),
occasional grains of Plantago lanceolata and an
interrupted curve for cereal-type pollen (until c. 1470
BP). At Eshton Tarn in the limestone area Corylus appears
to be the dominant pollen type whereas at White Moss
in the boulder clay Alnus assumes greater importance
and Betula is more significant.
The descriptions of vegetational phases whose boundaries
are defined in respect of Ulmus pollen representation
for Sniddle Moss (zone SM9-III) and Sunset Hole (zone
SH-IV) have been given in Chap ters 5 and 7. Here, these
descriptions for each study site are interpreted and
then a brief comparison between the two sites is
presented. It should be emphasized that a proper
comparison can be given when radiocarbon dates are
available for the Sunset Hole site.
SHIDDLE MOSS (Diagrams 5.4.10. and 5.4.11.)
Phase 1. A first elm decline (From 118 cm to 108 cm)
The start of this phase is marked by the first classical
elm decline (dated to 5050±50 BP) at which there is a
rise in total pollen concentration and influx values.
Since total non-herbaceous pollen values (both
rela ti ve and a bsolu te)
pollen values, it
are still higher than herbaceous
may be inferred that openings
were of 1imi ted extent around Sniddle Moss. Both Alnus
and Quercus seem to have been the main elements of the

107
local forest. However, increased representation ofCory1us
reflects higher pollen production, probably due to a
(slightly) more open woodland structure. Tilia and
Fraxinus may also have benefi ted from such small-scale
clearances, possibly on the southern pavements of the
Ingleborough Massif. The first occurrence of Cerea1ia
type and Plantago lanceolata pollen is roughly dated
to 5010 BP. These types along wi th abundant Pteridium
may point to both arable
rise in the frequency of
and pastoral agriculture. A
Cyperaceae, Fi1ipendu1a and
Salix may merely indicate a wetter mire surface.
Phase 2. (From 107 cm to 90 cm)
Ulmus trees seem to have declined considerably by about
4935 BP (estimated) at 107 cm where elm pollen is absent.
Great fluctuations in total pollen influx values might
be the result ·of sedimentological changes rather than
instability in vegetation in this early period of forest
clearance. Abundant birch suggests that this
light-demanding species became important in damper areas.
However, it should be stated here that high percentages
of Betula pollen at 102 cm (47%) and at 104 cm (c. 73%)
are probably due to birch catkins, which also account
for an increase in total pollen influx values. The
occurrence of Cerea1ia-type pollen and other cultural
indicators such as Plantago lanceolata, Succisa and
Pteridium and weeds including Artemisia and Cirsium-type
might be taken as indicative of increased farming
practice. On the mire Fi1ipendula appears to have been
replaced by Melampyrum. Godwin (1975) cites that high
Me1ampyrum pollen frequencies are associated with
disturbance of the vegetation by fire (Mamakowa, 1968).
Since there is no charcoal at or around the Me1ampyrum
maximum levels, as mentioned previously it is probable
tha tit was only an element of a mesotrophic fen-carr
community.

108
Phase 3. A partial recovery of elm (From 88 cm to 76
cm)
A . partial recovery of the elm pollen commencing at 88
cm is dated to 4710±45 BP. At 86 cm total pollen influx
values decline, but elm pollen exhibits a rise, suggesting
a real increase and regeneration of elm trees at c. 4670
BP. However, during this phase elm pollen never fully
recovers nor regains its former proportions. An increase
in . pollen of non-herbaceous taxa and the disappearance
of Cerealia-type and Plantago lanceolata pollen can be
interpreted as the abandonment of agricultural areas.
But frequent Pteridium spores may signify that pastoral
farming continued or at least that there were openings
in the woodland cover, as indicated by the presence of
weeds (e.g. Cirsium-type and Cruciferae).
Phase 4. A secondary fall in elm (From 74 cm to 70, cm)
A secondary elm decline at about 4520 BP, in which other
trees also diminish, can be regarded as a clearance phase.
There is, in fact, nothing to suggest that this represents
a further forest clearance because there is no increase
in cultural indicators and weed species. The rise of
Cyperaceae and corresponding drop in alder pollen may
ha ve been caused by changes in mire hydrology. This may
also be affecting the percentage values of Ulmus.
Phase 5. A renewed recovery of elm (From 66 cm to 26
cm)
A renewed recovery of elm pollen is dated to about 4420
BP at 66 cm. Ulmus never again attains its former values
but it appears to
phase 3, but only
show abetter recovery than that in
for one sample. This is paralleled
by a rise in non-herbaceous taxa pOinting to forest
regeneration. The decline in farming (until almost mid-
phase) might have promoted the expansion of trees such
as birch which regenerates and flowers quickly. Alder
would have colonized damper ground. On drier places.

109
have played a role and
as deterioration
then
in
it was
soil
replaced
fertility
hazel may
by oak,
increased
perhaps
in the Sniddle Moss area. Elm along with ash
and lime probably took some part on base-rich soils upon
the limestone pavements. The absence of most cultural
indicators supports the idea that agricultural land was
abandoned. However, towards the top, a gradual decline
in non-herbaceous taxa and reappearance of Plantago
lanceolata and Cerealia-type pollen and frequent Pteridium
spores may demonstrate that forest destruction started
again, at about 4200 BP.
SUNSET HOLE (Diagrams 7.4.3. and 7.4.4.)
Phase 1. A first elm decline (From 149.5 cm to 144 cm)
The first classical elm decline is recognized at 149.5
cm. Since the elm decline is apparently a synchronous
event for various parts of the Craven District, it is
thought that it may also date from about 5000 BP at the
Sunset Hole site. Other associated changes include a
rise in Corylus. Hazel may have spread into areas
previously occupied by Ulmus. Ilex pollen appears at
147 cm. Woodland of open structure may have facilitated
the establishment and flowering of Ilex. The occurrence
of Cerealia-type pollen in combination wi th other
disturbance-indicator species such as Plantago spp.,
Urtica, Rumex/Oxyria and Pteridium suggests clearance
for pastoral and arable agriculture close to the Sunset
Hole site. There is abundant charcoal in the peat
around the level of the elm decline. Though Ericales
(Calluna) shows a slight increase at this time, its rise
might be taken as an indication of its response to fire
(Odgaard, 1992).
Phase 2. (From 143 cm to 137 cm)
This phase records a further fall in elm pollen and its
absence at 140 cm accompanied by a further rise in Corylus
pollen reaching 50% of TLP. It is likely that hazel became
the dominant species in the woodland. Cultural indicators

110
show the continuation of pastoral farming.
Phase 3.
cm)
A partial
in total
decreased
A partial recovery of elm (From 136 cm to 131
recovery of elm pollen coincides wi th a rise
land pollen concentrations due to either
sedimentation rates or increased pollen
production. The Ulmus curve shows a slight recovery and
it might be postulated that elm trees may have started
to occupy their former places with Corylus gradually
being shaded out by elm trees on the better quality soils.
It is also noteworthy that species associated with various
aspects of man's farming activities become sparse. All
these may suggest a regeneration phase. A fall in both
birch and alder pollen matched by abundant Ericales pollen
might be explained by a change to more heathy, and
presumably drier, condi tions on slopes as well as on
the bog surface.
I
Phase 4. (From 130 cm to 120 cm) and Phase 5. (From 118.5
cm to 60 cm)
These following phases record low values of cultural
indicators and weeds reflecting decreased farming activity
and allowing the forest to recover. During much of phase
4 Ulmus pollen shows a further rise. At this time elm
trees may have expanded in the hazel-dominated woodland.
Again, during phase 4 increased representation of birch
and alder could be connected with wetter conditions in
the vicini ty of the Sunset Hole si te. In the beginning
of phase 5 a considerable rise in elm (up to 5% of TLP)
represents a real increase in elm pollen reaching the
bog. Although there is little evidence of forest clearance
in the Sunset Hole area, a conspicuous rise in ash pollen
along with the presence of Ti1ia and I1ex pollen in phase
5 may suggest their expansion onto limestone pavements.

111
A brief comparison between Sniddle Moss and Sunset Hole:
(a) The general pa t tern of elm pollen changes in phases
1, 2 and 3 seems to be the same at both sites.
(b) The decline of elm in phase 4 at Sniddle Moss may
be correlated with minimum values of Ulmus pollen at
132 cm in SH3 (Sunset Hole - phase 3) and at 122 cm in
SH4 (phase 4).
(c) SHS shows fluctuating values of elm pollen, which
are not as high as at pre-elm decline times, but much
higher than in phase 5 at Sniddle Moss.
(d) Betula and Salix are. temporarily very conspicuous
at Sniddle Moss. It is probable that both taxa assumed
some importance on the damper soils in the Sniddle Moss
area. At Sunset Hole Salix, in particular, is not very
conspicuous. This would be attributed to lack of suitable
soils in the Sunset Hole area.
(e) At Sniddle Moss Fraxinus becomes important after
the elm decline whereas at Sunset Hole it is present
before the elm decline. Later, in phase 5 ash is better
represented at Sunset Hole than at Sniddle Moss. There
is no doubt that ash was more successful on limestone
pavements in the uplands than in the boulder clay in
the lowlands.
(f) The very conspicuous spread of heath at Sunset Hole
could be local and it may partly reflect the elm decline
because of acidification of soils. Unlike Sunset Hole,
the Sniddle Moss site shows little spread of heath. This
may go with the much slighter evidence for forest
clearance in that area.
(g) Melampyrum is more abundant at Sunset Hole than at
Sniddle Moss, suggesting an open woodland in the vicinity
of Sunset Hole.

112
(h) Polypodium is more important at Sniddle Moss than
at Sunset Hole. This may point to denser forest in the
lowlands. To-day Polypodium grows on the ground and on
the branches of oak trees in the damp woods of the
Ingleton Gorges, a short distance from Sniddle Moss
(Bartley, personal communication).
(b) From c. 4000 BP - present day
The growth rate of the uppermost zone of Sniddle Moss
9 (SM9-IV) has been used to estimate the range of the
age for the peat from 26 cm to 14 cm, this being
between c. 3920 BP and 3770 BP (see Figure 5.5.2.). Zone
SM9-IV reveals that on the sampling site and its immediate
surrounding birch carr took over from the alder carr
with conditions becoming more acid. Birch along with
Sphagnum may have colonized the wetter ground while
Ericales (Ca lluna) would have spread over drier areas.
Other trees may have retreated due partly to increased
acidification of soils around the Sniddle Moss site.
There are signs of continuous pastoral farming with
Plantago lanceolata, Rumex/Oxyria, Rumex acetosa-type,
Succisa and Pteridium, and of a little arable activity.
Weeds include Artemisia, Chenopodiaceae, Cruciferae and
Vicia cracca-type.
A comparison of the pollen curves in the upper part of
the Sunset Hole pollen diagram produced for this study
with those in the earlier dated pollen diagram given
by Swales (1987) suggests that the sediments from 60
cm to 30 cm may correspond to a period between c. 3850
BP and 2970 BP. During this stage it is probable that
in the locality of Sunset Hole, as acid heath/bog
development spread over wider areas including the upper
slopes to the north, the remaining trees were reduced
gradually. The significant pollen of clearance indicator
species Plantago, Rumex/Oxyria, Urtica and Pteridium
demonstrates that pastoral agriculture was practised.

113
The pollen spectra of SM9-IV and of Sunset Hole (zone
SH-IV) presented by a section of the profile between
60 cm to 30 cm may be correlated with Arks I (AI4) and
Simon Fell I (SFI3). The lower boundary of AI4 at 3960±SO
BP and of SFI3 at 3810±SO BP is defined as the beginning
of more intensive clearance phase with pastoral-based
economy (Early Bronze Age). In the pollen diagrams from
the Massif (Arks, Simon Fell and Sunset Hole) both Cory Ius
and Fraxinus pollen, in particular, are more abundant
than in the Sniddle Moss 9 (zone SM9-IV) pollen diagram.
It is likely that hazel and ash were completely restricted
to the limestone pavements and colonized cleared areas.
Thus, the Sniddle Moss site and its immediate surrounding
on deteriorating soils may have been receiving hazel
and ash pollen mainly from upland vegetation, only a
few kilometres away.
At Braithwaite Wife Hole and Allotment Shooting Box a
more extensive Early Bronze Age clearance phase commenced
later, at c. 3680 BP and 36S0±60 BP respectively. At
Arks (AIS) large-scale clearances with pastoralism' and
cereal cultivation continued during the mid-Bronze Age
(c. 3400±SO BP). The Simon Fell (SFIS) area also saw
massive clearance (pastoral) until c. 1400 BP (Anglo
Saxon times) corresponding to the end of peat growth.
Swales (1987) says that the surface of the Sunset Hole
site seems to have stopped growing and erosion is
underway. She gives an estimated date of c. 1820 BP for
the surface samples of Sunset Hole using the growth rate
of peat and she concludes that the pollen record appears
to be missing from the beginning of Romano-British-times
to the present day. As in other areas of the Ingleborough
Massif in the Sunset Hole area heath and bog development
became more widespread from Early Bronze Age onwards.
The pollen spectra of zone SH-V indicate that opened
areas were still under grazing pressure with typical
species of grassland such as Plantago spp., Urtica and
Pteridium, but Rumex/Oxyria disappeared.

114
Pigott and Pigott (1959 and 1963) interpreted the great
rise of herb pollen in the upper part of the Malham Tarn
Moss diagrams as being in early zone VIII (Godwin's
zona tion) and contemporary wi th the Iron Age. Abundant
Plantago lanceolata, Artemisia and Rumex pollen along
wi th the occurrence of cereal pollen has been assigned
to the increase of agriculture. Continuous rise in the
ratio of herb to tree pollen throughout the uppermost
layers has been taken as indicative of the progressive
destruction· of woodland associated with the Norse
settlements and historic periods.
According to Bartley et a1. (1990) there appear to have
been changes in agricultural practice around Eshton Tarn
in lowland Craven at about 3800 BP. The first major
increase in Plantago lanceo1ata and Gramineae pollen
dated to 3600±100 BP (Early Bronze Age) may compare with
more intensi ve clearance phases started around or after
4000 BP on the Ing1eborough Massif. At White Moss in
the boulder clay, some 18 km from Eshton Tarn, the
beginning of the major agricultural activity is dated
to 1470±100 BP, approximately 2000 years later than at
Eshton Tarn.
In zone SM4-IX of the Sniddle Moss 4 pollen diagram
reduced tree pollen values coincide wi th bands of clay
and a sharp increase in pollen of herbaceous taxa probably
reflecting extensive forest clearance, consequent erosion
of mineral soils and flooding of the mire surface. This
resulted in reduced pollen production from trees both
allowing the grassland pollen to reach the Sniddle Moss
site in greater amounts and to have a greater
representation. Trees probably occupied a very minor
part of the landscape at this time. The nature of the
pollen curves for the main taxa in zone SM4-IX resembles
that of the upper zones of White Moss (WMI-6 and WMI-7)
representing a period from Anglo-Saxon times onwards.
In both pollen diagrams there is a major rise in cereal
type and Plantago lanceolata pollen. In zone SM4-IX these

115
two cuI tural types show almost a gradual increase. If
it is supposed that SM4-IX also dates from Anglo-Saxon
times, on the basis of the similari ties wi th the White
Moss zones, it seems that a part of the vegetational
record from about 3770 BP (Early Bronze Age) to around
1500 BP is missing in the observed sequence of Sniddle
Moss. If this assumption is correct, it may be deduced
that, as at White Moss, at Sniddle Moss intensive farming
acti vi ty took place later than in limestone areas. This
assumption also supports the contention of Bartley et
al. (1990) that on the unattractive heavy soils of Craven,
agriculture remained at a low level until at least the
Anglo-Saxon Period, whereas on the fertile limestone
soils extensive agriculture started earlier, in the Bronze
Age.
The uppermost zone SM4-X exhibits the removal of most
remaining woodland in the maj ori ty of localities: tree
and shrub cover must by now have been reduced more
consistently, leaving a quite open environment with areas
of acid grassland and heath, which are similar to those
of to-day.

116
9. DISCUSSION
9.1. Lateglacial
In the previous chapter some regional aspects of the
Lateglacial vegetation and environment with regard to
the Sniddle Moss 4 (and Thieves' Moss 2) data, have been
pres en ted. In this chapter, these data are tenta ti vely
correlated and compared with other Lateglacial sequences,
and some of these correlations are discussed. Sites
referred to in the text are located on Figure 9.1.1.
The proposed climatostratigraphic correlation of the
pollen sequence at Snidd1e Moss 4 (and Thieves' Moss)
wi th the scheme of Lowe and Gray (1980) is illustrated
in Table 9.1.1.
There
Late
is general agreement
Devensian glaciation
that within
was followed
NW Europe the
by a marked
climatic improvement at about or sometime before 13,000
BP (Mangerud ~ a1., 1974; Coope, 1977; Lowe & Gray,
1980). According to Atkinson et a1. (1987) coleopteran
evidence suggests that from 14,500 BP until just before
13,000 BP the Bri tish climate was characterized by very
cold winter months and the first warming took place at
about 13,000 BP. Therefore, the lowest pol1eniferous
sediments of the study sites (zones SM4-I and TM1-I)
reflecting a very open landscape (Phase 1) may coincide
with a date of around 13,000 BP. The climatostratigraphic
scheme proposed by Lowe and Gray (1980) places the main
interstadial episode of the Lateglacial between 13,000
and 12,000 BP. The succeeding phases 2 and 3 might be
equated with this unit.
Phase 2 characterized by the Gramineae-Cyperaceae-Salix
Rumex/Oxyria local pollen assemblage zone at Sniddle
Moss shows affinities with the features of the first
pollen assemblage zones defined for a number of
Lateg1acial sites in northern Britain and Ireland. Salix

o 100 I---...J
km
117
Figure 9.1.1. Locations of Lateglacial sites in Britain and Ireland referred to in the text.
1. Ballybetagh
2. Bingley Bog
3. Blea Tarn
4. Blelham Bog
5. Cam Loch
6. Chat Moss
7. J
Connemara
8. Dunshaughlin
9. Gransmoor
10. Kildale
11. Llanilid
12. Llyn Gwernan
13. Loch an t'Suidhe
14. Low Wray Bay
15. Pulpit Hill
16. Sniddle Moss (and Thieves' Moss)
17. Tadcaster
18. The Bog
19. The Burren
20. The Lower Tees Basin

r
Table 9.1.1. The proposed
Sniddle Moss
(1980).
climatostratigraphic correlation of the
4 (and Thieves' Moss) with the scheme
pollen
of Lowe
sequence at
and Gray
SNIDDLE HOSS L PAZ 1" II 1 EVE S ' H 0 S S L r A Z
SH4-V
TH2-llb ~ra.ineae-CJPeraceae-8etula-Rumel/0Ilri8
Craaineae-CJperaceae-(Betula)-Artemisia -------------------------------------------------
TH2-lla Betula-CJperaceae-Craaineae-Artealsia
SH4-1Vd 8etula-Craaineae-C,peraceae-Fillpendula TH2-1 ~-Cra.ine8e-CJPeraceae
----------------------------------------------------------------------------------------------------SH4-IVc 8etula-Craaineae-C,peraceae-(Juniperus)
SH4-1Vb C,peraceae-Graaineae-Betula
SH4-1V. Betula-Gra.ineae-CJperaceae-Filipendula
SH4-IIIc Graalneae-C,pereceae-Junlperus
SH4-qIb Graalneae-C,peraceae
SH4-IIIa Craalneae-Junlperus-C,peraceae
SH4-U Cra.ineae-CJperaceae-Salil-RuNel/OI,ria
SH4-1 Pinus-Craaineae THI-1 ~-Detula-Graaineae
THI (168-152 ca) No organic aatter
Yegetational Phases
5
4
3
2
LOWE & GRAY (1980)
FLANDRIAN INTERSTADIAL
Transition
lounger Drlas Stadial
Transit ion
Lateglacial Interatadial
Transition
LATE DEVENSIAN
RADIOCARBON nARS (DP)
10,000
10,500
11,000
12,000
13,000
14,000
..... ..... ex>

119
(herbacea), particularly, appears to have been an
important element of the earliest vegetation in the Lake
District, e.g. at B1e1ham Bog and Low Wray Bay, Windermere
and at B1ea Tarn, Longdale (Pennington, 1977) and in
eastern Ireland, e.g. Ba11ybetagh and Dunshaughlin (Watts,
1977). Pennington (1975) also records significant Salix
pollen values from the supposed equivalent zone of Cam
Loch in Sutherland, north-west Scotland. At Snidd1e Moss
Salix pollen never exceeds 15% of total land pollen but
at Pennington's sites it has higher values than at Sniddle
Moss, especially at B1ea Tarn reaching over 40%
(Pennington, 1970). The varia bi1i ty of Sal i x values may
only represent a difference in the location of boring
sites relative to "the nearest willow communities because
its pollen is poorly dispersed. Alternatively, it may
present a pattern related to specific environmental
parameters, such as snowfall. Since Pennington's sites
are located further west, higher Salix (herbacea) pollen
values at her sites might be attributed to more snow
cover in the extreme west than in the study area.
The early expansion of Juniperus before the Betula phase
in the early parts of the interstadial has been widely
recognized at western sites in Britain (Pennington, 1977).
At Snidd1e Moss, juniper exhibits almost a two-forked
curve before the tree birch peak (SM4-IVa) which resembles
that found at B1ea Tarn, at an altitude of 187 m, among
the mountains of the central Lake District. At both sites,
after an initial rise juniper temporarily declines.
Pennington (1970) deduces from her pollen diagram that
the first juniper phase precedes a more chianophilous
vegetation with Betula nana and Lycopodium se1aso.
Geochemical analyses at Blea Tarn are in agreement with
the palynological data and suggest a renewed
frost-disturbance of the soils (Pennington and Lishman,
1971). This first climatic oscillation of the Lateglacial
appears to be synchronous over Europe and it dates from
an age in the range of c. 12,500 to 12,000 BP, e.g. in
Scandinavia (Bj6rck ~ a1., 1988), 1n Switzerland {Lotter

120
et ~., 1992), in Ireland and Britain (Watts, 1980;
Atkinson et a1., 1987). The juniper decline which has
been dated to 12, 120±130 BP at Llyn Gwernan, west Wales
(Lowe & Lowe, 1989) and to 12,255±70 BP at Llanilid,
sou th Wales (Walker & Harkness, 1990) is compared wi th
this widespread event. The Snidd1e Moss subzone SM4-
IIIb might be also correlated with the same period.
In earlier papers the pollen record equated with the
interstadial phase after a
climate is often compared
brief phase of deteriorating
with the Allerod Chronozone
of Mangerud et al., (1974) characterized by a cooling
trend. However, in recent works a relatively warm period
following the first climatic cooling in the early
part of the Lateg1acia1 has been identified, e.g. those
from north-west Scotland, at Loch an t'Suidhe on the
Isle of Mull (Lowe & Walker, 1986) and at Pulpi t Hill
near Oban (Tipping, 1991). At the first site, the later
(warm) episode of the interstadial is marked by a rise
in Empetrum whereas at Tipping's site open grassland
with a slight rise in juniper and Empetrum is described.
Subzone SM4-IIIc at Sniddle Moss wi th high juniper and
significant Hippophae rhamnoides pollen appears to fit
into the pattern observed at the sites quoted above.
High Hippophae values are generally characteristic of
the inferred climatic recession episode of the Lateg1acia1
interstadial (the Older Dryas equivalent) in the north
east of England, as at Kildale, the Cleveland Dales
(zone KA-3) ( Jones, 1977) and at The Bog, Ross (subzone
RB-1b) (Beckett, 1981). According to Beckett, during
the early climatic deterioration of the interstadial
phase in eastern England the temperature drop was less
marked and less pronounced oceanic conditions may have
been major factors, allowing the spread of Hippophae.
Pennington (1975) points to the presence of more oceanic
climate with warmer winters and greater precipitation
in western Britain during the earlier stages of the
Lateglacial. A delay in the establishment of Hippophae
in the region of Snidd1e Moss may be explained by the

121
persis tence of oceani ty, pro ba bly un til the later
interstadial phase. Hippophae may have expanded, perhaps
with a decrease in precipitation.
As mentioned previously, the Sniddle Moss zone SM4-IV
demonstrates fluctuations in the major taxa curves during
the birch phase. At many si tes in Bri tain and Ireland,
strong fluctuations in the pollen record are accompanied
by signs of climatic deterioration and the increased
deposi tion 0 f mineral material (Pennington, 1977; Watts,
1980). Both conventional radiocarbon age determinations
and recently published accelerator dates support the
idea that a fall in temperatures and climatic
deterioration began at about 12,000 BP. Even though much
of the lithostratigraphic section of Sniddle Moss
corresponding to zone SM4-IV does not provide any
significant evidence of erosion, great fluctuations in
pollen values seem to be consistent with the general
climatic trend. This may permit the correlation of zone
SM4-IV with the transition unit of
climatostratigraphic scheme of Lowe and Gray
spanning from c. 12,000 to 11,000 BP.
the
(1980),
The beginning of the Sniddle Moss subzone SM4-IVa records
an abrupt rise of birch pollen. There are a number of
sites showing high values of birch in the southern part
of the north of England and in the north-east, e. g. at
Tadcaster 50% (Bartley, 1962), The Bog, Ross 75%
(Becket t, 1981) and at Bingley Bog in the Aire Valley
of Pennines 70% (Keen et al., 1988). Further north
in Cleveland (Jones, 1977) and the lower Tees Basin
(Bellamy et al., 1966) birch wood was less established.
Again, in Lancashire-Cheshire, e. g. at Chat Moss (Birks,
1965) where Betula values are less than 20%, birch woods
were poorly developed. Bartley and Morgan (1990) discuss
the Lateglacial distribution of Betula and note that
birch became established in areas of high relief, perhaps
on sunny south-facing slopes but on exposed lowlands
it was not so successful. The lower percentages of Betula

122
pollen (up to 44% of TLP) at Sniddle Moss in an area
of relatively low relief accord with this contention.
Subzone SM4-IVb is marked by a decline in birch along
with other warmth-demanding taxa. The fall in birch pollen
values has been dated to 11,344±90 BP in the Windermere
profile (Pennington, 1977). More recent works reveal
evidence for a pre-Younger Dryas climatic oscillation.
Isotopic traces in ice cores from Greenland and in lake
profiles from Swi tzerland and faunal records from North
Atlantic deep-sea cores (Broecker ~ al., 1988) led to
the proposal of a possible cold event prior to the onset
of the Younger Dryas Stadial. Lotter et al., (1992) stress
that in many profiles, small or very short oscillations
in the pollen curves may often be missed. They compare
the Swiss oxygen isotope profiles and notice a second
climatic oscillation (before the Younger Dryas biozone
c. 10,700-10,000 BP). Walker and Harkness (1990) report
a date of c. 11,400 BP for the Betula decline at Llanilid.
They correlate this date with an age of 11,500 BP
estimated by Broecker ~ al. and the date from Windermere.
In the 8th International Palynological Congress (1992)
several authors also presented data supportive of a pre
Younger Dryas climatic oscillation; Levesque ~ al. from
a number of si tes in Canada, 0' Connell ~ al. from the
southern parts of the Burren and Connemara in western
Ireland and Walker et al. from Gransmoor, East Yorkshire,
Bri tain. Again, though evidence from Sniddle Moss 4 is
not very strong, subzone SM4-IVb might be tentatively
compared with the same episode.
Much of subzones SM4-IVc and -IVd with increased
thermophilous species percentages and total land pollen
concentration values may coincide with the Llanilid zone
L-6 (Walker & Harkness, 1990) reflecting a short-lived
recovery of Betula dated to c. 11,300 BP and the second
Betula peak associated with fauna-rich in southern species
at Gransmoor (Walker et a1.). The authors interpret these
changes as showing a rise in temperatures immediately

123
before the Younger Dryas. Atkinson et a1. (1987) also
record a brief period of warming around 11,300 BP.
The most prominent period of climatic cooling of the
Lateglacial is considered to be the Younger Dryas Stadial.
The dates assigned to the beginning of this episode from
various parts of Europe are in broad agreement with
the age of about 11,000 BP (Mangerud et a1., 1974; Lowe
& Gray, 1980). There is clear evidence for renewed
mountain glaciation in Ireland (Watts, 1977 and 1980)
and in northwest England (Manley, 1959) and in Scotland
where there was major glacier growth during the Loch
Lomond Stadial (Sissons, 1974 and 1976). Zone SM4-V and
the correlated subzones of Thieves' Moss 2 (TM2-IIa and
-lIb) with low pollen density and extremely minerogenic
sediments seem to corroborate this event. The end of
the Lateglacia1 Period is usually dated at 10,000 BP.

124
9.2. Flandrian (Postglacial)
Pre-elm decline disturbance
Previously, it was thought that Mesolithic peoples Ii ved
within the framework of their environment without changing
it significantly. However, this view has been contested
and there is a growing body of evidence for the
possibility of human interference in the early Flandrian
vegetation (both the Boreal and Atlantic periods) of
Bri tain and Ireland. For example, Smi th (1970) suggests
that expansion of hazel may be connected with Mesolithic
ac ti vi ty. Smi th and Goddard (1991) at tri bute the decline
of the pine pollen curve at the Boreal-Atlantic transition
to intentional burning by man. A further hypothesis
involves association between the rise in Alnus pollen
and charcoal which has been taken as evidence for
vegetational disturbance by Mesolithic peoples (Smith,
1984j Smith & Cloutman, 1988). The possible anthropogenic
changes visible in pre-elm decline deposits of Britain
and Ireland also include the appearance of cereals (from
about 6500 BP) and increases in representation of
agriculturally significant weed taxa such as Plantago
lanceola ta, Pterid i um, Rumex, Urtica and Composi tae
Tubuliflorae (Edwards & Hirons, 1984 and Peglar, 1993).
Occupation sites dating to the Mesolithic Period (c.
10,250-5650 BP) are well known in parts of the Craven
District (see Chapter 3). It has been shown that there
is palaeoecological evidence of possible Mesolithic
ac ti vi ty in the region. Bartley et al. (1990) recognize'
a few indications of instability in vegetation of lowland
Craven in both Boreal and Atlantic times. Wide
fluctuations in the major taxa such as hazel, pine and
alder associa ted wi th the increase in mineral input in
the early Flandrian sediments of Eshton Tarn and Linton
Mires have been ascribed to human interference. At
Threshfield Moor at an altitude of c. 282 m the early

125
initiation of heathland development and frequent
occurrence of Sphagnum spores after the first pine maximum
at early stages have been interpreted as the acidification
of the thin drift soils, probably following disturbance
in the woodland.
In the early Flandrian subzones of the study sites Sniddle
Moss SM4-VIIIb and Thieves' Moss TM3-IIa, dated to c.
8000-6725 BP, fluctuations in the maj or curves coincide
with sedimentological and consequent hydroseral changes
(telmatic peat accumulation) (see Chapters 5 and 6).
As explained elsewhere, TM3-IIa also appears to reflec t
changes in the hazel-pine dominated forest but there
is no significant evidence of human interference with
the vegetation, accompanying these changes. However,
as at Threshfield Moor. towards the top of the succeeding
subzone of Thieves' Moss TM3-IIb (c. 6725-6200 BP)
increased representation of Ericales and Sphagnum follows
the pine dominance. This is coupled with a peak of Rumex/
Oxyria and abundant Cruciferae pollen, suggesting
disturbance by man. Similarly. the lower part of the
Sunset Hole zone SH-III with frequent Eriophorum remains,
Sphagnum. Melampyrum and later Ericales shows the
acidi fica tion of the soi 1 on the si te • probably towards
the close of the Atlantic Period. The pollen data from
Thieves' Moss and Sunset Hole site localities appear
to agree with Swales's (1987) suggestion that small-scale
clearance of the forest in parts of the Ingleborough
Massif started below the Atlantic/Sub-Boreal transition
(at about 5700 BP) due to activities of late Mesolithic
or early Neoli thic people. The course of natural
acidification of upland soils is related to changes in
vegetation from mixed woodland to heath and bog
development (Pennington, 1991). It might be postulated
that man's activity accelerated the soil deterioration
(podsolization) in areas of glacial drift on the Massif,
which probably began wi th the maj or climatic shift to
the more oceanic regime of the Atlantic Period.

126
At Sniddle Moss (SM9) after c. 6830 BP the curves for
the main components of the vegetation (chiefly Alnus
and Cyperaceae) exhi bi t great fluc t ua tions, perhaps due
partly to local changes and variation in sedimen ta tion.
There are signs of meso trophic conditions on the mire
(see Chapter 5), but up to the level 126-128 cm where
charcoal is found the pollen spectra demonstrate no
evidence for human interference. Open ground taxa appear
only occasionally wi th the exception of Pteridi urn spores
which become abundant after about 5685 BP. Charcoal has
been recovered from the sediments at both Sniddle Moss
and Sunset Hole. At Sniddle Moss it occurs some way below
the elm decline (126-128 cm) and at Sunset Hole it occurs
at 145-160 cm which lies across the elm decline. It
remains debatable whether fire was directly used in
clearance. However, it is thought that in Northern England
Mesolithic people were deliberately managing the woodland
by using fire (e.g. Simmons, 1969 and 1975; Mellars 1976;
Jacobi ~ a1., 1976; Simmons ~ al., 1981; Simmons &
Innes, 1987). Mesolithic horizons containing flints are
often associated with charcoal deposits, as at Stump
Cross near Grassington, in the era ven District (Walker,
1956). Charcoal layers are also found in other site
locali ties of Craven, for example at Malham Tarn Moss
(Pigot t & Pigott, 1959 and 1963) and Great Close Pasture
(Smith, 1986) where again there is abundance of mesolithic
artefacts. The charcoal, if anthropogenic in origin,
may merely derive from local domestic fire settings
(Edwards, 1988) or it may represent the reduced screening
effect of woodland close to the sampling site (Hirons
& Edwards t 1990). No mesoli thic remains are known from
the immediate vicinity of either Sniddle Moss or Sunset
Hole. Therefore, the find of charcoal from the study
sites might be consistent with the second hypothesis
put forward by Hirons and Edwards. Another aspect
of the charcoal is that in the Craven District its
abundance
suggesting
seems to be reduced after
a decline in the incidence
about 5000 BP,
of fires. This
pattern is similar to that found in the North York Moors
127
(Simmons & Innes, 1981) and in Scotland (Edwards & McIntosh, 1988; Edwards, 1990; Hirons & Edwards, 1990).
A fire-decreased model may reflect a change of woodland
management at the Mesolithic-Neolithic transition, as
deduced by Simmons and Innes. Apart from man-fire
relationship, it is feasible to state that pre-elm decline
deposits of Craven also feature the establishment of
grazing land. At Tarn Moss a rise in herb pollen
associated with Plantago lanceo1ata, Urtica dioica and
Chenopodiaceae has been correlated with the activity
of man. At Eshton Tarn in lowland Craven immediately
below the elm decline increased representation of
Gramineae pollen and the appearance of Plantago
lanceolata, Rumex acetose11a and Succisa have been
interpreted as indicating human interference. Coming
to the Ingleborough Region, the mid-Flandrian pollen
zones of Arks I, Allotment Shooting Box, Sunset Hole
and Thieves' Moss on the Massif and of Snidd1e Moss on
Newby Moor also demonstrates the occurrence of cultural
indicators (such as Pteridium and Rumex spp.) along with
other ruderals including Chenopodiaceae, Cruciferae and
Cirsium-type, suggesting pastoral economy.
In earlier studies the elm decline has been defined as
the first horizon in pollen profiles marking the
ac ti vi ties of agriculturalists. However, taken together,
the palynological data from the Craven District seem
to support the idea of supposed Mesolithic disturbance
and early Neolithic agriculture prior to the elm decline.
The elm decline
Before commencing a discussion of the elm decline it
might be worthwhile to summarize some of the important
features of this event and subsequent changes in the
elm pollen curves in the Craven District:
(a) The first classical elm decline of c. 5000-5100 BP
appears to be synchronous in the region.

128
(b) In the concentration and influx pollen diagrams
produced for the study sites and other sites on the Massif
at elm-decline times there is a rise in the values of
total pollen concentration and influx which shows that
the elm decline is a real phenomenon and it is not a
statistical response to the increased frequencies of
other pollen types.
(c) The elm pollen formerly rising up to 20% at si tes
on well-drained limestone soils and to 10% in areas
of glacial drift falls to less than 1% of TLP a t the
first elm decline in almost all localities. In other
words, the first elm decline shows a consistent pattern
from site to site on different soils.
(d) It displays a dramatic effect over an extensive area
because elm trees do not seem to regain completely their
former habitats, even on limestone.
(e) The elm decline itself is usually accompanied by
palynological indications of human activity and forest
clearance.
(f) At Sniddle Moss 9 two periods of recovery, roughly
dated to c. 4700 BP and 4420 BP respectively, are defined
and the latter comparing wi th a similar recovery dated
to c. 4440 BP at Allotment Shooting Box.
(g) At Sniddle Moss 9 a second elm decline is recognized
at an estimated date of 4520 BP which is earlier than
the dates from Allotment Shooting Box (c. 3650 BP) and
Arks I (c. 3960 BP).
Much attention has been given to the first classical
elm decline at about 5000 BP and it is widely reported
from north-west Europe (Huntley & Birks, 1983). Four
main hypotheses have been put forward to explain it:
changes in climate, soil deterioration, anthropogenic
effects on the vegetation and disease. The idea of marked
climatic change was originally proposed by Iversen in

129
the early 1940' s (Troels-Smi th, 1960) on the basis of
the decreasing values of thermophilous types such as
Hedera, Tilia and Ulmus pollen in Danish pollen diagrams.
However, this explanation has received much less support
as there is a lack of evidence from other sources (Ten
Hove, 1968; Godwin, 1975). In more recent works, absolute
changes in the behaviour of pollen curves around elm
decline times show that there is a reduction in pollen
concen tra tion and influx values (e. g. Smith & Clou tman,
1988; Hirons & Edwards, 1990; Whittington et al., 1991b).
Hirons and Edwards (1990) suggest that a general pattern
of reduced pollen production might indicate the influence
of widespread climatic change. A climatic deterioration
is not made likely by the associated increase of warmth
demanding trees like Fraxinus and Tilia along with the
occurrence of Hedera and Ilex pollen at and around the
time of the elm decline in parts of Craven. In addition,
the absolute pollen diagrams from the Ingleborough Region
displaying an increase in total pollen concentration
and influx values also argue against the suggestion of
Hirons and Edwards (1990).
Another factor besides climatic conditions is that of
soil deterioration. Elm demands a nutrient-rich soil
and podso1ization could slowly impede its ability to
grow on poor soils. Sturludottir and Turner (1985) suggest
that the cumulative effect of centuries of Mesolithic
activity resulted in soil depletion, leading to a decline
in elm populations. A gradual fall in frequency may be
expected on poor, badly-drained soils with the onset
of waterlogged conditions and soil leaching for whatever
reason, as at Sniddle Moss and White Moss. However, since
the elm decline is consistent on both poor and base-rich
soils of the Craven District, this interpretation may
also be discounted.
The coincidence of
agricul tural ac ti vi ty
the
by
first clear indications of
Neoli thic peoples wi th the elm
decline has led to the proposal of an anthropogenic cause

130
(Troels-Smith, 1960; Iversen, 1973). Troels-Smith
suggested that Neolithic man was selectively using elm
as fodder for livestock. Such method of managing woodlands
still persists in several parts of Europe and Asia
(Hybroek, 1963). The associated changes in the pollen
assemblages of Craven at elm-decline times and the
existence of evidence for Neolithic settlement in the
region seem to accord with an anthropogenic-explanation.
But the idea of selective utilization of elm is not
entirely supported because the pollen of other trees
of contrasting ecological requirements (e. g. Pinus,
Quercus, Betula and Alnus) also declines. This is
particularly conspicuous in limestone areas, e.g. at
Eshton Tarn and Tarn Moss. The fact that remains of
Neoli thic age come mainly from the limestone caves and
rock shelters of the uplands reflects marked differences
in prehistoric activity between the uplands and the
lowlands. Thus the synchronei ty of the elm decline all
over the region reduces the probability of a solely
human cause to explain the biotic crisis. Disease might
be the most likely primary cause, with early human
interference providing conditions which encouraged its
spread, as suggested by Rackham (1980, 1986 and 1988),
Groenman-van Waa ter.inge (1983) and Peglar (1993) • The
disease hypothesis was initially put forward by Iversen
in 1955 (Troels-Smith, 1960). What pathogen could have
been involved is unfortunately unknown. The current
elm disease (Dutch elm disease) is caused by the fungus,
Ceratocystis ulmi which is transmitted by bark beetle
Scolytus spp. Hybroek (1963) once rejected a disease
induced elm decline in Neolithic times but the recent
outbreak of Dutch elm disease has renewed interest in
this as a possibility. Perry and Moore (1987) have shown
similarities between current changes in elm-containing
woodlands and the Neolithic elm-decline. Also, Moore
(1984) has recorded the discovery of the beetle, Scolytus
scolytus in Neolithic deposits on Hampstead Heath, as
a clue to pre-historical decline of elms.

131
At elm-decline times, the death of elm trees in areas
decimated by elm disease may have created additional
space in the forest of Craven which was already undergoing
some changes through the activity of Mesolithic and
early Neolithic people. This would have allowed the
increased response of the light-demanding trees such
as Corylus and Fraxinus, r~sulting in the frequently
observed rises in their pollen. The more open canopy
and continued farming would also have encouraged open
ground taxa (e. g. Plan tago lanceola ta, Pteridi um and
Urtica). Elm trees damaged by man for pollarding or
ring-barking, as today, would be more subj ec t to fa tal
pathogen attack than undamaged trees (Huntley & Birks,
1983). Thus the spread of the disease may have been
accelerated by the arrival of new people (Neolithic
people) who brought new ideas to the Craven District.
In many pollen diagrams elm pollen shows a recovery after
the first decline. Huntley and Birks (1983) have drawn
attention to a marked geographic variation in pattern
of elm regeneration across north-west Europe. The recovery
phenomenon is particularly strong in Ireland (e. g.
0' Connell, 1980; Hirons & Edwards, 1986) and at Black
Loch, Fife, Scotland (Whittington ~ al., 1991b). In
England elm populations, on the other hand, never regained
their former status after 5000 BP, probably as a result
of soil acidity, competition, human activity and
decimation of populations to values too low for any
subsequent recovery (Birks, 1990).
Elm trees never fully recovered in the Craven District,
but the increased elm pollen values after the first
decline at Sniddle Moss, Sunset Hole and Allotment
Shooting Box are noteworthy. The work by Rackham (1980)
demonstrated that some modern elms are resistant to Dutch
elm disease. Thus it does not seem unreasonable to suppose
that elm populations recovered, at least partially. after
the devastation of pathogenic attack. Estimated time
of expansion from minimum to higher values after the

132
first decline of elm for the Sniddle Moss site is
approximately 350 radiocarbon years. Watts (1982) suggests
that the lag between the first decline and the recovery
reflects the time required for individuals that survived
the epidemic due to natural immunity, isolation or reduced
pathogenic
There is
virulence or for inj ured trees to recover.
no doubt that local factors such as soil
conditions and ecological competition also played an
important role during the time of the recovery of elms
in Craven.
The pollen evidence from the study site localities shows
that the nature of the elm regeneration varied from site
to si te. Elm trees seem to have made a better recovery
on limestone soils near Sunset Hole than in areas of
poor soil (Sniddle Moss). Similarly, at the recovery
time, elm pollen is better ( .represented
Tarn than at White Moss.
As already interpreted in the context of
at Eshton
the elm recovery
within the study areas, Sniddle Moss and Sunset Hole
(Chapter 8), the changes in the pollen curves suggest
a reduction of farming. It may be the case that the
abandonment of agricultural areas helped elm to recover on poor soils as well as on the bet ter soils. However,
incomplete recovery of elm populations, even on limestone
soils, raises the question of causation. Here, on the
basis of the evidence available the possibility of
competition from other trees - particularly Corylus which
appears to have formed dense areas of shrub on the
limestone pavements - might be counted.
Several authors (e.g. Hirons & Edwards, 1986; Whittington
et a1., 1991 b; Edwards & McDonald, 1991) consider the - -second elm decline which succeeded the recovery of elm.
The second elm decline is what Hirons and Edwards (1986)
refer to as the possible synchronous event which occurred
between 4470 BP and 3945 BP in Britain and Ireland.
Several explanations analogous to the debate surrounding

133
the cause of the first elm decline have been presented;
for example. disease (Bennett. 1983) , human
al., 1991b)
impact
and a (Garbett. 1981; Whi t tington et
combination of continuous low levels of the disease and
continued human activity (Peg1ar, 1993).
During the secondary elm decline of c. 4520-4470 BP in
phase 4 of Sniddle Moss there is no clear evidence of
possible clearance. Therefore, the idea of a renewed
activity of the pathogen might be tentatively considered~
Estimated dates of 4520-4470 BP from Sniddle Moss 9 may
compare with the dates of 4470-3945 BP ci ted by Hirons
and Edwards (1986). However, the second elm decline may
demand explanations specific to each locality and it
is very early to assert a case for its synchroneity.
The Neolithic Clearances (From 5000 BP - c. 4000 BP)
In the immediate post-elm period Neolithic woodland
destruction phases for farming purposes, as originally
described by Iversen (1956 and 1973), appear in most
of the pollen diagrams from Craven. In the Sniddle Moss
9 pollen diagram clearance phases appear as episodes
of about 500-600 years duration. This correlates with
the estimated longevi ty of the same phase, between 585
and 720 years, for the Ingleborough Massif (Swales, 1987).
Another coincidence is that in both the uplands and the
lowlands of the Ing1eborough Region Neolithic forest
clearance was taking place some 700 years after the
establishment of the first agriculture. Iversen (1956
and 1973) suggests the cutting down of the forest and
subsequent burning. As already pointed out elsewhere,
however, no significant quantities of charcoal have
been recorded from post-elm decline deposits of the Craven
District. It might be suggested that man-induced clearance
was chiefly affected by felling rather than burning.
Polished hand-axes da ting from Neolithic times recovered
on Over Pasture on the Ingleborough Massif (Gilks & Lord,
1985) and by Great Close and Fountain Fell (Pigott &

134
Pigott, 1959 and 1963) may also point to the involvement
of felling.
The pollen data from the Ingleborough Region seem to
indicate the episodes of clearances taking place in the
context of a pastoral economy, with little crop growing,
deduced from frequent occurrence of pastoral indicators.
The date of about 5010 BP for the first appearance of
cereal-type pollen in the pollen record of Sniddle Moss
9 suggests· that in the Ingleborough Region, though on
a minor scale, cereal cultivation may have started earlier
than in lowland Craven where cereal-type pollen first
appears at an estimated date of 4500 BP (at Eshton Tarn).
Another aspect of the episodes as recognized in the pollen
profiles of the Ingleborough Region is that long-term
Neolithic disturbance was followed by a short
forest-regeneration phase. The longevity of this phase
(some 220 years) revealed at Sniddle Moss also accords
with the duration of about 200-550 years on the Massif
(Swales, 1987).
The beginning of major episodes of forest clearance
started at approximately 3840-4200 BP in the Craven
District. This suggests that the later Neolithic or early
Bronze Age was a time of maj or human impac t on the
vegetation. The archaeological evidence points to late
Neolithic and early Bronze Age overlap in the region
(see Chapter 3). It might be tentatively inferred that
an increase in local population resulted in more intensive
woodland destruction, especially on high-quality limestone
soils.
From c. 4000 BP - present day
As mentioned elsewhere, it appears that intensive farming
continued on the fertile limestone soils of Craven while
the maj ori ty of si tes (including Snidd1e Moss) in the
boulder clay saw more intensive clearance later (from

135
Anglo-Saxon Period).

136
10. CONCLUSION
The importance of the results of this study lies in two
main areas of interest:
(a) By means of both percentage and concentration diagrams
it has been possible to describe the Devensian Lateglacial
vegetational history of the area around Sniddle Moss.
(b) Relative and absolute pollen diagrams produced for
the study sites (Sniddle Moss/radiocarbon-dated and Sunset
Hole) are the only pollen sequences from the Craven
District which show the elm decline and the associated
events in detail.
A reconstruction of the principal Lateglacial vegetational
changes for the Ingleborough Region based mainly on
Sniddle Moss 4 data is shown in Table 8.1.1. In general
terms, the pattern of these vegetational changes is
simi lar to that observed at 0 ther La teglacial sites in
western England, notably the spread of the juniper-scrub
followed by the expansion of birch trees during the
Interstadial. There are, however, several features of
the data from SM4 and TM1 to which attention should be
directed in further studies of Lateglacial history {n
the Craven District.
(1) There is very little pollen-stratigraphic evidence
(from SM4) for the occurrence of phases of retrogressive
vegetation development prior to the Younger Dryas Period.
(2) There are great fluctuations in the pollen curves
in the SM4 Lateglacial pollen diagram, particularly
in phase 4, which may be due partly to the influence
of local site factors.
(3) Contamination in the profile of TM1 makes the
interpretation of the TM1 data and the inference of the
early and middle Lateglacial vegetation in the immediate
vicinity of the site very difficult.
The existence of short-lived climatic oscillations during
the Interstadial remains an enigmatic aspect of

137
Lateglacial pollen-sequences. Such events may be recorded
at Sniddle Moss (and Thieves' Moss) but as mentioned
above, evidence is slight and not conclusive. More
detailed analyses at closer sampling intervals involving
geochemical data might be useful to establish the
occurrence of such climatic episodes. These may also
help to understand the extent of site-specific influences.
It is hoped that further sampling of Thieves' Moss (1)
may produce contamination-free material.
As explained in the discussion, there is a growing body
of evidence for the possibility of human interference
in the pre-Ulmus decline forests in parts of Britain
and Ireland. The present study shows no significant
evidence in support of human interference with the early
Flandrian vegetation. It is however possible to relate
the changes in forest composition of the early Flandrian
to changes in climatic conditions (dryness, wetness,
etc.) and soils • At the beginning of the Flandrian at
Sniddle Moss on the wet peaty soils in the lowland grasses
expanded widely and then juniper established itself in
this grassy vegetation. On the other hand, on drier
limestone soils in the uplands, as at Thieves' Moss,
grasses were not important and birch and juniper almost
eq ually invaded a more open vegetation. In the lowland,
grass and juniper-dominated vegetation remained important
up to about 9130 BP but it was invaded by birch and hazel,
the latter. eventually becoming dominant with some pine.
In the upland birch shaded out juniper and, perhaps for
a relatively short
woodland. This was
time, must have formed almost pure
then replaced by hazel which became
the dominant tree on the drier soils as in the lowland.
In the late Boreal Period pine colonized both the uplands
and the lowlands. Alder may have been present in the
Thieves' Moss area as early as 7830 BP. In the Sniddle
Moss area in the boulder clay alder appears to have
expanded quickly, in response to a rise in water table,
possibly initiated by a climatic change, and it replaced
the pine woodland. At Thieves' Moss on the well-drained

138
limestone soils pine was first replaced by hazel.
It is only towards the close of the Atlantic Period (at
about 5700-6000 BP) there are signs of possible human
interference, but the effect of late Mesolithic or early
Neolithic people seems to have been minimal.
The elm decline is shown to be a recurrent rather than
a unique feature and five main phases are distinguished
in respect of elm pollen representation at Sniddle Moss
(9) and Sunset Hole. The pattern of elm pollen changes
during phases 1, 2 and 3, in general, appears to be the
same at both sites. The recovery of elm was not complete
in the study area but was slightly more comprehensive
near Sunset Hole on the Massif than at Sniddle Moss in
the lowland. A shift towards increased Corylus and more
frequent Fraxinus in the Sunset Hole area and more
frequent Betula, Salix and Polypodium in the Sniddle
Moss area was evident at and around the time of the elm
decline. These between-site differences are related to
soil differences and differences in prehistoric land-
use.
When radiocarbon dates are obtained for the Sunset Hole
site, the detailed picture of the elm decline events
may be interpreted
correlations between
efficiently.
more properly and comparisons
the two sites may be made
and
more

139
APPENDIX 1
Radiocarbon dated levels
SITE DEPTH (em) DATE (BP) LAB. NUMBER
SM4 169-169.5 9130±65 AA - 9401
" 181-181.5 12020±90 AA - 9402
SM9 88-88.5 4710±45 AA - 9394
" 108.5-109 4960±55 AA - 9395
" 117.5-118 5050±50 AA - 9396
" 196-196.5 5685±80 AA - 9397
" 289.5-290 6115±60 AA - 9398
" 431-431.5 6830±65 AA - 9399
" 478-478.5 7305±60 AA - 9400
TM3 51-51.5 6200±60 AA - 9403
" 107.5-108 6725±70 AA - 9404
" 156.5-157 7830±80 AA - 9405

i I
I 140
I
I APPENDIX 2 I !
Estimated time seale for Sniddle Moss 9
DEPTH (em) DATE (BP) DEPTH (em) DATE (BP)
14 3770 103 4885
18 3820 104 4900
22 3870 105 4910
26 3920 106 4920
30 3970 107 4935
34 4020 110 4970
38 4070 111 4980
42 4120 112 4990
46 4170 113 5000
50 4220 114 5010
54 4270 115 5020
58 4320 116 5030
62 4370 119 5060
66 4420 126 5110
70 4470 134 5180
72 4500 142 5250
74 4520 150 5310
76 4550 158 5380
78 4570 166 5450
80 4600 174 5510
82 4620 182 5580
84 4650 190 5645
86 4670 198 5700
90 4720 206 5735
92 4750 214 5770
94 4770 222 5800
96 4800 230 5845
97 4810 238 5880
98 4820 246 5915
99 4835 254 5950
100 4850 262 5990
101 4860 270 6025
102 4870 278 6060

141
APPENDIX 2 (Cont.)
DEPTH (em) DATE (BP)
286 6100
294 6135
302 6180
310 6220
318 6260
334 6340
342 6380
350 6420
358 6460
366 6500
374 6545
382 6585
390 6625
398 6670
406 6710
414 6750
422 6790
430 6830
438 6900
446 6980
454 7060
462 7135
470 7210
486 7360
494 7440
502 7515

142
APPENDIX 3
Selec ted rare * pollen and sp,ore types from SNIDDLE MOSS 4
TAXON
Trees and shrubs
Tilia
Fagus
Fraxinus
? Populus tremula-type
Ilex
Herbs
Cornus sanguinea
C. suecica
Epilobium-type
Geranium
Humulus lupulus-type
Leguminosae undiff.
Lotus-type
Onobrychis-type
Lycopus subtype
Melampyrum
Mercurialis
Solanum dulcamara
Spergularia-type
Urtica
Valeriana
Viburnum
Pteridophytes
Botrychium lunaria-type
Cryptogramma
DEPTH (em)
28, 32, 40, 42, 46, 58 24, 118, 170 16, 20, 22, 24 94, 116
54, 318, 354
110
234
136, 202, 270, 78, 316
54
214, 222
12, 28, 194, 296, 330
252, 286, 294 106, 128
42
62, 210, 218 186
174, 222
272, 312
46, 226,
278, 280
178, 180
256, 290
290, 292
230,
278, 296
280,
256,
*less than 1% of total land pollen
282,
258,

APPENDIX 4
Selected pollen and spore 4a
TAXON
Trees
Tilia
Fagus
Fraxinus
Shrubs
Hedera
Ilex
Herbs
Cerealia-type
Cladium mariscus
Compositae Tubuliflorae undiff.
Artemisia
Centaurea nigra-type
Cirsium-type
Achillea-type
solidago-type
Composi tae Liguliflorae undiff.
143
* types from SNIDDLE MOSS
DEPTH (em)
70, 88, 94
108
72, 74, 76, 94, 98, 102, 106, 108, 110, 114
68, 76, 80, 82, 84, 86, 90, 92, 96, 100, 102, 104, 106, 108, 110, 112, 114, 116 76
68, 70, 76, 78, 80,
82, 86, 88, 90
92, 94, 96, 100, 102,
104, 112, 114
76, 80, 82, 86
88, 90, 92, 98, 108, 114
88
76, 82, 88
70, 78, 82, 110
74,
92, 80, 82, 86, 90, 102, 104, 108,
114, 116
70, 72, 74, 76, 78,
80, 82, 84, 86, 88,
90. 96, 104, 110

144
APPENDIX 4 (Cont.)
TAXON DEPTH (em)
Caltha-type 70, 76, 82, 84, 86, 88, 96, 102, 108
Caryophyllaeeae 68, 70, 76, 82, 86, 88, 90, 116
Chenopodiaeeae 68, 98 Cruciferae 70, 80, 84, 86, 88 Leguminosae undiff. 70 Mercurialis 74, 78, 94, 96 Seabiosa 84 Plantago 88, 102, 106, 110 P. coronopus 76, 80, 90 P. lanceolata 68, 70, 72, 74, 76,
78, 80, 82, 84, 86, 88, 90, 92
P. major/Po media 74, 78, 80, 82, 86, 92, 112
Polygonum amphibium 84 Potentilla-type 68, 70, 72, 76, 82,
84, 86, 88, 90, 94, 110
Ranunculaceae 68, 70, 72, 74, 76, 78, 80, 82, 84, 86, 88, 90, 92, 96, 98, 102, 104, 106, 110
Galium-type 70, 72, 74, 76, 78, 80, 82, 84, 86, 90, 94, 108, 114
Rumex/Oxyria 68, 72, 74, 76, 78, 80, 102, 114
R. acetosa-type 68, 70, 72, 82 Sanguisorba officinalis 106, 114 Sueeisa 70, 72, 74, 76, 84,
86, 92, 94, 96, 102, 106, 110

145
APPENDIX 4 (Cont.)
TAXON DEPTH (em)
Umbelliferae 68, ' 92, 100, 104,
108, 114 Valeriana 78
Aquatics
MIrioEhI11um vertiei11atum 114
NImEhaea 110, 114
Potamoseton 68, 70, 72, 76, 78,
84, 86, 88, 90, 92,
94, 96, 98, 108, 112, 114
Tn~ha angustifolia/SEarganium 84, 92, 102, 110, 112, 114
T. latifolia-type 96
Pteridophytes
Eguisetum 68, 78, 80, 82, 90, 92, 94, 96, 98, 100, 102, 104, 106
Po1:u~odium 68, 70, 72, 76, 78, 80, 82, 84, 86, 88, 90, 92, 94, 96, 98, 100, 102, 104, 106, 108, 110, 112, 114, 116
DrIoEteris-type 94, 100, 106, 108, 112, 114, 116
* less than 2% of total land pollen

146
APPENDIX 5
Selected rare * pollen and spore types from SNIDDLE MOSS 9
TAXON
Trees
Fagus
? Populus tremula-type
Herbs
Cladium mariscus
Centaurea nigra-type
Vicia cracca-type
Humulus lupulus-type
Potentilla-type
Sanguisorba minor
S. officinalis
Thalictrum
Epilobium-type
Geranium
Mercurialis
Viburnum
Aquatics
Myriophyllum spicatum
Pteridophytes
Lycopodium
DEPTH (cm)
101
406
438
18,
14
30
100
206
198,
462
100,
438
278
158
30,206,
46, 118
470, 494
398
30
270
* less than 1% of total land pollen

APPENDIX 6
Selected rare pollen and spore
TAXON
Herbs
Epilobium-type
Plantago coronopus
P. maritima
Polygonum aviculare-type
Succisa
Valeriana
Valleriane1la
Viburnum
Viola palustris-type
Aquatics
Myriophyllum verticillatum
Typha latifolia-type
Pteridophytes
Cryptogramma
Eguisetum
Polypodium
147
* types from THIEVES' MOSS 1
DEPTH (em)
122
132
132, 136
145
124, 138
145
134
120, 124
130
120
149
124
126, 130, 134
134
* less than 1% of total land pollen

I
I 148
APPENDIX 7
Selected
MOSS 2 rare pollen and spore * types from THIEVES'
TAXON
Herbs
Cornus sueeica
Epilobium-type
Leguminosae undiff.
Mercurialis
Rumex aquaticus-type
Urtica
Valeriana
Viburnum
Pteridophytes
Polypodium
DEPTH (em)
142, 194
186, 196
196
208
202
126, 130
142
130, 146, 154, 162
126, 178, 186
* less than 0.5% of total land pollen

149
APPENDIX 8
Selected
MOSS 3
rare pollen and spore
TAXON
Herbs
Compositae Tubuliflorae undiff.
Cirsium-type
Compositae Liguliflorae undiff.
Armeria
Epilobium-type
Leguminosae undiff.
Trifolium
Vicia cracca-type
Potentilla-type
Linum catharticum-type
Humulus lupulus-type
Geranium
Thalictrum
Urtica
Valeriana
Viburnum
Aquatics
Myriophyllum verticillatum
Nuphar
Pteridophytes
Lycopodium
L. annotinum
* types from THIEVES'
DEPTH (em)
114
98
2, 18
70, 106
154,
174
2
130
202
2
14
78
198
102
62
202,
198
210
74
154 .
202
210
* less than 0.5% of total land pollen

150
APPENDIX 9
Selected
HOLE
rare pollen and spore * types from SUNSET
Trees
Carpinus
Shrubs
Ilex --Herbs
Achillea-type
Solidago-type
TAXON
Compositae Liguliflorae undiff.
Leguminosae undiff.
Trifolium montanum-type
Vicia-type
V. cracca-type
Caltha-type
Galium-type
Humulus lupulus-type
Droseraceae
Geranium
Mentha-type
Mercurialis
Lonicera
Prunella-type
Sueeisa
Teucrium
Valeriana
Viburnum
Viola palustris-type
DEPTH (em)
131, 155
70, 93.5, 147
144
146, 153, 155, 163.5, 190
64, 250
122, 160, 180, 230, 277
157, 180
49.5, 180
49.5, 180
141
20, 118.5, 260 142, 143
138, 140, 141, 158 128, 230
270
25, 40, 45, 49.5, 120, 149.5
180
145
62, 82, 103
180
230, 250, 270 151, 277
106.5

APPENDIX 9 (Cont.)
TAXON
Aquatics
Hydrocotyle
Myriophyllum spicatum
Potamogeton
Pteridophytes
Equisetum
Lycopodium
Dryopteris-type
151
* less than 2% of total land pollen
99
20
49.5,
146
DEPTH (cm)
70, 99, 136,
78, 115, 135, 151,
152, 153, 154
277
82, 88, 90, 103, 118.5,
156, 161.5, 180, 190, 199
152
APPENDIX 10
Characeae oospores
The oospores of Characeae were abundant in the Lateg1acia1
and early Flandrian deposi ts of both Sniddle Moss and
Thieves' Moss. Consequently, an attempt has been made
to make specific identifications
microscope (LM) and the scanning
(SEM).
by using
electron
the light
microscope
Nomenclature follows Groves and Bullock-Webster (1920
and 1924).
LH study
Some important characters of the fossil oospores were
firstly used to distinguish the two genera, Ni te1la and
Chara. The oospores of Ni tel1a recovered from Snidd1e
Moss (Nitella-type A) and Thieves' Moss (Nitella-type
C) were
Nitella
at the
Nitella
(Tables
compared with the modern oospores of British
species of G. R. Bu110ck-Webster's specimens
herbarium of Leeds University. Type A fitted into
flexilis while type C was determined as !. opaca
1 and 4).
It is assumed that there may have been at least two
species of Chara growing in the former lake in the area
of Sniddle Moss since two morphologically distinct types
(type B1 and B2) have been recovered (Tables 2 .and 3).
Chara oospores found in the profile of Thieves' Moss
were named as type D (Table 5). Although herbarium samples
of various species of Chara have been examined to compare
wi th those from Sniddle Moss and Thieves' Moss it seems
difficult to be certain about the determination under
the LM because the oospores of available material show
great similarity to one another.

SEM study
Recent works show that the
to improve knowledge of the
(e.g. Caceres, 1975; Frame,
& Moore, 1987; John II al.,
153
SEM investigation appears
nature of the oospore wall
1977; Leitch, 1986; John
1990; Leitch et al., 1990).
It also provides taxonomically more important characters
of both modern and fossil representatives of the group
(Characeae) • Therefore, in this study the scanning
electron microscope was employed to understand the exact
structure of the wall of oospores found. The SEM technique
applied is as follows:
After washing in distilled water, selected fossil oospores
were mounted on aluminium stubs with double-sided tape
and coated wi th a gold layer of 50 nm using a POLARON
sputter coater. Photographs were taken using a CAM SCAN
SERIES 3 scanning electron microscope.
Notes on Characeae oospores recovered
Sniddle Hoss
(1) Type A (Table 1; Plate I, Figs 1 and 2)
Nitella flexilis
The SEM study by Frame (1977) demonstrate that in various
forms of modern Nitella flexilis there are highly variable
oospore wall patterns, either smooth, pitted, finely
spongy or scabrous. The comparison between his study
(see Frame, 1977; p. 47; Plate III,' Figs, 19 and 20)
and the SEM photographs of the oospore wall of type A
with spongy pattern allowed for intraspecific
determination and suggested that it is Nitella flexilis
var. flexilis f. flexilis.
(2) Type Bl (Table 2; Plate II, Figs 1 and 2 )
Chara sp. (C. ? aspera)
The SEM photographs of this type were compared with those
of modern Chara oospores in John II a1. (1990). In

154
general, the
nature and
oospore wall of Chara shows a conservative
this makes further determination difficult.
Consequently, the grouping of the Chara taxa based on
the morphology of the outer fossa wall given by John
~ al. (1990) has been considered and type B1 has been
placed in group {I)-B. The group includes Chara aspera,
C. bal tica, C. capensis and C. strigosa characterized
by either relatively
of numerous
smooth or
small pits,
roughened (due to the
pores and depressions) presence
oospore wall
elements on
in the fossa region and low, fused, nodulated
the surface of the ribbon-like structure.
Detailed examination suggests that the fossil type has
some features more similar to Chara aspera than other
species in the group - the fossa wall has pores varying
in size; larger ones range from 0.05-1 pm in diam.
(3) Type B2 (Table 3; Plate III, Figs 1 and 2)
Chara sp.
This type has been placed in group {I)-A-iii (John et
~., 1990) whose members (Chara cora1lina, C. desmacantha
and C. rusbyana) have pusticular projections and low
domes wi th or wi thout an opening on the fossa wall. It
resembles Chara rusbyana (see John ~ al., 1990; Fig.
51) and the fossil oospores recovered by John Foster
from deposits about 25,000 years old found near Hatfield
(Hertfordshire) (D. M. John & J. A. Moore, personal
communication). Chara rusbyana is unknown in Britain
and mainland Europe.
Thieves' Hoss
(4) Type C (Table 4; Plate IV, Figs 1 and 2)
Nite1la opaca
The taxonomic posi tion of modern Ni tel1a opaca and its
relationship with N. flexi1is are still controversial
since they display a range of morphological characters
tha t could fall wi thin both taxa (Moore, 1986). When
only oospore features are taken into consideration,
Nitella opaca has smaller oospores than N. flexilis

155
(Groves & Bullock-Webster, 1920). In this study, it was
possi ble to distinguish Ni tella oospores (type C)
recovered from Thieves' Moss from those (type A) found
in the profile of Sniddle Moss under the binocular
microscope type
than type A. The
also displays a
C being smaller and more compressed
oospore wall of type C (Nitella opaca)
different character under the SEM
there are very small granules and pits giving a roughened
surface.
(5) Type D (Table 5; Plate V, Figs 1 and 2)
Chara vulgaris
The specific determination of this type is based on the
comparison with the outer wall structure of Chara vulgaris
specimens seen with the SEM (see John ~ al., 1990; Figs
60-62) - granules or papillae in the fossa region, their
number being five along a 10 pm wid th across the fossa;
low, fused nodular elements on the surface of the ribbon
like structure.
Palaeoecological significance of fossil Characeae at the
study sites
Snidd1e Moss
Characeae oospores appear to be more abundant in the
uppermost part of the lower lake clay than in overlying
and underlying sediments. The types recovered may have
been the pioneering elements in the newly created lake
of the Sniddle Moss site in the beginning of the
Lateglacial Period. Later, they may have been replaced
by aquatic angiosperms as climate showed further
improvement. However, the presence
in the upper Lateglacial and early
of their oospores
Flandrian sediments
suggests that these types may have continued to assume
some importance in the aquatic vegetation.
Nitella flexilis tolerates a wide range of pH levels

156
while Chara aspera demands a pH range of c. 6 to 9 (Moore,
1986) • Nitella flexilis oospores were found together
with Chara-type B1 (C. ? aspera) at various depths of
the Sniddle Moss lake. This may indicate that the pH
level of the lake was not below 6.
Chara-type B2 which is thought to resemble C. rusbyana
would be regarded as an extinct type in Britain. It may
have been highly sensitive to local and environmental
changes.
Thieyes' Hoss
Since only a part
sediments could be
of contamination-free Lateglacial
extracted from the sampling point
TM2, it is now impossible to draw a complete picture
of the (La teglacial) aquatic vegetational history,
including charophytes. It is however noteworthy that
in minerogenic sediments (the upper lake clay) Ni tella
opaca is the dominant type whereas Chara vulgaris oospores
become abundant in the organic mud of the early Flandrian
Period. A similar pattern has been reported by several
authors (e.g. Vasari & Vasari, 1968; Berglund &
Digerfeldt, 1970; Birks & Mathewes, 1978) worked on the
Lateglacial sites, though there is no specific
determination for Chara in these papers.
Nitella opaca grows
conditions.
in diverse habitats under a wide
range of Langangen (1974) says that this
species shows optimal development in
characterized by low production and
in Norway. During the Younger Dryas
(Lobelia) lakes,
dense charophytes,
Period, a decline
in vigorous aquatic angiosperms may have created
conditions favourable for Nitella opaca. Thus it may
have flourished the former lake of the Thieves' Moss
si te, even it may have formed almost a pure charophyte
community. With the climatic improvement, Chara vulgaris
seems to have replaced Ni tella opaca. Ei ther competi tion
or nutrient status of the lake, or both, would have been
157
of great importance in the expansion of Chara vulgaris.
Conclusion
Ecological information available
help in the palaeoecological
Characeae oospore types found
appears to be of little
interpretation of some
in deposits of Snidd1e
Moss and Thieves' Moss. Further ecological studies of
this group, possibly involving detailed analysis of
chemistry and other features of lakes, are essential.
These might help pa1aeoeco10gists to draw more definite
conclusions. This study presents a limited
palaeoecological interpretation but it may be a part
of an index for fossil Characeae oospores in Quaternary
deposits.
References (for Appendix 10)
Berglund B. E. & Digerfe1dt G. (1970) "A palaeoecological
study of the Late-Glacial lake at Torreberga Scania,
South Sweden", Oikos, 21, 98-128.
Birks H. H. & Mathewes R. W. (1978) "Studies in the
vegetational history of Scotland", New Phyto10gist,
80, 455-484.
Caceres E. J. (1975) "Novedades Caro10gicas Argentinas
I. Una Nueva Especie de Ni te1la y tres Adiciones
a1 Genero Para La Flora Argentina", Kurtziana, 8,
105-125.
Frame P. (1977) "Fine Structural Studies of Oospore
Ornamentation and Bu1bi1 Development in Charophytes",
PhD ThesiS, University of Toronto.
Groves J. & Bullock-Webster G. R. (1920) "The Bri tish
Charophyta Volume I Nite11eae", Ray Society, London.

158
Groves J. & Bullock-Webster G. R. (1924) "The British
Charophyta Volume II Chareae", Ray Society, London.
John D. M. & Moore J. A. (1987) "An SEM study of the
oospore of some Nitella species (Charales,
Chlorophyta) with descriptions of wall ornamentation
and an assessment its taxonomic importance",
Phycologia, 26/3, 334-355.
John D. M.,· Moore J. A. & Green D. R. (1990) "Preliminary
observations on the structure and ornamentation
wall in Chara (Charales, of the oosporangial
Chlorophyta)", British
1-24.
Phycological Journal, 25,
Langangen A. (1974) "Ecology and distribution of Norwegian
charophytes", Norwegian Journal of Botany, 21, 31-
52.
Leitch A. R. (1986) "Studies on Living and Fossil
Charophyte Oosporangia", PhD TheSis, University
of Bristol.
Leitch A. R., John D. M. & Moore J. A. (1990) "The
oosporangium of the Characeae (Chlorophyta,
Charales)", (In "Progress in Phycological Research",
Vol. 7, ed. by F. E. Round & D. J. Chapman), pp.
213-268. Biopress Ltd.
Moore J. A. (1986) "Charophytes of Great Bri tain and
Ireland", Botanical Society of the British Isles,
London, No 5.
Vasari Y. & Vasari A. (1968) "Late- and
macrophytic vegetation in the lochs
post-glacial
of northern
Scotland", Acta Botanica Fennica, 80, 4-120.

'fable 1. Some characters' of Nitella (type A) oospore from Sniddle Moss under the LM and SEM and their comparison wi th the records of earlier workers on Nitella flexilis.
Groves & Bullock-Webster Frame Nitella (type A) LM
Some characters
LPA (Length of ~he polar axis)
LED (Largest equatorial diameter)
Shape
AND (Anisopolar distance: distance from the apical pole to the largest equatorial diameter)
ANI (Anisopolar index: AND/LPAdOO)
The maximum width of the segmented basal pore
The number of convolutions of the fassules (in lateral view)
The number of convolutions of the spirals (in lateral view)
Ornamentation on the fossa wall
(1920) Nitella flexilis
500-575 pm
425-500 pm
5-7
(1977 ) Nitella flexilis
Highly variable: smooth, pitted, finely spongy or scabrous
(pm)
520-640
450-520
Subpralate
300
53 (Ellipsoidal)
80-140
6-7
6-7
verrucatereticulate
SEM
spongy with mesh size c. 1.2 p.
...... l/1 \0

Table 2. Some characters of Chara (type B1) oospore from Sniddle Moss under the LM and SEM and their comparison with the records of earlier workers on Chara aspera.
Some characters Groves & Bullock-Webster
(1924) John et al.
(1990-) Chara (type Bl) LM SEM
LPA LED
Shape AND ANI
The height of the basal claw
The maximum width of the pore
The number of convol. of the fossules
The number of the spirals
Ornamentation on the fossa wall
Surface of the ribbon
The width of the ribbon
* excluding basal cage
Chara aspera
400-600 pm 250-375 pm
12-14
Chara aspera
roughened
(pm)
664-840 633 430-550
Perprolate 300-400 333
44 (Ellipsoidal)
40-100
100-160
12-13
12-14
".
roughened (pits and pores)
low, fused nodulated elements
c. 20 pm
low t fused t
nodulated elements c. 30
..... Q\ o

Ta ble 3. Some characters of Chara (type B2) oospore from Sniddle Moss under the LM and SEM.
Some characters
LPA LED
Shape
AND ANI The height of the basal claw
The maximum width of the pore
The number of convol. of the fossules
The number of the spirals
Ornamentation on the fossa wall
* including basal claws
LM (pm)
620-700 320-390
Prolate
300-360
SEM (pm)
* 770
50 (Ellipsoidal)
20-50 60
100-120
12-14
13
Foveolate Low pustular elevations with pores
~
0'1 ~

Table 4. Some characters of Nitella (type C) oospore recovered from Thieves' Moss under the LM and SEM and their comparison with the records of Groves & Bullock-Webster (1917) on Nitella opaca.
Some characters
LPA LED Shape
AND ANI
The numb. of convol. of the fossules
The numb. of convol. of the spirals
Ornamentation on the fossa wall
Groves & Bullock-Webster
(1920)
Nitella opaca
375-425 pm 350-400 pm Spheroidal/broader than long
Nitella (type C)
(Thieves' Moss)
LM (pm) SEM (pm)
420 302 360 258
Subprolate
200 162
48
(Ellipsoidal)
6
7
roughened
..-0'\ N

Table 5. Some characters of Chara (type D) oospore from Thieves t Moss under the LM and SEM and their comparison wi th the records of earlier workers on Chara vulgaris.
Some characters Groves & Bullock-Webster
(1924 ) John et a1.
(1990-) Chara (type D)
LPA LED
Shape AND ANI
The height of the basal claw
The maximum width of the pore
The number of convo1. of the fossules
The number of the spirals
Ornamentation on the fossa wall
Surface of the ribbon
* excluding basal cage
Chara vulgaris Chara vulgaris LM SEM (pm)
* w 425-675 pm 225-400 pm
12-15
630-740 370-550
Prolate
567 367
300-400 300-400 48
(Ellipsoidal)
roughened/granulate
low, fused, nodulated elements
50-70
70
11-14
11-14
granules/ papillae
low, fused nodulated elements
.... 0\ (..)

164
Plate I. Figs 1-2. SEM of Nitella (type A) (Nilclla flexilis) oospore from Sniddle Mo ss (SM9 458-460 em peat). Fig. 1. Oospore in lateral view. Fig. 2. Fossa wall showing s pongy ornamentation .

165
Plate II. Figs 1-2 . SEM of Chara (typ B1) (Char ?
aspera) oospore from Sniddle Mo ss (SM6 217-219 m - marl ). Fig. l . Oospore with some debri s in lateral vj w. P"g.2. Surface o[ the fossa wall covered by num ero us pit s , por es (arrowed) and depre ssio ns and broken ribbon s hroudin g the fossa wall; note the dif fe rence in the nature of its surface compared to the adjacent wall area (fo ssa ).

166
Plate III. Figs \-2 . SEM or Char (type B2) oospore from Sniddle Moss (SM3 226-228 cm - marl). ~ig. l. Oospore with basal claws (arrowed) in later 1 view. Fig.2. Oospore wall showing low pustular 1 vations wiLh perforations extending towards Lhe lower par of th ridge (arrowed).

167
Plate IV. Figs 1-2 . SEM of Nit l1a CLype C) CNLL 11 opaca) oospore from Thiev s ' Moss (TM2 204 . 5-205 . 5 m _ organic clay). Fig.l . Oospore with some debri s in lateral view. Pig .2. Fossa wall roughened du La presence of very small granules and piLS.

168
Plate V. Figs 1-2 . SEM of Chara (type D) (Chara vulgaris) oospore from Thieves' Moss (TM2 184 em - org ' nic mud). Fig. l . Oospore in lateral view. Fig.2 . Fossa wall COy r d by irregularly shaped projections and s urfac e of he ribbon showing a dense covering of low, fused nodular clem n s .

169
References
Arthurton R. S., Johnson E. W. & Mundy D. J. C. (1988)
"Geology of the country around Settle", BGS (British
Geological Survey), London.
Atkinson T. C., Briffa K. R. & Coope G. R. (1987)
"Seasonal temperatures in Britain during the past
22,000 . years, reconstructed using beetle remains",
Nature, 325, 587-592.
Barra t t B. C. (1960 ) "An in ves tiga tion of the morphology
and development of some grassland humus forms",
PhD Thesis, University School of Agriculture, King's
College, University of Durham.
Bartley D. D. (1962) "The stratigraphy and pollen analysis
of lake deposits near Tadcaster, Yorkshire", New
Phytologist, 61, 277-287.
Bartley D. D. (1967) "Pollen analysis of surface samples
of vegetation from Arctic Quebec", Pollen et Spores,
9, 101-105.
Bartley D. D. & Clark S. C. (1979)
of the Ing1eborough", S.S.S.I.,
Industrial Services Ltd. (ULIS),
"A vegetation survey
Uni versi ty of Leeds
Leeds.
Bartley D. D., Jones I. P. & Smith R. T. (1990) "Studies
in the Flandrian vegetational history of the Craven
District of Yorkshire: The lowlands", Journal of
Ecology, 78, 611-632.
Bartley D. D. & Morgan A. V. (1990) "The palynological
record of the King's Pool, Stafford, England", New
Phytologist, 116, 177-194.

170
Beales P. w. (1980) "The Late Devensian and Flandrian
vegetational history of Crose Mere, Shropshire",
New Phytologist, 85, 133-161.
Becket t S. C. (1981) "Pollen diagrams from Holderness,
North Humberside", Journal of Biogeography, 8, 177-
198.
Beijerinck W. (1947) "Zadenatlas Der Nederlandsche Flora",
H. Veenman & Zonen, Wageningen.
Bellamy D. J., Bradshaw M. E., Millington G. R. &
Simmons I. G.· (1966) "Two Qua ternary deposi ts in
the Lower Tees Basin", New Phytologist, 65, 429-442.
Bennett W. (1936) "Giants' Graves, Pen-y-Ghent", The j
Yorkshire Archaeological Journal, 33, 318-319.
Bennett W. (1938) "Iron Age Settlements'in Penigent Gill",
The Yorkshire Archaeological Journal, 34, 413-419.
Bennett K. D. (1983) "Devensian Late-glacial and Flandrian
vegeta tional history at Hockham Mere, Norfolk,
England", New Phytologist, 95, 457-487.
Bennet t K. D. (1984) "The Post-glacial history of Pinus.
sylvestris in the British Isles", Quaternary Science . Reviews, 3, 133-155.
Berggren G. (1969) "Atlas of Seeds, Part 2, Cyperaceae",
Swedish Natural Science Research. Council.
Berggren G. (1981) "Atlas of Seeds, "art 3, Salicaceae
Cruciferae" Swedish Museum of Natural History.
Birks H. J. B. (1965) "Late-glacial deposits at Bagmere,
Cheshire and Chat Moss, Lancashire", New Phytologist,
64, 270-281.

171
Birks H. J. B. (1973) "Past and Pres en t Vegetation of
the Isle of Skye A Palaeoecological Study",
Cambridge University Press, Cambridge.
Birks H. J. B. (1990) "Late-Quaternary biotic changes
in terrestrial and
particular
"Handbook
reference
lacustrine environments,
to north-west Europe",
with
(In
of Holocene Palaeoecology and
Palaeohydrology", ed.
John Wiley & Sons Ltd.
by B. E. Berglund) pp. 3-65.
Bjorck S., Berglund B. E. & Digerfeldt G. (1988) "New
aspects on the deglaciation chronology of south
Sweden", Geographica Polonica, 55, 37-49.
Broecker W. S., Andree M., Bonani G., Wolfli W., Oeschger
H. & Klas M. (1988) "Can the Greenland climatic
jumps be identified in records from ocean and
land ?", Quaternary Research, 30, 1-6.
Bullock P. (1964) "A study of the origin and development
of soils over Carboniferous Limestone in the Malham
District of Yorkshire",
of Leeds.
MSc TheSiS, University
Bullock P. (1971) "The soils of the Malham Tarn Area",
Field Studies, 3, 381-408.
Clapham A. R., Tutin T. G. & Moore D. M. (1989) "Flora
of the British Isles", 3rd ed., Cambridge University
Press, London.
Coesel P. F. M. (1979a) "Desmids 0 f the broads area
of N. W. Overjissel (The Netherlands) I", Acta
Botanica Neerlandica, 28, 257-279.
Coesel P. F. M. (1979 b) "Desmids of the broads area
of N. W. Overjissel (The Netherlands) II", Acta
Botanica Neerland1ca, 28, 385-423.

172
Conway
of
V. M. (1954) "Stratigraphy
Southern Pennine blanket
and pollen analysis
peats", Journal of
Ecology, 42, 117-147.
Coope G. R. (1977) "Fossil coleopteran
sensitive indicators of climatic
the Devensian (Last) cold stage",
Transactions of the Royal Society
280, 313-340.
assemblages as
changes during
Philosophical
of London B,
Crompton A. (1961) "A brief account of the soils of
Yorkshire" I Journal of Yorkshire Grassland Society,
3, 27-35.
Cunliffe B. (1978) "Iron Age communities in Britain",
Routledge & Kegan Paul, London & Boston.
Dickson J. H. (1973) "Bryophytes of the Pleistocene.
The British record and its chronological and
ecological implications", Cambridge University Press,
London.
Dixon H. N. (1954) "The Students Handbook of British
Mosses", Sumfield & Day Ltd.
Dunham K. C.,
Wilcockson
Hemingway J.
W. H. (1953)
E. Versey H. C. &
"A guide to the geology
of the district round Ingleborough", Proceedings
of the Yorkshire Geological Society 29, 77-115.
Edwards K. J. (1988) "The hunter-gatherer/agricultural
transition and the pollen record in the British
Isles", (In "The Cultural Landscape - Past, Present
and Future", ed. by H. H. Birks, H. J. B. Birks,
P. E. Kaland & D. Moe) pp. 255-266. Cambridge
University Press.
Edwards K. J. (1990) "Fire and Scottish Mesolithic:
evidence from microscopic charcoal", (In

173
"Contributions to the Mesolithic in Europe", edt
by P. M. Vermeersch & P. Van Peer) pp. 71-79.
Leuven University Press, Leuven.
Edwards K. J. & Hirons K. R. (1984) "Cereal pollen grains
in pre-elm decline deposits: Implications for the
earliest agriculture in Britain and Ireland", Journal
of Archaeological Science, 11, 71-80.
Edwards K. J. & MacDonald G. M. (1991) "Holocene
palynology: II
change", Progress
391.
human influence and vegetation
in Physical Geography, 15, 364-
Ed wards K. J. & McIntosh C. J. (1988) "Improving the
detection rate of cereal-type pollen grains in Ulmus
decline and earlier deposits from Scotland", Pollen
et Spores, 30, 179-188.
Edwards K. J. & Thompson R. (1984) "Magneti~
palynological and radiocarbon correlation and dating
comparisons in long cores from a Northern Irish
lake", Catena, 11, 83-89.
Faegri K. & Iversen J. (1989) "Textbook of Pollen
Analysis", (IV Edition by K. Faegri, P. E. Kaland
& K. Krzywinski), John Wiley & Sons.
Garbett G. G. (1981) "The elm decline: the depletion
of a source", New Phytologist, 88, 573-585.
Gilks J. A. (1973) "The Neolithic and early Bronze Age
pottery from Elbolton Cave, Wharfedale", The
Yorkshire Archaeological Journal, 45, 41-54.
Gilks J. A. (1981) "Ingleton, Ra venscar Cave, SD 730757"
in "Yorkshire Archaeological Register: 1981", The
Yorkshire Archaeological Journal, 54, 171-172.

174
Gilks J. A. & Lord T. (1985 ) "A late Neoli thic crevice
burial from Selside, Ribblesdale, North Yorkshire",
The Yorkshire Archaeological Journal, 57, 1-5.
Godwin, H. (1975) "History of the British Flora",
Cambridge University Press.
Gosden, M. S. (1965) "An investigation in to the origin
and nature of some organic deposits of the
Ingleborough Region", PhD Thesis, University of
Leeds.
Gray J. M. & Lowe J. J. (1977) "The Scottish Late Glacial
environment: a synthesis" (In "Studies in the
Scottish Lateglacial environment", ed. by J. M. Gray & J. J. Lowe) pp. 163-181. Pergamon Press,
Oxford.
Greig J. (In
ed.
(1982) "Past and present lime woods of Europe",
"Archaeological Aspects of Woodland Ecology", by M. Bell & S. Limbrey) pp. 23-55. Symposia
of the Association for Environmental Archaeology
No.2 BAR International Series 146.
Groenman-van Waateringe W. (1983) "The early agricultural
utilization of the Irish landscape: the last word
on the elm decline 7", British Archaeological Report
British Series, 116, 217-232.
Hi b bert F. A. & Swi tsur V. R. (1976) "Radiocarbon dating
of Flandrian pollen zones in Wales and Northern
England", New Phytologist, 77, 793-807.
Hirons K. R. & Edwards K. J. (1986) "Events at and around
the first and second Ulmus declines: Palaeoecological
investigations in Co. Tyrone, Northern Ireland",
New Phytologist, 104, 131-153.

175
Hirons K. R. & Edwards K. J. (1990) "Pollen and related
studies at Kinloch, Isle of Rhum, Scotland, with
particular reference to possible early human impacts
on vegetation", New Phytologist, 116, 715-727.
Huntley B. & Birks H. J. B. (1983) "An Atlas of Past
and Present Pollen Maps for Europe: 0-13000 years
ago", Cambridge University Press, Cambridge.
Hybroek, H. M. (1963) "Diseases and lopping for fodder
as possible causes of a prehistoric decline of
Ulmus", Acta Botanica Neerlandica, 12, 1-11.
Iversen J. (1954) "The Late-glacial flora of Denmark
and its relation to climate and soil", Danmarks
Geologiske Underspgelse, II, 80, 87-119.
Iversen, J. (1956) "Forest clearance in the Stone Age",
Scientific American, 194, 36-41.
Iversen, J. (1973) "The development of Denmark's nature
since the 'last-glacial" , Danmarks Geologiske
Unders~gelse, V, 7-C, 126 pp., Copenhagen.
Jacobi R. M., Tallis J. H. & Mellars P. A. (1976)
"The southern Pennine Mesolithic and the ecological
record", Journal of Archaeological Science, 3, 307-
320.
Jessen K. (1955) "Key to subfossil Potamogeton", Botanisk
Tiddskriff, 52, 1-6.
Jones I. P. (1977) "Studies in the Flandrian vegetational
history of the Craven District of Yorkshire", PhD
Thesis, University of Leeds.
Jones R. L. (1977) "Late Devensian deposits from Kildale,
Northeast Yorkshire", proceedings of the Yorkshire
Geological Society, 41, 185-188.

I 176
Katz N. Ja., Katz S. V. & Kipiani M. G. (1965) "Atlas
and Keys of fruits and seeds occuring in the
Quaternary Deposits of the USSR", Moscow.
Keen D. H., Jones R. L., Evans R. A. & Robinson J. E.
(1988) "Faunal and floral assemblages from Bingley
Bog, West Yorkshire, and their significance for
Late Devensian and early Flandrian environmental
changes", Proceedings of the Yorkshire Geological
Society, 47, 125-138.
Kendall P. F. & Wroot
Yorkshire", Vienna.
H. E. (1924) "The Geology of
King A. (1969) "A study of early settlement in Upper
Ri b blesdale and adj acen t uplands", MA Dissertation,
University of Liverpool.
King A. (1970) "Early Pennine settlement", Dalesman,
Clapham.
King A. (1978a) "Apron Full of Stones, a prehistoric
cairn, Thornton in Londsdale, North Yorkshire",
The Yorkshire Archaeological Journal, 50, 25-30.
King A. (1978b) "Gauber High Pasture, Ribblehead - an
interim report", (In "Viking Age York and the North"
ed. by R. A. Hall) pp. 21-25. CBA Research Report,
No. 27.
Kolstrup E. (1979) "Herbs as July tempera ture indica tors
for parts of the pleniglacial and Late-glacial in
the Netherlands", Geologie En Mijnbouw, 58(3),
377-380.
Kolstrup E. (1980) "Climate and stratigraphy in
northwestern
b.p., \¥ith
Mededelingen
Europe
special
R1jks
between 30,000 b.p. and 13,000 reference to the Netherlands",
Geologische Dienst, 32-15,

I
177
181-253.
Korber-Grohne U. (1964) "Probleme der kustenforchung
im sudlichen nordseege biet. 7. Bestimmungsschlussel
fur subfossile. Juncus-Samen und Graminen-Fruchte",
Hildesheim: August Lax.
Leeder M. R. (1982) "Upper Palaeozoic basins of the
British Isles Caledonide inheritance versus
Hercynian plate margin processes", Journal of
Geological Society, London, 139, 479-491.
Lockwood J. G. (1967) "Climate", (In "Leeds and its
region", ed. by M. W. Beresford & G. R. J. Jones)
pp. 30-43. Bri tish Association for the Ad vancement
of Science. Leeds Local Executive Committee.
Longworth I. (1965) "Yorkshire", Cory, Adams & Mackay.
Lotter A. F., Eicher U., Siegenthaler U. & Birks H. J.
B. (1992) "Late-glacial climatic oscillations as recorded in Swiss lake sediments", Journal of
Quaternary Science, 7(3), 187-204.
Lowe J. J. & Gray J. M. (1980) "The stratigraphic
subdivision of the Lateglacial of North-west Europe"
(In "Studies in the Lateglacial of Northwest Europe",
ed. by J. J. Lowe, J. M. Gray & E. Robinson) pp.
157-175. Pergamon Press, Oxford.
Lowe J. J. & Lowe S. (1989) "Interpretation of the pollen
stratigraphy of Late Devensian Lateglacial and early
Flandrian sediments at Llyn Gwernan, near Cader
Idris, North Wales", New Phytologist, 113, 391-408.
Lowe J. J. & Walker M. J. C. (1986) "La teglacial and
early Flandrian environmental history of the Isle
of Mull, Inner Hebrides", Transactions of the Royal
Society of Edinburgh: Earth Science, 77, 1-20.

178
Mangerud J., Andersen S. Th., Berglund B. E. & Donner
J. J. (1974) "Quaternary stratigraphy of Norden,
a proposal for terminology and classification",
Boreas, 3, 109-126.
Manley G. (1957) "The climate at Malham Tarn", Field
Studies Council, Annual Report (1955-1956), 43-56.
Manley G. (1959) "The late-glacial climate of North-west
England", The Liverpool and Manchester Geological
Journal, 2, 188-215.
Megaw J. V. S. & Simpson D. D. A. (1979) "Introduction
to British prehistory", Leicester University Press.
Mellars P. A. (1976) "Fire, ecology, animal po pula tions
and man; a study of some ecological relationships
in prehistory" , Proceedings of the Prehistoric
Society, 42, 15-46.
Moore P. D. (1984) "Hampstead Heath clue to historical
decline of elms", Nature, 312, 103.
Moore P. D., Webb J. A. & Collinson M. E. (1991) "Pollen
Analysis", second edi tion, Blackwell Scientific
Publications.
0' Connell M. (1980) "The developmental history of Scragh
Bog, Co. Westmeath and the vegetational history
of its hinterland", New Phytologist, 85, 301-319.
Odgaard B. V. (1992) "The fire history of Danish heathland
areas as reflected by pollen and charred particles
in lake sediments", The Holocene, 2, 3, 218-226.
Peglar S. M. (1993) "The mid-Holocene Ulmus decline at
Diss Mere, Norfolk, UK: a year-by-year pollen
stratigraphy from annual laminations", The Holocene,
3, 1, 1-13.

179
Pennington W. (1964) "Pollen analysis from the deposits
of six upland tarns in the Lake District",
Philosophical Transactions of the Royal SOCiety
London B, 248, 205-244.
Pennington W. (1970) "Vegetation history in the north
west of England: a regional synthesis", (In "Studies
in the vegetational history of the British Isles",
ed. by D. Walker & R. G. West) pp. 141-158. London:
Cambridge University Press.
Pennington W. (1975) "A chronostratigraphic comparison
of Late-Weichselian and Late-Devensian subdivisions,
illustrated by two radiocarbon-dated profiles from
western Britain", Boreas, 4, 157-171.
Pennington W. (1977) "The Late Devensian flora and
vegetation of Britain", Philosophical Transactions
of the Royal Society of London B, 280, 247-271.
Pennington W. (1980) "Modern
and the interpretation
British Late-Glacial
Phytologist, 84, 171-201.
samples from west Greenland
of pollen data from the
(LATE DEVENSIAN)", New
Pennington W. (1986) "Lags in adjustment of vegetation
to climate caused by the pace of soil development:
evidence from Britain", Vegetatio, 67, 105-118.
Pennington W. (1991) "Palaeolimnology in the English
lakes - some questions and answers over fifty years",
Hydrobiologia, 214, 9-24.
Pennington W. & Lishman J. P. (1971)" Iodine in lake
sediments in Northern England
Biological Reviews, 46, 279-313.
and Scotland",
Perry I. & Moore P. D. (1987) "Dutch elm disease as
an analogue of Neolithic elm decline", Nature,

180
326, 72-73.
Pigott M. E. & Pigott C. D. (1959) "Stratigraphy and
pollen analysis of Malham Tarn and Tarn Moss", Field
Studies, 1, 1-18.
Pigott C. D. & Pigott M. E. (1963) Late-glacial and Post-
glacial deposits at Malham,
Phytologist, 62, 317-334.
Yorkshire", New
Pun t W. & Malotaux M. (1984) "Canna baceae, Moraceae and
Urticaceae" (In "The Northwest European Pollen Flora
IV", ed. by W. Punt & G. C. S. Clarke) pp. 23-
44. Elsevier.
Rackham o. (1980) "Ancient Woodland: its history,
vegetation and uses in England", Edward Arnold,
London.
Rackham O. (1986) "The History of the Countryside", Dent, London.
Rackham O. (1988) "Trees and woodland in a crowded
landscape the cultural landscape of the British
Isles", (In "The Cultural Landscape - Past, Pres en t
and Future", ed. by H. H. Birks, H. J. B. Birks,
P. E. Kaland & D. Moe) pp. 53-77. Cambridge
Univesity Press, Cambridge.
Raistrick A. (1930) "Some glacial features of the Set tIe
District, Yorkshire", Proceedings of the University
of Durham, 8, part 3, (1929-1930).
Raistrick A.
Grassington,
Journal, 33,
(1936) "Prehistoric cultivation at
Yorkshire", The Yorkshire Archaeological
166-174.
Raistrick A. (1939) "Iron-age settlements in West
Yorkshire", The Yorkshire Archaeological Journal,

181
34, 115-150.
Raistrick A. & Holmes P. F. (1962) "Archaeology of Malham
Moor", Field Studies, 1, 73-96.
Raistrick ·'A. & Illingworth J. I. (1959) "The face of
North-West Yorkshire", The Dalesman Publishing
Company.
Rybnicek K., & Rybnickova E. (1987) "Palaeogeobotanical
evidence of Middle Holocene stratigraphic hiatuses
in Czechoslovakia and their explanation", Folia
Geobotanica et Phytotaxonomica, 22, 313-327.
Schweingruber F. H. (1990) "Anatomy of European woods";
Paul Haupt Berne and Stuttgart Publishers.
Simmons I. G. (1969) "Pollen diagrams from the North
York Moors", New Phytologist, 68, 807-827.
Simmons I. G~ (1975) "The ecological setting of Mesolithic
man in the Highland Zone", (In "The Effect of Man
on the Landscape: The Highland Zone",
G. Evans, S. Limbrey & H. Cleere)
CBA Research Report No. 11.
Simmons I. G. Dimbleby G. W. & Grigson
"The mesolithic", (In "The Environment
Prehistory", ed. by I. G. Simmons & M.
pp. 82-124. Duckworth, London.
ed. by J. pp. 57-63.
C. (1981)
in British
J. Tooley)
Simmons I. G. & Innes J. B. (1981) "Tree remains in
a North York Moors peat profile", Nature, 294,
76-78.
Simmons I. G. & Innes J. B. (1987) "Mid-Holocene
adaptations and later Mesolithic forest disturbance
in northern England", Journal of Archaeological
Science, 14, 385-403.

182
Sissons J. B. (1974) "The Quaternary in Scotland: a
review", Scottish Journal of Geology, 10, 311-337.
Sissons J. B. (1976) "A remarkable protalus rampart in
Wester Ross", The Scottish Geographical Magazine,
92, 182-190.
Smi th A. G. (1970) "The influence of Mesolithic and
Neolithic Man on British vegetation: a discussion",
(In "Studies in the vegetational history of the
British Isles", ed. by D. Walker & R. G. West)
pp. 81-96. Cambridge University Press, Cambridge.
Smith A. G. (1984) "Newferry and the Boreal-Atlantic
transition", New Phytologist, 98, 35-55.
Smith A. G. & Cloutman E. W. (1988) "Reconstruction of
Holocene vegetation history in three dimensions
at Waun-Fignen-Felen, an upland site in South Wales",
Philosophical Transcations of the Royal Society
of London B, 322, 159-219.
Smith A. G. & Goddard I. C. (1991) "A 12500 year record
of vegetational history at Sluggan Bog, Co. Antrim,
N. Ireland (incorporating a pollen zone scheme for
the non-specialist)", New Phytologist, 118, 167-
187.
Smi th A. J. E. (1978) "The Moss Flora of Bri tain and
Ireland", Cambridge University Press.
Smith R. T. (1986) "Aspects of the soil and vegetation
history of the Craven District of Yorkshire", (In
"Archaeology in the Pennines", ed. by T. G. Manby
& P. Turn bull) pp. 3-28. British Archaeological
Reviews, British Series 158.

183
Stockmarr J. (1971) "Tablets with spores used in absolute
pollen analysis", Pollen et Spores, 13, 615-621.
Stui ver M. & Polach H. A. (1977) "Discussion: reporting
of 14C data", Radiocarbon, 19, 355-363.
Sturludot tir S. A. & Turner J. (1985) "The elm decline
at Pawlaw Mire: an anthropogenic interpretation",
New Phytologist, 99, 323-329.
Swales S. (1987) "The Vegetational and Archaeological
History of the Ingleborough Massif, North Yorkshire",
PhD TheSiS, University of Leeds.
Syers J. K. (1964) "A Study of soil formation on
Carboniferous Limestone with particular reference
to lichens as pedogenic agents", PhD Thesis,
University School of Agriculture, King's College,
University of Durham.
Ten Hove H. A. (1968) "The Ulmus fall at the transition
Atlanticum-Subboreal in pollen
Palaeogeography,
5, 359-369.
Palaeoclimatology,
diagrams",
Palaeoecology,
Tipping R. (1991) "The clima tostratigraphic su bdi vision
of the Devensian Lateglacial: evidence from a pollen
site near Oban, western Scotland", Journal of
Biogeography, 18, 89-101.
Troels-Smith J. (1960) "Ivy, mistletoe and elm climatic
indicators fodder plants", Danmarks Geologiske
Unders~gelse, IV, 4(4), 32 pp.
Turner J., Innes J. B. & Simmons I. G. (1989) "Two pollen
diagrams from the same site", New Phytologist, 113.
409-416.

184
Van Geel B., Bohncke S. J. P. & Dee H. (1980) "A
study of an upper Late Glacial palaeoecological
and Holocene seq uence from 'De Borchert' the
Review of Palaeobotany and Palynology, Netherlands",
31, 367-448.
Vi t t D. H. & Kuhry P. (1992) "Changes in moss-domina ted
wetland ecosystems", (In "Bryophytes and Lichens
in a changing Environment", ed. by J. Bates & A.
M. Farmer) pp. 178-210. Clarendon Press, Oxford.
Walker D. (1956) "A site at Stump Cross near Grassington,
Yorkshire and the age of the Pennine microlithic
industry", Proceedings of the Prehistoric Society,
22, 23-28.
Walker M. J. C. & Harkness D. D. (1990) "Radiocarbon
dating the Devensian Lateglacial in Britain: new
evidence from Llanilid, South Wales", Journal of
Quaternary Science, 5(2), 135-144.
Wa t ts W. A. (1977) "The Late Devensian vegetation· of
Ireland", Philosophical Transactions of the Royal
Society of London B, 280, 273-293.
Wa t ts W. A. (1980) "Regional variation in the response
of vegetation to Lateglacial climatic events in
Europe", (In "Studies in the Lateglacial of Northwest
Europe", ed. by J. J. Lowe J. M. Gray & J. E.
Robinson), pp. 1-22. Pergamon Press, Oxford.
Watts W. A. (1982) "Response of biotic populations to
rapid environmental and climatic changes", Abstracts
Seventh AMQUA Conference, 19-21.
Whittington G., Edwards K. J. & Cundill P. R. (1991a)
"Late- and Post-glacial vegetational changa at Black
Loch, Fife, eastern Scotland a mUltiple core
approach", New Phytologist, 118, 147-166.

I 185
Whittington G., Edwards K. J. & Cundill P. R. (1991b)
"Palaeoecological investigations of multiple elm
declines at a site in north Fife, Scotland", Journal
of Biogeography, 18, 71-87.
Wi lIs L. J. (1978) "A palaeogeographic map of the Lower
Palaeozoic floor below the cover of Upper Devonian
Carboniferous and later formations", Memoir
Geological Society of London, 8, 36 pp.
Wood T. G. (1963) "The Fauna of Certain Moorland Soils
Developed on Limestone and Non-calcareous Drift",
PhD Thesis, University of Nottingham.

Table 53.1. Macroscopic fossils from SNIDDLE MOSS 4
E ~
a
50
100
150
:5 200 c. .,
Q
250
JOO
JSO
«10
E;l o
<5 ..r::: :5 Co
-
· · · · · · · · · · · · · · · · · · · · · l
r
Co C. ~ t..:.. t..:..
-------
· •
·
. •
· · · · · . · · · · ·
r r r II r
t..:.. t..:.. t..:.. t..:.. t..:.. Co C. t..:..
· · · ·
-------------· · . ·
• • • · · . • · · · . · • · · .
r r r r r r r r
~ t..:..
.
--
•
r r
t..:.. I t..:.. Co t..:..
.
----
. ,
· · · . · r I r r r
,r------- BRYOPIifTES (Ivs) -------,
t..:.. ~ C. ~ C. Co L.:.. t..:..
· ------- -
.
· • . · · · · · • . · :
• · · .
r r r r r r r r
L.:.. L.:.. L::..
•
. -
• . .
-
r r r
<:1ILY
9.lH(
-
SM4-\o111
;'M'I-YII ;'M'I-YI
SU4-V
SM4-l\I
SI.4HII
-
SI.4H
. present
Abbreviations:
b-bud
cp-capsule
ep-epidermia
f c s-female catkin scale
fr-fruit
fr-st-fruit-stone
lva-leavea
n-nut
oosp-oospore
a-seed
sh-shoot
stat-statoblast

Table 5.3.2. Macroscopic fossils from SNIDDLE MOSS 9
>-. O'l 0
"0 ...r::: ....... :.:J
0 L:.. L:.. L L L ~ L L t..:.. L.::... L.::... L.::... L L:.. L t..:.. L L:.. L.::... t..:.. L:.. L L L.::... t..:.. L.::... t..:.. L L..:... L:.: t..:.. ~ L..:...
50 · · · · . · · 100 · · · . 150 · · · · · · : : · . · 200 · · · · · · . 250 · · ·
- :lOO E · i · · · · · 0 .........
.J:: 350 ~
: · : · : · . . : : : : . · · · . . · .
0.. II)
· · · · Cl 400 · · · · · 4-50 · . · · · . · · · · · · · . . · · · · · · SOD · · .
· . · · · · · · · · S50 · · : · · · · · 600 · · · · · 650 .
r r r r r r r r r r r r r r r r r I' r r r r r r r r r r r r I' I' r 700
L.::... L:..-L.::... L L..:... L.::... t..:.. I L..:.. L..:... L..:... L..:... t..:.. L.::...
.
.
. · .
·
· · · · . .
· · . · ·
r r r r r r r I r r r r r r
,---------- BRYOPHYTES (Ivs)
L t..:.. L.::... L:.. L..:... L L.::... L L:.. L L.::... L.::... L..:... · ·
· .
. · .
· : : · . . . . : :
· · · · .
. . . · i · · · . · · · ·
r r I' r I' r r r I' r r r r
t..:.. L.:.:
· ~jg-J\I
· Sin-III
· · · Sin-II
Sin-I
I' r
. present
Abbreviations:
b-bud
cp-capsule
ep-epidermis
f c s-female catkin scale
fl-flower
fr-fruit
fr en-fruit cone
fr-st-fruit-stone
If-leaf
If rm-leaf remain
lvs-leaves
m camale catkin
n-nut
n s-nut shell
oosp-oospore
s-seed
stat-statoblast
stp-stipule

Table 5.3.3. Macroscopic fossils from other sampling points, which have not been found in the profiles of SM4 and SH9.
-----7-------------------------------------------------------------------------------------------------------------------------
TAXA PEMAIN5 5AMPLING NO AND DEPTH (cm)
-------------------------------------------------------------------------------------------------------------------------------
VA5CULAR PLANT5
Ajuaa reptans Calluna vulaaris Ce>ltha p"'l"~tl'i~ Cirsium sp. C. ? heterophyllum/palustre Corylus avellana Eupatorium cannabinum
Filipendula ulmaria ?Fr-aqa' .... la yes ca Franaula alnus Glyceria flultans/de~linata HIppurls vulaaris
Juncus ? bulbosus MyrIophvllum alterniflorum Lotus sp. Potamoaeton perfoliatus P. polyaonifolius
P. praelonaus p. cf. ::i::ii Potentilla cf. anqlica Ranunculus ? rep ens Pubus sp. F~umeH cr-i SptlS
SCIrpus sp. 5cIrpus maritimu.s SDarg~l-' i 11m ml n j m"m
Stachys sylvatica Taraxacum offlcinale ThalictrlJm minus UrtIca dloica Viola sp. ~. palustris
BRYOPHYTE5
Amblysteaium ? riparium ~. varium Aulacomnium palustl'e A. tUl'aidum Bryum sp.
Bryum sp./Mnium sp. Dicranella ? schrebel'ana Plaaiomnium ? affine ThuidilJm tamariscinum
s fl s a a r, S
a
s s s fr s
n s s f I'-S t h··-st
ft,-s t
"'-5 t s s s n n n n s s s s s s
lvs lvs Ivs lvs lvs
If lvs
SM12 47-50;55-57 5M3 30-32/5M7 50-52; 60-b21 5M8 0-3/5Mll 0-3 5M-5 32-::.1I5M-8 164-11:>6; :::::4-:::31:> 15M 1 0 19:::-200; 20:::-210; 21:3-220 SM::: 2::::4-::36 Sr.:=: 254-'::56 5t"11 13~-141 5M8 214-211:>; 224-226; 244-246/5M7 274-276/5M~ 110-112; 1 :20-1:22; 150-15:2 5~::: 129-131/5M5 106-108 5Ml 102-104/5M:: ~5-97/5M5 142-14b SM7 :234-::::'6 5M3 30-:32/SM5 ::::-3..1 5M7 350-352/5M8 421:>-428; 436-4::8; 466-468; 471:>-4781 5MI0 172-174; 182-184 SM7 30-3~; 40-42 SM12 200-202 51"12 143-145; 200-202 5Mll 216-218/5M12 210-212 5Ml 20-22/5M3 27-29/5M5 32-34/5M7 40-42; 60-62/5M8 54-51:>; 64-66 5M7 40-42; 60-62/5MI0 9-11151111 1 C,-21; 23b-23::: 5Ml1 263-265; 293-2':;'5/5M12 170-172 SM5 207-209 5~112 0-3 5M8 565-567/5MI0 198-200 5Mll 2':;'-31; 59-61 5MI0 192-1C,4 8M3 5'~-61 ISM:=: 254-256; ::64-:::r.:.~.; 374-37t. 5M~ 120-122;150-152;155-157 5M7 410-412; 470-472 5M12 47-50 SMll 19-21 SM3 110-112/5MI0 218-220/5Ml1 199-201/5M12 210-212 SMll 59-61/5M12 47-50 5Ml1) 271-273/5Mll 206-20:::/5M12 0-3 8M 1 0-3/SM5 7-~; 3::-::'4/SM7 30-32; 40-4:::; 50-S2/SM:3 54-56; 184-186/5M12 27-29
SM11 253-255 5~13 216-218; 256-25:::; 261-263/5M:=: 354-35';,/5Mll 206-20::: S~13 48-50; 150-152; l':;,::o-200/5MI0 9-11/5Ml1 0-3/5M12 47-50 SM5 267-269/SMll ::351-::353 SMI 24-26/SM3 155-157/SM7 3~O-3:2; 330-332; 350-352/ SM8 324-32€:.; 334-::::6; 344-::Ll6/SMll 34:::-350 5MI0 208-210 5~!1 196-198
1 vs 5M11 226-22:=: 1 vs 8M::: ::04-306; 334-3:::6; ::54-356
-----------------------------------------------------------------------AbbreYiations: a=achene, fl=flower, fr=fruit, fr-st=fruit-stone,lf=leaf,--l----------------------------------------------------
vs=leaves, n=nut, n s=nut shell, s=seed.

SNIDDLE MOSS 4 (Percentage Pollen Diagram) ~---- TREES ---~ ~----- SHRUBS -----7
Radiocarbon Year BP o
100
S ...Q o
-c -:.::J
, • • •
I • • • -: --= -;;----
~ ~
= --=--;. • • :
~
~
= --~
•
===-----~ =
---
r • • •
r • &
~:::::::1~~~~~::::::::::::::::::::::::::~- -~'" '''''I''''''''''''''r-'l"'"'I''''''I'''' """"'[""""T""'";!I 2Q ~ 2!1 4ll 60 20 2Q 4Q 6Q 20
-,
~ -- --~ , -. --
~ ~ -:.. : :..
•
:
:. :
--
•
r - l I • • • • • • • • • ~ • • • • -, -- :. : -
:
• ! ~ -! • •
-- : -
- -: - = : : - - -; I
•
f • • :
- -: :
- -- -, • •
- -- . -
: - ---, • ~
• •
· -
~--- PlERIDOPH'flES ---7
, -,
-
• :
~- ALG>l.E -"7
SM4-IX
S14-IV
SI.I4-II
SN4-J .."
N.ll. Note the chang~ of scale for Filitoles and desmids
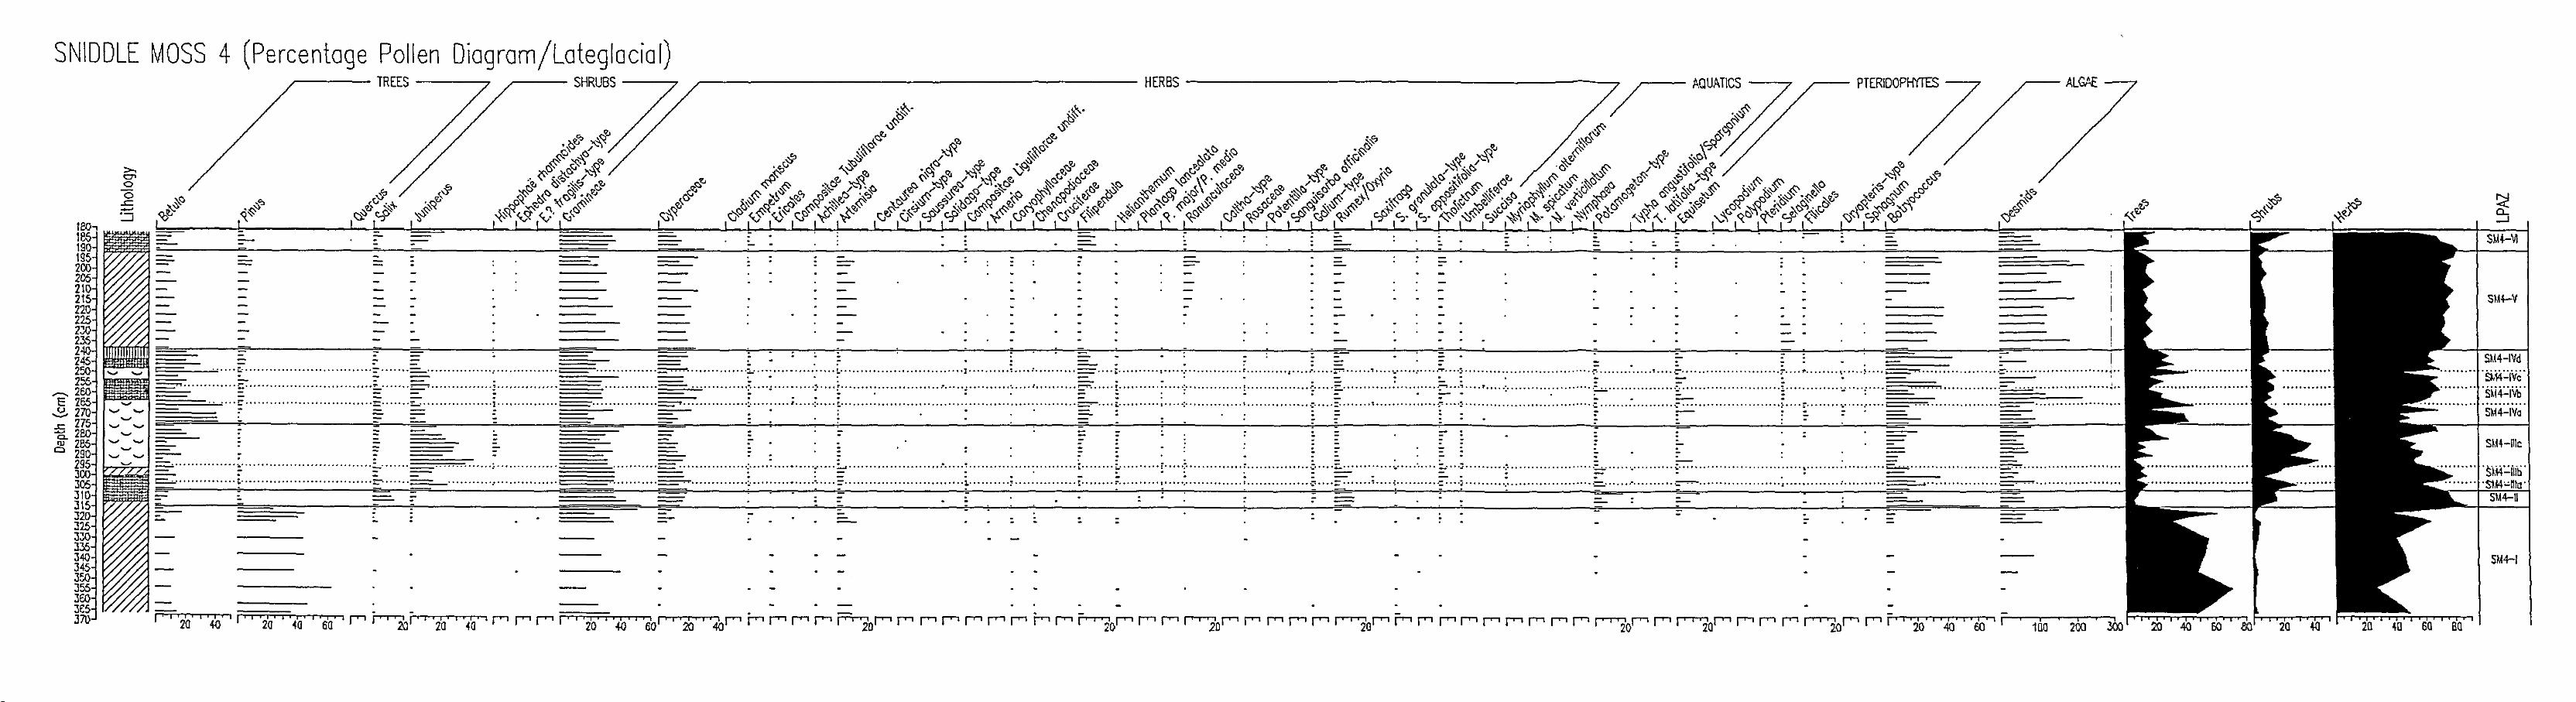
SNIDDLE MOSS 4 (Percentage Pollen Diagrom/Loteglocial) r---- TREES ---~ r--- SHRUBS --'-7 ~- PTERIDOPHYTES -~ ,r-- ALGAE --"'7
>. "'" 0 0 = -:...J
100, le5 190 195 200 2C6 210 215 210 215 2;)0 235 240 .. ... - - .. - - . - . .... - - - -.. - - _.. .. _ ....... - - _.... .' ... ,
•••••• ~ ••••••••••• "' ••••••••• ' •••••••• :: ••••• 0.=-••••••• 0 0 0 0 •••• 0/ ••• " •••••••••• _ ••••••••••••••• _ ••••••••••••• '?--.... ~ •.•. _ .•••• : .•.• ~ ....••••••.•.•.••.••••.•••.••• 2 •••••••••• , •••• : •••••••••• =-.... t ..••• · •••• ( ••••••.•• 0 •••••••••• r. o •••••••• , ••••••••••• :.,: ••••••• , ••••• : ••••• : •••• ':' •••• : ................................ :: ••••••••••••• 1 ••••• ="' ••••••••••......•••••••• : •••• ro .............. • 1> •••• "--- • I ••••••••••••••••••• = ...................... o. 'f" - - - -. --... --....- . ... - ... _ .............. ;: .••.....••...•••••••••••••••••• :.,. ••• '" .!..- ............... -1···. ........... . .•..••...... -- .....••....... ~ ..•. ; ........... ;:, ... : .....••. : ..........••.••.•..... : .....•.••. : ..... I •••••••••• = ....... :: ......... : ..... : ............. 0: ........... '" .. : ... , .: .................. ~ .... : ... :: .. ~ .... r ••••• : ••••••••••••••••••••• ~ ••••••••••••••••• ::, •••••••••• , ••••••••••••• 1 ...................... : ..... __ .......•.....•...•.... - ..... '" .••.••.•......• ~ .•
.....• ~ ............................... t:; .......................... ~ ............... ~ ................ =-' ................ ~ ......... ; ..... ; .... t ......................................................... :... ..... ~ .......... ; ..... : .............. , ................ ; ..... ~ ....... , ............... ~ .... , ................................ ~ .................... : ....................... + ... ~ ........ ~ .. ";' ... = ..................... _ ................... .. 245 250 2::6
,-... 260 E 2f'.5
$ 270 .... .., .<= 275
.... .... ..... ~ 2&l .... g- 2116 ..... .... o 290 ..... .... '-'
295 300 3C6
- -- - . ~. - •••••••••••••••• ;:: ...... , ........................ :... •••••• • ~ •••••••••••• l .............. .
. - -,-- ·,·,,···········t································!:""-··· ... --
. '-__ a _ '.'._ • • _ _ • _ _
.. ......... ~ ................. : ...................... :...: ............ , •••••••••• " ..... ~, .......... 00 ••••••••••••• ~ ...... ";" •••••••••• i ..•.. :' .... 00 ••••••• : ••••••••••••••• .; ••••• z: ....................... ,' ::.:. Ooj ••• ....... : ...................... ::..-•••••••• , ......... .;: ••••••••••• , •• , ................ ~ ••••••••••••••••••• ~ ...................... =:=;-:-:- ....................... . -- ::= :.' -:. -: ~ :-. - :... . - -
............ _ 11 .............. :, ................. -••••• = ............................. 1. .••••••••• ,. ............... t ........ ~ .......... , .................... I ................ ~ •••• = ....... , .... ~ .......... -:: .... j ................... , ............. =., ...... -... ........ ~ .................... ~ ............. : .......... - ••................ _. I ••••••••••••••• • ••••••• . . . .. ... . . . : ............... . JIO 315 32 315 -- :
J;:Q 335 3'10 345 350 355 JE.O JES J70
.. - .. - ... -j"7I'20' , '40' , J ' , '2'0' , '{'a' , '6'0' , r ~j' i 'to' , '{'a' i r r r I ' i '2'0' i '40' , 'dol' , '~' , '4br i'-r> r r r I ' , '20r ,..., ,..., r r r r r r ~or r r f""'T2or r r r r r-r-'2or r-o rn ,..., r r r r r ,..., r-r-'2or r r-r-'2ar r r r r-'2or r t' , 'io' , '40' , 'ro' , <"1-r-1-'-0-a ~-200'--"""":!O:J
SIH .. V
SM4 .. IVd
. ti.l4:':IVc·
. S~i4:':IVh' SM4 .. IVa
SUHllc
SM4-J

180 18!; 190 195 200 205 210 215 220 225 230 235 240 245 250 255
........ 260 E 265 ~ 'Z10 :5'Z15 280 g. 285 c. 290
295 3:10 3:15 310 315 320 325 330 335 340 345 350 355 360 365 :nO
~ o o
..c -:::J
~
~
~
~
~
~
~
~
~
~
~
~
.~ ~
f~' ~<:i ~ / ~~ • ",<$' ~-\- ~{' ~ «::-,,<$< ~ ~
= :: -
- .
---- - . :--- ... i ..... ~ .... ~ .............. - ........... ;- .... ~ .............. ~ ............... :=---...... ~ .................... ~ ................. _ .......... ~ ............... ~ ............... ~ ..... : ..... ;::::::==-'"-.. ' ''' .. ". - _. - . - - - ................ ~ ............................ ; ................... ---:-............. ,,_--:- ............... ::; ............... ~ ....... ~ .... --................. . = ........... ~ .... ~ ... ~ ..... : .... ~ ............ - ····L········· ......... ~ ~ ~ _
:..-- :-- ~:. :.. - - :. :..-____ ••••• ~ •• ",:-:: ••• 0::: ••••••••• ~ •••••• ~ ••••••••••• ~ •••• 0::: •••••••••••• ····w··· ............. w-:-: .•... :: .•................. :--......... . ..... ~ ................. :--:. ...... .... ..j ••••••••.••••••• • :.-........... ----....... . - . - . - -
: - - :..: ::. ,
- : . - -. . - .. - .. -- -- - - . - - - .
SMl-V
SMHld
·Si.i4:':Wc SM4-Wb
SM4-Wo
SIM-llic
!:: .................. -:: ...• ~ ... : ...... - •.......•... :::!' ••••••• ! ................... !:....-•••••••••••••••• ! ........ ~ ...•.....•.......... ::-...................• ~ ......•..•........ =.. .................................. ::. ........ ~ ...• . ................... "SlA4-ilib :. :::- - =:. =- : : - - . :-:--J:l. ••••••••••• : •••••• :.,: ••• :::::::::::: ••••••••••• =.,: ...... ~ ..... = ...... : .................. =.: ................. 1 ••••••••• ::: •••••••••••••••••••• ~ •••••••••••••••••••• = .................. =. ................... ,:......... . ....... ~.. . .. ~ .... :=::::::....:..... . ............... 'S~4-Htd
- - = _ - S1.I4-11
SMH
;........,""2 ..... '0...,·' r r ~Or j 1.0 4'01'"'2'0 ... 1----.., i-j ----.., f""'""T2o r1------., rl------.' rl------.' .-1-----,' "'1 -----" ~Or ;"'j ~-5.,..O--1 .... 0-0--,150
5 5 5 5 5 5 5
x1000 grains cm-J N.B. change 01 scale

SNIDDLE MOSS 4 (Percentage Pollen Diagram/Flandrian)
Radiocarbon Year BP
91~5-
10 1 20 25 30 ,35 40 45 50 55 60 65 70 75 eo
E~ ~ 95 or; 100 ....... 105 ~ 110 ellS
120 125 1.30 1,35 140 145 150 155 1&:l 165 170 175 ISO 185 190
~-- TREES --7 ,----- SHRUBS ------ ~-- PTrnIDOPHYlES --~
- - - - - · . -. .. .. .. :::-................ ;-........ ~ .... :-..... 7. ......... :7 ..... " ...•............. : ................. ; ........................ :. ...................................... ; ............ : .......... "1 •••••••••
· . -... -... .... . .... -••• : •••••••••••••••••••• : ••••••••••••• ~ ••••••••• ~ •••• "l ••• • t •••• t ••• ••••••• ~ •••• : •••••••••••••••••••••••••••••••••••••••••••••••••••••••••••••••••• : .......................................................................... ':' ••••••••••••••••••••••••••••••••••••••••• - - - - - - • • _.. ... •• _ _ L
- ~ - : - · . : - . -. - . . - - · : . · -- -- - - : :: - · = : : - · - -- - - - - - · - ; - : - - · - - . -: ; : : : : -- : : -:
- -. _. - . .. . - - - _. . ..... .. .. ___ .' ... - • .. .. • .... _.. t
~ •••••••••••• -. •• 0.0 •• ,.... •• 0 ""0 0.1' • ••••••••••• ~ ••••••••••••••••••• "1 __ •••••••••••••••••••• ~......... •••••••••• •• • .................. •••••••• 1' ........ •••••••••••• 0 ••••• 0 •• ••• .. I .. 0 ........ 0 0 .............................. _ .................................................................. 0 •••••••••• \.0 ...... 0 ... _ ...... 0 •••••••••• I ......... ...................... 0 •••• To 0 ....................... 0 .. '\ •••• 'To •••••••••• 0 ........................ H"
- • • .. 0.. ...... ..
- ;
SU4-lXa
N.8. Note the chonge of scale for Filicoles cnd desmids

SNIDDLE MOSS 4 (Concentration Pollen Diagram/Flandrian)
Radiocarbon Year BP
913<W35 -
10 15 20 25 30 35 40 45 50 55 60 65 70 75 80
.--.. 85 E 90
$ 95 -c 100 -<-' 105 g- 110 Cl 115
120 125 130 135 140 145 150 155 160 165 170 175 180 185 190
N
~ , " I I I I , ; i
SM4-X
~ •••••••••••••••••••••••••••••• T" ••••••••• 4 •••••••• ~ ••••••••••••• ;:::~.:..:. SM4-1}QJ ............. ,,"""" ............................. _ ... _ ...................... :.... ....................................... ..,..,.,......, ..................................... .
SMHXa
.' - . ----------------------------------------------------------------------------------------------------------------.-----------------------------------------------------------------------------------------------~--------
SIM-Vlllb
. ........... ... ...... - ...................................... :--............... . • ....•.. t .••.. ~ .••. .••••••.•••••••••. '" ...••.. '" " .-••..•••••.•••••.••••••••••••••••.....•••••••. II ~ .............................. : ........ ~ ........ ~ ................ ' ................................. ~ ......... .. SIM-Vlllo
SM4-VII
SM4-VI
1 5'0 150 1 '2'01 ' 201 '2D '401 '20' 4'0 ' 60 '8'0 1 10D 150 1 'I ' 20 4'0 ' 60 ' 80 ' lOa 1 50 100 150 200 I io ' 4D 601 I I 200 WO 600 BOO
x1000 grains em-3

SNIDDLE MOSS 4a (Percentage Pollen Diagram)
/ N
c:f .....J
70
-75 --80
SM4a-1I1
85
90 ..--. E u .........
..r::: 95 ...... - - - S~l4a-1I a.. Q)
Cl -100 -
--105 - - - SM4a-1 110
-115 _ _ _ _ _ _ _ a ~ • __
I ' I , ii' Iii , iii , i ~ I i I • iii iii Iii iii i • i ~ Iii i i r i , i , iii I ' i , i r' ~ ~ Iii ii' I j-r-,......., t-T""1.......,......,"""T""T'"T""T'T"'T'"""" hr-rr"T"T'",.-T-, j--,-,,......,. ........ .,.......,...,....,...., 20 20 +0 20 2.0 20 40 2ll 20 40 2ll 2ll
120
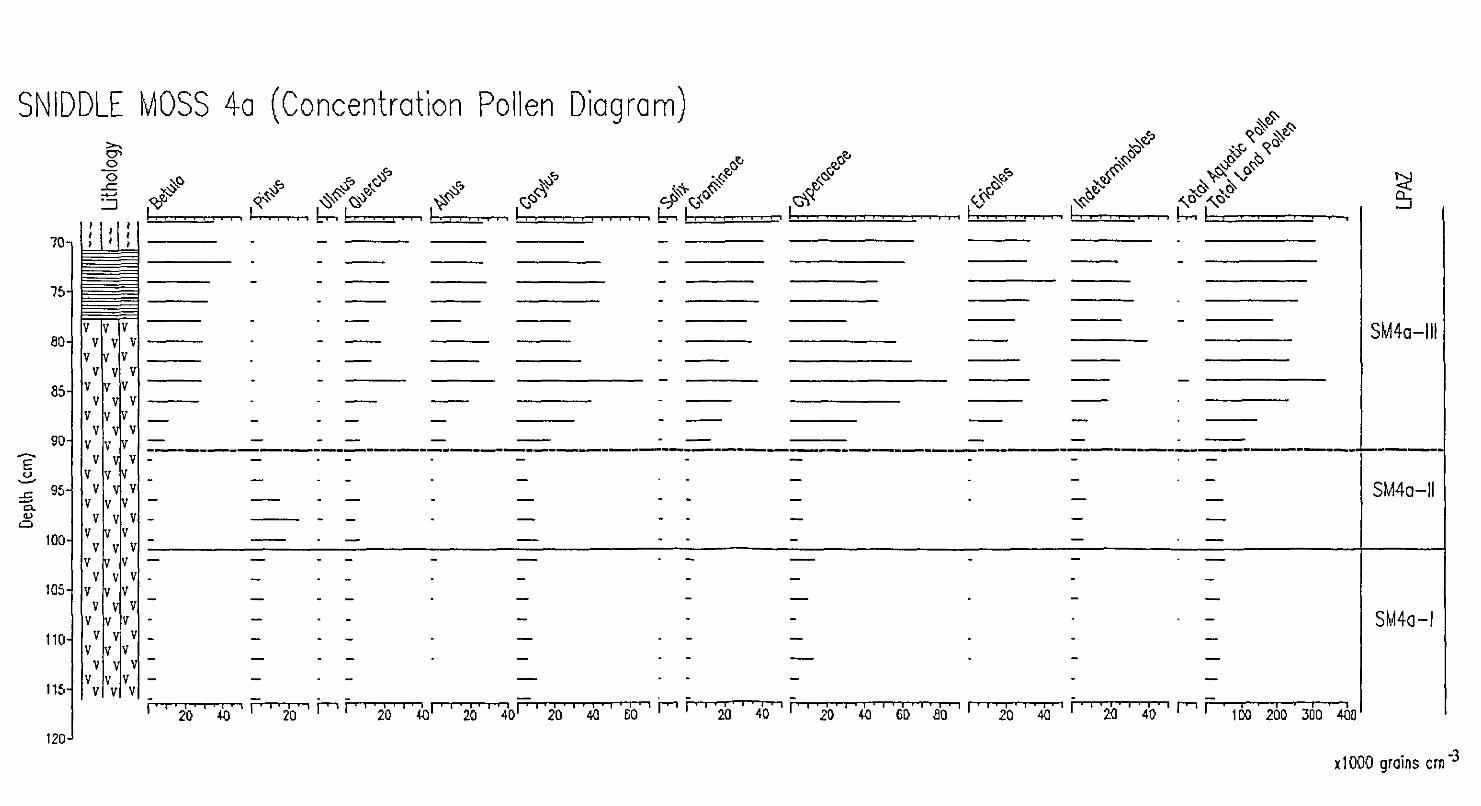
SNIDDLE MOSS 4a (Concentration Pollen Diag ra m)
70 -
75 -
ao -
85 -
90 -E u '-'
J:: 95 ~
0.. .., 0
100 -
105
110
115
120
'If ' , ' , ,
v v v v v v
v v V V V V
v r.' v v v v
v v 11 v v v
v v ~ v / v
v ~ v v v
v v ~ v v v
v ~ v v v v
v 11 v v v v
v ~ v v v v
v v v
1 v v v v ~
v v v v v v
'::,..,&"" o£,C>
<S~ """"I".
SM4a-11i
----------------------------------------------------------------------------------------- ----
SM4a-1i
SM4a-1
j' , I ( ; iii' l I 'it i • , r f i , • , • i I I I 'i; i' i • I j7 i • i ' i • iii' i I r i; i I I' I ; i ' I I' I ' , I I ii' i • I • Iii' I Iii' I ' I ' iii i' iii: I 'ii I r ,;=-""-"" -"--r, ~ • ..,.,-.-• .." 20 40 20 20 40 20 40 20 4{J £0 20 40 20 «l 60 80 20 4{J 20 40 100 200 300 4D0
xl000 groins ern-3

SNIDDLE MOSS 9 (Percentage Pollen Diagram)
>. en 0 0
..<::
Radiocarbon Year BP -<) :...J
• • • • • 50
100 , 150 \
5~- 200
\
..<:: 6115±OO - ~ 0.300
OJ
\
Cl
6830!£5-
1305iSO -
400
450 F F F F F
F F F ~oo F F
550
· ------· -----------· -----
Iii i 20
---· · · · ---· · · · · · -· · -· · 0
·
· -· ------
.,..------------ TREES ------------,
--'i I , i
20 i i
20 5
W i 6'0
· • I ·
- . . ~~ I ~'o ' f""""1 1 20 .'0 ' .., f""""1 1
NoB. Note the change of scale for Ulmus
-· -·
· ·
-~
• ·
, -I · r · , • • • • ! · · 0 · · · - · · . · -0 - · -· · · · --
. 0
-
-. . . .
-.
PTERIOOPHYTES --"
I .
Fi:r-T~f""""1 r'"' r r f""""1 r f""""1 f""""1 r'"' r r r'"' r f""""1 :' r .., .., r'"' r r ~r r r r r'"' r r r r f""""1 ;..j ""'1""'0"'" r ;"1 "'-''''io''''''-w''' .-" r 1 ED
SM9-!I1
SM9-11
SM9-1

SNIDDLE MOSS 9 (Influx Pollen Diagram)
Radiocarbon Year BP o
50
471~5-
t3~: 100
150
56B5±!lO - 200
6115±&l-
730&±S0 -
..s:: -o-J
0.. 300 cu Q
350
400
450
500
550
-
-
-
-
-
.
, , , , , , , , , , ,
~~ ~r:, "> ~~ <¢~ -:s-~
L 0 ! " " 0 0 0 0 0 0 0 0 0 0 I
-l V V V V V
rv v v v v v
rv v v
- -i I t-. -
~ i::. t i f
v v v ~ v W v v v
~ v W v v v
W v w v v v
W v ~ v v v
v v v v v v
v v v v v v
v v v
/ v v v v
v v v v v v v v V
F F F F F F
F F F F F F
r=::;="-"---T' --00--'1 Iii iii I • iii • i • I I 100 200 300 20 40 60
i
2'0
x100 groins cm-2 Year-I N.B. Nole the change of scale for Ulmus
J> ">
"'~<:> y.~",r:, .~o ~;§>
cfr~ ~ x\~CJ~~ ~ 0 l 0 I-,:..,! 0 0 0 b-, Lo I " " :
- . - : .. -~ l l: ; . 0 t t
~ ,.
iE ~ s:- I r ~ i :
, i 50 100
~\!, .~'O
(f' G~ I 0 0 0 0 0 0
-F""
~
~'lJ ru'"
I>,tj Ri
~'\~ I
--~ ~
~
-rt L
~ r
I I 1000 1500
SlAg-I>!
SU9-1\1
S1.t9-11
SM9-1

SNIDDLE MOSS 9 (Percentage Pollen Diagram/The Ulmus Decline)
Radiocarbon Year BP
~
E ~ ..r::::
47H1±45· "'0.. 2l
55
flO as 90 95
100 1 110 11 120 17.) 130 13!1 140 1tS 150
>-en 0
"0 .c -:.::J
, I I I I , I I I I I I
ffiITS--------------------------------~ SHRUBS ~---------------------- HERBS ------------------, AQUATICS r--- PTERIDOPffYlES ----,
.,..$> l<if
~
<'} -:& .. ~ .~,;§> ~t .f>.~ ~r{ <:>#
~6' .:...'*'''' &' ~,t>;; ~~ ~ &' ~'" ~ ,I~ <::.P I.;., t! I c§ 'V'" 'V~
L I ,L I ~I
=-......................... :- ... = ................................................................. = ........ ::;-................................. --........................................................... _ ................ _ .............. ~~ ................................................................... _ ......................................................................................................... _ .............. _ ............................................. . - . ". ... . . -
~ - - ... ... - - . = ........................ -':' ,-- .. -......................................... , ............ ==-, ............................................ _ ......................... -................................. ~~~ ... ': ... ': ... '=,.............. . ........ -......................... : .............. ~ ......... '; ... ': .................................. ': ........ '; ........................................... = .... : .............. _ .... : .... -- ............. _ ........................... .
- =. - . . . ::=--=--. . ~==- . . .. - .. _. . . - - -_. ' ..... - .. _.- . :.:: ......................... : .... =. .................................................................. = ......... ':..: ................................ =::..:.:.:. ..................... _ .................................. _ ....... _ •........ _................. . ................................................ ,., ... ,., ................ ,., ............... 00 ....... 00 ....................................... - ........................... _ .............. _ .............................................. . . . - .. _. - . . . . . . ~-~ . - .. ; " . ;-.......... , .... . .................................. : .............. , ............... , .... ;' ......... , ......... , .... , ........... ( ...................................................................... .
, , . .......................................... . ~ ......... .............. ..... .... ........... ......... ......... . ...... ~ .................................. -_ ...................... : .............................. ..
. -
, 60 B'Or. ---~-----". ' t'o ' r r rj ....... ~"r'Q..,' r. ' lO ' ~ ., ' 2'0 i .wI ,
lO ~ , 60 '. I 20
5 5 5
N.B. Note the change of scale For Ulmus, Tilig and [[minus
..........
'" Q)
"' " .c 0...
5
...... 4· ....
3
2
1

SNIDDLE MOSS 9 (Influx Pollen Diagram/The Ulmus Decline) ~~ 11-.~<::-
~?j. ~f(;~
Radiocarbon Year BP
471Q±<15 -
49E0:!:55 -
5050:00-
,-... E u ..........
15 ZO Z5 30 35 40 f5 50 55 60 65 70 75 80 85 90 95
100 105 110 115 lZ0 1Z5 130 135 140 lf5 150
·
· · · ·
·
~ o -o ..s::: -:.::i
I I I I I I I I I I I I I I I I I I I I I I I I I I I I I I I I I I I I I I I
V V V
vV V ~ V v
'r;V v v v v
v v v ~ v v v v v
~v v v v v
v v v v v v
v v v v v
v v v v v v
~~ v v v v
rr v v v v v
~ v v ~ v v
~ v v V V V
~ ,:? ~~ <$-'?; ~.r:;
~. ~ ~ ~~ ~~ (J'l> £!. ~~ ~o t;-Q<:i.. ~.f
.~r;;; en
.~J> " ~ ~o • <:)\ ~'4# ~r§< 11.)
~.§> .~rv ~~ ~& (sf:; ~~lS ~<:,<>; l-.Cl G ~OV;; '" ~ en
;'tS :,,~ ~ ~ vO ,<:'1 :b ~c.- <:> !U ,<,-& ~~<::> ,~rv ..s::: ~,~ "Q S<::> c;p cP "::,,,"'1.., <.SG ~~<:i.. ~. ~. ~. ,\0 "\."l a.. L I I I , l ,L L I L l ,L ' I ,I , , l ' ,,~ I
5
•••••••••••••••••••••••••••••••• _ •••• _ •••••••••••••••••••••••••••••••••••••••••••••••••••••••••••••••••••••••••••••• - •••••••••••••••••••••••••••••••• ,_ •••••••••••••••••• - ..................................................... _ ••••••••••••••••••••••••••• _ •••••••• - ••• 0 •••••••••••••••••• - ••••••••••• _ ............................................................. - .......................................................................................................... - ..................... - ............................... , ••• ·4 ...... · ..- _. - -' - - ., . - .-"- - - - - _. - .-................................ _ .... _ ............................................................................... -...................................................... _ .................................................... _ ..................................... _ ................................. _ ................................................................................................................................................................................................. _ ............................................. . - . - .-- " 3 . : ............................... = .... - ........................ , .................................................... ~ ............................ " .................... - ................................................... - ...................... .: ....... :- ................................. ~==::-:-:-.. :7 .. :7 .. ::-•. ::-•.• ::-•. ::: .................................................................................... " .••.......••...........••..••.....•.•••••... , •......••.•..•... " =-- ............... : .... - . . . . . . . . . . . . . . . . . . . . . . . .. . ............. .
-::- ::::- _.. ;,:. : =- 2 - . - ::::::::::;- • - ... ==-- .. - - - . - - .. - - . -•~.: ............... -................ ~:; .... ---........................................................................... -= ...••••••••••....••••••••••••• =": .................... = .................................................... . ........................ = ....... ~ ............ : .................... :.- ........................... : ........... ;. .................... : ............................................ : ................................................................ ; ............... :.... . ......................................... .
= = =, ,= = 1 ~;=- = ~ = : - ~ [ - =- ~
r-'--IOO" -'--2""'OOr-,-,3"oof"'o, r ====------..----------." ,r::""'---'SO'-'-I'O-O-'--I'SO ;:'1 --..--." ,r'-rr-5'O-'---'16'o-'---'IS0 r1 --..--." 1 ' , '2'0' , 'w' , '6'0' Ii' , '-loi ' , 'ii' , ,r---""T""---., ;:'1 ""T""'so-....'-,T60 ...... ' -1.5'0""-2'601 ' , 'tori --..---" '"I --...--.." "---...--.,, '"I --..--." .-, ---...--" 1"", -"'--'-"'-'201' , 'io' , '4b~ '"1"":;'-I00T"' "'-201""'O"'-,3OOT"' "'-401""'0"'-'500
5 5 5 5 5 5 5 5 5 5
xlOO groins cm-2 Year") N.B. change of scale

Table 6.3.1. Macroscopic fossils from THIEVES' MOSS
THIEVES' MOSS 1
120 1.35
140 125
145
130 n;y TO SYMBOLS 150
155
1:=:-::1 Dark. Tery humified 1= ::1 Marl 135 TM 1-11
- - amorphous pea t 160
165 14U a Sphagnum [llJ]] Organic clay
......... peat E
l.) '--'
..t: 145 ....... C>.. Q) o Fibrous peat Organic mud Cl
, '" 150 1M1-1 ,
E 170 u ........
:5 175 a. IIJ 180 CJ
185
190
Iv V V~ \lood peat ~ Lake clay 155
No organic 195
160 material 200
~ Swampy peat
165
205
210
r r r 170
215
THIEVES' MOSS 2
~ 01 0
'0 ..c ---:::J
I
J '-'L ....,
---t ::J ...., '-'
TM2-IV
'-' '-' '-'
'-' '-' '-'
'-' '-' '-'
'-' '-' '-'
'-' 1M2-III '-' '-'
'-' '-' '-'
'-' '-' '-'
'-' '-' ....,
'-' '-' ....,
'-' ...., '-' ....,
nY12-1i
1M2-I
THIEVES' MOSS 3
>... o· 0 '0 ..c ..... :::i
0 10 - ------20 30 oW
50 60 70 BO 90
~
E lDO 0 ........ ..<: 110 ...... g- 120 Cl
1:50 1«> 150 160 170 lBO 190 2DO 210 220
/r---- BRYOPHYTES (Ivs) ---;7
1M3-III
1M3-II
TM3-1
. . . rrrrrrrrrrrrrlrrrrrrrrrr
. present
Abbrevia tions:
b-bud
ep=epidermis
f c s-female catkin scale
fr=fruit
fr-st-fruit-stone
lvs-leaves
n-nut
oosp-oospore
s-seed

THIEVES' MOSS 1 (Percentage Pollen Diagram) .,------ TREES ----"7 ~-------- ALGAE. --------7
120
·c~ ~(:.' ~<i>
~ &' Jt& ~~ <;;;f'> l~ ~(!, I I , ,
- lWl-1ld
125 ............................................................................................................... , ....................................................................................................... , ................................................................................................................................................................................... .
1.10 11.11-11:
-1.15 ..............................................................................................................................................................................................................................................................................................................................................................................................................
1«1 lW I-Ilb
................................................................................................................................................................................................................................................................................................................................................................................................................
-150
155
I~O N 0 POL LEN
165
I7Q ""'" I"" , r r r I"'""'""":::' r ~ 'I -~---" rl ' .;,.. '~or r r~r r r r r r rr r r r r r rr r r r r r rr r r r r r rr r 1 20 «I 20 20 2Q LV" LV
5
N,B. Note the change of scale for Hippophoe rhamnoides and algae

TH IEVES' MOSS 1
120
125
130
1.35
140 -E (.) -..s:: 145 ~
Q. <V
C.
150
155
160
165
170
TlAl-Ild
nl1-lIc
........................................................................................................................................ ~ .................................................................................................. , ..... .
lM1-lIb
1M 1-110
Tl.11-1
N 0 POL LEN
I ' I '20' I '4r"" I ' I '201' r-I -~---'I r-I -~---'I I' r r-I -~---'I r-I -~--'I r-I -~---'i r-I -~----'I r-I -~----'I r r I I '20 I 4'0 &0 810
5 5 5 5 5 5 5
x1000 groins em-3 N.B. change of scale

THIEVES' MOSS 2 (Percentage Pollen Diagram)
125
130
1.15
141]
145
150
155
160
~ -"'" "'" ..... .....
"'" "'" "'" ..... --
;------- ALGAE -----~
E 165 8.
"'" "'" "'" ~
.................................. . .............................................................................................. - ... - .................................................. . ........................................................... - ................................................ .. . ....... : .... :.: ... :..:. .' ' ..... - ... ......... .. ..... ...... ........... ........ .
.s= 110 "'0. <l> 115 Q
lBO
185
190
195
ZOO
205
210
215
~ "'" - - - - .. .
- .' ................................................................. , ............................................................................................. . - - --. - - - _.
5
N.B. Note the change of scale for Hippophoe rhamnoides and algae
. .... ... .
... _. -' -, - - - -. . . . . .. . .............. ;., ......... : ............ '.' , ....... '.' .... : .... : ' ... .:.' ........ : .... :" ... '..:.,:' .,....... .... .. .......... . ...... ,'.... . ............. .:.... ... : .... :. - -.......................................................................................... --
TMl-N
TM2-llib
.....................
TM2-llia
Thl2-lIa
Thl2-1

125
130
135
155
160
E 165 ..3 .c 170 ..-0... cg 175
180
185
190
195
200
205
210
215
TM2-IV
TM2-lIlb
..................................... :.: ............. ...................... ~ ..... :..:... ......................... ... :,.:. ........ ,: ..................................................... ~ .............. : .......................... ..................... : ......... .:..:..:.:..:. ...................................... .
1M2-lila
TM2-llb - - -- - -. - - .. -............................... , ....................................................................................................................... " ......................................................................... '" . . .. . . .. . . .. .. .. .. .. . . .. .. .......................... . ............ . - .. . .. - -.. - - - . -
TM2-lIo
1M2-I , ' I 'io' I '40' I 60 I '00 I r .-, ~-50"T'~--.,00~..--,1bo I' , 'I 20ri -~--'I , ' I '20' ' I 'io;"" -~--'I ;::., -~--'I ;::., =--~--'I ;:'I-~-"""I ;::, =-~--'I r i' "iol 200
5 5 5 5 5 5
x1QOO groins em-3 N.B. change of scale

THIEVES' MOSS .3 (Percentage Pollen Diagram)
Radiocarbon Year BP o
10 20 :50
~o
SO 60 70 eo
.-.... 90 § 100
6725:1:70- ';; 110
78.»i80-
--a.. 120 Q)
Cl 130
140 150 160 170 180 190 200 210 220
r------- lREES -----""7 .r--- SHRUBS --"7 .,-------------- HERBS ------------"7 r------- PlERIDOPHYrES -----"7
- .......... , ............................................. --......... . o •
. n .•••..••.•... ....... : : •..... ~ ...• ~ ....................... : ..... ~ ............ ••......•..•......•. 'f' •••••••••••• :. iI •••••••••••••• , ••••••••••••••••••••••••• I ................ • ••••••••••••••••••••••••••••••• r ..•.. • .•.•• • ••.•• · ..••. 1 ........................................................ .-................. :.1 .................. ~ •.•••••••••.•••••••••.•••.••..••••••••• .•••••••••.•••••••••.••••••• - 00
NoB. Ncte the change of scole for Equiselum. Sphagnum ond Telroedron
1M~-lIIe
1M3-lib
1M3-lie

THIEVES' MOSS 3 (Concentration Pollen Diagram)
Radiocarbon Year BP o
10
20 30
40 6200±60 - 5{)
60 70
00 .....-.. 90 § 100
>.. 0> o o
..c ....... ~
X .. _....
. , .
~ v:-~ ~ ~
• ~ ~I:J<:O <:(°o~~ ;f i§) ~{." ~ ...
t:;,'lJ ~~ ;p ~(j c§' .~q;. & ... .{f ,>op.,'V N (j {!- ~ , (,)' (,)' <l:: ~ ~ ~## ~
. . . I 0 I 0 h:., l....:.... I 0 • 0 0 0 0 0
. ............................................... ;:.:;-.......... , ...... ,., , .. , ............ .JM~::-JII~ ..
1M3-ilia
1M3-III.>
1/ 6725:1:70 - --..c 110 f •••••••••••••••••••••••• ~ •••••••• - ••••••••• f ••••••••••••••••••••••••••••••••••••• t •••••••••••••••••••••••• l •••••••••••••••••••• r .••••••••••••••••••••• •••••••• , •••••••.•••••••••• ~ ••••••••••••••••.•• ,',... ••. ••••••.••••• • ..•••••••••••••• J ••••••••••••••••••• 1 ••••••••••••••••••• 1 ••••••••••• " ••••••••••••••••••••••••••••••••••••••••••
/
"I ........- .. / Cl- 120 /1 cu o 130 / / 1'),/
- - .
140 .. 15{)
Thl3-lIg
7830±60 - 160 170 100 190 200 W.3-1 210
220 i : ,
20 iii' i • Iii
M} 60 60 5 5 5 5
x1000 groins cm-3 N.B. change of scale

Radiocarbon Year BP (Swales. 1987)
297Qi60·
3B5Qieo·
tEY TO SYMBOLS
~ Sphagnum-Calluna peat
o Er1ophorum yaginatum peat
Ivvvj Wood peat
b>1 Fine. silty material
o 10 e s e 20 5 e 5
30 40 SO 60 70 80 90
100 110
.......... 120 ~ 130 --:5 140 0.. ISO '" c 160
170 180 190 200 210 220 230 240 250 260 270 280
e 5 e Is e s
e s e e e e
e e e e e e
e e e e e e
e e e e e e
e e e e e e
e e e e e e
e e e e e e
e e e e e e
e e e e e e
e e e e e e
v V V V V V
V V V V V Y
V V V V V V
V V V
-
-== ~
" :
-
--== --
-----=-
---: --
~ = ~ ~ --
---...- ...... -.......... . . .................. - ............ - ......................... .
I ' iii' iii i ' iii I 20 20
N.B. Note the change of scale for Ulmus
- - · --- - . SH-W --- . --- -:; =-~
~ t
• · ; , • •
, :..
SH-III
SH-II
• ....................................................... , .......................................... ". , ............... 1 •• , •••••• , •••••••••••••••• , •• " ........................................ _ ....................... , •••••••••••••••••••••••
SH-Ia

SUNSET HOLE (Concenlration Pollen Diagram)
Radiocarbon Year 8P (Swales. 1987)
297D±EO-
3850:±80-
0-10-20-;)0-
4Q-50-60-70-80-90
100 110
....... 120 5 1;)0 ---..t:: 140-Ci. 150 Q)
D 160
s e s s e s
s e s s e s
s e s e " " e e e e e e
e e e e e e
e e e e e e
e e e e e e
e e e e e e
e e e e e e
e e e e e e
e e e e e e
--
---•
~ ~ L ~
e e e _ ,. ,. ,.
-- -- --: · -: · L =
· -1 = -i" ~
: - -;;;.. -:-- --;.- • ---~ :-
~ ~ =
-
=-- --- - - =-- =- SH-I>I
- =- - : ~
~ ~ ~ = ~ .. - -~
--=- =- =- :;- • =-- = =- =-=--
~ :.. - :
=- :: -::. -=- ~ - • - -- c- - '=" ~ ==-- =
:
~ ~ ~ ~ ~ f ~
~ =
SH-1II
SH-D
. • - :iH-lb
170 180 190-200 210-220-2;)0-
24Q-250-260-270-280-
v v v v v v
v v v v v v
v v v v v v
v v v 1""1""1"" ••••••••••••••••••••••••••• ......,..., ••••••••••• ::::: .. ; ....................... ~ ................................................. ,.. ...................................................................... . ;::.I .•••.••...••••.•.•.•••••.••••••• ~ .•.••••.•.• 1"": ••••••••••••••••••••••••••••••••••••••••••••••••••••••••••• ~ ............................................................................. ~ ••••••••••• ~ ••••••••••••••••••••••••••••••••••••
SH-ia - . r-I ~--,5'0-~IT6o----.1501 ' "io I r-I ...;;;;;;..~--"T-~-20T""1 -~--'I I I 2'0 I r"1 ----~------" I -360 rl ----~------" I io 'I '2'0" '4'0 I
50 60 I I 660 5 5 5
x1000 grains cm-3 N.B. change of scale

Radioccrbon Year BP (Swales. 1987)
2970±60-
.3850±BO-
......... E (.) -.c: -c.. <V Cl
o 10 s e 5
s e s 20 s e s
s e s 30 s e s
50
60
70
00
90
100
110
120
130
140
15<)
160
170
180
S e s -e s
s e s e e e
e e e e e e
e e e e e e
e e e e e e
e e e _ e e e
e e e =e e e _
------
- -- - --
- · - - · · - - -· -- · · · - · · - · · -- -· -· · · - -- -- -- · = - - · : : . : :
-e e e e e e .............................................................. - ....... - ................... ~~ .. ~ ....... - ................... . .............. 0 ................. = ............. ==== ......................................... _ ................... : ............... : .................... : ..... " ............................. . eee_ ~~ _ - - - - ~ . : : .. =
- . _ ............... . e e e ~ ................. =-- ... '" ................................................... ......... . ....... :-................... ............................ ,., ........... ~ ................. .;::. .............. ~ ........................ : .... : .... , .. : ............... ~ ....................... ~ ................ : ............................. .
z::=.. ••••••• , •• 10... . . ~§§:.. ~ '~~~~F::' =- . . . . I e e e =- :, ~;;;;';=""""""""""""""""""""""""'" •••••••••••.••••• • •••••• ~ ••••••••••••••••••. ::: ·····5·················· ..... : ..... :: ................ =................ ·············:·····a··········· ····~·····i····;. .. , ~ .... : ...... : ..... ; .......... ; ............... ·~·····i····:·····~··························· e e e =::;:- ........ j. ••••• ==- .................................................................... . ..... : ..... : ..........•.... =................ . ..................................... .:. .......... : ... !. ...................... : •.••••••.• ~ .•.. = ••••• !. •.•• ! ..... !- •••••••••••••••••••••••••••••.
e e e c:::.. I ==::===_-.;.;_- . =- ..! : I'" i j ~ : i: =.: e e e
e e e e e e
e e e e e e ,
1 I io' I I' ;::1 ======:...--~----------.
5
N.B. Note the change of scale for Ulmus, Tllia and Fraxinus
- -:.. -
1 I io 1
-. .
I 1 I , I 4b1 20 5 5
III IlJ III o
..t:: CL.
5

SUNSET HOLE (Concentration Pollen Diagram/The Ulmus Decline)
Radiocarbon Year BP (Swales. 1987)
297D±60-
3850:180 -
;-0.
E u
"--' ..<: ...... a. Q)
Cl
,~c, ,>c, • ~~o, ,,;;?
o 10
20
,>" :::,0, ~ ~c.; c, ~ ""' .... # ~~ .:s-~ rv..;:fj ~~~ ~'5 ~ ... ~ ClQ'"
bl ==:::-',,....,.,~ ~ !:::I ========-----~, I.. ",I I--~~, bl ,===""', .,..." ,~,..;:;.:-...... , ,~, I!:=,............-~,I !::: ===-~....--. s e s
s e s s e s
s e s :xl s e s
s e s -40 s e s
s e s -50 e e e
60
70
00
90
100
110
e e e e e e
e e e e e e
e e e e e e
e e e ~ e e
e e e e e e
--------
:
-: ---.
· · -- ----. -· -- -- -- -: ~
- , · . - -=- - - -: ---
; .
- -- --- -- - --- -- -- - -- - -- -:. = - ::. --- - -- --
--- ---:- . - ----, .
--
--. - ---
en Q) (J)
'=' ..s:::. 0..
5
120 e e e
e e e ......... =. .................................. _ ..................................................... _ .......................... .:. ........... = ......................... ::=-..................................... : ....................................................................................... _ ....................................... .
1:xl
140
150
160
170
100
e e e e e e
e e e e e e
e e e e e e
e e e e e e
e e e e e e
e e e
~:.:..:..= ............ ..
· ... - -- . - - - - - - - 4 .............................................. -- ...... = .................. ·:ii~ ~ .......... :..:, ................. ~ ............ ~ ........... ::- ...................... '" ........... , ................ ~ ............................................................. ~ ........... ~~ ............... .
....................................... ," ===... 0-;:::.......- ...... , ... :-., .... " ..... ".. '--_ ........... , .. ,:-, ..... , .... , ................... ',. . ", .................... ,r ....... ,.:.· ...... , ... ;.. ......... , ....... :_ .................... _ .... , ..................... ':.... . ..... , .......... """ ." ... " .. ~'.' ... ':. .... " .... , .. ,.... - - . ............................ ', ...... , ....................... , .. ~ ........ -. _. .............. . ....... , ... :.:,.................. ~;,.;..;,.;. .. ;,.;. .......... '.. . ......... ~ ................... , .... =-= ............................ ~ ....... :......... , ............... ~ ................ ~ ................... :. ..... ,:,' .. .
'=
- :. :' :--
, ,
. ..................... .
:
;::;:;'::;:':;:iO-.-,-~4,...'O,...,' '''''''''''sbr ;::1 ========::::;:=====------.'1' , 20 'I r--~--" I" 2'0" '40" '6'0" 80" r'1 -~--" ;::1 ::::;:=;:5'o-~I ... bo~---.150,.....i,-r,~'2.,...'O..,' r'1..,'r-""'Tio......,.~4 ... 'O.......-' ~'sb""""" ;::1 ::::;.-5..,.'O~-100.-' ~'-'''''5-0~''''''2001'' '2'01" 'tOr'I -~--,'Ir--~-....,' r'1 -~---" r r 1;:::;:·::;16=0:;:·2::;:OO~3 ... 00-'-400.-' ~'5""OO
5 5 5 5 5 5
x1000 9rains em-3 N.B. change of secle