effects of chironomid density and dissolved …
TRANSCRIPT

EFFECTS OF CHIRONOMID DENSITY AND DISSOLVED OXYGEN ON MERCURY
EFFLUX FROM PROFUNDAL LAKE SEDIMENT
FROM DEER LAKE, WASHINGTON
By
SUZANNE ELAINE COX
A thesis submitted in partial fulfillment of
the requirements for the degree of
MASTERS OF SCIENCE IN ENVIRONMENTAL ENGINEERING
WASHINGTON STATE UNIVERSITY
Department of Civil and Environmental Engineering
DECEMBER 2011
ii
To the Faculty of Washington State University:
The members of the Committee appointed to examine the
thesis of SUZANNE COX find it satisfactory and recommend that it be accepted.
_______________________________________
Marc W. Beutel, Ph.D., Chair
________________________________________
Dave Yonge, Ph.D.
________________________________________
Cara Poor, Ph.D.
iii
ACKNOWLEDGEMENTS
I would like to take this opportunity to thank everyone that participated, helped and supported
this thesis. My advisor, Dr. Marc Beutel, was fundamental in the design and implementation of
this project. His expertise and experience guided this project through many challenging hurdles
and surprising results. I appreciate all the wisdom and hands-on guidance from my experienced
colleagues: Dr. Seyoum Gebremariam and Stephen Dent. As professors and committee members,
Dr. David Yonge and Dr. Cara Poor have given me a passion for engineering and the tools and
direction to tackle my current and future projects. This thesis would not have been possible
without the generous involvement of the Deer Lake Resort employees that provided boat rentals,
cabins, and refreshing treats at the end of a long day of sampling. Thank you, Cindy, Tom and
Ed. I am indebted to my fellow colleagues in the Civil and Environmental Engineering
Department: Piper Marshall, Lanka DeSilva, Ricardi Duvil and Brandon Reed, as well as our
undergraduate assistants, who were good sports with our chaotic organization and were essential
to the lab: Caitlin Reed, Griffin Nielsen, Alicia Flatt and Jerin Tilson. I am truly honored to work
with such amazing people that gave their time and sanity to participate in my various sampling
trips and time-consuming lab work. Thank you, Washington State University, for providing this
amazing opportunity and an incredible education. Finally, I want to thank my friends and family
for their love and support through this challenging and fulfilling adventure.
Go Cougs!

iv
EFFECTS OF CHIRONOMID DENSITY AND DISSOLVED OXYGEN ON MERCURY
EFFLUX FROM PROFUNDAL LAKE SEDIMENT
IN DEER LAKE, WASHINGTON
Abstract
By Suzanne Elaine Cox, M.S.
Washington State University
December 2011
Chair: Marc W. Beutel
Macrobenthos in aquatic sediments can greatly affect the exchange of chemical
compounds at the sediment-water interface due to bioturbation and bioirrigation. This study
explored the effects of chironomid density and dissolved oxygen on methylmercury efflux from
profundal sediments from a freshwater lake. A series of sediment-water interface chamber
incubations were conducted on sediment collected from Deer Lake, WA (Zmax = 22.9 m, A = 445
ha), an oligo-mesotrophic lake near Spokane, WA. Experimental chambers were incubated under
low and high densities of chironomid larvae native to the lake sediments. The first and second
incubations varied in dissolved oxygen concentration in chamber water, which was then
monitored for total mercury and methylmercury, the toxic form of mercury that accumulates in
the aquatic food web. Our hypothesis was that an increase in chironomid density would cause an
increase in methylmercury efflux from the sediment, and a second hypothesis that a decrease in
dissolved oxygen would also cause an increase in methylmercury efflux. For the high DO
incubation (~5.0 mg/L), the flux rate for dissolved methylmercury was 0.03 ± 0.16 ng/m2/d for
ambient density chambers and 0.18 ± 0.05 ng/m2/d for high density chambers (n=4), with a
v
significant difference in dissolved methylmercury efflux. Similar results were found for the low
DO incubation (~2.5 mg/L), with a rate of dissolved methylmercury as 0.16 ± 0.06 ng/m2/d for
ambient density chambers and 0.38 ± 0.07 ng/m2/d for high density chambers, with a significant
difference in dissolved methylmercury efflux. An analysis of variance (ANOVA) was performed
comparing the two incubations that showed dissolved oxygen was a significant factor. Overall,
both hypotheses were supported. Additionally, total methylmercury, total mercury and nutrients
were analyzed to support these hypotheses. This study provides a better understanding of the
effects of macrobenthos and dissolved oxygen on mercury cycling at the sediment-water
interface of freshwater lakes that will inform the development of lake management strategies to
better manage aquatic biota uptake of mercury.
vi
TABLE OF CONTENTS
ACKNOWLEDGEMENTS....................................................................................................... iii
ABSTRACT ............................................................................................................................. iv
1. INTRODUCTION...................................................................................................................1
1.1 Background .......................................................................................................................1
1.2 Methylmercury Efflux from Sediments ................................................................................5
1.3 Bioturbation of Macrobenthos ...........................................................................................6
1.4 Project Objective and Hypothesis ......................................................................................8
2. METHODS ........................................................................................................................... 11
2.1 Study Site ......................................................................................................................... 11
2.2 Water Column Monitoring ............................................................................................... 14
2.3 Chamber Collection ......................................................................................................... 14
2.4 Field Chironomid Collection............................................................................................ 16
2.5 July Chamber Incubations ............................................................................................... 16
2.6 August Chamber Incubations ........................................................................................... 17
2.7 Methylmercury Analysis ................................................................................................... 18
2.8 Total Mercury Analysis .................................................................................................... 19
2.9 Nitrate and Ammonia Analysis ......................................................................................... 20
3. RESULTS ............................................................................................................................. 23
3.1 Water Quality in the Water Column ................................................................................. 23
3.2 Chironomid Densities ...................................................................................................... 26
3.3 July Chamber Incubations ............................................................................................... 27
3.4 August Chamber Incubations ........................................................................................... 32
vii
3.5 Ammonia and Nitrate in August Experiment Chambers .................................................... 39
4. DISCUSSION ....................................................................................................................... 42
4.1 Water Quality in the Water Column ................................................................................. 42
4.2 Mercury in Chamber Incubations..................................................................................... 44
4.3 Ammonia and Nitrate in August Chambers ...................................................................... 49
5. CONCLUSION ..................................................................................................................... 52
6. REFERENCES………………………………………………………………………………..55
viii
LIST OF TABLES
Table 3.1: Chironomid densities for incubations………………………………………………..26
Table 3.2: Summary of average concentrations for July incubation…………………………….29
Table 3.3: Summary of average concentrations for August incubation…………………………35
Table 4.1: Comparison of total methylmercury flux rates from similar studies…...……………49
ix
LIST OF FIGURES
Figure 1.1: A simplified mercury cycle……………………...…………………………………...3
Figure 1.2: Fish consumption advisories in US……………...…………………………………...4
Figure 1.3: The relationship between the two incubations…...…………………………………10
Figure 2.1: Location of Deer Lake, WA…………………...……………………………………12
Figure 2.2: Bathymetric map of Deer Lake, WA…………...…………………………………...13
Figure 2.3: Sediment-water interface chambers in incubation…...……………………………..15
Figure 3.1: Deer Lake temperature and dissolved oxygen profiles..……...…………………….24
Figure 3.2: Deer Lake total methylmercury and total mercury profiles…..…………………….25
Figure 3.3: Methylmercury concentrations for July incubation………………………...……….30
Figure 3.4: Sediment mercury flux for July incubation…………………………...…………….31
Figure 3.5: Methylmercury and total mercury concentration for August incubation…………...36
Figure 3.6: Sediment mercury flux for August incubation…………………...…………………37
Figure 3.7: Comparison of sediment mercury flux……………………………………………...38
Figure 3.8: Ammonia and nitrate concentration for August incubation………………………...40
Figure 3.9: Ammonia, nitrate and DIN flux for August incubation…………………………….41

1
1. INTRODUCTION
1.1 Background
Mercury pollution has increased over the last century as a result of industrial activities.
Although main sources are located in industrial regions, the extreme residence time of mercury
in the atmosphere results in mercury contamination in even the most remote areas. Within the
atmosphere, approximately 95% of total mercury is elemental mercury, which can oxidize to
ionic mercury in the atmosphere and deposit onto the landscape through wet and dry deposition
(Morel et al., 1997). One-third of deposited mercury is from natural sources, while two-thirds are
from anthropogenic sources. Although water covers 70% of the Earth’s surface, with 97.3% of
the world’s water held in oceans and 0.009% held in freshwater lakes, the majority of mercury is
deposited on land and lakes, rather than oceans (Mason et al., 1994; Dodds, 2002).
Anthropogenic sources include metal production, pulp industries and coal-burning power plants
(Morel et al., 1997). One study in Dorena Lake, OR, investigated that the direct source of
mercury contamination was from stream-transported sediment from the Bohemia Mining District
(Bretagne et al., 2001). Many water sources can be linked directly to local anthropogenic
sources. Coal-burning power plants in the U.S. produce around 100 thousand pounds of mercury
into the atmosphere annually (Coequyt et al., 1999). For Deer Lake, WA, 97.1% of in-state
sources of dry and wet mercury deposition were from the Centralia Coal Power Plant. In-state
sources of mercury deposition made up only 53.9% of total Washington state deposition, while
other sources included national background levels, neighboring states, and Canada and Mexico.
Additional sources of mercury deposition likely to have influenced Deer Lake, WA, include Ash
Grove cement plant located in northeastern Oregon, which made up 99.9% of in-state mercury
deposition sources, and phosphate mining in southeastern Idaho, which also made up 99.9% of
2
in-state mercury deposition sources (USEPA, 2008). Ultimately, Deer Lake, WA, had no direct
on-site sources of mercury pollution, but it was likely influenced by atmospheric deposition from
dominant mercury sources in WA, ID and OR.
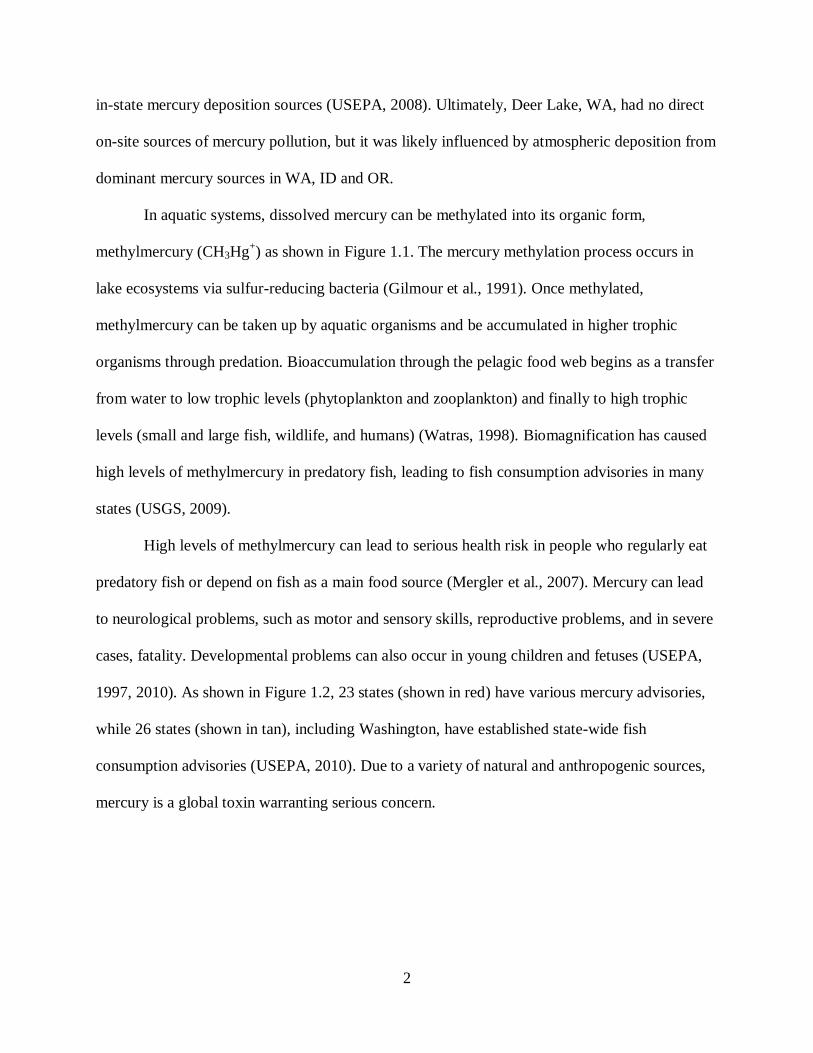
In aquatic systems, dissolved mercury can be methylated into its organic form,
methylmercury (CH3Hg+) as shown in Figure 1.1. The mercury methylation process occurs in
lake ecosystems via sulfur-reducing bacteria (Gilmour et al., 1991). Once methylated,
methylmercury can be taken up by aquatic organisms and be accumulated in higher trophic
organisms through predation. Bioaccumulation through the pelagic food web begins as a transfer
from water to low trophic levels (phytoplankton and zooplankton) and finally to high trophic
levels (small and large fish, wildlife, and humans) (Watras, 1998). Biomagnification has caused
high levels of methylmercury in predatory fish, leading to fish consumption advisories in many
states (USGS, 2009).
High levels of methylmercury can lead to serious health risk in people who regularly eat
predatory fish or depend on fish as a main food source (Mergler et al., 2007). Mercury can lead
to neurological problems, such as motor and sensory skills, reproductive problems, and in severe
cases, fatality. Developmental problems can also occur in young children and fetuses (USEPA,
1997, 2010). As shown in Figure 1.2, 23 states (shown in red) have various mercury advisories,
while 26 states (shown in tan), including Washington, have established state-wide fish
consumption advisories (USEPA, 2010). Due to a variety of natural and anthropogenic sources,
mercury is a global toxin warranting serious concern.

3
Figure 1.1: A simplified mercury cycle, as well as methylation and biomagnification process,
within aquatic systems (USGS, 2009).

4
Figure 1.2: Mercury Fish Consumption Advisories for Mercury in the United States (USEPA,
2010).
5
1.2 Methylmercury Efflux from Sediments
In sediments, methylation occurs within a sub-surface layer, where conditions are
suitable for the sustained activity of sulfur-reducing bacteria (SRB) (Benoit et al., 2006). These
conditions include the presence of ionic mercury to be methylated, the presence of organic
matter, which is an electron donor, and sulfide, which is an electron acceptor. The moderate
levels of sulfide available under anoxic conditions promote methylation through the formation of
neutrally charged sulfide-mercury complexes that diffuse easily across the polar cell membrane
and into SRB cells where it can be methylated (Morel et al., 1997). Sediments that are anaerobic
can contain high concentrations of sulfide which inhibit methylation, either through toxicity to
microbes or by repressing the bioavailability of ionic mercury for methylation through the
formation of charged sulfide-mercury complexes. Once methylated in the sediments,
methylmercury can diffuse upwards and into profundal bottom waters.
A number of mechanisms can cause an efflux of methylmercury into overlaying
profundal waters, which can then accumulate into the aquatic food web (Watras, 2009). Many of
these mechanisms are related to anoxic hypolimnetic waters, which tend to have high mercury
levels when compared to surface water or to the bottom waters of lakes with oxic hypolimnia.
Methylmercury can accumulate in the hypolimnion through the activity of SRB in anoxic
sediments or bottom waters, which methylate inorganic mercury to methylmercury. As noted
above, methylation is especially active at intermediate levels of sulfide which enhance the
bioavailability of ionic mercury for methylation. Watras (2009) explains hypolimnetic build-up
of methylmercury in sediments as four interconnected processes. First, ionic mercury attached to
settling particles can sink into the hypolimnion. Second, dissolved sulfide can strip ionic mercury
and methylmercury from settling particles. Third, SRB present in anaerobic water can methylate
6
ionic mercury into methylmercury; and fourth, with all these processes, methylmercury can
accumulate in the hypolimnion. Rather than being buried in the sediments, the mercury in the
aqueous phase is released where the ionic form, which can be methylated, combined with the
already present methylmercury can be taken up in the aquatic food web. Another potential source
of mercury to bottom waters is its release from iron and manganese oxides that dissolves from
the solid form under reduced conditions at the sediment-water interface as either ionic mercury
or methylmercury. This source is called indirect release (Benoit et al., 2009). Iron-reducing
bacteria have also been shown to facilitate the methylation of mercury, although SRB is still the
primary driving force (Kerin et al., 2006).
1.3 Bioturbation of Macrobenthos
Benthos is a term for organisms that live at or below the sediment surface in lakes, an
area called the “benthic zone”. Macrobenthos refers to larger, more visible organisms dwelling
within the benthic zone. This zone can be separated into two separate zones: littoral which is in
shallow water and is close to the shore, and profundal which is deep lake water that can be
seasonally anaerobic, which is where this study took place. The sediment-water interface has a
steep gradient of diffusion, and sediments can act as a sink for compounds diffusing from the
overlaying profundal water, such as oxygen and nitrate. In contrast, sediments can also release
compounds into overlaying water during aerobic or anaerobic conditions, such as ammonia, iron
and manganese (Dodds, 2002; Beutel, 2006). Common species of macrobenthos studied in lake
systems include oligochaetes and chironomid larvae (Biswas et al., 2009; Svensson, 1997).
Aquatic oligochaetes are long, segmented worms that burrow in sediments and consume organic
particles. Their disruption of the sediment-water interface through burrowing, called
bioturbation, can expose buried anoxic sediment as well as allow dissolved compounds to sink

7
deeper into the sediment. Aquatic oligochaetes and terrestrial earthworms are very similar in
shape and size (Dodds, 2002). Chironomids are midge larvae of aquatic insects, which are
freshwater invertebrates that spend their adolescent lives in sediment and eventually leave the
aquatic environment as adult aquatic insects. Chironomid species make up a third of all aquatic
midges (Dodds, 2002). Most chironomids are bright red, although some are green or clear. These
larvae mainly bioirrigate the sediment by drawing oxygen down through their burrows for
respiration. This exposes buried anoxic sediment to oxygen and can release ammonia into
overlaying water (Boudreau and Jorgensen, 2001). In this study, chironomid larvae were used
due to their presence in Deer Lake sediments and their ease of collection and quantification. As
oxygen decreases, the processes of respiration and the exchange of dissolved compounds at the
sediment-water interface accelerate (Katsev et al., 2007; Boudreau and Jorgensen, 2001).
Bioturbation and bioirrigation can disrupt the diffusive layer at the sediment-water interface,
allowing some dissolved compounds to rapidly be released into the overlaying water or buried
into the sediment.
Macrobenthos have long been known to enhance the flux of nitrogen compounds across
the sediment-water interface. In a study by Svensson (1997), eutrophic lake sediment bioturbated
by chironomid larvae consumed twice as much oxygen as nonbioturbated sediment. In addition
to oxygen consumption, bioturbated sediments released more ammonia to overlaying water and
exhibited higher rates of denitrification, which in turn resulted in higher release rates of nitrate.
Essentially, all of the components in the nitrogen cycle were highly affected by the variation in
chironomid larvae density in profundal sediment.
The effect of macrobenthos on mercury cycling at the sediment-water interface is a more
recently recognized phenomenon. A key paper that informed this study was Benoit et al. (2006),

8
which showed that, in marine sediments from Boston Harbor, macrobenthos burrow densities
affected methylmercury levels in sediments. Low levels of methylmercury were found at very
high and very low burrow densities. The author suggested that at low densities methylation was
inhibited by high pore-water sulfide, and at high burrow densities methylation was inhibited by
increased oxygen penetration into sediments as a result of bioirrigation. Based on a conceptual
model presented in Benoit et al. (2006), maximum concentrations of methylation should occur at
intermediate burrow densities, where the conditions that repress methylation are inhibited.
Another key paper was Benoit et al. (2009) who studied methylmercury flux rates across the
sediment-water interface through core incubations from Boston Harbor. Benoit et al. (2009)
found that burrow densities and methylmercury flux were directly correlated, which also meant
that burrow densities can be strong predictors of flux rates. Diffusive flux from the sediment was
found to be only a portion of total methylmercury flux. Although these studies were conducted in
marine systems instead of freshwater lakes, they were still informative to this study.
1.4 Project Objective and Hypothesis
The overarching objective of this research was to improve our understanding of
macrobenthos influence on mercury cycling in profundal freshwater lake sediments. This study
evaluated two hypotheses regarding mechanisms that influence the production of methylmercury
at the sediment-water interface and its efflux to overlaying profundal waters. The first hypothesis
was that an increase in the density of chironomids would cause an increase in the efflux of
methylmercury from sediments. The greater efflux would be the result of greater rates of
bioirrigation and bioturbation which would enhance the transport of methylmercury from
sediment pore-water and into overlaying water. Although this is not what was found in Benoit et
al. (2006, 2009), the Benoit et al. studies were conducted in waters with very high benthos

9
densities, which is not common in freshwater lakes. The second hypothesis was that a decrease
in dissolved oxygen, while remaining oxic (from 5 mg/L to 2.5 mg/L), would increase
methylmercury efflux to overlaying water. A conceptual framework for my experimental plan is
shown in Figure 1.3. Individually, the July incubation compared high and low chironomid
density at high DO, while the August incubation compared high and low chironomid density at
low DO. However, a comparison across incubations can compare high and low DO at high
chironomid density and high and low DO at low chironomid density. Although some studies
have been conducted on the influence of macrobenthos on methylmercury efflux from sediment
(Benoit, 2006, 2009), little research has been done in freshwater lakes. This study will include
similar methodology to other sediment-water interface chamber incubation studies, but the
variation of macrobenthos densities and DO levels in freshwater sediments is a new approach to
this field of study. Results from this study can have practical implications for lake and reservoir
management strategies aimed at impeding the uptake of toxic mercury in aquatic freshwater
biota.

10
Figure 1.3: The relationship between chironomid densities and dissolved oxygen comparisons
for the two incubations of sediment-water interface chambers.

11
2. METHODS
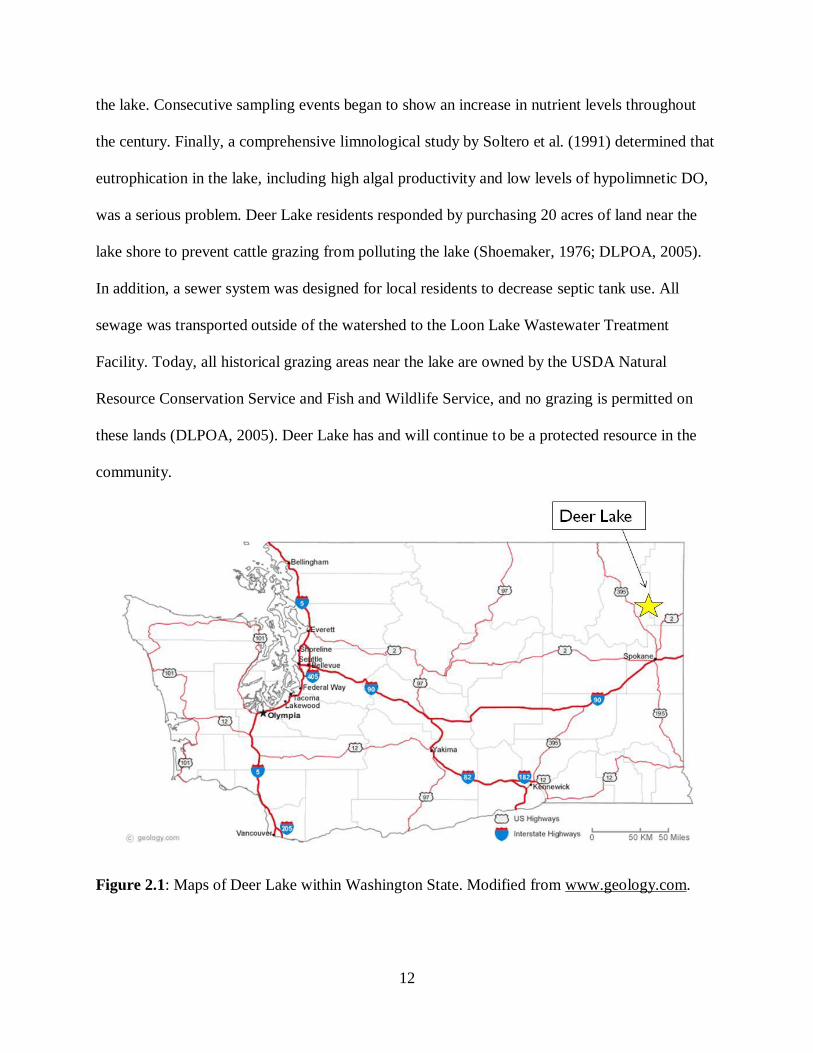
2.1 Study Site
The sediment-water interface chambers were collected from Deer Lake, a dimictic oligo-
mesotrophic lake north of Spokane in eastern Washington within Stevens County and the
Colville River Watershed (Figure 2.1). Deer Lake covers 445 ha of surface area with an average
depth of 15.9 m and a maximum depth of 22.9 m (Figure 2.2). The same sampling site was
returned to for both July and August 2011 chambers (48°07.12’N 117°35.32’W).
During the summer, Deer Lake thermally stratifies. In the fall, bottom water below 18 m
has low levels of dissolved oxygen (<2 mg/L) and accumulate compounds indicative of
anaerobic conditions at the sediment-water interface, such as phosphate and ammonia (Soltero et
al., 1991). According to the Washington State Department of Ecology (2002), Deer Lake has
low levels of mercury in littoral sediments (mean of 55 μg/kg dry weight; n = 3). In contrast,
fairly high levels of mercury were found in largemouth bass tissue (mean of 331 μg/kg wet
weight; n = 10). All of the largemouth bass exceeded the Washington Department of Health
consumption criterion of 150 μg/kg wet weight, and six of the bass exceeded the EPA Fish
Tissue Residual Criterion of 300 μg/kg wet weight. The Ecology study concluded that because
the Deer Lake bass do not exceed the EPA National Toxics Rule (825 µg/Kg wet weight), it does
not qualify for placement on the 2002 Washington State Department of Ecology 303(d) List for
Impaired Waters with respect to mercury.
Deer Lake has been monitored extensively in the last hundred years. A very early study
reported thermal stratification in July 1911, with a surface water temperature of 22 °C, a bottom
water temperature of 8.3 °C, and the presence of blue-green algae (Kemmerer et al., 1924).
Shoemaker (1976) identified faulty septic tanks as a significant source of phosphorus loading to
12
the lake. Consecutive sampling events began to show an increase in nutrient levels throughout
the century. Finally, a comprehensive limnological study by Soltero et al. (1991) determined that
eutrophication in the lake, including high algal productivity and low levels of hypolimnetic DO,
was a serious problem. Deer Lake residents responded by purchasing 20 acres of land near the
lake shore to prevent cattle grazing from polluting the lake (Shoemaker, 1976; DLPOA, 2005).
In addition, a sewer system was designed for local residents to decrease septic tank use. All
sewage was transported outside of the watershed to the Loon Lake Wastewater Treatment
Facility. Today, all historical grazing areas near the lake are owned by the USDA Natural
Resource Conservation Service and Fish and Wildlife Service, and no grazing is permitted on
these lands (DLPOA, 2005). Deer Lake has and will continue to be a protected resource in the
community.
Figure 2.1: Maps of Deer Lake within Washington State. Modified from www.geology.com.

13
Figure 2.2: Deer Lake bathymetric map with 10 m depth contour lines. Sample site for July 21st,
2011 and August 25th, 2011 shown with GPS coordinates of 48°07.12’N 117°35.32’W.

14
2.2 Water Column Monitoring
The water column was monitored for select parameters on two sampling dates: June 24th
and August 25th, 2011, which were not the same dates as chamber collections. Water samples
were collected at the sampling site (Figure 2.1) every 2 m down the water column for total
mercury and total methylmercury. Water samples were collected using a Wildco© Teflon
Kemmerer Water Sampler and stored in 125 mL glass bottles. Total mercury samples were
stored in clear glass bottles, while methylmercury samples were stored in amber glass bottles to
reduce photodegradation. Sample bottles for trace metal analyses underwent a vigorous cleaning
protocol, which included a nitric acid bath, DI rinse and acid conditioning. The field sampling
procedure followed the EPA “Clean Hands Dirty Hands” protocol: Method 1669 (USEPA,
1996). Once filled, the bottles were individually bagged, stored in coolers, and chilled with ice.
The water column was also monitored for temperature and dissolved oxygen using the Hach©
MS5 Sonde HydroLab in July and the Hach© HQ40d Portable Meter with Dissolved Oxygen
Probe and a Van Dorn water sampler in August. Samples from the field were carefully returned
to the lab. Within 24 hours of collection, samples were preserved and stored in a dark, 4 °C
refrigerator. Total mercury was preserved with 0.5% bromine monochloride and methylmercury
were preserved with 1% hydrochloric acid.
2.3 Chamber Collection
Two separate sets of eight sediment-water interface chambers were collected from the
sampling site on July 21st and August 25
th, 2011. Sediment-water interface chambers were
extracted using the Wildco© Standard (6” x 6” x 6”) Ekman Grab, and then sub-sampled into 10-
cm diameter polycarbonate chambers. Chamber collection followed methods outlined in Beutel
(2006) and Beutel et al. (2008). After sample collection, each chamber was refilled with bottom

15
water with minimal disturbance to the sediment-water interface using a peristaltic pump through
acid-washed Teflon tubing. No air head space remained in the chambers, and this decreased
turbulence in the chambers during transport. Bottom water used for refilling was collected
previously with the Wildco© Teflon Kemmerer Water Sampler and stored in polyethylene
Nalgene bottles in coolers. Each set of chambers was sealed and stored in coolers and chilled
with ice during transport to the lab. Twenty liters of remaining bottom water were also collected
and transported to the lab for later use. Once in the laboratory, chambers were stored in a dark
incubator at ambient water temperature (10 °C) and bubbled with a high-purity air mixture until
the beginning of the experiment (Figure 2.3).
Figure 2.3: Sediment-water interface chambers in incubation with bubbling air mixture.

16
2.4 Field Chironomid Collection
Sediments at the Deer Lake sampling site were collected for chironomid larvae to add to
chamber experiments to increase ambient densities and to quantify ambient densities for each of
the sampling events. Sediment was dredged using the Wildco© Standard (6” x 6” x 6”) Ekman
Grab and dispensed into the Wildco© Sieve Bucket with a 541 µm stainless steel mesh sieve and
an area of 0.0625 m2. The biota was sieved, collected by hand, and stored in multiple 4 oz. acid-
washed polyethylene bottles with previously collected bottom water. This process was repeated
until the sufficient chironomid count was achieved. The samples were chilled in coolers and
transported to the lab.
2.5 July Chamber Incubations
The first set of sediment-water interface chambers were incubated for 15 days from July
22nd
to August 5th, 2011. In the laboratory, chambers were installed in the VWR BOD Incubator
Model 2020 at 10 °C and connected to high-purity air mixture at 15 psi, using Teflon tubing and
glass aerators. The glass aerator was installed into each chamber approximately 3 cm above the
sediment for minimal disturbance to the sediment-water interface. The high-purity air mixture
included 90% nitrogen gas, 10% oxygen, and 350 ppm of carbon dioxide to maintain pH. This
air mixture yielded a dissolved oxygen concentration in chamber water of around 5.0 mg/L,
roughly half of the saturation.
On Day 0, July 22nd
, chamber water was first sampled for dissolved and total mercury to
quantify initial conditions in all eight chambers. Dissolved methylmercury samples were filtered
through an in-line PALL® AquaPrep 600 Capsule with a 0.45 µm Supor
® membrane. Mercury
samples were preserved as described earlier. Temperature and dissolved oxygen were also
measured and recorded for each chamber using the Hach© HQ40d Portable DO Probe. After
17
sampling, the chambers were refilled to a uniform water column height of 15 cm with lake
bottom water. For minimal disturbance to the sediment-water interface, the peristaltic pump was
used at a low speed through acid-washed Teflon tubing. All changes to water column levels were
recorded for mass balance calculations.
Once the sediment-water interface chambers were refilled, 20 chironomid larvae were
added gently into four of the eight chambers. Average chironomid density in “ambient
chambers” before incubation was 1090 chironomids/m2. Density in “high density” chambers
enhanced with chironomids before incubation was 3910 chironomids/m2. After the addition of
chironomid larvae to four high density chambers, all chambers were incubated for 15 days until
final sampling.
On Day 15, sampling was performed as described above for dissolved and total
methylmercury, temperature and dissolved oxygen. Chambers were then disassembled, with
sediments from four chambers sieved (two of each treatment) using a Wildco© Sieve Bucket for
final chironomid density estimates, and sediments from four chambers were frozen (two of each
treatment) for future study. Chironomid densities at the end of the incubation averaged 1550
individuals/m2 in the ambient density chambers and 2540 individuals/m
2 in the high density
chambers.
2.6 August Chamber Incubations
A second set of incubations was performed for 15 days from August 26th to September
9th, 2011, similar to methods from the July incubation but with a few significant differences. The
high purity air-mixture included 95% nitrogen gas, 5% oxygen and 350 ppm carbon dioxide.
This air mixture yielded a dissolved oxygen concentration in chamber water of around 2.5 mg/L,
which is half that of the July incubation. The Day 0 sampling method varied slightly between the

18
first and second set of incubations. For August, all chambers were carefully drained to the
sediment-water interface once in the laboratory, gently filled up with bottom water to a depth of
15 cm, and then the chironomids were added. In addition to dissolved and total methylmercury,
total mercury, ammonia and nitrate were also collected from each chamber. Total mercury was
sampled in a clear glass 125 mL bottle and preserved with 0.5% bromine monochloride.
Ammonia and nitrate were filtered and sampled through the same filter as for dissolved
methylmercury, then collected in a clean, hydrochloric acid washed 4 oz. polyethylene bottle and
chilled for later analysis. Average chironomid density in the ambient density chambers before
incubation was 860 individuals/m2 and density in the high density chambers before incubation
was 3680 individuals/m2. Final chironomid density for ambient density chambers after
incubation was 1200 individuals/m2 and density in the high density chambers after incubation
was 3170 individuals/m2.
2.7 Methylmercury Analysis
Methylmercury samples were analyzed in triplicate using the Brooks Rand MERX-M
Auto Analyzer. The analyzer has a detection limit of 0.002 ng/L. Dissolved and total
methylmercury were analyzed using distillation, aqueous ethylation, purge and trap, and CVAFS
following EPA Method 1630 (USEPA, 2001). Before analysis, 50 mL of each sample, including
method blanks, were distilled to remove acid used for preservation. Each MERX vial was filled
with 40 mL of sample and buffered with 300 µL of acetate to a pH of 4.9. Amber MERX bottles
were used to reduce photodegradation of methylmercury. For ethylation, 50 mL of sodium
tetraethylborate was added to each vial. This solution ethylated all main forms of mercury
present in the solution including elemental, ionic and organic methylmercury into a more volatile

19
form of mercury. Finally, all vials were filled with de-ionized water, capped without any air
bubbles, and inverted for homogenous mixing.
After vials were prepared, sample trays were installed onto the MERX-M Auto Analyzer
and the automated analysis was initiated. Samples were bubbled with nitrogen gas, volatizing all
ethylated forms of mercury into a gold amalgamation trap. The mercury was then purged via
thermal desorption and moved through the gas chromatographer which separated the forms of
mercury, then put the solution through a paralysis step to convert separated mercury forms into
elemental mercury. Finally, the Brooks Rand Model III cold vapor atomic fluorescence
spectrophotometer (CVAFS) detected the elemental mercury measured in peaks of concentration
using highly sensitive optical equipment. Final values, based on CVAFS results, calibrations,
sample volume, and detection limits were saved within the Mercury Guru TM
software, and
results were automatically accepted or rejected based on quality control criteria. Each run was
calibrated with standards, and quality control standards included matrix spikes (70-125%
recovery criterion), ongoing precision and recovery (77-123% recovery criterion) and DI blanks.
Under quality assurance, all samples, matrix spikes and matrix duplicates are given an 80%
recovery correction, because typically 20% of methylmercury is not captured during distillation.
2.8 Total Mercury Analysis
Total mercury samples were analyzed with the Brooks Rand MERX-T Auto Analyzer.
The auto analyzer shares some common equipment, but uses a different purge and trap apparatus.
Total mercury was analyzed using oxidation, purge and trap, and CVAFS according to EPA
Method 1631 (USEPA, 2002). Each clear MERX vial was filled with 25 mL of sample and 100
µL of hydroxylamine hydrochloride was added to remove any remaining bromine monochloride
used for preservation. Vials for calibration, matrix spikes and ongoing precision and recovery

20
were filled with varying amounts of mercury standards. Finally, 100 µL of stannous chloride was
added to oxidize all forms of mercury to elemental mercury. All vials were then capped and
inverted for homogenous mixing.
Once vials were prepared, the trays were installed into the MERX-T Auto Analyzer.
Samples were purged with nitrogen gas that volatized elemental mercury onto a gold
amalgamation trap. The mercury was then thermally desorbed and measured with a Model III
CVAFS detector. Final results were saved in the Mercury GuruTM
software, which automatically
accepted or rejected results based on quality control.
2.9 Nitrate and Ammonia Analysis
Nitrate and ammonia samples from the August incubation were analyzed by staff in the
Natural Resources Science Department under the supervision of Dr. Barry Moore. Analyses were
performed on a SEAL AutoAnalyzer 3 with a high resolution Digital Colorimeter using standard
colorimetric methods. Nitrate was technically measured as nitrate plus nitrite, but nitrite was
presumed to be low and assumed negligible.
2.10 Flux Estimates and Statistical Analysis
Flux rates for measured mercury species were calculated for each set of sediment-water
interface chambers. This rate represents the change in mercury in chamber water with respect to
surface area and time of incubation. The equation for mercury flux is as follows:
Where, flux is in ng/m2/d, area is in m
2, time is in days, Ct is concentration at time “t” in ng/L,
and Vt is volume at time “t” in m3.
21
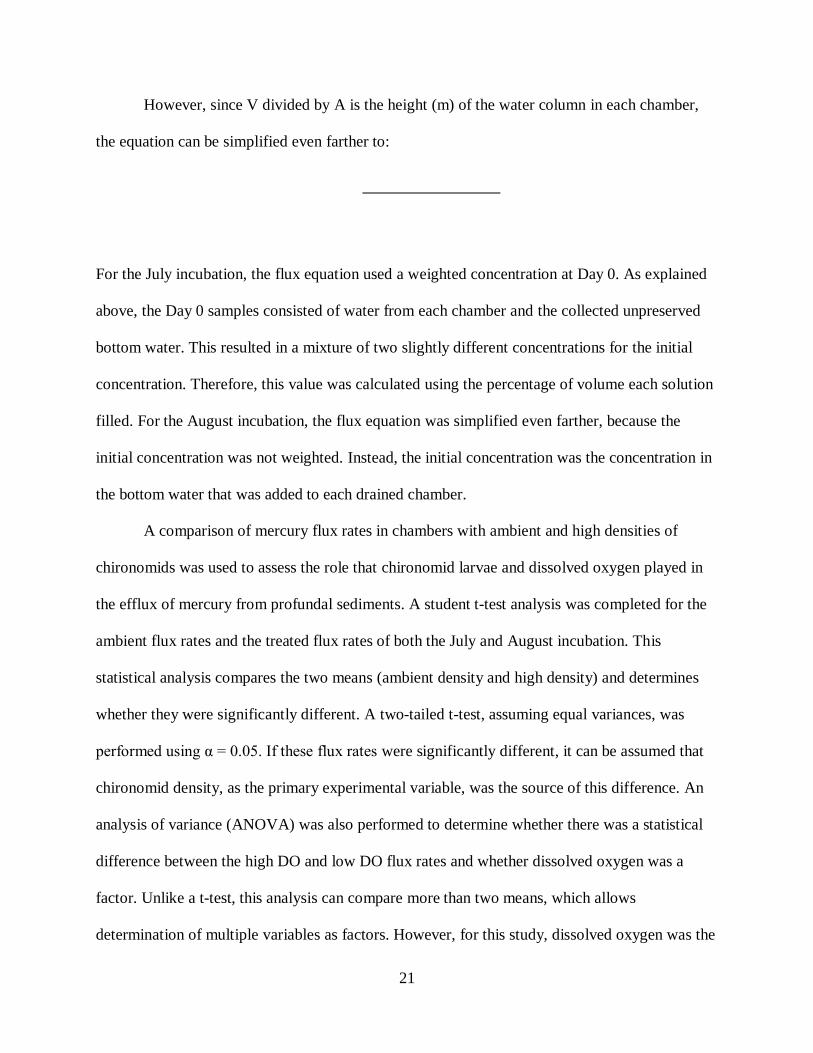
However, since V divided by A is the height (m) of the water column in each chamber,
the equation can be simplified even farther to:
For the July incubation, the flux equation used a weighted concentration at Day 0. As explained
above, the Day 0 samples consisted of water from each chamber and the collected unpreserved
bottom water. This resulted in a mixture of two slightly different concentrations for the initial
concentration. Therefore, this value was calculated using the percentage of volume each solution
filled. For the August incubation, the flux equation was simplified even farther, because the
initial concentration was not weighted. Instead, the initial concentration was the concentration in
the bottom water that was added to each drained chamber.
A comparison of mercury flux rates in chambers with ambient and high densities of
chironomids was used to assess the role that chironomid larvae and dissolved oxygen played in
the efflux of mercury from profundal sediments. A student t-test analysis was completed for the
ambient flux rates and the treated flux rates of both the July and August incubation. This
statistical analysis compares the two means (ambient density and high density) and determines
whether they were significantly different. A two-tailed t-test, assuming equal variances, was
performed using α = 0.05. If these flux rates were significantly different, it can be assumed that
chironomid density, as the primary experimental variable, was the source of this difference. An
analysis of variance (ANOVA) was also performed to determine whether there was a statistical
difference between the high DO and low DO flux rates and whether dissolved oxygen was a
factor. Unlike a t-test, this analysis can compare more than two means, which allows
determination of multiple variables as factors. However, for this study, dissolved oxygen was the

22
only factor analyzed. If this data was significantly different, then dissolved oxygen also played a
role in methylmercury efflux from the sediment to the overlaying profundal water.

23
3. RESULTS
3.1 Water Quality in the Water Column
The temperature and DO profiles collected on June 24th and August 25
th, 2011, are shown
in Figure 3.1. For temperature in June, the surface water was 18 °C and the bottom water was 7.0
°C, with a thermocline at approximately 6 m. In August, the surface and deep water were 22 °C
and 9 °C, respectively, and the thermocline was at 10 m. From June to August, the lake water
increased in temperature and the thermocline descended. The DO in the surface water was
approximately 9 mg/L in June and 8 mg/L in August. The DO in bottom waters showed a
marked decline, from around 8 mg/L in June to 4 mg/L in August. The rate of hypolimnetic
oxygen consumption was about 0.06 mg/L/d.
Methylmercury and total mercury profiles collected on June 17th and August 25
th, 2011,
are shown in Figure 3.2. In June, surface methylmercury concentration was extremely low at <
0.01 ng/L, but increased to 0.04 ng/L at 2 m and continued to decrease down the water column to
0.02 ng/L at 19 m. In August, the greatest concentrations of methylmercury were in the lower
epilimnion. Surface and bottom water concentrations were 0.01 ng/L. Between the surface and
bottom water of Deer Lake, the methylmercury concentration was 0.002-0.005 ng/L, but at
approximately 6 m, the methylmercury concentration was 0.04 ng/L, a full magnitude greater.
This profile suggests that methylmercury decreased substantially between June and August. In
June, total mercury concentrations were somewhat consistent down the water column between
0.6-0.8 ng/L. In August, total mercury ranged from 0.4 ng/L in the surface water and 0.85 ng/L
in the bottom water.

24
Figure 3.1: The temperature and dissolved oxygen profiles for the Deer Lake water column from
two different sampling events (June 24th
, 2011 and August 25th, 2011).
0
5
10
15
20
25
0 5 10 15 20 25
Dep
th (m
)
Temperature (deg C)
6/24/2011 8/25/2011
0
5
10
15
20
25
0 2 4 6 8 10
Dep
th (
m)
Dissolved Oxygen (mg/L)
6/24/2011 8/25/2011

25
Figure 3.2: The total methylmercury and total mercury profiles for the Deer Lake water column
from two different sampling events (June 17th, 2011 and August 25
th, 2011).
0
5
10
15
20
25
0 0.02 0.04 0.06
Dep
th (m
)
MeHg (ng/L)
6/17/2011
8/25/2011
0
5
10
15
20
25
0 1 2 3 4
Dep
th (m
)
THg (ng/L)
6/17/2011
8/25/2011

26
3.2 Chironomid Densities
Chironomid larvae densities were measured by collection of sediment on July 21st and
August 25th, 2011. Chironomids were sampled on the same dates as sediment-water interface
chamber collection. The densities were used to calculate approximate ambient densities in the
chambers before incubation. Densities in the high density chambers were calculated as ambient
densities with the addition of 20 chironomid larvae per chamber. After incubation, two chambers
of each treatment were sieved and counted for post-incubation densities. These values are listed
in Table 3.1. During both experimental incubations, chironomid densities appeared to increase
somewhat in ambient chambers and decrease in high density chambers. The increase in ambient
density chambers is likely due to reproduction of chironomid larvae during incubation, while the
decrease in high density chamber could be due to overpopulation or variation in initial densities
due to location of chamber collection.
Table 3.1: The chironomid densities (individuals/m2) from field (pre-incubation) collections and
post-incubation sediment samples for both ambient density and high density chambers.
7/21/2011 8/25/2011
Ambient density chambers as
measured in profundal sediments
1,085 861
Ambient density chambers at end of
15 day incubation in two chambers
1,975
1,129
1,270
1,129
High density chambers after addition
of 20 chironomids per chamber
3,907 3,683
High density chambers at end of 15
day incubation in two chambers
2,398
2,963
2,257
4,091

27
3.3 July Chamber Incubations
For July chamber incubations, chambers were organized into two treatments: ambient
density chambers and high density chambers to which additional chironomid larvae were added.
The DO in the chamber water was maintained at around 5.0 mg/L using a high-purity air
mixture. Chambers were monitored at Day 0 and Day 15 for dissolved and total methylmercury,
with results shown in Table 3.2. These concentrations with standard deviations are graphed in
Figure 3.3. For dissolved methylmercury concentration, ambient density chambers varied
between an increase or decrease in flux during the incubation, while high density chambers
showed a consistent increase for all four chambers. For total methylmercury concentration,
ambient density chambers, again, exhibited an increase or decrease during the incubation,
although the decrease was small; high density chambers show a consistent increase. Overall,
high density chambers released more methylmercury than ambient density chambers during the
July incubation of 15 days. Although some chambers showed a decrease in methylmercury
concentration, on average the change in concentration was positive. Dissolved methylmercury
made up approximately 25% of the total methylmercury in both ambient density and high density
chamber water.
Using concentration data, average methylmercury flux rates were calculated and
compared for ambient density and high density chambers. The average dissolved ad total
methylmercury flux rates with standard deviations are shown in Figure 3.4. The dissolved
methylmercury flux was 0.03 ± 0.16 ng/m2/d (average plus/minus standard deviation, n=4 for all
values) for ambient density chambers and 0.18 ± 0.05 ng/m2/d for high density chambers. The
total methylmercury flux for ambient chambers was 0.07 ± 0.32 ng/m2/d and for high density
chambers was 0.33 ± 0.19 ng/m2/d. This comparison shows that treated chambers generate a
greater amount of dissolved and total methylmercury efflux in the overlaying profundal water.

28
For dissolved methylmercury, the two-tailed two-sample t-test with equal variance provided a p-
value of 0.08, but the one-tailed t-test provided a p-value of 0.04, suggesting that concentrations
in the ambient density and high density sets of chambers are significantly different. The two-
tailed t-test produced a p-value of 0.32 for total methylmercury, which means that the
concentrations in the ambient density and high density sets of chambers not determined to be
significantly different. The treatment of increasing chironomid density to ambient chambers was
significantly different for dissolved methylmercury, but not total methylmercury, during the July
incubation.

29
Table 3.2: The summary of the average concentrations of ambient density and high density
chambers, including standard deviations, for dissolved and total methylmercury sampled in
triplicate for the July incubation.
*Asterisk indicates that standard deviation was simplified to original concentration only. This was
done to avoid complex calculations of the standard deviation for a weighted average Day 0 initial
concentration. Values are average ± standard deviation of triplicate analyses. Where no standard
deviation is listed, analyses were performed in duplicate. Initial ambient density was 1,085
chironomids/m2 and high density was 3,907 chironomids/m
2.
Dissolved
MeHg
Total
MeHg
(ng/L) (ng/L)
INITIAL (DAY 0)
Ambient Density
Ambient 1 0.0175 ± 0.004* 0.1670
Ambient 2 0.0218 ± 0.007* 0.1587 ± 0.012*
Ambient 3 0.0267 ± 0.006* 0.1016 ± 0.011*
Ambient 4 0.0322 ± 0.002* 0.0322 ± 0.002*
High Density
High 1 0.0055 ± 0.003* 0.0055
High 2 0.0098 ± 0.005* 0.0098 ± 0.005*
High 3 0.0397 ± 0.005* 0.0397 ± 0.005*
High 4 0.0261 ± 0.002* 0.0261 ± 0.002*
FINAL (DAY 15)
Ambient Density
Ambient 1 0.1385 ± 0.006 0.0361
Ambient 2 0.1027 ± 0.005 0.0338 ± 0.007
Ambient 3 0.0626 ± 0.004 0.0138 ± 0.003
Ambient 4 0.0727 ± 0.002 0.0162 ± 0.002
High Density
High 1 0.1450 ± 0.001 0.0354
High 2 0.1223 ± 0.013 0.0293 ± 0.007
High 3 0.1011 ± 0.006 0.0450 ± 0.008
High 4 0.1230 ± 0.005 0.0398

30
Figure 3.3: Dissolved and total methylmercury concentration at the beginning and end of the
incubation for the July chambers. Error bars are one standard deviation of triplicate analyses.
0.000
0.010
0.020
0.030
0.040
0.050
0.060
Ambient Ambient Ambient Ambient High High High HighDis
solv
ed
MeH
g C
on
cen
tra
tio
n (
ng
/L)
Day 0 Day 15
0.00
0.02
0.04
0.06
0.08
0.10
0.12
0.14
0.16
Ambient 1 Ambient 2 Ambient 3 Ambient 4 High 1 High 2 High 3 High 4
To
tal M
eH
g C
on
cen
tra
tio
n (
ng
/L)
Day 0 Day 15

31
Figure 3.4: Sediment mercury flux under ambient density (1,085 chironomids/m2) and high
density (3,907 chironomids/m2). Dissolved oxygen in overlaying water was maintained at 5.0
mg/L during the July incubation. Levels of statistical significance (p value for two-tailed two-
sample t-test with equal variances) for dissolved methylmercury and total methylmercury were
0.32 and 0.08, respectively. Error bars represent one standard deviation for four replicates.
0.00
0.05
0.10
0.15
0.20
0.25
Ambient Density High Density
Dis
solv
ed
MeH
g F
lux
(n
g/m
2/d
)
0.00
0.10
0.20
0.30
0.40
Ambient Density High Density
To
tal M
eH
g F
lux
(n
g/m
2/d
)
32
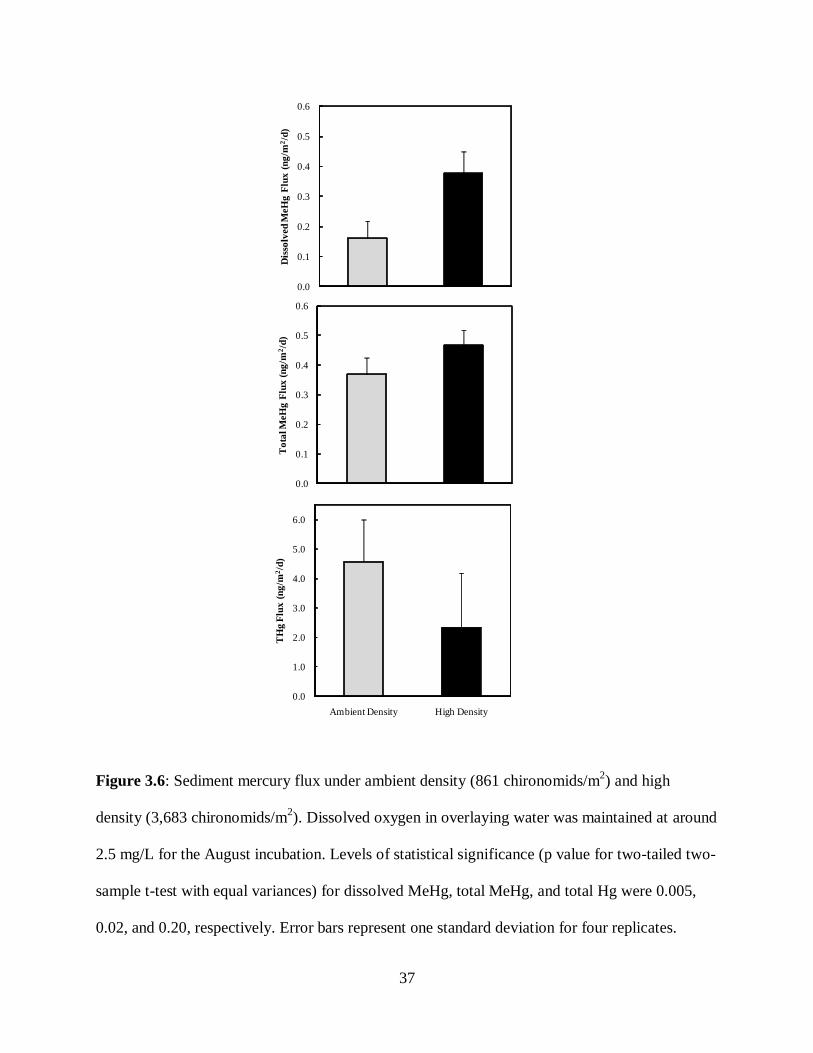
3.4 August Chamber Incubations
For the August chamber incubation, chambers were organized into two treatments:
ambient density chambers and high density chambers to which additional chironomid larvae
were added. The DO in the chamber water was maintained at approximately 2.5 mg/L using a
high-purity air mixture. Samples were collected at Day 0 and Day 15 for dissolved and total
methylmercury and total mercury. Results for Day 15 are shown in Table 3.3. Initial
concentrations are not shown, because August incubation involved a homogenized sample of
water collected from the hypolimnion as the initial concentration for all chambers. Due to the
variation in procedure, the Day 0 concentration was uniform for all chambers; therefore, an
individualized Day 0 concentration was not applicable. These concentrations with standard
deviations are shown in Figure 3.5. Relative to ambient density chambers, high density chambers
had greater concentrations of total and dissolved methylmercury in overlaying water. In contrast,
total mercury concentration in ambient density chambers was lower than in high density
chambers. Dissolved methylmercury was approximately 86% of total methylmercury, and total
methylmercury was approximately 2.5% of total mercury in both ambient density and high
density chambers.
Using concentration data, average methylmercury flux rates were calculated and
compared for ambient density and high density chambers. The average dissolved methylmercury,
total methylmercury and total mercury flux rates with standard deviations are shown in Figure
3.4. The dissolved methylmercury flux was 0.16 ± 0.06 ng/m2/d (average plus/minus standard
deviation, n=4) for ambient density chambers and 0.38 ± 0.07 ng/m2/d for high density
chambers. The total methylmercury flux for ambient density chambers was 0.37 ± 0.06 ng/m2/d

33
and for high density chambers was 0.47 ± 0.05 ng/m2/d. The total mercury flux for ambient
density chambers was 4.5 ± 1.42 ng/m2/d and for high density chambers is 2.3 ± 1.86 ng/m
2/d.
Dissolved and total methylmercury flux rates showed an increase from ambient density to
high density chambers, which supports the hypothesis that increased chironomid density would
yield an increase in methylmercury efflux. Dissolved methylmercury flux rates increased more
than total methylmercury flux rates. A two-tailed two-sample t-test with equal variance was
completed for dissolved and total methylmercury. The p-value was 0.005 for dissolved
methylmercury and 0.02 for total methylmercury, which means that concentrations in high
density and ambient density chambers were significantly different. A decrease in the flux rates
with an increase in chironomid density was found for total mercury. A two-tailed two-sample t-
test with unequal variance was performed for total mercury, due to the removal of high density
chamber 4 as an outlier. Even with the outlier removed, the p-value was 0.20; therefore, the
treatment of increased chironomid density to the ambient density chambers was not significant
for total mercury.
Finally, the two sets of July and August incubations were compared to evaluate trends
with respect to dissolved oxygen. The comparison of flux rates for ambient density and high
density chambers at high oxygen conditions (July; 5.0 mg/L DO) and low oxygen conditions
(August; 2.5 mg/L DO) for dissolved and total methylmercury are shown in Figure 3.7. Total
mercury is not shown, because flux rates were not evaluated in the July chambers. The data show
that high density chambers had higher levels of efflux for total and dissolved methylmercury
than ambient chambers. In addition, as dissolved oxygen concentration decreased, simulating a
decreasing oxic hypolimnion, total and dissolved methylmercury efflux increased. A single
factor ANOVA was performed to determine whether dissolved oxygen was a factor in

34
methylmercury efflux. For dissolved and total methylmercury, the p-value was < 0.001, thus
dissolved oxygen was a significant factor in methylmercury efflux in ambient density and high
density chambers.

35
Table 3.3: The summary of the average concentrations at the end of the incubation of ambient
density and high density chambers, including standard deviations, for dissolved and total
methylmercury and total mercury sampled in triplicate for the August incubation.
Dissolved MeHg Total MeHg Total Hg
Chamber (ng/L) (ng/L) (ng/L)
Ambient Density
Ambient 1 0.0442 ± 0.008 0.0547 ± 0.013 2.0600 ± 0.0436
Ambient 2 0.0360 ± 0.005 0.0437 ± 0.009 2.3433 ± 0.1950
Ambient 3 0.0332 ± 0.011 0.0531 ± 0.016 2.3467 ± 0.3092
Ambient 4 0.0309 ± 0.005 0.0447 ± 0.006 2.3433 ± 0.4010
High Density
High 1 0.0660 ± 0.008 0.0602 ± 0.010 1.8133 ± 0.1665
High 2 0.0556 ± 0.005 0.0595 ± 0.021 1.9867 ± 0.1756
High 3 0.0492 ± 0.001 0.0640 ± 0.010 2.2000 ± 0.1652
High 4 0.0603 ± 0.011 0.0522 ± 0.015 2.1967 ± 0.1815
Values are average ± standard deviation of triplicate analyses. Where no standard deviation is
listed, analyses were performed in duplicate. Initial ambient density was 861 chironomids/m2 and
high density was 3683 chironomids/m2.

36
Figure 3.5: Total and dissolved methylmercury and total mercury concentration at the end of the
incubation for the August chambers. Error bars are one standard deviation of triplicate analysis.
0.00
0.01
0.02
0.03
0.04
0.05
0.06
0.07
0.08
0.09
Ambient 1 Ambient 2 Ambient 3 Ambient 4 High 1 High 2 High 3 High 4
Dis
solv
ed
MeH
g C
on
cen
tra
tio
n (
ng
/L)
0.00
0.01
0.02
0.03
0.04
0.05
0.06
0.07
0.08
0.09
Ambient 1 Ambient 2 Ambient 3 Ambient 4 High 1 High 2 High 3 High 4
To
tal M
eH
g C
on
cen
tra
tio
n (
ng
/L)
0.00
0.50
1.00
1.50
2.00
2.50
3.00
Ambient 1 Ambient 2 Ambient 3 Ambient 4 High 1 High 2 High 3 High 4
TH
g C
on
cen
tra
tio
n (
ng
/L)
37
Figure 3.6: Sediment mercury flux under ambient density (861 chironomids/m2) and high
density (3,683 chironomids/m2). Dissolved oxygen in overlaying water was maintained at around
2.5 mg/L for the August incubation. Levels of statistical significance (p value for two-tailed two-
sample t-test with equal variances) for dissolved MeHg, total MeHg, and total Hg were 0.005,
0.02, and 0.20, respectively. Error bars represent one standard deviation for four replicates.
0.0
0.1
0.2
0.3
0.4
0.5
0.6
Ambient Density High Density
Dis
solv
ed
MeH
g F
lux
(n
g/m
2/d
)
0.0
0.1
0.2
0.3
0.4
0.5
0.6
Ambient Density High Density
To
tal M
eH
g F
lux
(n
g/m
2/d
)
0.0
1.0
2.0
3.0
4.0
5.0
6.0
Ambient Density High Density
TH
g F
lux
(n
g/m
2/d
)

38
Figure 3.7: Comparison of dissolved and total methylmercury fluxes for ambient and treated
sediment-water interface chamber at high oxic conditions (5.0 mg/L DO) for the July incubation
and low oxic conditions (2.5 mg/l DO) for the August incubation. Chironomid larvae densities
and statistical significance are the same as noted in Figures 3.4 and 3.6.
0.00
0.10
0.20
0.30
0.40
0.50
0.60
Ambient Density High Density
Dis
solv
ed
MeH
g F
lux
(n
g/m
2/d
)
High DO
Low DO
0.00
0.10
0.20
0.30
0.40
0.50
0.60
Ambient Density High Density
To
tal M
eH
g F
lux
(n
g/m
2/d
)
High DO
Low DO
39
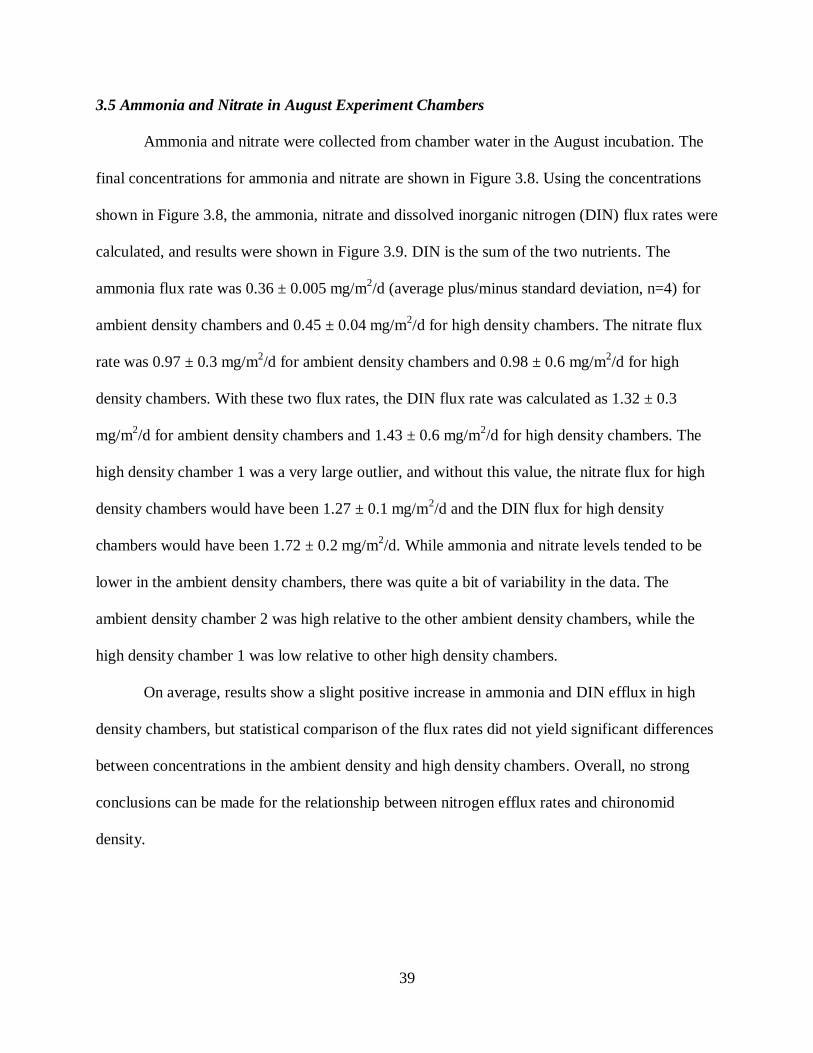
3.5 Ammonia and Nitrate in August Experiment Chambers
Ammonia and nitrate were collected from chamber water in the August incubation. The
final concentrations for ammonia and nitrate are shown in Figure 3.8. Using the concentrations
shown in Figure 3.8, the ammonia, nitrate and dissolved inorganic nitrogen (DIN) flux rates were
calculated, and results were shown in Figure 3.9. DIN is the sum of the two nutrients. The
ammonia flux rate was 0.36 ± 0.005 mg/m2/d (average plus/minus standard deviation, n=4) for
ambient density chambers and 0.45 ± 0.04 mg/m2/d for high density chambers. The nitrate flux
rate was 0.97 ± 0.3 mg/m2/d for ambient density chambers and 0.98 ± 0.6 mg/m
2/d for high
density chambers. With these two flux rates, the DIN flux rate was calculated as 1.32 ± 0.3
mg/m2/d for ambient density chambers and 1.43 ± 0.6 mg/m
2/d for high density chambers. The
high density chamber 1 was a very large outlier, and without this value, the nitrate flux for high
density chambers would have been 1.27 ± 0.1 mg/m2/d and the DIN flux for high density
chambers would have been 1.72 ± 0.2 mg/m2/d. While ammonia and nitrate levels tended to be
lower in the ambient density chambers, there was quite a bit of variability in the data. The
ambient density chamber 2 was high relative to the other ambient density chambers, while the
high density chamber 1 was low relative to other high density chambers.
On average, results show a slight positive increase in ammonia and DIN efflux in high
density chambers, but statistical comparison of the flux rates did not yield significant differences
between concentrations in the ambient density and high density chambers. Overall, no strong
conclusions can be made for the relationship between nitrogen efflux rates and chironomid
density.

40
Figure 3.8: The final concentration of ammonia and nitrate at the end of the incubation for
August chambers. No errors bars are shown, because samples were analyzed in duplicate.
0
0.01
0.02
0.03
0.04
0.05
0.06
0.07
0.08
0.09
Ambient 1 Ambient 2 Ambient 3 Ambient 4 High 1 High 2 High 3 High 4
Am
mo
nia
Co
ncen
tra
tio
n (m
g/L
)
0
0.02
0.04
0.06
0.08
0.1
0.12
0.14
0.16
0.18
0.2
Ambient 1 Ambient 2 Ambient 3 Ambient 4 High 1 High 2 High 3 High 4
Nit
rate
/Nit
rite
Co
ncen
tra
tio
n (m
g/L
)

41
Figure 3.9: Ammonia, nitrate and dissolved inorganic nitrogen (ammonia plus nitrate) flux under
ambient density (861 chironomids/m2) and high density (3,683 chironomids/m
2). Error bars
represent one standard deviation for four replicates.
0.0
0.1
0.2
0.3
0.4
0.5
0.6
Ambient Density High Density
Am
mo
nia
Flu
x (m
g/m
2/d
)
0.0
0.5
1.0
1.5
2.0
Ambient Density High Density
Nit
rate
/Nit
rite
Flu
x (
mg/m
2/d
)
0.0
0.5
1.0
1.5
2.0
2.5
Ambient Density Treated Density
DIN
Flu
x (
mg/m
2/d
)

42
4. DISCUSSION
4.1 Water Quality in the Water Column
Temperature and dissolved oxygen levels revealed thermal stratification and low DO
levels in bottom water. Overall, summertime temperature and dissolved oxygen decreased with
depth. Surface water temperatures were 20 °C and hypolimnetic water temperatures were 9 °C.
Surface water temperature increased at a rate of approximately 0.083 °C/day and hypolimnetic
water temperature increased at a rate of approximately 0.05 °C/day. Thermal stratification was
seen for both monitoring events, and decreased from 6 m in June to 10 m in August. Similar
results were found at Deer Lake by Beutel et al. (2008) with surface water temperature at around
14 °C and hypolimnetic water temperature at 7 °C, with a thermocline at approximately 14 m.
Temperatures from Beutel et al. (2008) were lower than this study, because field observations
were conducted in October, when air temperatures were cooler. According to The Weather
Channel© (2011), average monthly temperatures near Spokane, WA, are 16.7 °C for June, 20.8
°C for August, and 8.6 °C for October. Warmer water temperatures during summer months can
lower the thermocline in lake systems, until fall turnover (Dodds, 2002). The DO levels
decreased down the water column for both the June and August monitoring events. From June to
August, the deepest portions of the lake decreased from 8 mg/L DO to 4 mg/L DO. In August,
the DO levels decreased more severely in the hypolimnion, this is due to rapid loss of DO below
the thermocline during summer stratification. Since it was not the focus of this study, we did not
measure parameters typically used to estimate the trophic status of lakes, such as transparency
and nutrients of algal biomass. However, the observed decline in DO can be used to evaluate
trophic status using the metric areal hypolimnetic oxygen deficit (AHOD) (Cornett and Ringler,
1980). The AHOD is a model utilizing the hypolimnetic oxygen levels and the area of the

43
hypolimnion to determine lake trophic status. This term is in the units of mg of oxygen/m2/day
and is calculated as the rate of oxygen mass consumption in the hypolimnion divided by the area
of the hypolimnion and time lapsed. For Deer Lake, the hypolimnion was approximately 5500
m3 and the area of the hypolimnion was 390 m
2. From the model, it was found that AHOD
values were directly related to trophic levels in lakes with a maximum depth of 20 to 75 m. The
AHOD value for Deer Lake of 0.6 g/m2/d correlated to a mesotrophic trophic status (Borowiak et
al., 2010).
Total mercury and total methylmercury ranged from 0.5-2.0 ng/L and 0.01-0.04 ng/L,
respectively. These levels are comparable with other pristine lakes. In a study of freshwater lakes
and reservoirs, Watras (2009) reported that remote, unpolluted lakes ranged from 0.2-7.2 ng/L
for total mercury and 0.01-2.2 ng/L for total methylmercury. Total mercury and total
methylmercury concentrations tended to be higher in the anoxic hypolimnia than in surface
waters, because hypolimnetic enrichment does not occur in oxic hypolimnia (Watras, 2009). The
lack of mercury accumulation in the hypolimnion identifies Deer Lake as an unpolluted lake with
an oxic hypolimnia. Total mercury in the water column showed no obvious trends over time, but
methylmercury decreased in the water column from June to August. During spring and early
summer, heavy rains or warm weather can bring snowmelt and runoff into lakes and can bring a
high loading of mercury. The most common source of mercury to remote lakes is atmospheric
deposition, in either direct deposition or surface runoff (Watras, 2009), including Deer Lake.
This would be a possible explanation for the high methylmercury levels seen in June before
decreasing in August.
44
4.2 Mercury in Chamber Incubations
Flux rates increased from ambient density to high density chambers in the July and
August incubation. In July, when DO in the overlaying water was maintained at about 5.0 mg/L,
dissolved and total methylmercury flux rates averaged 0.03 and 0.07 ng/m2/d for the ambient
density chambers and increased roughly six-fold for dissolved methylmercury and five-fold for
total methylmercury in the high density chambers. A similar pattern was seen in August,
dissolved and total methylmercury flux rates averaged approximately 0.16 and 0.37 ng/m2/d for
the ambient density chambers, respectively, and flux rates less than doubled in the high density
chambers for both flux rates. Also, the ambient density chamber flux rates were an order of
magnitude higher at the lower DO level. A student t-test revealed in July a p-value of
approximately 0.05 for dissolved methylmercury and p-value > 0.05 for total methylmercury.
Therefore, the chironomid density in the chambers significantly affected dissolved
methylmercury efflux in July. For the August incubation, the p-values for both dissolved and
total methylmercury were < 0.05; consequently, the chironomid density in the chambers
significantly affects dissolved and total methylmercury efflux from the sediment. Ultimately, the
single-factor ANOVA comparing both incubations revealed a p-value < 0.001, thus DO was a
significant factor for both dissolved and total methylmercury in the July and August incubations.
Therefore, these results supported our hypothesis that methylmercury efflux would increase as
chironomid density increased in sediments and DO decreased in overlaying water.
An interesting result in the August incubation was, unlike methylmercury, total mercury
efflux decreased by about half in high density chambers from ambient density chambers. Total
mercury was found to have no significant difference with a p-value > 0.05. An ANOVA was not
performed for total mercury, since there were no samples collected from the July chambers. This

45
suggests that different mechanisms affect ionic mercury efflux from sediments than
methylmercury efflux. The increase in chironomid density could have inhibited the accumulation
of ionic mercury in the sediment and overlaying water. A large fraction of inorganic mercury in
lake waters is bound to organic particulate matter (Meili, 1997). Moreover, Morel et al. (1995)
found that a large portion of ionic mercury was related to organic particles in experimental
incubation studies. The increased bioirrigation in the high density chambers could have filtered
out or removed these organic particles with attached ionic mercury. Additionally, Watras (2009)
determined that concentrations of total mercury in aerobic sediments of pristine lakes was
dramatically less than in anaerobic sediments in contaminated lakes by orders of magnitude.
Because of the short residence time of mercury in freshwater and the rapid settling of ionic
mercury attached to particles, mercury is usually buried and remains below the sediment surface,
with minimal resuspension. In this study, bioirrigation could have resulted in a more oxidized
surface layer, encouraging deeper burial of total mercury within the sediment. Oxidized surface
layers can also have lower levels of sulfide, which inhibit mercury mobilization (Benoit et al.,
2006).
An important operational difference between the July and August incubations was how
the initial mercury concentration at Day 0 was collected. In July, a weighted initial concentration
was made up of the original water in the chamber and lake water added back to the chamber after
initial sampling. The original chamber water and the refilled bottom water were both measured
for mercury and then weighted based on percentage of volume occupied within the chamber.
Due to the complexity, the standard deviation for the weighted initial concentration on Day 0
was simplified to the original chamber water only. This was done because, ideally, the refilled
bottom water would have similar values to the original column water, since they were sampled at
46
the same time from the same location. The average initial concentrations and standard deviations
from each chamber varied significantly. This showed that the dynamic lake system can cause
considerable variation within a small portion of the lake sediment. Similar results were shown in
Benoit et al. (2006, 2009) when sediment-water chambers from four sampling sites in Boston
Harbor had chironomid densities ranging from 1,937 to 105,526 individuals/m2. Variation in
ambient chironomid densities from Deer Lake chambers could explain initial concentration
differences. This complication was rectified in the August incubation, where homogenous
mixing was used for uniform initial concentration in water for each chamber. In retrospect, the
August method was preferable because of its ease of implementation and related calculations.
Limited studies have evaluated the effect of macrobenthos on methylmercury efflux from
profundal sediments. Benoit (2006) studied the interaction between infaunal burrow densities
and total methylmercury accumulation in marine sediments. Four sediment cores were extracted
varying in low to high macrobenthos burrow densities, as mentioned earlier. The study had two
key conclusions. First, burrow density is positively correlated with the depth of maximum
methylmercury concentration. Our study could not determine the depth of maximum
methylmercury burial, because we were limited to extracting only overlaying profundal water for
analysis. The second conclusion was that maximum methylmercury levels in sediments were
found at intermediate burrow densities (around 30,000 individuals/m2). This is because at low
burrow densities (about 2,000 individuals/m2), there was an accumulation of sulfide, which
inhibited the methylation of mercury, and at high burrow densities (around 100,000
individuals/m2), the sediment became an oxidized layer, which also inhibits the methylation of
mercury. Similar results were found in our study. The ambient chambers in our experiment were
considered to have low burrow densities at approximately 1,000 individuals/m2, while the high

47
density chambers, at approximately 4,000 individuals/m2, were comparable to intermediate
burrow density in the Boston Harbor context. Just as Boston Harbor sediments contained more
methylmercury when burrow densities increased from low to intermediate, methylmercury efflux
from Deer Lake sediments increased as chironomid density went from low to intermediate.
Benoit et al. (2009) conducted a second study in Boston Harbor sediments, investigating
methylmercury efflux and how it relates to burrow densities. It was found that burrow densities
are a strong predictor of methylmercury efflux from sediment. Studies similar to this study are
compared in Figure 4.1. Benoit et al. (2009) found that total methylmercury flux rates ranged
from -0.9 to 41 ng/m2/d. Other studies reported methylmercury flux rates as low as -356 ng/m
2/d
in Lava Bay (Gill et al., 1999) and as high as 2544 ng/m2/d in the Gulf of Trieste, Italy (Covelli
et al., 1999). An additional study by Hammerschmidt and Fitzgerald (2008) investigated
methylmercury efflux from profundal sediment using shipboard benthic flux chambers.
Methylmercury efflux ranged from 15 to 19 n (Kuwabara 2002)g/m2/d in the summer. Although
the results from this study were similar, these studies were conducted in marine aquatic
environments. In saltwater, higher amounts of ionic mercury can be reduced to elemental
mercury and volatized into the atmosphere, causing very little mercury to settle to sediment
(Mason et al., 1994). Lower levels of ionic mercury available for methylation could explain why
some marine methylmercury fluxes were slightly lower in marine sediments compared to the
freshwater sediments in our study. As observed in this study, some studies found that anaerobic
sediments released more methylmercury, especially in lakes with more mercury contamination.
A USGS study conducted sediment-water core incubations in Lahontan Reservoir, NV, to
determine the benthic flux from the sediment into overlaying water (Kuwabara et al., 2002).
Lahontan Reservoir has historical contamination from local gold and silver mining. Although

48
Lahontan Reservoir remained oxic down the water column during the summer, this study found
that the site with the highest DO level had the lowest methylmercury efflux of -3.9 ng/m2/d and
the site with the lowest DO level had the highest methylmercury efflux of 27.4 ng/m2/d.
Methylmercury efflux was found to have a direct correlation with DO levels similar to this study.

49
Table 4.1: The comparison of total methylmercury flux rates from other similar studies in
marine and freshwater aquatic systems.
Study Site Total MeHg (ng/m2/d) Source
Deer Lake, WA 0.07-0.37 This Study
Boston Harbor, MA -0.9-41 Benoit et al., 2009
Lahontan Reservoir, NV -3.9-27.4 Kuwabara et al., 2002
San Francisco Bay, CA -20-183 Choe et al., 2005
Lavaca Bay, TX -356-895 Gill et al., 1999
Gulf of Trieste, Italy -112-2544 Covelli et al., 1999
Grado Lagoon, Italy 1050-1602 Covelli et al., 2008
Thau Lagoon, France -32-68 Point et al., 2007
New York/New Jersey Harbor 15-19 Hammerschmidt and Fitzgerald, 2008

50
4.3 Ammonia and Nitrate in August Chambers
Ammonia and nitrate were also analyzed as ancillary components for the chamber
incubation collected on August 25th, 2011. Average ammonia efflux increased from 0.36 to 0.45
mg-N/m2/d between ambient density and high density chambers (Figure 3.9: top plot) Standard
deviations were low, but the flux rates from the ambient density and high density chambers were
not significantly different for both nutrients with a p-value > 0.05. For nitrate and dissolved
inorganic nitrogen (DIN) average fluxes showed little difference and had large standard
deviations. DIN is the sum of ammonium, nitrate and nitrite (Dodds, 2002), but in this study,
nitrite is too small and considered negligible. For the ambient density chambers, ammonia and
nitrate flux rates were 0.36 and 0.97 mg-N/m2/d, respectively. For the high density chambers,
ammonia and nitrate flux rates were 0.45 and 0.98 mg-N/m2/d, respectively. While rates of
ammonia and nitrate efflux were generally higher in the high density chambers, no major trends
were seen.
Macrobenthos are known to enhance the efflux of reduced compounds from the
sediments to overlaying profundal water as a result of bioturbation and bioirrigation processes.
Chironomids can bioirrigate by drawing oxygen down into their burrows for respiration
(Boudreau and Jorgensen, 2001). In addition, a byproduct of macrobenthos respiration is
ammonia, thus higher densities of chironomids produce more ammonia. We expected ammonia
efflux to be higher in the high chironomid density chambers. As noted above, the ammonia and
nitrate results were not significantly different. However, in a similar lake sediment study,
Svensson (1997) found that oxygen consumption doubled in sediment chambers bioturbated with
chironomids than non-bioturbated sediment chambers. Bioturbated sediments had a net positive
release of ammonia into overlaying water, which was found to accumulate at the sediment

51
surface. In addition, nitrate levels increased within the bioturbated sediments, as did the
denitrification process, which reduces nitrate into inorganic nitrogen gas. Bioturbated sediments
disrupted the diffusive barrier between nitrate and buried anoxic sediments, which fueled the
denitrification process. Overall, bioturbated sediments were found to be more of a sink than a
release for inorganic nitrogen. Another sediment chamber study by Biswas et al. (2009)
conducted an analysis on phosphorus flux from eutrophic and mesotrophic pond sediment. This
study showed that phosphorus flux increased more with the presence of chironomids than
without from sediment into overlaying water.
Anoxic conditions can have an effect on ammonia release from lake sediments. Under
anoxic conditions, ammonia can build up in sediments and diffuse into overlaying water. In
contrast, ammonia in aerobic conditions can be removed by being nitrified to nitrate and then
denitrified into nitrogen gas, where the aquatic nitrogen then returns to the atmosphere (Kadlec
and Wallace, 2009). Nitrification of ammonia cannot occur in anaerobic water. In a study of a
wide range of lakes and reservoirs, Beutel (2006) found that lake sediments released ammonia
under anoxic conditions, and release rates were significantly lower or negligible under oxic
conditions. Typical rates for oligo-mesotrophic lakes, similar to Deer Lake, were less than 5 mg-
N/m2/d. Results from this study were drastically lower, even with increased chironomid density,
because aerobic conditions were maintained in the chambers. This condition enhanced
nitrification and subsequently denitrification, which removed nitrogen from the aquatic system.
52
5. CONCLUSION
Macrobenthos, such as chironomid larvae used in this study, can bioirrigate the sediment-
water interface and enhance the efflux of compounds from the sediment to overlaying profundal
water (Boudreau and Jorgensen, 2001). In this study, two sets of sediment-water interface
chambers were incubated under two treatments: ambient chironomid density chambers and high
chironomid density chambers. The two sets of chambers varied in DO exposure. This study
confirmed that macrobenthos and DO played an important role in the release of methylmercury
from profundal sediment into overlaying water in freshwater lakes. Methylmercury efflux rates
measured in our study were similar to those reported in related studies (Benoit et al., 2009;
Gagnon et al., 1997; Gill et al., 1999; Hammerschmidt and Fitzgerald, 2008). The results from
this study supported our initial hypotheses that as DO decreased and chironomid density
increased, methylmercury efflux from sediment increased. T-tests determined that the flux rates
for the ambient density and high density chambers were significantly different, and an ANOVA
concluded that DO was a significant factor in methylmercury efflux from profundal sediment to
overlaying water. Both ambient density and high density chambers exhibited a negative efflux of
total mercury from the August incubation, but were not significantly different between the two
different densities.
Ammonia and nitrate were also measured during the August incubation. While none of
the nitrogen efflux rates showed significant differences between the chambers, the flux rate of
ammonia increased from the ambient density to high density chambers. Nitrate and DIN effluxes
were similar between treatments. Ammonia release rates were comparable to a similar chamber
study by Svensson (1997).
53
This study can advance lake management practices with respect to the methylmercury
efflux from sediments. One approach for increasing oxygen in anoxic bottom waters of lakes is
hypolimnetic oxygenation (Beutel and Horne, 1999). Oxygenation systems release soluble
oxygen into the hypolimnion during summer stratification to maintain a well oxygenated
condition in bottom waters while maintaining thermal stratification. This study showed that
increasing DO levels from 2.5 mg/L DO to 5.0 mg/L DO at the sediment water interface
decreased the sediment efflux of methylmercury by approximately 80%. However, a byproduct
of creating an oxygen-rich hypolimnion is that biota can flourish in oxygenated sediments, such
as macrobenthos, and increase methylmercury efflux. Thus, oxygenation can decrease or
indirectly increase methylmercury efflux.
It is important to note that this increase in methylmercury efflux from the bioirrigation of
macrobenthos may be insignificant when compared to the alternative: methylmercury efflux
under anoxic conditions. For example, in Twin Lake, another study site for the Mercury
Research Group, bottom waters accumulate approximately 0.4 ng/L over the three to four
months in the summer and fall when the hypolimnion is anaerobic. With a hypolimnetic mean
depth of about 4 m, the flux in the hypolimnion was approximately 10 ng/m2/d. This is an order
of magnitude higher than the rates measured in our chambers. Overall, both macrobenthos and
DO are related factors to the efflux of methylmercury at the sediment-water interface, and both
factors are influenced by lake oxygenation. The use of nitrate to inhibit sediment methylmercury
efflux while avoiding recolonization of macrobenthos in sediment has been proposed for
mercury polluted lake ecosystems (Todorova et al., 2009). Nitrate can inhibit sulfur-reducing
bacteria and methylmercury efflux from sediment, without providing an oxygen-rich
environment for biota. Nolan (2011) recently reported that calcium nitrate is being injected via

54
barge into the bottom waters of Onondaga Lake, a highly polluted lake near Syracuse, NY, to
repress methylmercury release from sediments. Results have shown that a nitrate concentration
of approximately 1 mg-N/L repressed methylmercury efflux from sediments. However,
introducing nitrate in high concentrations to freshwater lake systems can initiate other problems,
such as increased algal blooms and groundwater contamination. High levels of nitrate in drinking
water can cause blood diseases, such as “baby-blue” syndrome. In some bodies of water,
nitrogen is often considered a limiting nutrient, thus increasing the concentration of nitrogen in
the system can increase eutrophication. Lake management practices will continue to improve
with a greater understanding in methylmercury efflux from sediment. To the best of our
knowledge, this is the first study to evaluate the effects of macrobenthos density on
methylmercury efflux from freshwater lake sediments. While these concepts are extensively
studied in sulfur-rich marine environments (Benoit et al., 2006, 2009), the effects of
macrobenthos density on methylmercury cycling in freshwater is still somewhat of a mystery.
Future research could include a study which depended on variability in ambient density, perhaps
as a function of depth. Oligochaetes are another common type of macrobenthos in freshwater
lake sediments, whose primary disruption of the sediment-water interface is burrowing rather
than bioirrigation. A study of the influence of oligochaetes on the mercury cycling at the
sediment-water interface could provide more information on whether the activity of
macrobenthos can release or bury dissolved compounds. This study has provided initial research
on methylmercury efflux from sediment in freshwater lakes as a function of chironomid density
and dissolved oxygen levels, but further research still needs to be done.

55
6. REFERENCES
Benoit, J.M., Shull, D.H., Harvey, R.M., Beal, S.A. "Effect of Bioirrigation on Sediment-Water
Exchange of Methylmercury in Boston Harbor, Massachusetts." Environmental Science
& Technology, 2009: 43: 3669-3674.
Benoit, J.M., Shull, D.H., Robinson, P., Ucran, L.R. "Infaunal burrow densities and sediment
monomethyl mercury distributions in Boston Harbor, Massachusetts." Marine Chemistry,
2006: 102: 124-133.
Beutel, M.W., Horne, A.J. "A review of the effects of hypolimnetic oxygenation on lake and
reservoir water quality." Lake Reserv. Manage., 1999: 15(4): 285-297.
Beutel, Marc W. "Inhibition of ammonia release from anoxic profundal sediments in lakes using
hypolimnetic oxygenation." Ecological Engineering, 2006: 28: 271-279.
Beutel, Marc W., Horne, A.J., Taylor, W.D., Losee, R.F., Whitney, R.D. "Effects of oxygen and
nitrate on nutrient release from profundal sediments of a large, oligo-mesotrophic
reservoir, Lake Mathews, California." 2008.
Beutel, Marc W., Leonard, T.M., Dent, S.R., Moore, B.C. "Effects aerobic and anaerobic
conditions on P, N, Fe, Mn and Hg accumulation in waters overlaying profundal
sediments of an oligo-mesotrophic lake." Water Research, 2008: 42: 1953-1962.
Biswas, J.K., Rana, S., Bhakta, J.N., Jana, B.B. "Bioturbation potential of chironomid larvae for
the sediment-water phosphorus exchange in simulated pond systems of varied nutrient
enrichment." Ecological Engineering, 2009: 35: 1444-1453.
Borowiak, D., Nowinski, K., Baranczuk, J., Skowron, R., Solarczyk, A., Marszelewski, W.
"Interactions between Areal Hypolimnetic Oxygen Depletion rate and trophic state of
lakes in northern Poland." BALWOIS Conference, 2010.

56
Boudreau, B.P., Jorgensen, B.B. The Benthic Boundary Layer: Transport Processes and
Biogeochemistry. New York: Oxford University Press, Inc., 2001.
Bretagne N.H., Ambers, R.K., Ambers, C.P. "Tracing the source of mercury contamination in the
Dorena Lake watershed, Western Oregon." Environ. Geol., 2001: 40: 853-859.
Coequyt, J., Wiles, R., Stadler, F., Hawkins, D.,. Mercury Falling: An analysis of mercury
pollution from coal-burning power plants. 1999, Washington, D.C.: Environmental
Working Group/Clean Air Network/NRDC, 1999.
Deer Lake Property Owners Association, (DLPOA). Deer Lake 2005 Water Quality Study
Report. Spokane: Spokane Tribal Laboratories, 2005.
Dodds, Walter K. Freshwater Ecology: Concepts and Environmental Applications. San Diego:
Academic Press, 2002.
Gagnon, C., Pelletier, E., Mucci, A. "Behaviour of anthropogenic mercury in coastal marine
sediments." Mar. Chem., 1997: 59: 159-176.
Gill, G.A., Bloom, N.S., Cappellino, S., Driscoll, C., Dobbs, C., McShea, L., Mason, R.P., Rudd,
J. "Sediment-water fluxes of mercury in Lavaca Bay, Texas." Environ. Sci. Technol.,
1999: 33: 663-669.
Gilmour, C.C., Henry, E.A. "Mercury methylation in aquatic systems affected by acid
deposition." Environmental Pollution, 1991: 71:131-169.
Hammerschimdt, C.R., Fitzgerald, W.F. "Sediment-water exchange of methylmercury
determined from shipboard benthic flux chambers." Marine Chemistry, 2008: 109:86-97.
Katsev, S., Chaillou, G., Sundby, B. "Effects of progressive oxygen depletion on sediment
diagenesis and fluxes: A model for lower St. Lawrence River Estuary." Limnol.
Oceanogr., 2007: 52(6): 2555-2568.
57
Kemmerer, G., Bovand, J.F., Boorman, W.R. "Northwestern Lakes of the United States:
Biological and chemical studies with reference to possibilities in production of fish."
Bulletin of the U.S. Bureau of Fisheries, 1924: 39: 51-140.
Kerin, E.J., Gilmour, C.C., Roden, E., Suzuki, M.T., Coates, J.D., Mason, R.P. "Mercury
Methylation by Dissimilatory Iron-Reducing Bacteria." Applied and Environmental
Microbiology, 2006: 72: 7919-7921.
Kuwabara, J.S., Marvin-Dipasquale, M., Praskins, W., Byron, E., Topping, B.R., Carter, J.L.,
Fend, S.V., Parchaso, F., Krabbenhoft, D.P., Gustin, M.S. Flux of Dissolved Forms of
Mercury Across the Sediment-Water Interface in Lahontan Reservoir, NV. 02-4138,
United States Geological Survey Investigations Report, 2002.
Mason, R.P., Fitzgerald, W.F., Morel, F.M.M. "The biogeochemical cycling of elemental
mercury: anthropogenic influences." Geochimica et Cosmochimica Acta, 1994: 58:3191-
98.
Mason, R.P., Morel, F.M.M., Hemond, H.F. "The role of microorganisms in elemental mercury
formation in natural waters." Water Air Soil Pollut., 1995: 80: 775-787.
Meili, M. "Mercury in lakes and rivers." Metal Ions Biol. Syst., 1997: 34:21-51.
Mergler, Donna, Anderson, H.A., Chan, L.H.M., Mahaffey, K.R., Murray, M., Sakamoto, M.,
Stern, A.H. "Methymercury exposure and health effects in humans: a worldwide
concern." AMBIO: A Journal of the Human Environment, 2007: 36(1):3-11.
Morel, F.M.M., Kraepiel, A.M.L., Amyot, M. "The Chemical Cycle and Bioaccumulation of
Mercury." Annual Review of Ecology and Systematics, 1998: 29: 543-566.

58
Nolan, J., Effler, S., Driscoll, C., Henry, B., Auer, M. "Controlling sediment release of
methylmercury via nitrate addition." Presentation at the North American Lake
Management Society Annual Conference. Spokane, November, 2011.
Shoemaker, W.J. "Water and sewage facilities plan for Deer Lake." Report sponsored by Public
Utilities District No. 1 Stevens County, 1976.
Soltero, R.A., Wainwright, M.L., Sexton, L.M., Humphreys, L.M., Buchanan, J.P., Seigmund,
B.L., Anderson, D.E., Oppenheimer, J.O., Morency, D.A. "Water Quality Assessment of
Deer Lake, Washington." Biology Department, Eastern Washington University, Cheney,
WA, 1991.
Svensson, Jonas M. "Influence of Chironomus plumosus larvae on ammonia flux and
denitrification (measured by the acetylene blockage- and the isotope pairing-technique) in
eutrophic lake sediment." Hydrobiologia, 1997: 346: 157-168.
The Weather Channel, (weather.com). Monthly Averages for Spokane, WA. 2011.
http://www.weather.com/outlook/recreation/outdoors/wxclimatology/monthly/graph/US
WA0422.
Todorova, S.G., Driscoll, Jr., C.T., Matthews, D.A., Effler, S.W., Hines, M.E., Henry, E.A.
"Evidence for Regulation of Monomethyl Mercury by Nitrate in a Seasonally Stratified,
Eutrophic Lake." Enviro. Sci. Technol., 2009: 43: 6572-6578.
United States Environmental Protection Agency, (USEPA). "Mercury Study Report to Congress:
Vol. VII: Characterization of Human Health and Wildlife Risks from Mercury Exposure
in the United States." Washington, D.C., 1997.
United States Environmental Protection Agency, (USEPA). Mercury: Health Effects.
http://www.epa.gov/hg/effects.htm, 2010.
59
United States Environmental Protection Agency, (USEPA). "Method 1630: Methylmercury in
water by distillation, aqueous ethylation, purge and trap, and CVAFS." In EPA-821 R-01-
020. Washington, D.C.: USEPA, 2001.
United States Environmental Protection Agency, (USEPA). "Method 1631, revision E: Mercury
in water by oxidation, purge and trap, and cold vapor atomic fluorescence spectrometry."
In EPA-821 R-02-019. Washington, D.C.: USEPA, 2002.
United States Environmental Protection Agency, (USEPA). "Method 1669: Sampling Ambient
Water for Trace Metals at EPA Water Quality Criteria Levels." In EPA-821 R-96-008.
Washington, D.C.: USEPA, 1996.
United States Environmental Protection Agency, (USEPA). "Model-Based Analysis and
Tracking of Airborne Mercury Emissions to Assist in Watershed Planning." Washington,
D.C., 2008.
United States Environmental Protection Agency, (USEPA). The National Listing of Fish
Advisories. National Fish and Wildlife Contamination Program, 2010.
Wallace, Kadlec and. Treatment Wetlands. Boca Raton: CRC Press, 2009.
Washington State Department of Ecology, (WSDOE). Mercury in Edible Fish Tissue and
Sediments from Selected Lakes and Rivers of Washington State. Olympia: Department of
Ecology, 2003.
Watras, C.J. "Bioaccumulation of mercury in pelagic freshwater food webs." Science of the Total
Environment, 1998: 219:183-208.
Watras, C.J. "Mercury Pollution in Remote Freshwaters." In Encyclopedia of Inland Waters, by
Gene Elden Likens, 100-109. New York: Elsevier, Inc., 2009.