a cclaro phenol contaminant id - thermo fisher … note a cclaro phenol contaminant id detection of...
TRANSCRIPT
TECHNICAL NOTE
Acclaro phenol contaminant IDDetection of phenol in nucleic acid samples using the NanoDrop One spectrophotometer
IntroductionIn this post-genomic era, the quantification of nucleic acids remains an essential technique used in modern laboratories today. Most cutting-edge biological and biomedical research uses experimental techniques and workflows involving nucleic acid samples. Experimental techniques such as PCR, qPCR, next-generation sequencing, and cloning require researchers to determine sample purity as well as other important variables affecting nucleic acid samples before using them in downstream experiments. Sample concentration, purity, and quality are the main sample variables that can be obtained by various instruments available in the life science market.
The quantification of nucleic acids has traditionally been performed by absorbance measurements at 260 nm. One thing to consider when evaluating samples using absorbance is that contaminants from the nucleic acid extraction process absorb in various regions of the UV spectrum. The presence of any of these contaminants in a nucleic acid sample can directly affect the accuracy of the quantification result.
Authors: Sean Loughrey and Brian Matlock, Thermo Fisher Scientific, Wilmington, DE
Key Words NanoDrop One, Acclaro Contaminant ID, Phenol Contamination, Purity Ratio, Chemometrics, UV-Vis, Spectrophotometer, Spectral Analysis, Sample Intelligence, DNA QuantificationAbstractThe new Thermo Scientific™ Acclaro™ Sample Intelligence technology built into the Thermo Scientific™ NanoDrop™ One microvolume UV-Vis spectrophotometers allows scientists to accurately quantify their nucleic acid samples in the presence of common contaminants carried over from nucleic acid extraction methods. In this study, we measured the concentration of DNA in the presence of various amounts of phenol contamination. We then compared the uncorrected versus the Acclaro-corrected concentration values. The results showed that the Acclaro-corrected DNA concentrations were within 10% of the concentration of the DNA-only control. The Acclaro-corrected results demonstrate the effectiveness of the software algorithm in identifying phenol contamination, properly correcting the DNA concentration values, and providing a more accurate concentration result than the A260 value alone. This information enables scientists to make informed decisions regarding sample use in downstream experiments and provides valuable information for troubleshooting problematic extractions.
No
. 52918

Reviewing purity ratios has been the primary method used to assess the presence of UV-absorbing contaminants. In general, researchers will verify that their purity ratios fall into an acceptable range (Table 1). However, relying on purity ratios alone does not provide a complete assessment of the potential contaminants in nucleic acid samples (Table 1). Purity ratios used in combination with full-spectral data greatly enhances the ability of researchers to determine not only the purity of a nucleic acid sample, but also an accurate concentration via A260 absorbance. Until now, analysis of a sample’s spectrum has been a qualitative research endeavor, and the ability to identify specific contaminants from the spectrum has relied mostly on the researcher’s analytical experience.
Rigorous, quantitative research methods and data have driven the development of the Acclaro sample intelligence technology in the NanoDrop One spectrophotometer. The Acclaro technology provides a cutting-edge quantitative approach for contaminant identification by using chemometric methods to analyze the chemical components present in a sample. Ultimately, the goal for this new technology is to help scientists make informed decisions about whether to use their samples in downstream reactions and workflows that may be labor intensive, expensive or consume rare samples.
The NanoDrop One Acclaro Contaminant Identification (ID) feature allows for the detection of protein, phenol, and guanidine-salt contaminants in nucleic acid solutions. The NanoDrop One spectrophotometer alerts users to the presence of a contaminant in real time by displaying a yellow contaminant ID icon (Figure 1A) next to the sample number on the NanoDrop One touchscreen.
Tapping on the contaminant icon reveals the full contaminant analysis details provided by the Acclaro technology (Figure 1B). The screen displays the deconvolved spectra, identified contaminants, purity ratios, corrected DNA concentration, and the coefficient of variation, which represents the confidence in the Acclaro algorithm prediction. In this technical note, we present data obtained by the Acclaro Contaminant ID feature.
The data show how this rigorous, quantitative technology can accurately detect phenol contamination in nucleic acid samples and provide accurate DNA concentration values.
Phenol contamination in nucleic acid samplesThe use of phenol to separate protein from nucleic acids has a long history, dating back to the 1950s. Although there have been various protocols and formulations developed over the years, the most popular technique was developed by Chomczynski and Sacchi in the mid-1980s. This technique used a mixture of guanidinium thiocyanate, phenol, and chloroform and allowed scientists to obtain highly pure, undegraded total RNA in a single step (Chomczynski and Sacchi, 1987, Chomczynski and Sacchi, 2006)1-2. This method served as the basis for the development of various RNA extraction kits including TRIzol™ kit (Thermo Fisher Scientific), TRI Reagent® kit (Molecular Research Center, Inc), QIAzol® kit (Qiagen), TriPure™ kit (Sigma-Aldrich), TRISure™ kit (Bioline), and RNAzol® kit (Molecular Research Center). These extraction kits use different formulations of phenol, guanidium thiocyanate, and chloroform to lyse cells and denature proteins including DNases and RNases. Traces of these reagents can be found in purified nucleic acid samples and may affect downstream workflows.
260/280 260/230
DNA 1.8-2.0 1.8-2.2RNA 2.0- 2.2 1.8-2.2
Pure Phenol 1.6 2
Table 1: Purity ratio ranges generally accepted for pure nucleic acid samples in TE buffer. Notice that the purity ratio for pure phenol does not deviate greatly from the purity ratios for pure nucleic acids.
Figure 1: The Acclaro Contaminant ID feature identifies possible contaminants present in a sample. 1A) Measurement screen: the Acclaro Contaminant ID icon indicates that the Acclaro algorithms have detected a potential contaminant in a dsDNA sample. 1B) Contaminant analysis screen: comparison of original absorbance spectrum (DNA plus phenol, blue), the corrected spectrum (original minus contaminant, green) and the contaminant spectrum (orange). This screen also contains the original and corrected DNA concentration results.
A
B

The extraction procedure will create an organic phase and an aqueous phase (Figure 2). The pH of the extraction solution will dictate which nucleic acid species is extracted into the aqueous phase. An acidic solution favors extraction of RNA into the aqueous phase, while an alkaline solution extracts both DNA and RNA into the aqueous phase. Partially denatured proteins congregate in the interphase between the two phases (Figure 2). Separation of nucleic acids from the denatured protein requires removal of the aqueous phase without disturbing the interphase (Figure 2). This can prove very difficult, especially for those who are new to the extraction technique. To avoid contamination of the purified nucleic acid with protein, phenol, or guanidium, removal of the aqueous phase requires experience and precise technique (Oswald, 2016, Plank, 2010, Jankovic 2016)3-5. Nucleic acid contamination from extraction reagents continues to be a common issue in today’s laboratory and a popular topic for the NanoDrop technical support group.
Phenol contamination can have the following effects on nucleic acid samples:
• Phenol can effectively denature proteins, thus affecting downstream enzymatic steps.
• Phenol has a very high extinction coefficient at 270 nm; even small amounts of contamination can drastically overestimate sample concentration.
Calculating and assessing an A260/A280 (260/280) or A260/A230 (260/230) ratio is the traditional method to detect phenol contamination. However, this is not a very effective method because phenol has an absorbance peak at 270 nm, and the purity ratios of pure phenol are close to the ratios observed for pure DNA and RNA (Table 1). In this technical note, we show how different amounts of phenol contamination affect the 260/280 or 260/230 purity ratios and nucleic acid quantification results.
We also show how the Acclaro Contaminant ID feature can accurately identify phenol contamination, subtract the phenol absorbance contribution from the original measurement value, and deliver an accurate nucleic acid concentration result.
Materials and methods Stocks of DNA and phenol were prepared as follows:
• A double stranded DNA (dsDNA) stock was prepared by diluting a salmon sperm DNA solution (Invitrogen, #15632-011) in Tris-EDTA (TE) buffer (Fisher BioReagents, pH 7.6, BP-2474-500).
• A phenol stock was prepared by diluting a buffer-saturated phenol (Fisher BioReagents, BP-1750) in TE buffer.
The concentrations of the stocks were determined on the NanoDrop One spectrophotometer against a TE blank. Nine mixtures of DNA and phenol were prepared by adding various amounts of the DNA and phenol stocks to generate the mixtures shown in Table 2.
Five replicates of each solution were measured on the NanoDrop One instrument against a TE blank. A fresh 1.5 µL aliquot of the appropriate mixture was used for each replicate. The dsDNA application calculated concentrations (original-uncorrected and corrected) and provided contaminant identity data, which were then used to generate the data sets presented in Table 3 for:
• Average concentrations and standard deviation (SD) based on uncorrected concentrations
• Average concentrations and SD based on Acclaro-corrected concentrations
• Average purity ratios for each mixture
Figure 2: Phase separation typically observed when performing a conventional phenol-based nucleic acid extraction. The picture shows how difficult it is to see the phase separation.
MixtureTarget DNA
ConcentrationPhenol
Concentration
1 225.0 ng/μL 0.00 ppm
2 225.0 ng/μL 18.75 ppm
3 225.0 ng/μL 37.50 ppm
4 225.0 ng/μL 75.00 ppm
5 225.0 ng/μL 150.00 ppm
6 225.0 ng/μL 300.00 ppm
7 225.0 ng/μL 600.00 ppm
8 225.0 ng/μL 1200.00 ppm
9 225.0 ng/μL 1600.00 ppm
Table 2: dsDNA and phenol stocks were mixed to yield the samples listed above.

The uncorrected concentrations versus the Acclaro-corrected concentrations were compared, and results are discussed below. *Mixtures 1 and 2 did not contain high enough concentrations of phenol to trigger an Acclaro result, therefore, the corrected DNA concentrations for these mixtures were determined by performing the Acclaro spectral analysis algorithm using the Thermo Scientific™ TQ Analyst™ software package.
Results and discussion Table 3 presents the Acclaro Contaminant ID data obtained for the nine DNA/phenol mixtures described in Table 2. Notice that the phenol component is expressed in parts per million (ppm). This conversion is needed because the molar extinction coefficient of phenol is much larger than the extinction coefficient of dsDNA. For example, a 0.1% solution of phenol is 1000 ppm. As the level of phenol increases from 37.5 ppm to 1600 ppm, the discrepancy between the corrected and the uncorrected values increases. This clearly demonstrates how even
very small amounts of phenol contamination can inflate an A260 concentration result. The Acclaro-corrected results demonstrate the effectiveness of the software algorithm in identifying phenol contamination, properly correcting the concentration values, and providing a more accurate concentration result than the A260 value alone.
The bar graph shown in Figure 3 compares the uncorrected and the corrected DNA concentration data in the presence of different levels of phenol contamination. It is clear that the presence of phenol inflates the concentration value significantly. The Acclaro feature flags samples when phenol contamination is greater than ~18.75 ppm, thus illustrating the high sensitivity of the software at detecting phenol contamination. The bar graph also shows that in all cases, the Acclaro-corrected DNA concentrations are within 10% of the concentration of the DNA-only control. Moreover, the concentration results were highly reproducible at high levels of phenol contamination, with average standard deviations under 5 ng/μL.
Mixture 1 2 3 4 5 6 7 8 9
Phenol content (ppm) 0.00 18.75 37.50 75.00 150.00 300.00 600.00 1200.00 1600.00
Original (Uncorrected) DNA conc ng/μL 245.75 253.50 264.34 284.75 318.35 387.55 523.59 851.29 1041.50
Corrected DNA conc ng/μL *240.56 *238.67 240.61 243.26 244.38 242.51 245.26 265.96 265.45
Corrected DNA conc ng/μL Std dev 0.61 0.95 0.79 1.24 0.76 0.85 0.87 5.47 3.26
260/280 Purity Ratio 1.89 1.85 1.83 1.79 1.75 1.70 1.71 1.53 1.54
260/230 Purity Ratio 2.43 2.38 2.32 2.27 2.19 2.11 2.08 1.89 1.94
Acclaro Flag No Flag No Flag
Table 3: The DNA concentration of each mixture and DNA-only control (mixture 1) were determined with the NanoDrop One spectrophotometer using the dsDNA application. The corrected DNA concentration for mixtures 3 through 9 was obtained directly from the Acclaro contaminant analysis screen. The Acclaro Contaminant ID icon ( ) denotes mixtures that have levels of phenol contamination high enough to trigger an Acclaro result.
Figure 3: The DNA concentration after Acclaro correction is within 10% of the actual DNA concentration (DNA-only control) for all mixtures. Red bars represent the uncorrected DNA concentrations. The blue bars represent the corrected DNA concentrations reported by the Acclaro software (or as described in Material and Methods). The blue line is the average concentration for the DNA-only control (Mixture #1: 245.75 ng/μL without phenol). The green dotted lines represent 10% above or below the DNA-only control. Each data point represents the average of five measurements. Error bars represent one standard deviation from the mean.
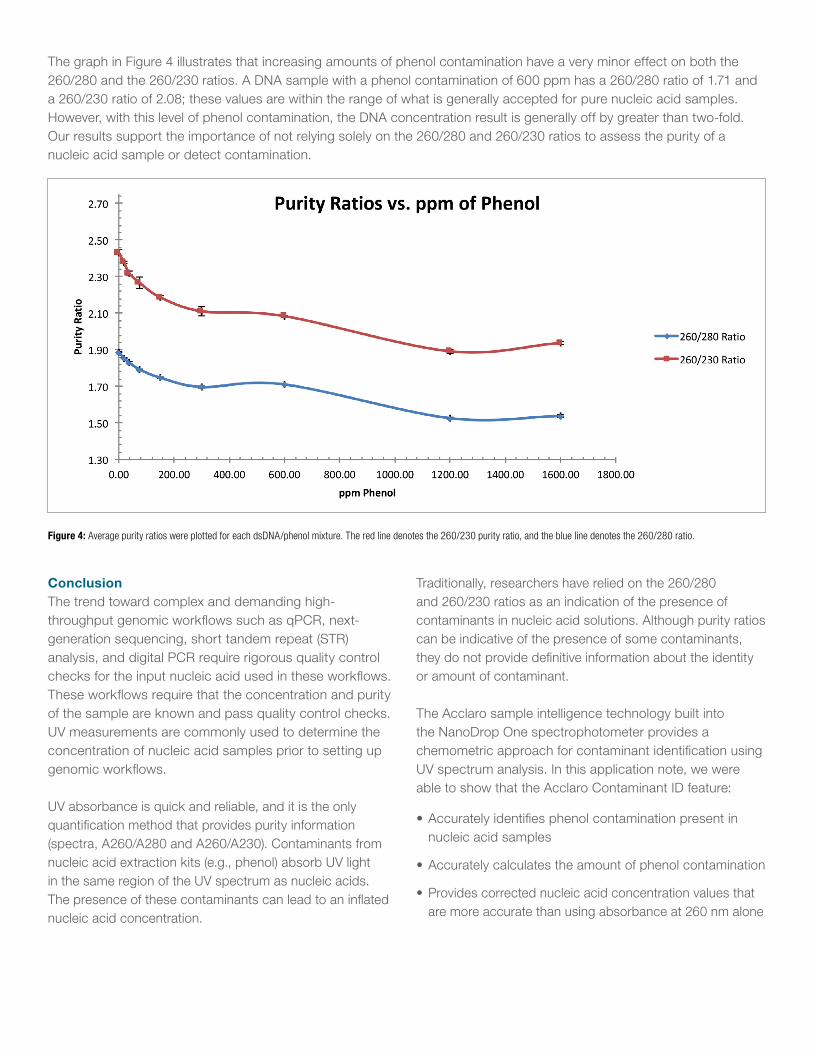
The graph in Figure 4 illustrates that increasing amounts of phenol contamination have a very minor effect on both the 260/280 and the 260/230 ratios. A DNA sample with a phenol contamination of 600 ppm has a 260/280 ratio of 1.71 and a 260/230 ratio of 2.08; these values are within the range of what is generally accepted for pure nucleic acid samples. However, with this level of phenol contamination, the DNA concentration result is generally off by greater than two-fold. Our results support the importance of not relying solely on the 260/280 and 260/230 ratios to assess the purity of a nucleic acid sample or detect contamination.
Conclusion The trend toward complex and demanding high-throughput genomic workflows such as qPCR, next-generation sequencing, short tandem repeat (STR) analysis, and digital PCR require rigorous quality control checks for the input nucleic acid used in these workflows. These workflows require that the concentration and purity of the sample are known and pass quality control checks. UV measurements are commonly used to determine the concentration of nucleic acid samples prior to setting up genomic workflows.
UV absorbance is quick and reliable, and it is the only quantification method that provides purity information (spectra, A260/A280 and A260/A230). Contaminants from nucleic acid extraction kits (e.g., phenol) absorb UV light in the same region of the UV spectrum as nucleic acids. The presence of these contaminants can lead to an inflated nucleic acid concentration.
Figure 4: Average purity ratios were plotted for each dsDNA/phenol mixture. The red line denotes the 260/230 purity ratio, and the blue line denotes the 260/280 ratio.
Traditionally, researchers have relied on the 260/280 and 260/230 ratios as an indication of the presence of contaminants in nucleic acid solutions. Although purity ratios can be indicative of the presence of some contaminants, they do not provide definitive information about the identity or amount of contaminant.
The Acclaro sample intelligence technology built into the NanoDrop One spectrophotometer provides a chemometric approach for contaminant identification using UV spectrum analysis. In this application note, we were able to show that the Acclaro Contaminant ID feature:
• Accurately identifies phenol contamination present in nucleic acid samples
• Accurately calculates the amount of phenol contamination
• Provides corrected nucleic acid concentration values that are more accurate than using absorbance at 260 nm alone

References 1. Chomczynski, P. and Sacchi, N. “Single-step method of RNA isolation by acid guanidinium thiocyanate-phenol-chloroform
extraction.” Anal. Biochem. 162: 156-159. 1987.
2. Chomczynski, P. and Sacchi, N. “The single-step method of RNA isolation by acid guanidinium thiocyanate-phenol-chloroform extraction: twenty-something years on.” Nature Protocols Vol. 1 No.2: 581-585. 2006.
3. Oswald, N. “The Basics: How Phenol Extraction of DNA Works”. BiteSize Bio. July 9th 2016. http://bitesizebio.com/384/the-basics-how-phenol-extraction-works
4. Plank, J. “Practical application of Phenol/Chloroform Extraction”. BiteSize Bio. May 3rd 2010. http://bitesizebio.com/3651/practical-application-of-phenolchloroform-extraction
5. Jankovic, J. “Acid Phenol Chloroform Extraction of DNA, RNA and protein: 3 in 1”. BiteSize Bio. Nov. 23rd 2016. http://bitesizebio.com/31609/acid-phenol-chloroform-extraction
Thermo Scientific™ NanoDrop™ One and OneC Microvolume UV-Vis spectrophotometers
Find out more at www.thermofisher.com/nanodrop
© 2017 Thermo Fisher Scientific Inc. TRI Reagent and RNAzol are registered trademarks of Molecular Research Center, Inc. TriPure is a trademark of Roche Diagnostics Operations, Inc. QIAzol is a registered trademark of Qiagen GmbH. TRISure is a trademark of Bioline Reagents Ltd. All other trademarks are the property of Thermo Fisher Scientific and its subsidiaries. TN52918_E 02/17M