a balance of healthy and sustainable food choices for
TRANSCRIPT

Healthy people, healthy planet.
A BALANCE OF HEALTHY AND SUSTAINABLE FOOD CHOICES FOR FRANCE, SPAIN AND SWEDEN
Report
Healthy people, healthy planet.
1
Authors
Stuart Thompson (Ribble Consultants)
Robin Gower (Infonomics)
Nicole Darmon (University of Aix-Marseille)
Florent Vieux (University of Aix-Marseille)
Donal Murphy-Bokern (Murphy-Bokern Konzepte)
Matthieu Maillot (University of Aix-Marseille)
Acknowledgements
We gratefully acknowledge support from Jennie MacDiarmid (explaining the reality of producing the
original LiveWell UK report), Rob Beeston (helping with carbon data) and staff of the WWF offices.

2
CONTENTS
Foreword ................................................................................................................................................. 6
Executive summary ................................................................................................................................. 8
Glossary................................................................................................................................................ 11
Introduction ........................................................................................................................................... 12
1. Background and research questions .......................................................................................... 13
1.1 WWF’s One Planet Food programme and the Livewell diet for the UK................................ 13
1.2 LiveWell for low impact food in Europe (LIFE) ..................................................................... 14
1.3 Key research questions ...................................................................................................... 15
1.4 Literature review ...................................................................................................................... 17
2. Methodology ............................................................................................................................... 23
2.1 General approach ............................................................................................................... 23
2.1.1 Collation of data ............................................................................................................. 23
2.1.2 Modelling ........................................................................................................................ 25
3.1 General ............................................................................................................................... 27
3.1.1 Introduction .................................................................................................................... 27
3.1.2 Comparing the three countries ....................................................................................... 27
3.1.3 Common features ........................................................................................................... 29
3.2 LiveWell for each country .................................................................................................... 30
3.2.1 France ............................................................................................................................ 30
3.2.2 Spain .............................................................................................................................. 39
3.2.3 Sweden .......................................................................................................................... 50
4. Analysis ...................................................................................................................................... 57
4.1 Approach to data ................................................................................................................ 57
4.2 Approach to defining acceptability ....................................................................................... 58

3
4.3 Approach to modelling ........................................................................................................ 60
4.4 Extreme diets ...................................................................................................................... 61
4.5 Areas outside the model ..................................................................................................... 62
4.6 Cost of the diet .................................................................................................................... 63
4.7 Specific issues for each country .......................................................................................... 64
4.7.1 France ............................................................................................................................ 64
4.7.2 Spain .............................................................................................................................. 73
4.7.3 Sweden .......................................................................................................................... 75
5. Conclusions ................................................................................................................................ 76
5.1 General ............................................................................................................................... 76
5.2 Research questions ............................................................................................................ 76
5.2.1 Can a healthy diet be more environmentally sustainable? .............................................. 77
5.2.2 Can a diet be healthy, economic and respect the environment? ..................................... 77
5.2.3 What is the lowest level of GHGe that may be reached while fulfilling nutritional
recommendations and not increasing diet cost? ......................................................................... 77
5.2.4 What would be a healthy, sustainable diet which reduces GHGe by 25% and minimises
change from the current diet? ..................................................................................................... 78
5.2.5 How can we show consumers that this is a viable change in diet? ................................. 78
5.2.6 What are the general implications? ................................................................................ 78
5.3 Need for further research .................................................................................................... 80
A. France ................................................................................................................................ 86
1. Breakdown of foods ............................................................................................................ 86
2. Availability of GHGe data .................................................................................................... 86
3. Conversion of data – approach ........................................................................................... 86
4. Nutritional data .................................................................................................................... 86
5. Cost data ............................................................................................................................ 87

4
6. Constraints – nutrition ......................................................................................................... 87
7. Constraints – acceptability .................................................................................................. 87
B. Spain .................................................................................................................................. 88
1. Breakdown of foods ............................................................................................................ 88
2. Availability of GHGe data .................................................................................................... 88
3. Conversion of data – approach ........................................................................................... 88
4. Nutritional data .................................................................................................................... 89
5. Cost data ............................................................................................................................ 89
C. Sweden ............................................................................................................................... 89
1. Breakdown of foods ............................................................................................................ 89
2. Availability of GHGe data .................................................................................................... 89
3. Conversion of data – approach ........................................................................................... 90
4. Nutritional data .................................................................................................................... 92
5. Cost data ............................................................................................................................ 92
6. Constraints – nutrition ......................................................................................................... 92
France ........................................................................................................................................... 94
1. GHGe sensitivity analysis ................................................................................................... 94
2. Cost sensitivity analysis ...................................................................................................... 95
Spain ............................................................................................................................................. 96
Sweden .......................................................................................................................................... 99
Task 1 – To produce resource material on each pilot country’s current dietary patterns............... 102
Outputs..................................................................................................................................... 103
Task 2 – To conduct analysis and produce a case study for each pilot country ............................ 103
The environment ...................................................................................................................... 103
LiveWell for LIFE ...................................................................................................................... 103

5
Outputs..................................................................................................................................... 105
Summary ..................................................................................................................................... 105
6
FOREWORD
A balance of healthy and sustainable food choices for France, Spain, and Sweden is an important
report. It shows that it is possible to have a healthy, low-carbon diet that takes account of cultural
preferences. It demonstrates that these diets will not necessarily cost more – and extra cost is often
given as a reason to not change products and buying habits.
Food is at the heart of many key environmental issues. Growing, producing and importing food
contributes substantially to climate change. It’s a driving force behind habitat and biodiversity loss. And
it’s a huge drain on water resources. WWF’s vision of a sustainable food system is one that supports
vital elements of our work: conserving biodiversity, reducing water use and reducing greenhouse gas
emissions.
The change in the Western diet – to one that’s high in meat, dairy and processed food – is a recent
phenomenon: it’s developed since the 1940s. It’s coincided with a growth in problems such as obesity,
type II diabetes and heart disease. That’s why helping to develop a sustainable food system for healthy
people and a healthy planet is one of WWF’s priorities and why we have joined forces with our partners
Friends of Europe to investigate the potential for LiveWell across Europe.
The world’s population has doubled since 1960, and it’s predicted to increase to over nine billion by
2050. So the pressure that feeding the world is putting on the climate and ecosystems has never been
so high. Global access to food is not equally distributed: half the global population is either underfed or
overfed.
Many major independent reports in recent years have recognised the need for food production and
consumption to change, as outlined in the literature review. They all recognise the role of production
and technological changes, but the food system will not be sustainable without a change in food
consumption patterns. That led WWF-UK to look at food consumption. We quickly realised that many of
the highest-impact foods are the ones that, if eaten excessively, are causing health problems. Through
our LiveWell work we demonstrated that a diet that follows UK government healthy-eating guidelines –
containing fresh produce and not too much meat and dairy or processed foods – is a sustainable diet.
The LiveWell for low impact food in Europe (LiveWell for LIFE) project is only a first step towards
defining a more sustainable diet. It looks at health, nutrition, carbon and affordability. Its aim is to open

7
the debate on this topic and to get key stakeholders from the food supply chain and EU and national
policy-makers to look at sustainable diets as part of a future policy agenda.
This publication is the initial result of the LiveWell for LIFE project’s work to define country-specific
sustainable diets for three European countries. In addition there is a summary report to enable project
stakeholders to easily understand the findings of the initial research, supporting further engagement in
the next stages of LiveWell for LIFE.
These findings were presented to the Network of European food stakeholders at our first project
workshop – ‘Appetite for change’ – which was held in Brussels on 18 September 2012. Members of the
Network were also invited to contribute and share their views on the report during a three-week
consultation period. We received a large number of contributions, for which we are grateful.
Our responses to the Network’s comments and queries collected during the consultation period, as well
as changes and next steps for the project as a result of these, can be found in the LiveWell Plate
evaluation report. The evaluation report shows that more work is needed to refine the tools that
accompany and help communicate the LiveWell Plate in each country. We look forward to using this
feedback to inform the development of the project and working together with stakeholders to further
refine the project outcomes.
Duncan Williamson
Senior Policy Advisor (food)
WWF-UK

8
EXECUTIVE SUMMARY
There is increasing recognition of the environmental impact of food and drink. Proposals suggest that
food policy and dietary advice need to go beyond their traditional focus on nutrition to include
consideration of environmental impacts. Balancing environmental, economic and social aspects with
nutritional ones adds complexity to establishing dietary guidelines.
This report builds on the work done in the UK on the LiveWell diet recommendations, representing a
balance between healthy and sustainable food choices, with sustainability defined only in terms of
greenhouse gas emissions (GHGe). By extending this approach to a further three countries – France,
Spain and Sweden – we aim to determine whether it is possible to develop corresponding diet
recommendations in other countries. We also analyse the difficulties of integrating data from multiple
sources to see whether these countries can be used as pilots for work elsewhere.
The key question addressed in this report is whether it is possible, in each of the countries, to develop a
“LiveWell” diet which decreases GHGe by 25% from the current average1, costs no more, meets
national nutritional guidelines, and still resembles current diets sufficiently to be widely and easily
accepted.
To answer this question we used a similar approach to that adopted for LiveWell UK – collating data on
current consumption patterns, nutritional recommendations, public dietary guidance, GHGe of particular
foods, and general price information. The quality and completeness of the data varied between the
countries and we have had to make some assumptions. Nonetheless, through modelling we have
sought to demonstrate that, for all three countries:
Moves towards healthier eating can align with environmental objectives
A healthy and sustainable diet does not necessarily cost more than the existing diet
A healthy diet which costs no more than current amounts and reduces GHGe by 25% is possible
and could be accepted by a large proportion of the population (i.e. not too far from current
consumption patterns).
Our analysis substantiates all these points. We can state, specifically:
1 LiveWell UK based its reduction on 25% taking into account projected growth in population. Owing to lack of clarity in projections, in this
report the 25% does not take population changes into account, i.e. it is per capita rather than for the country as a whole.

9
1. For all three countries it is possible to produce a healthy and sustainable diet.2 In all cases we
produced a diet which reduced GHGe by more than 25%, although there has to be compromise
regarding acceptability. Despite the limitations of the methodology, the wide reductions possible
demonstrate that food choices can have a real effect.
2. A healthy sustainable diet does not have to be an expensive one. Indeed, in all the general
analysis, cost was not a binding constraint and only came into play in terms of choosing
“acceptable” foods for the consumer. This is important because cost is often seen as a factor in
consumers not adopting healthy and sustainable eating.
3. We have demonstrated that for all three countries a LiveWell diet is possible – one which
complies with nutritional recommendations, reduces GHGe by 25%, and provides a choice of
foodstuffs as acceptable as possible.
Comparison between the three countries can be invidious and can easily become a comparison of
cuisine and eating habits rather than health, cost and sustainability. Nonetheless, a number of overall
similarities between these nutritious low GHGe diets can be observed:
1. All diets show a reduction in the total amount of meat consumed. This is inevitable since these
are the foods with the highest GHGe. On the other hand, we demonstrate that for a 25%
reduction it is still possible to have enough meat and/or fish in the diet to comply with nutritional
recommendations and maintain some traditional dishes and meal patterns.
2. All diets show an increase in the consumption of legumes as sources of protein. This again is
inevitable owing to the lower GHGe of legumes relative to most other sources of protein, even if
they are imported long distances. As legumes are not costly, this may help to keep the food
budget constant or even to decrease it.
3. All diets show an increase in cereals and starchy foods, typically represented by increases in
bread, pasta and potatoes.
4. Consumption of dairy products remains similar to now.
2 Sustainability here relating to reducing GHGe only.

10
This first piece of research demonstrates that healthy, sustainable food choices are possible in a variety
of countries, and can be adapted to be acceptable in a variety of contexts. But it also points to further
research and analysis which should be done to make this work more precise and assist in guidance to
stakeholders. In particular we suggest:
Better GHG and life-cycle analysis (LCA) data to assist in modelling and giving precise guidance
Research into other factors that can affect the degree to which GHGe can be reduced – for
example, eating seasonal foods, and different ways of preparing food (including, for example,
the effect of this on bio-availability of nutrients). These are complex factors which our modelling
could not take into account.
Further research on the effect of such diets on supply and pricing, including how this should
affect subsidy systems for farmers. We note that there are connections between supply of items
(e.g. between meat and dairy production) which would need to be taken into account.
Consideration of minority and regional diets, or even individual diets, rather than looking at a
single sample diet for each country.
Research into the consequences of taking wider sustainability criteria (water, biodiversity) into
account.
Research into reducing GHGe in production and distribution of food.

11
GLOSSARY
ANSES French agency for food, environmental and occupational health and
safety
BEDCA Database of Spanish Food Composition
CAP Common Agricultural Policy
CPI Consumer Price Index
ENIDE National Survey of Dietary Intake [Spain]
EU European Union
FAO United Nations Food and Agriculture Organisation
FBDG Food-based dietary guidelines
GHGs Greenhouse gases
GHGe Greenhouse gas emissions
HBS Household budget survey
HLCWG How Low Can We Go? Report
INCA Individual and National Survey on Food Consumption [France]
LCA Life cycle analysis
PNNS National Health and Nutrition Programme [France]
RDA Recommended daily allowance
RDC Regional distribution centre
SIK Swedish Institute for Food and Biotechnology
SNO Swedish nutritional recommendations objectified
SNR Swedish nutritional recommendations

12
INTRODUCTION
This report has a number of audiences. On the one hand, this is a research project and we wish to give
full details of the methodology and assumptions made. On the other hand many people will be more
interested in the diet for a particular country and how it compares with what they or others eat now. To
cater for both audiences, the report is divided into the following sections:
1. Background and research questions. This explains the background to the project, including
the Livewell UK project, and the key questions which we have sought to answer.
2. Methodology. This explains the general approach we used and the ways in which we adapted
data for the purposes of dietary modelling.
3. The LiveWell diet. This gives a diet for each country based on a 25% reduction in GHGe. For
each diet we show the list of ingredients (compared against current consumption) and a sample
menu. We compare nutritional data against average consumption and national nutritional
recommendations, and look at how the LiveWell diet affects consumption of different food
groups.
4. Analysis. This section gives greater detail on the assumptions made and the ways we
approached data in different countries, including some specific national issues.
5. Conclusions. These include answers to the key research questions and ideas for further
research.
The report has the following annexes for reference:
1. Extreme diets – maximum possible GHGe reductions
2. Detailed methodology for collating data
3. Sensitivity analysis
4. National nutritional recommendations (from Task 1)
5. Project brief
6. References

13
1. BACKGROUND AND RESEARCH QUESTIONS
1.1 WWF’s One Planet Food programme and the Livewell diet for the UK
WWF-UK’s One Planet Food programme, which runs from 2009 to 2015, aims to reduce the
environmental and social impacts of UK food consumption and production. Its goals are to:
reduce GHGe resulting from the production and consumption of food destined for the UK by
70% based on 1990 levels
ensure that water use in the production and consumption of food destined for the UK has no
unacceptable socio-economic or environmental impacts
change trading patterns and governance structures so that UK food is making a net positive
contribution to WWF’s priority places for biodiversity, such as the Amazon.
The concept of a ‘sustainable diet’ has stimulated debate about how changes in the UK diet may go
some way towards achieving these goals. Any work on diet needs to look beyond the environment and
include the potential benefits to health, society, the economy and developing countries.
In 2010-11, WWF-UK commissioned the Rowett Institute of Nutrition and Health at Aberdeen University
to define a diet with lower GHGe and produce the Livewell plate. This work was framed by three
questions:
1. What does the average UK consumer eat and what would change if we were to follow government
recommendations for a healthy, balanced diet, as outlined by the Eatwell plate3?
2. What would be the sustainability benefits of following the Eatwell plate guidance, and would the
plate need to be modified to include sustainability criteria?
3. What would be the key principles of a sustainable diet?
3 The Eatwell plate represents the UK government’s dietary guidelines in the form of a plate showing recommended consumption of
different food groups (fruit and vegetables; bread, rice, potatoes, pasta and other starchy foods; milk and dairy foods; meat, fish, eggs and
beans; foods and drinks high in fat and/or sugar).

14
The UK Livewell project aimed to create a seven-day diet with significantly lower GHGe than the
average UK diet, while also meeting dietary requirements for health.
Linear programming was used to construct a sample diet that minimised GHGe while still meeting food,
energy and nutrient requirements for an adult woman in the UK. Nutrient composition and GHGe data
for 82 food items were used. To ensure a realistic variety and balance of food items, the model placed
consumer acceptability constraints on the amount of each food group included in the diet.
A seven-day sample diet was created that met dietary requirements and achieved a significant
reduction in GHGe. It was possible to incorporate a wide variety of food without eliminating any food
groups (e.g. meat, dairy products) but the quantities of some foods were reduced compared to the
current diet. The retail cost of the diet was comparable to the average UK expenditure on food.
The Livewell study for the UK illustrated that many of the principles of a healthy diet are consistent with
the dietary changes needed to reduce GHGe to tackle climate change. Individual food groups do not
need to be eliminated, but the range and quantities of food need to be rebalanced to benefit health and
the environment.
1.2 LiveWell for low impact food in Europe (LIFE)
The LiveWell for LIFE project uses the LiveWell Plate to define country-specific sustainable diets across
the EU. As the food system produces considerable GHGe, moving towards sustainable diets across the
EU would make an important contribution to keeping global warming below 2°C. The project examines
the feasibility of EU-wide introduction of the LiveWell Plate by testing and evaluating the tool in three
pilot EU member states – Sweden, Spain and France. These countries have been chosen due to the
range of dietary contexts they represent and the different levels of policy readiness for adopting the
sustainable diets concept.
Monitoring and evaluation (M&E) of the LiveWell Plate and of the methodology used for its application
will be embedded in all demonstration actions. Establishing and developing the European network of
food stakeholders is a key component of the project, essential to its longer term impact. The ultimate
aim of the LiveWell for LIFE programme is to help create a conducive policy environment and influence
European legislation by developing policy pathways and disseminating this widely across the EU.
The Livewell 2020 Plate produced for the UK sets out a diet that will reduce GHGe from the UK food
supply chain by 25% (based on 1990 levels) by 2020. The LiveWell Plates developed for the pilot

15
countries (France, Spain and Sweden) would provide the same 25% reduction in GHGe from these
countries’ food chains by 2020. As the pilot countries are large food producers this will contribute
significantly towards the European Commission’s overall target of a 20% reduction in overall GHGe by
2020.
The project brief is shown in Annex 5.
1.3 Key research questions
In using this report it is important to keep in mind that:
The work addresses all three countries separately.
Sustainable refers only to GHGe: specifically, reduction from present levels of emissions from
the average diet unless an alternative figure is given.
Economic refers to estimated costs of the diet: specifically, reduction from the estimated
costs of the average diet unless an alternative figure is given.
Minimising change means that the diet is as close to the current average diet as is possible
(we consider how to define this later).
Viable change of diet means that the change in diet is one which is acceptable to most
consumers (we consider how to define this later).
In order to make the research specific, we defined a set of research questions. These are as follows:
A. Can a healthy diet be environmentally sustainable?
Is it possible to comply with national health guidelines while reducing GHGe?
Most health guidelines include a reduction in meat consumption. Meat is the major source of GHGe
from food: UK figures show meat, dairy and eggs account for around one-third of the diet in terms of
energy, and two-thirds of production GHGe. However, not all dietary guidelines explicitly advise
reductions in meat consumption. In particular, the French dietary guidelines advise the consumption of
one to two (at least one, two maximum) portions of meat, fish, poultry or egg per day. Unlike in the UK
and US guidelines, nuts and legumes are not included in this group of “protein-rich” foods.

16
In addition, healthy diets may have high GHGe (e.g. living on exotic fruit and vegetables, higher
quantities of white meat and fish). Our model needs to demonstrate that this is not the case with the
proposed diet.
B. Can a diet be healthy, economic and respect the environment?
Previous studies have shown that it is difficult to eat healthily on a low budget, but that it is possible by
selecting foods with a high ratio of nutritional quality to price (see reference 3). In this study, we identify
food choices that reconcile healthy eating with cost-conscious household budgeting, while reducing
environmental impacts from the food system. In making this static analysis we do not consider the
effects of supply and demand if the whole population adopts a different diet (e.g. changing prices of
foods due to demand and availability of subsidies). Pricing and the market for food is a complex subject
which is beyond the scope of this report.
C. What is the lowest level of GHGe that may be reached while fulfilling nutritional
recommendations and not increasing diet cost?
What diet would most reduce GHGe while following health guidelines and not increasing costs?
Although cheap, such a diet would be likely to be unappealing to most consumers, having a limited
variety of foods and being a long distance from current diets. Nonetheless, we seek to identify this as a
benchmark to show the limits of minimising GHGe through food choices in the current environment.
D. What would be a healthy sustainable diet which reduces GHGe by 25% and minimises change
from the current diet?
This is a major part of the work and results in a recommended distribution of foods as the LiveWell plate
for each country.
E. What are the general implications?
As this is a first piece of research, we also review briefly further issues and indicate trends and need for
further research.
Defining minimising change
This clearly caused some difficulties for the original LiveWell plate, as representing objective change
from the current diet is not simple. We created upper and lower bounds based on factors including

17
popularity of foodstuffs (not excluding the most popular items), portion sizes (avoiding small amounts of
items which can only be bought as units), cultural preferences (potatoes vs. pasta vs. rice as a source
of carbohydrate), avoiding introducing large amounts of currently unpopular foods, and ensuring variety.
We used two approaches for balancing acceptability with other factors. For France, minimisation of the
change from current food intake patterns was conducted following a previously described methodology
(see references 7 and 12), and only limited additional bounds were then imposed. For Spain and
Sweden, we used more general bounds based on popularity and minimum portion sizes and then
imposed additional constraints based on discussion with dieticians in order to produce an acceptable
menu.
1.4 Literature review
There is an increasing amount of evidence for the need to look at food consumption and a sustainable
diet. This comes from a variety of international bodies from the United Nations Food and Agricultural
Organisation (FAO) to the Royal Society and the World Health Organisation (WHO). Though the subject
is still reasonably new, there is a growing body of evidence defining what a sustainable diet should look
like. The concept of sustainable eating combines healthy food with environmentally friendly food; they
are seen as complementary, not separate entities. In 2010, the FAO defined a sustainable diet as:4
…those diets with low environmental impacts which contribute to food and nutrition security and
to healthy life for present and future generations. Sustainable diets are protective and respectful
of biodiversity and ecosystems, culturally acceptable, accessible, economically fair and
affordable; nutritionally adequate, safe and healthy; while optimizing natural and human
resources.
According to the United Nations Environment Programme (UNEP) an increasing population, coupled
with the increased purchasing power of Asia and Africa’s middle classes, an urbanising world and the
increased prevalence of Western diets and lifestyles, means the demand for natural resources is
accelerating at an unparalleled rate. A “business as usual” scenario will result in a tripling of annual
resource extraction by 2050. This is neither sustainable nor feasible. One of the key drivers of resource
use is an increased demand for resource-intensive foods such as livestock products.
4 FAO. 2012. Sustainable Diets and Biodiversity; Directions and Solutions for Policy, Research and Action. Available at:
www.fao.org/docrep/016/i3004e/i3004e.pdf [Accessed 13 January 2013]

18
A 2012 report by Professor John Beddington for CGIAR recognises that the food system has to
“reshape food access and consumption patterns to ensure basic nutritional needs are met and to foster
healthy and sustainable eating patterns worldwide”.5
European food consumption and production is estimated to account for 20-30% of the EU’s total
environmental impact. In September 2011, the European Commission (EC) presented its Roadmap to a
Resource Efficient Europe, expressing a vision of a European economy in 2050 that respects resource
constraints and planetary boundaries. The roadmap sets out milestones for 2020 and a broad range of
EC and member-state actions to reach them. One of the three key economic sectors identified as being
a barrier for meeting the 2020 milestones is food. The 2020 milestone is defined as follows:
By 2020, incentives to healthier and more sustainable food production and consumption will be
widespread and will have driven a 20% reduction in the food chain’s resource inputs. Disposal of
edible food waste should have been halved in the EU.6
According to the Royal Society7 the food system is one of the main drivers of environmental
degradation. Their solution focuses on consumption: “In the short term it is of utmost urgency to reduce
consumption and emissions that are already causing damage, for example greenhouse gases,
deforestation and land use change.”
The call to look at food consumption and work towards sustainable diets has come from, among others,
the EU8 , CGIAR, the Foresight report,9 the Royal Society, the World Bank,10 Forum for the Future11 and
5 Beddington J, Asaduzzaman M, Fernandez A, Clark M, Guillou M, Jahn M, Erda L, Mamo
T, Van Bo N, Nobre CA, Scholes R, Sharma R and J Wakhungu. 2011. Achieving food security in the face of climate change: Summary for
policy makers from the Commission on Sustainable Agriculture and Climate Change. CGIAR Research Program on Climate Change,
Agriculture and Food Security (CCAFS). Copenhagen, Denmark. Available at: www.ccafs.cgiar.org/commission [Accessed 13 January 2013]
6 ec.europa.eu/environment/resource_efficiency/index_en.htm
7 The Royal Society. 2012. People and Planet. The Royal Society Policy Centre report 01/12
8 www.eea.europa.eu/soer
9webarchive.nationalarchives.gov.uk/+/http://www.bis.gov.uk/foresight/our-work/projects/current-projects/global-food-and-farming-futures
10 World Bank. 2007. World Development Report 2008: Agriculture for Development. World Bank, Washington DC.
11www.forumforthefuture.org/sites/default/files/images/GreenFutures/Tomorrows_food_and_farms/TFTF.pdf

19
Prince Charles’s International Sustainability Unit.12 Even the recent Environment Outlook report from
the OECD,13 says we need to tackle meat consumption. Many health bodies have a similar message,
including the WHO, the Scientific Advisory Committee on Nutrition and the World Cancer Research
Fund. A WHO technical report14 states:
For the large majority of people in the world, particularly in developing countries, livestock
products remain a desired food for nutritional value and taste. Excessive consumption of animal
products in some countries and social classes can, however, lead to excessive intakes of fat.
The growing demand for livestock products is likely to have an undesirable impact on the
environment. For example, there will be more large-scale, industrial production, often located
close to urban centres, which brings with it a range of environmental and public health risks.
Various specialists within WWF’s global network have independently highlighted the need to look at
diets and livestock product consumption as key to meeting conservation goals. In order to achieve
WWF’s target of zero net deforestation by 2020, dietary shift is needed, with many parts of the world
needing to eat less meat (for global diets to be more equitable, sub-Saharan Africa and South Asia
should see a per capita increase).15 In the 2010 Living Planet Report, the need to reduce meat
consumption is clearly recognised.16 The Energy Report (2011) shows that WWF’s vision of 100%
renewable energy by 2050 is achievable only if Western diets become less resource intensive.17 In
2009, WWF-UK produced How low can we go?.18 This looked at the role of the food system in meeting
the UK government’s 2050 carbon targets. This concluded that, while production and technological
changes are vital, targets will not be met without a change in food consumption patterns and defining a
sustainable diet is going to be key.
12
www.pcfisu.org/reports
13 www.oecd.org/document/11/0,3746,en_2649_37465_49036555_1_1_1_37465,00.html
14 WHO/FAO. 2002. Diet, nutrition and the prevention of chronic diseases: report of a joint WHO/FAO expert consultation, Geneva, 28 January
– 1 February 2002. WHO technical report series, 916. Geneva, Switzerland.
15 wwf.panda.org/what_we_do/how_we_work/conservation/forests/zeronetdeforestation
16 wwf.panda.org/lpr
17wwf.panda.org/energyreport
18 wwf.org.uk/what_we_do/changing_the_way_we_live/food/food_publications_library.cfm?3678/How-low-can-we-go

20
There have been important strides towards defining a sustainable diet. WWF’s LiveWell plate outlines
guidance for achieving a varied and nutritionally balanced diet that would also meet UK GHGe targets.
The FAO has spoken about the need to change consumption for many years, notably in Livestock’s
Long Shadow19. Its 2012 publication Sustainable Diets and Biodiversity20 states:
Sustainable diets can address the consumption of foods with lower water and carbon footprints,
promote the use of food biodiversity, including traditional and local foods, with their many
nutritionally rich species and varieties. The sustainable diets approach will contribute in the
capturing efficiencies through the ecosystem approach throughout the food chain. Sustainable
diets can also contribute to the transition to nutrition-sensitive and climate-smart agriculture and
nutrition-driven food systems.
The Barilla Centre for Food and Nutrition has created the ‘double pyramid’: the familiar food pyramid (a
balanced, healthy diet) and an environmental food pyramid.21 The latter, placed alongside the food
pyramid, is shown upside-down: foods with higher environmental impact are at the top and those with
reduced impact are at the bottom. From this double pyramid it can be seen that those foods with higher
recommended consumption levels are also those with lower environmental impact. This illustrates the
connection between two different but highly relevant goals: health and environmental protection.
European governments have also recognised the need to work on sustainable diets. In 2011 the health
council of the Netherlands produced “Guidelines for a healthy diet: the ecological perspective”22. It
recognised the mutual benefits of a healthy, environmentally friendly diet for its citizens and the planet.
Its two win-win guidelines are:
A less animal-based and more plant-based diet, containing fewer meat and dairy products and
more wholegrain products, legumes, vegetables, fruit and plant-derived meat substitutes. This
dietary pattern is associated with a lowered risk of cardiovascular disease and also has a
19
FAO. 2006. Livestock’s Long Shadow. FAO, Rome, Italy.
20 FAO. 2012. Sustainable Diets and Biodiversity; Directions and Solutions for Policy, Research and Action.
www.fao.org/docrep/016/i3004e/i3004e.pdf
21 Barilla Center for Food and Nutrition. 2011. 2011 Double Pyramid: Healthy food for people, sustainable for the planet.
http://www.barillacfn.com/wp-content/uploads/2010/06/pp_doppia_piramide_alimentazione_eng.pdf
22 Health Council of the Netherlands. 2011. Guidelines for a healthy diet: the ecological perspective. Publication no. 2011/08E. Health Council
of the Netherlands, The Hague

21
smaller ecological impact. From a health perspective it is not necessary to avoid meat and dairy
products entirely; nor does this appear to be necessary from an ecological perspective.
The reduction of energy intake for those with an excessive body weight, in particular by eating
fewer non-basic foods, such as sugary drinks, sweets, cakes and snacks. A healthy body weight
is associated with a reduced risk of diabetes, cardiovascular disease, and certain forms of
cancer. Lower energy intakes also reduce the demand for foods, which lowers production and
consequently reduces the ecological impact.
In 2009, in Sweden the National Food Administration and Swedish Food Environmental Protection
Agency (EPA) produced its environmentally friendly food choices (since withdrawn with a change in
government). These highlighted the need to reduce meat and rice consumption, amongst other thing,
and were the first of their kind.23
Successive UK governments have recognised the need to define and work on sustainable diets. There
have been three key reports from government: Food Matters (2008)24, Food 203025 and the Green Food
Project (2011-12)26, which commits the government to bring together stakeholders to work on defining a
sustainable diet. Unfortunately, the reports have not been followed up or have been scrapped after a
change of government.
There is a growing body of independent evidence and research around the impacts of current
consumption patterns on health, the planet, society and the economy. We are no longer eating the
same food as we were 50 years ago. These changes have occurred as we have changed our farming
practices. We cook less, eat less as a family, and are eating more meat and processed foods than at
any other time. This is clearly demonstrated in the report Protein Puzzle27 which examines how
European diets have changed significantly over the last 50 years, including higher intakes of meat,
dairy, eggs and fish. These higher intakes have been accommodated by new agricultural production
23
www.slv.se/upload/dokument/miljo/livsmedelsverkets_%20miljosmarta_matval_till_EU.pdf
24webarchive.nationalarchives.gov.uk/+/http://www.cabinetoffice.gov.uk/media/cabinetoffice/strategy/assets/food/food_matters1.pdf
25 archive.defra.gov.uk/foodfarm/food/pdf/food2030strategy.pdf
26 www.defra.gov.uk/publications/2012/07/10/pb13794-green-food-project
27 Westhoek, H et al. 2011. The Protein Puzzle. PBL Netherlands Environmental
Assessment Agency, The Hague

22
techniques, which have made food cheaper. The increased production and the techniques deployed
have also aggravated a number of environmental impacts including effects on biodiversity, animal
health and welfare and emissions of GHGs and reactive nitrogen.
Globally between 1969 and 2005 food consumption has increased on average by 360 kcal per person
per day – a 15% increase.28 The increase in global food consumption has not been equal. In sub-
Saharan Africa, the per capita supply of calories has remained about the same,29 but hunger has
increased among the poorest, as has food-related ill health among the middle classes.
Global demand changes rapidly as countries become wealthier and people can afford more varied
diets, and move to more meat, dairy and fish. Fish consumption, for example, increased from 9.9 kg per
year in the 1960s to 17 kg per capita in 2010.30 The consequences of this development are naturally not
equally distributed; whereas fish consumption increases in wealthier countries some fisheries are
seriously depleted and communities lose their main source of protein. In the developed world people
are eating a narrower variety of ingredients and more homogenised diets. Future trends in food will
depend on demand, driven by dietary preferences, marketing, market value and availability.
Finally the thinking around sustainable diets examines how sustainable diets can benefit our children.
The report Healthy and sustainable diets in the Early Years by Susan Westland and Helen Crawley31
discusses the need to ensure our diets are sustainable throughout the generations and to emphasise
environmental constraints, as it is today’s children who will feel the effects of the current system. Poor
nutrition affects school performance, economic productivity and earning power in adult life, and this has
increased costs on society both directly and from loss of ability to contribute fully to society, economic
growth and taxes.
As we can see, the idea of working on consumption and sustainable diets is widely endorsed by a
myriad of independent global and national bodies and scientists. Sustainable diets are a key part of a
food system that addresses food security, inequality, poor health and planet-friendly agriculture.
28
Foresight. 2011. Synthesis Report C1:Trends in food demand and production. Global Food and Farming Futures, UK government
29 WHO. 2003. Diet, nutrition and the prevention of chronic diseases. Technical report series 916, WHO, Geneva, Switzerland.
30 FAO. 2010. The state of the world fisheries and aquaculture 2010. FAO, Rome, Italy.
31 Westland S and Crawley H. 2012. Healthy Sustainable Diets in the Early Years. Implications of current thinking on healthy, sustainable diets
for the food and nutrition intakes of children under 5 in the UK. www.firststepsnutrition.org/pdfs/sustainability.pdf

23
2. METHODOLOGY
2.1 General approach
Our general approach followed the methodology developed by Livewell UK. This had three stages, as
follows:
1. Collation of relevant data
2. Production of a model, including creation of appropriate constraints
The sources for data and detailed approaches differ for each country and are explained in the analysis
section. However, we used a basic approach described below.
2.1.1 Collation of data
The following data was gathered:
1. Dietary data – showing an average diet for the country and, if possible indications of popularity of
particular items (percentage of the population eating a particular food item, including average
consumption and standard deviation). The data was produced as a separate contract (“Task 1”)
and we did not need to supplement this.
2. Information on national nutritional recommendations – again this was provided by Task 1 and we
did not need to supplement it. However, we note that for some trace elements (e.g. iodine)
nutritional data can be unreliable so we considered carefully which items should be part of the
model. National nutritional recommendations (provided by Task 1) are presented in annex 4.
3. National nutritional data – again provided by Task 1. This required a certain amount of processing
because there was not data for all items, so we had to use substituted data from other countries,
or in some cases there was missing data on particular nutrients. In addition, we had to estimate
wider categories (for example “fish” in the Swedish dietary survey) based on other information
regarding composition or derivation. Additional processing and merging databases was a
particular issue for Spain owing to the wide range of specific foods identified in the dietary survey.

24
4. GHGe data – for this we tried where possible to use GHGe/LCA data from studies conducted for
the particular country. Where this was not possible we used data from countries with the most
similar GHGe patterns where possible (for example, UK in preference to France for Sweden,
France in preference to UK for Spain). When using UK data (specifically HLCWG data)
consideration was given to different trading patterns in estimating GHGe. Where there were
several studies showing data for different stages of the life cycle (regional distribution centre
(RDC), retail, final consumer), multiplications were made to ensure consistency between the
figures. The result is a set of GHGe figures where the relative values are more reliable than the
absolute values. For Sweden the figures estimate the GHGe for the full cycle to the consumer,
whereas for France and Spain figures are to retail; it seemed unnecessary to estimate an
additional multiplication factor which would not affect the relative values. Finally, for highly
processed items where there was no national data, we used data presented by Eat England,
based on UK experience, since in a global market place such goods are likely to have a similar
profile across Europe, certainly in terms of relative values.
5. Price data – for France we were able to access detailed price data, but for Sweden and Spain we
used a more general approach. For these two countries we did not have comprehensive price
data, even though there was some detailed data on a limited range of products (generally from
official statistics used to calculate consumer price inflation). We therefore used a combination of
methods, making an overall estimate based on statistics from the household budget survey (HBS)
for each country, which shows the amount households spend on different groups of foods. We
then fine-tuned this to make sure that relative prices were valid by taking absolute figures from
official statistics and checking online supermarket websites. This may create some averaging
effects, but in other respects avoids problems, for example through examining figures at a
particular time for seasonal foods.
6. Information on food-based dietary guidelines – in general these categorisations, provided by Task
1, are very broad and not completely quantified (for example, the Swedish recommendation is to
have at least one item from each group in the “food circle” each day32). This data was therefore
used for reporting rather than modelling.
32
Please see Food patterns and dietary recommendations in Spain, France and Sweden, a report previously released by the project that
investigated the eating behaviours in Spain, France and Sweden – the project’s pilot countries. It compares these findings to what the people

25
2.1.2 Modelling
The task of optimisation can be formulated as a simple linear programming model which we then
processed electronically, either through the Rglpk package (Sweden and Spain) or by using Solver in
Excel (France). Rglpk is faster and more versatile regarding data manipulation, whereas Solver allows
more flexibility in developing constraints.
The problem can be articulated as being to find the values of a set of variables (amounts consumed of
individual foodstuffs) which optimises an output (minimum GHGe) subject to a number of constraints
(minimum nutrient requirements, and others) and boundaries on particular variables (due to
acceptability, portion sizes etc.).
Owing to the availability and quality of data, modelling worked slightly differently in France, compared to
the other two countries. We imposed the current French dietary guidelines strictly. These are expressed
as consumption frequencies of defined portion sizes of some categories and therefore can be readily
translated into daily quantities. This is not the case for Spain and Sweden.
For the purpose of making a clear model for Sweden and Spain, where dietary guidelines are more
qualitative, we used the following approach:
1. The definition of different foodstuffs used was the same as that used in the national dietary
survey, in order to maintain comparability with current consumption.
2. Nutritional constraints were defined for key nutrients in the national nutritional recommendations
where there was adequate data. For France, we used the nutrients used as constraints in the
LiveWell UK report and then checked for other nutrients in the final diet. For Sweden and Spain,
we used different selections of nutrients based on availability of data, though ensuring we
included those that were expected to be key binding constraints (for example iron and zinc).
3. Overall acceptability constraints were defined by requiring that amounts consumed in particular
food groups should be at least 60-80% of the current average consumption. Food groups were
defined differently for different countries – for Sweden we used the food circle recommendations;
for Spain, we used the wider categories used in the dietary survey as a guideline.
in these countries should be eating, according to their national dietary guidelines. http://www.livewellforlife.eu/wp-
content/uploads/2012/05/LiveWell_A4-Food-Patterns-Report_web.pdf
26
4. Bounds were set for a number of reasons, in order to produce an acceptable model (see further
discussion on acceptability below). Setting of bounds is discussed in more detail for individual
countries.
We ran the model to produce two outputs:
1. Optimising GHGe based only on nutritional recommendations and currently consumed foodstuffs
2. Ensuring a target of 25% reduction in GHGe subject to constraints and bounds set to ensure
maximum acceptability.
For the second output, for Spain and Sweden we ran the model to optimise for GHGe and imposed
successively tighter acceptability bounds until the reduction was only 25%. For France, we minimised
total departure from the mean observed consumption of food in the French population, subject to
nutritional constraints (both nutrient-based and food-based) and to 25% GHGe reduction, as previously
described (reference 12). However, this method requires precise data on the food intakes observed in
the target population. In addition, such an objective function does not fully guarantee that the modelled
diet will be acceptable, particularly because:
1. It is difficult to encapsulate how different foodstuffs go together in a particular national diet (need
for milk with breakfast cereal, butter/margarine with bread etc.)
2. Different sources of particular nutrients can make small differences to GHGe but the result may
not be culturally acceptable. The trade-offs here are difficult to work through. For example, the
basic model would suggest that in Sweden the diet could be more sustainable by eating pasta
rather than potatoes. What is more important for acceptability: to eat potatoes rather than pasta,
or to be able to eat slightly more meat?
3. Inevitably, any model will produce strange amounts of some minority foodstuffs which are difficult
to integrate into a “normal” weekly menu – for example, more than 200g strawberry jam.
For France, we designed only one modelled diet that fulfilled the nutritional constraints subject to 25%
GHGe reduction, acceptability constraints (on particular portion sizes for each food) and minimal
departure from the average diet. For Spain and Sweden, we used linear programming to examine a
variety of scenarios and to make some analysis of the effect of different assumptions not only on GHGe,
but also on variety and composition of the diet.

27
3. LIVEWELL DIET
3.1 General
3.1.1 Introduction
In this section we present a LiveWell diet for each country: that is, a possible diet which is as acceptable
as possible, reduces GHGe by 25% from the current average diet, costs no more than now, and
complies with national nutritional recommendations.
For each country diet we show:
1. Nutritional data against average consumption and national nutritional recommendations
2. A comparison of consumption of different food groups between current consumption, the
LiveWell diet, and a diet with the maximum reduction in GHGe possible through choice of foods.
In all analysis we have ignored the effect of alcohol and drinks33 since this was too complex for the
model.
Presenting our findings against public dietary recommendations proved to be difficult, since many such
recommendations are qualitative. Instead, we used these to determine the categories of foods for
reporting and show how the breakdown changes.
3.1.2 Comparing the three countries
There is an inevitable temptation to compare the LiveWell diets in the three countries and to derive
conclusions form this. Who has the most sustainable diet? Why does people in one country eat more
fruit than another? Why does another have more meat in the diet?
However, comparing the three countries can be invidious and can easily become a comparison of
cuisine and eating habits, rather than a question of balancing health, cost and sustainability. We urge
caution in terms of comparisons for a number of reasons:
33
Except for fruit juices, milk, and a single cola drink.

28
1. We have tried to develop the diets with national acceptability in mind and the cuisine of the three
countries is quite different. So we have more potatoes in Sweden and more pasta in Spain – but
this is more a matter of preference than a critical difference in the diet and its sustainability or
nutritional content. In the same way, whether there is a mixture of different types of meat or just a
few in larger quantities is partly dependent on the ease of manufacturing a menu from the results
of our modelling.
2. The models work with slightly different data. In particular, the French model was produced with
women-only data (as with the original Livewell UK), but because of availability of data, Spain and
Sweden are presented for an “average” person. Nutritional recommendations are averaged
accordingly where they are different for men and women.
3. Nutritional recommendations (see annex 4) vary considerably between countries. We have sought
to strictly comply with nutritional recommendations, so these affect the foods selected. Running a
model for Spain with Swedish nutritional recommendations would inevitably produce a different
LiveWell Plate.
4. The degree to which food-based dietary guidelines are used as a constraint varies between
countries. For France, we interpreted the principles and used these within the model. For Sweden,
the general principle of variety within the food circle was used, keeping variety similar to that of
the current diet. For Spain, food-based dietary guidelines were found to be too difficult to quantify
so constraints were chiefly based on acceptability criteria.
5. Absolute figures are not comparable. We spent time adjusting the data (particularly the carbon
data, but also for cost) for Sweden and Spain so that the figures are consistent (i.e. relative values
are defensible) since the selection of foods and quantities in the model is based on relative
values, not absolute ones. For GHGe figures, for Sweden we used an estimate of the figure for
the life cycle to the consumer whereas for France and Spain the figure used is only to retail.
6. As the detail comes from dietary surveys, the number of foods in the model varies between
countries (68 for France, 277 for Spain, and 88 for Sweden). This gives different opportunities for
developing different diets: with a greater number of more detailed foods it is possible to produce a
wider range of solutions.

29
3.1.3 Common features
A number of overall similarities between these nutritious low GHGe diets can be observed:
1. All diets show a reduction in the total amount of meat consumed. This is inevitable since these
are the foods with the highest GHGe. On the other hand, we demonstrate that for a 25%
reduction it is still possible to have enough meat and/or fish in the diet to comply with nutritional
recommendations and to maintain some traditional dishes and meal patterns.
2. All diets show an increase in the consumption of legumes as sources of protein. This again is
inevitable owing to the lower GHGe of legumes relative to most other sources of protein, even if
they are imported long distances. . As legumes are not costly, this may help to keep the food
budget constant or even to decrease it.
3. All diets show an increase in cereals and starchy foods, typically represented by increases in
bread, pasta and potatoes.
4. Consumption of dairy products remains relatively similar to now.
Different assumptions about an acceptable diet would produce different diets – for example, it would be
possible to run the model excluding meat altogether for vegetarians. Nonetheless we can make the
following additional points:
1. Reducing GHGe by 25% while maintaining relatively recognisable meal patterns and composition
is possible. We note any significant changes for each country, but there is generally enough
flexibility to cater for this. At least half the meals in the week are “normal”, though there may be
less meat or changes in proportion of different items.
2. All LiveWell diets strictly comply with national nutritional requirements. However, requirements for
some items vary quite widely between countries: in particular, for Spain, the figures for zinc and
iron are relatively high. It may be possible to produce a more acceptable diet if these constraints
are partially relaxed.

30
3.2 LiveWell for each country
3.2.1 France
Amounts of food selected by the LiveWell model:
Food items EPIC food groups Average intake, g/day Amount in the
LiveWell diet, g/day
Potato chips, salted 1 1.49 0.0
Scalloped potatoes 1 7.47 7.5
Boiled potato 1 33.10 33.1
Fried potato (frozen) 1 8.99 9.0
Potato salad 1 4.95 5.0
Raw carrot 2 19.08 19.1
Raw endive 2 5.33 5.3
Canned green beans,
drained
2 21.25 71.1
Cooked onion 2 4.26 4.3
Green salad without
dressing
2 26.86 26.9
Raw tomatoes 2 55.75 55.8
Tomato Provençal 2 8.68 8.7
Lentils, cooked 3 8.79 150.0
Fresh banana 4 20.86 20.9

31
Clementine 4 22.67 60.5
Stewed apple 4 13.91 13.9
Walnuts 4 0.67 4.7
Fresh orange 4 16.02 16.0
Fresh unpeeled apple 4 87.22 80.0
French cheese
(Camembert)
5 7.86 30.0
Low-fat cream 5 1.48 0.0
High-fat cream 5 2.67 0.0
Cream cheese, 20% fat 5 10.44 10.4
Gruyère cheese 5 6.37 13.5
UHT semi-skimmed milk 5 143.23 143.2
Yogurt with fruit 5 13.92 13.9
Yogurt 5 26.33 26.3
Appetizer cracker biscuit 6 1.23 0.0
Bread, baguette 6 72.81 72.8
Bread, wholegrain 6 7.24 99.5
Cooked pasta 6 41.27 41.3
Cooked white rice 6 23.41 23.4
Grilled lamb chops 7 3.72 0.0
Turkey 7 11.51 7.6

32
Cooked ham 7 23.38 7.0
Grilled bacon 7 3.31 0.0
Roasted chicken 7 24.24 7.7
Dried sausage 7 3.27 0.0
Ground beef, 15% fat 7 24.62 24.6
Baked cod 8 2.89 0.0
Shrimp, cooked 8 3.42 0.0
Hake, cooked 8 5.26 0.0
Sardines canned in oil,
drained
8 1.00 29.0
Steamed salmon 8 9.63 0.0
Raw smoked salmon 8 1.75 0.0
Canned tuna in brine,
drained
8 5.88 0.0
Boiled egg 9 14.45 14.5
Unsalted butter 10 16.11 0.0
Olive oil 10 9.56 10.0
Sunflower oil 10 3.87 10.0
Honey 11 8.32 8.3
White sugar 11 23.36 7.6
Processed cake 12 12.62 0.0

33
(brioche)
Chocolate bread (pain
au chocolat)
12 14.47 14.5
Fruit tart (processed) 12 39.20 0.0
Orange juice
(pasteurised)
13 64.04 0.0
Cola drink 13 59.21 59.2
Low-fat margarine 15 14.11 0.0
Vegetable soup
(processed)
16 17.70 17.7
Vegetable soup, home-
made
16 60.00 60.0
Cassoulet (canned) 17 11.34 11.3
Cheeseburger 17 6.34 0.0
Pizza 17 14.94 0.8
Fried breaded fish 17 11.07 0.0
Quiche Lorraine 17 13.59 13.6
Meat ravioli with
tomato(canned)
17 16.11 16.1
Tabbouleh 17 9.96 10.0
Stuffed tomato 17 13.76 13.8

34
Dietary and nutrient recommendations for French women used in the model and nutrient intake from the
LiveWell diet:
Average observed Targets LiveWell diet
Total amount, g/day 1304 - 1410
GHGe 3478 <2609 2609
Cost, euros/day 4.9 - 4.36
Nutrients
Energy, kcal 1814 1800 1800
Proteins, g 68 >50 79.5
Carbohydrates, g 202 225-337
(50%-75%)
225.0
(50%)
Fibre, g 14 >25 26.3
Lipids, g 81 <70
(<35%)
63.4
(32%)
Saturated fatty acid, g 32 <20
(<10%)
20.0
(9.9%)
Sodium, mg 2053 <2365 2365
Calcium, mg 581 >900 927
Iron, mg 8 >14 14
Zinc, mg 7 >10 10

35
Vitamin B12, mg 3 >2.4 5.5
Vitamin B9, mg 188 >300 300
Added sugar, g 39 <45
(<10%)
18.6
(2.6%)
Food groups
Fruit and vegetables 4.52 >5 5.4
Fruit juice 0.32 <1 0.0
Nuts 0.03 <1 0.2
Grains 2.21 >3 4.7
Dairy products 2.06 3 3
Meat, fish, eggs 1.48 1-2 1.0
Fish 0.30 >0.29 0.29
Fat 4.37 <3.5 2.0
Olive oil 0.96 >1 1
Sunflower oil 0.39 >1 1
Sweets products 4.24 <2 1.9
Sugar 3.17 <2 1.6
Drinks 0.30 <1 0.3

36
Since nutrient recommendations were used only for those included in the original Livewell UK research,
we also show the results for some other key nutrients:
Nutrients not included
in the model
Observed intake Target LiveWell diet
Magnesium, mg 182.8 360 249.8
Phosphorus, mg 944.6 750 1395.7
Potassium, mg 2349.8 3100 2645.1
Copper, mg 0.8 1.5 1.3
Selenium, mcg 41.3 50 36.5
Iodine, mg 82.6 150 78.8
Vitamin D, µg 2.7 3 2.8
Vitamin E, mg 11.0 12 11.7
Vitamin C, mg 87.6 110 82.1
Vitamin B1, mg 1.0 1.1 0.9
Vitamin B2, mg 1.1 1.5 1.4
Vitamin B3, mg 13.7 11 13.1
Vitamin B5, mg 3.8 5 4.8
Vitamin B6, mg 1.4 1.5 1.5

37
Comparison by food groups:
EPIC food groups Observed average,
g/day
LiveWell diet,
g/day
Deviation, g
Legumes (3) 8.8 150.0 141.2
Cereals and cereal
products (6)
146.0 237.0 91.0
Vegetables (2) 141.2 191.1 49.9
Fruits, seeds, nuts (4) 161.4 196.0 34.7
Dairy products (5) 212.3 237.4 25.1
Egg and egg products
(9)
14.5 14.5 0.0
Soups, bouillon (16) 77.7 77.7 0.0
Fish and shellfish (8) 29.8 29.0 -0.8
Potatoes and other
tubers (1)
56.0 54.5 -1.5
Fat (10) 29.6 20.0 -9.5
Condiments (15) 14.1 0.0 -14.1
Sugar and
confectionery (11)
31.7 15.9 -15.8
Miscellaneous (17) 97.1 65.6 -31.5
Meat and meat
products(7)
94.0 46.9 -47.1

38
Cakes (12) 66.3 14.5 -51.8
Non-alcoholic
beverages (13)
123.3 59.2 -64.0
As can be seen, the biggest increases are in legumes and cereals while the biggest decreases are in
meat and meat products as well as highly processed sweet foods (cakes). Consumption of dairy foods
increases but only modestly. We show this graphically on the next page.
Graphical comparison:
A: Observed diet (3478g CO2e/day) B: LiveWell diet (25% reduction in GHGe: 2609g
CO2e/day)
465
90
2090237
442
66
Fruits and vegetable
Meat, Fish, Eggs
Fat
Total sweets products
Dairy products
Grains
Mixed dishes
444
138
44157
212
211
97
Fruits and vegetable
Meat, Fish, Eggs
Fat
Total sweets products
Dairy products
Grains
Mixed dishes

39
3.2.2 Spain
The LiveWell diet for Spain shows a reduction in GHGe of approximately 27% and a cost equivalent to
that of the current diet.
The model produces the following long list of ingredients:
Category Food LiveWell diet
(g/day)
Current average
consumption
(g/ day)
Cereals Bread products: rusks,
peaks, breadsticks,
toast and similar
6.86 2.08
Brown rice 1.45 0.44
Buns, including
processed
5.17 17.23
Corn, canned 1.82 1.82
Corn and popcorn 1.91 0.58
Corn breakfast cereal 2.51 0.76
Muesli cereals 1.25 0.38
Multigrain cereal 1.32 0.40
Other cereals 5.15 1.56
Oats, wheat, other
grains
1.72 0.52
Other types of bread 19.67 5.96

40
Other types of flour 1.39 0.42
Pastal 75.00 18.76
Precooked patties or
turnovers
1.95 0.59
Rice 75.00 15.22
Wheat 20.92 6.34
Wheat breakfast cereal 2.18 0.66
White bread 100.00 8.30
White sandwich bread 86.31 77.14
Wholegrain sandwich
bread
4.13 1.25
Wholewheat bread 16.34 4.95
Drinks not including
milk
Citrus juices 23.00 23.85
Peach juice 8.81 2.67
Tomato juice 1.29 0.39
Eggs and egg products Fresh chicken eggs 46.35 30.43
Fats and oils Olive oil 23.00 23.03
Fruits and fruit products Apple 25.00 41.42
Banana 7.29 24.29
Mandarin 5.00 9.83
Melon 5.00 14.41

41
Olives 3.48 3.48
Orange 25.00 34.64
Peach 5.00 14.98
Pear 20.00 18.25
Quince 1.16 0.35
Strawberries 5.00 2.82
Watermelon 5.09 16.96
Meat and meat
products
Black pudding 5.00 1.30
Chicken 15.00 32.78
Cooked ham (York
sweet, shoulder, Lacon)
5.00 8.61
Cured ham and
shoulder
15.00 12.40
Liver 2.44 0.74
Partridge, quail 1.02 0.31
Pork 40.34 5.76
Roast turkey 3.76 1.14
Sausage, salami, fuet,
secallona
10.82 3.28
Milk, dairy and milk
substitutes
Cheese 5.00 25.41
Condensed milk 1.02 0.31

42
Curd 1.91 0.58
Milk substitutes
(almond, soy)
7.96 7.96
Other types of milk 1.39 0.42
Semi-skimmed milk 84.36 55.08
Skimmed milk 41.39 41.39
Whole milk 27.40 91.34
Whole yogurt 20.00 35.15
Miscellaneous Herbs and spices 3.83 1.16
Pasta tuna salad 1.72 0.52
Prepared sauces:
tomato Bolognese
46.22 10.27
Salt 4.51 4.51
Vinegar 5.00 2.24
Nuts and oilseeds Almonds 2.57 0.78
Hazelnuts 1.49 0.45
Mixed nuts 3.00 0.91
Peanuts 1.45 0.44
Sunflower seeds 3.80 1.15
Walnuts 3.80 1.15
Seafood products Anchovy 2.45 2.45

43
Canned sardines in oil 1.25 0.38
Canned tuna in oil,
albacore, mackerel and
other
5.00 11.36
Hake, sliced 5.00 12.22
Mackerel 1.65 0.50
Monkfish 5.00 1.45
Mussels 3.15 3.15
Sardines 11.81 3.58
Sole, megrim, plaice 5.00 4.32
Squid sepia and similar 7.85 7.85
Sugar and sugar
products
Cocoa 1.85 2.70
Nougat and marzipan 1.88 0.57
Sugar 5.00 7.04
Vegetables and
legumes
Artichoke 8.18 2.48
Asparagus 5.00 3.58
Beans (white and red
beans, broad beans)
16.67 5.05
Beetroot 1.12 0.34
Carrot 5.00 9.85
Cauliflower 5.00 2.87

44
Celery 2.44 0.74
Chard 2.99 2.99
Chickpeas 17.92 5.43
Chives 1.09 0.33
Endive 1.58 0.36
Garlic 5.00 2.60
Green beans, pods 27.36 8.29
Green peas 11.55 3.50
Leek 6.24 1.89
Lentils 22.34 6.77
Lettuce 20.00 20.72
Mushrooms and fungi 11.00 5.61
Onion 12.05 23.30
Pepper 5.00 13.55
Potato 100.00 66.48
Pumpkin 5.00 2.21
Soy 2.18 0.66
Spinach 5.00 4.42
Tomato 60.00 55.60
Watercress and corn
salad
1.95 0.59

45
Zucchini 5.00 6.25

46
The graph below shows the major changes by food item:
A nutritional comparison reveals the following:

47
Average consumption LiveWell diet National nutritional
recommendation
Energy 1884.01 2220.38 (no rec)
Protein, g 83.83 97.22 >33.00
Fat, g 86.32 82.30 <105.00
Fat (saturated), g 25.67 21.00 <21.00
Fat (polyunsaturated), g 12.26 14.24 <30.00
Carbohydrate, g 187.35 259.84 >165.00
Vitamin A, mg 597.02 1093.16 750.00
Vitamin B1, mg 1.47 2.19 1.05
Vitamin B2, mg 1.66 2.01 1.60
Vitamin B3, mg 36.09 36.25 17.50
Vitamin B6, mg 1.99 2.28 1.70
Vitamin B11, µg 327.60 588.69 200.00
Vitamin B12, µg 5.83 6.11 2.00
Vitamin C, mg 146.16 118.87 60.00
Vitamin D, mg 5.40 5.50 2.50
Vitamin E, mg 13.56 18.27 12.00
Calcium, mg 715.32 725.00 725.00
Iron, mg 10.37 18.00 18.00
Zinc, mg 10.32 15.00 15.00
This shows that the LiveWell diet meets all recommendations for nutrient consumption where we had
reliable data.34 The figures for the average diet possibly underestimate the nutritional content since it
includes foods which we did not examine in detail and where some nutrient data may be missing.
Comparisons between food groups are shown below, demonstrating the pattern seen in other
sustainable diets of an increase in cereals and starchy foods, an increase in legumes, and a decrease
in meat and seafood. The diet showing maximal decrease in GHGe consists largely of legumes. The
34
We excluded iodine, for example, due to unreliable figures in nutritional tables.

48
decrease in fruit and vegetables may seem surprising but represents the balance between the different
food groups.

49
Pie chart comparison

50
3.2.3 Sweden
The Swedish diet similarly shows a reduction in GHGe of 25% at a cost approaching that of the current
diet.
Food LiveWell diet
(g/day)
Current average consumption
(g/day)35
Boiled potato 108.67 92.50
Mashed potato 23.42 21.88
Lentils 38.00 11.88
Wholegrain bread 67.79 33.13
Rye bread 29.48 26.88
White bread 39.00 48.13
Cereals, muesli 20.00 8.75
Rice, rice dishes, grains 20.00 34.38
Spaghetti, macaroni 105.00 50.63
Wheat bread, rusks 5.10 21.25
Carrot 38.00 11.88
Other root vegetables 20.00 4.38
Cucumber 10.00 10.63
Tomato 68.36 32.50
35
Allowing for 25% under-reporting

51
Cabbage 13.50 5.63
Mixed salad 68.00 21.25
Mushroom 7.50 3.13
Peas, mixed vegetables 28.00 8.75
Stewed vegetables 2.00 1.25
Other vegetables 52.00 32.50
Banana 15.00 37.50
Citrus fruits 100.00 41.25
Apple, pear 105.00 52.50
Kiwi 6.00 3.75
Berries 9.00 5.63
Cheese (around 28% fat) 14.00 26.88
Yoghurt (3% fat) 114.00 47.50
Skimmed sour yoghurt (0.5%
fat)
42.00 26.25
Milk (3% fat) 53.00 65.63
Fruit yoghurt 16.00 10.00
Yoghurt with fruit 13.00 8.13
Semi-skimmed milk (1.5% fat) 107.64 146.88
Fermented milk (1.5% fat) 24.00 15.00
Beef dishes 12.00 28.13

52
Pork dishes 12.00 31.88
Chicken dishes 34.50 14.38
Sliced meat, sandwich meat 6.75 28.13
Sausage, topping (bread) 24.00 7.50
Fish36 70.96 41.25
Eggs 60.00 18.75
Bregott margarine 15.00 6.25
Margarine (40% fat) 26.97 10.63
Sugar 5.00 5.63
Tomato ketchup 5.00 15.63
Peanuts 7.00 8.75
Pastries 33.76 17.50
Biscuits 1.80 7.50
Ice cream 13.00 16.25
Rice pudding dessert 45.00 18.75
Jam 5.97 12.50
Apple juice 92.85 109.38
Cola soft drinks 39.45 164.38
36
Represented by 60% salmon, 30% cod and 10% herring

53
A number of the items here are rather generic, but for the purposes of modelling we chose either a
specific item as a representative or averaged the values for a number of items (e.g. fish). This allowed
us to make direct comparisons with the average consumption, shown graphically below:

54
The diet above follows strictly the Swedish Nutritional Recommendations as follows:
Average consumption LiveWell diet National nutritional
recommendation
Energy, kcal 2509.25 2450.00 >2450.00
Protein, g 102.26 94.88 >37.50
Fat, g 92.51 87.20 <90.00
Carbohydrate, g 301.53 303.82 >180.00
Fibre, g 25.58 30.00 >30.00
Thiamin, mg 1.77 1.50 1.25
Riboflavin, mg 2.16 1.94 1.45
Vitamin C, mg 94.21 142.26 60.00
Niacin equivalents 41.94 40.30 17.00
Vitamin B6, mg 2.53 2.44 1.35
Folate, µg 294.35 415.54 300.00
Vitamin B12, µg 8.75 6.99 2.00
Vitamin D, µg 8.77 13.05 5.00
Vitamin E, mg 10.45 14.16 9.00
Calcium, mg 1126.38 896.30 800.00
Phosphorus, mg 1767.75 1649.37 600.00
Potassium, mg 3662.10 3605.97 3300.00
Sodium, mg 2903.67 2171.67 2000.00
Iron, mg 11.96 12.50 12.50
Zinc, mg 14.29 11.95 8.00
Selenium, µg 49.31 57.10 45.00
Magnesium, mg 359.94 383.28 315.00
Below we show a comparison based on the categories used for the food circle – where the instructions
are to eat at least one item from every sector each day. This shows a decrease in meat and “leeway”
(items not necessary for the diet) and an increase in vegetables and dairy products. In some ways this

55
is misleading, because as can be seen from the initial table in this section, there is a real change in the
composition of the categories, with big increases in lentils and carrots and a shift in meat consumption
from beef and pork towards chicken. Sources of protein show real increases in both fish and egg
consumption. There is a decrease in cheese but increases in other dairy products, particularly yoghurt.
A diet with maximal reduction in emissions shows these tendencies taken further with an increase in
root vegetables and cereals as well as legumes.

56
Pie chart comparison

57
4. ANALYSIS
This section explains in more detail the way in which we approached the modelling and how we
addressed a number of issues in doing this.
4.1 Approach to data
For detailed discussion of our methodology in finding appropriate data see annex 4.
The quality and consistency of the data varied between the three countries and in some cases this
created challenges. In approaching questions related to data (or deficiencies within the data) we took
the following general approach:
1. Where possible we used national data and filled in any gaps with data from other countries, even
when the other countries’ data was of better quality or more comprehensive. For all three
countries there were existing dietary surveys, nutritional recommendations and nutritional
information (provided by task 1 – see annex 4). Specifically for Spain, the nutritional information
had some gaps which we sought to fill by using data from Sweden and France and through
estimation where appropriate.
2. For the purposes of the model, the key question is the consistency and comparability of the data.
Therefore we sought to make sure that data derived from different sources (e.g. for GHGe) was
as consistent as possible, by comparing a set of common items and through this deriving a
“conversion” factor. This was a particular issue for GHGe: there are very different estimates for
the same item, but the relative values and trends are much more consistent (beef has a much
higher GHG footprint than pork, for example) – see reference 5 regarding reviews of data sources
for meat in Sweden, for example.
This approach has some effect on the final results of our work. In particular we note the following:
1. Comparability between countries is limited because the basis of figures is slightly different. The
results should therefore be used to examine the effects of change, rather than, for example,
seeking to determine which country has the most sustainable diet. In any case, constraints related
to cost, nutrition and sustainability have varied between countries so the diets are not strictly
comparable even if we had completely accurate and comparable GHGe data.

58
2. Although we quote absolute figures in our reports, we have more confidence in relative figures.
So, for example, we can have confidence that the GHGe of the LiveWell diet are substantially less
than the current average diet, and that the cost is not more. On the other hand, the estimate of
average GHGe in absolute terms is more open to discussion.
4.2 Approach to defining acceptability
“Acceptability” is a nebulous concept and we can conceive of a number of acceptable diets which
conform to the LiveWell criteria. Again we used slightly different approaches for France and for the
other two countries.
For France, acceptability was defined using upper bound constraints (expressed in maximum number of
daily portions acceptable) for each food, and by minimising the difference for each food variable
between the current diet and the LiveWell diet (that is, between the observed amount eaten in the
population of adult women and the optimised quantity chosen by the solver). See reference 7 for an
explanation of the methodology used here.
For Spain and Sweden, we used the following approach to work on acceptability through iteration and
putting bounds on particular foodstuffs by:
1. Ensuring that popular37 foods were not removed from the diet, generally ensuring that at least
30% of the most popular foods remained.
2. Ensuring that there was appropriate variety by putting an upper bound on most foods. Initially we
put higher bounds (in terms of multiples of the current average consumption and/or standard
deviations) for more popular foods, specifically to avoid introducing large amounts of unpopular
foods into the diet.
3. Where appropriate removing foods which were present only in small amounts in the average diet
to avoid creating a shopping list with too many small items.
4. Following health recommendations for particular specific types of food (e.g. semi-skimmed rather
than full-fat milk, wholemeal rather than white bread). In general we did not take this to an
extreme, but rather limited any increase in the total to being through healthy options.
37
Popularity was defined using what data we had from dietary surveys – see sections on individual countries for details.

59
5. Removing small items of ambiguous composition (sauces etc.) to increase confidence in the
nutritional composition of the final diet.
6. Putting lower bounds, particularly on popular foods, in order to regulate minimum portion sizes
(one piece of fruit, a piece of meat which can be used in one meal etc.).
7. Moving the model in a particular direction for cultural reasons. For example, bread, potatoes and
pasta have fairly similar characteristics as far as GHGe and prices are concerned, but the model
will seek to optimise one particular foodstuff. For this reason consumption of pasta was limited in
Sweden and potatoes in Spain.
8. Finally, a certain amount of trial and error was used to create a diet with ingredients which could
be combined.
Nutritional constraints introduced in the French model included constraints ensuring that national dietary
guidelines were fulfilled. Because these guidelines are expressed in consumption frequencies of
predefined portion sizes of food groups, this helped (but did not guarantee) the introduction of integer
portions for some foods (i.e. when the upper or lower bounds for a given food group were reached and
when they were reached with only one food).
While we tried to make this systematic, a key point here is that other decisions could have produced an
equally valid diet – for example, it is not necessarily the case that popular foods should be increased in
greater percentages than unpopular ones (the population may like pasta but it doesn’t mean that they
want to eat it every day; just because carrots are the most popular vegetable doesn’t mean that there
isn’t a need for variety). Our aim for variety was also influenced by the idea that we were producing a
weekly shopping list and sample menu, limiting the number of items we should buy. If we had produced
a list for a longer period it would have been more appropriate to include a larger number of small items
(for example varieties of fish in Spain).
For France we had data which was more clearly related to the current diet, so we were able to design a
diet which resembles it as closely as possible.
It is not only the modelling approach that is responsible for producing somewhat unrealistic food
combinations and quantities, but also the definition of what is an “average” diet. A mean diet is in itself
unrealistic because, by definition, nobody does eat the average diet, since individual’s eating patterns

60
vary greatly. The average diet gives an average consumption for each food by dividing the total quantity
of all foods consumed by the total population – including people who may not consume that particular
food at all. For instance, if only 1 in 20 individuals consume 50g of liver per week, the mean diet will
contain 2.5g of liver per person per week (50/20 = 2.5) – a totally unrealistic quantity, since nobody
would cook 2.5g of liver. Something which is acceptable to the “average” person may in reality be
acceptable to only a small proportion of the population.
Another assumption is made when modelled diets derived from average population diets are proposed
as acceptable diets for individuals. Individuals are assumed to have a greater food repertoire than they
do in reality (because, by definition, in the average diet, all the foods are present, even in very small
amounts). In the present study, this overestimating was counterbalanced by at least two instances of
underestimating food diversity. First, due to the lack/incompleteness of dietary data (in particular GHGe
food data) the models included a relatively small list of food variables. Second, the diet modelling
process in itself is likely to decrease food diversity because it selects foods with a good nutritional
quality for their GHGe value.
We have not sought to analyse the spread of different types of diet within the population (nor do we
have full data on this). Further research needs to consider approaches to creating acceptable diets for
minority groups. To increase the acceptability of modelled diets, individual diet modelling approaches
(as opposed to population diet modelling) have been developed – see reference 13. However, these
require precise individual food intake data and specific modelling techniques that were beyond the
scope of the present study.
4.3 Approach to modelling
The basic approach to modelling the diets using linear programming is the same in all three cases, but
the way in which we used the model in order to produce the LiveWell diet varied between the countries.
For Spain and Sweden we used a methodology equivalent to that used for the Livewell UK diet, as
follows:
The model was optimised to minimise GHGe while complying with nutritional guidelines.

61
General constraints were included to comply with food-based dietary guidelines and overall
acceptability (for example, encouraging more of popular foods and excluding unpopular ones;
minimum portion sizes).
Additional bounds were put on individual foods in an iterative process to produce a diet where
foods could be combined in an acceptable way while GHGe were reduced by at least 25%.
For France we took a different approach to the same dietary model:
We developed an “acceptability” function showing the variation from the current diet and this
was optimised subject to a 25% reduction in GHGe and compliance with nutritional guidelines.
Constraints were included to comply with food-based dietary guidelines and portion sizes
We put additional acceptability bounds on individual foods to fine-tune the result.
It was easier to use this approach in France than in the other two countries because of better quality,
detailed data including, for example, portion sizes.
The different approaches would not be expected to produce different final results. Rather, the model
gives a wide variety of ways of meeting the overall constraints (GHGe at 25%, cost not increased,
compliance with nutritional guidelines) and a strategy needs to be developed to find the most
acceptable diet within this. The approach depends on the availability of detailed information and
personal choice, and the results should not be seen as qualitatively different from each other.
We hope that exhibiting different approaches gives some useful guidance for researchers developing
diets in other countries or with other data.
4.4 Extreme diets
For each country we ran the model to determine the degree to which GHGe could be reduced, keeping
constraints only on nutrition and cost (i.e., not including acceptability). Actual details of the diets
produced are shown in annex 1.
These diets give an idea of how much further we could reduce GHGe, although some caution is needed
in examining them because:
62
The reduced variety and increased amount of particular foods will create some inaccuracy in
nutritional values (in any case, some foods are not “pure” and may vary in nutritional content). In
general it is good nutritional policy to have wider variety.
The figures for GHGe and cost are also approximate and therefore not accurate at the extremes.
Nonetheless, we can conclude the following:
It is possible to reduce GHGe by considerably more than 25% through choice of diet, and almost
certainly by more than 50%.38
We did not make a detailed examination of diets with 50% reduction but note that it is possible to
do this through choosing from existing foodstuffs. However, extreme diets are likely to be
unrecognisable and unacceptable to the majority of the population.
4.5 Areas outside the model
A number of areas were not examined that would affect GHGe, even within the proposed diet:
1. We did not consider seasonality – which can have an important effect not only on price but also
on GHGe. While the GHGe for an average tomato imported from Spain to Sweden are less than
an average hot-housed tomato from Sweden itself, this does not apply for tomatoes grown
seasonally. Seasonal eating of fruit and vegetables could have an impact on GHGe, although this
is difficult to estimate since it would alter other patterns of eating (if we only eat local apples, then
what fruit do we eat out of season?).
2. We used quite broad categorisations of food, particularly due to the nature of dietary surveys. It
may be possible to be more specific in terms of which foods are eaten and through this to reduce
GHGe. Nutritional categories sometimes contain items which have widely differing GHGe. The
data on GHGe is still in its infancy, but better data could inform consumer choice in this respect.
3. Surprisingly, guidelines on nutrients vary significantly between countries. For example the
recommendation for zinc for a Swedish woman is 7mg compared to 15mg and 10mg for Spanish
and French women, respectively, and a 4.9mg general WHO recommendation for women. It could
38
This figure relates to primary production; the final net reduction would be lower. See reference 2 for a more detailed overall estimate.

63
be interesting to discover whether this has a significant effect on GHGe through modelling.
Certainly, for example, zinc was a key constraint on the model in Spain.
4. We found it difficult to disaggregate energy spent on cooking and processing foods in the home,
but this is clearly a component of GHGe: more efficient ways of cooking and less processing could
therefore reduce GHGe. It seems possible that more energy-efficient methods of food preparation
could also be healthier, but this needs to be tested.
5. We used data on the nutritional composition of foods without consideration of the actual bio-
availability (i.e. the ability of the body to absorb the nutrient from the food). For example, it is
suggested that the absorption of zinc and iron from cereals is less efficient than from meat (see
reference 8). To some degree this can be mitigated by methods of food preparation (for example
fermentation, soaking and sprouting of grains). We considered this issue to be too complex for
analysis here and further work is required.
6. We avoided consideration of drinks outside fruit juices, milk and one soft cola drink – and in
particular excluded alcohol from the model. Drinks cause some data issues, for example related to
relative level of dilution and, in any case, tend to be a personal choice which is not seen as part of
the diet (i.e. a change in the menu will not have a significant effect on what the average person
drinks with their meal). On the other hand, drinks can be a significant contributor to GHGe (for
example tea and coffee) while alcohol may have other nutritional impacts (for example on overall
energy).
4.6 Cost of the diet
Cost was never a binding constraint in terms of finding a solution that reduced GHGe appropriately,
showing that a healthy and sustainable diet is not necessarily an expensive one – see annex 3 for more
details of sensitivity analysis. In general key constraints related to nutrition. In some cases we used
recommendations which were higher than the average consumption reported in the dietary survey (for
example the recommended intake of zinc is almost 50% higher than the average consumption in
Spain).
Cost did have some binding effect on acceptability, however. For both the Spanish and Swedish sample
menus, the cost is estimated to be the same as the current average diet. Cheaper menus would have
been possible, but these would have been further from current consumption.

64
4.7 Specific issues for each country
4.7.1 France
Data for France was based on the diet consumed by women participating in the nationally
representative INCA 2 dietary survey (2007 – reference 14). After exclusion of energy under-reporters
following the appropriate procedures (see reference 15), dietary data from 1,142 women were used to
estimate the mean population diet, i.e. the observed diet consumed by women in France. To limit the
bias of acceptability induced by the estimation of the mean population diet, average consumption of
food items was weighted. A weight was estimated for each food item according to its consumption
among an EPIC39 food group. More precisely, this weight was calculated by the ratio between the
consumption of this corresponding food item and the sum of the consumption of selected food item in
the EPIC food group. This led to a weight value between 0 and 1, with the sum of each weight in a
given EPIC group being 1. Then, average consumption of each EPIC food group was calculated.
Finally, each food item weight was applied to the average consumption of its EPIC food group, leading
to a weighted average consumption for each food item.
All models were run using linear programming. When applied to nutrition, linear programming is a
mathematical tool used to find the optimal solution of a linear function (the objective function) of food
variables fulfilling a set of linear equality and inequality constraints. In the present study, two kinds of
models were developed. The first model was built to produce a LiveWell diet: it minimised total
departure from the mean population diet (objective function) while achieving nutritional constraints
subject to a 25% GHGe reduction. A sensitivity analysis was run by increasing the reduction of GHGe to
50% and 70% (see Annex 3). The second set of models (A, B and C) aimed to directly minimise total
GHGe while achieving nutritional constraints (results in appendices). The nutrient content and GHGe
values were available for a list of 68 frequently consumed food items, which constituted the food
variables in all the models.
To ensure the healthiness of the modelled diets, they had to fulfil several nutritional constraints, i.e. a
set of constraints on nutrients (using the same list of nutrients as in the original UK LiveWell diet) plus
another set of constraints on food groups. These were based on the French food-based dietary
39
EPIC food groups were used as a neutral system of classification, although they do not correspond exactly to either the INCA survey
or French food-based dietary guidelines.

65
guidelines (FBDGs) for the general population (www.mangerbouger.fr). In the LiveWell model, social
acceptability constraints were added to avoid an unrealistic diet.
To analyse the impact of a cost reduction on GHGe, we conducted a cost sensitivity analysis (see
annex 3).
The details of the methodology for each model are displayed in table 1.

66
Table 1: Summary of linear programming models
LiveWell model GHG minimised models
M1 M2 M3
Minimised
objective
function
Sum of the absolute
deviation from average
individual food intake40
Total GHGe of
the diet
Total GHGe of
the diet
Total GHGe of
the diet
GHGe
constraint
Total GHGe lower than
75% of observed GHGe
(i.e. 25% reduction)
- - -
Nutritional
constraints
Nutrient
recommendations (see
table 2) plus:
French FBDGs (see table
3)
Nutrient
recommendations
(see table 2)
French FBDGs
(see table 3)
Nutrient
recommendations
(see table 2) plus:
French FBDGs
(see table 3)
Cost None None None None
Acceptability
constraints
Maximum number of
portions of each individual
food (see table 4)
- - -
40
This function was non-linear. To apply linear programming the function was transformed into a linear function using a published method (see
reference 7).

67
Table 2: Daily energy and nutrient intakes of French women (n=1142) based on the INCA2 dietary
survey (2007, reference 14), and corresponding nutrient-based recommendations for that population
(reference 16), used as nutrient-based constraints where needed.
Observed mean
intakes
Corresponding recommendations
Nutrient Minimum Maximum
Energy, kcal 1814 1800 1800
Proteins, g 68 50
Carbohydrates, g (%TE) 202 (44.5%) 225 (50%) 337 (75%)
Fibre, g 14 25
Lipids, g (%TE) 81 (40%) 70 (35%)
Saturated fatty acids, g (%TE) 32 (15.8%) 20 (10%)
Sodium, mg 2053 2365
Calcium, mg 581 900
Iron, mg 8 14
Zinc, mg 7 10
Vitamin B12, µg 3 2,4
Folates, µg 188 300
Added sugars, g (%TE) 39 (8.6%) 45 (10%)

68
Table 3: Food group intakes of French women (n=1142) based on the INCA2 dietary survey (2007,
reference 14), and corresponding FBDGs, used as constraints on food groups where needed.
Observed mean
intakes
Corresponding FBDGs
French PNNS food groups Portions/day Minimum
Maximum
Fruit and vegetables 4.52 5
Fruit juice 0.32 1
Nuts 0.03 1
Starchy food 2.21 3
Dairy products 2.06 2.5 3.5
Meat, fish, eggs 1.48 1 2
Fish 0.30 0.29
Fat 4.37 3.5
Olive oil 0.96 1
Sunflower oil 0.39 1
Sweet products 4.24 2
White sugar and honey 3.17 2
Drinks 0.30 1

69
Table 4: List of foods (with portion size) used as variables in the models and their average consumption
by French adult women
Food items EPIC food group1 Average intake,
g/day
Portion size, g Maximum number
of portions*
Potato chips,
salted
1 1.49 150 1
Scalloped potatoes 1 7.47 150 1
Boiled potato 1 33.10 150 1
Fried potato
(frozen)
1 8.99 150 1
Potato salad 1 4.95 150 1
Raw carrot 2 19.08 80 1
Raw endive 2 5.33 80 1
Canned green
beans, drained
2 21.25 80 1
Cooked onion 2 4.26 80 1
Green salad
without dressing
2 26.86 80 1
Raw tomatoes 2 55.75 80 1
Tomato Provençal 2 8.68 80 1
Lentils, cooked 3 8.79 150 1
Fresh banana 4 20.86 80 1

70
Clementine 4 22.67 80 1
Stewed apple 4 13.91 80 1
Walnuts 4 0.67 20 1
Fresh orange 4 16.02 80 1
Fresh unpeeled
apple
4 87.22 80 1
French cheese
(Camembert)
5 7.86 30 1
Low-fat cream 5 1.48 125 1
High-fat cream 5 2.67 125 1
Cream cheese,
20% fat
5 10.44 125 1
Gruyère cheese 5 6.37 30 1
UHT semi-
skimmed milk
5 143.23 200 1
Yogurt with fruit 5 13.92 125 1
Yogurt 5 26.33 125 1
Appetizer cracker
biscuit
6 1.23 150 1
Bread, baguette 6 72.81 60 3
Bread, wholegrain 6 7.24 60 3
Cooked pasta 6 41.27 150 1

71
Cooked white rice 6 23.41 150 1
Grilled lamb chops 7 3.72 100 1
Turkey 7 11.51 100 1
Cooked ham 7 23.38 100 1
Grilled bacon 7 3.31 100 1
Roasted chicken 7 24.24 100 1
Dried sausage 7 3.27 100 1
Ground beef, 15%
fat
7 24.62 100 1
Baked cod 8 2.89 100 1
Cooked shrimp 8 3.42 100 1
Hake, cooked 8 5.26 100 1
Sardines canned in
oil, drained
8 1.00 100 1
Steamed salmon 8 9.63 100 1
Raw smoked
salmon
8 1.75 100 1
Canned tuna in
brine, drained
8 5.88 100 1
Boiled egg 9 14.45 60 1
Unsalted butter 10 16.11 10 3
Olive oil 10 9.56 10 3

72
Sunflower oil 10 3.87 10 3
Honey 11 8.32 10 1
White sugar 11 23.36 10 1
Processed packed
cake (brioche)
12 12.62 40 1
Chocolate bread
(pain au chocolat)
12 14.47 40 1
Fruit tart
(processed)
12 39.20 100 1
Orange juice 100%
(pasteurised)
13 64.04 200 1
Cola drink 13 59.21 200 1
Low-fat margarine 15 14.11 10 1
Vegetable soup
(processed)
16 17.70 200 1
Vegetable soup
home-made
16 60.00 200 1
Cassoulet (canned) 17 11.34 200 1
Cheeseburger 17 6.34 200 1
Pizza 17 14.94 200 1
Fried breaded fish 17 11.07 200 1
Quiche Lorraine 17 13.59 200 1

73
Meat ravioli with
tomato (canned)
17 16.11 200 1
Tabbouleh 17 9.96 200 1
Stuffed tomato 17 13.76 200 1
* A maximum number of portions per day was imposed to each food variable to help ensure social
acceptability of the LiveWell diet
1 See task 1 for references on definition of EPIC food groups
4.7.2 Spain
Spain has produced a remarkably comprehensive and detailed dietary survey, detailing consumption of
many individual and infrequent items such as specific types of fish and seafood. Dealing with this wide
range of foods (the final model had 277 different foods) caused some challenges in developing the data
for modelling, particularly the following:
1. Lack of GHGe data specifically for Spain – as explained in annex 2 we adapted data from
elsewhere. Many of the specific items where data was difficult to find had very low consumption,
and for these we believe that estimates from comparable foodstuffs suffice.
2. Some deficiencies in the nutritional data – the BEDCA database for Spain does not cover all the
foodstuffs in the ENIDE national dietary survey. We used data from France and Sweden to cover
the gaps for nutritional information. In addition, inspection of details for individual foods showed
some missing figures, specifically related to iron and zinc, which we estimated from comparable
foods.41 Inspection of data suggested that iodide composition was not in all figures and was
unreliable, so we took this out of the model even though it is a Spanish nutritional
recommendation.
Spanish recommendations for iron and zinc (and iodide content) are relatively high compared to other
countries and we note that the average diet does not fulfil the recommended amounts for these
41
The missing figures were generally related to areas where there was a benchmark figure e.g. different cuts of meat from the same animal.

74
minerals. We considered whether to adjust for under-reporting based on this fact – but since it is
possible to produce a diet without this adjustment we have not done so.
To define general bounds for different foods we defined popular foods using comparison of the standard
deviation to the mean (Tchebyshev's inequality42). We started modelling with a combination of the
following constraints:
1. For popular foods we allowed consumption to increase by 4.5 times, and not to fall below 30% of
the average value or 5g/day.
2. For other foods we allowed consumption to increase by 3.3 times and excluded foods where the
maximum would be less than 1g a day (to avoid excessive numbers of small items).
The figures chosen here were determined empirically in order to create a diet with appropriate variety
and acceptability.
Additional bounds were imposed in order to produce an acceptable diet. Some discussion was
necessary here because the nutritional recommendations (specifically related to iron) resulted in small
amounts of liver and black pudding in the diet which were difficult to integrate into the menu. Initially we
tried to put restrictions on the degree of divergence of food groups from the average but
experimentation showed that it was difficult to produce an acceptable menu with these conditions.
The very large number of small items in the dietary survey suggests wide differences in individual diets,
and we certainly suppose that there are real regional differences within Spain in the cost and availability
of different foods, and actual menus. However, we have based our research purely on an average
menu.
42
We had figures for the deviation and the mean but no indication directly of the percentage of the population eating each foodstuff.

75
4.7.3 Sweden
The latest dietary survey (Riksmaten) at the time of modelling was more than 10 years old, though it
has since been reviewed. This caused some issues with price information, which we took from a recent
household budget survey (2009), but checking items on online supermarket portals suggests that there
is an acceptable match and that the average Swedish diet has not changed markedly during this period.
The fact that the survey is old does not in itself have a marked effect on modelling, since the data used
for the model (GHGe, nutrition and cost) is up to date. However, the survey data caused some issues,
most specifically that some items were very generic (e.g. fish in total). Since we used the survey as a
benchmark and reported change against it, we were obliged to use the same categories in our
modelling.
For generic items we made estimates for GHGe, nutrition and cost data. For example for fish we
estimated consumption based on HBS data and current prices and produced GHGe estimates and
nutritional data based on this. In modelling, however, this produces a LiveWell diet categorised in the
same way, which does not consider the effects of different combinations (e.g. more herring and less
cod). We left this position since it fits more clearly with acceptability criteria and in any case the model
produces a feasible solution.
The energy from the average diet is considerably less than the levels recommended in Swedish
nutritional recommendations (SNR), probably because of under-reporting. To avoid distortions created
by increasing foods purely for energy content, and noting experience from elsewhere (for example
decisions made in the LiveWell UK work), we increased consumption by 25%.
As initial constraints for the model we used the following for acceptability:
1. Consumption of foods in each of the food circle categories were kept to at least 75% of the current
Swedish nutritional recommendations.
2. Popular foods (those which at least 50% of either men or women eat) could be increased by up to
four times, and not reduced below 30% of current average consumption.
3. Unpopular foods (those eaten by less than 25% of men or women) were limited to no more than
twice current average consumption.

76
4. Other foods could be increased by up to three times average current consumption.
Additional bounds were imposed in order to produce an acceptable diet
The figures chosen here were determined empirically in order to create a diet with appropriate variety
and acceptability.
5. CONCLUSIONS
5.1 General
The research here shows that it is possible to work in three different European countries using the
principles and methods embodied in the LiveWell UK research. Although there were differences in the
availability and quality of data, we have demonstrated linear programming models which show that it is
certainly possible to reduce GHGe through choice of foods without increasing the cost of the diet, falling
outside nutritional guidelines, or producing menus which would be unacceptable to the majority.
In doing this, as well as producing a set of sample menus which demonstrate the possibility of achieving
a 25% reduction in GHGe, we have produced:
1. Sensitivity analysis showing in general terms what is achievable
2. Details of methodologies for developing an acceptable diet based on a linear programming
model, but working on slightly different bases
3. Approaches to coping with data deficiencies and making sufficient assumptions in order to draw
valid conclusions.
We hope this report can guide future researchers in the same topic in other countries and situations,
and be a first step in creating sustainable diets in the three countries under observation.
5.2 Research questions
We return to the key research questions which we sought to answer.

77
5.2.1 Can a healthy diet be more environmentally sustainable?
Answer: Yes, for all three countries
Although nutritional recommendations act as binding constraints, it was relatively easy to construct a
healthy diet which reduces GHGe. In doing this we should recognise some limitations of the
methodology and the need to have better information on nutrients. Specifically:
Some constraints (such as specific fatty acids) were missing from recommendations and from
nutritional data.
We did not take into account differential nutrient bio-availability depending on the sources of
nutrients (important for iron, zinc, calcium, proteins, vitamin A) – this is an important factor,
bearing in mind that, for example, iron and zinc are chiefly sourced from meat and dairy in
current diets and the degree of absorption is higher from meat than vegetable sources: for
further discussion see reference 8.
Nonetheless, we can suppose that this result partly relates to the “unhealthy” part of the current diet,
which to some degree can include over-consumption in general and unnecessarily high consumption of
high-GHG foods (specifically meat).
5.2.2 Can a diet be healthy, economic and respect the environment?
Answer: Yes, for all three countries.
Although the cost of the LiveWell diets approached that of the current average diet, this related in
general to choices made to enhance acceptability. Without acceptability constraints, healthy diets which
reduce GHGe are very likely to be cheaper than current diets.
5.2.3 What is the lowest level of GHGe that may be reached while fulfilling nutritional
recommendations and not increasing diet cost?
Our models suggest that it is possible to have a diet which fulfils current dietary recommendations and
reduces GHGe by at least 50%. Although the models show that it is possible to reduce emissions
further than this, the resultant diets have a limited number of foods (very low variety) and are so
extreme that the validity of the data is questionable. Even with a 50% reduction in emissions the diet

78
would be unrecognisable to most consumers, typically requiring a reliance on legumes as a source of
protein, a much larger amount of vegetables, and much less meat.
5.2.4 What would be a healthy, sustainable diet which reduces GHGe by 25% and minimises
change from the current diet?
The LiveWell diets shown in this report demonstrate three such possibilities. Our experience in creating
these diets suggests that there is a variety of diets which would also meet the criteria, particularly noting
that the concepts of “acceptability” and “change from the current diet” are inevitably partially subjective.
We note from the reception of the LiveWell UK report that detailed menus can create quite strong
reactions and we again emphasise that these are samples: the evidence suggests that there are other
solutions which may be more acceptable to different sectors of society than those we exhibit. On the
other hand, a reduction of 25% does mean real changes in the diet, not the same things in a different
combination. All the diets show significant changes in composition, particularly the decrease in meat,
and increase in cereals and legumes.
5.2.5 How can we show consumers that this is a viable change in diet?
We have demonstrated that it is possible to produce an “acceptable” weekly menu which can be used
as a tool in promoting a more sustainable diet.
More work needs to be done on communication. Many years of public nutritional guidance and food-
based dietary guidelines seem to have had disappointingly little effect on people’s eating habits.
However, we hope sustainability can be incorporated into national guidelines as they develop in the
future.
5.2.6 What are the general implications?
We can see from the analysis here that it is possible to produce a LiveWell diet for three very different
Western European countries. The implication is that the same exercise could be done for other
European countries and a diet for each developed. We hope that this report demonstrates a
methodology which could be used and explains the ways in which we adapted data for cases where it
was fragmentary, inconsistent or non-existent.
It seems likely that with judicious adjustment of the diet (for example, eating local and seasonal foods in
preference to imported ones, and accepting a lower amount of meat) it would be possible to decrease

79
GHGe even further. The 25% reduction is an arbitrary figure for the exercise based on overall carbon
targets and does not represent a boundary for acceptability or possibilities of reduction.
It is not clear whether the same approach will produce a valid result in countries further afield. Countries
in Eastern Europe have different supply chains (until fairly recently, the countries participated much less
in the global food market), have more markedly different eating habits, have a greater percentage of the
population who produce their own food, and are currently in transition to a more globalised economy.
We can hypothesise that diets are sufficiently similar that a similar result could be obtained, but we feel
there is need for further research. We had difficulty getting data for Spain and therefore had to make
widespread assumptions regarding applicability of data for other countries. We suspect that this will be
a greater challenge for Eastern Europe since it will be more difficult to support assumptions based on
comparisons with Western Europe.
We also seek to identify the impact of the LiveWell diet on farmers in Europe. We can make the
following observations:
1. The changes will reduce the consumption of livestock products and this will have an effect on
agricultural output. Several studies have shown that this switch reduces the monetary value of
farm-gate sales (reference 17).
2. Widespread adoption of a LiveWell diet would reduce the demand for meat and dairy products
and reduce these sectors’ production changes in line with consumption.
3. The changes are unlikely to be abrupt and will be absorbed by market adjustments. However,
change at the margins may be significant in this adjustment phase. The immediate effect would be
a contracting domestic market for meat and dairy products which will depress prices and reduce
incentives for production expansion.
4. Less meat might offer the potential for some producers to enter the higher-value, lower-volume
markets. Farmers, environmental and animal welfare organisations and industry would need to
work together to come up with ways of reducing our consumption footprint that support rural
livelihoods.

80
5. There will be opportunities for other sectors such as horticulture, feed and the potato industries to
increase market share and sales as people move to more plant-based, lower-input foods. Some
farmers could be supported to move into these areas.
However, a number of additional factors come in to play and need to be considered:
1. There are links between production of different foodstuffs, most particularly between beef (meat)
production and dairy.
2. The current food system is heavily dependent on comparative advantage for cereal and maize
production for animal feed in Europe complemented by protein crop production in South America.
The change would lead to a fundamental restructuring, for example up to a 75% reduction in the
need for imported soy (see reference 18).
3. Optimising the food system in terms of GHGe reduction requires better LCA data (though this
should not be an excuse for inaction). The environmental costs of production are not reflected in
consumer prices and as a result options that increase GHGe may be cheaper. In some cases,
reducing GHGe may be counter-intuitive, for example when food transported over long distances
has a lower impact compared with locally grown food.
4. The effect on prices can be complex. If the population consumes less meat then in the short term
the price would fall.43 There is a danger that this would naturally give the consumer an incentive to
start buying more meat again. Changing the food system requires careful planning and
adjustments of prices.
5.3 Need for further research
This type of analysis is in its infancy and there is much further work to be done. We would like to
highlight the following as areas for further work:
1. Generation of better and more consistent GHGe data. Already some work has been done (for
example HLCWG, LCA food and Eat England) which groups together data to allow some idea of a
consistent database for other countries, but there is still a need to add to this. Full LCA needs to
43
We temporarily ignore the effect of subsidies and supermarket monopoly/monopsony.

81
take into account effects of land-use change, which we have ignored for the purposes of the
current report.
2. Research on the question of seasonality in food. To what degree would diets with a strong
seasonal component have an effect on GHGe? And would there be adverse health implications?
3. Research into the question of GHGe related to cooking and preparation of food. We did not take
this into account systematically.
4. Further research and consideration of the effect on farmers of a changing diet, and the way in
which subsidy and support mechanisms need to be adjusted to support this. Such research
should consider links between production of different foods (e.g. meat and dairy).
5. Consideration of minority and regional diets. For large and diverse countries such as the UK,
France and Spain, should there be different LiveWell diets for different geographical locations and
sectors of society?
6. Research into the bio-availability of certain key nutrients and the effects of changing their sources.
Specifically we need more data on sources for iron, zinc and calcium. A better understanding here
would allow more consistent guidelines for recommended amounts of these nutrients in the diet.
7. Research into shopping habits and how this can affect GHGe. For example, what are trade-offs
between better variety of low-GHG food and the GHG and economic costs of transport to find it?
8. Incorporation of other factors in the definition of sustainability, including water and biodiversity.
9. It may be appropriate to revisit the Swedish diet in the light of the renewed survey in autumn
2012.

82
ANNEX 1 – EXTREME DIETS
These diets take the model to its extreme by looking only at nutritional constraints and ignoring
acceptability to minimise GHGe using the same foods as in the national dietary surveys.
For France, we can exhibit a diet (fulfilling nutrient recommendations only) which reduces GHGe by up
to 74% (921g CO2e/day) and cost by up to 45% (€2.7/day).
Table 1: Minimised GHGe model with nutrient constraints only
Food items Quantity (g/day)
Total diet 1119
Lentils, cooked 465
Pasta, cooked 419
Sardines canned in oil, drained 158
Sunflower oil 31
White sugar 45
Fulfilling French FBDGs only we can display a diet which reduces GHGe by up to 64% (1243g
CO2e/day) and cost by up to 33% (€3.3/day).

83
Table 2: Minimised GHGe model with French FBDGs only
Amount, g/day
Total diet 1686
Food items
Vegetable soup to warm 640
Pasta, cooked 558
UHT semi-skimmed milk 313
Sardines canned in oil, drained 100
Sunflower oil 25
White sugar 20
Walnuts 20
Olive oil 10
We can display a diet (fulfilling nutrient recommendations and French FBDGs) which reduces GHGe by
up to 57% (1499g CO2e/day) and cost by up to 20% (€3.9/day).

84
Table 3: Minimized GHGe model with nutrient recommendations and French FBDGs
Amount, g/day
Total diet 1851
Food items
Cooked pasta 477
Vegetable soup, homemade 398
Yoghurt with fruits 375
Vegetable soup (processed) 250
Lentils, cooked 213
Sardines canned in oil, drained 100
Walnuts 19
Sunflower oil 10
Olive oil 10
For Spain we can exhibit a diet which reduces GHGe by more than 90% and cost by 75%.
Category Food Quantity, g
Meat and meat products Liver 4.291
Miscellaneous Bouillon cube 6.750
Miscellaneous Herbs and spices 42.091
Miscellaneous Mayonnaise and other dressings
with the same ingredients
60.693

85
Category Food Quantity, g
Seafood products or related Eel 7.177
Seafood products or related Oysters 3.499
Vegetables White pinto beans 430.109
For Sweden we have a diet which reduces GHGe by more than 70% with a cost reduction of 25%.
Food Quantity, g
Wholegrain bread 103.91
White bread 263.44
Cracker 150.45
Other root vegetables 674.82
Cabbage 80.58
Milk (3% fat) 187.77
Eggs 96.61
Margarine (40% fat) 16.24
None of these are realistic, not only because of acceptability (it would be difficult to make interesting or
in any way “normal” meals from the ingredients) but also because the lack of variety and large amounts
of foods which are normally eaten in small quantities gives rise to suspicion about the margin of error on
nutritional and GHGe figures. These diets do, however, give an indication of the maximum reduction
which could be achieved using current foods and methods of production.
86
ANNEX 2 – DATA METHODOLOGY
This annex explains how we approached gathering data for the different countries.
A. France
1. Breakdown of foods
The INCA2 cross-sectional dietary survey (“Enquête Individuelle et Nationale sur les Consommations
Alimentaires” [Individual and National Survey on Food Consumption]) conducted in 2006-2007 by
ANSES (French agency for food, environmental and occupational health and safety) was used to
estimate mean/median consumption.
2. Availability of GHGe data
We selected 73 widely consumed food items as representative of French diets, by preferentially
choosing foods with the highest percentage of consumers. Then, we collected the GHGe associated
with the consumption of these 73 representative food items from the available literature and from
studies conducted in France. Only studies using LCA were used to quantify the environmental impacts
generated by a product throughout its life cycle, and we assumed that the selected food items were all
obtained through the conventional and most frequent production and distribution processes in France.
The food-related GHGe values covered the stages of agricultural production, processing, packaging
and transportation to retail outlets but the stages that occur after purchase (transportation from store to
home, storage, preparation and cooking at home, waste disposal) were not included due to a lack of
data.
3. Conversion of data – approach
For nutritional, cost and GHGe data, we applied a factor for consumed food to take into account
wastage, cooking and hydration.
4. Nutritional data
All of the food items participants in the survey declared as consumed (including the 73 highly consumed
foods) were listed in a survey-associated food database giving the nutritional composition of each food
item. The nutritional composition of the foods was computed from the INCA2 food composition
database.

87
5. Cost data
The cost of all the food items declared as consumed (including the 73 highly consumed foods) was
collected from two types of sources:
From the TNS Worldpanel 2006 study (c.90% of the listed food items)
From supermarkets (c.10% of the listed food items)
6. Constraints – nutrition
Constraints on nutrition can be separated into two categories: food-based dietary guidelines and
nutrient recommendations.
The French FBDGs define nine rules (eight on food consumption and one on physical activity)
expressed in frequency (at least five fruit and vegetable portions per day) or in grams (not more than 8g
of salt a day) [see Task 1 report 2.1.2]. For rules expressed in frequency, we have had to make
decisions in order to assess a portion size to each food item.
Nutrient recommendations were collected from the recommended daily intake in France published by
the French agency for food (ANSES). In task 1 French recommendation for fibres was missing. The
minimum recommended intake for fibre is 19g/day for French women.
7. Constraints – acceptability
A first diet modelling was run to reach a target energy intake of 1800Kcal, which is the recommended
energy level for French women.
Acceptability constraints for each food item were then added:
A minimum value equal to the 5th percentile of consumption observed in the population (non-
consumers included).
A maximum of the 95th percentile of consumption observed in the population (non-
consumers excluded).
We tried other acceptability constraints depending on the preliminary results from first LP model runs.
88
B. Spain
1. Breakdown of foods
The ENIDE survey gives a comprehensive breakdown of foods. Most items are clear and can be
triangulated against possible GHGe and nutrition data.
2. Availability of GHGe data
Examination of the literature produces almost no direct data on GHGe related to food in Spain. Although
there have been a number of papers, in general they use data estimated from international sources.
One exception is a paper on the carbon footprint of the Galician fishing industry (reference 11), which
we have used to estimate GHGe figures for different types of fish.
3. Conversion of data – approach
In view of the difficulties of making any overall estimates of GHGe, we have used the following general
approach:
GHGe data is “to retailer” but adjusted for amounts consumed.
Where possible we have used data from France, which is the nearest country where there is a
set of consistent and comparable data.
Where there are gaps we have used the following substitutes:
Data for fishing based on the Galician fishing fleet
Data from HLCWG, using a multiplication factor to allow for transport etc. between RDC and
retail. The multiplication factor is based on comparison of similar foods where there is French
data available. Some allowance is made for origin of e.g. fruits in choosing a base figure.
Conversion factors from McCance and Widdowson
Some processed foods from Eat England data
Estimations from comparable data (e.g. LCA food regarding some fish and mussels).
For important foods (e.g. olives) we made some estimates of our own based on comparable or
constituent products (for example papers produced on LCA of olive oil).

89
This still leaves some areas where there is no data, although in general these are areas of low
consumption. In these cases we have made educated estimates.
4. Nutritional data
Where possible we used information from the BEDCA online database. As this was not comprehensive
enough, we supplemented it with data from French and Swedish sources. Examination of the data
showed a need to find additional data on iron and zinc in a small number of cases. Iodide figures
appear unreliable and not comprehensive so we did not use these, even though iodide is included in
nutritional recommendations.
5. Cost data
We use a triangulation of the HBS with the ENIDE survey.
C. Sweden
1. Breakdown of foods
The only data on current diet is the Riksmaten survey, as noted by Task 1. This is not in all cases very
detailed and requires assumptions to be made regarding recipes, preparation methods and detailed
costs.
Specifically we note categories:
where the actual ingredients or proportion of ingredients are unclear (muesli, pancakes, pizza)
where the origin/animal is unclear (meats, offal, sausages, fish)
which are very vague (cakes, desserts).
We explain our assumptions for this below.
2. Availability of GHGe data
There are a number of papers on GHGe of food, but for the purpose of the exercise we needed to have
a set of data which was consistent and reasonably comprehensive. This requires examination of the full
life cycle (different studies use different endpoints) and consideration of how imported goods are
treated.

90
A study which has considerable data is that of Wallén et al. (reference 9) estimating emissions from
farm to RDC. However, examination shows that this has been produced by examining energy
requirements and converting this directly to CO2, leading to a conclusion that emissions from pork and
beef are roughly similar. In addition, examination of individual figures suggests that the authors
assumed that production of imported goods had the same footprint as those produced locally (for
example, compare values for tomatoes with those from HLCWG). We therefore regretfully did not use
this data.
A more useful survey is done by Carlsson-Kanyama (AJCN 2009) (reference 6) which makes estimates
from farm to table for a number of items. This appears well worked out and consistent, but has many
missing items.
The Swedish Institute for Food and Biotechnology has produced a number of LCAs for different food
products (see reference 5). The figures shown include emissions to the point of consumption. Generally
estimates appear low, for example compared with HLCWG, although this can be partly explained by the
fact that domestic energy emissions in Sweden have lower carbon content (greater reliance on hydro
and nuclear power).
Figures for energy estimates can be derived from Carlsson-Kanyama and Faist and we sought to use
these in making figures compatible. A survey by Orremo (1999) (quoted in SIK report 804 – see
reference 5) states that the average shopping trip is 7.81km and 59% of trips are by private car so
estimates for this component of emissions can be made in the same way as for HLCWG.
Statistics Sweden (2006) estimates the emissions related to different purposes, including food, based
on “operation of vehicles” and “heat energy”, although figures do not include private consumption. An
older report (2003) seeks to categorise emissions by household activity and therefore gives an overall
estimate for emissions for “cooking” (including food) and “shopping” (including food shopping)
(reference 10). This, together with more general assumptions regarding the percentage of emissions
from food (estimated in the range 18-29% in different literature) can give overall figures for emissions
where detail is unavailable.
3. Conversion of data – approach
First of all we make some overall top-down estimates – these are to be used for validation and as
benchmarks only.

91
Statistics Sweden estimates GHGe both directly and indirectly associated with cooking food as
14.39MtCO2e. This does not include shopping, where total direct burden is 8.55MtCO2e, including other
shopping and leisure activities. However, the latest transport survey suggests that 44% of trips not
connected with work relate to shopping and elsewhere that 50% of shopping trips relate to food
shopping. This would give an estimate of the total burden of food consumption as around 16MtCO2e.
From an equally top-down point of view, analysis in other countries suggests that food represents
somewhere between 18% and 29% of overall GHGe. Eurostat figures for 2009 give the total emissions
for Sweden as 59.994Mt giving an estimate for food-related emissions of between 10.8 and
17.4MtCO2e. We can hypothesise that Sweden will be towards the higher end bearing in mind that it
has a generally low per capita emissions pattern but that this is due to the composition of electricity,
while significant parts of the food life cycle relate to carbon-based transport and agriculture.
Using these figures and examining parallels with HLCWG as well as individual LCA reports for Sweden
from SIK, we propose a benchmark of 15MtCO2e: 57% pre-RDC (8.5Mt), 20% RDC to retail including
processing (3.1Mt), 13% transport to consumer (1.9Mt), and 10% cooking and household (1.5Mt).
As with the original LiveWell report, we divide the RDC-to-retail figure in proportion to weight. While this
may not be the most appropriate division, it is difficult to determine from the consumption data whether
food was cooked at home or was bought as ready-meals, so apportioning processing between before
and after retail is not possible in a consistent way.
Where it is possible to use figures from either CK or SIK we have done so, adapting these by
appropriate multiplication factors from the analysis above to gain a figure/kg for the product finally
consumed.
Where there is no figure available we have used HLCWG figures, adapted for post-RDC emissions and
in proportion to imports based on FAOSTAT data, or figures provided by Eat England (generally for
processed foods). For these figures we have also taken into account the fact that consumed weight may
not be the same as the weight at RDC due to wastage (banana skins, bones), cooking (meat shrinkage)
and hydration (pasta). Conversion factors are taken from McCance and Widdowson.
For areas where the categories are broad or vague we have chosen a value based on typical figures for
that type of food using the sources above and informed by any likely concentration (e.g. of types of
fish).

92
In a few areas, there were significant differences between Swedish (CK + SIK) data and UK-based
(HLCWG and Eat England) data. Notably these include eggs and milk. In these cases we have used
Swedish data.
4. Nutritional data
Nutritional data is taken from a public database of nutritional content of different foods. Generally this
gives a more specific value than the broad categories in the Riksmaten survey and so “representative”
foods have been chosen. We revisited some definitions when it became clear which foods are
important.
5. Cost data
We have produced very broad-brush cost data using the approach of triangulating the 2009 HBS from
Statistics Sweden with the Riksmaten survey. This has some dangers, since changes in relative
consumption of different food categories will have an effect on the apparent price (e.g. if Swedes now
eat proportionately more cheese, then the apparent price of cheese will go up). In any case, for some
categories (e.g. dishes with beef) the price can vary by several multiples depending on the quality of the
base item.
Initial comparison of relative prices with those found for a Swedish online retailer suggests that the
relative figures are reasonably consistent.
6. Constraints – nutrition
Sweden publishes two recommendations on diet: the food circle (FC) – see Task 1 report 2.1.3 – and
recommendations on minima and maxima for nutrients (SNR). These are complemented by a study
named Swedish Nutrition Recommendations Objectified (SNO). SNO is not really a “recommendation”
as such, more a way of using the nutritional recommendations to create a specific diet.
The actual recommendation to the general public is to eat at least one portion from each segment of the
food circle each day. This does create a constraint because it requires a significant amount of meat and
dairy. On the other hand, portion sizes seem to be poorly defined and we have had to make estimates
in this respect.

93
We considered using SNO as a constraint for acceptability, but this proved too difficult: following SNO in
detail results in a rigid diet which cannot reduce GHGe adequately, while loosening the bounds merely
means that the constraints are ineffective. Instead, we used the food circle as categorisations and
added a constraint that the relative proportions of foods should not change too much – specifically that
for each food circle category, the LiveWell diet should include consumption of at least 80% of values
used for the SNO diet.
SNO produces a set of sample diets, which we ued when developing a sample LiveWell menu.

94
ANNEX 3 – SENSITIVITY ANALYSIS
France
1. GHGe sensitivity analysis
To analyse the consequences of a step-by-step reduction of GHGe in a healthy diet, we ran four
LiveWell models. The first model has no constraint on GHGe; the others imposed a 25%, 50% and 70%
(related to the 2050 target in UK LiveWell plate) reduction of GHGe. Figure 1 displays the impact on
food choices represented by the National Health and Nutrition Programme (PNNS) food groups. The
model simulating a 70% reduction of GHGe was not feasible. Indeed, the minimum achievable
reduction of GHGe was 1499g CO2e/day (57% reduction) subject to nutrient recommendations as well
as to French FBDGs (Appendix 1). This means that it is not possible to make a healthy diet with a 70%
reduction.

95
Figure 1: Observed diet and optimal food patterns modelling a reduction of GHGe, expressed in PNNS
food groups.
0
1
2
3
4
5
6
observed Free (7% reduction)
25% reduction 50% reduction 70% reduction
Nu
mb
er
of
po
rtio
ns
pe
r d
ay
Fruits and vegetable
Grains
Dairy products
Meat, Fish, Eggs
Fish
Fat
Sweets products
Sugar
Dashed line indicates food categories which were not included in the major food group (indicated by the
same colour).
The grey area indicates that the model was not feasible subject to a 70% reduction of GHGe. For
example, the number of portions of fruit and vegetables do not match with the recommendation (i.e. at
least five portions of fruit and vegetables).
2. Cost sensitivity analysis
Imposing a reduction of cost induced a decrease in GHGe and an increase of the deviation from
observed diet. The minimal cost achievable assuming a healthy diet was €3 per day. A low-cost healthy
diet was compatible with a reduction in GHGe (i.e. 20% from the actual) but huge modifications of food
habits were needed.

96
0
5
10
15
20
6 5.5 5 4.9 4.5 4 3.5 3
Dev
iati
on
per
fo
od
, g
Daily cost, euros
Observed diet4.9 euros/d
Figure 2. Impact of a decreasing cost constraint on GHGe (Panel A) and on the deviation from food
habits (Panel B)
Panel A Panel B
2400
2600
2800
3000
3200
3400
3600
6 5.5 5 4.9 4.5 4 3.5 3
GH
G, g
CO
2 e
q/d
Daily cost, euros
Observed diet3478 g CO2 eq/d4.9 euros/d
Spain
A more general analysis shows a trade-off between reducing emissions and ensuring acceptability
which is not wholly simple. The figure below shows the effect of constraining each foodstuff by numbers
of standard deviations from the current average diet and the effect that this has on GHGe and degree of
variety of foods. This shows that after a certain point making the diet more extreme has little effect on
GHGe. Of course diets here are probably not culturally acceptable, but the graphic gives an impression
of the degree of change needed – and the fact that it does not take a great deal of movement in order to
reduce GHGe by 75%.
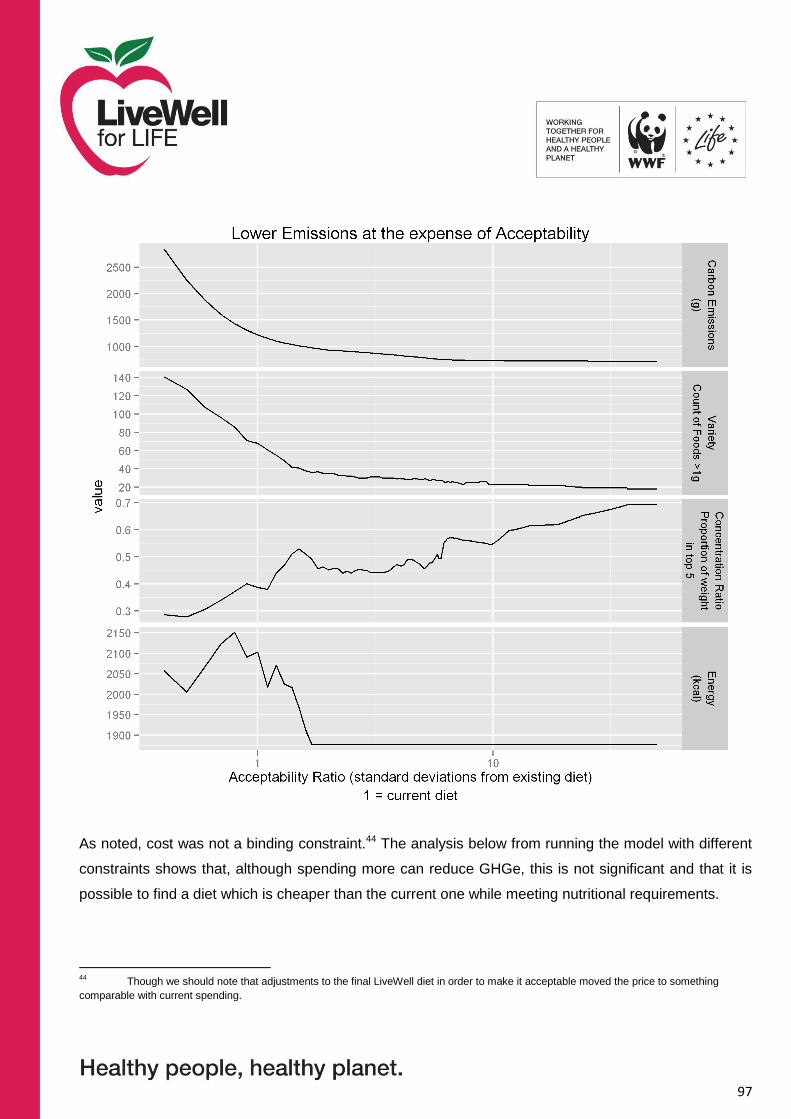
97
As noted, cost was not a binding constraint.44 The analysis below from running the model with different
constraints shows that, although spending more can reduce GHGe, this is not significant and that it is
possible to find a diet which is cheaper than the current one while meeting nutritional requirements.
44
Though we should note that adjustments to the final LiveWell diet in order to make it acceptable moved the price to something
comparable with current spending.

98

99
Sweden
A more general analysis shows a trade-off between reducing emissions and ensuring acceptability
which is not wholly simple. The figure below shows the effect of constraining each foodstuff by multiples
based on consumption of the current average diet and the effect that this has on GHGe and degree of
variety of foods. This shows that after a certain point making the diet more extreme has little effect on
GHGe. Of course diets here are probably not culturally acceptable, but the graphic gives an impression
of the degree of change needed – and the fact that it does not take a great deal of movement in order to
reduce GHGe by 75%.

100
As noted, cost was not a binding constraint.45 The analysis below from running the model with different
constraints shows that, although spending more can reduce GHGe, this is not significant and that it is
possible to find a diet which is cheaper than the current one while meeting nutritional requirements.
45
Though we should note that adjustments to the final LiveWell diet in order to make it acceptable moved
the price to something comparable with current spending.

101
ANNEX 4 – NATIONAL NUTRITIONAL RECOMMENDATIONS
Table taken from Task 1
Note that fat, carbohydrate and protein are expressed as en%. For the purpose of modelling we
converted these to g/day equivalents.

102
ANNEX 5 – PROJECT BRIEF
Note – the brief for task 1 is included for completeness, but this report relates only to task 2
Task 1 – To produce resource material on each pilot country’s current dietary patterns
WWF proposes outlining the content of an average person’s diet from France, Spain and Sweden,
using existing national dietary data. Alongside this the diet related health problems in each country will
be quantified. This will be compared to healthy eating advice in the form the Eatwell plate.
There is plenty of evidence available that the average person in the developed world is eating too much
of the wrong type of food per day resulting in the related health problems. This is an issue recognised in
the EU, and some industry bodies, such as Scientific Advisory Committee on Nutrition, the Food
Standards Agency and the British Dietetic Association in the UK and organisations such as Cancer
Research, the British Heart Foundation and the National Obesity Forum. A key part of this work will be
clarifying the current consumption patterns and their relationship to dietary advice.
The Eatwell plate, published by the UK’s Department of Health, is seen as one of the clearest and most
recognised guides available that demonstrates pictorially the correct amount of food in your diet.
Though it does not display quantities by the different parts, of the plate it is a clear, simple
representation of what a balanced diet should look like. Most European countries take a similar
approach and publish dietary guidance, usually either in plate or pyramid form, though France uses the
less common staircase. This report will take as a basis for nutritional advice from the pilot countries
using it as the definition of that country’s healthy diet. The report will then use each definition of a
healthy plate of food and use it to highlight the difference between that and the average diet in each of
the pilot countries, based on national food consumption data and information from others sources such
as the FAO.
The nutritional advice in the pilot countries will be compared to that in the UK and that in Brussels and
produce a clear comparison of the advice and highlight similarities and differences.
For each country the final report will compare the current diet to a traditional one, identify reasons for
change and where food tends to be sourced. What if any are the health issues and costs of these
issues associated with the new current diet? Are any future trends identifiable if business as usual
continues?

103
For details of an example of sources of information go to appendix 1, though these are not to be seen
as a definitive list, other sources can and will be used.
This task, when completed, will form the basis for task 2 which will further develop these findings.
Outputs
Quantification of current eating habits for each pilot country
Comparison to nutritional advice
Pictorial representation of results
Accompanying report which compares reasons for change, health issues and costs.
Task 2 – To conduct analysis and produce a case study for each pilot country
The environment
WWF has recognised that the current food system has substantial impacts on the environment. As part
of the One Planet Food programme we are looking at both production and consumption, and are
working on seafood, soy, palm oil, meat and dairy, water and agriculture. We are aware that the current
dietary habits of the developed countries are unsustainable and as more and more people start moving
towards the developed world’s high livestock product diet the impact on the natural world will be
magnified and will accelerate habitat destruction and climate change. This will be compounded by the
growing concern around food prices since the 2008 and 2011 price spikes and global food security.
As part of our work on consumption WWF is looking at the role of diet and its impact on the environment
with the various elements being mapped out. Any diet will need to look at the impacts of food
consumption in the pilot country and internationally. The investigation will need to incorporate local and
seasonal food as well as food from the developing world. Where foods come from and the role of
farmers will be different for each country, thus necessitating the need to look at these areas.
LiveWell for LIFE
WWF believes that a healthy diet is sustainable and the questions WWF are asking are ‘is a healthy diet
sustainable? Is it possible? Can we create a LiveWell plate for each of the pilot countries – France,
Spain and Sweden?’ And ‘If current dietary advice is not sustainable what changes would be needed?’

104
As part of this WWF feels it is important to show that meat, dairy and seafood can be part of a healthy,
environmentally friendly diet.
WWF understands that the carbon data might not be available for each individual part of the diet and
this should not be seen as a problem as there is evidence available as to the carbon footprint of many
foods and there has been work conducted recently looking at the sustainable diets of various European
countries (appendix 1) these and others can be used as building blocks for the research. The aim will
be to produce a defined sustainable diet for each pilot country, similar to the LiveWell work in the UK.
WWF-UK is looking for one lead body who if needed can outsource some of the work to the relevant
experts in each country. The aim is not to compare the different diets but to demonstrate what the diet
looks like for each country.
The LiveWell plate for each country could be designed in 2 formats, one with more general sections,
such as the current UK LiveWell plate (appendix 1), with the second more compartmentalised into the
different types of protein, carbohydrates and other nutrients. As there are many sources of proteins it
would be useful to demonstrate the different types and where they can be found. This will demonstrate
that there are many different sources of protein beyond meat and wild caught fish.
An often expressed objection to following the healthy diet or to any changes is food consumption is that
it will be difficult to make the transition or the resultant diet will be dull. This study will need to quantify
the amount of food a person can eat in a week when following the recommendations. The resulting
weekly menus will need to be varied and representative of the country’s culinary heritage.
The proposed diet is meant to be practical, and much like the current Eatwell plate, a section will need
to include foods high in fat and sugar.
Using the research a clear definition of a sustainable diet for each country will be made that can be
expressed pictorially and verbally.
For each country a weekly shopping list will be produced as well as a weekly menu of suggested foods
that incorporates some traditional dishes and cooking styles.
The final recommendations need to be easily communicable as guidance for consumers, based in
science as a tool for retailers and government to build upon. The final plates should have some

105
headline principles that go with it that are appropriate for each country and others for the EU as a
whole; WWF will be able to help with these messages.
The research needs to be nutritionally correct and as such the final LiveWell plate should be presented
to a relevant nutritional body for consultation and approval.
The end work will outline the key principles of a sustainable diet and will be able to be translated in to a
LiveWell plate, with the economic and carbon potential savings being quantified
Once the LiveWell plate has been defined to make it truly sustainable it would be beneficial to explore
whether the diet would have social, economic and other benefits.
Outputs
LiveWell plate for each country in 2 formats
Identify different protein sources
A clear definition of a sustainable diet for each country
A weekly shopping list and menu including typical costs in each country – incorporating
traditional dishes and cooking styles
Easy-to-communicate principles
Economic and carbon savings will be quantified.
Summary
This assignment seeks to show:
Current dietary habits in the pilot countries and the health impacts
The environmental impacts of current consumption patterns in the pilot countries
A sustainable diet for each pilot country
How the LiveWell plate will benefit local traditions and food sectors.
What a weekly diet will consist of, look like and cost for each pilot country
A definition of a sustainable diet for each pilot country
The main work for this assignment is outlined above. Subsequent to task 2, consultants are expected to
provide further commentary around the results and to deal qualitatively with some of the issues not
directly covered by the analysis. The commentary should cover the following questions:

106
A. How would the diet be potentially different for someone in other European states? Northern
European, Southern, Eastern and Western.
B. How would a change to a sustainable diet impact on EU farmers?
This final diet needs to be seen by an approved nutritional or health body to ensure it is possible and
ideally have appropriate publishable support. The final plates need to be peer reviewed.

107
ANNEX 6 – REFERENCES
1 WWF. 2011. Livewell: a balance of healthy and sustainable food choices. WWF-UK,
Godalming, UK
2 WWF. 2010. How Low Can We Go?: An assessment of greenhouse gas emissions from the
UK food system and the scope to reduce them by 2050. WWF-UK, Godalming, UK
3 Maillot M, Darmon N and A Drewnowski. 2010. Are the lowest-cost healthful food plans
culturally and socially acceptable? Public Health Nutrition 13:1178-1185
4 Task 1 report
5 SIK reports, particularly:
794 Greenhouse gas emissions from Swedish consumption of meat, milk and eggs 1990 and
2005 (2009)
802 Food Production and Emissions of Greenhouse Gases – An overview of the climate impact
of different product groups (2010)
804 Environmental Life Cycle Assessment (LCA) of ready meals (2010)
828 Emissions of Greenhouse Gases from Production of Horticultural Products (2011)
6 Carlsson-Kanyama A and González AD. 2009. Potential contributions of food consumption
patterns to climate change. American Journal of Clinical Nutrition 89(5):1704S-1709S
7 Darmon N, Ferguson EL and A Briend. 2002. A cost constraint alone has adverse effects on
food selection and nutrient density: an analysis of human diets by linear programming. Journal
of Nutrition 132:3764-71
8 Millward DJ and Garnett T. 2009. Food and the planet: nutritional dilemmas of greenhouse gas
emission reductions through reduced intakes of meat and dairy foods. Proceedings of the
Nutrition Society 69(1):103-18
9 Wallén A, Brandt N and R Wennersten. 2004. Does the Swedish consumer’s choice of food
influence greenhouse gas emissions? Environmental Science & Policy 7:525–35
10 Statistics Sweden. 2003. Households in the environmental accounts.
http://www.scb.se/statistik/MI/MI1202/2004A01/MI1202_2004A01_BR_MIFT0408.pdf

108
11 Iribarren D, Vázquez-Rowe I, Hospido A, Moreira MT and G Feijoo. 2010. Estimation of the
carbon footprint of the Galician fishing activity (NW Spain). Science of the Total Environment
408: 5284–5294
12 Darmon N, Ferguson EL and A Briend. 2006. Impact of a cost constraint on nutritionally
adequate food choices for French women: an analysis by linear programming. Journal of
Nutrition Education and Behavior 38: 82-90
13 Maillot M, Vieux F, Amiot J and N Darmon. 2010. Individual diet modeling translates nutrient
recommendations into realistic and individual-specific food choices. American Journal of
Clinical Nutrition 91: 421-30
14 Lafay L. 2007. Etude Individuelle et Nationale sur les Consommations Alimentaires, INCA 2
(2006-2007), Paris. Available from: www.afssa.fr/Documents/PASER-Ra-INCA2.pdf [Accessed
13 January 2013]
15 Black AE. 2000. Critical evaluation of energy intake using the Goldberg cut-off for energy
intake:basal metabolic rate. A practical guide to its calculation, use and limitations. International
Journal of Obesity and Related Metabolic Disorders 24: 1119-30
16 Martin A. 2001. Apports nutritionnels conseillés pour la population française. 3 ed. Lavoisier,
Paris, France
17 Audsley E, Chatterton J, Graves A, Morris J, Murphy-Bokern D, Pearn K, Sandars D and A
Williams. 2010. Food, land and greenhouse gases. The effect of changes in UK food
consumption on land requirements and greenhouse gas emissions. The Committee on Climate
Change, London, UK
18 Westhoek H, Murphy-Bokern D. and others. 2012. European Nitrogen Assessment. Special
report on nitrogen and food. In review in public. Available at: www.clrtap-tfrn.org [Accessed 13
January 2013]