climate change conservation sustainability...
TRANSCRIPT

a balance of healthy and sustainable food choices
Livewell:
THIS REPORT HAS BEEN PRODUCED IN COLLABORATION WITH:
Climate change Conservation Sustainability
THIS REPORT HAS BEEN PRODUCED IN COLLABORATION WITH:
JANUARY
2011REPORT

Livewell Report 2011
2
Livewell: a balance of healthy and sustainable food choices
Commissioned by WWF-UK
Authors:
Dr Jennie Macdiarmid
Dr Janet Kyle Dr Graham Horgan
Mrs Jennifer Loe Miss Claire Fyfe
Dr Alex Johnstone Professor Geraldine McNeill

Livewell Report 2011
3
CONTENTS
FOREWORD 5
EXECUTIVE SUMMARY 8
KEY POINTS 10
1. BACKGROUND 11
2. PROJECT BRIEF 12
3. THE DIET OF THE UK POPULATION 14
3.1 Dietary intakes in the UK 14
3.2 Comparison of the UK diet with the Eatwell plate 17
3.3 Greenhouse gas emissions from the UK diet 23
4. Greenhouse gas emission targets for 2020 and 2050 27
4.1 Food-related greenhouse gas emission targets for 2020 and 2050 27
4.2 Methodology: Linear programming to optimise the diets to meet dietary recommendations
and minimise greenhouse gas emissions 28
5. Livewell 2020: healthy and sustainable diet for 2020 30
5.1 Livewell 2020 diet 31
5.2 Livewell 2020 plate 37
5.3 Transferability of Livewell 2020 to other populations and cultures 43
6. Diets for 2050 40
7. Summary 41

Livewell Report 2011
4
8. Uncertainties and limitations of the GHGE data 43
9. Other considerations for a sustainable diet 44
9.1 Broader environmental issues 44
9.2 Economic and ethical issues 48
10. Public health message for a sustainable, healthy diet 50
11. Recommendations for future work 51
12. References 52
13. Appendices 55
Appendix 1: The type of food included in each of the five Eatwell plate food groups 55
Appendix 2: NDNS food groups and allocation to the Eatwell food groups 55
Appendix 3: The contribution of different food in the NDNS to each Eatwell plate food group 59
Appendix 4: Food groups included in the database with upper and lower limits imposed on the amount of
certain food in the Livewell 2020 model 61
Appendix 5: List of food items when no upper or lower limits are imposed on the amount of individual
food in the diet 62
Appendix 6: Micronutrient content of the Livewell 2020 diet 63
Appendix 7: Ingredients in the composite meals in the Livewell 2020 sample menu 63

Livewell Report 2011
5
FOREWORD In January 2009 WWF-UK launched its One Planet Food programme, which aims to reduce the environmental and social impacts of food consumption in the UK. We work across the food chain to reduce greenhouse gas emissions (GHGEs), protect biodiversity and reduce the impact of food on finite water resources. The aim has always been to move away from unsustainable food choices, towards sustainable ones that support global agriculture and biodiversity.
Since 1960 the world’s population has doubled, increasing the demand for food and impacting on the climate and our ecosystems. Agriculture is one of the direct drivers in the growth of GHG emissions, with livestock being a significant contributor. There are also indirect impacts, not least due to growing food to feed livestock, such as poultry and dairy cattle. This has led to vast swathes of biodiversity-rich areas, such as the Cerrado in Brazil, being cleared. This causes deforestation and soil erosion, and requires oil-based fertilisers and pesticides.
Around 70% of all agricultural land is used to grow crops for livestock, a result of an increase in meat consumption (per person consumption of meat in the UK is 79kg, based on slaughtered weight). Agriculture on this scale requires massive amounts of water, and accounts for 8% of the global water supply. If current agricultural trends continue, the impacts will become more severe and increasingly unsustainable. This will be exacerbated by population growth and demand for biofuels.
According to the UN Food and Agricultural Organisation,1 we each consume around 3,500 calories per day in the UK, which is 1,000 too many. We tend to overeat the food which has the greatest impact on our health and on the environment. This growth in our Western diet – one that’s high in meat, dairy and processed food – has been a recent phenomenon (our grandparents didn’t eat like this), and it has occurred at the same time as a growth in Western diseases such as obesity, Type 2 diabetes and heart disease. There is also a huge imbalance in the food system: 1.2 billion people suffer from hunger and malnutrition, while more than 1.2 billion are overweight or obese.
Before working on consumption, WWF looked at the existing advice about food choices. We saw that this was already a very crowded area and we didn’t want to add to the maelstrom of information. We had already noticed that the environmental ’hotspots’ had much in common with the health ones. In an attempt to bring some of these messages together, we decided to look at current governmental eating advice – the Eatwell plate – and to see how it could be adapted to include the environment. The idea was to produce a definition of a sustainable diet that is nutritionally viable – what we call our Livewell plate; a diet that’s good for both people and the planet.
We are working with the Rowett Institute of Nutrition and Health at the University of Aberdeen, which has expertise and extensive experience in food group and nutritional analysis and design, and in developing healthy and specialist diets. This report maps current eating habits and compares them with UK government dietary advice. By following government dietary recommendations we would take a significant step towards a low-carbon diet.
We asked Rowett to look ahead to 2020 and to map how the diet changes in line with predicted increases in population. The modelling shows that our diets will not need to change that much from current guidelines if we are to meet the WWF 2020 GHGE targets. We will still be able to eat meat and dairy, crisps and chocolate, for example. The weekly menu contains fish and chips, macaroni cheese, chicken curry and beef chilli, as well as plentiful amounts of fruit and vegetables – so it’s not a mundane menu. This demonstrates that you do not necessarily have to be vegetarian or vegan to save the planet. The diet is familiar, normal and varied.
This is a first attempt at defining a sustainable diet, and we recognise that it’s not perfect; more needs to be done. The report is based on the best available information in the public domain. And while the
1 FAOSTAT, table D1 – Dietary energy protein and fat consumption http://www.fao.org/economic/ess/publications-
studies/statistical-yearbook/fao-statistical-yearbook-2009/d-consumption/en/

Livewell Report 2011
6
reader may be able to debate some of the detail of this report, we firmly believe the overall story (more plants, less meat, less processed food) won’t change. The Livewell plate is the first step towards a sustainable diet and we hope it will be built upon.
Recommendations If we really want to avoid climate change and conserve the ecosystems on which we all depend, it’s clear that we have to tackle both what we produce and consume. To progress this work, WWF believes that the UK government and retailers need to urgently develop and promote eating habits based on a sustainable diet if we are to address climate change, protect ecosystems and start to reverse the impacts of poor nutritional choices and promotions on people’s health.
Led by the Department of Environment, Food and Rural Affairs and the Department of Health, the UK government should define a sustainable diet and convene a debate of all stakeholders including retailers, farmers, civil society, communities and civil servants.
The government should use the principles of a sustainable diet to inform its procurement strategy and to ensure meals supplied in all areas where public procurement standards are enforced follow these guidelines.
Further research needs to be conducted to incorporate other environmental elements, as well as social and economic aspects, into the Livewell plate.
Retailers should promote food choices that make it easier for consumers to follow a sustainable diet. The role of consumer choice ‘editing’ by retailers could be instrumental in facilitating change – for example, highly processed food could be reformulated to follow the Livewell guidelines.
Duncan Williamson Programme Manager One Planet Food WWF-UK

LIVING WELLWhen it comes to food we’re all a bit weary of being told what to do. And the conflicting reports we hear make it all sound a bit complicated.
Well – here’s some good news! Things might be a good deal simpler than you think. What’s healthy for people is – more or less – healthy for the planet too.
The food we eat – growing, producing and importing it – has a massive impact on the planet, from the Cerrado savannah in Brazil to the forests of Borneo. And food is responsible for 30% of the UK’s CO2 emissions, adding to the threat of dangerous climate change.
But you can help the environment by eating more fruit, vegetables and cereals – and less meat and processed food. And, of course, that’s better for you too.
wwf.org.uk/livewell2020
© W
WF-C
an
on
/ RiC
ha
Rd
Sto
ne
ho
uS
e

Livewell Report 2011
8
EXECUTIVE SUMMARY With increasing recognition of the environmental impact of food and drink, future food policy and dietary advice need to go beyond the traditional focus on nutrient recommendations for health to include wider issues of sustainability. The task should not be underestimated, not least because the issue of sustainability is complex with multiple dimensions, including environmental, economic and social aspects. Current dietary advice is based on nutrient recommendations for health. These recommendations have been translated by the Food Standards Agency into a health education tool for the public, known as the Eatwell plate. The plate illustrates the proportions of major food groups that should be included in a healthy diet. It is now recognised that this advice needs to be extended to integrate sustainability.
The Climate Change Act 2008 set out targets to reduce greenhouse gas emissions (GHGEs) 2. At present it is estimated that 18-20% of GHGEs in the UK come from the food chain. In response to climate change, WWF-UK’s One Planet Food Programme (2009-12) set goals to reduce GHGEs from the consumption and production of food destined for the UK by at least 25% by 2020 and by 70% by 2050 (based on 1990 emission levels). This will require changes to both the supply side (food production) and the demand side (food consumption) within the food supply chain. As part of the WWF programme, this project was designed to incorporate issues of environmental sustainability, in particular reduction in GHGEs, into the Eatwell plate advice to develop what WWF terms the ‘Livewell’ plate. The main questions addressed in this report are:
1. What is the nutrient intake and the GHGEs of the UK population’s diet?
2. What would WWF’s Livewell plate and diet look like if they met both current dietary recommendations and the 2020 target of a 25% reduction in GHGEs?
3. Is it possible to achieve a diet with 70% reductions in GHGEs by 2050 and still meet current dietary recommendations?
To answer the first question, dietary intake data from the National Diet and Nutrition Survey (NDNS) for adults aged 19-64 years (2000/01) was compared with nutrient recommendations for health and the Eatwell plate. This confirmed the fact that the UK diet is too high in saturated fat, sugar and salt, and low in fibre compared with dietary recommendations. Furthermore, a shift to more fruit, vegetables and starch-based food and to fewer high fat and/or sugar types of food and high protein-based food (particularly meat) is needed. From the NDNS data it was estimated that the GHGE from the UK adult diet was 7.14kgCO2e/adult/year, which is similar to previous estimated annual UK food chain GHGE figures.
To address the second question, the main task of the project was to develop a Livewell 2020 diet that would meet the 2020 target for reductions in GHGEs and dietary recommendations for a healthy diet. This required GHGE data for different food commodities to be matched to the actual food items consumed in the diet, as well as adjusting the GHGE reduction targets (expressed as kgCO2/person/day) to take into account projected population growth by 2020 and 2050. It was assumed that GHGE reductions would be made to both the supply and demand sides within the food chain.
2 There are six main greenhouse gases which cause climate change and are limited by the Kyoto protocol. Each gas has a different global warming potential. For simplicity of reporting, the mass of each gas emitted is commonly translated into a carbon dioxide equivalent (CO2e) amount so that the total impact from all sources can be summed to one figure.

Livewell Report 2011
9
To address the second question, the main task of the project was to develop a Livewell 2020 diet that would meet the 2020 target for reductions in GHGEs and dietary recommendations for a healthy diet. This required GHGE data for different food commodities to be matched to the actual food items consumed in the diet, as well as adjusting the GHGE reduction targets (expressed as kgCO2/person/day) to take into account projected population growth by 2020 and 2050. It was assumed that GHGE reductions would be made to both the supply and demand sides within the food chain.
Total GHGEs from the food supply can be split by a nominal boundary of the regional distribution centre (RDC), i.e. primary commodity production and transport to the RDC (pre-RDC) and processing, transport to retail, storage, preparation and waste (post-RDC), in the ratio of 56:44 (Audsley et al. 2009). It is recognised, however, that this is only a nominal boundary as it is not always clear exactly where primary production ends and processing begins for different types of food. Given the limited data available for post-RDC for individual food commodities, the focus in this report was on changing food choice using pre-RDC GHGEs for which there is more comprehensive data. Using the mathematical modelling technique of linear programming, a diet was created from a list of food by placing a number of constraints on the model to ensure that nutrient recommendations were met and GHGEs minimised. For the Livewell 2020 diet additional constraints were built in, placing either upper or lower weight limits on individual food items that could be included in the diet to make it more acceptable to the UK population.
The resulting list of food items, which could be viewed as an example of a ‘shopping list’ for a week, was used to create a seven-day sample menu to demonstrate that food could be combined into a recognisable and varied diet, with examples of the type of meals. The menu was only an illustration as there are many different ways in which the food could be combined and therefore should not be interpreted as a definitive diet. There are many different combinations of food that could meet dietary recommendations and GHGE targets; substitution of food in the list could take into account variations in food preferences, seasonality, culture or nutrient needs.
The diet includes both meat and dairy products, though quantities are reduced compared with the current UK diet. The inclusion of these commodities is intentional, as it is considered unrealistic to expect the population to make radical changes, such as wholly eliminating these food types from their diet by 2020 (less than 5% of the UK population report being vegetarian or vegan). Smaller quantities of meat will mean changing eating patterns to either fewer meat-based meals or smaller quantities within a meal. The cost of food for the Livewell 2020 diet was estimated to be £28.40 per person per week based on mid-range supermarket products in August 2010, which is slightly less than the average household spend of £32.12 per person on food in 2009.
The Livewell plate developed for 2020 provides additional detail within some of the original Eatwell food groups, such as the proportion of the different sources of protein-based food. For example, in the Livewell 2020 plate only about a third comes from meat, which is significantly less than in the UK diet. The plate needs to be developed further to include additional dimensions of sustainability – for example the fruit and vegetable food group could be sub-divided to take into account seasonality and energy efficiency of production methods. A similar approach could be adopted for each of the five main food groups on the Eatwell plate.
Thirdly, it was shown that it was possible with the right combination of food to achieve a 70% reduction in GHGEs (2050 target) while still achieving dietary recommendations for health, but the range of food would be limited. Furthermore, it would be much more difficult to create a sensible diet from the list of food. A 2050 diet could include food such as meat and dairy, but in very much smaller amounts than the current diet; this would only be achievable by limiting the range of other food in the diet. It was concluded that it was unrealistic to create an actual diet as it could only be based on food available today and current estimates of GHGEs for food commodities, both of which are likely to change over the next 40 years. Taking a holistic approach to the diet, this project has shown that a healthy and low-GHGE

Livewell Report 2011
10
diet can include a moderate amount of food types classed as ‘unhealthy’ or food with high GHGEs by balancing them with other lower GHGE food across the rest of the diet.
In this report, only GHGEs have been addressed but other environmental, social and ethical aspects of sustainability could be included in future to explore wider impacts, as well as identifying any possible unintended consequences of changing the diet. This project should be viewed as a first step towards developing a diet that meets both dietary recommendations and GHGE targets, which has been shown to be possible. The real challenge will be to develop a clear, consistent message for the public and to find ways of supporting change towards a diet for a healthy population and environment. It is clear, however, that a reduction in GHGEs from the UK diet is needed now, and that action should be taken to initiate real change in the UK diet so that we move towards a diet that is healthier and more sustainable.
KEY POINTS
The UK diet is too high in saturated fat, sugar and salt and too low in fibre, while the types of food eaten are also contributing high GHGEs. It is therefore neither sustainable for health nor the environment.
A diet can be achieved which meets dietary recommendations for health and the GHGE
reduction targets for 2020, without eliminating all meat and dairy products. Rebalancing the UK diet in line with the Eatwell plate and reducing meat-based proteins could achieve a diet that would meet the 2020 GHGE target.
Meeting the GHGE targets for 2050 and dietary recommendations will require a radical shift in
food consumed, though it would be possible to include some meat or dairy products in very small amounts if other food in the diet were low in GHGEs.
As the GHGE targets are based on an annual emissions value and the UK population is
projected to grow by 2020 and 2050, it follows that the reduction in GHGEs will need to be even greater than 25% and 70% per person respectively. To achieve these targets changes will be needed in both food production and consumption.
Using a relatively simple mathematical modelling technique to achieve a holistic approach to
healthy and sustainable diets illustrates that future food choice is about balancing food in the diet, not eliminating them. This flexible approach allows different cultural, religious and individual dietary needs or preferences to been taken into account.
This report provides a starting point for understanding healthy sustainable diets, with future
work needed to integrate wider issues of sustainability into the modelling process and to develop broader dietary advice.

Livewell Report 2011
11
1. BACKGROUND
In 2008 the Cabinet Office published Food Matters: Towards a Strategy for the 21st Century (Cabinet Office 2008), which set out some of the concerns about current food consumption in the UK and its impact on health, and the economic, social and environmental sustainability of food production. It concluded that the current diet is not sustainable for either public health or the environment. In brief, the diet of the UK population is failing to meet dietary recommendations, with high intakes of saturated fat, sugar and salt, and low intakes of fruit and vegetables (Henderson et al. 2003, FSA 2010). It is estimated that 70,000 premature deaths a year in the UK could be avoided if the population met energy and nutrient recommendations. In addition current dietary patterns have a significant environmental impact (Cabinet Office 2008). It is estimated that 18-20% of the total UK greenhouse gas emissions (GHGEs) come from the food chain; from production, processing, transport, storage, consumption and waste (Garnett 2008).
In terms of economic stability and growth, in 2008 the UK food and drink industry accounted for 7% of the national output, supporting about 3.7million jobs (Cabinet Office 2008). Trying to balance these complex elements of sustainability poses an enormous challenge. While some synergies can be found there are also a number of conflicting goals and potential tensions. For example, a recent report by the Sustainable Development Commission (SDC) suggested that while reducing the consumption of food and drink with low nutritional values could have a positive impact on public health, environmental sustainability and social inequalities, it could possibly have a negative impact on economic sustainability (SDC 2009). These issues can no longer be addressed in isolation. This has led to calls for better integration of health and environmental impacts in future food policies to reduce the likelihood of conflict and unintended consequences of action or policy. In January 2010 the UK government launched ‘Food 2030’, a new national food strategy and the first for 50 years (UK government 2010)3. It set out a vision for 2030 to develop an integrated approach to food policy linking sustainability, food security and health. This is complex and is likely to be challenging, not least because currently there is no agreed definition of a sustainable diet.
With increasing global temperatures and the impact of climate change, it is accepted that there needs to be a reduction in global GHGEs which are contributing to climate change. As part of the UK Climate Change Act 2008 (www.legislation.gov.uk/ukpga/2008/27) targets were set to cut the total annual GHGEs in the UK by at least 80% by 2050, with an interim target of a reduction of 34% by 2020 (based on the 1990 levels). The food system is a major contributor to GHGEs, with the food chain estimated to account for approximately a fifth of total GHGEs in the UK, the majority of which are thought to come from agriculture (Garnett 2008). GHGs are produced at all stages of products’ life cycle, including agriculture, food production, processing, packaging, storage, transport, retailing, preparation, consumption and waste – but there is limited detailed and accurate data on each of these stages for individual food commodities. Assessing the GHGEs of a product, using life cycle analysis (LCA), is complex and the methods and assumptions made are not always consistent – for example the variables included in the calculations may vary (e.g. direct and indirect emissions). In 2007 the British Standards Institute developed the Publicly Available Specification 2050 (PAS 2050) at the request of the Department of Environment, Food and Rural Affairs (Defra) and the Carbon Trust to provide a method for measuring the embodied GHGEs from goods and services (PSA 2050, 2008). The guidelines designed to standardise the method of assessment and to help make the comparison of GHGEs between products easier in the future were published in 2008 and a review of them is due to be published in 2011. One of the benefits of using an LCA to evaluate the environmental burden of a product is that it can help to identify where GHGE savings can be made. Also, looking at the whole life cycle of a product rather than sections in isolation, can help avoid artificial or misguided savings. For example, reducing refrigeration of produce may save emissions
3 It is unclear at the time of writing how the UK government will take this forward.

Livewell Report 2011
12
during storage but could result in greater levels of food waste (Garnett 2008). This area of work is evolving rapidly as more is understood about GHGEs in the food chain, but it now needs to be linked to the impact of diet on health. It should also be noted that GHGEs (often referred to as the carbon footprint) are only one of many environmental impacts of the diet, with others including water use, biodiversity and land change. For this project, however, the focus was on GHGEs. It is generally agreed that on average meat and dairy products are the most GHG-intensive relative to other food groups, with most emissions coming from the agricultural stage of the LCA (Garnett 2008). To make sustainable cuts in GHGEs from the food chain, changes are needed in both the supply side (food production) and the demand side (food consumption). Attempts to meet GHGE targets from the food chain must not be made in isolation because any dietary recommendations to reduce GHGEs must also meet dietary requirements for the health of the population. The most recent population-based energy and nutrient requirements were published in 1991 by the Department of Health (DoH 1991), with subsequent recommendations for specific food items such as fruit and vegetables, red and processed meat, and fish set by other organisations such as the Food Standards Agency (FSA 2007, WCRF 2007) and the World Cancer Research Fund. The Department of Health dietary recommendations are now almost 20 years out of date and the evidence on which they were based even older. Some of the recommendations are currently under review but were not available at the time this project was completed.
Despite the long-established recommendations and public health messages, the population is still failing to achieve a healthy balanced diet. To date public health messages for dietary intakes have focused on the impact on health outcomes and have not addressed any of the wider issues relating to sustainability. It is recognised that this could be complex, but it is important to add some of the wider issues of sustainability into current dietary advice if a single, consistent message about the diet is to be given to the public, government and industry. The next step therefore is to build on the dietary recommendations for health to incorporate broader environmental and social issues of sustainability. This work is in its infancy with no consensus on the definition of a sustainable diet; indeed, it is still not known if it is even possible to have a diet that is environmentally, socially and economically sustainable that will also meet dietary requirements for health.
2. PROJECT BRIEF This project was funded by WWF-UK as part of its One Planet Food Programme (2009-2012). The programme aims to reduce the global environmental and social impacts of UK food consumption and help safeguard the natural world, tackle climate change and the way we live. It is intended to stimulate debate about how changes in the UK diet may go some way towards achieving the programme goals outlined in Box 1.
Given the short timeframe and scope of the present project, the work focused on the first of the One Planet Food Programme goals, which is to reduce GHGEs from the production of food destined for and consumed in the UK. Inclusion of broader environmental (e.g. water usage, land use, biodiversity) and ethical issues of sustainability is outside the scope of the project but some of these issues are discussed later in the report (section 9). The aim of the project was to explore what a diet which met both energy and nutrient requirements for a healthy balanced diet and a reduction in GHGEs might look like. Meat and dairy products are viewed as the most GHG-intensive food commodity (Garnett 2008), but they should not simply be removed from the diet as they can contribute a range of essential nutrients required for a healthy diet, such as iron, essential amino acids, zinc, B vitamins and calcium.

Livewell Report 2011
13
In terms of GHGEs, the goal of the One Planet Food programme is to reduce food-related GHGEs by at least 25% by 2020 and by 70% by 2050, based on 1990 levels. In 1990 the total level of GHGEs in the UK was estimated to be 776.1MtCO2e4 (DECC 2010), with direct emissions from the food supply chain accounting for 18-20% of total GHGEs – equivalent to approximately 152.183MtCO2e per year (133-171 MtCO2e (95% CI)) (Audsley et al. 2009). The food-related emissions targets for 2020 and 2050 are therefore approximately 114,137ktCO2e and 45,655ktCO2e per year respectively. It should be noted that these figures do not include the impact of land use change, which is estimated to account for an additional 102,000ktCO2e per year.
The specific objective was to take the principles of the Eatwell plate (FSA 2007), which was designed to illustrate the balance of food and drinks that should be consumed for a healthy diet, and develop a ‘Livewell’ plate. The Livewell plate would be designed not only to achieve the dietary recommendations for health but also meet the GHGE targets. In the short term, not only does the diet need to meet both these requirements but any future diet also needs to be acceptable to the UK consumer if we are realistically to expect people to change their current diet. For example, the approach taken here was to reduce the quantities of GHG-intensive food eaten, such as meat and dairy products, rather than eliminate them completely from the diet. This can be achieved either by eating smaller portions or eating them less frequently.
The questions posed for the project were:
i. What is the average food and nutrient intake of the UK population?
ii. How does the UK diet compare with dietary recommendations and the Eatwell plate?
4 GHGEs are expressed as carbon dioxide equivalents (CO2e), which is a universal unit to represent GHGs (carbon dioxide is the most abundant of these gases, but methane, nitrous oxide and some refrigerant gases have a more significant impact in terms of global warming potential).
Box 1: One Planet Food Programme
“By 2050 the key social and environmental impacts of food production and consumption have been reduced and the UK has moved to a one planet food system.” Goals for 2020:
To reduce GHGEs resulting from the production and consumption of food consumed in the UK by at least 25% based on 1990 levels.
To ensure more than 80% of the total water footprint related to food consumption in the UK rests on areas where water use does not exceed the water limits of the concerned area.
To halt habitat loss within our priority biodiversity places caused by food production destined for and consumed in the UK,
Goals for 2050:
To reduce GHGEs resulting from the production and consumption of food consumed in the UK by at least 70% based on 1990 levels.
To ensure that all water usage in the production of food consumed in the UK has no unacceptable socio-economic or environmental impacts.
By 2050, the major adverse socio-economic and environmental impacts of production
and consumption of food consumed in the UK is eliminated within key global ecosystems.

Livewell Report 2011
14
iii. What is the GHGE from the UK diet?
iv. Based on the Eatwell plate, what would an equivalent ‘Livewell 2020’ diet and plate look like if it were to meet the 2020 reduction in GHGE target (25%) and current dietary recommendations?
v. Would it be possible to achieve a 70% reduction in GHGEs by 2050?
At the outset it should be stressed that the published data available for GHGE for food and drinks is very limited and the values are only approximate. Values can vary between different sources of data, with inconsistencies partly explained by differences in the assumptions made in the calculations and methodologies used to estimate GHGEs. While this makes it difficult to combine datasets, the general hierarchy of GHGEs from different food groups is reasonably consistent. Unlike the national food and nutrient composition databases, which contain nutrient information for an extensive range of food and drinks, there is no equivalent database for GHGEs from food and drink available. The lack of standardised GHGE data was one of the big challenges for this project, so assumptions based on the published data had to be made to develop a database of GHGE for food. The project was completed in four months (July to October 2010) and this should be viewed as a scoping report. The ‘Livewell diet’ is the first step in estimating what future diets could look like and is the starting point for more detailed future work in this area. In time, as more detailed and accurate GHGE data becomes available, this work can be updated and developed.
3. THE DIET OF THE UK POPULATION The purpose of this section of the report is to describe the diet of the UK adult population and compare it with recommended intakes of energy and nutrients and the Eatwell plate. The data presented is taken from the National Diet and Nutrition Survey (NDNS) carried out in 2000/01 (Henderson et al. 2003) and is based on reported consumption data – not purchase or expenditure data.
3.1 Dietary intakes in the UK The dietary habits of the UK population are based on data from the NDNS of adults aged 19-64 years carried out in 2000/01 (Henderson et al. 2003). This is a national cross-sectional survey to assess the dietary habits and the nutritional status of a representative sample of men and women. Dietary intakes were assessed using self-completed seven-day weighed dietary records, where the participant is required to weigh (wherever possible) and record all food and drink consumed during a seven-day period.
A total of 833 men and 891 women aged 19-64 years completed the survey. Although the 2000/01 NDNS is almost 10 years out of date, it was used in this project because it is the most recent complete national dietary survey. The NDNS is currently being repeated as a new rolling programme which started in 2008 and is still ongoing (FSA 2010). Some preliminary results have been published from the new survey but the sample size is small, with dietary data for only 434 people, and the data at this early stage is unlikely to be representative of the UK population. It was therefore decided to use the data from the completed 2000/01 survey which has a much larger sample and would be more representative of the population. The 2000/01 data, however, was compared with the limited data from the 2008/09 programme for indications of any dietary changes in the population over this time.
The Department of Health published dietary reference values (DRVs) for food energy and nutrients for the UK in 1991 (DoH 1991). These are guidance values for recommended daily intakes for the population and the terminology for the DRVs used in this report is described in Box 2.

Livewell Report 2011
15
The energy and nutrient intakes for men and women from the 2000/01 NDNS are shown in Table 1.
Table 1: Energy and nutrient intakes per day of the UK population, based on the NDNS (2000/01)
Energy and nutrient Intakes per day
Men (n=833)
Women (n=891)
Recommendations: men (women)
Energy (kJ) Mean (SD)
9720 (2446) 6870 (1758)
10,600 (8,100) kJ/d*
Median 9620 6880
Protein (g) Mean (SD)
88 (33) 64 (17) 65 (53) g/d**
Median 87 63
Protein (% food energy) Mean (SD)
16.5 (3.6) 16.6 (3.5)
Median 16.1 16.3
Total fat (g) Mean (SD)
87 (28) 61 (22)
Median 84 60
Total fat (% food energy) Mean (SD)
35.8 (5.6) 34.9 (6.5) <35% food energy
Median 36.0 34.7
Saturated fat (g) Mean (SD)
33 (12) 23 (10)
Median 31 22
Saturated fat (% food energy) Mean (SD)
13.4 (2.9) 13.2 (3.3) <11% food energy
Median 13.4 13.1
Total carbohydrate (g) Mean (SD)
275 (79) 203 (59)
Median 269 203 Total carbohydrate (% food energy)
Mean (SD)
47.7 (6.0) 48.3 (6.7) >50% food energy
Median 48.0 48.4
Non-milk extrinsic sugar (NMES) (g)
Mean (SD)
79 (44) 51 (33)
Median 71 44
NMES (% food energy) Mean (SD)
13.6 (6.7) 11.9 (6.5) <11 % food energy
Box 2: Terminology for dietary reference values
Estimated average requirement (EAR): the average amount of energy or nutrients required for people in different age groups and for men and women.
Reference nutrient intake (RNI): the amount of a nutrient which is enough to meet the dietary requirements of about 97% of the population. Intakes above this value are considered adequate.
Livewell Report 2011
16
Median 12.5 10.9
Fibre (g) [non-starch polysaccharides]
Mean (SD)
15 (6) 13 (5) 18 (18) g/d
Median 14 12
Iron (mg) Mean (SD)
13.2 (4.8) 10.0 (3.7) 8.7 (14.8) mg/d**
Median 12.6 9.6
Calcium (mg) Mean (SD)
1007 (411) 777 (269) 700 (700) mg/d**
Median 979 752
Zinc (mg) Mean (SD)
10.2 (3.2) 7.4 (2.1) 9.5 (7.0) mg/d**
Median 9.9 7.3
Folate (µg) Mean (SD)
344 (127) 251 (90) 200 (200) µg/d**
Median 327 245
Vitamin B12 (µg) Mean (SD)
6.8 (5.9) 5.1 (4.6) 1.5 (1.5) µg/d**
Median 5.6 4.4
Sodium (mg) Mean (SD)
3313 (1015) 2302 (638) 1600 (1600) mg/d**
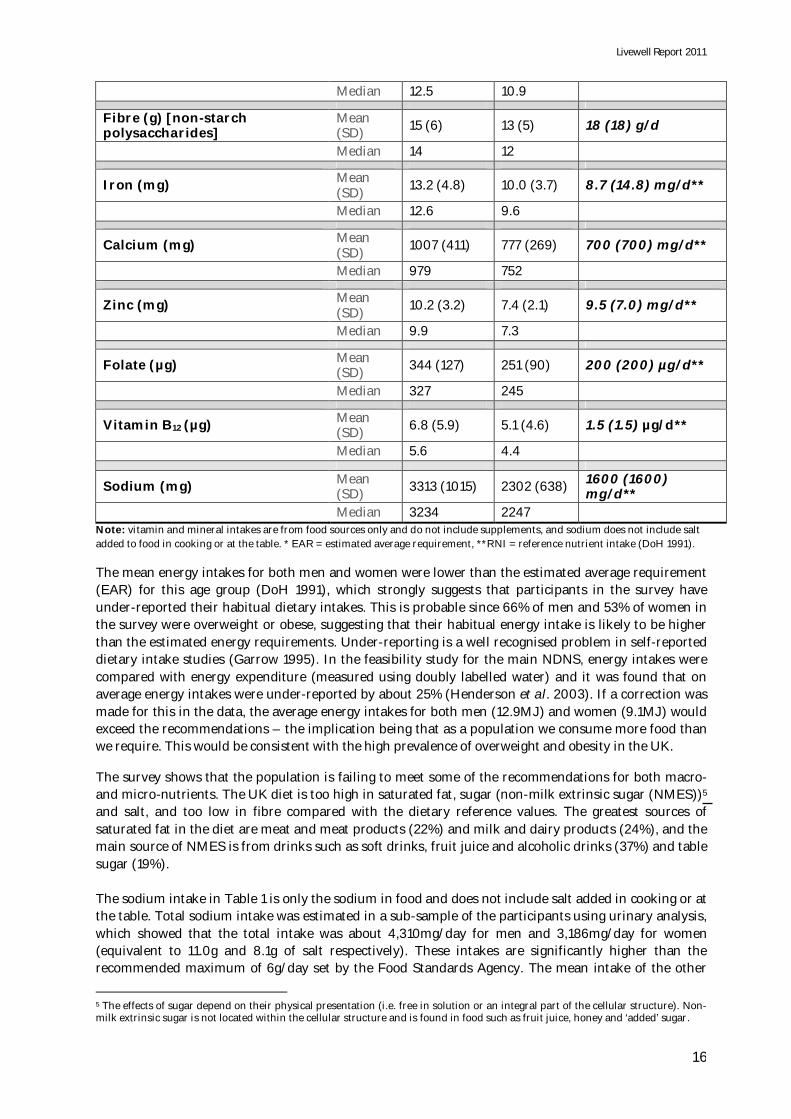
Median 3234 2247 Note: vitamin and mineral intakes are from food sources only and do not include supplements, and sodium does not include salt added to food in cooking or at the table. * EAR = estimated average requirement, **RNI = reference nutrient intake (DoH 1991).
The mean energy intakes for both men and women were lower than the estimated average requirement (EAR) for this age group (DoH 1991), which strongly suggests that participants in the survey have under-reported their habitual dietary intakes. This is probable since 66% of men and 53% of women in the survey were overweight or obese, suggesting that their habitual energy intake is likely to be higher than the estimated energy requirements. Under-reporting is a well recognised problem in self-reported dietary intake studies (Garrow 1995). In the feasibility study for the main NDNS, energy intakes were compared with energy expenditure (measured using doubly labelled water) and it was found that on average energy intakes were under-reported by about 25% (Henderson et al. 2003). If a correction was made for this in the data, the average energy intakes for both men (12.9MJ) and women (9.1MJ) would exceed the recommendations – the implication being that as a population we consume more food than we require. This would be consistent with the high prevalence of overweight and obesity in the UK.
The survey shows that the population is failing to meet some of the recommendations for both macro- and micro-nutrients. The UK diet is too high in saturated fat, sugar (non-milk extrinsic sugar (NMES))5 and salt, and too low in fibre compared with the dietary reference values. The greatest sources of saturated fat in the diet are meat and meat products (22%) and milk and dairy products (24%), and the main source of NMES is from drinks such as soft drinks, fruit juice and alcoholic drinks (37%) and table sugar (19%). The sodium intake in Table 1 is only the sodium in food and does not include salt added in cooking or at the table. Total sodium intake was estimated in a sub-sample of the participants using urinary analysis, which showed that the total intake was about 4,310mg/day for men and 3,186mg/day for women (equivalent to 11.0g and 8.1g of salt respectively). These intakes are significantly higher than the recommended maximum of 6g/day set by the Food Standards Agency. The mean intake of the other
5 The effects of sugar depend on their physical presentation (i.e. free in solution or an integral part of the cellular structure). Non-milk extrinsic sugar is not located within the cellular structure and is found in food such as fruit juice, honey and ‘added’ sugar.

Livewell Report 2011
17
micronutrients listed in Table 1 met the dietary requirements, with the exception of iron intake which among women was below the recommended intake. The intake of other vitamins and micronutrients were within dietary recommendations (LRNI) for more than 90% of the UK population (full details can be found in the NDNS report (Henderson et al. 2003)). The intake of protein was between 23g/day and 11g/day higher than the dietary reference value for both men and women respectively and accounted for about 16-17% of food energy. The absolute intake of some of these nutrients is likely to be even higher than presented because of dietary under-reporting in the survey. Overall the results show that for public health the diet of the UK population needs to change in order to meet dietary recommendations. This data is taken from dietary intakes of adults in 2000/01 but the first wave of results from the NDNS rolling programme suggest that the diets in 2008/09 have changed very little in terms of energy and nutrient intakes (FSA 2010). The energy intakes in 2008/09 NDNS are reported to be 9.48MJ for men and 6.92MJ for women, with intakes of saturated fat (13.0% and 12.6% for men and women respectively) and NMES (13.0% and 12.1% for men and women respectively) still not meeting dietary recommendations. A more recent FSA survey of sodium intake suggests that intakes of salt may have reduced slightly (9.7g for men and 7.7g for women) but again are still higher than dietary recommendations (FSA 2008).
3.2 Comparison of the UK diet with the Eatwell plate The Eatwell plate: The Food Standards Agency’s Eatwell plate shown in Figure 1 (see page 18) is a health education tool designed to illustrate the proportion in which food should be eaten to make up a healthy diet (www.Eatwell.gov.uk/healthydiet/Eatwellplate/). The plate is divided into five food segments, with the proportions of each segment based on the dietary reference values for the population. These proportions were used in the national food guidelines developed in 1994 for the original plate called ‘the balance of good health’ (Hunt et al. 1995). The plate aims to translate scientific nutrient information into actual food in a pictorial form, making it easier for the consumer to understand. The purpose was to provide a single source of dietary information to convey a consistent message to the public about how to achieve a healthy balanced diet. In 2007, ‘the balance of good health’ was re-launched by the FSA as the Eatwell plate.
The plate shows the relative proportions of what consumers should eat from each of the five food groups. The plate is divided into the following food groups:
fruit and vegetables 33% bread, rice, potato, pasta and other starchy food 33% meat, fish, eggs, beans and other non-dairy sources of protein 12% milk and dairy 15% food and drink high in fat and/or sugar 8% TOTAL 101%*
* As noted in the original document by Gatenby et al. (1995) the total adds up to 101% due to rounding up.
A more detailed description of the range of food included in each segment is described in Appendix 1. The size of each segment was calculated on the relative consumption of food within each segment to ensure that a national average diet would be consistent with the dietary reference values (Gatenby et al. 1995). The segments are based on the weight of the food but do not include frequency of servings, portion size or any specifications of the proportion of different types of food within each segment. The plate should be used as a guide for achieving a balance over a period of time, such as a week (not at each meal). It applies to most of the population since it refers to the proportions of food and drinks to be consumed, rather than quantity or portion sizes. In conjunction with the plate, the FSA has expanded some of the recommendations about the five sections (Box 3).

the eatwell plate
8%
33%33%12%15%
* As noted in the original document by Gatenby et al. (1995) the total adds up to 101% due to rounding up.
Fruit and vegetables
Bread, rice, potato, pasta & other starchy foods
Milk & dairy
Food & drinks high in fat & / or sugar
Meat, fish, eggs, beans and other non-dairy sources of protein
Figure 1: The Eatwell Plate (Food Standards Agency) The plate shows consumers how the relative proportions of what they eat should come from each food group. The plate is divided into five food groups:
total 101%*
Source: Department of Health in association with the Welsh Assembly Government, the Scottish Government and the Food Standards Agency Northern Ireland.
© C
ro
WN
Co
py
rIG
Ht

Livewell Report 2011
19
There are a number of adjustments and considerations that need to be taken into account not only when using the plate, but also when comparing it with the diet of the UK population:
1. The volumes of milk and fruit juices included have to be halved to compensate for their high water content (and therefore weight).
2. Soft drinks are included in the plate as their sugar content (by weight) to compensate for the weight of water.
3. Not all dairy products are included in the ‘milk and dairy’ section of the plate. Butter, cream and ice-cream are grouped under ‘high fat and/or sugar food’, as they are principally considered a source of fat and energy.
4. Alcohol and miscellaneous food such as sauces, pickles, tea and coffee are not included in the plate.
5. There is no comprehensive list of food published which clearly describes to which of the five Eatwell sections it should belong, and for some types of food it is not clear where they fit.
6. The plate is based on basic food commodities and does not include composite dishes.
Most composite dishes, such as pizza, casseroles, macaroni cheese and sandwiches, span several food groups on the plate. As the plate is designed as a tool to educate about the balance of food groups, it is difficult in its current form to accommodate composite dishes (Gatenby et al. 1995). This relies on the consumer being able to identify the different food groups in composite dishes and visualise their proportions, but it is not known whether most consumers today can do this. The lack of composite dishes also makes it more difficult to compare the UK dietary intake from surveys such as the NDNS with the Eatwell proportions.
Comparison of the UK diet with the Eatwell plate recommendations: The aim was to try and display the UK diet in the five Eatwell food groups, in order to estimate how far it is from a ‘healthy balanced diet’. To estimate the contribution of the different food and drinks in the current UK diet, 106 food groups (excluding toddlers’ drinks, supplements, sweeteners and water) from the NDNS were allocated to one of the five food groups in the Eatwell plate (see Appendix 2). Adjustments were made for the weight of liquids such as milk, fruit juice and soft drinks, as described above. The NDNS food group for meat includes composite dishes such as lasagne, shepherd’s pie and casseroles, while beans and pulses in composite dishes are included in the category of ‘vegetables’. It is not possible to separate out the main ingredients to match the Eatwell groups.
Box 3: Food Standards Agency recommend that we should try to eat: plenty of ‘fruit and vegetables’ (at least five portions a day)
plenty of ‘bread, rice, potato, pasta and other starchy food’ (choose wholegrain
varieties)
some ‘milk and dairy food’ (low-fat alternatives or high-fat versions only infrequently or in small portions)
some ‘meat, fish, eggs, beans and other non-dairy sources of protein’ (low-fat alternatives and eat two portions of fish a week including one of oily fish)
just a small amount of ‘food and drinks high in fat and/or sugar’
Livewell Report 2011
20
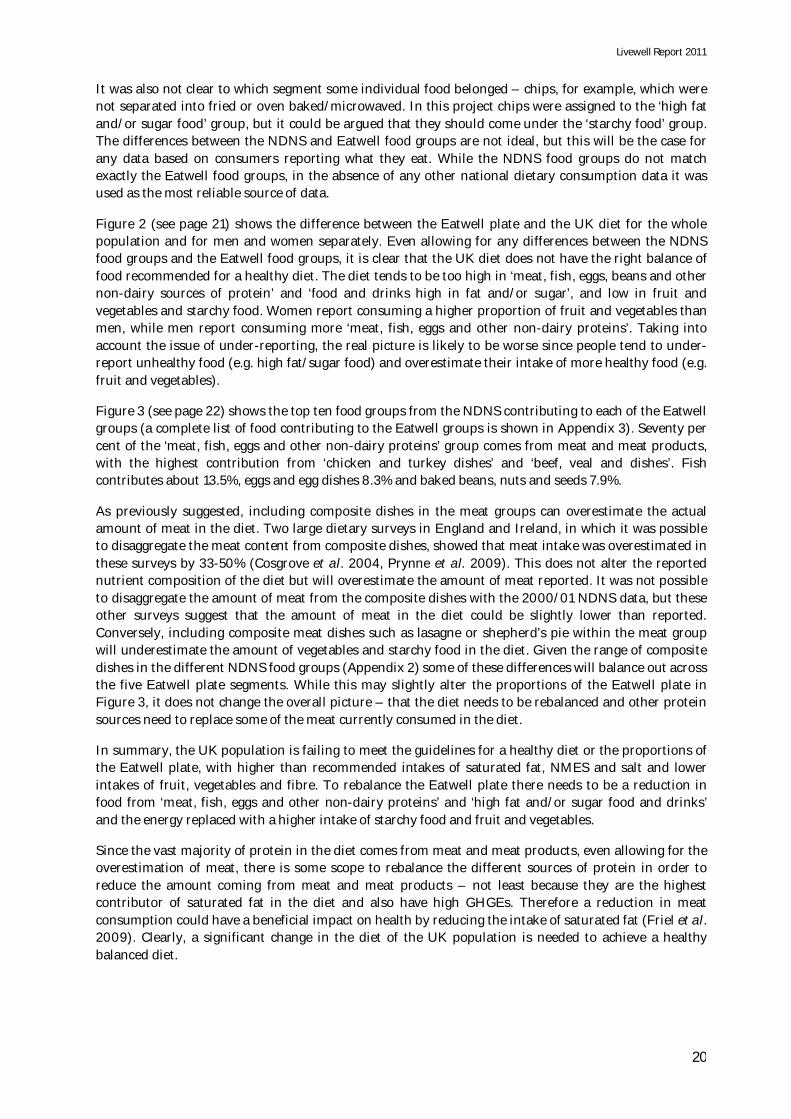
It was also not clear to which segment some individual food belonged – chips, for example, which were not separated into fried or oven baked/microwaved. In this project chips were assigned to the ‘high fat and/or sugar food’ group, but it could be argued that they should come under the ‘starchy food’ group. The differences between the NDNS and Eatwell food groups are not ideal, but this will be the case for any data based on consumers reporting what they eat. While the NDNS food groups do not match exactly the Eatwell food groups, in the absence of any other national dietary consumption data it was used as the most reliable source of data.
Figure 2 (see page 21) shows the difference between the Eatwell plate and the UK diet for the whole population and for men and women separately. Even allowing for any differences between the NDNS food groups and the Eatwell food groups, it is clear that the UK diet does not have the right balance of food recommended for a healthy diet. The diet tends to be too high in ‘meat, fish, eggs, beans and other non-dairy sources of protein’ and ‘food and drinks high in fat and/or sugar’, and low in fruit and vegetables and starchy food. Women report consuming a higher proportion of fruit and vegetables than men, while men report consuming more ‘meat, fish, eggs and other non-dairy proteins’. Taking into account the issue of under-reporting, the real picture is likely to be worse since people tend to under-report unhealthy food (e.g. high fat/sugar food) and overestimate their intake of more healthy food (e.g. fruit and vegetables).
Figure 3 (see page 22) shows the top ten food groups from the NDNS contributing to each of the Eatwell groups (a complete list of food contributing to the Eatwell groups is shown in Appendix 3). Seventy per cent of the ‘meat, fish, eggs and other non-dairy proteins’ group comes from meat and meat products, with the highest contribution from ‘chicken and turkey dishes’ and ‘beef, veal and dishes’. Fish contributes about 13.5%, eggs and egg dishes 8.3% and baked beans, nuts and seeds 7.9%.
As previously suggested, including composite dishes in the meat groups can overestimate the actual amount of meat in the diet. Two large dietary surveys in England and Ireland, in which it was possible to disaggregate the meat content from composite dishes, showed that meat intake was overestimated in these surveys by 33-50% (Cosgrove et al. 2004, Prynne et al. 2009). This does not alter the reported nutrient composition of the diet but will overestimate the amount of meat reported. It was not possible to disaggregate the amount of meat from the composite dishes with the 2000/01 NDNS data, but these other surveys suggest that the amount of meat in the diet could be slightly lower than reported. Conversely, including composite meat dishes such as lasagne or shepherd’s pie within the meat group will underestimate the amount of vegetables and starchy food in the diet. Given the range of composite dishes in the different NDNS food groups (Appendix 2) some of these differences will balance out across the five Eatwell plate segments. While this may slightly alter the proportions of the Eatwell plate in Figure 3, it does not change the overall picture – that the diet needs to be rebalanced and other protein sources need to replace some of the meat currently consumed in the diet.
In summary, the UK population is failing to meet the guidelines for a healthy diet or the proportions of the Eatwell plate, with higher than recommended intakes of saturated fat, NMES and salt and lower intakes of fruit, vegetables and fibre. To rebalance the Eatwell plate there needs to be a reduction in food from ‘meat, fish, eggs and other non-dairy proteins’ and ‘high fat and/or sugar food and drinks’ and the energy replaced with a higher intake of starchy food and fruit and vegetables.
Since the vast majority of protein in the diet comes from meat and meat products, even allowing for the overestimation of meat, there is some scope to rebalance the different sources of protein in order to reduce the amount coming from meat and meat products – not least because they are the highest contributor of saturated fat in the diet and also have high GHGEs. Therefore a reduction in meat consumption could have a beneficial impact on health by reducing the intake of saturated fat (Friel et al. 2009). Clearly, a significant change in the diet of the UK population is needed to achieve a healthy balanced diet.

UK diet for women UK diet for men
24%
15%
14%
20%
27%
13%
16%
25%
20% 26%
Eatwell plate (recommended)
33% FrUit anD vEgEtablEs
12% mEat, Fish, Eggs, bEans anD othEr non-Dairy soUrcEs oF protEin
33% brEaD, ricE, potato, pasta & othEr starchy FooDs
15% milK & Dairy
8% FooD & DrinKs high in Fat & / or sUgar
UK diet for men & women
15%22%
23% 25%
15%
Figure 2: The UK diet displayed in the Eatwell plate food groups

1. Apples and pears not canned 12.8%2. Bananas 11.1% 3. Other vegetables (not raw) 11.0% 4. Fruit juice 10.1% 5. Other fruit, not canned 9.5% 6. Salad & other vegetables (raw) 8.7% 7. Tomatoes (raw) 6.8% 8. Vegetable dishes 6.8% 9. Citrus fruit not canned 5.2% 10. Leafy green vegetables(not raw) 4.8%
1. Semi-skimmed milk 45.1% 2. Whole milk 16.3% 3. Yogurt 14.2% 4. Skimmed milk 10.4% 5. Other cheese 9.4% 6. Other milk 2.0% 7. Other diary desserts 1.2% 8. Cottage cheese 0.9% 9. Fromage frais 0.6%
1. White bread 25.4% 2. Other potatoes, potato salads and dishes 21.5% 3. Rice 10.8% 4. Pasta 10.6% 5. Wholegrain and highfibrecereals 8.3% 6. Other breads 7.0% 7. Wholemeal bread 6.0% 8. Pizza 4.6% 9. Other breakfast cereals 2.9% 10. Other cereals 1.9%
23% Fruit anD vegetables
1. Chips 22.3% 2. Buns, cakes and pastries 11.7% 3. Fried or roast potatoes and fried potato products 7.7% 4. Biscuits 7.5% 5. Sugar 7.2% 6. Chocolate confectionary 5.9% 7. Carbonated soft drinks, not diet 5.6% 8. Crisps and savoury snacks 4.7% 9. Other cereals-based puddings 3.9% 10. Ice cream 3.8%
15% FooD & Drinks high in Fat & / or sugar
25% breaD, rice, potato, pasta & other starchy FooDs
15% milk & Dairy
1. Chicken and turkey dishes 20.3% 2. Beef and veal dishes 15.5% 3. Baked beans 7.0% 4. Eggs 6.7% 5. Bacon and ham 6.6% 6. Meat pies and pastries 6.3% 7. Oilyfish 5.4% 8. Sausages 4.2% 9. Pork and pork dishes 3.9% 10.Whitefishcoated and/or fried 3.9%
Figure 3: The top ten food contributors to each of the Eatwell segments from the UK diet.
22% meat, Fish, eggs, beans anD other non-Dairy sources oF protein
Fruit & vegetables
Bread, rice, potato, pasta & other starchy foods
Meat, fish, eggs, beans* and other non-dairy sources of protein
Milk & dairy
Food & drinks high in fat & / or sugar
* beans (except baked beans) and pulses in the UK diet are included in the fruit & vegetable section

Livewell Report 2011
23
3.3 Greenhouse gas emissions from the UK diet The second aim of the project was to estimate the GHGEs of the UK diet based on the dietary data from the NDNS 2000/01 and provide more detailed information about the main sources of GHGEs in the diet. It is stated in the recent report How Low Can We Go? (HLCWG) that the annual food-related GHGEs are approximately 152,183 ktCO2e per year (Audsley et al. 2009). Dietary intake data tends to be expressed in terms of ‘intake per person per day’, and the NDNS data is specifically for adults aged 19-64 years. The annual GHGE figure therefore had to be converted into the equivalent of ‘GHGE per adult per day’ to make the dietary intake data and GHGE data comparable. The first task was to collate the GHGE values for individual food and drinks commodities and link them with the food and drink categories in the NDNS data.
Merging GHGE data with food and dietary intake data: A database was created using GHGE figures taken mainly from the HLCWG report (Audsley et al. 2009), and as far as possible the individual food types were aligned with the NDNS food groups. The HLCWG report divides the total food-related GHGEs from the LCA into two stages with a nominal boundary set by the regional distribution centre (RDC).
1. Pre-RDC: Primary production up to and including transport to the RDC.
2. Post-RDC: Post-primary commodity production beyond the RDC, which includes processing, packaging, distribution to the retail storage, retail outlets, food preparation, washing up and food waste disposal.
Primary production was defined as all activities and emissions arising from commodity production up to and including transport to the RDC, and for most products this was as the raw commodity. Audsley et al. describe the RDC as only a nominal boundary as it is not always easy to determine from data sources where the primary production ends and the processing begins for different food. For example, for liquid milk the manufacturing, processing and packaging was included in the pre-RDC, while for wheat the pre-RDC included up to the milling of the wheat; but processing it into products such as bread and biscuits was included in the post-RDC values. More detail can be found in the HLCWG report (Audsley et al. 2009). Emissions from the pre-RDC and post-RDC of the whole food chain have been estimated to account for approximately 56% and 44% of the total food-related emissions respectively. It is recognised that different stages of the life cycle can vary considerably between products – for some products the primary production (pre-RDC) will have a greater contribution to the total GHGE than the processing, storage and preparation (post-RDC) and vice versa. However, only the primary production values (pre-RDC) are reported for individual food commodities in the HLCWG report and at the time of completing this project there was no detailed data relating to individual food for post-RDC. The database created, therefore, was based on only the pre-RDC values for the food and drink groups and then a constant value for the GHGE post-RDC was added (in the ratio of 56:44 for pre-RDC and post-RDC) to give an estimate of the total GHGEs for the diet. Taking the diet as a whole, it was assumed that a lot of the variation between food in the post-RDC emission would average out across the diet. This is recognised as a limitation; given more time, future work could weight the different food groups according to the intensity of the different stages of the post-RDC GHGEs.
GHGE figures vary for the same food item depending on where in the world the food is produced: in the HLCWG report these are classified into the UK, the rest of Europe and the rest of the world. Using import and export data taken from UK trade information (www.uktradeinfo.com) a GHG figure for individual food was recalculated based on the ratios of imports and home production in the UK. The HLCWG pre-RDC values are based on basic food commodities rather than the actual food consumed: for example there is a value for milk but not for processed items such as cheese or yogurts. Some additional values were taken from a Defra report (Wiltshire et al. 2009), but as these values included GHGEs up to manufactured and packaged food, adjustments were made to represent GHGEs of only the

Livewell Report 2011
24
primary production. The estimated pre-RDC GHGE figure for some processed food was based on the amount of the basic food commodity needed to produce it, using information from a recent Swedish study as a guide for these calculations (e.g. it takes 3kg of oranges to make 1kg of orange juice) (Wallén et al. 2004). A list of GHGE figures (kgCO2e/kg of product) was matched with the food groups in the NDNS data. As discussed above, a limitation of the NDNS dataset is that the food groups contained composite dishes, unlike the GHGE data which is based on the primary produce.
There were several other adjustments that had to be made so that the GHGE data and dietary data were compatible. Data for GHGE tends to be expressed as kgCO2e/kg of primary products, while dietary and nutrient data is based on the weight of cooked and/or edible portions of food items. The weight of some food varies between the raw product and the actual food consumed. For example, the weight can increase through hydration when cooked (e.g. rice, pasta) and decrease when cooked (e.g. meat), and the edible portion of a food can differ from the primary product (e.g. banana with and without the skin). Since the weight of the food from the NDNS data is based on cooked and edible portions, adjustments were made to the GHG values of the primary produce to account for these differences.
Dietary intake data in the NDNS is expressed as the ‘weight, in grams, of food and drink consumed per adult per day (g/day)’, while the total GHGEs from the food and drink are expressed as ‘ktCO2e/year for the whole population’. It was calculated that the GHGEs per day based on the whole UK population (2001) were equivalent to 7.05kgCO2e/person/day. The conversion of GHGEs to these units does not take into account the different energy needs across the population by age or sex. On average adults have higher energy requirements than younger children and the elderly, and men have higher energy needs than women. It follows that those with greater energy needs will have higher GHGEs because they will need to eat more food.
Adjusting for the different energy requirements within the population, it was calculated that the equivalent food-related GHGE of the adult population matching the NDNS sample (aged 19-64 years) was 7.50kgCO2e/adult/day. The population figure was taken from the National Office of Statistics 2001 UK adult population aged 19-64 years to match the NDNS population. The total GHGE can be split into pre-RDC (4.20kgCO2e/adult/day) and post-RDC (3.30kgCO2e/adult/day) emissions using the estimated 56:44 ratio. Taking account also of the different average energy requirements of men (10.6kJ/day) and women (8.1kJ/day), the total GHGEs were calculated to be 8.51kgCO2e/man/day for men and 6.50kgCO2e/woman/day for women.
Estimate of the GHGE of the UK diet: Based on the NDNS data, the GHGEs of the UK diet of adults were estimated to be 7.14kgCO2e/adult/day (Table 2). Consistent with the calculation of the annual GHGEs of 152,183 ktCO2e/year, the figure from the NDNS data includes all food and drink consumed, as well as alcohol. The pre-RDC GHGE figure of 3.04kgCO2e/adult/day was corrected for the estimated 25% under-reporting of intake in the NDNS, and then a value for post-RDC (44% of the total) was added to give the total GHGEs. Despite the margin of errors and uncertainties in the estimated GHGE and NDNS data, the values for total GHGEs derived from the analysis of the NDNS data are of the same magnitude to that which was calculated per adult from the annual food related emissions reported in the HLCWG report (152,183kgCO2e/year equivalent to 7.50kgCO2e/adult/day).

Livewell Report 2011
25
Table 2: GHGE estimates from UK dietary intakes based on the NDNS compared with the estimated annual GHGEs from food and drink
GHGEs from the UK diet (kgCO2e/adult/day)
All Men Women
Pre-RDC from NDNS (uncorrected for under-reporting) 3.01 3.50 2.55
Pre-RDC from NDNS (corrected for under-reporting) 4.00 4.65 3.39
TOTAL GHGEs from NDNS data (pre-RDC + post-RDC)
7.14 8.30 6.05
Estimated GHGE calculated from the annual figure of 152,183kgCO2e/year* 7.50 8.51 6.50
* UK population based on 2001 figures for adults aged 19-59 years (Office of National Statistics, www.statatistics.gov.uk [accessed July 2010]).
Figure 4 (see page 26) shows the approximate percentage contribution of GHGEs from different food groups in the UK diet, based on the pre-RDC figures. The ‘meat, fish, eggs and other non-dairy proteins’ group contributes the highest (57%) of the total GHGEs. This is due to a combination of high GHGEs of these food and high levels of consumption. The breakdown of the contribution of the different protein sources are shown in Table 3. Meat, meat dishes and meat products account for about 48% of the total GHGEs from the diet, with beef and veal dishes alone accounting for 21% of the total. Milk is the biggest component of the milk and dairy group, with semi-skimmed milk being most commonly consumed. Cheese contributes about 35% to this group, with the remainder coming from consumption of yogurts, fromage frais and other dairy-based desserts. Table 3: GHGEs from sources in the ‘meat, fish, eggs and other non-dairy proteins’ group
Protein sources % total GHG emissions
Red meat and meat dishes (beef, lamb, pork) 27.3
Processed meat (bacon, ham, burgers, kebabs, sausages) 9.0
Chicken and turkey dishes (incl. coated chicken) 7.5
Meat products (pies, pastries) and other meat 3.8
Liver and liver dishes 0.5
Fish and fish dishes 6.6
Eggs and egg dishes 1.9
Baked beans 0.3
Nuts and seeds 0.1
Total emissions from ‘meat, fish, eggs and other non-dairy sources of protein’
57.0%
These figures serve to show where the majority of GHGEs are coming from in the diet. There are some limitations in using this data – for example, GHGEs for meat and meat products could be overestimated as the NDNS food group for meat includes composite meat dishes as discussed earlier. The GHGE values are also based predominantly on pre-RDC emissions, so could overestimate some food which has higher pre- than post-RDC GHGEs compared with other food groups such as meat vs. vegetables, or high fat and/or high sugar processed food. The milk and dairy group in the Eatwell plate does not include all dairy products (i.e. cream, ice-cream and butter), but based on the amount of these types of food consumed they contribute less than 1% of the diet’s total GHGEs. There are also other food items that have dairy products included as raw ingredients (e.g. milk chocolate, baked products) which would

Figure 4: The relative contribution from different food groups to the total GHGE based on the NDNS 2000/1.
57% meat, fish, eggs, beans and other non-dairy sources of protein
11% fruit & vegetables
5% food & drinks high in fat & / or sugar
6% bread, rice, potato, pasta & other starchy foods
7% other misc. foods (e.g.hot drinks, alcohol, sauces)
14% milk & dairy

Livewell Report 2011
27
not be included in ‘milk and dairy food’, but again it is unlikely that this will alter the proportions significantly. This is one of the challenges of trying to link together different databases, for example, GHGEs from primary produce with actual food and meals eaten, many of which are a combination of food groups. The general pattern of the results confirms the findings of previous reports, which show that meat and dairy contribute most to GHGEs in the UK diet. This pattern also serves to illustrate where some of the savings could be made if the UK diet were to change. There are some synergies where changes in the diet could cut GHGEs and benefit the health of the population. In section 3.2 it was shown that the Eatwell proportions need to be rebalanced to reduce the contribution of ‘meat, fish, eggs and non-dairy’ proteins, ‘high fat and/or sugar food’, and replaced with a higher consumption of starchy food, and fruit and vegetables. Protein intake is 35% and 20% higher for men and women respectively than the dietary reference values, so there is scope to reduce the amount of protein in the diet, especially consumption of meat. While high fat/sugar food contributes a relatively small proportion of the pre-RDC GHGEs, it is some of the most processed energy-dense and nutrient-poor food in the diet. It would be unrealistic to eliminate this completely from the diet and it should be recognised that such food can be eaten in moderation as part of a healthy diet – but current intakes could be reduced by half to be consistent with the Eatwell plate recommendations. It is important to include some of this food in the diet so that the consumer does not view a healthy, sustainable diet as lacking in all desirable types of food.
Rebalancing the UK diet in line with the Eatwell plate would be a good first step towards reducing GHGEs in the diet, particularly if some of the reductions in protein came from consuming less meat. Furthermore, with the majority of adults being overweight or obese, as a population we are consuming more energy than we need. This suggests that eating the amount of food to meet our energy requirements for a healthy weight would reduce the amount of food and drink required by the population and could be another step towards reducing GHGEs.
4. GREENHOUSE GAS EMISSION TARGETS FOR 2020 AND 2050 While there are many different and complex elements to sustainability, for the purpose of this work we focused on GHGEs as they relate to the One Planet Food programme targets for 2020 and 2050. The aim was to develop a Livewell plate and a Livewell 2020 diet which would not only meet current dietary recommendations but also the One Planet Food programme goal of a 25% reduction in GHGEs by 2020 (Livewell 2020). The Livewell 2020 diet and plate would serve as a basis for future diets that are considered healthy and sustainable. Using the same principles, the final task was to explore the possibilities for a 2050 diet based on 70% reduction in GHGEs.
4.1 Food-related greenhouse gas emission targets for 2020 and 2050 The GHGE reductions of 25% and 70% are based on the 1990 levels of approximately 152,183ktCO2e/year from food. Since food intake is based on dietary energy needs per person, calculating the reductions in annual emissions for 2020 and 2050 targets needed to take into account the differences in energy requirements and the size of the population. As described in section 3.3 the calculations were adjusted for the varying dietary energy needs of different groups in the population. Here the GHGE targets per person were calculated for adults aged 19-50 years and for men and women separately, adjusting for the differences in their energy requirements (EAR: 10.6MJ for men and 8.1MJ for women). In addition, figures from the Office for National Statistics have predicted that the UK population could increase by as much as 19-20 million between 1990 and 2050 (www.statistics.gov.uk). Since the GHGE reduction targets for 2020 and 2050 are expressed in this report as the average ‘emissions per person’ they had to be adjusted for the predicted population growth over this time. This adds a layer of complexity to the calculation, resulting in the reduction in GHGEs per person having to be even greater (i.e. more than 25% and 70% per person) than if based on the current population size. For example, the estimated current GHGE per adult (aged 19-50 years) is 7.78kgCO2e/adult/day, so

Livewell Report 2011
28
assuming no change in population size, a 25% reduction would be 5.84kgCO2e/adult/day. By taking into account the estimated population growth by 2020, the figure per person is reduced further to 5.02kgCO2e/adult/day. Table 4 shows the reduction of the total annual GHGEs to meet the targets for the UK by 2020 and 2050 and the estimated target per person per day.
Table 4: Estimated reductions in GHGEs for 2020 and 2050 (per person per year)
1990 (baseline)
2020 (25% reduction)
2050 (70% reduction)
Total annual GHGEs (ktCO2e/year) 152,183 114,137 45,655
Estimated UK population* 57,237,400 66,521,962 77,073,280
Estimated GHGEs per head of population** kgCO2e/ person/day
7.28 4.70 1.62
Estimated GHGEs per adult** kgCO2e/adult/day Per adult (19-50 yrs) MEN (19-50 yrs) WOMEN (19-50 yrs)
Total (pre-RDC: post-
RDC) 7.78 (4.36 : 3.32) 8.82 (4.94 : 3.88) 6.74 (3.77 : 2.97)
Total (pre-RDC: post-
RDC)
5.02 (2.81 : 2.21) 5.68 (3.18 : 2.50) 4.34 (2.43 : 1.91)
Total (pre-RDC:
post-RDC) 1.74 (0.97 : 0.77)
1.97 (1.10 : 0.87) 1.50 (0.84 : 0.66)
* Office for National Statistics (www.statistics.gov.uk) accessed July 2010 ** GHGEs per person for 2020 and 2050 are adjusted for predicted population growth
It was assumed that there will need to be GHGE reductions from both the type of primary products eaten and efficiency savings in production, processing, food preparation and waste. For this project it was assumed therefore that there would be a 25% and 70% reduction in both pre-RDC and post-RDC emissions by 2020 and 2050. Previous research has suggested that the 25% reduction by 2020 could be achieved by changes in the production and manufacturing of food, without the need to alter what the population eats (Jackson et al. 2009). However, as recognised in their report, changing people’s behaviour is a slow process so the population needs to start to make some changes to their diet now in order to shift the social norm of what we expect our diets to comprise, in preparation for longer-term changes that will be needed to achieve the 2050 GHGE targets. Furthermore, 25% is a minimum reduction and greater savings would only be beneficial.
To estimate the reduction in GHGEs, changes to the types of food eaten were based on the pre-RDC GHGE figures, and in the absence of any detailed data a single figure was added for the post-RDC (i.e. 44% of the total). The manipulation of the 2020 and 2050 diets in this project therefore was made to the type of food selected in the diet, but it was assumed that there would also be efficiency savings from changes in production methods. Proportionally to achieve a total reduction of 25% in GHGEs, overall it is assumed that approximately 14% would come from dietary changes (pre-RDC) and 11% from savings in production/processing methods of food (post-RDC). Similarly in 2050 for a 70% cut in total GHGEs, in the model approximately 39% would come from dietary changes and 31% from post-RDC savings.
4.2 Methodology: Linear programming to optimise the diets to meet dietary recommendations and minimise greenhouse gas emissions
The diets were developed using linear programming, which is a widely used mathematical modelling technique. This has been used in other studies to optimise the diet for populations who need to meet different dietary recommendations (Maillot et al. 2008, Maillot et al. 2010).

Livewell Report 2011
29
In this instance the model optimised the diet by selecting quantities of food from a list of food groups with the constraints of having to first meet set dietary requirements and then minimise the GHGEs. R package version 2.11.1, with Rglpk package version 0.3-5 (http://R-Forge.R-project.org/projects/rglp/) was used. This mathematical method optimises an outcome (i.e. GHGEs) which is a linear function of some variables which can be controlled (i.e. the amount of food eaten per day), while subject to a number of constraints (i.e. dietary requirements). The dietary requirements were set so that the diet provides sufficient energy, protein, fibre (NSP) and micronutrients, while also observing upper limits from dietary reference values for total fat, saturated fat, NMES and sodium (DoH 1991). Linearity implied by the model assumes that the outcome and the constraints are directly proportional to the amounts of each food type, which in this case is a reasonable approximation (for a more detailed description of linear programming see Dantzig & Thapa (1997)). Energy and nutrient requirements for a healthy diet vary across the population between different age groups and for men and women. It was decided that the diets for the Livewell plate would be modelled on the energy and nutrient requirements for an adult woman (19-50 years, sedentary lifestyle). The energy requirement is 8.1MJ/day (equivalent to about 2,000 kcals). One reason the diet was based on the dietary needs of women was because they have a higher requirement of iron than men and since meat is a major source of iron and was likely to be reduced in the Livewell diet it was important these higher recommendations were met. The diets derived from this model can be scaled up for the energy requirements for an adult male while still meeting dietary and GHG targets, and the general principles of the diet would also apply to children and the elderly.
Amount of food eaten per day: A database with a list of 82 individual food groups (each aligned to one of the five Eatwell plate segments) was created using pre-RDC GHGEs (kgCO2/kg product) and energy and nutrient information for each group from the NDNS nutrient database (see Appendix 4 for the list of food). The NDNS food groups described in section 3.3 were not used because of the complication of the composite food dishes. The energy and nutrient data was for the food as consumed (e.g. cooked, processed), but due to the limited data available the estimated pre-RDC GHGEs were used for primary products (i.e. raw commodities, unprocessed). As described in section 3.3, the pre-RDC GHGE figures were taken predominantly from the HLCWG report and Defra data (Wiltshire et al. 2009). To harmonise the nutrient and GHGE data, adjustments were made to the pre-RDC GHGE figures for any differences between the weight of the raw primary products and the weight of cooked food as consumed (e.g. meats, pasta, rice), and between the whole food item and the edible portion (e.g. bananas).
Optimising GHGEs: In the absence of any accurate predictions, the Livewell plate was based on the assumption that proportional reductions would be made in both pre-RDC and post-RDC emissions (56:44) to achieve the reduction target. Savings are likely to be made in production and processing in the years to come but the magnitude of this is unknown. The pre-RDC GHGEs for the Livewell 2020 plate, based on the diet of an adult female, had to be less than or equal to 2.43kgCO2e/woman/day (Table 4). A 70% reduction by 2050 would require a diet that had pre-RDC GHGEs less than or equal to 0.84kgCO2e/woman/day.
Nutrient and food constraints for the Livewell plate: The food and nutrient requirements were taken from the UK dietary reference values (DoH 1991) for energy, macronutrients (i.e. total fat, saturated fat, total carbohydrate, non-milk extrinsic sugar, protein, fibre (non-starch polysaccharides), micronutrients (i.e. iron, vitamin B12, zinc, calcium, folate) and sodium for women aged 19-50 years, shown in Table 5). As a precaution the minimum intake of protein was set at 53g/day, which is higher than that of the recommended RNI (45g/day), to adjust for more unrefined cereals and vegetable protein sources in the diet. It is recommended ‘for diets which contain considerable amounts of unrefined cereal grains and vegetables, a correction for digestibility of 85% should be applied’ (DoH 1991, p80).
Since meat and dairy are GHG-intensive and are one of the main sources of saturated fats in the diet, these are likely to be limited in the model. Meat and dairy, however, are good sources of the

Livewell Report 2011
30
micronutrients iron, zinc, vitamin B12 and calcium, so constraints were placed in the model to ensure that if meat and dairy were restricted, alternative sources for these micronutrients would be found in sufficient quantities from other food to meet recommended intake for health. Folate was included as a constraint in the model to ensure requirements were met because of the current debate on the need to fortify flour to reduce the risk of neural tube defects (SACN 2006). An upper limit was set for the amount of sodium in the diet as there are clear links between hypertension and high intakes of sodium, and subsequent risk of cardiovascular disease. Although these were the constraints placed on the model to achieve the requirements for these micronutrients, the final diet was checked for a wider range of micronutrients (i.e. vitamins A, C, E, B6, niacin, thiamine, riboflavin, magnesium) to ensure that the diet provided by the model met all dietary requirements.
In addition, recommended intakes for specific food groups had to be achieved in the diet (i.e. fish, fruit and vegetables, red and processed meat). The fruit and vegetable constraint in the model was based on the recommended ‘5-a-day’ message for a healthy diet, which is equivalent to a minimum of approximately 400g/day for an adult. Based on the FSA recommendation for fish intake, at least two portions of fish a week had to be included in the diet, one of which had to be an oily fish. White fish is regarded as a good low-fat source of protein and oily fish provide one of the main natural sources of omega-3 fatty acids in the diet. An upper limit of 300g of red meat per week (i.e. beef, pork, lamb, goat) of which very little if any should be processed meat, was set in the model based on the public health goal set by the World Cancer Research Fund (WCRF) in 2007. This recommendation was based on scientific evidence suggesting that red or processed meats are ‘convincing or probable causes of some cancers’ (WCRF 2007).
Finally, the model was set up so that the diet also had to try and meet the Eatwell plate proportions for the five food groups, or be as close to them as possible.
5. LIVEWELL 2020: HEALTHY AND SUSTAINABLE DIET FOR 2020 For Livewell 2020, additional food constraints were added to try and ensure that the diet would be as acceptable as possible to the general population. The year 2020 is a relatively short time away in terms of achieving a change in the dietary habits of the population, so it was important to include commonly consumed food in the diet. These foods were selected using data from the NDNS and from seven-day food diaries completed by 199 men and women (unpublished in-house data, Rowett Institute). The most commonly eaten food reported by those completing the diaries – and food reported to be eaten by more than 50% of participants in the 2000/01 NDNS – was combined and this information was used as an indicator of acceptability and to ensure that the 2020 diet included commonly eaten foods.
Acceptability of the diet was modelled by imposing lower and/or upper intake (grams) limits on the amounts of certain food items, forcing them to be included or excluded from the diet (Appendix 4). For example, the model would be unlikely to select red meat in the diet since the GHGE per kilo is higher than other protein sources, but by setting a lower intake limit for this food it ensured that some red meat was included. The intake limits were set using standard food portion sizes (Crawley 2003) and, where possible, standard product sizes (e.g. an apple or a packet of crisps). Setting upper limits restricts the total amount of an individual food in the diet, removing the risk of including an unrealistic amount of a single type of food. These restrictions ensured that the list of food could be translated into a sensible diet with usable portions and minimal waste.
To illustrate the importance of the intake limits, the model was first run without imposing any lower or upper limits on the types of food that could be included in the diet. The model produced a very restricted list (see Appendix 5) and although the listed food met all the dietary recommendations and greatly exceeded the 2020 GHGE reduction targets, it would be very challenging to combine in a way that would create an acceptable diet or even produce meals. Using the approach of setting upper and lower limits for food in the model, it is possible to vary the food in the diet to meet different cultural or religious needs and still meet dietary requirements simply by changing the limits.

Livewell Report 2011
31
5.1 Livewell 2020 diet The list of food items for a week produced from the model met all the nutrient criteria included in the model. Iron intake was very slightly below the reference nutrient intake, but well above the estimated average requirement for women of 11.4mg/day (Table 5). The sodium intake is likely to be overestimated in this model, as there is continuing reformulation of food in the UK to reduce the salt content of products such as bread, snacks and processed food (FSA 2009); this will not be reflected in the food in the nutrient database at the time of this project. While a number of constraints were placed on the model to achieve the requirements for the micronutrients listed in Table 5, the 2020 diet also met a wider range of vitamin and mineral requirements (shown in Appendix 6). The amount of meat in the diet not only met the WCRF recommendation, but it was also within the recommendation proposed by the Scientific Advisory Committee on Nutrition (SACN), which suggests that intakes of red and processed meat should be no more than 70g per day (SACN 2009). The pre-RDC GHGE of this diet was estimated to be approximately 2.42kgCO2e/woman/day, which met the target of less than or equal to 2.43kgCO2e/woman/day. Including post-RDC proportion it is estimated that the total GHGEs of this diet would be 4.32kgCO2e/woman/day, which would meet the target of 25% reduction in total.
Table 5: Dietary constraints for a woman (19-50 years) used in the model, and the energy and nutrient intakes from the Livewell 2020
Nutrients Dietary recommendations
(constraints included in the model)
Source Livewell 2020 diet
Energy 8.1 MJ DRV 8.1MJ
Total fat < 35% of food energy DRV 28.8% (63g)
Saturated fat < 11% of food energy DRV 10.6% (23g)
Total carbohydrate > 50% of food energy DRV 54.0% (274g)
Non-milk extrinsic sugar < 11% of food energy DRV 8.5% (44g)
Fibre (NSP) > 18g/day DRV 22g
Protein 53g/day* DRV 82g
Iron 14.8mg/day DRV 14.3mg
Folate 200ug/day DRV 319ug
Vitamin B12 1.5ug/day DRV 5.9ug
Zinc 7.0mg/day DRV 10.0mg
Calcium 700mg/day DRV 1009mg
Sodium < 2400mg/day 6g salt per day
DRV FSA
2283mg 5.7g salt
Food
Fruit and vegetables 400g per day FSA 442g per day (excluding juice)
Fish 2 portions per week, 1 to be oily fish
(approx. 166g) FSA 329g per week
Meat (red and processed) population average consumption of
cooked red meat <300g/week** WCRF 203g per week

Livewell Report 2011
32
(very little should be processed meat)
Eatwell plate proportions
Fruit and vegetables 33% FSA 35%
Meat, fish, eggs, beans and other non-dairy protein
12% FSA 13%
Milk and dairy 15% FSA 15%
Bread, rice, pasta, potatoes and other starchy food
33% FSA 29%
High fat and/or sugar food and drink
8% FSA 9%
* the RNI for protein is increased to compensate for reduced digestibility of unrefined cereals and vegetable (DoH, 1991). ** Red meat includes beef, pork, lamb and goat (a maximum for an individual is <500g/week) Key: DRV = dietary reference value, FSA = Food Standards Agency, WCRF = World Cancer Research Fund Table 6 (see pages 33/34) shows the list of food produced by the model, which could be viewed as ‘a shopping list’ for a week. This should not be interpreted literally as a shopping list of exact quantities of food to be purchased each week, but as the total quantities to be eaten per week. For example, it is not suggested that 210g of cooked rice should be bought, but this quantity of rice eaten for a meal would be taken from a bag of rice that would be used over a longer period of time. In any event, individuals’ diets tend to vary from week to week and not all the foods have to be eaten in the exact quantities each week but rather averaged out over a longer time period to minimise waste. Additionally the perishable food could be balanced out over a few weeks where more is eaten in week one and less the next.
The food list is only an example of what could be included in the Livewell 2020 diet and should not be interpreted as a definitive list – for example, fruit and vegetables could be varied according to season or certain food could be excluded according to preferences. Different intake limits could be imposed on a range of other food which would vary the output, and it is also possible to make trade-offs and substitutions of individual food types. For example, to include some citrus fruit (which is not on the current food list) this can be forced into the model by setting a lower weight limit for the citrus fruit, which would then re-align and possibly change some of the other food in the list to ensure that the nutrient requirements were still being met and the GHGE of the diet was minimised.
This also serves to illustrate that it would not be possible to recommend an exact amount of any single food that should be eaten (e.g. red meat) because the amount will depend on what else is included in the diet. Food with a high GHGE can be included (up to certain limits) but other food would have to be sacrificed to achieve a balance. This presents the same challenge for developing a simple educational message as posed by promoting the concept of a healthy balanced diet; there are individual food types that are considered ‘unhealthy’ but eaten in small amounts can be included as part of a healthy diet. The same is true for a low-GHGE diet; there are food choices with high GHGEs which do not necessarily need to be eliminated but consumed in smaller quantities.
It would be unrealistic to expect the whole population to eat the same list of food, as preferences differ and dietary patterns are not all the same. Future work needs to identify the exchanges within and between food groups that could be made while still achieving a healthy, low-GHGE diet.
Since the scope of this work was based on modifying the Eatwell plate, only the Eatwell plate food groups were included in the model. Hot drinks (e.g. coffee, tea, drinking chocolate) and alcoholic drinks are not included in the Eatwell plate. Tea and coffee will contribute to GHGEs but they do not contribute significantly to key nutrients. It is estimated that a cup of tea or coffee would add approximately 0.01kgCO2e and 0.07kgCO2e respectively (not including the boiling water, milk or

weekly shopping listTable 6
Results from the 2020 model: an example of a weekly ‘shopping list’ that meets the nutrient requirements and the 2020 reduction in GHGE for a woman (19-50yrs).
Food groups ExamplEs oF Foods itEms in thE Food groups WEight / EatWEll Food WEEk (g) group
Bread, rice, potato, pasta & other starchy foods
Pasta, Noodles (cooked) All types of pasta, noodles & macaroni 525 1
Rice (boiled) All types of white, brown, long grain, 210 1 basmati, easy cook
White Bread Sliced, toasted, fried, French stick, 553 1 pitta bread & rolls
Wholegrain Bread As above 401 1
Wholegrain & High Fibre Cereals a with non-starch polysaccharides 140 1 Breakfast Cereals ≥ 4g/100g; e.g. all bran, branflakes, muesli, (not porridge) shredded wheat
Other Breakfast Cereals Cereals with non-starch polysaccharides 70 1 ≤ 4g/100g; Oats (cooked) e.g. cornflakes, coco pops, sugar puffs, rice krispies
Oats (cooked) e.g. porridge 161 1
Potato Products – grilled or Oven chips, waffles, croquettes, hash browns, 289 1 oven baked (not fried) fritters, alphabites or ketchups etc
Potatoes Boiled, mashed (no fat), baked 490 1
Fruit & vegetables
Carrots, Turnips (cooked) 133 2
Tomatoes Tinned, raw 427 2
Peas Frozen, canned, mushy 175 2
Cabbages, Brussel sprouts, 98 2 other Brassicas (cooked)
Cauliflowers, Broccoli, 91 2 Spinach (cooked)
Cucumber 112 2
Lettuce 133 2
Mushrooms (fried) Fried in a variety of oils 112 2
Onions (inc. shallots) Fried in a variety of oils 217 2
Pepper (raw) Red, green, yellow, etc. 280 2
Sweetcorn Canned, on the cob 28 2
Apples, Pears 497 2
Bananas 217 2
Grapes, Kiwi, Cherries 154 2
Peaches, Nectarines, 301 2 Apricots
Raspberries, Strawberries, 119 2 Blueberries
Fruit Juice Fruit & vegetable juice 630 2
Continued

Food groups ExamplEs oF Foods itEms in thE Food groups WEight / EatWEll Food WEEk (g) group
milk & dairy
Semi-Skimmed Milk 1603 3
Cheese (reduced fat) All types incl. hard, soft & cream cheese 203 3
Yoghurt / Fromage Frais All types 156 3 (full fat)
Yoghurt / Fromage Frais All types 294 3 (low fat)
Meat, fish, eggs, beans & other non-dairy sources of protein
Eggs Fried, poached, boiled, scrambled 119 4
Ham All types 21 4
Beef (cooked) All cuts incl joints, fillets, minced, stewed, etc 91 4
Pork (cooked) As above 91 4
Chicken Meat (cooked) As above 203 4
White Fish (coated, fried) Battered/fried cod, haddock, plaice etc., 161 4 fish fingers, fish cakes, scampi
Shellfish All types, incl. mussels, prawns, crab, scallops etc 49 4
Oily Fish Salmon, sardines, mackerel, kippers, herring, 119 4 fresh tuna
Sesame Seeds 1.4 4
Nuts Incl. mixed nuts, peanuts, walnuts, almonds, 25 4 Brazil nuts
Beans (excl. baked beans) Kidney beans, black-eyed beans, butterbeans, 70 4 chickpeas
Lentils (cooked) Boiled 56 4
Baked Beans Canned 273 4
Food & drinks high in fat & / or sugar
Biscuits All sweet & savoury types e.g. shortbread, 77 5 digestives, cream crackers, flapjacks, cereal bars
Buns, Cakes and Pastries All types e.g. sponge cakes, muffins, Danish 98 5 pastries, croissants, doughnuts, tarts, scones, gateaux
Puddings (sponge or other All types e.g. rice pudding, sponge pudding, 217 5 cereal based puddings) jam rolypoly, sponge flan, trifle, crumble, bread pudding, tiramisu,
Ice-Cream All types 70 5
Low Fat Spread Spreads containing ≤40% fat 98 5
Fried, Roast Potatoes and All fried potato products, fried in a variety of oils 147 5 Fried Potato Products (incl. chips)
Crisps & Savoury Snacks All types of potato and cereal based savoury snack 28 5
Sugar All types incl. golden syrup 35 5
Preserves Jam, fruit spreads, marmalade, honey, lemon curd 42 5
Chocolate All types e.g. chocolate bars, filled bars, 35 5 assortments
Note: All weights are based on ‘as eaten’ e.g. cooked weight (e.g. meat, pasta, rice) and edible portion of foods (e.g. fruit) Key: 1= bread, rice, potatoes, pasta & other starchy foods, 2= fruit & vegetables, 3 = milk & dairy, 4 = meat, fish, eggs, beans & other non-dairy sources of protein, 5 = foods high in fat and/or sugar
Table 6 continued

Livewell Report 2011
35
sugar); on average, an adult consumes three hot drinks a day. Additional milk was included in the Livewell 2020 diet to allow enough milk for approximately three hot drinks a day, plus a small amount of sugar that could be used on cereal or in hot drinks. If more was wanted, this would be possible but it would have to be exchanged with other food.
Alcohol was not included in our diet as it does not feature in the Eatwell plate, but it does contribute additional energy to the diet and GHGEs. Alcohol is not consumed by everyone, but if it were included in the diet up to the maximum recommended limit (14 and 21 units per week for women and men respectively) it would add approximately 438kJ/day and 0.17kgCO2e/day for women and 657kJ/day and 0.26kgCO2e/day for men. The calculations for alcohol were based on an average of the values for beer and wine.
For the 2020 plate we did not include soya products as these are not commonly consumed – but if soya protein and soya-based dairy equivalent products could be substituted for some of the meat and dairy in the menus, this could help reduce the GHGEs further. According to the NDNS (2001) only 5% of the population reported being vegetarian or vegan (only 2% in the NDNS 2008/9), so it was felt that eliminating all meat and dairy and replacing them with soya-based products was unrealistic for 2020, and indeed could still be by 2050.
Sample menus for the Livewell 2020 diet: The next stage was to ensure that the list of food items could be combined into a reasonable and recognisable seven-day menu. The menus were based on three main meals a day, with additional snacks that could be either added to meals or eaten separately. The snacks include some additional milk and sugar which could be used in hot drinks, or the sugar added to cereals. Table 7 (see page 36) shows an example of a menu that could be derived from the list of food in Table 6. The ingredients for the composite evening meals are described in Appendix 7. In addition herbs and spices were added to the meals. These were not included in the food list as they were regarded as ‘store cupboard’ items which did not contribute to the nutrient composition of the diet, and would not significantly change the GHGEs as they are only used in very small amounts. This menu is only an example of what could be made from this list of ingredients; it is flexible as more than one type of food is classified under most of the food items allowing exchanges to be made, as shown in Table 6. The ingredients could be combined in different ways to produce different meals for individual preferences. For example, instead of having chilli beef and kidney bean tortillas for dinner on Day 2, the mince and kidney beans could be combined with the potatoes from another meal to make cottage pie. The seven-day sample menu was prepared by professional cooks in the Human Nutrition Research Unit (Rowett Institute of Nutrition and Health) to ensure that the quantities of ingredients in each dish were appropriate and the combination of ingredients worked together. The menu was prepared using standard middle-range supermarket products and the whole seven-day menu was tasted by a small panel; the meals were considered to be highly palatable.
The quantities of food with high GHGEs – for example meat – have been reduced but the meals were designed to include them in small amounts. It is possible to have meat most days but in smaller amounts than in the current diet. Some meals which include meat have had other ingredients added (e.g. beans and vegetables) to ‘bulk out’ the reduced quantities of meat. It is this type of adjustment which could be used as a stepping stone for change. The Livewell 2020 diet contains 203g of red meat (of which 21g is processed) per week which is below the WCRF recommended maximum of 300g per week for the population (and less than 500g for individuals).
It is difficult to estimate what the average reduction in actual meat in the Livewell 2020 diet is compared with the UK diet (NDNS data), but the Family Food Survey (Defra 2010), which is based on food purchases rather than consumption, reported that an average of 323g of red or processed meat, 246g of poultry, 151g of meat-based ready meals and 279g of meat products was purchased per person per week in 2009. While these quantities are based on a raw weight which will be higher than the

7 day sample menuTable 7: Seven day sample menu based on the food list from the model
wholegrain/high fibre vegetable & lentil soup chicken curry & rice apple cereal & semi skimmed milk with white pitta bread raspberries/strawberries prawn mayonnaise biscuit white toast & preserve sandwich (wholemeal 100ml semi-skimmed milk* bread) 1 tsp of sugar**
porridge egg salad sandwich chilli beef & kidney banana (white bread) bean tortillas with salad peach wholemeal toast & spread scone & jam yoghurt (full fat) 100ml semi skimmed milk* fruit juice 1tsp sugar** wholegrain/high fibre tomato & red pepper salmon with cream pear cereal & semi skimmed soup wholemeal roll cheese topping, new grapes milk potatoes, broccoli, biscuit yoghurt (low fat) & carrots crisps fruit juice 100ml semi skimmed milk* 1tsp sugar** wholemeal toast & spread other breakfast cereal & baked potato with chicken stir fry and noodles apple semi skimmed milk baked beans & cheese biscuit ice cream & raspberries nectarine fruit juice salad /strawberries cake 100ml semi skimmed milk* 1tsp sugar** wholegrain/high fibre cereal carrot & butterbean soup macaroni cheese chocolate bar & semi skimmed milk with salad pear ham & cream cheese kiwi fruit fruit juice bagel sponge/cereal pudding small packet of nuts 100ml semi skimmed milk* 1 tsp sugar** other breakfast cereal & cheese & tomato sandwich fish, oven chips & peas banana semi skimmed milk (wholemeal bread) white bread & spread biscuit peach wholemeal toast & preserve yoghurt (low fat) 100ml semi skimmed milk* 1tsp sugar** poached egg, baked beans, roast pork, roast potatoes, cheese toastie & salad grapes potato waffle & mushrooms cabbage & gravy (white bread) biscuit apple wholemeal toast & spread sponge/cereal pudding 100ml semi skimmed milk* 1tsp sugar**
1
2
3
4
5
6
7
day Breakfast lunch dinner snacks
* Additional milk for tea or coffee
** In tea, coffee or on cereal, or equivalent to one small glass of diluting juice

Livewell Report 2011
37
cooked weight reported for the Livewell 2020 diet, they illustrate that overall the Livewell 2020 diet will be lower in meat than most of the population’s current diet.
The amount of meat in the meals in the sample menu is not dissimilar to that found in a range of ready meals. The meat content of the three composite dishes in the 2020 diet was 30% (chicken curry), 32% (beef tortillas) and 18% (chicken stir fry). In comparison, the average meat content of the same type of dishes, taken from an average of 27 ready meals from three main supermarkets in the UK, was 35%, 32% and 20% respectively (Kyle 2010, unpublished). In the sample menu only four of the seven main meals throughout the week were meat dishes, but this could be changed to more meat-based meals if less meat was used per dish for people who prefer to eat meat more often.
Meat dishes could be bulked out with other ingredients such as beans, pulses and vegetables to compensate for a smaller quantity of meat. Also, larger quantities of meat could be consumed if meat with lower GHGEs were substituted for that with higher GHGEs. It would also be beneficial to health if better quality meat were eaten, as this would reduce the intake of saturated fats. Although better quality meat would be more expensive if smaller quantities are eaten, in total the overall cost to the consumer would be unlikely to change significantly.
Cost of the Livewell 2020 diet: The cost of the 2020 diet is very important for acceptability and accessibility to the whole population. The cost of the list of food for the 2020 diet in Table 6 was calculated using mid-range supermarket products and estimated to be approximately £28.40 per person (August 2010). This could potentially be reduced further depending on the brand of food and where it was purchased. The cost of the 2020 diet is less than the average spending on food and non-alcoholic drinks of households in the UK reported in 2009, which was approximately £32.12 per person per week (Defra 2010). This figure is averaged for all participants in the Family Food Survey which includes all adults and children over the age of seven, so the real cost per adult is likely to be slightly higher. There would be small additional costs to the 2020 diet that would need to be added for basic ‘store cupboard’ ingredients such as herbs, spices, tea and coffee, but this would be minimal over time. The estimated cost of the 2020 diet was based on the cost of food today and it is recognised that this likely to vary as food prices fluctuate, and be subject to seasonal variation.
5.2 Livewell 2020 plate Based on the Eatwell plate, Figure 5 (see page 38) illustrates what the Livewell 2020 plate might look like using the list of food items from the 2020 model compared with the UK diet.
The proportions of each of the main five food groups in the Livewell 2020 plate are within ±10% of the original Eatwell plate, except for the starchy food group which is slightly lower. It was considered a higher priority to ensure that the dietary recommendations were met rather than meeting the Eatwell plate proportions exactly. The constraint of placing upper and lower intake limits on individual food portions to make the diet acceptable meant that although the dietary requirements were met, the Eatwell food groups did not exactly match the original percentages. One of the purposes of the model was to shift the balance of food within the five food group segments, particularly within the protein segment. Comparing the Livewell 2020 with the UK diet shows that to achieve the dietary and GHGE targets there will need to be an overall reduction in amount of protein consumed, with a smaller proportion coming from meat and a higher proportion coming from non-meat and non-dairy sources.
The model for the Livewell 2020 diet was constrained to try and achieve the Eatwell plate proportions, which is why the proportions of the main food groups have changed very little from the original Eatwell plate. The model was re-run without the constraint of having to achieve the Eatwell proportions but the proportions remained very similar to the original plate (Table 8).

16% meat & meat dishes*
4% meat only
3% Fish
Figure 5: The Livewell 2020 plate compared with the UK diet based on the Eatwell plate
livewell 2020
UK diet (ndns 2000/1)
15% Food & drinKs high in Fat & / or sUgar
9% Food & drinKs high in Fat & / or sUgar
2% baKed beans only
4% beans & pUlses
2% eggs
1% eggs
23% FrUit and vegetables
35% FrUit and vegetables
15% milK & dairy Foods
15% milK & dairy Foods
25% bread, rice, potato, pasta & other starchy Foods
29% bread, rice, potato, pasta & other starchy Foods
0.2% nUts & seeds
0.3% nUts & seeds
3% Fish
*The data from the NDNS (UK diet) for the meat content of the diet included meat dishes.

Livewell Report 2011
39
Table 8: Comparison of the 2020 model with and without the constraint of achieving the Eatwell plate food group proportions
Eatwell plate proportions*
with upper/lower weight
limits for food items
without upper/lower weight
limits for food items Eatwell plate recommended proportions
with Eatwell
without Eatwell
without Eatwell
meat, fish, eggs, beans and other non-dairy sources of protein
12% 13% 17% 5%
bread, rice, potato, pasta and other starchy food
33% 29% 27% 43%
milk and dairy food 15% 15% 13% 0%
fruit and vegetables 33% 35% 34% 48%
food and drinks high in fat and/or sugar
8% 9% 10% 4%
Total GHG emission per person (kgCO2e/woman/day)
4.32 4.14 0.60
* the Eatwell plate food group proportions total 101% as in the original plate.
The lack of difference when the Eatwell constraints were removed is perhaps unsurprising as the same upper and lower intake limits were placed on a number of food items which greatly influence which types of food were chosen in the model. For example the ‘milk and dairy’ section only reduced to 13% from 15% when the Eatwell plate proportions constraints were removed. This was due to a very small reduction in the amount of milk in the diet but this was unlikely to be cut further because of the lower limit set for milk. These limits had been placed in the model to try and ensure the diet would not be a radical change and thus more likely to be acceptable to people today.
The proportion of protein increased from 13% to 17% when the Eatwell constraint was removed, as no upper weight limit was placed on the amount of protein in the diet, only a lower limit. The additional protein came from an increase in the amount of beans and pulses. The model was then run again removing both the Eatwell plate proportions constraint and all the upper and lower weight limits for the individual food items, leaving only the nutrient constraints – and the results were very different (last column in Table 8). This met the dietary requirements with a very low GHGE and very different Eatwell proportion, but contained no dairy or meat products. The list of food produced in this model contained only eight food items and would make a very strange and totally unacceptable diet to most people in the UK (see Table 1 in Appendix 5). This serves to illustrate the importance of factoring into the model an element of ‘acceptability’ to produce diets that people would be likely to adopt.
Although the Livewell plate has been developed to achieve the reductions in GHGEs, future work will need to try and take this forward with additional dimensions of sustainability. For example, more detail about the type of food within each of the five segments in the plate would be useful. In the Livewell 2020 plate the protein section was subdivided to select food that has a lower GHGE; future work could look more closely at the fruit and vegetable section, subdividing it to take into account seasonality and production methods for different fruit and vegetables, for example.
The approach taken for developing the 2020 Livewell diet was reviewed and endorsed by the British Dietetic Association (BDA), which recognised that this is a starting point for understanding and

Livewell Report 2011
40
developing guidance for what could constitute a healthy and sustainable diet and that the approach is flexible, allowing food with high GHGEs to be exchanged in the proposed diet. While the BDA noted that the 2020 diet includes several food types that would not fall into the 'healthy food' category, they recognised the importance of the whole diet being palatable, familiar and affordable, but suggest that ‘healthier’ options could be considered by choosing wholegrain and unprocessed produce wherever possible.
5.3 Transferability of Livewell 2020 to other populations and cultures The 2020 diet was modelled to include a number of food constraints to try and make it acceptable to general population in the UK, but it may not be suitable for, or acceptable to, some cultures, religions or sub-groups of the population. The linear programme approach taken for modelling the diet means that the model can be re-run setting different food, nutrient or environmental constraints that would match the specific needs of different populations. For a vegetarian diet, for example, the same nutrient and energy requirements would be set in the model but the food constraints would be reset to prevent the inclusion of any meat products. The outcome would be a different list of food and drink to those in Livewell 2020 diet, but the vegetarian diet would still meet the dietary requirements and GHGE targets.
Similarly, for different countries or cultures the nutrient and GHGE database of food used in the model could be changed to include a database of food and drinks specific to that country or culture, and the GHGE values that are relevant to the import/export and production of food for consumption in the country of interest. The principles of the linear programming model would be used in the same way to ensure that the dietary requirements and GHGE targets were met, just using another database of food items. Future work could involve modelling diets based on specific preferences and requirements of different cultures and countries.
6. DIETS FOR 2050 The final task was to explore whether it would it be possible to achieve a 70% reduction in GHGEs in the diet by 2050, as well as dietary requirements for health. This is a theoretical exercise as it is impossible to predict how farming, production, processing distribution and preparation methods might change, what type of technology might be developed, what the impact of reducing food waste could be, or even what types of food and drink might be available in 2050. It is assumed that efficiencies would be made, but due to the lack of data and future predictions the model for Livewell 2050 was based on food currently available and current estimates of GHGEs. This limits the value of the results as it is projecting today’s food and production/processing methods onto a diet 40 years in the future.
As with the 2020 Livewell diet, it is possible to derive a diet using linear programming based on food available today and current GHGE figures and create a list of food that achieves the GHGE reductions for 2050 and still meet dietary requirements. As illustrated previously, it is possible to include most food in the diet within limits. It would be possible to have a diet in 2050 which includes small amounts of meat and dairy but these high-GHGE foods would need to be compensated for by the selection of other low-GHGE food. Using a modelling approach as described in this report allows almost any diet to be created, but to meet the 70% reduction for 2050 would mean an enormous shift from what is currently eaten by the UK population, and even from the 2020 Livewell diet. Future food production and processing will need to consider more seriously the implications for the whole diet and the environment. The challenge will be to construct menus for recognisable diets rather than simply producing a list of food items and ensure that linkages are made between food and that the diet is acceptable and has minimal food waste. For example, a diet with a lot of breakfast cereal ideally needs to contain some form of milk. These are all important issues that emphasise the need to take account of the whole diet both nutritionally and environmentally, particularly for the issue of food waste.

Livewell Report 2011
41
7. SUMMARY In summary, the results of this project confirm that changes are needed in the UK diet to both improve health and reduce the environmental impact of the food consumption. We attempted to tackle the question that has been raised by the government and other organisations over the last few years –whether it is possible to achieve a diet that meets both dietary recommendations and environmental targets.
In the most simplistic terms it is possible to create a list of food that will achieve both these goals, as shown in Appendix 5. The challenge, however, was to produce a diet that could be culturally acceptable to the population so that changes to the current diet would be within the scope of most people in the UK. This was achieved by setting intake limits in the model to include certain food types for the 2020 Livewell diet, though only time will tell if people are willing to make these changes to their diet. To achieve the 2020 cuts in GHGEs from the food chain and improve the health of the population there will need to be a combined approach using nutritional, environmental and behavioural expertise, to restructure food production/processing and change food choices made by the consumer (Audsley et al. 2009).
The UK diet, which is too high in saturated fat and sugars and low in fibre, has changed very little over the last 10 years or more, according to the NDNS. This poor diet is having a major impact on the health of the population – for example, the risk of developing heart disease and some cancers. The public health message is clear: there needs to be a shift in the balance of food currently being eaten in order to achieve a healthy diet, as set out in the Eatwell plate. Meat and meat products and dairy products account for approximately half of the saturated fat consumed in our diet and this has significant health implications. It was recently reported that a 30% reduction in adult consumption of livestock products could reduce the number of premature deaths from ischemic heart disease by up to 17% in the UK (Friels et al. 2009). Increasing the intake of fibre, fruit and vegetables will also have significant health benefits, reducing the risk of cardiovascular disease, some cancers and other chronic diseases.
Many of these dietary changes described for health benefits could also help to cut GHGEs in the diet. The GHGE targets cannot be met just from dietary changes; methods for decarbonising production and manufacturing practices will be needed too, but consumers must make changes to their choice of food. It has been suggested that tackling only the agriculture and other non-consumption components of the food chain could achieve the 2020 GHGE targets (Jackson et al. 2009) and this would be easier than trying to change behaviour. These savings, however, will only go so far towards tackling the longer-term GHGE targets and will fail to initiate the dietary changes needed to improve health. It is clear that any future strategy for a sustainable, healthy diet must incorporate changes to both the food supply chain and consumer food choices.
Much of the debate about the environmental impact of the diet has focused on reducing meat consumption and the role of vegetarian diets, with a consensus that a diet lower in meat would be beneficial for both health and the reduction in GHGEs. The results based on the NDNS data estimated that meat and meat dishes account for approximately half of the total emissions in the diet. While this is likely be an overestimation of the real figure, it confirms previous reports that meat, as well as dairy products, is one of the greatest contributors to GHGEs in the UK diet.
The debate, however, continues as there are many other environmental and ethical factors that need to be considered. It is not as simple as just substituting meat and dairy products for non-meat and non-dairy products (Garnett 2007, Steinfield et al. 2006, Williams et al. 2006). From a cultural perspective, expecting the UK population to become vegetarian is unrealistic; the 2000/01 NDNS reported that only 5% of adults surveyed were vegetarian or vegan (2% in 2008/9), with the majority of these people eating dairy products. The aim should be to try and reduce the population’s consumption of meat and meat products through smaller portions and better quality meat, but even this is likely to be a substantial challenge. Strategies need to be developed now to encourage people to reduce their consumption of meat to levels proposed in the Livewell 2020 diet. Given the high consumption of ready meals, one

Livewell Report 2011
42
approach could be to reduce the amount of meat in those products, substituting it for a greater proportion of vegetables and starchy food. This could be done in a stepwise fashion with reformulation phased in over time – a process currently being adopted to reduce salt content of processed food. This approach allows the consumer to adjust to small changes at a time, which is thought to be more successful. It is anticipated that a range of marketing and pricing strategies would be needed to help drive any change.
The Eatwell plate does not separate the different protein sources, and provides little guidance on what proportion of these food types should be consumed. So, even if consumers rebalance their current diet just to match the five Eatwell plate proportions, it is not clear from the current guidance how this should be achieved – for example from a reduction in meat consumption, which could lead to the changes in livestock production desirable to reduce GHGEs. The Livewell 2020 plate has sub-divided the protein section to show approximately what proportion of this group should comprise meat and other protein sources (Figure 5). With more detailed data on the GHGEs of fruit and vegetables this approach could be applied to the fruit and vegetables segment of the plate to illustrate where the greatest savings in GHGEs could be made – for example with the environmental impact of seasonality and country of production taken into account.
An increase in fruit and vegetables in the diet will have beneficial effects on health, but the lifecycle of produce care will need to be taken into account to ensure that increasing production does not have a detrimental impact on environmental concerns such as increased energy needs for refrigeration and transport, and water use for irrigation or waste. The Livewell 2020 plate, therefore, should be viewed as the starting point for moving towards a model for a sustainable, healthy diet. Much more work is needed to achieve something that truly reflects all aspects of a sustainable diet and can be translated into something that is easy to understand and follow.
There are some clear ‘win-win’ situations to be gained from changing the diet, not least in terms of public health and environment considerations, but it is less clear what impact these could have on social and economic factors. For example, the results of this study suggest that a reduction in meat consumption to within recommended limits could be beneficial for health and GHGEs, but this could have consequences for farming and other employment in meat production. While these issues are beyond the scope of this project, they need to be considered for a sustainable diet.
There are also some more subtle conflicts that need to be worked out, such as the consumption of dairy products. Milk and dairy products provide a range of essential nutrients, but due to the high saturated fat content it is recommended that low-fat versions of these products are consumed. If the high fat component (i.e. cream) removed from milk is not used elsewhere in the diet or food chain, which may be desirable for health reasons, it creates the potential for a considerable amount of food waste. Also, in future diets some thought needs to be given to how much food waste is produced, particularly in connection with meat consumption. If meat is included in the diet, perhaps more needs to be done to encourage consumption of other edible parts of the animal (e.g. offal), which currently are less desirable to many UK consumers. For example, according to the NDNS (2000/01) less than 10% of UK adults eat liver or liver products.
Current dietary recommendations are to eat at least two portions of fish a week, one of which should be oily fish. The recommendation for oily fish is because it is a rich source of omega 3 fatty acid which has health benefits. Environmentally there is some concern about the long-term sustainability of some of our fishing practices and fish stocks, particularly white fish (Defra 2007), which should be considered. In future this could mean having to eat a wider variety of fish, species that are not over- fished and only eating fish from certified fisheries or those using sustainable fishing practices.
Aquaculture is a growing industry which aims to bridge the gap between fish consumption and decreasing stocks of certain species, but this is not without environmental issues. If fish consumption increased to meet dietary recommendations, it is not clear whether aquaculture would be able to meet these demands. The Livewell 2020 diet substituted some meat in the diet for fish to a level which is

Livewell Report 2011
43
slightly greater than the current recommendations – but if the fish content of this diet were considered too high and unsustainable, this could be reduced and the model re-run to substitute for other non-meat proteins.
The proportion of dairy products included in the Livewell 2020 diet was the same as in the Eatwell plate, partly driven by the restrictions placed in the model for a minimum amount of milk to be included in the diet. This was considered necessary in order to eat the quantity of breakfast cereal proposed in the diet. It would be possible to substitute dairy products with alternatives such as soya milk, but it was thought that a complete substitution was unrealistic in the 2020 timeframe. Also, while soya-based products are thought to have a lower GHGE, there are other environmental concerns such as the demands placed on land use overseas. The diet does show that with the right balance of food, the GHG targets can be met without eliminating most commonly consumed food groups.
Based on the Livewell 2020 plate, a diet meeting current dietary recommendations for health would also achieve the reduction of 25% in GHGEs, assuming the same proportional reduction is made in the food supply chain through production/processing. The reductions made by changing the diet by 2020 are around 14% from dietary changes. Previous work modelling the impact of changing the diet reported that completely eliminating meat, milk and rice would reduce GHGEs by approximately 15% (Audsley et al. 2009).
This project has taken a slightly different approach in that it looked at rebalancing the food in the diet rather than eliminating them and has achieved a similar magnitude of change. The changes presented for the 2020 diet are not as drastic as some might have expected, as it still includes small amounts of red meat and dairy products. This was intentional as it is believed that small step changes are needed if there is any hope for the population to take up the challenge of changing their diet for health and/or environmental reasons. It does, however, demonstrate that a healthy diet can be achieved that meets current nutrient recommendations with meat and dairy products included as well as meeting GHGE targets.
It is known that there is considerable variation in people’s consumption patterns, which is reflected in the wide range of GHGEs from individual diets (Coley et al. 1998). This means that the magnitude of change needed by individuals to achieve the 2020 diet will vary and it will be easier for some people than others. One of the greatest challenges will be to engage people who consume high GHG-intense diets and get the message across to everyone in a clear and concise manner. What does seem to be clear is that moving towards a diet that meets dietary recommendations, as described by the Eatwell plate, will go a long way towards reducing the GHGEs of the diet and meeting the 2020 target.
8. UNCERTAINTIES AND LIMITATIONS OF THE GHGE DATA Although there are many uncertainties and assumptions surrounding LCA and GHGEs for different types of food and drink, the available data has been used as best estimates for the project. The figures are not exact but the values are relative – for example, it is generally accepted that on average the GHGE for beef is higher than for many cereals. These uncertainties should not prevent the development of a diet that could reduce GHGEs or delay a move towards changing the UK’s diet because the general type of adjustments required to cut emissions is relatively clear even if the figures are not as precise as we would want. Also, a reduction in GHGEs is needed now; we cannot afford to wait until we have a more accurate and complete dataset for all food before action is taken. More accurate data will help improve the estimated savings that can be made, but is unlikely to change the general message of what people need to do to change their dietary choices.
The scope of this work was to develop a Livewell 2020 plate and design a diet which met both dietary recommendations for health and GHGE targets. The approach taken was driven by the short timescale of the project and the limited amount of published data available for GHGEs for individual food items, particularly for composite dishes that are a large part of the present day diet. There are various sources

Livewell Report 2011
44
of data for food GHGEs but these are not necessarily comparable, as different assumptions have been made and calculations used to produce the figures. We chose to use published pre-RDC GHGEs for primary produce from the HLCWG report, as this was the most comprehensive and recent published list of individual food items we could source. Since we could find very little information for the post-RDC figures or full LCA for individual food items, a single figure for post-RDC for the whole diet was added based on the ratio of pre-RDC to post-RDC (56% to 44%) for the total GHGE. Post-RDC emissions will vary between products depending on their type of processing, storage, cooking and waste. For example, the most GHG-intensive stages in the life cycle of fruit and vegetables are refrigeration and transport (post-RDC) and it makes up 25% of avoidable household waste, compared with only 6% of meat and fish (WRAP 2009), while agriculture (pre-RDC) is the most intensive stage of meat and dairy products.
With more time, individual food groups would be weighted to reflect these differences in the post-RDC GHGE values such as processing, transport, storage, packaging, preparation and waste. Again, this might alter the figures slightly but working within the error margins and uncertainties of the general GHGE figures it is unlikely to dramatically change the general consumption patterns proposed in the Livewell 2020 diet. More detailed data for GHGEs and greater consistency in lifecycle analysis is needed, which will allow better comparison between datasets and datasets to be combined. The recent development of the publicly available specification for assessment of GHGEs from goods and services (PSA 2050), a British Standard supported by Defra and the Carbon Trust, should help future work on LCA. This is a technical report with more specific guidelines for calculating GHGEs than previous ISO standards from LCA, which is currently being reviewed.
Future work related to diet and sustainability needs to consider how best to combine and harmonise datasets which have been set up for different purposes – for example GHGE data for the production of food commodities and dietary intake data based on food as consumed. The difference in the way the food is reported can influence the perception of the impact it is having on the pre-RDC GHGE. For example, a kilogram of uncooked rice has a pre-RDC GHG value of 3.50 kgCO2e, but is equivalent to approximately 2.7kg of cooked rice once it is hydrated. What is actually eaten is cooked rice, so using the adjusted weight for the form in which it is consumed, the pre-RDC per kilogram of cooked rice is lower. The reverse of this works for meat consumption as approximately 20-30% of the weight of meat is lost when it is cooked, so the pre-RDC GHGEs would be higher for the equivalent weight of cooked meat compared with raw meat. Dietary intakes can be expressed as production of food commodities, purchase of food items and consumed meals and snacks – in whatever form, however, the dietary and GHGE data needs to be harmonised to be consistent.
9. OTHER CONSIDERATIONS FOR A SUSTAINABLE DIET The scope of this project was to focus on the reduction of GHGEs, but this is only one of many environmental, ethical and economic issues that should be considered as part of a sustainable diet. The following section will highlight some of the key issues that should be considered in future work and be incorporated into future dietary models. More detailed discussions of many of these complex issues can be found in previous reports (Foster et al. 2006, Williams et al. 2006, Murphy-Bokern 2008, Chapagain & Orr 2008).
9.1 Broader environmental issues Broader environmental issues such as land use change, use of water resources, seasonality of food production, pollutants and biodiversity need be taken into account when considering a healthy, sustainable diet for the population. Many of these issues are interlinked, with some synergies and some conflicts between them.
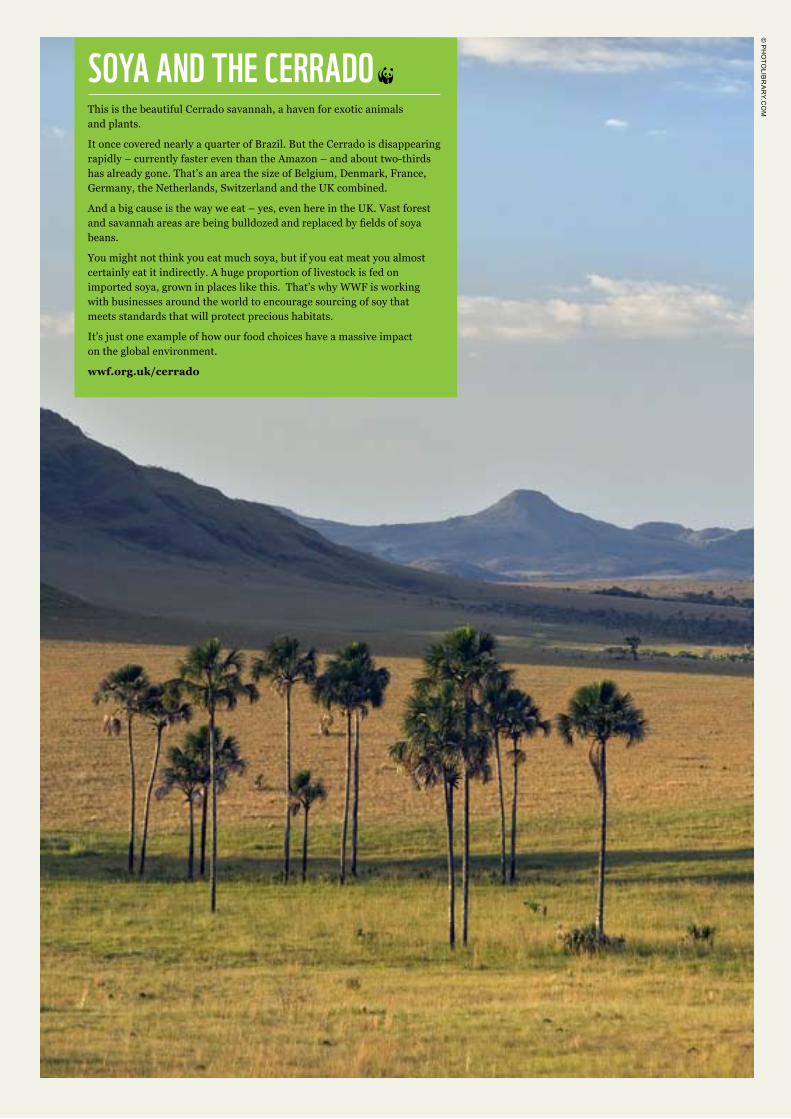
This is the beautiful Cerrado savannah, a haven for exotic animals and plants.
It once covered nearly a quarter of Brazil. But the Cerrado is disappearing rapidly – currently faster even than the Amazon – and about two-thirds has already gone. That’s an area the size of Belgium, Denmark, France, Germany, the Netherlands, Switzerland and the UK combined.
And a big cause is the way we eat – yes, even here in the UK. Vast forest and savannah areas are being bulldozed and replaced by fields of soya beans.
You might not think you eat much soya, but if you eat meat you almost certainly eat it indirectly. A huge proportion of livestock is fed on imported soya, grown in places like this. That’s why WWF is working with businesses around the world to encourage sourcing of soy that meets standards that will protect precious habitats.
It’s just one example of how our food choices have a massive impact on the global environment.
wwf.org.uk/cerrado
© P
ho
tolib
ra
ry.c
om
SOYA AND THE CERRADO

Livewell Report 2011
46
The impact of emissions resulting from land use change was not included in the analysis, mainly because most of the published data for LCA at the time of the project did not take this into account. Emissions arising from change of land use are typically the result of deforestation or pasture land being cleared for cultivation of commercial crops. This not only removes the carbon sink through the loss of forest but causes a release of CO2 and other GHGs into the atmosphere through soil disturbance (Garnett 2008). It is estimated that man-made land use change accounts for approximately 18% of global GHGEs and adds an extra 102MtCO2e/year to the emissions from UK food supply (Audsley et al. 2009). Much of the land use change has been driven by food production for export markets, commonly in the tropics where land use has changed most significantly. As highlighted by Garnett (Garnett 2008), if this is not taken into account in future work, it could result in policy or recommendations which could actually increase emissions. For example, a higher demand for cereals could lead to more land use changes at a global level through clearances to grow more crops for either human consumption (e.g. for soya products) or animal feed, or livestock could be displaced from land used for grazing into forest land.
These changes across the world tend to be driven by social, political and economic factors and can have a negative impact on biodiversity and affect wildlife habitat. All these issues need to be considered when developing recommendations for the diet in order to avoid any unintended consequences. The importance of this is now being recognised and therefore the British Standard for LCA (PAS 2050) will take into account land use changes.
With the Climate Change Act 2008 setting targets to cut carbon emissions by at least 80% by 2050, much of the focus has been on cutting GHGEs from the food supply, but equally important is the use of freshwater resources in the production of food. Water is a diminishing resource in certain parts of the world and, unlike oil where alternative forms of energy can be sourced if it runs out, water is a finite commodity for which there is no substitute. A significant amount of water is used in the production of food; this is referred to as 'embedded water' or 'virtual water', which is the volume of fresh water required to produce a product (Hoekstra & Chapagain 2008). The terms 'embedded' or 'virtual' water are used as the vast majority of water used to create a product is not physically contained in the product itself but consumed during the different phases of production. Like GHGE figures, the amount of embedded water in a product varies according to the type of food, as well as how and where it is produced. For example, it has been estimated that it takes about 140 litres of water to make one cup of coffee and 15,000 litres for 1kg of beef (Hoekstra & Chapagain, 2007). Beef is one of the most water-intensive types of food as it is not only the water consumed by animals but also the large volume that is needed to grow the grain to feed the animals. The exact magnitude of these figures is debated but they serve to illustrate that food production uses a lot more water than commonly realised. This is a serious concern. The traditional statistics on water use in the UK show that only 12 km3 (12,000 billion litres) of water per year is drawn from rivers and aquifers. This is about 9% of the total actual renewable water available in the UK, but it doesn’t include ‘green water’ (i.e. evaporation of soil moisture) used in the crop fields, which is about 35 km3 (35,000 billion litres) per year. Furthermore if the net volume of virtual water imported from other parts of the world is included, the total water footprint in the UK would become 102 km3 (102,000 billion litres) per year (Chapagain & Orr 2008). In the UK it is estimated that 4,645 litres of embedded water is consumed per person per day, of which approximately 65% is embedded in the food we eat. Sixty two percent of embedded water is imported in the UK, which is the sixth largest net importer of embedded water in agricultural products (Chapagain & Orr 2008). Hence, what happens elsewhere in the world is very important for food and water security in the UK. For example, most of the water used in coffee production in Brazil is the best use of rain water, which is beneficial to local livelihoods without hampering the environment much, whereas most of the water used in cotton fields in Pakistan would trigger further pollution and reduced run-off in the river

the mediterranean basinJuicy tomatoes and sweet peppers, warm bread and olive oil, figs and lemons, tuna steak and grilled sardines… Not only is the Mediterranean diet one of the world’s most seductive, it’s also one of the healthiest.
But the growing demand for the region’s produce has led to more intensive farming and fishing. And this has had a severe impact on the region’s unique biodiversity.
Large areas of land have been converted to agriculture, with water demand in the Mediterranean Basin doubling between 1950 and 2000. And cutting down forests of cork oaks, cedars, pines and olive trees means less space for animals like the Iberian lynx, brown bear and Barbary deer.
It’s a similar story in the Mediterranean waters where whales, dolphins, turtles, monk seals and bluefin tuna are also under pressure.
For more on how UK food habits impact on biodiversity around the world go to:
wwf.org.uk/food
© W
WF / M
inis
ter
iod
e M
ed
ioa
Mb
ien
te y
Jun
ta d
e a
nd
alu
cia

Livewell Report 2011
48
Indus with severe impacts on biodiversity and local water use further downstream. Water usage therefore has to be considered as part of a sustainable diet and as more data becomes available, this could be added to the model developed in this project – for example, constraints to minimise the impact of the diet on both GHGEs and embedded water. Importing food with large amounts of embedded water into the UK also raises an ethical issue, not least when valuable water is taken from countries where it is scarce. The depletion of water in many of these countries is exacerbated through irrigated agriculture for production of fruit and vegetables for export. As well as using up the water supply, this runs the risk of polluting the local water source with fertilisers and pesticides (Murphy-Bokern 2008). Mismanagement of water resources can also speed the rate of biodiversity loss and impact on habitats of different wildlife species. The issue of water use is much more complex than summarised here, but it is recognised as a very important issue for the sustainability of our future diet and should be taken into account in future work. The GHGE figures used in the Livewell diet models were adjusted to reflect the current ratio of imported food and domestic production of food items in the UK, but it did not specifically take into account the seasonality of food production. For a more sustainable diet the population could move towards eating more seasonal and field-grown fruit and vegetables (grown either in the UK or abroad) rather than those grown out of season and in heated greenhouses (SDC 2009).
This is not suggesting that the population should consume only seasonal, field-grown fruit and vegetables produced in the UK, not least because it could have the unintended result of reducing fruit and vegetable consumption, with detrimental health consequences. Depending on the time of year, the production of some imported fresh produce can have a lower GHGE than the equivalent domestically produced items because of the additional energy needs to grow them out of season in the UK. For example, the GHGE figure reported by Audsley et al. (2009) estimates that on average the GHGE for tomatoes produced in the UK is approximately three times higher compared with other parts of Europe. Importing some produce may cut GHGEs of the diet, but this in turn might be exporting environmental problems to other countries by increasing the burden on limited water sources, by reducing biodiversity or increasing levels of pollution through use of pesticides and fertilisers. GHGEs not only vary for fruit and vegetables, but there are also seasonal variations in the production of meat and dairy products. It would be possible to model a diet based on food only produced in the UK if there were sufficient data, but the range of food in the diet would be more limited and may not be acceptable to consumers – and depending on methods of food production may not result in a lower GHGE.
9.2 Economic and ethical issues There are also economic and ethical considerations relating to the food supply and sustainability of the food chain. In political terms, economic considerations can often supersede environmental and ethical issues when there is a drive for ongoing economic growth of a country. Many issues, such as domestic and international trade (including Fair Trade), farming practices and animal welfare are interconnected with the environmental issues already discussed. For example, importing fresh food into the UK that has been produced in irrigated agricultural systems provides trade and employment for some Sub-Saharan African countries, but at the same time it depletes the water sources for their population. This creates an ethical, economic and environmental dilemma which needs to be carefully balanced when considering sustainability outcomes. Changes to the current diet towards a healthier, sustainable diet could have economic implications for different sectors of the food and agriculture industry. For a diet to be sustainable, food production has to be economically sustainable, but this should not be at the expense of the environment or health of the population.
Although food prices are increasing in developed countries, the cost has been comparatively cheap for a long time. Purchasing patterns are often driven by the cost of different types of food, and there is a concern that if the cost of healthier or more sustainable products is high, many consumers would be unwilling or unable to pay for it. On the other hand, in a drive to make food production more energy and

The world’s oceans and seas are under severe strain. Three-quarters of all major global fish stocks are now fished to the limit – or beyond.
We co-founded the Marine Stewardship Council (MSC) to promote responsible fishing and to make it easier to buy responsibly-sourced fish. Several fisheries around the UK are now certified as sustainable by the MSC and some big north-east Atlantic fisheries are working towards certification. Many major supermarkets have committed to selling more MSC-certified fish in the future, so you’ll get an even wider choice.
We also want to reduce the environmental and social impact of farmed fish by developing standards for the Aquaculture Stewardship Council (ASC). Atlantic salmon is the main species farmed in the UK, but we also import a lot of farmed seafood from south-east Asia, India and South America, including tropical prawns, tilapia and pangasius.
wwf.org.uk/seafoodtips
© Jir
i re
za
c / W
WF-U
K
MSC

Livewell Report 2011
50
cost efficient, care needs to be taken that this does not drive practices of intensive agricultural methods that can be detrimental to animal or human welfare.
All these issues, and more, highlight the huge complexity of sustainability and the difficulty in defining and creating a truly sustainable healthy diet. To start this process it was considered a sensible and manageable approach to initially focus on the single environmental issue of GHGEs and create the basis for a healthy, sustainable diet. The approach and method developed in this project could now be built on to take a more holistic approach and consider the balance of these wider issues of sustainability.
10. PUBLIC HEALTH MESSAGE FOR A SUSTAINABLE, HEALTHY DIET In the UK government’s ‘Food 2030’ strategy6 a commitment was made to provide information to consumers to enable them to make healthy, sustainable food choices. At this stage it is not clear exactly how a public health message might explain what a totally sustainable, healthy diet would look like, but we hope this project might start the process. We can only highlight some of the issues that we think should be considered when trying to develop a single, consistent message about what people should be eating to achieve a sustainable healthy diet.
A general message based on the Livewell plate might include recommendations that small amounts of meat and dairy can still be included in the diet, but choosing lower fat versions of these products. The general type of meals eaten don’t necessarily need to change, but the composition of some meat-based meals could be ‘bulked out’ with other ingredients such as beans, pulses and vegetables to compensate for a reduced meat content. The challenge will be to develop simple messages that can convey all this information and include wider sustainability issues such as seasonality and field-grown produce, and then convince the population to change to this diet. This challenge will be all the greater because a recent Defra survey found that people in the UK thought they would be able to adapt to a ‘lower impact diet’, but from a list of 12 possible examples of pro-environmental behaviour, changing their diet was the one which they were least willing to do (Defra 2008).
The Eatwell plate was originally designed more than 15 years ago with the aim of translating scientific knowledge about nutrient requirements into proportions of food that should be eaten to achieve a healthy balanced diet which the public could understand. One of the limitations is that within each of the five food groups on the plate, there is no guide to how much of the different food types should be consumed, and it is unclear to which food groups some food belongs.
Today, with the range of ready meals and takeaways available, it can be hard to work out the proportion of different food groups in composite dishes and therefore difficult to translate it onto the Eatwell plate. Perhaps there is a need to update the way that a healthy diet is represented to try and incorporate composite dishes that are commonly consumed, reflecting the way people tend to eat today. Any new format would need extensive work among a wide range of the population to find the best solution. If the plate were to be revised to include sustainability it would also need to include all the food and drinks consumed in the diet, such as tea, coffee, other hot drinks, sauces, etc. which are currently excluded from the Eatwell plate. Attempts have been made to combine nutritional and environmental messages related to dietary intake. The ‘double pyramid’ shows the traditional food pyramid for health, with the food which should be eaten least frequently at the top of the pyramid alongside an inverted pyramid representing the ecological impact of the food (Barilla Center for Food & Nutrition 2010). Those food types with the lowest impact tend to be similar to those recommended for consumption in greater proportions for health.
Combining sustainability and health also raises issues about food labelling. There is already a lot of information on packaging about the nutrient composition of the food and a range of environmental issues – but the risk is that too much information leaves the consumer confused or that food manufacturers highlight only beneficial aspects of their product for health or sustainability. For
6 It is unclear at the time of writing how the government will take this forward (2010).

Livewell Report 2011
51
example, for unhealthy food focusing on what savings are made in terms of reducing GHGEs in the lifecycle of the products could be used to distract from the impact it might have on health. Without legislation this is likely to be unavoidable.
One thing is clear: there needs to be a lot of careful consideration and reflection to develop a simple, consistent public message and resources to describe a sustainable, healthy diet. There is enough confusion among the public about what they should eat for health and the risk is that if the message becomes too complex, people will not engage at all. Encouragingly, the results of this study suggest that the dietary changes needed to achieve a healthy diet are consistent with most changes needed for a low-GHGE diet.
11. RECOMMENDATIONS FOR FUTURE WORK This project has moved research forward and has started building the blocks for what the whole diet might look like if the reduction targets for GHGEs are to be achieved. Previous work has made recommendations for reducing the intake of specific food items such as meat and dairy products, or the impact of farming methods, but little has been done to look at the impact on the whole diet (Erb et al. 2009, Thomas et al. 2010). There is much more work to be done to fully understand the concept of a sustainable, healthy diet and the model developed in this project can be used as a starting point for future work. There are several recommendations that we consider would help take this work forward to improve our understanding of a sustainable, healthy diet.
1. Further development of the dietary model: the linear programming model used in the project is a useful method for generating different types of diets while applying constraints that must be achieved, such as nutrient recommendations and GHGEs. The model works on the basis of balancing and exchanging food to achieve the constraints, which means that it could be tailored to individual preferences and dietary needs. For example, if people wanted more of a specific food item within the bounds of the dietary recommendations, this would be possible but at the expense of other GHG-intensive food. The diet produced by the model could be tested for acceptability among groups of the population, then re-run to maximise the preferences of the general population. Taking this into account could help achieve the changes needed to improve the diet in terms of both health and GHGE targets.
2. More detailed GHGE data and full LCA: The amount of the GHGE data for individual food items based on full LCA is limited at the moment, and the accuracy of the model could be improved with more extensive and consistent GHGE data. It is hoped that with the development of a British Standard (PAS 2050), future LCA data will be more comparable, and that a standardised database could become available, similar to those that exist for the nutrient composition of food and drinks. These databases, including the national food and nutrient database (FSA 2002), must be maintained and updated regularly to reflect current food production methods and nutrient composition. This will require an organisation to take full responsibility and commit to updating this regularly, which is a large undertaking. There would also be great advantages if the nutrient intake databases and GHGE were harmonised to express respective values for food as eaten.
Due to the level of detail needed for different food items, the values from the HLCWG report were used, which was the most comprehensive list we could source. These figures, however, were only for the pre-RDC data of food commodities; therefore to calculate the total GHGEs in this project a single factor was added for post-RDC GHGE (44% of the total GHGEs). With more time available the post-RDC GHGE figure for different food groups in the model could be weighted to reflect differences in post-RDC GHGEs between food items.
3. Inclusion of a wider range of sustainability issues: The sustainable, healthy diet developed in this project only included the GHGE reduction targets; future work needs to consider some of the other issues related to sustainability, such as water use, land use change, impact on biodiversity, and ethical and economic concerns. With sufficient data it would be possible to include some of these in the model

Livewell Report 2011
52
as additional constraints that should be optimised – for example, water use or the economic impact of production methods. Putting these into a single model would start to show some of the trade-offs that will need to be made to achieve a truly sustainable and healthy diet.
12. REFERENCES
Audsley E, Brander M, Chatterton J, Murphy-Bokern D, Webster C, Williams A (2009) How Low Can We Go? An assessment of greenhouse gas emissions from the UK food system and the scope for reduction by 2050. WWF-UK. Barilla Center for Food & Nutrition (2010). Double Pyramid: healthy food for people, sustainable food for the planet. www.barillacfn.com/uploads/file/72/1277905159_PositionPaper_BarillaCFN_Double-Pyramid.pdf Cabinet Office (2008) Food Matters: Towards a Strategy for the 21st Century. London: TSO
Chapagain AK & Orr S (2008) UK Water Footprint: the impact of the UK’s food and fibre consumption on global water resources. WWF-UK http://assets.panda.org/downloads/wwf_uk_footprint.pdfwater resources Coley DA, Goodliffe E & Macdiarmid J (1998) The embodied energy of food: the role of diet. Energy Policy, 26, 6, 455-459. Cosgrove M, Flynn A, Koely M (2004) Impact of disaggregation of composite foods on estimates of intake of meat and meat products in Irish Adults. Public Health Nutrition, 8 (3), 327-337 Crawley H (2003) Food portion sizes. Third Edition. London: Food Standards Agency. Dantzig GB & Thapa MN (1997) Linear programming 1: Introduction. Springer-Verlag. DECC (2010) UK climate change sustainable development indicators: 2008 greenhouse gas emissions, final figures. Department of Energy & Climate Change www.decc.gov.uk/assets/decc/statistics/climate_change/1_20100202091108_e_@@_020210ghgnationalstatisticsrelease08finalresults.pdf Defra (2007) Fisheries 2027: a long term a long-term vision for sustainable fisheries. Department for Environment, Food and Rural Affairs, London. Defra (2008) A framework for pro-environmental behaviours. Department for Environment, Food and Rural Affairs, London. Defra (2010) Family Food: A report on the 2009 Family Module of the Living costs and food survey. National Statistics Publication. www.defra.gov.uk/evidence/statistics/foodfarm/food/familyfood/documents/familyfood-2009.pdf DoH (1991) Dietary reference values for food energy and nutrients in the United Kingdom. Department of Health: Report 41, London: HMSO. Erb KH, Haberl H, Krausmann F, Lauk C,et al (2009) Eating the Planet: Feeding and fuelling the world sustainably, fairly and humanely – a scoping study. Compassion on Farming and Friends of the Earth www.ciwf.org.uk/includes/documents/cm_docs/2009/e/eating_the_planet_full_report_nov_2009.pdf Foster C, Green K, Blenda M, Dewick P, Evans B, Flynn A, Mylan J (2006) Environmental Impacts of Food Production and Consumption. Department for Environment, Food and Rural Affairs, London. Friels S, Dangour AD, Garnett T, Lock K et al. (2009) Public health benefits of strategies to reduce greenhouse-gas emissions: food and agriculture. The Lancet, 374, 2016-2024. FSA (2002) Food Standards Agency McCance & Widdowson’s the Composition of Foods, 6th summary Edition. Cambridge: Royal Society of Chemistry; 2002

Livewell Report 2011
53
FSA (2007) Food Standards Agency: The Eatwell Plate. www.Eatwell.gov.uk/healthydiet/Eatwellplate/ FSA (2008) An assessment of dietary sodium levels among adults (aged 19-64) in the UK general population in 2008, based on analysis of dietary sodium in 24 hour urine samples. www.food.gov.uk/multimedia/pdfs/08sodiumreport.pdf FSA (2009) Food Standards Agency: Salt reduction targets. www.food.gov.uk/scotland/scotnut/salt/saltreduction FSA (2010) Food Standards Agency: National Diet Nutrition Survey: headline results from year 1 (2008/2009) www.food.gov.uk/science/dietarysurveys/ndnsdocuments/ndns0809year1 Garnett T (2007) Meat and dairy production & consumption: Exploring the livestock sector’s contribution to the UK’s greenhouse gas emissions and assessing what less greenhouse gas intensive systems of production and consumption might look like. Food Climate Research Network, Centre for Environmental Strategy, University of Surrey. Garnett T (2008) Cooking up a storm: Food, greenhouse gas emissions and our changing climate. Food Climate Research Network, Centre for Environmental Strategy, University of Surrey. Garrow JS (1995) Human nutritionist’s guilty secret. BNF Nutrition Bulletin, 20, 103-8. Gatenby SJ, Hunt P & Rayner M (1995) The National Food Guide: development of dietetic criteria and nutritional characteristics. Journal of Human Nutrition and Dietetics, 8, 323-334 Henderson L, Gregory J, Irving K, Swan G (2003) The National Diet & Nutrition Survey: adults aged 19 to 64 years. Volumes 1-4. Stationery Office, Norwich: HMSO. Hoekstra, A. Y., & Chapagain, A. K. (2007). Water footprints of nations: Water use by people as a function of their consumption pattern. Water Resources Management, 21, 35-48. Hoekstra, A. Y., & Chapagain, A. K. (2008). Globalization of Water: Sharing the Planet’s Freshwater Resources. Oxford, UK: Blackwell Publishing Ltd. Hunt P, Rayner M, Gatenby S (1995) A national food guide for the UK? Background and development. Journal of Human Nutrition & Dietetics, 8, 315-322. Jackson B, Lee-Wolf C, Higginson F, Wallace J, Agathou N (2009) Strategies for reducing red meat and dairy consumption in the UK. Imperial College London and WWF-UK. Maillot M, Ferguson EL, Drewnowski A, Darmon N (2008) Nutrient profiling can help identify foods of good nutritional quality for their price: a validation study with linear programming. J Nutr.138(6):1107-13. Maillot M, Vieux F, Amiot MJ, Darmon N (2010) Individual diet modelling translates nutrient recommendations into realistic and individual-specific food choices. Am J Clin Nutr. 91(2):421-30 Murphy-Bokern D (2008) Environmental impacts of the UK food economy with particular reference to WWF Priority Places and the North-east Atlantic. WWF report. http://assets.wwf.org.uk/downloads/environmentalimpacts_ukfoodconsumption.pdf PAS 2050 (2008) Guide to Publicly Available Specification 2050: How to assess the carbon footprint of goods and services. London: BSI. Prynne CJ, Wagemakers JJMF, Stephen AM, Wadsworth MEJ (2009) Meat consumption after disaggregation of meat dishes in a cohort of British adults in 1989 and 1999 in relation to diet quality. Eur J Clin Nutr 63, 660-666. SACN (2006) Scientific Advisory Committee on Nutrition. Report on Folate and Disease Prevention www.sacn.gov.uk/pdfs/folate_and_disease_prevention_report.pdf SACN (2009) Scientific Advisory Committee on Nutrition. Draft SACN Report on Iron and Health www.sacn.gov.uk/pdfs/draft_iron_and_health_report_complete_june_2009_consultation.pdf

Livewell Report 2011
54
SDC (2009) Setting the Table: Advice to government on priority elements of sustainable diets. Sustainable Development Commission, UK. Steinfeld H, Gerber P, Wassenaar T, Castel V, Rosales M, de Haan C (2006) Livestock’s long shadow: environmental issues and options. Food and Agriculture Organisation of the United Nations, Rome. Thomas P, Rayner M, Clarke D & Scarborough (2010) Healthy planet eating. How lower meat diets can save lives and the planet. Friends of the Earth. www.foe.co.uk/resource/reports/healthy_planet_eating.pdf UK Government (2010) Food 2030, Department for Environment, Food and Rural Affairs, London. www.defra.gov.uk/foodfarm/food/pdf/food2030strategy.pdf [accessed July 2010] Wallén A, Brandt N, Wennersten R (2004) Does the Swedish consumer’s choice of food influence greenhouse gas emissions? Environmental Science & Policy, 7: 525–535. Williams AG, Audsley E, Sandars DL (2006) Determining the environmental burdens and resource use in the production of agricultural and horticultural commodities. Department for Environment, Food and Rural Affairs (Defra) Research Project IS0205. Bedford. Wiltshire J, Wynn S, Clarke J, Chambers B, Cottrill B, Drakes D et al. (2009) Scenario building to test and inform the development of a BSI method for assessing GHGE from food. Defra project code FO0404. http://randd.defra.gov.uk/Document.aspx?Document=FO0404_8542_FIN.pdf WCRF (2007) World Cancer Research Fund/American Institute for Cancer Research. Food, Nutrition, Physical Activity and the Prevention of Cancer: a Global Perspective. Washington DC: AIRC. WRAP (2009) Waste & Resources Action Programme. Household Food and Drink Waste in the UK. Banbury.

Livewell Report 2011
55
13. APPENDICES
Appendix 1: The type of food included in each of the five Eatwell plate food groups
Group Eatwell segments
Example food
1
Bread, rice, potatoes, pasta, other starchy food
All bread, incl. soda bread, rye bread, pitta, flour tortilla, baguettes, chapatti, bagels
Rice Potatoes Pasta, noodles
Breakfast cereals, oats Maize, cornmeal,
polenta Millet, spelt Couscous, bulgur wheat,
pearl barley Yams and plantains
2 Fruit and vegetables
All fruit and vegetables, incl. apples, pears, oranges, bananas, grapes, strawberries, mango, pineapple, raisins, broccoli, courgettes, cabbage, peas, sweetcorn, lettuce, tomatoes, carrots
3 Milk and dairy food
Milk Cheese Yogurt Fromage frais
Cottage cheese Cream cheese Quark
4
Meat, fish, eggs, beans and other non-dairy sources of protein
Meat, poultry and game, incl. lamb, beef, pork, chicken, bacon, sausages, burgers
White fish (fresh, frozen, canned), incl. haddock, plaice, pollack, coley, cod Oily fish (fresh, frozen, canned), incl. mackerel, sardines, trout, salmon,
whitebait Shellfish (fresh, frozen, canned), incl. prawns, mussels, crab, squid, oysters Eggs Nuts Beans and other pulses, incl. lentil, chickpeas, baked beans, kidney beans,
butter beans
5
Food and drinks high in fat and/or sugar
Cakes Sugary drinks Biscuits Chocolate Sweets Puddings Pastries Ice-cream
Jam Honey Crisps Butter Margarine and spreads Oil Cream Mayonnaise
Appendix 2: NDNS food groups and allocation to the Eatwell food groups The table below shows the allocation of each NDNS food group to the Eatwell food groups and provides examples of the types of food in each NDNS food group.
NDNS food groups Example food Eatwell group
1A Pasta All types – dried, fresh and canned; incl. egg noodles, macaroni cheese, ravioli, spaghetti bolognaise
1
1B Rice Fried and boiled, savoury rice, egg fried rice, rice flakes, rice flour. (Not rice pudding)
1
1C Pizza All types – thin and crispy, deep pan, French bread 1
1R Other cereals Includes flour, bran, oats, dry semolina, papadums, dumplings, Yorkshire pudding
1
2R White bread Sliced, unsliced, toast, fried; incl. French bread, milk loaf, slimmers bread, pitta bread, rolls, chapatti, soda bread
1
3R Wholemeal bread Sliced, unsliced, toast, fried; incl. French stick, milk loaf, slimmers bread, pitta bread, rolls, chapatti, soda bread 1
4A Soft grain bread Sliced unsliced, toast, fried, rolls, fortified and not fortified 1

Livewell Report 2011
56
NDNS food groups Example food Eatwell group
4R Other bread
Sliced, unsliced, toast, fried; includes brown, granary, high-fibre white, rye bread, gluten free, garlic bread, continental bread e.g. ciabatta, oatmeal bread, VitBe, Hovis, crumpets, English muffins (white and wholemeal), pikelets, brown and granary rolls, bagels, brioche, naan, paratha
1
5R Wholegrain and high-fibre cereals
All with non-starch polysaccharide of 4g/100g or more e.g. bran, muesli, Shredded Wheat. Includes porridge and Ready Brek
1
6R Other Breakfast Cereals
All with non-starch polysaccharide of less than 4g/100g, e.g. corn flakes, Coco Pops, Sugar Puffs, incl. pop tarts
1
38R Potato products not fried
Croquettes, waffles, fritters, hash browns, AlphaBites, ketchips, grilled or oven baked
1
39R Other potatoes, potato salads and dishes
Includes boiled, mashed, baked (with or without fat), canned, potato salad, instant potato, potato-based curries, cheese and potato pie 1
36A Carrots (raw) 2
36B Salad and other vegetables (raw)
All types of raw vegetables incl. coleslaw, fresh herbs. Not salads made with cooked vegetables or potato salad
2
36C Tomatoes (raw) 2
37A Peas (not raw) canned, frozen
Includes canned, dried, mushy, frozen, mange tout, pease pudding canned
2
37B Green beans (not raw) canned, frozen
Includes French, runner, green beans; fresh, frozen, canned 2
37D Leafy green vegetables (not raw)
Includes broccoli, spinach, cabbage (all types), brussel sprouts; fresh and frozen 2
37E Carrots (not raw) Includes fresh, frozen, canned 2
37F Tomatoes (not raw) Includes fried, grilled, canned, sundried tomatoes 2
37G Vegetable dishes Includes curries, pulse dishes, casseroles and stews, pies, vegetable lasagne, cauliflower cheese, veggie burgers, bubble and squeak, vegetable samosas, pancake rolls, ratatouille, vegetable fingers etc.
2
37R Other vegetables (not raw)
Includes lentils, dried beans and pulses, mushrooms, onions, aubergine, parsnips, sweetcorn, peppers, leeks, courgettes, cauliflower, mixed vegetables, TVP/soya mince, quorn, tofu
2
40A Apples and pears not canned Includes raw, baked, stewed (with or without sugar), dried, apple sauce 2
40B Citrus fruit not canned Includes oranges, grapefruit, limes, tangerines, ortaniques etc 2
40C Bananas Includes baked bananas, banana chips 2
40D Canned fruit In juice Includes canned in water 2
40E Canned fruit In syrup 2
40R Other fruit, not canned
Includes plums, grapes, apricots (raw and stewed) etc. fruit pie fillings, dried fruit, fruit salad
2
45R Fruit juice Includes 100% single or mixed fruit juices, vegetable juices, canned, bottled, cartons; carbonated, still, freshly squeezed
2
10R Whole milk All types of cow’s milk incl. pasteurised UHT, sterilised, Channel Island 3
11R Semi-skimmed milk
All types of cow’s milk incl. pasteurised UHT, sterilised, canned, milk with added vitamins
3
12R Skimmed milk All types of cow’s milk incl. pasteurised UHT, sterilised, canned, milk with added vitamins, Vital, Calcia
3
13R Other milk Includes soya alternative to milk, goat’s, sheep’s, evaporated, condensed, dried milk, milk shake, coffee whitener, buttermilk, flavoured milk drink
3

Livewell Report 2011
57
NDNS food groups Example food Eatwell group
14A Cottage cheese Includes diet and flavoured 3
14R Other cheese All types, incl. hard, soft, cream cheese 3
15A Fromage frais Includes fromage frais, mousse, quark 3
15B Yogurt All types incl. soya, goat’s, sheep’s, yogurt mousse, yogurt drink, frozen yogurt, custard-style yogurt, Greek yogurt
3
15R Other dairy desserts
Includes chocolate and fruit cream desserts, mousse, milk jelly, junket, egg custard, buttermilk desserts, fruit fools, crème caramel
3
16A Eggs Includes boiled, fried, scrambled, poached, dried, omelettes (sweet and savoury)
4
16B Egg dishes Includes quiches, flans, soufflés, scotch eggs, eggy bread, apple snow, meringue, pavlova, curried eggs
4
22R Bacon and ham Including bacon and gammon joints, steaks, chops, rashers; all types of ham, pork shoulder, bacon and cheese grills
4
23R Beef, veal and dishes
Includes beef and veal joints, steaks, minced beef, beef stews, casseroles, meat balls, lasagne, chilli con carne, beef curry, bolognaise sauce, shepherd’s pie, canned beef
4
24R Lamb and dishes Includes lamb joint, chops, cutlets, fillets, lamb curries, Irish stew, lamb casseroles and stews
4
25R Pork and dishes Includes joints, chops, steaks, belly rashers, pork stews and casseroles, sweet and sour pork, spare ribs, roast roll
4
26R Coated chicken and turkey
Chicken and turkey pieces coated in egg and crumb; drumsticks, nuggets, fingers, burgers etc. Includes Kentucky Fried Chicken, chicken kiev
4
27R Chicken and turkey dishes
Includes roast chicken and turkey, barbeques, fried (no coating), curries, stews, casseroles, chow mein, tandoori, in sauce, spread, chicken/turkey roll
4
28R Liver, liver products and dishes
Includes all types of liver – fried, stewed, grilled, braised; liver casserole, liver sausage, liver pate 4
29R Burgers and kebabs
Includes beefburgers, hamburgers, cheeseburgers, (with or without roll), doner/shish/kofte kebabs (with or without pitta bread and salad), grillsteaks, steaklets
4
30R Sausages Includes beef, pork, turkey sausages, polony, sausage in batter, saveloy, frankfurters, sausage dishes
4
31R Meat pies and pastries
Any type of meat; incl. chicken/turkey pies, vol-au-vents, beef pies, steak and kidney pudding, pork pies, veal and ham pies, pasties, sausage roll, meat samosas, pancake rolls
4
32R Other meat and meat products
Includes game (e.g. venison, grouse, rabbit, pheasant), duck, goose, all offal (except liver), faggots, black pudding, haggis, haslet, meat paste, tongue, luncheon meat, corned beef, salami, pepperami , meat loaf
4
33R White fish coated or fried incl. fish fingers
Cod, haddock, plaice, etc. fried without coating, or coated in egg and crumb, batter or flour and fried, grilled or baked. Includes fish fingers and fish cakes – fried and grilled, fried cartilaginous fish, scampi, filet-o-fish, cod roe fried, prawn balls, fish feasts, fish pancakes
4
34R Other white fish and fish dishes
Cod, haddock, plaice etc. poached, steamed, baked, grilled, smoked, dried; incl. curried fish, fish in sauce, fish pies, kedgeree
4
34B Shellfish All types incl. mussels, prawns, crabs, shellfish dishes 4
35R Oily fish Includes herring, kippers, mackerel, sprats, eels, herring roe (baked, fried, grilled), salmon, tuna, sardines, trout, taramasalata
4
37C Baked beans Canned baked beans in sauce, baked beans with additions e.g. sausages, burgers, pasta
4
56R Nuts and seeds Includes fruit and nut mixes, salted peanuts, peanut butter, tahini, Bombay mix
4

Livewell Report 2011
58
NDNS food groups Example food Eatwell group
7R Biscuits All types, sweet and savoury; incl. cream crackers, flapjacks, breadsticks, crispbread, cereal crunchy bars, ice-cream cornet
5
8A Fruit pies All types, one and two crusts; incl. apple strudel, individual fruit pies from takeaways
5
8R Buns, cakes and pastries
Includes Danish pastries, currant buns, doughnuts, Eccles cakes, Bakewell tarts, jam tarts, scones (sweet and savoury), sponge cakes, fruit cakes, éclairs, currant bread, malt loaf, gateaux, pastry, mince pies, sponge fingers, scotch pancakes, croissants, custard tart, lemon meringue pie
5
9A Cereal-based milk puddings
Rice pudding (incl. canned), custard (not egg custard), Angel Delight, blancmange, confectioners custard, semolina, sweet white sauce
5
9B Sponge puddings Steamed, canned, suet pudding, jam roly poly, sponge flan, upside down pudding
5
9R Other cereal-based puddings
Includes trifle, fruit fritters, pancakes, crumble, bread pudding, cheesecakes, tiramisu, rum baba, Christmas pudding
5
13B Cream All types, incl. imitation cream, aerosol, dream topping, Tip Top, crème fraiche
5
53R Ice-cream All types, incl. non-dairy, choc ices, ice-cream desserts, ice-cream containing lollies, milk ice lollies, low fat/low calories ice-cream
5
17R Butter Salted and unsalted, butter ghee, spreadable butter 5
18A Polyunsaturated margarine Margarine claiming to be high in polyunsaturated fatty acids 5
18B Polyunsaturated oils Includes corn oil, sunflower oil, solid sunflower oil 5
19A Low-fat spread polyunsaturated
Spreads containing 40% or less fat, claiming to be high in polyunsaturated fatty acids
5
19R Other low-fat spread
Spreads containing 40% or less fat, not claiming to be high in polyunsaturated fatty acids
5
20A Block margarine All hard margarine 5
20B Soft margarine not polyunsaturated
Tub margarine not claiming to be high in polyunsaturated fatty acids 5
20C
Other cooking fats and oil, not polyunsaturated
Includes blended vegetable oil, suet, lard, compound cooking fat, dripping, olive oil, rapeseed oil
5
21A Reduced fat spread, polyunsaturated
Spreads containing more than 40% and less than 80% fat, claiming to be high in polyunsaturated fatty acids 5
21B Other reduced fat spread
Spreads containing more than 40% and less than 80% fat, not claiming to be high in polyunsaturated fatty acids; incl. spreads made with olive oil, rapeseed oil or fish oil
5
38A Chips Fresh and frozen, incl. oven and microwave, French fries 5
38B Fried or roast potatoes and fried potato products
Roast potato, fried sliced potato with or without batter, fried waffles, croquettes, crunchies, AlphaBites, fritters, hash browns 5
42R Crisps and savoury snacks
Includes all potato and cereal-based savoury snacks, popcorn (not sweet), Twiglets
5
41A Sugar All types incl. golden syrup, fructose 5
41B Preserves Includes jam, fruit spreads, marmalade, honey, lemon curd 5
41R Sweet spreads, fillings, icing
Includes ice cream topping sauce, chocolate spread, mincemeat, glace cherries, mixed peel, icing, brandy/rum butter, marzipan
5
43R Sugar confectionery
Includes boiled sweets, gums, pastilles, fudge, chews, mints, rock, liquorice, toffees, chewing gum, sweet popcorn, ice lollies (without ice-cream)
5

Livewell Report 2011
59
NDNS food groups Example food Eatwell group
44R Chocolate Confectionery Includes chocolate bars, filled bars, assortments 5
57A Concentrated soft drinks All types incl. squashes and cordials not low calorie 5
57B Carbonated soft drinks, not low calorie
All types, incl. tonic water. Not carbonated mineral water; not alco-pops 5
57C Ready to drink soft drinks, not low calorie
All types of still soft drinks, not carbonated 5
58A Concentrated soft drinks, low calorie
All low calorie, no added sugar, sugar-free types 5
58C Ready to drink soft drinks, low calorie
All low calories, no added sugar, sugar-free types. Not carbonated 5
Appendix 3: The contribution of different food in the NDNS to each Eatwell plate food group Eatwell food groups
NDNS food group Contribution to the Eatwell plate food group (%)
ALL MEN WOMEN White bread 25.4 27.8 24.0 Other potatoes, potato salads and dishes 21.5 19.5 22.6 Rice 10.8 10.9 11.1 Pasta 10.6 10.2 10.7 Wholegrain and high-fibre cereals 8.3 7.9 8.8 Other bread 7.0 6.6 7.5 Wholemeal bread 6.0 6.1 5.9 Pizza 4.6 5.3 3.8 Other breakfast cereals 2.9 2.7 3.1 Other cereals 1.9 1.8 2.0 Potato products not fried 0.5 0.6 0.3
Bread, rice, potatoes, pasta and other starchy food
Softgrain bread 0.4 0.6 0.2
Semi-skimmed milk 45.1 46.7 40.3 Whole milk 16.3 17.9 16.7 Yogurt 14.1 12.5 15.6 Skimmed milk 10.4 10.9 13.2 Other cheese 9.4 8.2 8.5 Other milk 2.0 1.9 2.4 Other dairy desserts 1.2 1.1 1.3 Cottage cheese 0.9 0.4 1.3
Milk and diary food
Fromage frais 0.6 0.4 0.7
Chips 22.3 23.3 21.1
Buns, cakes and pastries 11.7 11.0 12.5 Fried or roast potatoes and fried potato products 7.6 8.2 7.7 Biscuits 7.5 7.6 7.7 Sugar 7.2 7.3 6.4 Chocolate confectionery 5.9 6.1 5.9 Carbonated soft drinks, not low calorie 5.6 5.6 4.9 Crisps and savoury snacks 4.7 4.5 4.8 Other cereal-based puddings 3.9 3.5 4.7 Ice-cream 3.8 3.2 4.3 Cereal-based milk puddings 3.1 3.1 3.2 Other reduced fat spread 2.2 2.4 2.2
Food and drinks high in fat and/or sugar Food and drinks high
Preserves 2.2 2.0 2.0

Livewell Report 2011
60
Eatwell food groups
NDNS food group Contribution to the Eatwell plate food group (%)
ALL MEN WOMEN Butter 2.0 2.0 2.0 Fruit pies 1.7 1.8 1.7 Sugar confectionery 1.3 1.4 1.5 Reduced fat spread, polyunsaturated 1.3 1.2 1.4 Concentrated soft drinks 1.1 1.1 1.0 Cream 1.1 0.9 1.0 Low fat spread polyunsaturated 0.7 0.9 1.0 Sponge puddings 0.7 0.8 0.8 Soft margarine not polyunsaturated 0.7 0.8 0.6 Ready to drink soft drinks, not low calorie 0.7 0.5 0.6 Other low fat spread 0.4 0.5 0.5 Sweet spreads, fillings, icing 0.2 0.2 0.2 Other cooking fats and oil, not polyunsaturated 0.2 0.2 0.1 Polyunsaturated margarine 0.1 0.1 0.1 Concentrated soft drinks, low calorie 0.0 0.02 0.03 Ready to drink soft drinks, low calorie 0.0 0.01 0.02 Polyunsaturated oils 0.0 0.00 0.00
in fat and/or sugar (cont)
Block margarine 0.0 0.00 0.00
Chicken and turkey dishes 20.3 19.6 21.4 Beef, veal and dishes 15.5 15.3 15.9 Baked beans 7.0 7.4 7.0 Eggs 6.7 7.2 6.7 Bacon and ham 6.5 7.1 6.5 Meat pies and pastries 6.3 6.7 5.9 Oily fish 5.4 4.8 5.0 Sausages 4.2 4.4 4.2 Pork and dishes 3.9 4.2 3.7 White fish coated and/or fried incl. fish fingers 3.9 4.1 3.4 Burgers and kebabs 3.8 3.8 3.3 Lamb and dishes 3.2 3.2 3.1 Coated chicken and turkey 3.0 3.1 3.1 Other meat and meat products 2.7 2.7 3.0 Other white fish and fish dishes 2.5 2.1 2.4 Shellfish 1.7 1.4 2.1 Egg dishes 1.6 1.2 1.9 Nuts and seeds 0.9 0.9 0.9
Meat, fish, eggs, beans and other non-dairy sources of protein
Liver, liver products and dishes 0.7 0.8 0.5
Apples and pears (not canned) 12.8 13.5 12.1 Bananas 11.1 12.1 11.5 Other vegetables (not raw) 11.0 11.0 11.1 Fruit juice 10.0 10.7 9.9 Other fruit (not canned) 9.4 8.1 9.5 Salad and other vegetables (raw) 8.7 7.1 9.2 Tomatoes (raw) 6.8 6.6 7.7 Vegetable dishes 6.8 5.8 7.0 Citrus fruit (not canned) 5.2 5.5 5.7 Leafy green vegetables (not raw) 4.8 4.8 4.9 Peas (not raw) canned, frozen 4.4 4.7 3.4 Carrots (not raw) 3.5 3.9 3.3 Tomatoes (not raw) 1.9 2.3 1.6 Green beans (not raw) canned, frozen 1.4 1.5 1.3 Canned fruit In juice 0.9 1.0 0.8 Canned fruit In syrup 0.7 0.8 0.6
Fruit and vegetables
Carrots (raw) 0.6 0.6 0.5

Livewell Report 2011
61
Appendix 4: Food groups included in the database with upper and lower limits imposed on the amount of certain food in the Livewell 2020 model
Food Item Imposed limit
Food Item Imposed limits
Pasta, noodles lower & upper Yogurt/fromage frais (full fat) no limits Rice (cooked) lower & upper Yogurt/fromage frais (low fat) lower & upper White bread lower Eggs (fried, poaches, boiled) lower Wholegrain bread lower Bacon upper Brown, granary, rye bread upper Ham lower
Wholegrain and high-fibre breakfast cereals porridge)"
lower & upper Beef (cooked meat only) lower & upper Other breakfast cereals lower & upper Lamb (cooked meat only) no limits Oats (e.g. porridge) lower & upper Pork (cooked meat only) lower
Potato products grilled, oven baked (not fried)
lower Chicken meat lower
Potato (boiled, baked, no fat) lower & upper Turkey meat no limits Carrots (raw) no limits Liver (calf, lamb, chicken, pig) upper Carrots/turnips (cooked) lower Sausages (pork) no limits
Tomatoes (tinned and raw) lower & upper White fish (coated, fried) lower Peas (cooked) lower & upper White fish (not fried) no limits Green beans (cooked) no limits Shellfish lower & upper
Cabbages, sprouts, other brassicas (cooked)
lower Oily fish lower & upper Cauliflowers, broccoli, spinach (cooked) lower Cashew nuts no limits Cucumbers lower Sesame seeds lower Eggplant (aubergines) fried no limits Sunflower seeds no limits Lettuce lower & upper Nuts lower
Mushrooms (fried) lower Beans – kidney, black-eyed, butter, chickpeas"
lower Onions (inc. shallots) lower Lentils lower & upper Pepper (raw) lower Baked beans lower Sweetcorn lower & upper Biscuits lower & upper Pumpkins, squash and gourds no limits Buns, cakes and pastries lower & upper Apples, pears (raw) lower Milk and dairy puddings no limits Citrus fruit no limits Sponge and cereal-based puddings lower Bananas lower & upper Cream no limits
Grapes, kiwi, cherries lower Ice-cream lower Peaches, nectarines, apricots lower & upper Butter no limits Melons, mangoes, pineapple, watermelon no limits Soft margarine (not low fat) no limits Plums no limits Reduced fat spread no limits Raspberries, strawberries, blueberries lower Low fat spread lower Currants and gooseberries no limits Fried, roast potatoes and fried
potato products (incl. chips)" lower
Fruit juice lower & upper Crisps and savoury snacks lower Whole milk no limits Sugar lower
Semi-skimmed milk lower Preserves (jam, honey) lower Skimmed milk upper Sweets no limits Cottage cheese no limits Chocolate lower Cheese (high fat) no limits Concentrated soft drinks (not diet)
made up with water" no limits
Cheese (reduced fat) lower Carbonated soft drinks (not diet) no limits
Note: limits were set for each food group to give sensible and usable portion sizes (Crawley 2003) and to ensure that food was included as far as possible as whole units or in units in which it is sold.
Appendix 5: List of food items when no upper or lower limits are imposed on the amount of individual food in the diet

Livewell Report 2011
62
The food lists in both tables below meet all the nutrient requirements described for the 2020 diet. In Table 1 the list was not required to achieve the Eatwell plate proportions, but in Table 2 the list was required to meet the Eatwell plate proportions as well as food and nutrient requirements. These examples show that the type of food list produced if no upper or lower limits are imposed gives portion sizes that are not viable as a sensible diet (e.g. 203g cereal per day with no milk) and the range of food is very limited.
Table 1: A diet that meets only nutrient requirements but not the Eatwell plate proportions
Eatwell food group Food items
Weight as eaten
(g/day)
Eatwell plate percentage
1 Pasta, noodles, couscous 153
1 Wholegrain and high-fibre breakfast cereals (not porridge) 203 43%
2 Peas 280
2 Cabbages, brussel sprouts, other brassicas 12
2 Onions 108
48%
4 Sesame seeds 37 5%
5 Sweets 3 5 Chocolate 33
4%
Pre-RDC GHGE: 0.34 kgCO2e per person (total GHGE = 0.60 kgCO2e) 92% GHGE reduction
Table 2: A diet that meets food and nutrient requirements and the Eatwell plate proportions
Eatwell food groups
Food items Weight as
eaten (g/day)
Eatwell plate percentage
1 Pasta, noodles, couscous 106
1 Wholegrain and high-fibre breakfast cereals (not porridge) 184 33%
2 Peas 240
2 Onions 50 33%
3 Yogurt (full fat) 131 15%
4 Oily fish 25
4 Sesame seeds 18
4 Cashew nuts 37
4 Beans e.g. kidney, black-eyed, butter, chickpea 25
12%
5 Fried, roast potatoes and fried potato products (incl. chips) 43
5 Chocolate 26 8%
Pre-RDC GHGE = 0.57 kgCO2e per person (Total GHGE = 1.03 kgCO2e) 86% GHGE reduction
Appendix 6: Micronutrient content of the Livewell 2020 diet The table below shows that in addition to the nutrient requirements set for the model, other micronutrient requirements were also met in the Livewell 2020 diet.

Livewell Report 2011
63
Micronutrient Average of the seven-day menu for Livewell 2020
Reference nutrient intake for a woman 19-50yrs
Vitamin A 1285 µg 600 µg
Thiamine 1.76 mg 0.8 mg
Riboflavin 2.04 mg 1.1 mg
Niacin 38.6 mg 13 mg
Vitamin B6 2.36 mg -
Vitamin C 173.8 mg 40 mg
Vitamin E 8.33 mg -
Magnesium 322 mg 270 mg
Appendix 7: Ingredients in the composite meals in the Livewell 2020 sample menu The table below shows the cooked weight of each ingredient used in the three main composite dishes.
CHICKEN STIR FRY
Cooked weight
(g)
CHICKEN CURRY
Cooked weight
(g)
CHILLI BEEF TORTILLAS
Cooked weight
(g)
Chicken (cooked) 102 Chicken (cooked) 101 Beef (cooked) 91
Peas/mange tout 35 Peas 70 Kidney beans (canned) 35
Mushrooms 22 Mushrooms 46 Pepper 82
Onions 19 Onions 40 Onions 40
Carrots 19 Sauce: Tinned tomatoes 86
Peppers 40 Semi-skimmed milk 110 Chilli powder* 2
Sweetcorn 28 Low fat spread 7 Served with:
Orange juice 27 Flour** 5 Tortilla wraps 110
Ginger* 1 Curry powder* 2 Reduced fat cheese 20
Noodles (cooked) 260 Served with: Lettuce 30
Rice (cooked) 210 Tomatoes 34
Pitta bread 65 Cucumber 23
* these food types were not on the food list but are considered to be ‘store cupboard’ items that would not alter the nutrient composition of the diet and if used in very small quantities would not add significant GHGEs. ** flour was taken from the allowance for bread in the food list.

WWF-UK, registered charity number 1081247 and registered in Scotland number SC039593. A company limited by guarantee number 4016725 © 1986 panda symbol and ® “WWF” Registered Trademark of WWF-World Wide Fund For Nature (formerly World Wildlife Fund), WWF-UK Panda House, WeysidePark, Godalming, Surrey GU7 1XR, t: +44 (0)1483 426333, e: [email protected], wwf.org.uk
© N
AS
A
48%
30%
1.2 Billion 2/3
Proportion of food-related greenhouse gas emissions arising from livestock
The number of people worldwide suffering from hunger and malnutrition whilst the same number are overweight or obese
Proportion of the beautiful Cerrado savannah in Brazil that has been destroyed largely due to production of soy, beef and other agriculture
The proportion of UK greenhouse gas emisions generated by the food sector
Food in numbers
If there is no URL
With URL - Regular
OR
Why we are here
To stop the degradation of the planet’s natural environment and
to build a future in which humans live in harmony and nature.
Why we are here
wwf.org.uk
To stop the degradation of the planet’s natural environment and
to build a future in which humans live in harmony with nature.
WWF.oRG.UK/liveWell2020• liveWell RepoRt