a 3d-ultrasound guidance - kth.diva-portal.org1086147/fulltext01.pdf · a 3d-ultrasound guidance...
TRANSCRIPT


A 3D-ultrasound guidance device for central venous catheter placement using augmented reality
En 3D-ultraljud guidningsanordning för central venös kateter placering med användning av förstärkt verklighet
Magnus Jansson
Master’s thesis at STH
Supervisor: Dr Arata Jumpei Collaborator: Dr Shinya Onogi Examiner: Dmitry Grishenkov Degree Project in Technology and Health Advanced level (second cycle), 30 credits Master thesis fulfilled at Kyushu University, Japan

i
Abstract
Central venous catheterization (CVC) is performed frequently in clinical practices in Operation
Rooms(OR) and Emergency Rooms(ER). CVC is performed for different reasons such as supply
nutrition or medicine. For CVC ultrasound (US), diagnostic device is preferable among other medical
imaging technologies. Central Venous Catheterization (CVC) under the 2D US guidance requires skills
for catheter placement to avoid damaging non-targeted blood vessels. Therefore, there is a great need
for improvements in the CVC field where mechanical complication has a risk of occurring during the
procedure, for example misplacement of the needle.
This master thesis project was performed at Kyushu University department of mechanical
engineering and collaboration with Maidashi Kyushu University Hospital department of Advanced
Medicine and Innovative Technology in Japan. This thesis is aimed to develop a new simple and cheap
guidance system for CVC placement. The system performed on a Tablet PC and will be using already
existing Ultrasound machines in Hospitals and Augmented Reality(AR).
The project developed a simple AR-System for CVC placement with use of the ArUco library. The new
developed system takes information from Ultrasound images and constructs a 3D-model of a vein
and artery. Then the 3D-model is augmented on the patient through the tablet PC by using the ArUco
library. The construction and augmentation is all performed on the tablet PC and has a small
computation to complete the necessary procedures for the 3D-blood vessels.
The AR-system has a simple control where the interface of the system is a simple push and action
system. When a good visualization of the blood vessels and Doppler effect is shown on the ultrasound
machine, the surgeon presses the screen and the image is saved. After about five images are acquired,
the system builds the 3D-model and augments it on the patient using a marker.
For the development of this system it implemented the waterfall method where each step was tested
and checked, before moving to the next step.
A full functional system was developed and tested. From the tests performed it is shown that there
were limitations due to segmentation and depth perception. But the system has possibilities as an aid
for CVC placement.
Keywords: Augmented Reality, Central Venous Catheterization, Mechanical complications,
Guidance system.

ii
Sammanfattning
Central Venös kateterisering (CVC) utförs ofta i klinisk praxis som i operationsrum (OR) och
akutmottagning (ER). CVC utförs av olika skäl såsom tillförsel av näring eller medicin. För CVC är
ultraljuds (US) guidning att föredra bland andra medicinska avbildningstekniker. Men vid CVC under
2D-ultraljuds vägledning krävs det höga färdigheter för kateter placeringen för att undvika att
punktera andra blodkärl än den som skall punkteras för katetern. Det finns därför ett stort behov av
förbättringar inom CVC området där de mekaniska komplikationerna har en risk att inträffa under
utförandet av operationen, exempelvis felplacering av nålen.
Detta examensarbete har utförts vid Kyushu University avdelningen för maskinteknik och med
samarbete med Maidashi Kyushu Universitetssjukhus vid Institutionen för avancerad medicin och
innovativ teknik i Japan. Examensarbetet var riktad mot att utveckla ett nytt enkelt och billigt
guidnings system för CVC placering. Genom att använda förstärkt verklighet (Augmented Reality) på
en bärbar surfplatta.
Projektet utvecklade ett enkelt AR-system för CVC placering med användning av ArUco biblioteket.
Det nya systemet har utvecklats så att det kunde från tagna ultraljuds bilder konstruera en 3D-modell
av en ven och artär. Sedan genom att använda ArUco biblioteket kunde systemet placera blodkärlen
på patienten genom en surfplatta. Surfplattan var en Windows 10 OS surfplatta från Dell, där den
kunde hantera processen det tog för att hantera livestream från ultraljudsmaskinen och kameran som
presenterar användbar information för kirurgen.
AR-systemet har ett enkelt kontroll system där det grafiska gränssnittet för systemet är ett enkelt
tryck och åtgärdssystem. När en åtgärd skall ske trycks på önskade åtgärdsknappen, till exempel
starta systemet eller att gå vidare med kalibrering av systemet.
För utvecklingen av detta system implementerades vattenfalls metod där varje steg testades och
kontrolleras innan nästa steg påbörjades.
Ett full fungerande system blev utvecklat och testat. Från testerna visades det sig att det fanns
begränsningar på grund av segmentering och djup seende. Men systemet har möjligheter som ett
fungerande hjälpsystem för CVC placering.
Nyckelord: Förstärkt verklighet, Central ven kateterisering, mekaniska komplikationer, Guide
system.

iii
Acknowledgements
First and foremost, I would like to thank my collaborator Dr Onogi Shinya and my supervisor
Dr Arata Jumpei for giving me the opportunity to work on this project and supporting me
along the way during this Thesis. They have been truly invaluable to me when in need of
feedback and guidance. I would also like to thank Kyushu University in giving me the
opportunity for me to study at their university in Japan. Last, but not least, I would like to
thank my family for your constant love and support
Magnus Jansson
Fukuoka, August 2016
Distribution of work
This thesis was performed with a collaboration with Dr Shinya Onogi at Maidashi Kyushu
University Hospital. Where Dr Onogi, developed the basic marker detection function and
needed translation between coordinates systems, such as from the image coordinate system
to the camera coordinate system. Also the final interface of the system was developed by Dr
Onogi. The Author developed the image processing, the 3D-construction of the blood vessels,
the navigation system for the interface and the tests. The production and design of the 3D-
printed objects was done by the author.
Abbreviations
CVC Central Venous Catheterization
OR Operating Room
ER Emergency Room
US Ultrasound
AR Augmented Reality
VR Virtual Reality
VTK Visualization ToolKit
OpenCV Open Source Computer Vision Library
ITK Insight Segmentation and Registration Toolkit

iv
TABLE OF CONTENTS
1 Introduction .................................................................................................................................1
1.1 Background ........................................................................................................................1
1.2 Objective .............................................................................................................................1
1.3 Outline .................................................................................................................................1
2 Method and Setup .....................................................................................................................2
2.1 Software ..............................................................................................................................2
2.2 Hardware ............................................................................................................................2
2.3 Development of the System .............................................................................................3
2.4 Test setup ...........................................................................................................................3
2.5 How the System Works ....................................................................................................7
3 Experiments ............................................................................................................................ 11
3.1 Image Segmentation ...................................................................................................... 11
3.2 Marker Detection Experiment ....................................................................................... 11
3.3 Accuracy Experiment ..................................................................................................... 12
4 Results ..................................................................................................................................... 13
4.1 Image Processing ........................................................................................................... 13
4.2 Marker Detection ............................................................................................................ 13
4.3 Accuracy of Marker ........................................................................................................ 14
5 Discussion ............................................................................................................................... 16
5.1 Image Processing ........................................................................................................... 16
5.2 Detection Test ................................................................................................................. 17
5.3 Accuracy Test ................................................................................................................. 17
6 Conclusion ............................................................................................................................... 19
7 Future Work ............................................................................................................................. 20
8 References .............................................................................................................................. 21
Appendix A. Test Data ....................................................................................................................... 22
Appendix B. State of the Art ............................................................................................................. 26

1
1 INTRODUCTION
1.1 BACKGROUND Central venous catheterization (CVC) [1,2] is performed frequently in clinical practices in
operation rooms (OR) and emergency rooms (ER). CVC is performed for several reasons
such as suppling nutrition/medicine or kidney dialysis [3] and in some cases, due to a
patient’s condition, CVC has to be performed immediately where the patient could suffer
from kidney failure [4]. Ultrasound (US) diagnostic device is superior when it comes to
instantly acquiring internal images of a patient and is the reason why it is preferable among
other medical imaging technologies. Compared to CVC, Computerized tomography and
magnetic resonance imaging are more expensive and require more time.
However, CVC under the 2D US guidance requires skills for catheter placement to avoid
damaging non-targeted blood vessels. This is because a 2D US image will only supply an
image section of the blood vessels. A 2D image will not show the surrounding area of the
targeted blood vessels and therefore have a risk for misplacement. It has been noted that approximately 15% of patients suffer from complication from the CVC surgery [1,5] and the
complication can be fatal [6].
3D volume reconstruction of US image would thus drastically improve the catheter
placement by the augmented three-dimensional perception. US 3D reconstruction has been
shown in the market, but only using a specialized 3D US probe or machines which have a
position sensor such as an electro-magnetic position sensor for freehand 3D ultrasound [7].
A product from the company BK [8] represents an ideal solution; however, the product
requires a specific 3D US probe that is only introduced in some specific areas (e.g. pelvic
floor). Other studies regarding CVC and Augmented Reality (AR) have been studied but
solely focused on simulation training [9,10].
1.2 OBJECTIVE The main focus of this project is to develop an Augmented Reality system for CVC needle
insertion using real-time 3D volume reconstruction that can be performed by a conventional
US probe which is scanned by free-hand. For this new system several test were performed
on each function of the system. This project will be divided into three larger tasks (Marker
Detection, Segmentation and Construction) where each task focuses on specific needs for
the system. Were the needs are the thing the system needs to fully function as intended. Also
all larger tasks contain subtasks for better overview and control of project, such as the
marker itself or connecting contours for 3D-model construction.
1.3 OUTLINE A theoretical background to most of the concepts used in this thesis can be found in the
Literature Study in Appendix A. Chapter 2 Methodology contains a description of the
different methods used, also the test setup. Chapter 3 Test & Validation describes how the
tests were performed. Chapter 4 covers the resulted system and results from the tests that
were performed. Chapter 5 Discussion covers a discussion of the resulted data and Chapter
6 Conclusion gives a conclusion of the produced results. Chapter 7 Future work covers
possible improvements and the next step of the project.

2
2 METHOD AND SETUP
This chapter will explain how the different parts of the AR-System software were developed
and present the experimental setup for the project. Information about the used software and
tools for developing the system can be found in this chapter also. The chapter then ends
with how the developed system works.
2.1 SOFTWARE This section lists the software and libraries that were used in the system.
2.1.1 Visual Studio
For developing the programming environment, “Visual Studio 2015 Community” (VSC) was
used. VSC has good functionality for the selected program language C++. The programming
language C++ has a wide functionality and compatibility with the used libraries such as
Visualization ToolKit (VTK) [1] and Open Source Computer Vision Library (OpenCV) [2].
The used marker detection and identification library ArUco [3] is mainly developed in C-
programming. ArUco is a minimal AR library which uses OpenCV algorithms to perform
marker-based AR. VSC also has great functionality for debugging and remote debugging,
which is used for testing the software on the tablet PC.
2.1.2 CMake
CMake [4] was selected for this system because of its cross-platform build environment for
open source projects such as VTK [1] and Insight Segmentation and Registration Toolkit
(ITK) [5]. CMake is an open source, cross platform designed to build, test and package
software. The suite of CMake tools were created by Kitware [6].
2.1.3 VTK and OpenCV
To acquire visualization and image processing, the libraries VTK [1] and OpenCV [2] were
selected.
VTK [1] was used for 3D computer graphics, image processing and visualization. VTK
consists of a C++ class library, and several interpreted interface layers including Python,
Tcl/Tk and Java.
OpenCV [2] is an open source computer vision and machine learning software library. It has
C++, C, Python, Java and MATLAB interfaces. OpenCV [2] is written natively in C++ and
has a templated interface that works seamlessly with STL containers, which works perfectly
with the C++ developed system. Were OpenCV was used for segmentation of images and
used by the ArUco library.
2.1.4 Sketchup Sketchup [7] was used for designing and developing the 3D-printed markers and
attachments. Such as the test setup for the developed system. Sketchup [7] is a 3D-modelling
software, that can be downloaded for free. Sketchup is owned by Trimble [8] and was
developed by @Last Software [9].
2.2 HARDWARE
The Tablet Pc used was a Dell “Venue 8 Pro 5855” [10]. This tablet PC was selected because
of its specifications, such as its dual-processor, camera and Windows operating system. For

3
the tests and placing of the 3D-printed marker holder an optical table was used. The table
was selected as it was the one available.
2.3 DEVELOPMENT OF THE SYSTEM
2.3.1 The System
The project was developed in an object-oriented fashion [11]. The functions were developed
outside the main system so they could be tested on their own. Functions that were developed
were collecting the data, constructing the 3D-bloodvessels, placement of the 3D-object using
the AR-system and the interface. The constructing of the 3D-bloodvessels was divided into
smaller sections; the Image segmentation and 3D-construction of blood vessels. The
interface was developed to be a push-and-action system, where the only thing needed was to
push a button for an action to happen. The AR-system is the ArUco library [3] and almost
no alterations were done to the system for improvement.
By dividing the construction of the 3D-bloodvessels into separated tasks it was easier to
develop and test. Each separate task was tested with debugging and checked before
continuing to the next task, for example using “notification code strings” which were code
bits whose only purpose was to notify the user that the functions worked correctly or not.
By using remote debugging [12] in “Visual Studio”, functions could be tested on the tablet
PC without having to transfer the whole code and packages to the tablet PC. These tests were
repeated several times until functions functioned correctly.
2.3.2 The Marker
The marker provides the positioning of the blood vessels in two ways. The first is the
position of each ultrasound image from the patient. So the distance between each taken
image and the direction can be calculated. The second is the positioning of the 3D-
constructed blood vessels on the patient from the ultrasound probe.
As the ArUco library [3] proved to be a sufficient system to begin with, the only need was to
check if improvements were possible. The focus became to improve the paper printed
marker itself, because they proved to have a higher possibility of improvements, such as
reducing the light reflection [13] and the robustness of the marker itself. The light reflection
on the marker causes the marker to seem distorted or not visible and if the marker becomes
bent or distorted because of its structure the system will not find the marker. Because it does
not have the required square shape or the pattern within the marker.
These two problems were handled by designing a more robust marker and by trying to see
what could give a better result. The marker needed to be robust and have a low light
reflection or to say a low gloss, so using Sketchup [7] a new marker could be designed
fulfilling this task.
2.4 TEST SETUP There were three tests made. The first one was on the image processing, where the test was
to find the optimal available filter for blood vessel segmentation. The second test was to test
the detection of markers in speed and the limit of when markers are detected in angle. The
third test was to test the accuracy of the detected markers.

4
2.4.1 Image Segmentation
To construct an accurate 3D-model of the blood vessels the image segmentation needs to
give accurate contours of the blood vessels from the ultrasound images. The purpose of the
first test was to see which filter from the OpenCV library [2] gave the most accurate contours
of the blood vessels from the ultrasound images. All filters were performed separately and
the filters that were tested are as follows [14]:
Adaptive threshold - A method that calculates the threshold for a small region
of the image. So we get different thresholds for different regions of the same image,
for images with varying illumination.
Threshold(Otsu) - A method that automatically calculates an approximation
threshold value from image histogram for a bimodal image.
Laplace - A method that calculate the Laplacian of the image.
Colour Filtering – Removes colours outside a certain RGB value range.
Median blur – Blurs the image by replacing pixels with the median from
neighbouring pixels.
EqualizeHist – A method that equalize the intensity distribution of an image or flattening the intensity distribution curve.
These filters are used in a simple segmentation program, that loads a specified ultrasound
image and performs selected filter on it, after the filtering is done it saves the image as
an .png image file. Each filter is performed with a trial-and-error for finding the optimal
parameters for optimal result. Meaning the filters are tested several times with different
parameters until the most accurate contours of the blood vessels are achieved from the
authors perspective. The most accurate contours are the contours that follow the edge of the
blood vessels the closest after the trial-and-error.
Segmented images are compared in adaptability for different images, noise and accuracy.
For which looking at which resulted image contain the least noise, most accurate contours
around the targeted blood vessels and can provide similar results for several different
ultrasound images.
2.4.2 Marker Detection
The purpose of the first marker test with the paper printed markers [Fig 1] was to measure
the detection time and ratio of the marker with different conditions. The test was performed
because the lowest detection time is wanted, as it can have a great effect on the frame rate of
the system. The markers were tested with different kinds of positions and angles, but one
marker at the time. Because the AR-library detects one marker at the time. The printed
marker was placed on the marker holder that can move to different angles and positions [Fig
2]. The marker holder is moved in two positions/directions [Fig 3], first to the right in front
of the camera by 25 mm. Then it is moved upwards, as increasing the height of the marker
holder by 20 mm, so to say the X- and Y-direction [Fig 2a]. The marker has the same Z-
position for all tests, because the X- and Y-position were enough at first for the detection
test.

5
(a) (b) (c) (d) (e) (f)
Fig 1 (a-f) Tested Markers: The Marker name is that of bit size, position in dictionary and
size of dictionary. a-b 3 x 3 bit marker with 2 markers in the dictionary, c-d 4 x 4 bit
marker with 2 markers in the dictionary,
e-f Original 4 x 4 bit marker with 50 markers in the dictionary
Fig 2 The Marker Test setup
(a) Markers position movement (b) Side view of the marker holder, Changes of
Markers Angle
Fig 3 Markers are moved in X and Y direction as shown in (a). The marker are tilted to a
certain given angle between 0-60° as shown in (b).
Y-Direction
X-Direction
Rotated around
this axis
Placement of
markers
Tablet PC Marker
holder, for
placement
of marker
Optical board Blocks for elevating the
marker holder
Placed
marker

6
The test program times the detection time by checking the time before and after the
detection function has performed, the time is measured in milliseconds. A green square
around the marker will be visible in the running program if the marker is detected.
The Tablet PC [10] was held up by a simple construction that keeps the tablet PC in the same
vertical positions for each test [Fig 2]. The information obtained is stored in a simple .cvs
document for later interpretation.
2.4.3 Marker Accuracy
The second marker test was done similar to the first marker test but only the 3D-printed
marker Marker3x3_0-2D [Fig 3a,4] was used. This was because of the result of the detection
test [Ch. 4.2] and the test only needs the information of one marker to obtain the accuracy
of a marker.
Fig4 3D-Pinted Marker3x3_0-2D
The accuracy test was the most important test, as it shows how accurate the 3D-constructed
blood vessels can be placed. Because if the accuracy is low the user will probably miss the
targeted vein with the needle, as it will show a faulty position of the 3D-constructed blood
vessels.
The accuracy test was performed as mentioned before similar to the detection test, where
the marker was moved to several positions and data was obtained from each position. But
the selected positions were different than the detection test, where the marker holder was
also moved in the Z-direction [Fig 6b]. The positions of the marker holder were selected
randomly and if a position was undetected it was discarded and a new possible positon was
selected. The purpose of the accuracy test was to determine how accurate the obtained
marker data was similar to the true position data. The marker holder was also tilted to a 45◦
angle for the whole test, for this being a more natural angle when the system would be used
in real life, because the tablet would be held to a similar angle towards the patient when used.

7
(a) (b)
Fig 6a: Figure of the relation between the camera world and image world; Fig 6b: Overview
of the accuracy test setup, marker holder in origin position and the stars are selected position
for the marker holder to be moved to
The measurements obtained were the translation vector and rotation vector of the current
positon of the tested marker, which is computed with Affine transformation [15] to get the
translation between the image coordinate system and camera coordinate system [Fig 6a].
The positions obtained are subtracted with the start-position/origin of the performed test,
which then were compared to the true values [Fig 6b].
2.5 HOW THE SYSTEM WORKS The resulted system is a simple input output system, where the user provides the ultrasounds
images and the system construct the 3D-bloodvessels from the images and position it on the
marker.
2.5.1 Image Segmentation
The image segmentation starts with retrieving the image data taken from the US-machine.
Then the system follows the workflow in Fig 12. The images are segmented and process to
only contain the contours of the obtained images. The obtained contours are then sent to the
next processing step to construct the 3D-bloodvessels.

8
Fig 12 Flow chart of the image processing
2.5.2 3D- Model Construction
The 3D-construction of the blood vessels starts with checking every obtained blood vessels
contours has a separated artery and vein. If a slice is detected with only one contour,
meaning artery and vein has fused together, an estimation is made from nearest slice before
and after the current slice with only one contour. The process then goes according to the
workflow in Fig 13.
Crop the left side of the image to get ROI of Doppler Echo-US image
Use Gaussian Blur on image
Convert from RGB to HSV Color and Color Filter image to only get the Doppler echo part of image
Convert image to Binary 1/0
Load images from source
Send images in to two Separate Crop function
Crop the right side of the image to get ROI of B-mode image
Use Gaussian Blur on image
Use OTSU Threshold on image
Doppler Echo image used to filter noise from B-US image by element-wise multiplication of matrixes.
Use findContour function to get contour of blood vessels Only get contour of certain size.
Erode/Dilate resulted image, finally invert image

9
Fig 13 Flow chart of the 3D-Construction of the Blood vessels
An important step is Ellipse fitting, it is done because the shape of the contours and the
number of position points of the contour [Fig 14]. The shape of the artery is very rough and
misshapen due to the image segmentation. The made ellipses are then adjusted to with same
number of position points for every ellipse, because not every slice has the same number of
position points and this cause deformation when constructed to a 3D-model.
(a)Contour data (b) Ellipse fitted contour data
Fig 14 (a) Contours data on original US images and (b) Ellipse fitted contour data
To give a more realistic surface to the blood vessel skeleton, a skin is generated on the
skeleton [Fig 15]. This is done with the VTK library and a surface is placed between each line
in the 3D-model. After this is done the final preparation is taken for it to be sent back to the
main program of the system.
From given Contours from main program do Ellipse fitting on them
From constructed Ellipses remake them with certain number of points
Make line between each points, between each slice
Use VTK filter to make surface between lines
Give specific color to each blood vessel
Send Resulted 3D-model to main program
Convert each Ellipse from pixel to mm
Alter each Ellipse with given AR data
Store points from each Ellipse

10
(a) Skeleton of Blood vessel (b) Blood vessel with surface
Fig 15 Skeleton structure of Blood vessel and Blood vessel with surface
2.5.3 Interface
The final Interface were not developed by the author but by the Collaborator. The functions
of the interface were developed by the author. The functions that were developed for the
interface was obtaining the images, structure of navigation system and reconstruction of
blood vessels.
The final interface is really simple and is a full window screen with a small extra screen in
the corner [Fig 16], the screen in the corner is the visual data from the ultrasound machine.
The user would start the system and then when the ultrasound shows a good quality of the
blood vessels, the screen is pressed. When the screen is pressed the currently viewed image
of the blood vessels and tablet screen is stored in the system. This process of storing images
is continued for about five images, then the system constructs the 3D-bloodvessels. When
the construction is complete, the blood vessels are shown and the system can give the
position of the blood vessels on the patient.
Fig 16 View of interface for the System after blood vessels are reconstructed

11
3 EXPERIMENTS
This chapter will explain and present how the different tests were performed.
3.1 IMAGE SEGMENTATION The saved files from the segmentation test program was compared to each other and the
original image [Ch. 9.1]. If a clear selection cannot be made after the first set of tests for the
best contour and least noise, the test is performed again on a different ultrasound image with
the optimal filters from the first test. Because to see if the selected filter can give similar
results as the first tried ultrasound image to determine the adaptability of the filter for
different US images.
3.2 MARKER DETECTION EXPERIMENT After the program is started for the marker detection test, the user inputs the angle, distance
from the camera, the X-position (distance from origin in mm, left to right) and Y- Position
(distance from origin in mm, Height) according to the optical table [Fig 2].
When the program is running the user can see if the marker is detected or not, because a
green square is visible around the marker if it is detected. While the program is running the
user press the space bar and the current image is saved, along with the current data. After
the image is saved the program is looped and the user put in the new position of the marker,
that is after the user has moved the marker.
Each test is performed by first changing the angle, then the X-position and finally the Y-
position. The angle is not changed before all X- and Y-positons are tested. The tested range
of the camera view is only a quarter of the full camera range, as the camera would produce
the same result for each quarter of the screen and therefore deemed unnecessary [Fig 17].
Fig 17 Figure of the moved positions of the marker holder viewed in the tablet screen.
0
10
20
30
40
50
60
70
80
0 25 50 75 100
Y-Po
siti
on
/ m
m
X-Position /mm
Position 1
Position 2
Position 3
Position 4
Position 5
View of Tablet

12
3.3 ACCURACY EXPERIMENT The same program as the detection test is used after a simple modification, the user inputs
the position each time the position is changed. After each position test the marker is moved
according to Fig 6b. If a position is undetected a new one is selected instead. When several
positions are selected the program is terminated and the collected data is saved in a .csv file.

13
4 RESULTS
This chapter will go through the results of the tests and how each part of the developed
system works.
4.1 IMAGE PROCESSING From the authors perspective it was viewable that the EqulizeHist and Colour filter had the
most accurate contours with the least amount of noise compared to the other filters used
[Ch. 9.1]. Therefore, it was only them that were tested a second time to determine which of
them were the best. When comparing the filters in the second test it was clear that the Colour
filter was the one that should be selected. Because the EquilzeHist filter did not show the
blood vessels contours at all in the resulted image in the second test in the image table Ch.
9.1.
4.2 MARKER DETECTION The result from the detection test can be viewed in the staple diagram [Fig 18], where the
results show that the time doesn’t differ much between the three types of markers. The
information shown in the staple diagram [Fig 18] is the time it takes for the program to run
the detection function. The fastest group of markers is the 4x4 bit marker with a 2 marker
dictionary. The second fastest is the 3x3 marker group.
Fig 18 Diagram of the Detection time of all the markers
In the second staple diagram [Fig 19] it shows the detection ratio for the markers. The Y-axis
is the number of detected markers and the X-axis is the specified markers. By looking in the
0° and 30° category of the staple diagram all markers were detected in every test, but in the
60° test the 3x3 bit markers shows a much higher detection ratio than the rest.
0123456789
101112131415
0 Angle 30 Angle 60Angle
Det
ecti
on
tim
e/ m
s
Angle of Marker
Detection Speed of markers
Marker3x3_0-2D Marker3x3_1-2D Marker4x4_0-2DMarker4x4_1-2D Marker4x4_0-PD50 Marker4x4_1-PD50

14
Fig 19 Staple diagram of the detection ratio of the markers
4.3 ACCURACY OF MARKER As seen in the staple diagram [Fig 20] (where the Y-axis is the distance of the marker holder
from origin and the X-axis is the current position of the Marker holder) is that the difference
between the true value (GT Move) and measured values are very similar. The difference
between them is at average 1.2 millimetres and they have a standard deviation of 3.3
millimetres. These errors cannot be estimated as exact error values, as there are other factors
that come into the calculation. Such as the ideal values that has been selected contains some
errors, due to human error were the placed marker holder may hold a small difference to the
selected true value.
Fig 20 Staple diagram of the True and Measured Distance between the origin position and
moved position
0
2
4
6
8
10
12
14
16
0 Angle 30 Angle 60Angle
Detection Ratio of markers
Marker3x3_0-2D Marker3x3_1-2D Marker4x4_0-2DMarker4x4_1-2D Marker4x4_0-PD50 Marker4x4_1-PD50
0102030405060708090
100110120130140
1 2 3 4 5 6 7 8 9 10 11 12 13 14 15 16 17 18 19 20 21
Dis
tan
ce f
rom
Ori
gin
/ m
m
Position of marker
Distance from Origin
GT Move Measured Move

15
4.3.1 Marker detection function
The alteration made to the ArUco library was reduction of number of markers in the
database from 50 to 2 and the number of bits in the marker from 4 to 3. To accurately
position the 3D-model, the information retrieved from the marker detection function and
position estimation function was used. By using known measurement and detected markers,
the blood vessels are placed below the US probe. The known measurement is the distance
from the marker on the probe to the tip of the US probe, also the range of the ultrasound
spectre.
4.3.2 The Marker
The resulted 3D-printed marker was more robust and had a lower light reflection than a
regular paper printed marker [Fig 21a]. A calibration station was made for calculate the
distance of the placed marker on the probe to the tip of the probe [Fig 21b]. Where the US
probe with the marker is placed on the calibration station and with known distance from the
centre of the marker on the calibration station to below the probe.
Fig 21 (a) Image of 3D-printed markers and (b) Calibration station

16
5 DISCUSSION
In this chapter the different parts of the developed system will be discussed and if the
obtained results are deemed reasonable.
5.1 IMAGE PROCESSING Ultrasound images are a grey-scaled image and to locate the blood vessels can be quite hard
even with the human eye. Because for example, if the patient is dehydrated the blood vessels
shrink in size, which make them harder to detect. Another example is that a dark spot in the
ultrasound image could be interpreted as a blood vessel. So tell a system to find the blood
vessels is even harder.
There are other ways to visualize blood vessels today such as with Magnetic Resonance
Imaging (MRI) or Computed Tomography CT. MRI or CT are good ways to visualize the
blood vessels and even create 3D structures of blood vessels, they can even show simulations
of blood flow.
In MRI to achieve the blood vessel scan a contrast agent is injected into the patient, this
contrast agent with the human tissue reacts to the radio waves produced by the MRI. This
reaction causes the protons in the human body to absorb the radio waves, then due to the
different magnetic properties of the human tissue it reemits the radio waves at different
times. MRI then detects these different timed waves, which later are used to build the images
of the internal structure of the human body.
The CT takes several “photos” from different angles and then reconstructing a image of the
internal structure of the human body from the taken “photos”. To view the blood vessels a
contrast dye is injected into the patient, which help the computer to differ the blood vessel
from the rest of the human tissues.
But these techniques are expensive and takes time to gather the data and build the
simulation compared to ultrasound and Doppler-functions. Also, there is the need for the
contrast agent to even be able to view the blood vessels.
There is also the use of near-infrared light to view blood vessels, but it cannot show blood
flow. The infrared light system works by light absorption in red blood cells in blood vessels
but bounced back in other tissue. But this system is very expensive compared to the
suggested solution and provide a cheaper solution would be preferred. The cheaper US
solution with Doppler-function is a simpler solution as it a function that many US machines
have.
The selected colour filter with Doppler-echo function in this project is a good way to secure
the blood vessel contours, which was not be possible with the EqualizeHist filter. But
unfortunate the Doppler-function is not an 100% reliable solution.
The diagnostic outcome of the ultrasound Doppler technique is subjective and sufferers from
multiple uncertainties caused by to the position of the probe with respect to the flow
direction, velocity of the blood flow, size of the vessel and amount of blood that are passing.
The later is especially critical for occluded vessel where the turbulent flow pattern might be
observed. For example, if the patient is having the risk of getting a stroke or have blood clots
as they affect the blood flow and blood vessel size. For example, the blood clots can decrease
the possible blood vessel size and cause a turbulent blood flow.

17
When regarding the angle of the probe it needs to be as far from perpendicular to the blood
vessels as possible. Because if it is perpendicular the probe it cannot notice the blood flow
with the Doppler-function and it will not show the blood vessels. This flaw is needed to be
careful of when using Doppler-function, but it is assumed a trained surgeon should be able
to handle this flaw when using it as it will show on the US machine screen when the Doppler-
function is not functioning. The surgeon also needs to handle if blood flow is detected outside
the blood vessels, but the surgeon will view the ultrasound livestream and decide when to
take the images.
The velocity of the blood flow can affect the Doppler function, because if the flow is too low
the Doppler function can not make an reading the blood flow. If the size of the inspected
blood vessels are too small the same affect can happen and the Doppler function can not
read the blood flow, because the size of the flow is too small to make a reading. Also if the
flow is not fluent or laminar and is turbulent the reading can be seemed irregular and not
possible to use for filtering. The turbulence of blood flow can be caused by either large sized
blood vessels or high velocity, such as in branch points or near the heart. So, the velocity,
size and flow needs to be in mind when using the Doppler-function. But these things are
related to the patient’s condition and will affect the results of the images in total. What is
wanted is a calm heart beat with a laminar flow and regular sized blood vessels, enough to
get a clear view of the artery and vein. Which should be achieved when the patient is sedated
during the surgery and have received fluids to keep the patient from dehydration.
The resulted image varies in quality because of the ultrasound images, which is logical.
Because the system is dependent on the quality of the ultrasound image. But the quality is
needed even without the system, because the surgeon needs clear ultrasound images of the
blood vessels to even be able to perform the CVC surgery. So the selected filter shows a great
adaptability and safety for the system to locate the blood vessels, as the Doppler-echo shows
the blood flow and location of the blood vessels. But if the patient’s condition is irregular,
maybe is highly dehydrated or have blood clots. The timing and location of the surgery needs
to be carefully chosen. But this should be in mind today even without the system as it will
affect the surgery in total.
5.2 DETECTION TEST By looking at the diagrams and the obtained data, it shows that the selected 3x3 bit marker
has the highest detection ratio, which is probable due to its simple pattern. When the
markers were printed on regular paper it could affect the result as the reflection of light on
the marker can cause the pattern to be not identified in extreme cases, due to the pattern is
deformed in the camera view because of the light. Also if the marker is in paper form it is
easier to be bent and deformed which can cause the marker detection ratio to decrease. The
presented 3x3 bit marker could go past these detections errors as it shows high detection
robustness.
5.3 ACCURACY TEST Looking at the data it shows that the average error is only 1.2 millimetres, which is
reasonable low. But in certain positions the error seems to be unreasonable high, such as
when the marker holder was moved directly diagonally. But is the error value really that high,
when regarding the human error and the estimated distance. For example, the selected angle
that were performed on the marker holder were selected by eye estimation on the made angle
teller on the marker holder [Fig22]. Meaning that the angle could be around 45°±5° than the

18
exactly inputted 45° angle. Which affects the distance of the marker from origin, because of
the centre-point of the marker is moved when the marker is tilted from the tablet camera
and which could give a slight shift in the true computed position.
The depth perception by using a single camera also affects the resulted position of the
markers, as the Z-direction is computed from the Y-direction. So it is nearly impossible to
get the correct Z-position using only one camera. Also the resolution affects the results of
the accuracy. For example, the accuracy between a pixel and millimetres is higher in a
resolution of 1920x1280 than a resolution of 640x480. Because of the simple reason that
you get a more accurate estimation of how many pixel is a certain distance when going up in
resolution. For example, an 640x480 is an 0.1 millimetres step ruler and a 1920x1280 is and
0.05 millimetres step ruler. When regarding these slight differ in the true values the resulted
average error it can be deemed within reason. To increase the accuracy, the tablet hardware
itself would need to be improved such as an extra camera, the camera resolution and also
get more accurate tools for the experiment for example to be able to get the exact wanted
angle. Therefore, the results are reasonable with used material. For further estimation of the
accuracy of the system more tests are needed with phantom models.
Fig 22 Axis of the Marker holder, Show the intended angle
0◦ 45◦
90◦
Centre of Axis

19
6 CONCLUSION
In this thesis the complication of misplacement in CVC was assessed. This project was
motivated by the large number of complication and performed surgeries of CVC annually.
The task was to develop a simple and cheap method for improving the guidance system for
CVC.
This was done by developing a AR-system that could be used on a tablet PC and uses the
already existing ultrasound machine in hospitals. Which was what made the developed
system original, such as its small computation, simplicity and cheapness, where hospitals
cannot always purchase expensive systems. The developed system works live-stream for
blood vessel visualization, where other blood vessel visualization system such as Magnetic
Resonance Imaging or Computed Tomography need more time and contrast agent for it to
work. Also other available systems for ultrasound guided interventions focus in other areas
or need tools that would limit the number of possible patients, such as with the mentioned
SonixGPS [Ch. B.2.1].
The blood vessels were constructed from several taken ultrasound images with Doppler-echo
effect. The blood vessels were then positioned by using the AR-function of the ArUco library.
The tests carried out shows the accuracy of the system, the improvements of the marker and
ArUco-library when reducing the marker bit size and library size. The real-time handling of
the ultrasound images and positioned blood vessels shows the potential of the system.
Reliable positioning and reconstruction of the blood vessels remains a real challenge and
this problem will be further studied at Maidashi Kyushu University Hospital.
The improvements to be handled is the adaptability of the image segmentation for different
US images and the depth estimation of the viewed 2D image. Current resulted system can
be seen in Fig 23 which is a screenshot from the tablet when using the system. As there are
possible improvements to be made the system has not yet reached its full potential.
Therefore, it is of interest to see what the system becomes when it reaches its full potential.
Because this system could offer a reduction in the current CVC complication.
Fig 23 Screenshot from Tablet PC when system in use. The black square is the representation
of the ultrasound area. The red and blue tube is the representation of the blood vessels.

20
7 FUTURE WORK
For further development of the system phantom tests for validation of the system is the first
step to be taken. Further improvements of the accuracy and adaptability could be performed
depending on the result from the phantom tests. Another possible work is the segmentation,
because not a lot of hospitals has the Doppler-effect system in their ultrasound machine. For
example, improving the second best filter that was found in the testing of the image
segmentation or implementing a free-hand drawing function, for the user to draw the
contours around the blood vessels.
Simple improvements would be removing redundant code that can be made better and more
efficient. For example, making possible function into parallel functions, for increased speed.
Finally, would to increase the system function if wanted or needed, for example be able to
confirm the made contours and adjust them for better accuracy. Also including pulse
Doppler, which tells if the viewed blood vessels is really blood vessels by showing the pulse.
For example, the artery has a steady pulse but the vein doesn’t, this is also a way to tell them
apart from each other.

21
8 REFERENCES
[1] Will Schroeder, Ken Martin, Bill Lorensen, “The Visualization Toolkit, An Object-Oriented Approach To 3D
Graphics”, (4th ed. )Kitware, 2006, ISBN 1-930934-19-X
[2] OpenCV 2.4.13.1 Documentation - API Reference, OpenCV Developer Team (2011)
[3] S. Garrido-Jurado; R. Mu~noz-Salinas; F.J Madrid-Cuevas; M.J. Marn-Jimenez, “Automatic generation and
detection of highly reliable ducial markers under occlusion”, Pattern Recognition. 47(6): 2280-2292,2014
[4] K. Martin, B. Hoffman, “Mastering CMake” , (5th ed. )Kitware, Inc. (2010)
[5] ITK, Insight Segmentation and Registration Toolkit, [Online] URL: https://itk.org/
[Last visited: 2016-08-17]
[6] Kitware, Company, [Online] URL: http://www.kitware.com/
[Last visited: 2016-08-17]
[7] Sandeep Singh, “Beginning Google SketchUp for 3D Printing”, 2010, Ch. 1,
ISBN : 978-1-4302-3361-9
[8] Trimble, Company, [Online] URL: http://www.trimble.com/
[Last visited: 2016-08-17]
[9] @Last Software, No longer existing company [Online] URL: https://www.crunchbase.com/organization/last-
software#/entity
[Last visited: 2016-08-17]
[10] Tablet PC, Dell Venue 8 Pro 5855, [Online] URL: http://www.tabletpcreview.com/tabletreview/dell-venue-
8-pro-5855-review/
[Last visited: 2016-08-17]
[11] Timothy A Budd, “An Introduction to Object-Oriented Programming”, Third Ed., Addison Wesley Longman,
ISBN 0-201-76031-2, 2002
[12] Microsoft Visual Studio, Remote Debugging, [Online] URL: https://msdn.microsoft.com/en-
us/library/y7f5zaaa.aspx
[Last visited: 2016-08-17]
[13] X-rite, “The Color Guide and Glossary”, 2004
[14] OpenCV documentation, Image Processing [Online] URL:
http://docs.opencv.org/2.4/modules/imgproc/doc/imgproc.html
[Last visited: 2016-08-17]
[15] Owen Byer; Felix Lazebnik; Deirdre L. Smeltzer,” Methods for Euclidean Geometry”, ISBN: 978-0-88385-
763-2, 2010, Ch. 12

22
Appendix A. TEST DATA
A.1 FILTER RESULTS
Image result after processing the image. Input values are searched for with Trial-and-Error
for optimal result.
Type of Filter
Before Image After Image
Adaptive
Threshold
Threshhold (Otsu)
Laplace
Colour Filter
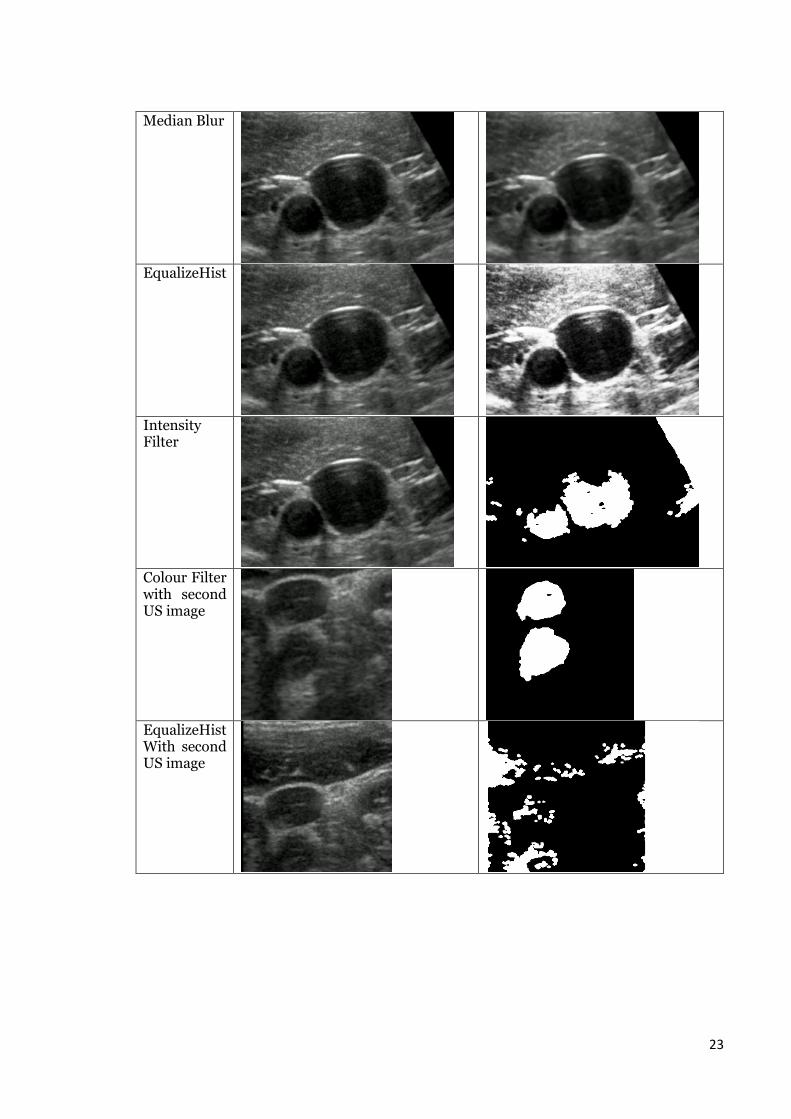
23
Median Blur
EqualizeHist
Intensity Filter
Colour Filter with second US image
EqualizeHist With second US image

24
A.2 RESULTED DETECTION TEST DATA
Marker
Detection Avr time (ms)
Detection Avr mean (ms)
Angle (°) Distance from camera (mm)
Detected Miss
3x3-0-D2 12.8 13.5 0 235 25 6 3x3-0-D2 12.8 13.4 30 235 25 6 3x3-0-D2 13.3 13.5 60 235 14 17 3x3-1-D2 13.3 13.6 0 235 25 6 3x3-1-D2 13.3 13.7 30 235 25 6 3x3-1-D2 13.7 13.6 60 235 19 12 4x4-0-D2 12.1 12.6 0 235 25 6 4x4-0-D2 12.5 12.7 30 235 25 6 4x4-0-D2 12.8 13.3 60 235 5 27 4x4-1-D2 12.1 12.3 0 235 25 6 4x4-1-D2 11.8 11.9 30 235 25 6 4x4-1-D2 11.7 12.5 60 235 13 18 4x4-0-PD50 12.4 13.2 0 235 25 6 4x4-0-PD50 12.8 13.2 30 235 25 6 4x4-0-PD50 15.4 13.3 60 235 2 29 4x4-1-PD50 12.0 12.4 0 235 25 6 4x4-1-PD50 11.8 12.1 30 235 25 6 4x4-1-PD50 12.1 12.5 60 235 14 16
A.2.1 AVERAGE DATA OF THE MARKER GROUPS/ DETECTION TIME AND DETECTION RATIO
Marker Detection time (ms) Mean Detection time (ms) Detected (%) 3x3_D2 13.2 13.5 71 4x4_D2 12.2 12.5 63 4x4_PD50 12.8 12.8 62
A.2.2 AVERAGE DATA OF THE MARKER GROUPS PER ANGLE/DETECTION RATIO
Marker Detected at 0° (%) Detected at 30° (%) Detected at 60° (%) 3x3_D2 80 80 53 4x4_D2 80 80 29 4x4_PD50 80 80 26
A.3 ACCURACY TEST RESULTED DATA:
A.3.1 TRUE MOVEMENT AND MEASURED MOVEMENT
Position Position X/mm
Position Y/mm
Position Z/mm
M Position X/mm
M Position Y/mm M Position Z/mm
1 0 0 0 0.245693 -13.0962 246.473 2 75 0 0 76.0207 -12.8499 241.35 3 125 0 0 124.147 -12.6106 234.663 4 100 0 25 100.443 -12.8532 214.184

25
5 75 0 75 74.4384 -13.0564 164.168 6 25 0 125 24.1047 -14.0711 121.174 7 0 0 75 -1.75987 -13.6117 172.377 8 0 20 0 0.34532 -33.4683 243.916 9 75 20 0 76.6218 -33.3932 242.287 10 125 20 0 124.071 -32.5164 232.79 11 100 20 25 99.7951 -33.0218 211.431 12 75 20 75 74.5881 -33.5064 163.981 13 25 20 125 24.0791 -34.8777 117.753 14 0 20 75 -1.20708 -35.1059 173.222 15 0 40 0 0.354737 -54.1045 243.622 16 75 40 0 77.0062 -54.2577 243.063 17 125 40 0 123.349 -52.0386 229.748 18 100 40 25 100.72 -53.4575 212.421 19 0 40 50 -0.466879 -54.735 195.631 20 0 20 100 -1.82485 -35.5062 148.048 21 0 20 100 -2.27678 -34.7904 144.616
A.3.2 TRUE ANGLE AND MEASURED ANGLE/ TRUE DISTANCE AND MEASURED DISTANCE
Position Select Angle/°
M. Angle/° Angle Diff/° GT Move/mm M. Move/mm Diff Move/mm
1 135 133.095 -1.905 0 0 0 2 135 132.1791 -2.82094 75 75.94838694 -0.94838694 3 135 131.6924 -3.30765 125 124.4638332 0.536166765 4 135 132.6028 -2.39715 103.0776406 105.2717384 -2.19409773 5 135 132.5057 -2.4943 106.0660172 110.809171 -4.74315384 6 135 132.1927 -2.80725 127.4754878 127.554075 -0.07858715 7 135 131.7329 -3.26709 75 74.12492994 0.875070056 8 135 132.6017 -2.39828 20 20.53218529 -0.53218529 9 135 132.7217 -2.27829 77.62087348 79.13785773 -1.51698424 10 135 131.9 -3.1 126.589889 126.0836044 0.506284563 11 135 132.2148 -2.78525 105 107.4013768 -2.40137678 12 135 132.4491 -2.55088 107.9351657 112.9083691 -4.97320335 13 135 132.6749 -2.32514 129.034879 132.7075862 -3.67270718 14 135 132.274 -2.72602 77.62087348 76.49997676 1.12089672 15 135 132.8814 -2.11857 40 41.1074295 -1.1074295 16 135 132.8906 -2.10943 85 87.16692387 -2.16692387 17 135 131.8461 -3.15393 131.2440475 130.1947016 1.049345837 18 135 132.6958 -2.30422 110.5667219 113.5062096 -2.93948762 19 135 132.8691 -2.13095 64.03124237 65.72066941 -1.68942704 20 135 130.7291 -4.27092 101.9803903 100.9652211 1.015169164 21 135 131.5753 -3.42471 101.9803903 104.1722114 -2.19182115

26
Appendix B. STATE OF THE ART
B.1 FOCUS OF THESIS
The main focus of this project is to develop an Augmented Reality system for Central Venous Catheterization (CVC) needle insertion using real-time 3D volume reconstruction, that can be performed by a conventional ultrasound (US) probe scanned by free-hand. This is to increase efficiency and decrease mechanical complications of CVC placement that currently exist. The system will assist the surgeon with fully visual blood vessels of targeted area on the patient, that will visible through a PC tablet. Thus the need to guess and imagine where bloods vessels are should decrease, when the surgeons previously only could see a 2D image of the blood vessels. As shown in Fig. 1 this system will use Echography with Doppler-Echo function to obtain needed information to reconstruct the 3D US image of targeted Blood vessel. Then with the combination of the AR marker on the patient and the probe system will accurately compute the location of where the reconstructed blood vessels will be placed. Thus the proposed system will contribute to the healthcare society, not because its technical novelty but with its clinical needs.
Fig: 1 Overview of the proposed system
27
B.2 CENTRAL VENOUS CATHETERIZATION AND CURRENT TECHNOLOGY
B.2.1 HISTORY OF CENTRAL VENOUS CATHETERIZATION
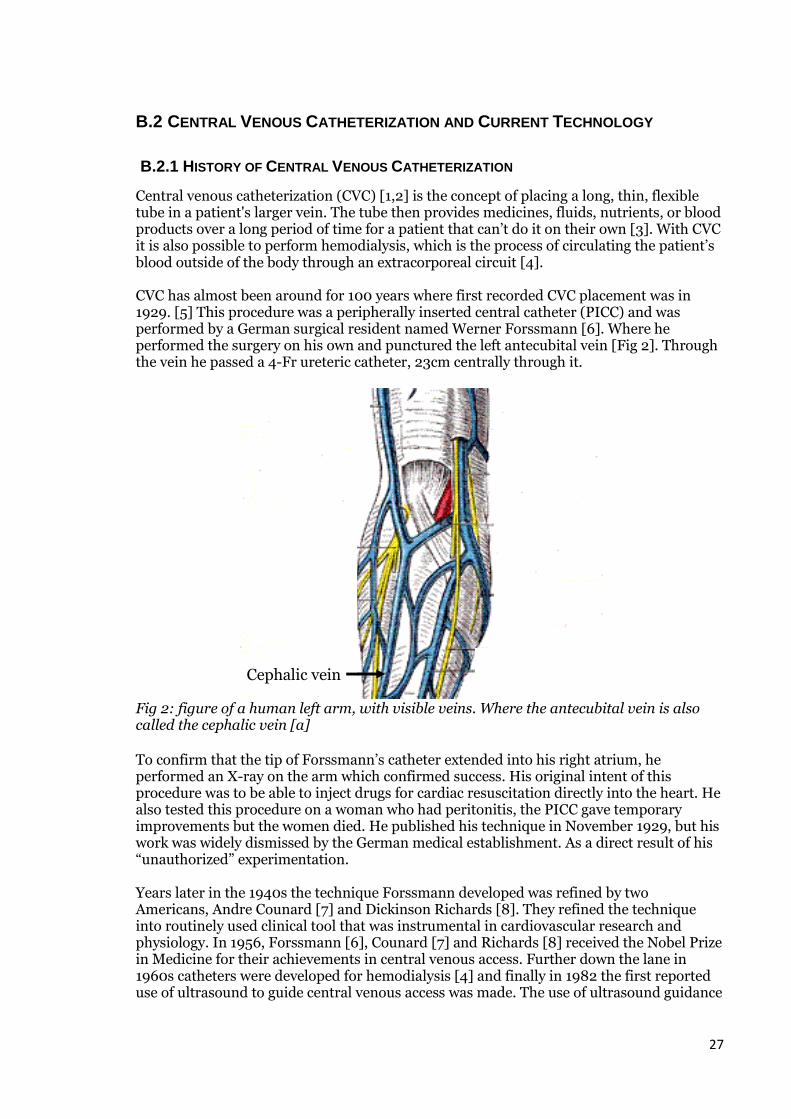
Central venous catheterization (CVC) [1,2] is the concept of placing a long, thin, flexible tube in a patient's larger vein. The tube then provides medicines, fluids, nutrients, or blood products over a long period of time for a patient that can’t do it on their own [3]. With CVC it is also possible to perform hemodialysis, which is the process of circulating the patient’s blood outside of the body through an extracorporeal circuit [4]. CVC has almost been around for 100 years where first recorded CVC placement was in 1929. [5] This procedure was a peripherally inserted central catheter (PICC) and was performed by a German surgical resident named Werner Forssmann [6]. Where he performed the surgery on his own and punctured the left antecubital vein [Fig 2]. Through the vein he passed a 4-Fr ureteric catheter, 23cm centrally through it.
Fig 2: figure of a human left arm, with visible veins. Where the antecubital vein is also called the cephalic vein [a] To confirm that the tip of Forssmann’s catheter extended into his right atrium, he performed an X-ray on the arm which confirmed success. His original intent of this procedure was to be able to inject drugs for cardiac resuscitation directly into the heart. He also tested this procedure on a woman who had peritonitis, the PICC gave temporary improvements but the women died. He published his technique in November 1929, but his work was widely dismissed by the German medical establishment. As a direct result of his “unauthorized” experimentation. Years later in the 1940s the technique Forssmann developed was refined by two Americans, Andre Counard [7] and Dickinson Richards [8]. They refined the technique into routinely used clinical tool that was instrumental in cardiovascular research and physiology. In 1956, Forssmann [6], Counard [7] and Richards [8] received the Nobel Prize in Medicine for their achievements in central venous access. Further down the lane in 1960s catheters were developed for hemodialysis [4] and finally in 1982 the first reported use of ultrasound to guide central venous access was made. The use of ultrasound guidance
Cephalic vein

28
where presented in a journal titled “Doppler ultrasound technique for safer percutaneous catheterization of the infraclavicular subclavian vein” [9]. The help of ultrasound guidance could prove a big change for the CVC surgery. Because until the late 1980s to the early 1990s CVC had been done with basing on anatomic landmarks to place the catheter [Fig 3]. Which carry great risk of needle misplacement.
Fig 3: View of anatomic landmarks (such as collar bone and sternum) and blood vessels [b] The usage of CVC has continued to grow and in 2011 it was reported that in USA almost 15 million central venous access cases were performed annually, including central venous lines, dialysis catheters, peripherally inserted central catheters, and ports [5]. Also Image guidance for CVC have continued to evolve to find better ways to increase patient safety and decrease complications from or during surgery. Where one example is the use of needle guidance with Ultrasound [10, Fig 5], but this still only works with patients without pacemakers, due to the instruments used for finding the needle. So there still exist room and need to improve CVC for reducing complication that arise and increase patient’s safety, further details in related work.
Fig 5: View of the SonixGPS setup and the resulted ultrasound view with detected needle [c]

29
B.2.2 USES OF CENTRAL VENOUS CATHETERIZATION
CVC is used widely for different needs, such as medicine or nutrients. It serves to give long term medicine treatment for pain, infection, or cancer [3]. Compered to others like intravenous catheter (IV) [Fig 6], which gives medicines into a vein near the skin surface and can only stay in for a short time. Another uses of CVC is to give medicine that affects the heart, especially if a quick response to the medicine is wanted. CVC give the possibility to give large amounts of blood or fluid quickly, it can also provide if needed to take frequent blood samples without having to “stick” someone with a needle every time when sample is needed [2]. Finally, with CVC it is possible to provide kidney dialysis if the patient suffers from kidney failure [3]. As a further notice CVC isn’t only performed on adults it is also used in the paediatric sections of hospitals.
Fig 6: Placed Intravenous catheter on patient[d]
B.2.3 EQUIPMENT
The equipment that is used CVC surgery is quite few. What many institutions uses is stocked pre-packaged catheter-insertion kits containing the necessary equipment. The catheter-insertion kit would contain such as [11, Fig 8]:
Fig 8: Example of a CVC kit. (a) Introducer needle. (b) “J” spring steel guide wire. (c) Vessel dilator. (d) Polyurethane catheter. (e) Male adapter plugs. (f) Extra suture wings. [e]
(a)
(b)
(c)
(d) (e)
(f)

30
When selecting the catheter [Fig 8(d)] it should have the appropriate lumen size to deliver the required medications, and its length should be appropriate to reach the junction of the vena cava and the right atrium. Approximate length can be measured against the patient’s external anatomical landmarks. Seven-French 20-cm catheters are the most commonly used. Dialysis or rapid fluid resuscitation requires larger-bore catheters. Each additional lumen decreases the size of the individual lumens, which will decrease the maximal rate at which fluids can be administered. The catheter should be flushed, and compatibility between the guide wire [Fig 8(b)] and the needle [Fig 8(a)]] should be confirmed before proceeding with the procedure [2]. If guidance systems are used such as ultrasound, more commonly ultrasound machine like OB/GYN (OB is obstetrics or for an obstetrician, GYN is short for gynaecology or for a gynaecologist) ultrasound machine can be used and a similar or the same exist almost in every internal diagnostic equipped hospital.
B.2.3.1 ULTRASOUND GUIDANCE
As mentioned in chapter 2.1 the ultrasound guidance for CVC was first reported in 1982[9] and has continued being used since then. Ultrasound is the use of acoustic energy in the form of mechanical pressure waves having a frequency above the audible range of 20,000 Hz. The mechanical pressure waves can be thought as sinus waves with a steady amplitude and frequency, where it propagates through a medium denser than air [12]. In Ultrasound Imaging the mechanical pressure waves are created from something called ultrasound transducer, which uses a crystal called piezoelectric crystal. The crystal is able to convert electric signals to high pressure sound waves and the crystal can also convert the received sound waves to electrical signals. The crystals are organized in 128 parallel channels which can emit the mechanical waves at equal frequency [13]. As the body contains different kinds of density such as bones, blood vessels, skin and muscle tissue, the produced pressure waves are affected by attenuation. Where higher density causes larger attenuation and by reading the echo from these different kinds of attenuation the internal body can be viewed without surgical aids. Ultrasounds guidance is used for different areas in the medical science, such as to see a unborn baby in a pregnant lady or to see a certain organ in a patient such as the heart. Also the positive part of US imaging is that it presents the taken images live-stream. So the doctors get a direct visualization of what the doctor is targeting with a US probe.
The Ultrasound Guidance systems has just as CVC developed and found functions that could be implemented into US imaging. One of these implemented functions is the Doppler-Echo function [13, Fig 9], The Doppler effect was discovered by Christian Doppler [14] in the 19th mid-century. Doppler effect is a function that takes the advantage of a moving area, the velocity and the frequency shift in the reflected ultrasound wave. Which make it able to identify the direction and velocity of blood flow of a targeted area, with this function visualization of the blood flow is possible. The function is written according to
equation (1) and ∆𝑓𝑑 is the frequency alteration between the Doppler-shift. V is the blood flow velocity, C is the sound propagation velocity, 𝑓0 is the transmitting frequency and finally ∝ is the Doppler irradiation angle [13].
∆𝑓𝑑 = 2 ∙𝑉
𝐶∙ 𝑓0𝑐𝑜𝑠 ∝ (1)
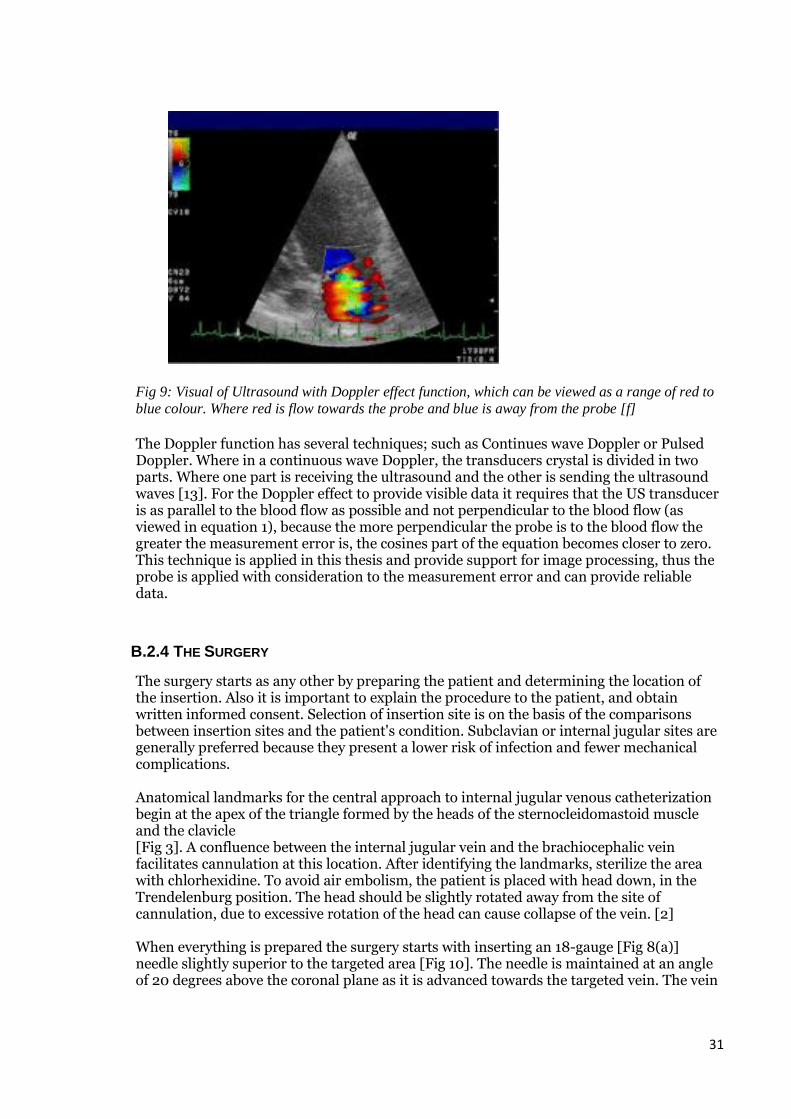
31
Fig 9: Visual of Ultrasound with Doppler effect function, which can be viewed as a range of red to
blue colour. Where red is flow towards the probe and blue is away from the probe [f] The Doppler function has several techniques; such as Continues wave Doppler or Pulsed Doppler. Where in a continuous wave Doppler, the transducers crystal is divided in two parts. Where one part is receiving the ultrasound and the other is sending the ultrasound waves [13]. For the Doppler effect to provide visible data it requires that the US transducer is as parallel to the blood flow as possible and not perpendicular to the blood flow (as viewed in equation 1), because the more perpendicular the probe is to the blood flow the greater the measurement error is, the cosines part of the equation becomes closer to zero. This technique is applied in this thesis and provide support for image processing, thus the probe is applied with consideration to the measurement error and can provide reliable data.
B.2.4 THE SURGERY
The surgery starts as any other by preparing the patient and determining the location of the insertion. Also it is important to explain the procedure to the patient, and obtain written informed consent. Selection of insertion site is on the basis of the comparisons between insertion sites and the patient's condition. Subclavian or internal jugular sites are generally preferred because they present a lower risk of infection and fewer mechanical complications. Anatomical landmarks for the central approach to internal jugular venous catheterization begin at the apex of the triangle formed by the heads of the sternocleidomastoid muscle and the clavicle [Fig 3]. A confluence between the internal jugular vein and the brachiocephalic vein facilitates cannulation at this location. After identifying the landmarks, sterilize the area with chlorhexidine. To avoid air embolism, the patient is placed with head down, in the Trendelenburg position. The head should be slightly rotated away from the site of cannulation, due to excessive rotation of the head can cause collapse of the vein. [2] When everything is prepared the surgery starts with inserting an 18-gauge [Fig 8(a)] needle slightly superior to the targeted area [Fig 10]. The needle is maintained at an angle of 20 degrees above the coronal plane as it is advanced towards the targeted vein. The vein

32
is generally encountered approximately 13 mm under the skin, though this can vary, depending on regional adiposity.
Fig 10: Insertion of Needle [g] After venous access is obtained, the syringe is very carefully disconnected from the needle. The J-shaped end of the guide wire [Fig 8(b)] is introduced into the needle and advanced. During the insertion of the wire cardiac rhythm changes can appear, if this would occur the wire is pulled back until rhythm normalizes. Then the needle is removed, leaving the wire in place. With carefully maintaining control of the wire, a 1-to-2-mm incision at the site of skin puncture is made. Next the dilator [Fig 8(c)] is advanced over the guide wire. Once the tract is dilated, the dilator is removed and the catheter is threaded over the wire and into the vessel. Finally, the guidewire is removed and blood return is confirmed. When procedure is done a sterile dressing is applied and an X-ray image is taken to confirm the catheter placement is correct [2].
B.2.5 COMPLICATION WITH CENTRAL VENOUS CATHETERIZATION
Even with the use of different kinds of navigation for finding the targeted vein of a patient, there still occurs complications during and after CVC placement. The complications can be divided in three categories; Mechanical, Deep vein thrombosis and Bloodstream infections [15]. Mechanical complications include arterial puncture, hematoma, pneumothorax, hemothorax, arrhythmia, and improper location of the catheter, whether in an accessory vein or in the other vessels of the upper vascular system. Insertion of a catheter into the femoral vein has the highest risk of mechanical complications, but the rates of serious mechanical complications for femoral and subclavian insertion are similar. If an artery is punctured, further attempts at that site should be abandoned, and access to an alternative site should be attempted. Internal jugular and subclavian cannulation sites are preferred because of their lower overall rate of mechanical complications. However, these sites carry a small risk of hemothorax and pneumothorax. Ultrasound guidance for internal jugular cannulation significantly reduces the number of attempts required and the risk of complications [2].

33
Deep vein thrombosis occurs when a blood clot (thrombus) forms in one or more of the deep veins in your body, usually in your legs. Deep vein thrombosis can cause leg pain or swelling, but may occur without any symptoms. The thrombus can also break lose and travel through your bloodstream and lodge itself in your lungs or even heart, where it can cause pulmonary embolism. Deep vein thrombosis can also happen if you don't move for a long time, such as after surgery, following an accident, or when you are confined to a hospital or nursing home bed. This also can occur due to the punctured vein from the CVC placement [15]. Infections in the area of CVC where the more common one is bloodstream infections, which refers to the recovery of an infectious microorganism that can cause disease in the blood culture by virtue of infection, not the subject of contamination [16]. In this thesis the focus will lie on the mechanical complications of CVC and how to decrease the problem such as misplacement. With the use of Ultrasound guidance systems the complications have decreased, where other systems such as Computed Tomography (CT) and Magnetic Resonance Imaging (MRI) would not be useful due to the time and cost. CVC is performed frequently in clinical practices such as in OR and ER, this makes Ultrasound navigation optimal with its fast imaging system. But still it requires great skill to perform an CVC operation. This is because a 2D US image will only supply an image slice of the blood vessels [Fig 11].
Fig 11: 2D slice of blood vessels, (V)Vein and (A) Artery [h] A 2D image will not show the surrounding area of the targeted blood vessels and therefore have a risk for misplacement. It has been noted that approximately 15% of patients suffer from complication from the CVC surgery [1,17] and the complication can be fatal [18]. This is where and 3D-model reconstruction comes in place, to decrease the difficulty of the CVC operation. There have been made other solutions made for this problem in needle placement during CVC surgery, which is continued in related work. Further notice in a more recent study in 2015 where they performed CVC placement in around 2500 patients, they found that around 1.4% [15] of these people suffered from mechanical complications. So if this is applied to the amount which was noted the medical journal “Ultrasound-Guided Procedures in Emergency Medicine” [19] where around 5 million CVC placements were done in just USA annually in the year 2011. This gives a rough idea for how many suffer mechanical complications annually. The total reaches about 70 thousand individuals that suffers from mechanical complications annually, this is just in the USA and if the rest of the world is included the numbers would increase significantly. So the desire to decrease this number of complications is very desirable. It should be noted that the selected location of insertion can increase or decrease the risk that comes with the surgery. Where the number of 1.4% was calculated when they randomly selected the location of insertion [15]. For example, Internal jugular and subclavian cannulation have a lower risk than femoral veins. So this proves that the need for improving CVC procedures and decrease mechanical

34
complications exist. Then because every hospital doesn’t have the capability to purchase an advanced and expensive system, a cheap and simple system is a really profitable solution, which this thesis is intended to be.
B.2.5.1 NAVIGATION FOR CENTRAL VENOUS CATHETERIZATION
As mentioned before Ultrasound Guidance is one of the used tools for CVC as for
navigation during the surgery. But there is other navigation system that can provide
visualization of the blood vessels. For example, regular fluoroscopy, CT and MRI. But as
the fluoroscopy, MRI and CT can give detailed images, it comes with some complications.
As fluoroscopy and CT is the same use of X-ray imaging, but the way of taking and
handling the X-ray images differ between them. For example, fluoroscopy is live-stream of
a section of a body part with X-ray imaging. But CT is several taken X-ray images around
the patient which provides a slice image of the patient. But if there is an over use of X-ray
imaging it will cause tissue damage to the patient due to radiation. Also for to get the
contour of the blood vessels, the doctor needs to inject a contrast agent to make it possible
to visualize the blood vessels.
Unfortunately the MRI can only be used pre-surgery. Because the MRI machine uses
magnetic force which will attract the used tools during the CVC surgery, also it takes too
much time to get needed images. The MRI can give an 3D model of the blood vessels but
those images can’t be used as a guide as due to the patient movement and positioning,
where the blood vessels can shift enough mm to cause misplacement if used. Also it takes a
lot of time to provide those images. So it is not possible to give them live-stream. The 3D
imaging is also possible with CT but with the same reason it can’t be used as a guide when
placing the CVC needle.
This is where ultrasound come in, as the doctors don’t need to inject a contrast agent for
ultrasound, only put a gel on the skin for better contact between the skin and US probe.
The ultrasound doesn’t expose the patients to radiation as fluoroscopy and CT does, nor
the magnetic force as MRI. Ultrasound only bigger fault compared to fluoroscopy, CT and
MRI is the lower spatial resolution of the images, (spatial resolution is how detailed the
images are as in number of pixels).
Where we as today ultrasound can’t give as high spatial resolution images as CT and MRI
can. But of the four it is the safest, where it can be used the longest without injuring the
patient. Also it has a higher temporal resolution compared to CT and MRI, where it can
give live-stream images. Ultrasound can also provide 3D-images, but the technology for it
to give 3D-models of the blood vessels has yet to come. The 3D ultrasound is mostly used
on pregnant women for the to get a glimpse of their unborn child. So for CVC surgery the
best option is still the ultrasound, but there still room for improvements. As mentioned in
the section 2.5, there still exist a lot of complication for CVC and improving the surgery can
improve a lot for the patients’ health that needs the CVC surgery.

35
B.3 AUGMENTED REALITY - THE TECHNOLOGY
Gives a brief explanation of Augmented Reality(AR) is and its history.
B.3.1 WHAT IS AUGMENTED REALITY
According to “Augmented Reality; An Emerging Technologies Guide to AR” [20] the
definition of AR is a variation of Virtual Environment(VE) or Virtual Reality(VR). Where
Augmented Reality takes the digital or computer generated information, whether it be
images, audio, video, and touch or haptic sensations and overlaying them over in a real-
time environment. AR can in simplicity take digital objects and show them in the real
world using a hardware medium, such as a smartphone or tablet. Another definition of the
AR is defined in Lester Madden’s [21] book, there he defines AR to five parts. These are
[22, page 4]:
1. Combines reality with computer graphics
2. Provides interaction with objects in real-time
3. Tracks objects in real-time
4. Provides recognition of images or objects
5. Provides real-time context or data
What can be noticed of these five parts that they mostly focus on the real-time functions.
Where something to be defined as AR it has to interact with the reality and digital world in
real-time, else it could be just pasted on the screen without any interaction with the user or
current visible environment in the used medium. Also as AR tracks objects in the real
world in has to be in real-time, because of the environment changes when the medium is
moved or the tracked object is. For example, when an objects is tracked through a AR
software and the objects is moved. The AR software needs to adjust the current coordinates
of the digital objects so it can be placed on the tracked object again, this is to give reality of
the augmented digital object.
B.3.2 HISTORY OF AUGMENTED REALITY
Augmented Reality as it is today have a shared past with the other reality systems such as
VR and VE, as it is an variation of them. To look in to the Past of AR we need to go back
more than 50 years, where it all started. In the beginning the first version of so called AR
today was Invented by a man called Morton Heilig [23], where he put a patent about
simulating sound and images, called “The Sensorama Simulator” [24, Fig12]. The
Sensorama simulator used a booth with a hood where image, sound, vibration, wind and
smell could be simulated. This machine could so to say distort reality, how the machine
looked can be viewed in Fig12 and this was the first step towards AR.

36
Fig 12: A poster of the Sensorama machine in 1962. [i]
A few years after this sensation of invention towards AR, the next step were taken and a new minimalist solution was created which had focus on augmenting image only. This was the Head-Mounted-Display(HMD) [25] where today we can see it in VR gaming in different kinds of gaming consoles. For example, Occolus Rift [26]. It should be noted that the display of the HMD can either be a simple one/double display or a see-through/transparent display. The HMD Ivan Sutherland [27] invented had a see through display where on the display it could augment images on it. The see through display didn’t stop being developed after Ivan Sutherlands[ibid] HMD, it can for example be seen in the new Microsoft’s HMD that is called “Hololens” [28]. The first handheld AR device came in 1993 and was called “Chameleon” [29]. The Chameleon system took regard of the position of its display and showed images accordingly, it was like a virtual magnifying glass. Further down the road as where we are today the AR systems have gone from a physical medium to a software application on different kinds of hardware systems, for example tablets or smartphones. The first tool for AR development where the ARToolKIT [30], where you can develop your own software solution for AR, which uses pattern recognition and is one of the techniques for AR systems. Several other developing tools for AR have been made, one of those is the ARUCO library [31] and is the library that is used for this thesis. As mentioned the pattern recognition is a technique used in the AR system and is used to track objects in the real world for placing digital information or objects. It exists several techniques such as reference pattern [32, Fig 13a] and Natural qualities [33, Fig 13b]. Reference pattern as viewed in [Fig 13a] is a special pattern in black and white where the certain pattern is a ID so the system can recognise the pattern and place a digital object on it, which object is decided by the patterns ID. The natural quality system is the function of finding certain pattern in certain objects, for example the human face or statues. But this system requires high definition images for it to work properly, as the natural qualities can be harder to distinguish when the images have a poorer quality.

37
(a) (b) Fig 13: Possible patterns, (a) is a simple reference pattern using number of black or white coloured cells [j]. (b) is an example of natural quality pattern on Statue of Liberty [k].
B.3.3 USES OF AUGMENTED REALITY
AR can be used in several ways and also in several fields. Such as in the entertainment
industry and the medical field. Where we can see it in today’s very popular game “Pokémon
GO” [34], where the user can use the games AR to see Pokémon’s in the real world. In the
medical field AR has been researched to be used as a visual aid during surgery or training
tool for new surgeons, more detailed example can be viewed in chapter 4. So the possibility
of AR is great and can provide so much with the help of the current technologies, for
example could a smartphone user look at a poster with a AR-application and a trailer of a
certain movie is shown directly inside the poster. Or a person in the poster could start to
move and promote a certain event. It is even possible to provide more visible information,
such as where and when a certain event is or a certain discounts currently active at a store.
This could make a posters life last longer and the need for continuously new poster would
decrease, therefore save some trees in the process. So AR has great possibilities and one of
those possibilities is researched in this thesis.
B.3.4 THE ARUCO LIBRARY
The used system library in this Thesis is called ARUCO library and was developed by S. Garrido-Jurado, , R. Muñoz-Salinas , F.J. Madrid-Cuevas and M.J. Marín-Jiménez [31]. What they developed is a high robust and quick system. This system can be divided in two parts, first is the detection of the marker and the second is the identification of the marker. The detection works by filtering each frame image from a web-camera. By first turning the image to grey-scale then using an adaptive threshold. After that they use a contour extraction for finding and detecting the square markers. After the contour extraction they perform a polygonal approximation so they are only left with the square markers. When they have the wanted square markers they use the collected information to identify each marker. They identify each marker with perspective projection and thresholding, so they are left with a black and white image. Where the image is divided according to the bit size of the marker. Then they check the resulting matrix of black and white squares with the database. The ARUCO library also control if the marker is rotated in any way. So the ARUCO library can detect the marker in any direction. [ibid] Which also give much more movement to the marker and its system. They ARUCO Library can also contain a large

38
number of unique markers, but increased marker will decrease the speed of the system for handling and identifying the markers [Fig 14].
Fig 14: Detection and Identification of markers, (a) is the Original Camera viewed image. (b) is the result of applying local thresholding. (c) is after applied contour detection. (d) is after shape approximation and removal of irrelevant contours. (e) is an example of marker after perspective transformation. (f) is the result after converting black and white to bit numbers for each cell [31]

39
B.4 RELATED WORK
AR have been implemented in different areas but the focus here will be in the medical field. Where AR has been used in the medical field for such as in surgeries or medical training. Where the application in surgery is to provide information or visual aid to the surgeon during surgery. One of these application have been made in laparoscopic surgery where they used AR to aid a surgeon in the removal of a tumor. [35, Fig 15]
Fig 15: Visualization and use of AR in surgery- Visualizations for (a) directing the surgeon to the tumour, (b) showing the resection margin and (c) the resection line and (d) displaying vital structures currently at risk [35]. The application used, shows only information of interest, such as where blood vessels and the tumor are. The 3D constructed image were made beforehand with taken MRI scans. But the limit with this technique is that the bodies organ shifts and moves during surgery, due to different reasons, one simply because of the bodies movement. So the prepared image isn't always correct or the positions isn't correct due to movement or shifts, When the images were taken before hand with for example MRI or CT scans. In medical simulation with AR for new surgeons/ doctors, it can be really helpful for them to get a clear image how to handle live surgery and not handle a living person before the students is fully trained. This can cause great improvement and decrease errors due to low experience of surgery. Studies regarding the CVC and AR have been studied for simulation training [36,37]. Where they use AR to simulate the surgery and give more real life experience for new doctors/surgeons, where they combine a plastic model with AR which gave positive results. This thesis focus on using AR systems for surgical guidance and when the focus is on blood vessels and only using a needle to puncture a vein. The problem of great body movement isn’t a greater issue, due to the images being taking with US which provides live-feed imaging and the patient will not move after images are taken. So the risk of high difference between taken images and when used is quite low compared to images taken with MRI or CT then later used. The used AR library used for this system have shown great speed and robustness compared to other AR libraries [31]. Also there have been other studies regarding CVC, 3D-model and AR. Where US 3D reconstruction has been shown in the market, but only using specialized 3D US probe or machines which have a position sensor such as an electromagnetic position sensor for freehand 3D ultrasound [38]. A product from BK [10] represents an ideal solution, however, the product requires a specific 3D US probe that is only introduced in some specific symptoms (e.g. pelvic floor). Also with their device for needle tracking is not usable for patients with pacemakers, due to the electromagnetic position sensor.

40
B.5 REFERENCES
1. Taylor, Robert W. MD; Palagiri, Ashok V. MD,“Central Venous Catheterization: Concise
Definitive Review”, CRIT. CARE MED. 35(5): 1390-1396, 2007.
2. Alan S. Graham, M.D.; Caroline Ozment, M.D.; Ken Tegtmeyer, M.D.; Susanna Lai, M.P.H.
and Dana A.V. Braner, M.D., “Central Venous Catheterization” ,n engl j med 356;21, 2007.
3. Andy Bodenham; Helen Hamilton, ”Central venous catheters”, WILEY-BLACKWELL, 2009,
ISBN: 978-0-470-01994-8, [page xiii]
4. Jacqueline L. Longe; Deirdre S. Blanchfield, “The GALE ENCYCLOPEDIA of MEDICINE”,
Second Edition, Vol 1,GALE GROUP, 2002, ISBN: 0-7876-5490-6, page 45.
5. Michael V. Beheshti, MD, “A Concise History of Central Venous Access”, Tech Vasc
Interventional Rad 14:184-185, 2011.
6. NNDB, Werner Forssmann, [Online] URL:
http://www.nndb.com/people/706/000129319/
[Last visited: 2016-06-02]
7. NNDB, André Frédéric Cournand, [Online] URL:
http://www.nndb.com/people/687/000129300/
[Last visited: 2016-06-02]
8. NNDB, Dickinson W. Richards, [Online] URL: http://www.nndb.com/people/721/000129334/
[Last visited: 2016-06-02]
9. Peters JL; Belsham PA; Garrett CP, et al: “Doppler ultrasound technique
for safer percutaneous catheterization of the infraclavicular subclavian
vein”, Am J Surg 143:391-393, 1982.
10. SonixGPS, BK Ultrasound,[Online] URL: http://bkultrasound.com/sonix/options/sonixgps
[Last visited: 2016-06-02]
11. Jorgensen Laboratories, Inc, OPERATING INSTRUCTIONS, Central Venous Catheter Kits,
URL:
http://www.jorvet.com/wpcontent/uploads/2012/01/central_venous_catheter_directions.pdf
[Last visited: 2016-06-02]
12. Harald T. Lutz; Hassen A. Gharbi ,”Manual of Diagnostic Ultrasound in Infections Tropical
Diseases”, Springer, 2006, ISBN: 978-3-540-24446-2, Chapter 1.
13. Robert A. Sofferman; Anil T. Ahuja, “Ultrasound of the Thyroid and Parathyroid Glands”,
Springer-Verlag New York,2012, ISBN: 978-1-4614-0974-8, Chapter 2.
14. NNDB, Christian Doppler, [Online] URL: http://www.nndb.com/people/711/000061528/
[Last visited: 2016-06-02]
15. Jean-Jacques Parienti, M.D.; Ph.D., Nicolas Mongardon, M.D.; Bruno Mégarbane, M.D.; Ph.D.,
Jean-Paul Mira, M.D.; Ph.D., Pierre Kalfon, M.D.; Ph.D., Antoine Gros, M.D.; Sophie Marqué,
M.D.; Marie Thuong, M.D.; Véronique Pottier, M.D.; Michel Ramakers, M.D.; Benoît Savary,
M.D.; Amélie Seguin, M.D.; Xavier Valette, M.D.; Nicolas Terzi, M.D.; Ph.D., Bertrand
Sauneuf, M.D.; Vincent Cattoir, Pharm.D.; Ph.D., Leonard A. Mermel, D.O. and Damien du

41
Cheyron, M.D., Ph.D., “Intravascular Complications of Central Venous Catheterization by
Insertion Site”,n engl j med 373;13, 2015.
16. Harshal Shah; Wendelyn Bosch; Kristine M. Thompson and Walter C. Hellinger,
“Intravascular Catheter-Related Bloodstream Infection”, The Neurohospitalist, 2013 Jul;
3(3): 144–151.
17. Reston N Smith; Jerry P Nolan, “Central venous catheters”, BMJ, 2013,347:f6570
18. Blaivas, Michael,“Video Analysis of Accidental Arterial Cannulation With Dynamic Ultrasound
Guidance for Central Venous Access”, JOURNAL OF ULTRSND. IN MED. 28(9): 1239-1244,
2009.
19. Chris Moore, MD, RDMS, RDCS, “Ultrasound-Guided Procedures in Emergency
Medicine”,Ultrasound Clinics, 6(2), 2011, Pages 277–289
20. Greg Kipper, Joseph Rampolla, “Augmented Reality: An Emerging Technologies Guide to
AR”, Elsevier Inc,2013, Chapter 1.
21. Lester Madden, Lester Madden. [Online] URL:
www.lestermadden.com/tag/augmented-reality/
[Last visited: 2016-06-02]
22. L. Madden, “Professional Augmented Reality Browsers for Smartphones:
Programming for Junaio, Layar and Wikitude”, John Wiley & Sons, 2011, Chapter 1.
23. Morton Heilig, Morton Heilig. [Online] URL: www.mortonheilig.com/
[Last visited: 2016-06-02]
24. Morton Heilig, “Sensorama Patent,” 28 Aug, 1962. [Online] URL:
www.mortonheilig.com/SensoramaPatent.pdf
[Last visited: 2016-06-02]
25. Gartner, Head-mounted display. [Online] URL:
http://www.gartner.com/it-glossary/head-mounted-displays-hmd/
[Last visited: 2016-06-02]
26. S. Parkin,“Oculus rift”,Technol. Rev., 117 (2014), pp. 50–52
27. ACM, Ivan Sutherland. [Online] URL:
http://amturing.acm.org/award_winners/sutherland_3467412.cfm
[Last visited: 2016-06-02]
28. Colaner, Seth, "What's Inside Microsoft's HoloLens And How It Works", Tom's
Hardware,23 August 2016.
29. B. Buxton; G. Fitzmaurice, “HMDs, Caves & Chameleon: A Human-Centric Analysis of
Interaction in Virtual Space,” i ACM SIGGRAPH Computer
Grahpics, Vol 32, Issue 4, Nov 1998, pp 69-74.
30. HITLab, ARToolKit. [Online] URL: www.hitl.washington.edu/artoolkit/
[Last visited: 2016-06-02]

42
31. S. Garrido-Jurado; R. Mu~noz-Salinas; F.J Madrid-Cuevas; M.J. Marn-Jimenez, “Automatic
generation and detection of highly reliable ducial markers
under occlusion”, Pattern Recognition. 47(6): 2280-2292,2014
32. R. Sood, Pro Android Augmented Reality. Apress, 2012, page 54.
33. Edmund Ng; Giap Weng; Rehman Ullah Khan; Shahren Ahmad Zaidi Adruce; Oon Yin Bee,
“Objects Tracking from Natural Features in Mobile Augmented Reality”, Procedia - Social and
Behavioral Sciences, Vol 97, 6 Nov 2013, pp 753-760.
34. Niantic, “Pokemon GO”, [Online]URL: http://pokemongo.nianticlabs.com/en/
[Last visited: 2016-08-13]
35. Darko Kati´c; Anna-Laura Wekerle; Jochen Görtlera; Patrick Spengler;
Sebastian Bodenstedt; Sebastian Röhl; Stefan Suwelack; Hannes Götz Kenngott;
Martin Wagner; Beat Peter Müller-Stich; Rüdiger Dillmann; Stefanie Speidel,
“Context-aware Augmented Reality in laparoscopic surgery”,Computerized Medical Imaging
and Graphics 37(2),2013 page. 174–182.
36. Barsuk, Jeffrey H.; McGaghie, William C. ; Cohen, Elaine R. ; Balachandran, Jayshankar
S. ; Wayne, Diane B. , “Use of Simulation-Based Mastery Learning to Improve the Quality of
Central Venous Catheter Placement in a Medical Intensive Care Unit”,Journal of Hsp. Med.
4(7):397-403, 2009.
37. Evans, Leigh V. ; Dodge, Kelly L.; Shah, Tanya D. ; Kaplan, Lewis J. ; Siegel, Mark
D. ; Moore, Christopher L. ; Hamann, Cara J. ; Lin, Zhenqiu; D'Onofrio, Gail, “Simulation
Training in Central Venous Catheter Insertion: Improved Performance in Clinical Practice”,
ACADEMIC MED., 85(9):1462-1469. 2010.
38. O.V. Solberg et al., “Freehand 3D Ultrasound Reconstruction Algorithm –A Review,” Ultrason.
Med. Biol. 33(7): 991-1009, 2007.

43
B.6 FIGURE REFERENCES
(a) antecubital vein (cephalic vein), [Online], URL:
http://www.ganfyd.org/index.php?title=Accessory_cephalic_vein&oldid=32793
[Last visited: 2016-06-02]
(b) Anatomic landmarks and blood vessels, [Online], URL: Source: http://clinicalgate.com/central-
venous-catheterization-and-central-venous-pressure-monitoring/
[Last visited: 2016-06-02]
(c) SonixGPS, [Online], URL: Source: http://bkultrasound.com/sonix/options/sonixgps, “video”
[Last visited: 2016-06-02]
(d) Intravenous Catheter, [Online], URL: http://emedicine.medscape.com/article/1998177-
overview#a3
[Last visited: 2016-06-02]
(e) CVC kit, [Online], URL:
http://www.jorvet.com/wpcontent/uploads/2012/01/central_venous_catheter_directions.pdf
[Last visited: 2016-06-02]
(f) Visual of ultrasound with Doppler effect, [Online], URL:
https://en.wikipedia.org/wiki/Doppler_echocardiography
[Last visited: 2016-06-02] (g) Insertion of needle, [Online], URL: https://www.youtube.com/watch?v=HE5QhsPRaPU
[Last visited: 2016-06-02] (h) Blood vessels, [Online], URL: http://www.usra.ca/tissueecho.php
[Last visited: 2016-06-02] (i) Sensorama machine, [Online], URL: Source:
http://www.telepresenceoptions.com/2008/09/theory_and_research_in_hci_mor/ [Last visited: 2016-08-13]
(j) Reference pattern, [Online], URL: (a) http://iplimage.com/blog/cv-img-tec-black-white-marker-detection/ [Last visited: 2016-06-02]
(k) Natural quality pattern, [Online], URL: http://thenextweb.com/mobile/2011/05/02/wikitudes-augmented-reality-now-installed-on-every-blackberry-device-interview/#gref [Last visited: 2016-06-02]

