a $15 u.s. minimum wage: how the fast-food industry · pdf filea $15 u.s. minimum wage: how...
TRANSCRIPT

PO
LIT
ICA
L E
CO
NO
MY
R
ESEA
RC
H IN
ST
ITU
TE
A $15 U.S. Minimum Wage:
How the Fast-Food Industry
Could Adjust Without Shedding Jobs
Robert Pollin and Jeannette Wicks-Lim
January 2015
WORKINGPAPER SERIES
Number 373

A $15 U.S. MINIMUM WAGE: HOW THE FAST-FOOD INDUSTRY COULD ADJUST WITHOUT
SHEDDING JOBS
By Robert Pollin and Jeannette Wicks-Lim Department of Economics and Political Economy Research Institute (PERI)
University of Massachusetts-Amherst [email protected]; [email protected]
January 2015
JEL CODE: J38 ABSTRACT: This paper considers the extent to which U.S. fast-food businesses could adjust to an increase in the federal minimum wage from its current level of $7.25 per hour to $15 an hour without having to resort to reducing their workforces. We consider this issue through a set of simple illustrative exercises, whereby the U.S. raises the federal minimum wage in two steps over four years, first to $10.50 within one year, then to $15 after three more years. We conclude that the fast-food industry could absorb the increase in its overall wage bill without resorting to cuts in their employment levels at any point over this four-year adjustment period. Rather, we find that the fast-food industry could fully absorb these wage bill increases through a combination of turnover reductions; trend increases in sales growth; and modest annual price increases over the four-year period. Working from the relevant existing literature, our results are based on a set of reasonable assumptions on fast-food turnover rates; the price elasticity of demand within the fast-food industry; and the underlying trend for sales growth in the industry. We also show that fast-food firms would not need to lower their average profit rate during this adjustment period. Nor would the fast-food firms need to reallocate funds generated by revenues away from any other area of their overall operations, such as marketing. We are grateful to Daniel Aaronson for his comments on a previous draft and for sharing results from some of his own preliminary research.

Pollin and Wicks-Lim “A $15 U.S. Minimum Wage” for PERI Working Paper January 2015 Page 1 1. INTRODUCTION
Over the past few years, there has been a growing movement in the United States to substantially raise the federal minimum wage, which has been fixed at $7.25 per hour since 2009. One widely embraced goal within this movement is to raise the federal minimum to $15 an hour. This would constitute a 107 percent increase over the current $7.25 minimum. The question we address in this paper is whether it is feasible to expect that the federal minimum wage could be raised to $15 per hour without causing major negative unintended consequences, specifically as it would affect the U.S. fast-food industry. The fast-food industry is an appropriate industry on which to focus this discussion. This is because, along with other sectors within the restaurant and food preparation sector, it employs fully 47 percent of all workers who earn at or below the federal minimum.1
The most straightforward possible negative consequence of a minimum wage increase to $15 an hour would be that it would generate large-scale employment losses, within the fast-food industry and more broadly. Through such an outcome, the good intentions that motivate the demand for a $15 federal minimum wage would result instead with low-wage workers and their families being made worse off through the contraction in job opportunities.
In addressing any such proposal along the lines of a $15 federal minimum wage, it is therefore critical to assess the relative likelihood that such a measure would generate its intended consequence—i.e. raising incomes and living standards for low-wage workers and their families—as opposed to its unintended consequence—i.e. reducing job opportunities and thereby worsening the life circumstances for low-wage workers. To preview our findings, we show that the U.S. fast-food industry could absorb the rise in its overall costs generated by an increase in the federal minimum wage to $15 an hour without causing employment losses. More specifically, we present a scenario through which the federal minimum wage rises in two steps over four years—to $10.50 an hour within one year and to $15 an hour three years later. We show that the cost increases resulting from these measures could be absorbed by the fast-food industry not only without causing employment losses, but, crucially, without business firms within the fast-food industry having to reduce their average rate of profitability. This is true, regardless of whether such a redistribution from business owners to low-wage employees is justified as one means of reducing inequality within the U.S.
1 This figure comes from the Labor Department’s 2013 report on the “Characteristics of Minimum Wage Workers.” See: http://www.bls.gov/cps/minwage2013.pdf, accessed December 2014.

Pollin and Wicks-Lim “A $15 U.S. Minimum Wage” for PERI Working Paper January 2015 Page 2 Of course, whether or not minimum wage increases lead to significant employment losses for low-wage workers is a longstanding matter of contention within the economics research literature. We do not provide one more review of this literature here.2 Our own assessment of the current state of the literature to date coincides with the conclusion reached by Freeman in his review of the literature as of 1995. Freeman conclusion, circa 1995, was “The debate is over whether modest minimum wage increases have ‘no’ employment effect, modest positive effects, or small negative effects. It is not about whether or not there are large negative effects,” (1995, p. 883, emphasis in original).
Nevertheless, Freeman is clear that his conclusion refers to the employment effects of modest minimum wage increases. It is fair to say that an increase from today’s $7.25 minimum to $15 would not be modest, even if this increase were phased in over four years, as we consider in this paper. This is true, despite the fact that, after correcting for inflation, today’s $7.25 federal minimum is about 33 percent lower than the $10.85 figure as of 1968—46 years ago. This long-term deterioration in the real value of the minimum wage is even more dramatic after we recognize that average labor productivity has risen by roughly 135 percent since 1968. This means that, if the federal minimum wage had risen in step with both inflation and average labor productivity since 1968, the federal minimum today would be $25.50 an hour.
The debate over the employment effects of increases in the minimum wage has mainly focused on whether or not these negative employment effects have in fact occurred. Much less attention has been given to an equally important follow-up question. If, indeed, no significant negative employment effects have resulted from minimum wage increases, then why haven’t they occurred? The basic law of demand in economics is clear that raising the price of anything will reduce demand for that thing, all else equal. Since nobody has proposed repealing this basic law of demand, it follows that, for an increase in the minimum wage to not generate employment losses for low-wage workers, it is necessary that the “all else equal” provision of the law has to be relaxed through some possible set of channels.
Some researchers have examined what alternative adjustment options firms have in fact pursued in response to minimum wage increases.3 In fact, there are four primary ways for businesses to adjust to cost increases other than reducing employment. First, a minimum wage hike could be paid for, in part, by cost savings from reduced absenteeism,
2 For a range of recent alternative perspectives on the literature, see, for example, Neumark and Wascher (2008), Pollin et al. (2008), Stanley and Doucouliagos (2009), and Belman and Wolfson (2014). 3 Schmitt (2013) and Hirsch et al. (2013) provides valuable overviews on these issues.
Pollin and Wicks-Lim “A $15 U.S. Minimum Wage” for PERI Working Paper January 2015 Page 3 lower turnover and training costs, and higher productivity more generally. Second, firms could possibly cover a share of their increased costs by raising prices. Third, firms could allocate a share of the revenues generated by economic growth to cover these increased costs. Finally, firms could redistribute overall revenues within the firm—from profits to the wages of their lowest-paid workers; from high-wage workers to low-wage workers; through investing in new equipment to reduce their employment requirements relative to their overall level of operation; or through cutting back on other business expenses to cover the increased wage bill.
It is critical to recognize here that, all else equal, for firms to be forced to cut their workforce due to a minimum wage increase could impair their capacity to sustain or improve their existing level of operations and retain or expand their customer base. As such, reducing the workforce is not likely to be their preferred adjustment option for most business firms that aspire to compete effectively and expand. We also assume that the least desirable option for firms is to reduce their profit rate. These are the reasons why firms are likely to be motivated to consider the prospects for reducing turnover, raising prices and drawing on a share of their increased revenues from growth to absorb their higher labor costs before they resort to cutting their workforce or reducing profitability.
The focus of this paper is to consider the extent to which U.S. fast-food businesses could adjust to a $15 minimum wage through some combination of these alternative possibilities, as opposed to resorting to reducing their workforces. We consider this issue through a set of simple illustrative exercises, whereby the U.S. raises the federal minimum wage in two steps over four years, first to $10.50 within one year, then to $15 after three more years. In assessing the likely adjustments within the fast-food industry of these minimum wage increases, we conclude that the fast-food industry could indeed absorb the increase in its overall wage bill without resorting to cuts in their employment levels at any point over the four-year adjustment period. Rather, we find that the fast-food industry could fully absorb these wage bill increases through a combination of turnover reductions; trend increases in sales growth; and modest annual price increases over the four-year period. We also show that fast-food firms would not need to lower their average profit rate during this adjustment period. Nor would the fast-food firms need to reallocate funds generated by revenues away from any other area of their overall operations, such as marketing.
Precisely because the fast-food industry operates with such a high concentration of low-wage workers, these findings specifically focused on the fast-food industry also offer broader implications. Our findings show, more broadly, how business firms within

Pollin and Wicks-Lim “A $15 U.S. Minimum Wage” for PERI Working Paper January 2015 Page 4 the U.S. economy overall could realistically adjust to a $15 federal minimum wage without generating employment losses within any sector of the economy.
The structure of this paper is as follows: Section 2 estimates the overall cost increases that fast-food firms would incur through an increase in the federal minimum wage to both $10.50 and $15 an hour. Section 3 then considers the options other than layoffs that businesses can pursue for absorbing these increased costs. Section 4 examines these options specifically as they apply within the current U.S. fast-food industry. Section 5 presents our scenario as to how the fast-food firms could absorb the increased costs generated by the two-step minimum wage increase to $10.50 within one year and to $15 within four years without having to reduce their workforce. Section 6 offers some brief conclusions.
2. COSTS TO FAST-FOOD FIRMS OF MINIMUM WAGE INCREASES
To estimate cost figures for a minimum wage hike up to $15.00 per hour for fast food employers, we need to answer the following three questions: 1) How many workers would get raises from the increased minimum wage? 2) How big would these raises be? and 3) What is the overall impact on the wage bill?
We answer these questions using publicly available labor market data published by the U.S. Labor Department for the “Limited Service Eating Places” industry (we use the terms “limited service eating places” and “fast food” industry interchangeably). These data sources include the Occupational Employment Statistics (OES), the Current Population Survey (CPS), and the Quarterly Census of Employment and Wages (QCEW). We include in our cost figure two distinct categories of raises. These are: 1) Mandated raises—the raises that get all workers to at least the new minimum wage rate; and 2) Ripple-effect raises. These are raises that would lift some workers above the newly-mandated minimum wage. Employers provide these ripple-effect raises in order to maintain a wage hierarchy after the new minimum wage has been enacted. In addition, we incorporate the rise in payroll taxes that employers will be mandated to pay to all workers receiving raises.
Estimating which workers will receive ripple-effect raises, as well as the size of these raises, is necessarily a more speculative exercise, since these raises are not legally mandated. To estimate the size and extent of ripple-effect raises, we start with the results of a study by one of us (Wicks-Lim 2008). That study looks at the impact, from 1983 to 2002, of federal and state-level minimum wage hikes on wages across the full wage distribution. Its basic finding is that ripple effects strongly compress wages at the low end. We apply this study’s estimates across the wage distribution. Through this, we

Pollin and Wicks-Lim “A $15 U.S. Minimum Wage” for PERI Working Paper January 2015 Page 5 assume that the effect of a 107-percent minimum wage can be expected to extend up to workers earning about $17.50 per hour, which would be 17 percent above the new mandated minimum wage of $15 (see appendix for details).
In addition, some case studies have considered the ripple effects of living wage ordinances implemented at the municipal level. These municipal-level living wage mandates require much larger minimum wage increases than the federal or state-level increases that were the focus of the 2008 Wicks-Lim research. These studies provide evidence supporting the idea that ripple effects from more substantial minimum wage increases, such as those that have resulted through municipal living wage ordinances, are likely to be larger than those resulting from typical federal or state minimum wage increases.
One such case study examines the impact of the living wage increase that was implemented over 1998 – 2001 at the San Francisco Airport (Reich et al. 2005). As part of this study, the researchers surveyed covered businesses before and after the wage floor increased from $5.75 to $10.00 per hour. Based on the changes in wage rates reported by these employers, ripple effects from this San Francisco living wage measure appears to have extended to wages about 40 percent above the new $10.00 floor, i.e., to workers earning up to $14.00. If we applied this standard to a minimum wage increase from $7.25 to $15.00 minimum wage, it would suggest that ripple effect raises would extend to workers earning up to $21.00, not $17.50.
This more extensive ripple effect observed in the San Francisco study is consistent with observations from two other studies on living wage ordinances (Fairris et al. 2005, and Brenner and Luce 2008). At the same time, Reich et al.’s wage survey did not adjust for wage increases that would have occurred in the absence of the newly-adopted living wage mandate and therefore likely reflect, in part, wage increases not caused by the living wage measure. Additionally, many San Francisco Airport workers were unionized at the time that the living wage ordinance was enacted. The collective bargaining process over their working conditions likely enabled these workers to raise their wages in response to the living wage ordinance more than would be normally the case among non-union workers. In other words, the raises observed by Reich et al. likely reflect the influence of more than the adoption of the living wage ordinance alone.
As a result, we view our two sets of ripple effect estimates—from Wicks-Lim (2008) on federal and state-level minimum wage increases and Reich et al (2005) on the San Francisco airport living wage ordinance—as providing lower- and upper-bound cost estimates, respectively, of the raises we expect to occur due to a minimum wage increase from $7.25 to $15.00. For the purposes of our calculations, we assume that ripple-effect

Pollin and Wicks-Lim “A $15 U.S. Minimum Wage” for PERI Working Paper January 2015 Page 6 raises extend throughout the entire wage distribution among fast food workers. This is because the Labor Department’s figures indicate that the highest wage rate among fast-food workers is about $18.25. This is only 22 percent above a $15 minimum wage level—i.e. roughly only half the 40 percent level percentagewise that Reich et al. observed for ripple effects resulting from the San Francisco living wage ordinance. For our purposes, we assume that the ripple effects will fall midway between the levels suggested by the Wicks-Lim and Reich et al. studies (see the appendix for details on our estimations).
In Table 1, we present these average figures for determining the costs of both mandated and ripple-effect raises from a $15.00 minimum. We see in the first column of Table 1 that about 1.1 million fast food workers earn wages at the bottom of the wage scale—between $7.25 and $8.50. In row 6, we show that these workers can expect to get a raise that brings them up to the new $15.00 minimum, up from their current average of $7.74. This is an average raise of 94 percent.
TABLE 1 BELONGS HERE
The next group of fast-food workers earns between $8.50 and $9.50. We estimate that these approximately 1.3 million workers would, on average, receive raises that push their wages slightly higher than the new $15.00 minimum, to $15.60. Their raises, however, are smaller than those of the lowest paid workers. The average wage increase is from $8.87 to $15.60, or 76 percent. These smaller raises result from the fact that they began at higher wage rates. In other words, minimum wage increases tend to compress, rather than simply shift, the wage distribution.
We assume that this pattern continues through the wage distribution, with each set of workers receiving smaller proportional raises. These raises basically place workers in a similar position before and after implementation of the $15.00 minimum wage, but cause the wage distribution to compress at the lower end. The top wage earners in the fast-food industry, currently earning between $17.50 and $18.50, receive an average raise of only about seven percent.
To calculate the total annual wage bill increase resulting from these raises (shown in row 7), we multiply for each group of affected workers: the number of workers (row 1) by their average annual hours (row 3) and their average raise (row 6). Table 2 provides summary figures of these costs. We estimate that basically all 3.8 million fast-food workers, earning up to $18.25 would receive raises.
TABLE 2 BELONGS HERE

Pollin and Wicks-Lim “A $15 U.S. Minimum Wage” for PERI Working Paper January 2015 Page 7
Because workers at different points in the wage distribution work varying numbers of hours, for our summary figures in Table 2, we convert the overall employment and wage figures to reflect full-time equivalent (FTE) positions. As we can see in Table 1, workers at the lowest wage rates also tend to work the fewest number of hours. The impact of these workers on the fast-food industry’s overall wage bill will therefore be smaller than what their headcount number would suggest.
In row 2 of Table 2, we show that 2.5 million FTE positions should expect to experience wage raises from a $15.00 minimum. The average raise (row 6) across these FTE positions is 59 percent, which is roughly half the 107 percent increase in the wage floor due to the minimum wage increase from $7.25 to $15.00. This lower average percentage wage increase reflects the fact that workers earning above the current $7.25 minimum will receive smaller mandated and ripple effect raises. As we show in row 7 of Table 2, total raises within the fast-food industry resulting from the increase to a $15 minimum add up to $30.7 billion.
We can, of course, utilize this same methodology to estimate the overall set of raises, and the overall wage bill increase, that would result through minimum wage increases to other levels. In Table 3, we show our results for the case of minimum wage increases from the current $7.25 per hour standard to $10.50 as the new mandate. As Table 3 shows, with the increase to an $10.50 minimum wage, we estimate that 3.5 million fast-food workers, now earning between $7.25 and $14.50 would receive raises. These workers work an equivalent of 2.2 million FTE positions (row 2). Across these FTE positions, the increase to an $10.50 minimum wage would raise the average hourly pay rate by 16.0 percent from $9.42 to $10.96. These raises add up to a total of a $7.1 billion increase in the fast-food industry’s wage bill.
TABLE 3 BELONGS HERE
In Table 4, we then scale the total fast-food industry wage bill increases relative to the industry’s total sales in 2013 of $232 billion.4 We show the ratios of these wage-bill increases relative to sales resulting through minimum wage increases from the current $7.25 figure for both $10.50 and $15 respectively. As we see in the bottom row of Table 4, the wage-bill increases represent 3.3 percent of sales at an $10.50 minimum wage and14.2 percent of sales at a $15 minimum wage. These ratios are critical in providing a scale for measuring the extent of the adjustments that fast-food firms would need to
4 The figures on fast-food industry sales come from the 2012 U.S. Economic Census. See the discussion in the appendix as to how we updated these figures for 2013.

Pollin and Wicks-Lim “A $15 U.S. Minimum Wage” for PERI Working Paper January 2015 Page 8 undertake in order to absorb the wage-bill increases associated with significantly higher minimum wage standards.
TABLE 4 BELONGS HERE
3. HOW BUSINESSES ADJUST TO MINIMUM WAGE COST INCREASES
There are four primary ways for businesses to adjust to cost increases other than reducing employment. First, a minimum wage hike could be paid for, in part, by cost savings from reduced absenteeism, lower turnover and training costs, and higher productivity more generally. Second, firms could possibly cover a share of their increased costs by raising prices. Third, firms could allocate a share of the revenues generated by economic growth to cover these increased costs. Finally, firms could redistribute overall revenues within the firm—from profits to the wages of their lowest-paid workers; from high-wage workers to low-wage workers; through investing in new equipment to reduce their employment requirements relative to their overall level of operation; or through cutting back on other business expenses to cover the increased wage bill. We briefly consider these alternatives in turn.
Raising worker productivity. There are good reasons to expect that firms will experience some labor-cost savings due to greater worker productivity. This is because minimum wage hikes can increase workers’ commitment to their job as their compensation increases. One concrete way that these changes can be measured is through turnover rates. With lower turnover, employers save on the costs of recruiting and training new employees and achieve efficiency improvements through operating with more experienced employees.
At the same time, in assessing the prospects for such cost-saving channels, the initial question that emerges is: If businesses could raise productivity and save on labor costs through raising wages, why wouldn’t they raise wages independent of changes in minimum wage mandates? The answer is that the cost savings from productivity improvements induced by higher wages will almost certainly not offset the cost of the higher wages in full. That is, in almost all circumstances, productivity improvements will reduce, but will not completely pay for, the increased costs resulting from higher wages.
Raising prices. Firms can raise prices to generate more sales revenue that they can then use to cover their higher labor costs. The crucial question here is: how much can a firm raise prices without losing sales? That is, what is the price elasticity of demand that the firms face? Businesses that operate in markets where demand is relatively

Pollin and Wicks-Lim “A $15 U.S. Minimum Wage” for PERI Working Paper January 2015 Page 9 inelastic have more flexibility to raise their prices since their customers are less likely to change how much they spend even as prices rise.
This point raises a question about firms’ price-setting behavior that parallels the question about firms’ wage-setting behavior above. That is, why wouldn’t firms that operate in markets where demand is relatively inelastic raise prices regardless of whether there is a minimum wage increase? The answer in this case is that it can be difficult for a single firm to pursue this strategy alone. If one firm among several within a competitive market environment raises its prices, it risks losing customers to its competitors which have not raised prices. Therefore even if a firm would want to raise its prices to take advantage of a relatively inelastic market demand, it will be reluctant to do so unless other firms also raise their prices concurrently. However, in the case of a regional or federal minimum wage increase, the likelihood is that all affected firms within a given area will raise their prices at about the same time. In this case, no one firm is placed at a disadvantage relative to its competitors, and all firms are able to enjoy the benefits of charging a higher price. In the absence of an area-wide policy change like a minimum wage hike, firms will face difficulties in coordinating with their competitors any such price increase. Among other factors, explicit efforts for competitive businesses to coordinate their pricing policies constitute collusion.
Increased revenues through economic growth. The overall growth trajectory of any specific sector, and of the economy overall, provides additional flexibility for firms facing cost increases resulting from higher minimum wages or any other factor. That is, on average, firms’ revenues will increase as a result of overall economic growth. When faced with higher labor costs, firms could therefore allocate a share of their expanding revenues to cover their higher labor costs.
Redistribution of revenue within firm. Businesses can channel a higher proportion of any given level of revenue to cover the increased labor costs resulting from a higher minimum wage. For example, firms could lower their profit margins to cover their higher labor costs. They could also reduce the rate of wage increases for their higher-paid workers. Finally, they could reduce spending or at least slow the growth in spending in other areas, such as marketing.
4. ALTERNATIVE ADJUSTMENT OPTIONS IN PRACTICE
Taken together, the adjustment channels we have described above—raising productivity; raising prices; drawing on a share of the revenue gains generated by economic growth; or redistributing a given level of revenue—provide firms with alternative ways to absorb the cost increases generated by a minimum wage hike rather

Pollin and Wicks-Lim “A $15 U.S. Minimum Wage” for PERI Working Paper January 2015 Page 10 than resorting to reducing their overall employment levels. All else equal, cutting overall employment could impair the capacity of firms to sustain their existing level of operations and retain their customer base. As such, it is not likely to be their preferred adjustment option. The question we wish to consider now is the extent to which fast-food firms could realistically deploy these alternative adjustment options when faced with minimum wage increases up to both $10.50 and $15 per hour.
For the purposes of our exercise, we assume that the least desirable option for firms is to reduce their profit rate. The other relatively undesirable option would be to reduce costs in other areas of their operations, such as marketing or investments in new equipment.
It is possible that fast-food firms would channel an increased share of their revenues to purchase new equipment that could enable them to rely less on employing low-wage workers to maintain their desired scale of operations. Aaronson and Phelan (2014) examine this prospect for the case of low-wage workers in the fast food industry. They find that such technological adjustments do take place as a result of a minimum wage increase, but that the effects of such adjustments on overall fast-food employment are negligible.5
Overall then, in considering minimum wage increases to both $10.50 and $15 per hour, we assume no adjustments through either a reduction in profitability or through changes in spending levels within other areas of the firms’ operations. That is, we assume both that profit rates will remain stable and that no other redistributions of firms’ revenues occur either. That leaves us with three remaining adjustment options—raising productivity; raising prices; or channeling a share of the revenue gains from economic growth to cover the rise in low-wage labor costs.
Prospects for productivity improvements. We combine findings from two sets of research to estimate the degree to which fast-food firms could experience productivity gains resulting from an increase to either a $10.50 or $15 minimum wage. First, we consider research on the hospitality industry that estimates costs that businesses incur through employee separations. We then also consider research findings that have estimated the extent to which higher wage floors reduce labor turnover rates among low-wage workers. These two sets of research will enable us to estimate the range of cost 5 Specifically, Aaronson and Phelan conclude that the impact of a minimum wage increase on overall employment is indistinguishable from zero but the employment response does, in fact, vary based on the extent to which an occupation is associated with routine cognitive tasks. They write that “at the same time that employers are reducing highly cognitively routine jobs, non-routine employment is expanding.” They also find that “this movement away from highly routinized occupations occurs with little effect on the probability of job change, the probability on subsequent employment, or wages, (2014, p. 2).”

Pollin and Wicks-Lim “A $15 U.S. Minimum Wage” for PERI Working Paper January 2015 Page 11 savings that fast food firms are capable of achieving through any given minimum wage increase.
According to the U.S. Labor Department, the accommodations and food service industry had an annual turnover rate of 62.6 percent in 2013.6 However, Hinkin and Tracey (2010) report that among limited service restaurants specifically, turnover is substantially higher, at 120 percent. Hinkin and Tracey also estimate the costs associated with this high turnover rate within the hospitality sector (in their 2000, 2006 and 2010 studies). Their findings indicate that, on average, fast-food businesses experience a cost of roughly $4,700 each time fast-food workers separate from their jobs (see appendix for details on these turnover cost estimates). Their estimates of employer separation costs include five major cost categories, which they term “pre-departure, selection, orientation and training, and lost productivity,” (Tracey and Hinkin, 2010, p. 3).
A 2013 study by Dube, Lester, and Reich generates estimates of separation elasticities associated specifically with minimum wage increases between 2000 and 2011 —that is, how much the separations rates fall as a result of these minimum wage increases. They estimate an elasticity of -0.225. This means that, for each 10 percent increase in minimum wage, the decline in the turnover rate for fast-food workers would be -2.2 percent.
We can then combine the respective findings of Hinkin/Tracey and Dube et al. to estimate the amount of cost savings that are likely to be generated through a rise in the minimum wage to $10.50 and $15 per hour respectively. Thus, a minimum wage increase to $10.50 per hour is an increase of 45 percent relative to the current $7.25 minimum. Following from the Dube et al. separation elasticity figure, a 45 percent minimum wage increase should then reduce turnover by 10.0 percent (45 percent x -0.225). This represents roughly a 12 percentage-point decline in what we have seen above from the Hinkin/Tracey research as an average turnover rate of 120 percent in the fast-food industry (i.e. 120 percent x .12). Given current employment levels within fast food, this level of decline in turnover rates translates to 456,000 fewer worker separations. The cost savings associated with this decline amounts to $2.1 billion or roughly 28 percent of the total wage bill increase for the fast food industry that we reported in Table 4.
Following the same set of steps and calculations for a minimum wage increase to
$15, we calculate that this minimum wage increase would generate a 24 percent reduction in the turnover rate. This in turn would mean a 29 percentage-point reduction relative to what had been a 120 percent turnover rate within the fast-food industry. This would then 6 The turnover rate is defined as the total number of separations as a percent of total employment. See: http://data.bls.gov/cgi-bin/print.pl/news.release/archives/jolts_03112014.htm, Table 16.

Pollin and Wicks-Lim “A $15 U.S. Minimum Wage” for PERI Working Paper January 2015 Page 12 generate 1.1 million fewer separations per year among the 3.8 million workers employed in the industry, which in turn translates into $5.2 billion in cost savings. This equals 17 percent of the total wage bill increase of $33.0 billion generated by the minimum wage rise to $15 per hour.
The results we have derived through these exercises correspond closely with the findings of three previous studies. Thus, a study by Fairris et al. (2005) directly asked employers subject to the 1997 Los Angeles living wage ordinance about changes in their turnover rates resulting through establishing the municipal living wage mandate. The employers estimated that the living wage ordinance reduced turnover rates from 49 to 32 percent—i.e. a decline of 17 percentage points. Fairris et al. further found that, after taking account of the costs to find and train new employees, this reduction in turnover produced cost savings equal to about 16 percent of the wage bill increase generated by the 1997 Los Angeles living wage ordinance.
Two other studies estimated cost savings from lower turnover within the range of 11 percent (Reich, Hall and Jacobs, 2003 for the San Francisco City Airport ) to 30 percent (Pollin and Brenner 2008, Chapter 5 for Santa Fe, NM restaurants). Overall then, these studies suggest that lower turnover rates may offset between 10 and 30 percent of the cost of a minimum wage hike. Based on these results, we assume that the minimum wage increases to $10.50 and $15 per hour respectively will generate reductions in worker turnover that will offset 20 percent of the overall wage bill increase.
Prospects for raising prices. The only two recent studies of price elasticities of demand within the U.S. fast-food industry specifically were done by researchers at the U.S. Department of Agriculture (USDA), Okrent and Alstom (2012) and Okrent and Kumcu (2014). Both of these studies were based on data from between 1999 and 2010. Despite this, the two studies—with the same lead author in both cases—generated a large difference in their estimated price elasticities of demand. The elasticity estimate was -0.13 for the 2012 study and -0.9 for the 2014 study.
For the purposes of our discussion, it is critical to identify the source of this large disparity. The key difference appears to be that in the 2012 study, Okrent and Alstom do not separate out the effects of household time constraints and advertising on the demand for fast food, as against the pure effects of price on demand independent of the impacts of household time constraints and advertising. For our purposes, we are most interested in knowing the impact on demand of price changes as they operate in combination with (i.e. their interactive effects) with both household time constraints and advertising. This is because we assume that the change in the minimum wage will not affect trends in either household time constraints or the advertising expenditures of fast-food firms. As such, we conclude that the price elasticity of demand that is most relevant for our discussion

Pollin and Wicks-Lim “A $15 U.S. Minimum Wage” for PERI Working Paper January 2015 Page 13 would be much closer to the -0.13 figure from the Okrent/Alstrom 2012 study than the -0.90 estimate from the Okrent/Kumcu study, which does attempt to separate out pure price effects from the effects of household time constraints and advertising expenditures.
We also note that assuming a price elasticity in the much higher range of -0.90 is inconsistent with the body of evidence which finds that minimum wage increases do typically generate price increases. This result emerges strongly, for example, from the research by Aaronson and his co-authors over several studies (e.g. Aaronson 2001, McDonald and Aaronson 2006, and Aaronson et al. 2008). For example, in considering evidence from the 1995-1997 period covering a two-step federal minimum wage hike, Aaronson et al. (2008) report that fast-food prices rise by about 1.4 percent in response to a 10 percent minimum wage increase. If it were the case that a rise in fast-food prices generated an equivalent or near-equivalent decline in consumer demand—as is suggested by a -0.9 elasticity—then there would be no purpose for fast-food firms to raise prices to help offset the increased wage bill resulting from a rise in the minimum wage.
Nevertheless, in order that we not underestimate the potential fall in demand from a rise in fast-food prices resulting from a minimum wage increase, we will assume a rough midpoint figure between the two estimates, at -0.50, as our price elasticity in considering both the $10.50 and $15 minimum wage increase scenarios.
Increased revenue from economic growth. Figures from the U.S. Economic Census indicate that from 1997 to 2012, sales in limited service eating places, adjusted for overall inflation, grew at a 2.5 percent average annual rate. This compares with the economy’s overall real GDP growth rate over this period of 2.3 percent per year. In other words, sales in the fast food industry have grown slightly faster than the U.S. economy as a whole. This occurred even while the Census Bureau’s price index for the industry indicates that prices have risen marginally faster than the overall consumer price index since 1998 (the first year for which the BLS provides this data). The fast food price index rose at a pace of 2.9 percent annually compared to the overall CPI, which rose by 2.4 percent annually.
These observations suggest that overall sales in the U.S. fast-food industry tends to grow at approximately the same rate as overall U.S. GDP, even after allowing that fast-food prices are increasing at a slightly faster rate than the overall CPI. For the purposes of our two scenarios—the minimum wage increase to $10.50 in one year and to $15 over a four-year period—we assume that sales growth in the fast-food industry will proceed at an average rate of 2.5 percent per year. We also assume that this overall 2.5 percent

Pollin and Wicks-Lim “A $15 U.S. Minimum Wage” for PERI Working Paper January 2015 Page 14 increase in fast-food sales revenue will be available to help cover the higher industry costs generated by the minimum wage increases.7
5. SCENARIO FOR A $15 MINIMUM WAGE WITHIN FOUR YEARS
In our scenario, the federal minimum wage rises from its current level (what we term the “Year 1” level) of $7.25 to $10.50 after one year, i.e. by Year 2. The federal minimum then rises to $15 after three more years, i.e. by Year 5. Therefore, the U.S. economy operates with an $10.50 minimum wage for three years, from Years 2 – 4, before rising to $15 per hour in Year 5.
The assumptions through which we develop this scenario are straightforward. That is, again, we begin by assuming that the fast-food industry experiences no employment losses over the full four-year adjustment period, from Years 2 – 5. We rather assume that employment growth proceeds at an average rate of one percent per year. This is a slower rate of employment growth than the two percent trend growth rate for the fast-food industry.8 But, as we discuss more below, we are also anticipating that the growth in sales volume (though not sales revenues) will also slow modestly due to the price increases that we assume the industry will enact as one of their adjustment mechanisms. In other words, employment growth will slow from the trend 2 percent rate to 1 percent through Years 2 – 5. This is because the growth in the total amount of food that the industry will sell will also slow modestly. In any case, after the four-year adjustment period to move the federal minimum to $15 per hour, employment growth should then return to its trend rate of around 2 percent.
According to the October 2014 IBIS World Industry Report that focuses on the U.S. fast-food industry, the profit rate in the fast-food industry for 2014 was 5 percent. IBIS is defining profitability here as profits as a share of total revenues. In our scenario, we assume that profits as a share sales revenues will be fixed at this 5 percent of sales ratio for all four years of our adjustment period. We also, again, assume that there are no other areas of the industry’s operations which experience reductions in their revenue levels.
7 We do not attempt here to analyze here the general equilibrium effects that would operate within a more fully specified time-series macro model of the U.S. economy. If we were to develop such a fuller model that would include longer-term effects, we would need to incorporate, as noted at the outset of the paper, the fact that the federal minimum wage has declined by roughly 1/3 in real dollars relative to its peak level in 1968, even while average labor productivity has risen by roughly 135 percent. 8 This trend employment growth rate is based on the change in employment levels in limited service eating places between the 1997 and 2012, as reported by the U.S. Economic Census.

Pollin and Wicks-Lim “A $15 U.S. Minimum Wage” for PERI Working Paper January 2015 Page 15
At the same time, we do need to account for the fact that some components of fast food firms’ spending will rise as their sales volume rises. These include spending on inputs such as wholesale food products, utilities, and, franchise royalties paid by the franchisees. Based on IBIS’s 2014 report, these types of industry costs currently make up approximately 60 percent of sales revenue.9
There are three further key assumptions, as derived from our literature review above:
1) Cost savings from turnover reductions. Turnover reductions will generate cost savings for the fast-food firms that will amount to 20 percent of their wage bill increases.
2) Industry sales growth trend tied to overall economic growth. The fast-food industry’s underlying growth trend will continue to roughly match that of the overall economy, at around 2.5 percent per year. The actual rate of sales growth will be reduced modestly due to industry-wide price increases, but will still otherwise correlate closely with overall GDP growth.
3) Demand elasticity and price increases. We assume that the price elasticity of demand within the fast-food industry is -0.5. We also allow that overall prices within the fast-food industry will rise by 3 percent per year over Years 2 – 5. Given our -0.5 price elasticity assumption, the 3 percent annual price increase will break down into: 1) a 1.5 percent decline in sales revenue relative to what sales would be otherwise along a 2.5 percent annual sales growth trend; and 2) a 1.5 percent increase in revenues relative to what revenues would be otherwise for a given volume of sales.
In Tables 5 and 6, we now show how the fast-food industry could realistically adjust to a $15 minimum wage without resorting to either employment losses, reductions in their profit rate, or other forms of revenue redistribution within the industry. Specifically, Tables 5 and 6 show the effects of the full set of adjustments that the fast-food industry could make in response to the higher minimum wage levels, working from our assumptions with respect to turnover; the growth trend in industry sales; and the -0.5 price elasticity of demand combined with a 3 percent annual increase in prices.10
9 Specifically, on p. 21, IBIS reports industry costs, as a percent of sales, to be composed of: profit (5%), wages (25.4%), purchases (35.5%), depreciation (3%), marketing (3%), rent and utilities (14%) and “other” (14.1%). IBIS describes this “other” category to include such items as administrative costs, professional fees, and franchise royalties. The 60 percent figure we use to describe spending on industry costs that will rise with increases in sales volume includes: purchases, depreciation, and utilities (half of 14%, or 7%), and “other” costs. How much of the “other” category would actually increase with sales is unclear. Therefore, we simply assume that all of the “other” category would increase. 10 Of course, the results of our exercises depend on the assumptions we have made. As an additional set of explorations, it would be useful to examine the extent to which the overall results might change through

Pollin and Wicks-Lim “A $15 U.S. Minimum Wage” for PERI Working Paper January 2015 Page 16 TABLES 5 AND 6 BELONG HERE
We begin in Table 5 with the adjustment process from Years 1 to 2, from the $7.25 to the $10.50 per hour federal minimum wage. As Table 5 shows, based on our full set of assumptions, the fast-food industry will face a $8.2 billion wage bill increase resulting from the rise to an $10.50 minimum wage. This overall wage bill increase is then absorbed through the combination of these three channels: 1) $1.5 billion in cost savings generated by reduced turnover; 2) $3.5 billion in increased revenues, assuming a 3 percent price increase and a -0.5 price elasticity of demand; and 3) a $6 billion revenue increase generated by the 2.5 percent underlying sales growth trend. Within this Year 2 adjustment framework, we also need to account for the increase in other costs from our assumed one percent growth in sales volume. As noted above, these other costs are equal to approximately 60 percent of the sale revenue given current prices. Thus, we assume that a one percent increase in sales volume will raise other costs by $1.4 billion (60 percent x 1.0 percent x $232 billion). As we see in row 7 of Table 5, an additional 0.5 billion will need to be allocated to firm profits in order to maintain the average industry profit rate at 5 percent of overall sales.
Table 6 then presents figures on the second phase of the adjustment process for the fast-food industry, in which the federal minimum wage rises from $10.50 per hour in Year 4 to $15 as of Year 5. In this case, we see that the overall wage bill will be $28.4 billion. This wage bill increase is then covered through these channels: 1) A $5.2 billion cost reduction generated by lower turnover; and 2) a $30 billion revenue increase in Year 5 relative to Year 2. This figure incorporates both a) three years of underlying sales growth at 2.5 percent; and b) three years of price increases at 3 percent per year, with a -0.5 percent price elasticity operating in all three years. In this case, $1.5 billion out of total revenues will need to be allocated for profits to maintain the industry profit rate at 5 percent of sales. Finally, we show in row 8 that $4.2 billion will go towards covering the cost increases fast food firms experience due to increased sales volume. As we see in row 9 of Table 6, after all of these adjustments are accounted for, the industry will still be able to retain $1.1 billion in revenues to be allocated for other purposes.
6. CONCLUSION
We have presented a simple, stylized scenario through which we show how the federal minimum wage in the U.S. could be raised within four years to $15 an hour without generating employment losses in the fast-food industry. We also show how this altering our underlying assumptions. For our purposes here, we are focusing, more narrowly, on the findings that result based on the reasonable set of assumptions that we have derived from the relevant literature.

Pollin and Wicks-Lim “A $15 U.S. Minimum Wage” for PERI Working Paper January 2015 Page 17 adjustment to a $15 minimum wage could be accomplished without fast-food business firms having to face a decline in profitability. The set of assumptions underlying this scenario are all realistic and derived from the existing relevant literature.
These results can help provide clarity on two sets of questions regarding the impact of minimum wage laws in the United States, one a purely analytic question and the other more geared to ongoing policy debates. From an analytic perspective, our illustrative exercises help to explain how it is the case that minimum wage increases can be implemented repeatedly without generating large-scale employment losses among low-wage workers. The key point that our scenario emphasizes—following from the literature we have discussed here—is that business firms do have other options available to them besides cutting their workforce. These other options, moreover, are likely to be more desirable under most circumstances, especially for firms that aspire to compete successfully and grow.
In terms of policy implications, our results offer a straightforward conclusion. Achieving a $15 federal minimum wage within the U.S., phased in over four years, should be seen as a realistic prospect. This specifically means that the intended consequence of the $15 minimum wage—to improve the living standards of low-wage workers in the U.S. and their families—can certainly prevail over the unintended consequence that low-wage workers and their families would suffer from widespread employment losses.

Pollin and Wicks-Lim “A $15 U.S. Minimum Wage” for PERI Working Paper January 2015 Page 18
APPENDIX
1. Estimating wages and employment levels of fast food workers
The CPS does not distinguish fast food workers from restaurant workers more generally. As a result, to estimate the wage, hours and employment characteristics of workers in this industry, we combine data on the limited service eating places industry wage structure from the May 2011 OES, and data on restaurant workers the 2013 CPS. The OES provides the following measures of the limited service restaurant industry’s wage structure: the 10th, 25th, 50th (median), 75th, and 90th wage percentiles, as well as the mean.
TABLE A.1 BELONGS HERE
We used these summary wage measures to first construct a wage distribution for the industry and then approximate the proportions of workers that are likely to receive raises from each of the higher minimum wage levels we consider (e.g., $10.50). The percentages of fast food workers for each of the wage intervals we analyze are presented in main text in Table 1.
We then estimated the average wage, average weekly hours, and weeks worked using the 2013 CPS data file made publicly available by the Center for Economic and Policy Research (CEPR), restricting the sample of workers to those working in food services specifically, and using CEPR’s hours (uhoursi) and wage (rw) measures from the Outgoing Rotation Group data files. Note that CEPR imputes usual weekly hours for workers who report that their usual hours “vary.” For more information about CEPR’s adjustments to the hours and wage measures, see: http://ceprdata.org/wp-content/cps/CEPR_ORG_Wages.pdf.
For the highest wage category of workers earning between $17.50 and $18.50, we used as the maximum wage $18.25 since assigning this upper limit produces an overall wage distribution with a mean wage of $9.86, matching the mean wage for the limited service eating places industry from OES data. Without this limit, the maximum wage would be as high as $200.00, possibly overestimating the pay of the highest paid fast food workers.
We used the 2013 CPS ASEC file to estimate annual weeks worked for each wage interval. There are two issues to note about using this data file. We can construct an hourly wage from this data file by doing the following: (annual wage and salary income)/(number of weeks worked in the past year) x (number of hours worked per week). We can then use this hourly wage to identify workers within each of our wage groups and get their average weeks worked per year.
There is, however, a higher amount of reporting error in the CPS ASEC data file compared to the hourly wage measure in from the CPS ORG data file. This is because the hourly wage estimate from the CPS ASEC depends on information from respondents on their earnings and work schedule that they have to recall from over the entire past calendar year. The CPS ORG wage measure, in contrast, is based on respondents’ reporting on their pay rate over the past two weeks. As a result, the ASEC wage measure tends to have a problem of over-reporting hours at the low end of the wage distribution. This is because workers who overestimate the number of hours or weeks worked will tend to produce an underestimate of their hourly wage and incorrectly place themselves toward the low end of the wage distribution.

Pollin and Wicks-Lim “A $15 U.S. Minimum Wage” for PERI Working Paper January 2015 Page 19
To take these errors into account, we adjust downward the weeks worked for the lowest wage workers ($7.25 - $8.50) by the following factor: the ratio of hours worked as reported in the CPS ORG file between the lowest two wage intervals (0.87), and apply it to average weeks reported in the CPS ASEC file for the second to lowest wage interval ($8.50 to $9.50). In other words, we multiply our estimate of average weeks worked for the $8.50 to $9.50 wage interval (45 weeks) and multiply this by 0.87 to get an average of 39 weeks worked. This adjustment creates the familiar pattern of the lowest paid workers working the least and the highest paid workers working the most.
2. Updating the 2012 Economic Census measure of overall sales in the limited service eating places industry to 2013
The 2012 Economic Census reports the overall sales for the limited services eating places to be $223 billion in 2012. To estimate the figure for 2013, we simply take the average annual nominal growth rate between 2007 and 2012 (4.0 percent), and apply it to 2012. Therefore our estimate for 2013 sales equals $232 billion.
3. Estimating ripple effects raises from a large minimum wage hike
As stated in the main text, we use two sets of past research to estimate ripple effect raises in our study.
First, we use the estimates from chapter 11 of Pollin et al. 2008. For these estimates we take the following steps:
1) We modeled each minimum wage hike to take place over multiple steps if the minimum wage increase in total, is larger than 15 percent. E.g. we modeled a minimum wage increase from $7.25 to $10.50 to occur in three steps.
2) We then assume raises in each step will conform to the same size and distribution as those reported in Table 11.1 Panel B from Pollin et al. 2008 (p. 204). These raises are largest for those who are at the current $7.25 rate and smallest for those around $10.50.
3) Because these wages lead to a compression of the wage rates at the bottom of the distribution, we require that the raises for workers at any particular point in the “old” distribution (i.e., the wage distribution prior to a minimum wage increase) are at least sufficient enough to place them at or above the wages of workers who sit below them in the “old” distribution. In other words, we assume ripple effect raises will be large enough to, at minimum, preserve the wage hierarchy.
Second, as we explained in the main text, we use the wage rate observations of Reich et al. (2005) before and after the San Francisco’s $10.00 living wage mandate for covered workers at the San Francisco airport to model a second set of ripple-effect raises. To do this, we take the following steps.
1) We assume that the extent of raises will be 40 percent past the new minimum wage level. This is based on the observed impact of past living wage ordinances on wages, as for example, in the Reich et al. 2005 study. See Table A.2.
2) Because only the Reich et al. 2005 provides any details about how much different wage rates increased before and after a new living wage, we use their observations to determine how large raises should be at different points in the wage distribution.

Pollin and Wicks-Lim “A $15 U.S. Minimum Wage” for PERI Working Paper January 2015 Page 20
Specifically, we rescale the raises in Table A.2 to estimate the size of raises that would occur starting from those workers earning the lowest rates (i.e., around $7.25) to those workers earning up to 40 percent over the new wage floor (e.g., for a new minimum at $15.00 the raises would extend to workers earning up to $21.00). In order to estimate raises for workers earning wages at all the points in the wage distribution up to 40 percent over the new wage floor, we take an additional step. We fit a logarithmic trend line to a scatterplot of the various points in the wage distribution represented by the observations in Table A.2, expressed as a percent of the old wage floor (on the x-axis) against the size of the raises (on the y-axis). We then used the equation of the trend line to interpolate the raises for each of the wage categories used in Table 1 of the main text. The raises are presented in detail in Table 1 for the $15.00 minimum wage.
TABLE A.2 BELONGS HERE
4. Estimating cost savings from lower turnover rates.
We use Hinkin and Tracey’s 2000 estimates of turnover costs for employees in various occupations within the hotel industry. Specifically, they estimated a range of turnover costs based on surveys they conducted with hotel managers of hotels in Miami and New York. In Miami, they found that turnover costs added up to roughly $6,000 per worker, among workers who earned $10.00 as an entry wage. In New York, turnover costs added up to between $12,000 and $13,000 per worker, among workers who earned $20.00 as an entry wage. The difference in costs between the two locations reflects cost-of-living differences.
We take these figures and scale them down to reflect turnover costs of a worker in a fast food job with an entry wage of $7.90, i.e., the 10th wage percentile for fast food workers as shown above. Based on these calculations, we approximate turnover costs of around $4,700 per worker. This figure seems conservative (i.e., low) when we compare it to Tracey and Hinkin’s more recent turnover cost estimate of about $5,700 (in 2005 dollars) for “low complexity” hotel jobs in hotels located across the country. We use this figure of $4,700 as the turnover cost per worker separation.
As we noted in the main text, we use the following assumptions to determine the overall cost savings due to lower turnover for each minimum wage level we examine.
1) The separations elasticity, i.e., the change in turnover rate with respect to a change in the minimum wage, equals -0.225 (see Dube, Lester, and Reich, 2013).
2) The current turnover rate in fast food is approximately 120 percent. 3) Current employment in fast food equals 3.8 million.
Table A.3 presents our calculations, based on these figures, to determine the cost savings fast food employers would experience with a higher minimum wage, due to a lower turnover rate among their workers.
TABLE A.3 BELONGS HERE

Pollin and Wicks-Lim “A $15 U.S. Minimum Wage” for PERI Working Paper January 2015 Page 21
REFERENCES
Aaronson, Daniel. 2001. “Price Pass-Through and the Minimum Wage,” The Review of Economics and Statistics, February, 83(1): pp. 158-169.
Aaronson, Daniel, Eric French, James MacDonald. 2008. “The Minimum Wage, Restaurant Prices, and Labor Market Structure,” The Journal of Human Resources, 43(3): pp. 688-720.
Aaronson, Daniel and Brian J. Phelan 2014. “Wage Shocks and Technological Substitution,” preliminary draft (cited with permission), Federal Reserve Bank of Chicago.
Belman, Dale and Paul J. Wolfson. 2014. What does the Minimum Wage Do? Kalamazoo, MI: Upjohn Institute.
Brenner, Mark and Stephanie Luce. 2008. “Living Wage Laws in Practice,” Ch. 10 in Pollin, Brenner, Wicks-Lim and Luce, A Measure of Fairness: The Economics of Living Wages and Minimum Wages in the United States, Ithaca, NY, Cornell University Press.
Doucouliagos, H. and Stanley, T. D. 2009. “Publication Selection Bias in Minimum-Wage Research? A Meta-Regression Analysis,” British Journal of Industrial Relations, 47: pp. 406–428.
Dube, Arindrajit, T. William Lester, and Michael Reich. 2010. “Minimum Wage Effects Across State Borders: Estimates Using Contiguous Counties,” The Review of Economics and Statistics. 92(4): pp. 945-964.
Dube, Arindrajit, Lester T. William, and Michael Reich. 2013. “Minimum Wage Shocks, Employment Flows, and Labor Market Frictions,” Institute for Research on Labor and Employment Working Paper Series, University of California-Berkeley.
Fairris, David, David Runsten, Carolina Briones, and Jessica Goodheart. 2005. Examining the Evidence: The Impact of the Los Angeles Living Wage Ordinance on Workers and Businesses. Los Angeles Living Wage Study.
Hinkin, Timothy R. and J. Bruce Tracey. 2000. “The Cost of Turnover: Putting a Price on the Learning Curve,” Cornell Hotel and Restaurant Administration Quarterly, 41(14) pp. 14-21.
---------. 2006. Development and Use of a Web-Based Tool to Measure the Costs of Employee Turnover: Preliminary Findings. Ithaca, NY: Cornell University School of Hotel Administration Center for Hospitality Research.
Hirsch, Barry T., Bruce Kaufman, and Tetyana Zelenska. 2013. “Minimum Wage Channels of Adjustment.” IZA Discussion Paper No. 6132. Germany: Institute for the Study of Labor.
IBISWorld. 2014. IBISWorld Industry Report 72221a: Fast Food Restaurants in the U.S., October.
MacDonald, James M. and Daniel Aaronson. 2006. “How Firms Construct Price Changes: Evidence from Restaurant Responses to Increased Minimum Wages,” American Journal of Agricultural Economics, 88(2): pp. 292-307.
Neumark, David and William Wascher. 2008. Minimum Wages. Cambridge, MA: The MIT Press.

Pollin and Wicks-Lim “A $15 U.S. Minimum Wage” for PERI Working Paper January 2015 Page 22 Okrent, Abigail, and Julian M. Alston. 2012. “The Demand for Disaggregated Food-Away-From-Home-
Products in the United States,” Economic Research Report Number 139, August, United States Department of Agriculture.
Okrent, Abigail M. and Aylin Kumcu. 2014. “What’s Cooking? Demand for Convenience Foods in the United States,” selected paper presented at the Agricultural and Applied Economics Association’s 2014 AAEA Annual Meeting, Minneapolis, MN, July 27-29, 2014.
Pollin, Robert, Mark Brenner, Jeannette Wicks-Lim and Stephanie Luce. 2008. A Measure of Fairness: The Economics of Living Wages and Minimum Wages in the United States. Ithaca, NY: Cornell University Press.
Reich, Michael, Peter Hall, and Ken Jacobs. 2003. Living Wages and Economic Performance: The San Francisco Airport Model. Berkeley, CA: Institute of Industrial Relations, UC Berkeley.
---------. 2005. “Living Wage Policies at the San Francisco Airport: Impacts on Workers and Businesses,” Industrial Relations, 44(1): pp. 106-138.
Schmitt, John. 2013. “Why Does the Minimum Wage Have No Discernible Effect on Employment?” Washington, DC: Center for Economic and Policy Research, February, http://www.cepr.net/documents/publications/min-wage-2013-02.pdf
Tracey, J. Bruce and Timothy R. Hinkin. 2010. “Contextual Factors and Cost Profiles Associated with Employee Turnover,” [Electronic version]. Retrieved Nov. 2014, from Cornell University, SHA School site: http://scholarship.sha.cornell.edu/348.
Wicks-Lim, Jeannette. 2008. “Mandated Wage Floors and the Wage Structure: New Estimates of Ripple Effects of Minimum Wage Laws,” Chapter 11 in Pollin, Brenner, Wicks-Lim and Luce, A Measure of Fairness: The Economics of Living Wages and Minimum Wages in the United States, Ithaca, NY, Cornell University Press.
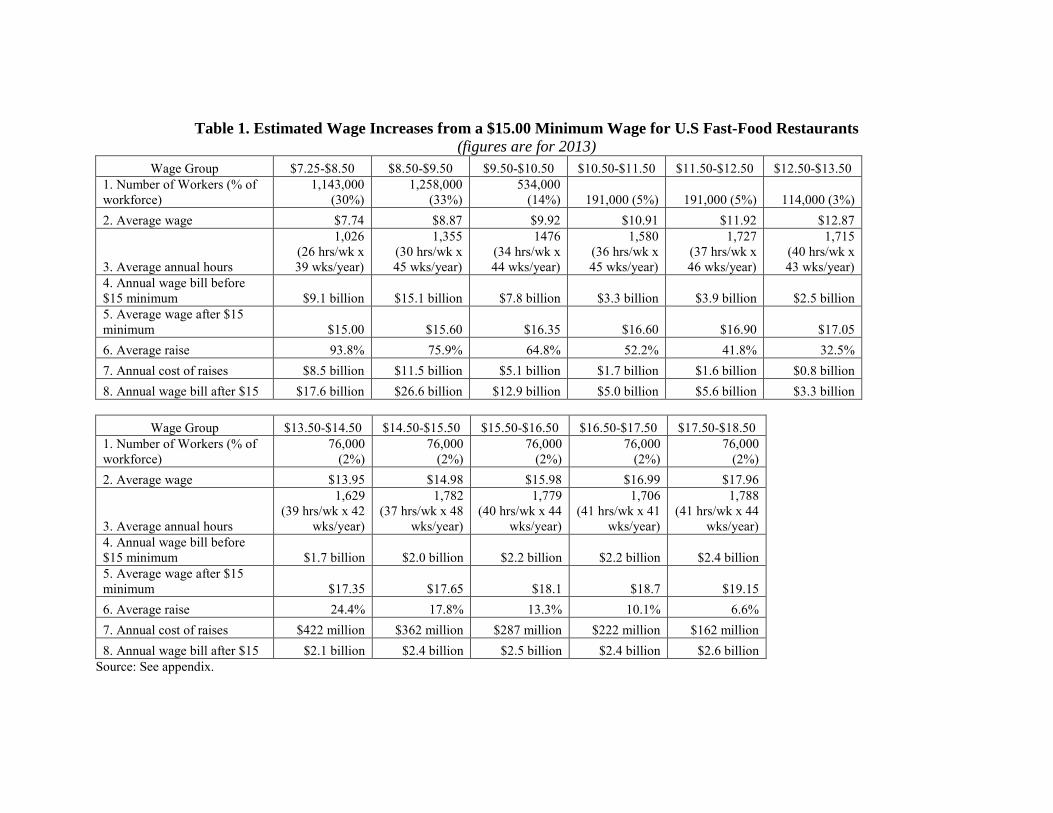
Table 1. Estimated Wage Increases from a $15.00 Minimum Wage for U.S Fast-Food Restaurants (figures are for 2013)
Wage Group $7.25-$8.50 $8.50-$9.50 $9.50-$10.50 $10.50-$11.50 $11.50-$12.50 $12.50-$13.50 1. Number of Workers (% of workforce)
1,143,000 (30%)
1,258,000 (33%)
534,000 (14%) 191,000 (5%) 191,000 (5%) 114,000 (3%)
2. Average wage $7.74 $8.87 $9.92 $10.91 $11.92 $12.87
3. Average annual hours
1,026 (26 hrs/wk x 39 wks/year)
1,355 (30 hrs/wk x 45 wks/year)
1476 (34 hrs/wk x 44 wks/year)
1,580 (36 hrs/wk x 45 wks/year)
1,727 (37 hrs/wk x 46 wks/year)
1,715 (40 hrs/wk x 43 wks/year)
4. Annual wage bill before $15 minimum $9.1 billion $15.1 billion $7.8 billion $3.3 billion $3.9 billion $2.5 billion 5. Average wage after $15 minimum $15.00 $15.60 $16.35 $16.60 $16.90 $17.05 6. Average raise 93.8% 75.9% 64.8% 52.2% 41.8% 32.5% 7. Annual cost of raises $8.5 billion $11.5 billion $5.1 billion $1.7 billion $1.6 billion $0.8 billion 8. Annual wage bill after $15 $17.6 billion $26.6 billion $12.9 billion $5.0 billion $5.6 billion $3.3 billion
Wage Group $13.50-$14.50 $14.50-$15.50 $15.50-$16.50 $16.50-$17.50 $17.50-$18.50
1. Number of Workers (% of workforce)
76,000 (2%)
76,000 (2%)
76,000 (2%)
76,000 (2%)
76,000 (2%)
2. Average wage $13.95 $14.98 $15.98 $16.99 $17.96
3. Average annual hours
1,629 (39 hrs/wk x 42
wks/year)
1,782 (37 hrs/wk x 48
wks/year)
1,779 (40 hrs/wk x 44
wks/year)
1,706 (41 hrs/wk x 41
wks/year)
1,788 (41 hrs/wk x 44
wks/year) 4. Annual wage bill before $15 minimum $1.7 billion $2.0 billion $2.2 billion $2.2 billion $2.4 billion 5. Average wage after $15 minimum $17.35 $17.65 $18.1 $18.7 $19.15 6. Average raise 24.4% 17.8% 13.3% 10.1% 6.6% 7. Annual cost of raises $422 million $362 million $287 million $222 million $162 million 8. Annual wage bill after $15 $2.1 billion $2.4 billion $2.5 billion $2.4 billion $2.6 billion
Source: See appendix.

Table 2. Average Wage Increases Due to a $15.00 Minimum Wage for All Affected U.S. Fast-Food Restaurant Workers
Affected Workers Only Wage Group: $7.25 - $18.50
1. # of Workers 3.8 million
2. # of FTE positions 2.5 million
3. Average wage per FTE job $10.16 4. Annual Wage Bill Before $15 Minimum
(row 3 x row 2 x 2080 annual hours/FTE position) $52.3 billion
5. Avg. Wage per FTE job after $15.00 Min. $16.11
6. Avg. Raise per FTE job (row 5/row 3) 58.6% 7. Annual Cost of Raises
(row 5 x row 2 x 2080 annual hours/FTE position) $30.7 billion
8. Annual Wage Bill After $15.00 Minimum (row 4 + row 7) $83.0 billion
Source: See appendix.

Table 3. Overall Wage Increases in U.S. Fast Food Industry Due to Minimum Wage Rise to $10.50
Affected Workers Only $7.25-$14.50
1. # of Workers 3.5 million
2. # of FTE positions 2.2 million 3. Avg. Wage per FTE position $9.42 4. Annual Wage Bill Before New Minimum $43.5 billion 6. Avg. Wage per FTE After New Min. $10.96 5. Avg. Raise per FTE position 16.0%
7. Annual Cost of Raises $7.1 billion 8. Annual Wage Bill After New Minimum $50.6 billion
Source: See appendix.

Table 4. Total Wage Bill Increases Relative to 2013 Fast-Food Restaurant Sales from Minimum Wage Increases to $10.50 and $15.00 per Hour Minimum Wage at: $10.50 $15.00 1. Total Cost Increase $7.6
billion $33.0 billion
a. Total Wage Increases
$7.1 billion
$30.7 billion
b. + Higher payroll taxes (7.65%)
$0.5 billion
$2.3 billion
2. Total Cost Increase of Private Firms Relative to $232 billion in sales
3.3% 14.2%
Sources: See appendix.
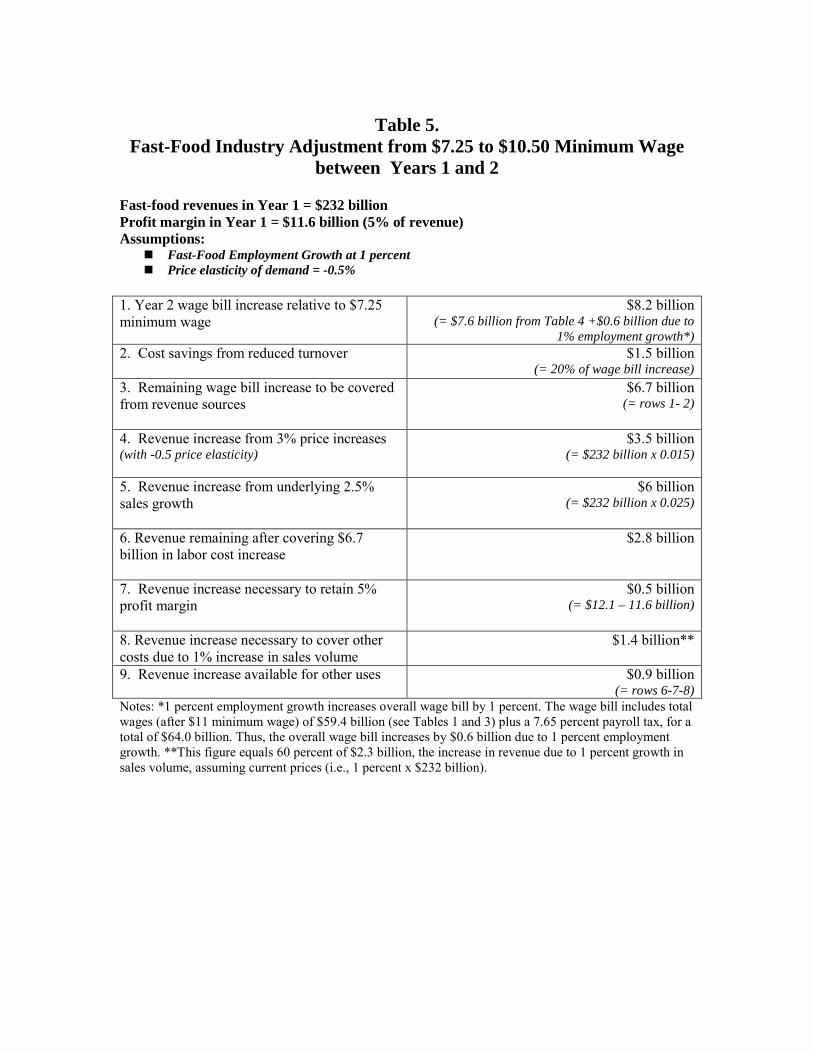
Table 5.
Fast-Food Industry Adjustment from $7.25 to $10.50 Minimum Wage between Years 1 and 2
Fast-food revenues in Year 1 = $232 billion Profit margin in Year 1 = $11.6 billion (5% of revenue) Assumptions:
Fast-Food Employment Growth at 1 percent Price elasticity of demand = -0.5%
1. Year 2 wage bill increase relative to $7.25 minimum wage
$8.2 billion (= $7.6 billion from Table 4 +$0.6 billion due to
1% employment growth*) 2. Cost savings from reduced turnover
$1.5 billion (= 20% of wage bill increase)
3. Remaining wage bill increase to be covered from revenue sources
$6.7 billion (= rows 1- 2)
4. Revenue increase from 3% price increases (with -0.5 price elasticity)
$3.5 billion (= $232 billion x 0.015)
5. Revenue increase from underlying 2.5% sales growth
$6 billion (= $232 billion x 0.025)
6. Revenue remaining after covering $6.7 billion in labor cost increase
$2.8 billion
7. Revenue increase necessary to retain 5% profit margin
$0.5 billion (= $12.1 – 11.6 billion)
8. Revenue increase necessary to cover other costs due to 1% increase in sales volume
$1.4 billion**
9. Revenue increase available for other uses $0.9 billion (= rows 6-7-8)
Notes: *1 percent employment growth increases overall wage bill by 1 percent. The wage bill includes total wages (after $11 minimum wage) of $59.4 billion (see Tables 1 and 3) plus a 7.65 percent payroll tax, for a total of $64.0 billion. Thus, the overall wage bill increases by $0.6 billion due to 1 percent employment growth. **This figure equals 60 percent of $2.3 billion, the increase in revenue due to 1 percent growth in sales volume, assuming current prices (i.e., 1 percent x $232 billion).

Table 6.
Fast-Food Industry Adjustment from $10.50 to $15 Minimum Wage between Years 2 and 5
Fast-food revenues in Year 2 = $241 billion Assumptions: Fast-food employment growth from Years 2 - 5 = 1.0% per year Underlying sales growth from Years 2 - 5 = 2.5% per year Price elasticity of demand = -0.5%
1. Wage bill increase relative to $11 minimum wage
$28.4 billion (= $25.4 billion from Table 4 + $3.0 billion due to
employment growth from years 2 – 5*) 2. Cost savings from reduced turnover
$5.2 billion (= 20% of wage bill increase)
3. Remaining wage bill increase to be covered from revenue sources
$23.2 billion (= rows 1- 2)
4. Revenues in Year 5 with underlying 2.5% annual sales growth and 3% price increases (with -0.5 price elasticity)
$271 billion (= $241 billion * 1.043)
5. Revenue increase in Year 5 relative to Year 2
$30 billion (= $271 - $241 billion)
6. Revenue increase remaining after covering $23.2 billion in labor cost increase
$6.8 billion (= row 5 – 3)
7. Revenue increase necessary to retain 5% profit margin
$1.5 billion (= $13.6 – 12.1 billion)
8. Revenue increase necessary to cover other costs due to 3% increase in sales volume
$4.2 billion**
9. Revenue increase available for other uses $1.1 billion (= rows 6 – 7 - 8)
Notes: *This accounts for the increase in the wage bill, with a $15 minimum, due to a total of 4 percent employment growth net of the wage bill increase due to employment growth accounted for in row 1 of Table 5. The total wage bill includes wages of $83 billion (see Table 2, row 8) plus a 7.65 percent payroll tax, for a total of $86.3 billion. Thus, 4 percent employment growth causes the overall wage bill to increase by $3.6 billion due to 4 percent employment growth (4% x $86.3 billion). ** This figure equals 60 percent of the of $7.0 billion increase in revenue due to 3 percent growth in sales volume from Year 2 to Year 5 assuming current prices (i.e., 3 percent x $232 billion=$7.0 billion).

Table A.1: 2013 Wage Distribution For Limited Service Restaurant Workers (2013$) 10th percentile $7.90
25th percentile $8.36
50th percentile $9.03
75th percentile $9.92
90th percentile $13.07
Mean $9.86 Source: May 2011 OES, adjusted to 2013 using average annual wage growth among average fast food cooks between 2011 and 2013, or 0.5 percent annually.

Table A.2 Changes in Wage Rates Before and After $10.00 San Francisco Living Wage Occupation Minimum entry wage Average wage
Before After Before After Customer service agent $5.75 $10.00 $10.15 $11.85 Administrative/ clerical $7.40 $9.00 $10.90 $13.45 Baggage/ramp agents $6.95 $10.00 $10.50 $12.35 Cabin Cleaners $6.00 $10.00 $9.95 $11.45 Screeners $5.75 $10.00 $6.50 10.05 Skycaps $5.75 $10.00 $6.35 $10.00
Note: This is a reproduction of Table 2 in Reich et al. 2005, p. 110. Prior to the $10.00 living wage, the wage floor (minimum wage) was $5.75. We excluded occupations where the minimum entry wage did not rise to a level near the new $10.00 minimum.

Table A.3. Cost savings due to lower turnover rate at $10.50 and $15 minimum wages 1. Minimum Wage:
$10.50 $15.00
2. % Minimum Wage Increase
45% 107%
3. % Change in Turnover Rate (Row 2 x -0.225)
-10% -24%
4. Percentage point change in industry turnover rate (Row 3 x 120%)
-12% -29%
5. Number of fewer worker separations based on 3.8 million workers
456,000 1.1 million
6. Cost savings (Row 5 x $4,700)
$2.1 billion $5.2 billion
As % of wage bill increase due to higher minimum wage
28% (=$2.1 b./ $7.6 b.)
16% (=$5.2 b./ $33.0 b.)