national minimum wage
DESCRIPTION
National Minimum Wage. A2 Economics revision presentation on the theory and practice of the UK National Minimum Wage. Some historical background. 1909: minimum wages first introduced, covering the “sweated trades” (via Wages Boards/Councils). - PowerPoint PPT PresentationTRANSCRIPT

A2 Economics revision
presentation on the theory and practice of the UK National
Minimum Wage
National Minimum Wage

Some historical background
• 1909: minimum wages first introduced, covering the “sweated trades” (via Wages Boards/Councils).
• 1986 – 1993: decline and abolition of Wages Councils (covered 10% of workers at abolition).
• 1993 – 1999: no minimum wage except in agriculture.
• 1999: introduction of National Minimum Wage (NMW).
• Monitored by Low Pay Commission (made up of employer reps, trade union reps and independents).

The changing NMW in the UK
Year Adult NMW rate
£ per hour
Rate as % of median wage
1999 3.60 45.6
2000 3.70 45.3
2001 4.10 48.0
2002 4.20 47.2
2003 4.50 48.6
2004 4.85 50.5
2005 5.05 50.5

Setting a pay floor
• What is the economic case for a minimum wage?
• Has the minimum wage in the UK proved to be a success?
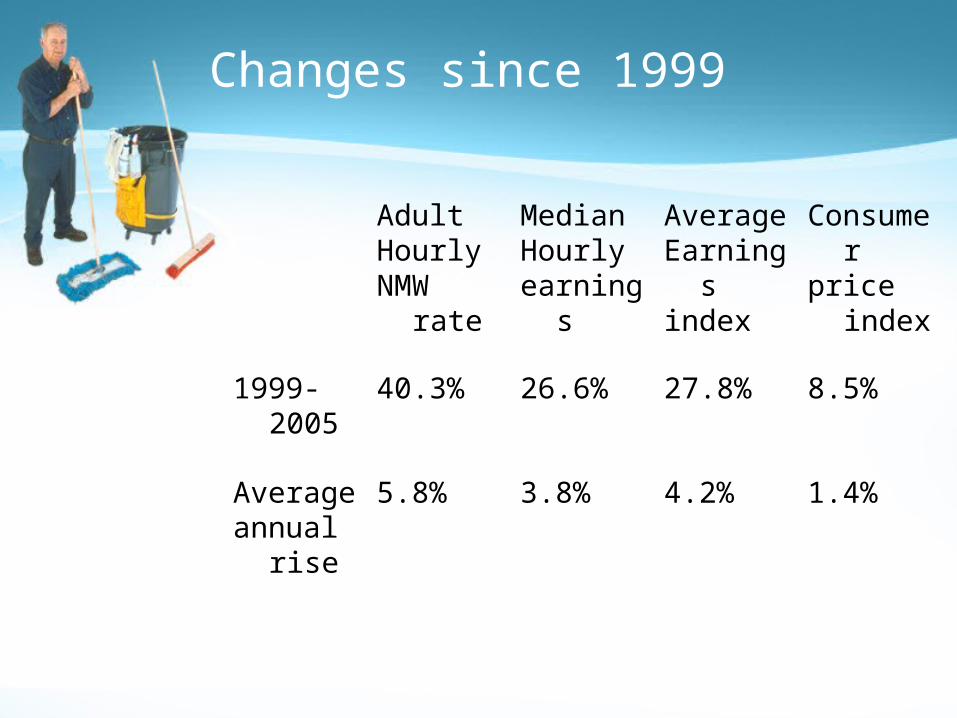
Changes since 1999
AdultHourlyNMW
rate
MedianHourlyearnings
AverageEarningsindex
Consumerprice
index
1999-2005
40.3% 26.6% 27.8% 8.5%
Averageannual
rise
5.8% 3.8% 4.2% 1.4%

What is a National Minimum Wage?
• NMW is a statutory “pay floor”
• Tips can be included in minimum wage calculations if they are paid through the PAYE system and appear on salary slips
• NMW needs to be set above the normal free market wage to have an direct effect on the labour market
• Employers are not allowed to “undercut” the NMW
• Employers are prosecuted if they do not pay the NMW
• Most other countries have something similar
• No commitment to an annual up-rating in line with prices or earnings

Who have been the main beneficiaries?
• According to the Low Pay Commission:
• Main occupations affected: Hospitality, retail, cleaning, hairdressing, health and social work sectors
• Three-quarters (77%) of NMW workers are women
• Half (49%) are part-time workers
• More than two-fifths (43%) of NMW workers are both female and part-time.
• Disproportionately young workers (24% are under25 years of age)
• NMW has helped to narrow (slightly) the gender wage gap at the bottom of earnings distribution

Aims/Advantages of a Minimum Wage
• (1) Reduce exploitation of lower paid workers (e.g. where there is little or no trade union protection)
• (2) Reduce the scale of relative poverty & inequality by boosting incomes of low income households
• (3) Reverse the effects of employer discrimination (e.g. help to close the gender pay gap)
• (4) Improve incentives for people to find work and reduce benefit dependency by raising the “return to working”
• (5) Expand the aggregate labour supply – this helps to boost economic growth in the long term (outward shift of PPF)
• (6) The NMW should reduce the need for low paid workers to claim “top-up state benefits” such as income support and council tax benefit
• (7) A NMW might reduce rates of labour turnover in many jobs

The Low Pay Unit’s View
The Low Pay Unit has always argued that advanced industrial societies like Britain have a duty to ensure that all their people have the right to a just and favourable remuneration for the work they do
Markets can respond to any number of different influences and stimuli, but they never respond to genuine need.
Therefore, the only equitable mechanism for ensuring minimum standards in the labour market is a statutory national minimum wage
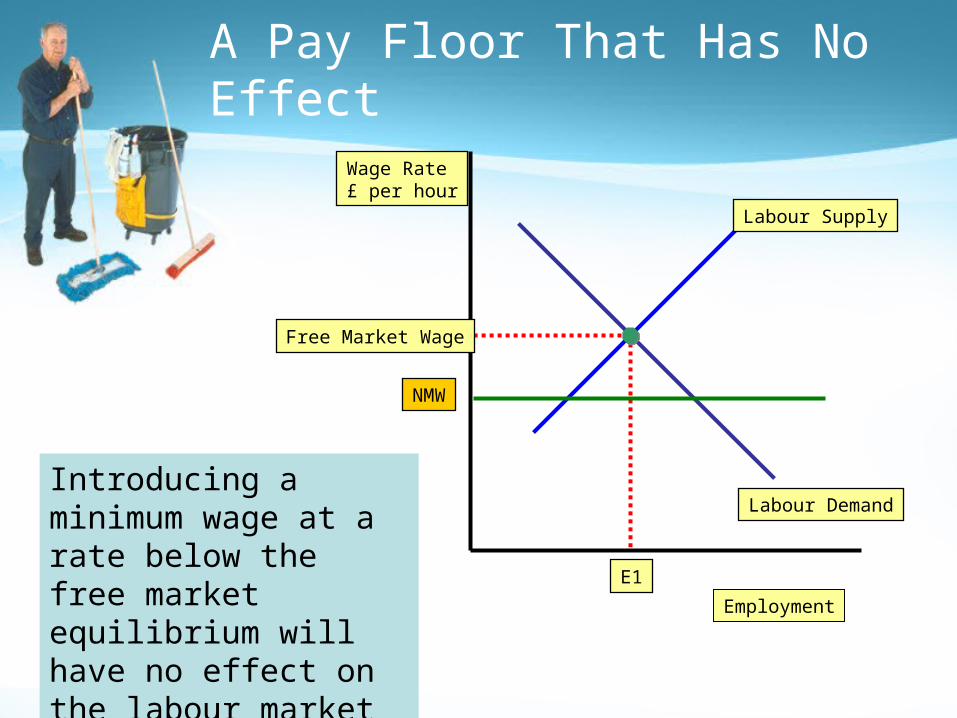
A Pay Floor That Has No Effect
Employment
Wage Rate £ per hour
Labour Demand
Labour Supply
Free Market Wage
E1
NMW
Introducing a minimum wage at a rate below the free market equilibrium will have no effect on the labour market

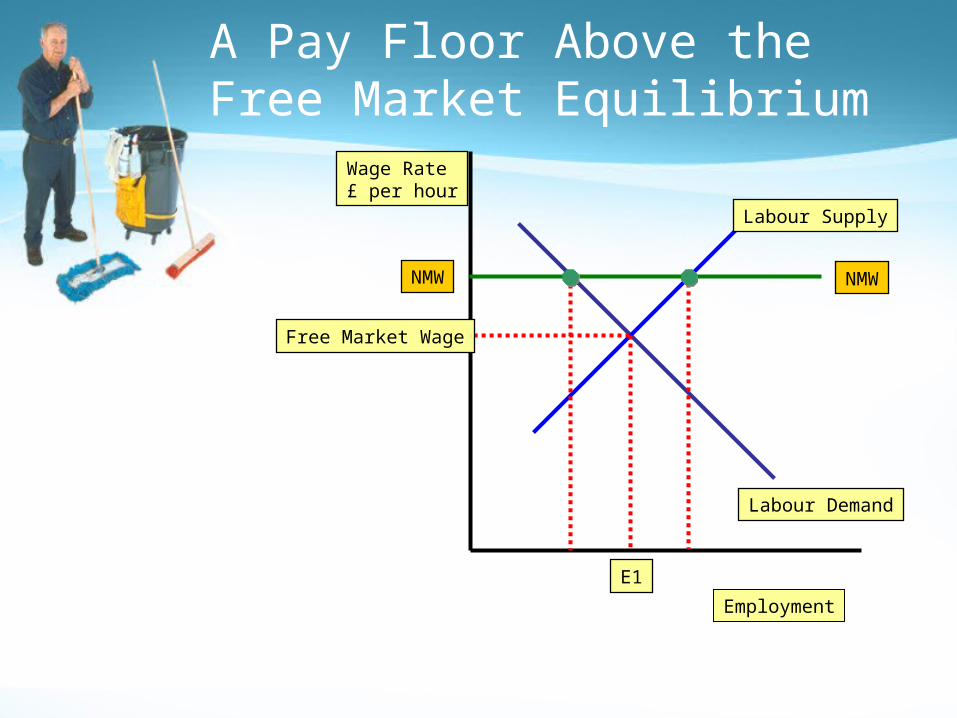
A Pay Floor Above the Free Market Equilibrium
Employment
Wage Rate £ per hour
Labour Demand
Labour Supply
Free Market Wage
E1
NMW NMW
A Pay Floor Above the Free Market Equilibrium
Employment
Wage Rate £ per hour
Labour Demand
Labour Supply
Free Market Wage
E1
NMW NMW

A Pay Floor Above the Free Market Equilibrium
Employment
Wage Rate £ per hour
Excess Supply
Labour Demand
Labour Supply
Free Market Wage
E1
NMW NMW
E2E2

A Pay Floor Above the Free Market Equilibrium
Employment
Wage Rate £ per hour
Excess Supply
Labour Demand
Labour Supply
Free Market Wage
E1
NMW NMW
E2E2
A minimum wage set above the free market wage may have the effect of creating an excess supply of labour at the ruling pay floor
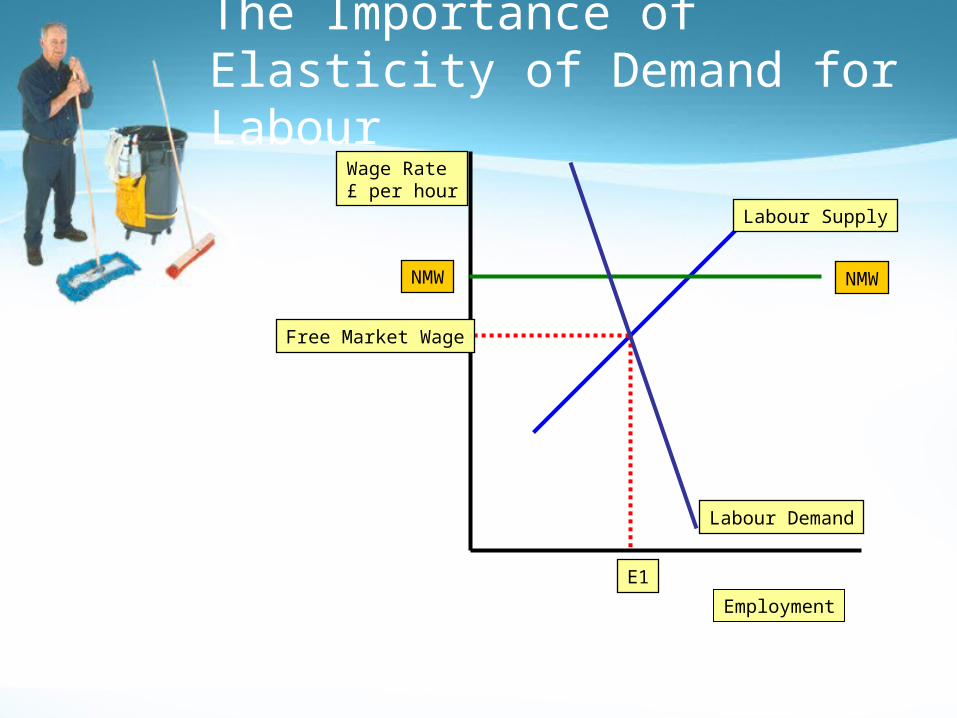
The Importance of Elasticity of Demand for Labour
Employment
Wage Rate £ per hour
Labour Demand
Labour Supply
Free Market Wage
E1
NMW NMW

The Importance of Elasticity of Demand for Labour
Employment
Wage Rate £ per hour
Labour Demand
Labour Supply
Free Market Wage
E1
NMW NMW
E2E2

The Importance of Elasticity of Demand for Labour
Employment
Wage Rate £ per hour
Labour Demand
Labour Supply
Free Market Wage
E1
NMW NMW
E2E2
When labour demand is inelastic, the employment effects of a NMW are less pronounced – perhaps because businesses feel able to pass on the higher costs to final consumers

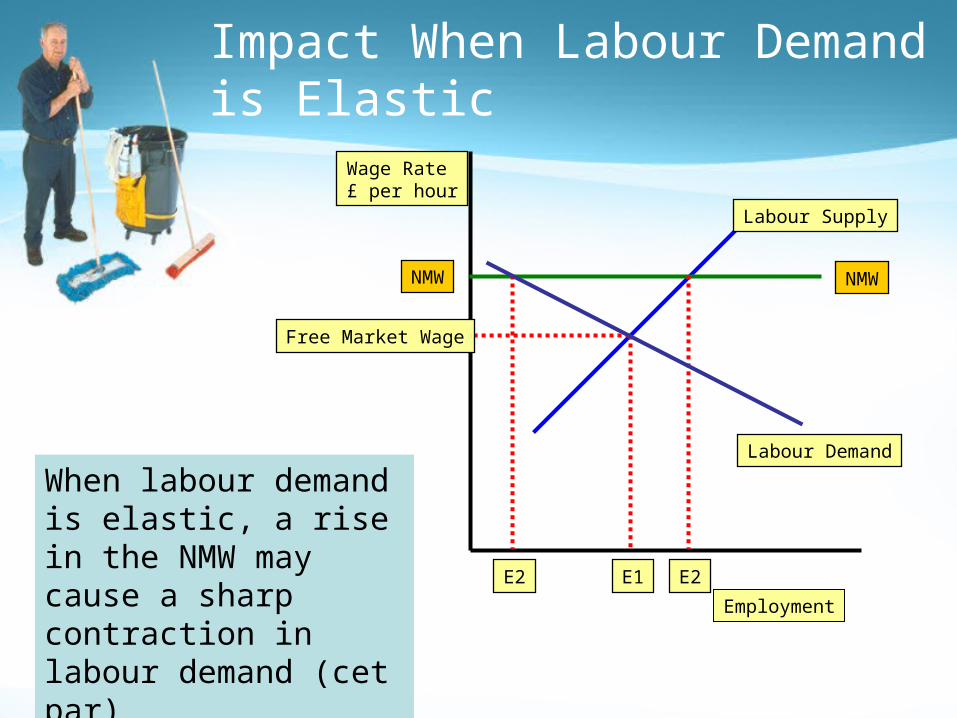
Impact When Labour Demand is Elastic
Employment
Wage Rate £ per hour
Labour Demand
Labour Supply
Free Market Wage
E1
NMW NMW

Impact When Labour Demand is Elastic
Employment
Wage Rate £ per hour
Labour Demand
Labour Supply
Free Market Wage
E1
NMW NMW
E2E2
Impact When Labour Demand is Elastic
Employment
Wage Rate £ per hour
Labour Demand
Labour Supply
Free Market Wage
E1
NMW NMW
E2E2
When labour demand is elastic, a rise in the NMW may cause a sharp contraction in labour demand (cet par)

A Rise in Labour Productivity or Higher Demand
Employment
Wage Rate £ per hour
LD1
Labour Supply
Free Market Wage
E1
NMW NMW

Employment
Wage Rate £ per hour
LD1
Labour Supply
Free Market Wage
E1
NMW NMW
LD2
A Rise in Labour Productivity or Higher Demand

A Rise in Labour Productivity or Higher Demand
Employment
Wage Rate £ per hour
LD1
Labour Supply
Free Market Wage
E1
NMW NMW
E2
LD2

A Rise in Labour Productivity or Higher Demand
If workers become more productive, then the unit cost of what they produce at a given wage rate will go down. This may cause an outward shift in labour demand – and possible a higher level of employment despite the NMW Employment
Wage Rate £ per hour
LD1
Labour Supply
Free Market Wage
E1
NMW NMW
E2
LD2

Disadvantages of a National Minimum Wage
• (1) Fall in employment due to higher wage costs
• (2) Danger of “pay-leapfrogging” as workers seek to maintain existing wage differentials
• (3) Risk of higher wage inflation (higher interest rates?)
• (4) Damages competitiveness of some firms
• (5) The NMW is not the most effective way to reduce relative poverty
• (6) Free-market economists believe that a NMW creates artificial distortions in the way the labour market works – let wages find their own level – a source of government failure?

Evaluation: Alternatives to the National Minimum Wage
• Low wage subsidies
• Tax breaks for low-income families
– (i) earned income tax credit
– (ii) provides an incentive to seek and then hold a job
• Improve education (e.g. secondary schooling)

People on wages close to the NMW

Financial Times on the Minimum Wage
• “Statutory minimum wages should be safety nets, not incomes policies. They can tidy up the low-wage end of the labour market by stopping monopsonistic employers - those with buying power - using their control over workers to hold down pay. They cannot and should not be used to engineer substantial redistributions of income. That way higher unemployment lies.
• The rises so far, which have taken the adult minimum rate from £3.60 to £4.85, have had little apparent effect on employment - not least because, thanks to inadequate wage data, initial rates turned out to cover far fewer workers than expected. But the era of repeated large increases in the minimum is likely to be drawing to an end."

Further recent evidence
• Many companies set their own minimum wages higher than the national rate, according to the Labour Market Trends survey
• Employers tend to pay at least £5.50 or £6 an hour rather than the national minimum wage (NMW) of £5.05 per hour for workers over the age of 22, the research revealed.
• The higher rates indicate that companies would rather set their own rates of pay at round numbers and absorb the extra labour costs
• The NMW is due to rise to £5.35 an hour (for employees over the age of 22) in October 2006 and to £4.45 an hour (up from £4.25) for 18-21 year olds.

Low Pay
• Estimates from the Annual Survey of Hours and Earnings show that the number of jobs paid below the national minimum wage in the UK was 327,000 in Spring 2005, amounting to 1.3 per cent of all jobs in the labour market.