does the minimum wage bite? - economics · does the minimum wage bite into fast-food prices? ......
TRANSCRIPT

Does the Minimum Wage Bite into Fast-Food Prices?∗
Emek Basker†
University of MissouriMuhammad Taimur KhanIslamic Development Bank
January 2016
Abstract
We study the effect of increases in effective minimum wages on the prices ofseveral fast-food items using quarterly city-level data from 1993-2014, a periodduring much of which the federal minimum wage declined in real value whilestate-level legislation flourished. For one product, a burger, we find a robustprice elasticity of 9% with respect to the minimum wage. This estimate indicatessubstantial cost pass-through when contextualized by the effect of minimum-wage increases on restaurant wage bills. Our estimate for pizza is suggestiveof a similarly large pass-through rate but is less precisely estimated, and ourestimate for fried chicken is near zero, but estimated even less precisely. Takenas a whole, our estimates point toward sizable cost pass-through of minimumwage increases to consumer prices. These results contribute to a mixed literatureon the consumer burden of minimum wage increases.
JEL Codes: J31, L81
Keywords: Minimum wage, fast food, restaurants, pass-through, prices
∗The authors declare that they have no conflict of interest. We thank C.Y. Choi, Dean Frutiger, WenSun, and Erol Yildirim for help with the C2ER data; and Dan Aaronson, Saku Aura, Peter Klein, CoryKoedel, Mark Lewis, Jeff Milyo, Peter Mueser, and David Neumark for helpful comments and conversations.†Corresponding author; [email protected]
1 Introduction
A panel appointed by New York governor Andrew Cuomo recently recommended that New
York increase the minimum wage paid to fast-food workers who work for chains with at least
30 locations, to $15 an hour (McGeehan, 2015). Other cities, including Seattle and Los An-
geles, have already implemented similar increases. Although there is an extensive literature
on the effects of minimum-wage increases on low-skilled workers’ wages and employment
rates, relatively little attention has been paid to estimating the pass-through of these in-
creases to consumer prices (Neumark and Wascher, 2008; Lemos, 2008). The elasticity of
prices with respect to the minimum wage matters because it has distributional implications
and represents a potential channel for inflationary effects of labor policy.
In this paper, we analyze the effects of minimum-wage increases on prices of three fast-
food products — burgers, fried chicken, and pizza — using data from the last twenty years,
which include significant variation in minimum wages both over time and across locations.
We find large point estimates for the first two products: elasticity estimates of 0.09 and 0.08,
respectively, both of which imply large cost pass-through. The estimate of the elasticity of
the burger price is fairly precise, with a standard error of about 0.03, while the estimate for
pizza is much noisier. For the third product, fried chicken, our standard errors are also quite
large, and although our point estimate is small and negative, the confidence interval does not
rule out a large pass-through effect. We also estimate the price effects of the minimum wage
using two other datasets, the food-away-from-home CPI from the Bureau of Labor Statistics
and the average price of a meal from the Census of Accommodation and Foodservices, and
find similar results.
Earlier papers that address this question include Aaronson (2001), Card and Krueger
(1994), and Katz and Krueger (1992). Aaronson (2001), which is most similar to our paper,
uses data from 1978–1995 and finds an elasticity of fast-food prices with respect to the
minimum wage ranging from 0.07 to 0.16. Katz and Krueger’s (1992) point estimates are not
statistically significant, leading them to conclude that prices are unaffected by the minimum
wage, but their standard errors are large and their point estimates do not rule out large
effects. Card and Krueger (1994) report that their results are “mixed” because in some
specifications their coefficients are not statistically significant; but again, in these cases their
standard errors are quite large and do not rule out substantial cost pass-through. In a related
paper, Aaronson, French, and MacDonald (2008) focus on the price effects of the federal
minimum-wage increases in 1996-97 and find price elasticities around 0.07. MacDonald and
Aaronson (2006) find that pass-through in aggregate prices is quite fast, although individual
establishments may not adjust all prices immediately. Finally, in a case study of the early
effect of San Francisco’s “living wage” legislation, Dube, Naidu, and Reich (2007) find a
price elasticity of about 0.06 for fast-food outlets.
In the years since those papers were written there was substantial erosion in the federal
minimum wage and significant activity at the state level. The federal minimum wage fell
more than 25% in real terms between September 1997 and July 2007. In response, many
states increased their minimum wages, providing rich variation for estimating price effects
using a full difference-in-difference framework, unlike earlier studies, which are limited by
relatively few state-level changes in minimum-wage legislation.
As a result, compared to earlier studies, our dataset is significantly more comprehensive,
including five federal minimum-wage increases and over 300 state or local increases. This
allows us to estimate flexible difference-in-difference specifications that control for many
unobserved factors other studies have had to assume away. This is an advantage in particular
over the dataset used by Aaronson (2001), in which identification relies primarily on increases
in the federal minimum wage.
To determine the degree of pass-through, we also estimate the effect of the minimum
wage on restaurant wage bills. We find that the elasticity of the state-level wage bill of
limited-service restaurants with respect to the minimum wage is around 0.16. A back-of-the-
envelope calculation suggests that, if the labor share of marginal cost is about 50%, fast-food
restaurants are fully passing through their cost increases to consumer prices.
2

2 Data
We obtained minimum-wage data from several sources. Federal minimum-wage rates and
enactment dates come from the U.S. Department of Labor’s website, which also includes
historical state minimum-wage data but without the enactment dates. We corroborated
the data with history of state minimum-wage enactment dates from Fiscal Policy Institute
(2006) for 1996-2006 as well as from state governments’ websites for the remaining years to
form a comprehensive dataset with state minimum-wage rates and their enactment dates
from 1993-2014. The minimum-wage data are described in detail in Appendix A.1.1
We use city-level average-price data for the period 1993-2014 from the Council for Com-
munity and Economic Research (C2ER, formerly the American Chamber of Commerce Re-
search Association, or ACCRA). The data are updated quarterly, in the first week of each
quarter (in January, April, July, and October). For this analysis, we use C2ER’s city-level
average prices of three fast-food items over the period 1993-2014. These data are also used in
Aaronson’s (2001) study. The products are a McDonald’s Quarter Pounder (“McD burger”),
13 inch thin-crust regular cheese pizza at Pizza Hut and/or Pizza Inn (“pizza”), and fried
chicken drumstick and thigh at Kentucky Fried Chicken and/or Church’s Fried Chicken
(“KFC fried chicken”); the product definitions are consistent over time and across states.
Price surveyors at participating Chambers of Commerce are instructed to survey at least five
and up to ten McDonald’s, Pizza Hut and/or Pizza Inn, and Kentucky Fried Chicken and/or
Church’s Fried Chicken establishments in town, if possible. More details on the C2ER data
are available in Appendix A.2.2
1The minimum wage does not apply to all workers. In many states tipped workers’ cash wages may fallbelow the state’s regular minimum wage, as long as the sum of cash wages and tips meets the minimum-wagestandard. However, tipping is very unusual in the fast-food sector, and we believe our minimum-wage dataappropriately capture the relevant wage floor (Even and Macpherson, 2014; Allegretto, 2013). Jones (2015)provides evidence on the effect of the tipped minimum wage on the wages of restaurant servers.
2City-level C2ER data have been used for a variety of economic studies in the past, including studies ofsupermarket financing (Chevalier, 1995; Chevalier and Scharfstein, 1996); price convergence and deviationsfrom the “law of one price” (Parsley and Wei, 1996; Choi and Wu, 2012); inequality (Frankel and Gould,2001); and the impact of retailer entry on prices (Basker, 2005; Courtemanche and Carden, 2014).
3

Aaronson (2001) raises several concerns about the ACCRA/C2ER data. First, he notes
that C2ER does not aim for consistency in its product definitions over time, focusing instead
on cross-sectional consistency; as a result, survey participants vary from quarter to quarter.
While the product definitions of the fast-food items in this study have not changed over
this period, the specific outlets surveyed may have changed, which could result in spurious
variation over time in the average price of a specific item in a given city. Second, the quarterly
frequency of C2ER data makes it difficult to determine whether prices respond immediately
to a minimum-wage increase. Because C2ER prices are always collected in the first week of
the quarter, and minimum-wage increase almost always become effective on the first day of
the quarter, a lag in price adjustment of just a few days delays our observation of the price
increase by a full quarter.
Aaronson (2001) partially addresses the first concern by smoothing out the price series
to remove temporary price changes of more than 5% that quickly return to their prior
levels. We have estimated all our regressions using this smoothing procedure, but as it did
not meaningfully change either point estimates or significance levels, we report only the
unadjusted regressions.
Like Aaronson (2001), we supplement the price analysis by using the BLS “food-away-
from-home” CPI as a second measure of prices, this one at the Metropolitan Statistical Area
(MSA) level. Because many of the BLS cities are actually multi-state metro areas (e.g.,
Washington-Baltimore, DC-MD-VA-WV; New York-Northern New Jersey-Long Island, NY-
NJ-CT-PA), and are subject to different minimum wages in different parts of the metro
area at any given point in time, we conduct the CPI analysis using two different samples.
The first sample includes only MSAs that are entirely inside one state, and the second adds
MSAs that span state lines; in the latter case, we use the average minimum wages across the
states in the MSA.3 We also estimate the regressions using two data frequencies: monthly
3This is less of an issue for Aaronson’s analysis, since he focuses on the effect of federal rather thanstate-level minimum-wage hikes.
4

and annual, because many MSAs have data only bimonthly or quarterly. The monthly
single-state MSA dataset includes only ten MSAs in eight states, and only one of these (Los
Angeles-Riverside-Orange County, CA) has monthly CPI data for the full twenty-year period
of our sample. Monthly data are available for at least some months in five additional MSAs
that span two or more states. Annual CPI data have somewhat better coverage: 17 MSAs
in 13 states contained entirely within a state have an annual “food-away-from-home” CPI
for all or part of the time period; of these, and nine additional MSAs that span two ore more
states have annual data available.
A final source of price data is the Census of Accommodation and Foodservices (CAF)
from 1997, 2002, and 2007. In each of those years, the CAF questionnaire sent to most
restaurants asks the restaurant to report the average price of a meal that year at that
restaurant. Published reports from the CAF provide, by state, the number of restaurants re-
porting average prices in several ranges, and the total revenues of restaurants in each of these
price-range categories. This information is reported separately for full-service restaurants
(NAICS 722110) and limited-service restaurants (NAICS 722211).4 From this information,
we construct the fraction of restaurant revenues earned at restaurants with average meal
price below $5, below $10, and below $15. On average across the three years for which we
have data, and excluding cells with suppressed information, 3% of full-service restaurants’
revenues are earned by restaurants with an average meal price under $5; 44% are earned
by restaurants with an average meal price under $10; and 71% by restaurants with average
meal price below $15. The respective shares for limited-service restaurants are 44%, 91%,
and 98%.
We also use payroll data from state-level County Business Patterns (CBP) data from
4The Census Bureau includes fast-food restaurants in NAICS 722211. This category excludes bars,cafeterias, ice-cream parlors, coffee shops, and food trucks, all of which are classified elsewhere. Datafor 2002 and 2007 are available from American Fact Finder at http://factfinder.census.gov/faces/
nav/jsf/pages/index.xhtml. Data for 1997 are available from the publication “1997 Economic Census:Accommodation and Foodservices: Subject Series,” Table 8.
5
1993 to 2012. CBP data are annual and include full-year and first-quarter payroll paid by
business establishments, by state and industry. Until 1997, the data are reported using the
Standard Industrial Classification (SIC) system, and we use payroll by SIC 5800 establish-
ments (eating and drinking places). Starting in 1998, the reporting is done using the North
American Industrial Classification System (NAICS), and provides a breakdown of NAICS
722 (all restaurants and drinking places) into multiple subsectors, including NAICS 722110
(full-service restaurants) and NAICS 722211 (limited-service restaurants).5
Because of concerns that state minimum wages are procyclical, which may cause a spuri-
ous positive relationship between minimum wages and restaurant payrolls, payroll regressions
include the log of current and lagged per-capita state-level GDP (Gross State Product, or
GSP) from the Bureau of Economic Analysis in chained 2009 dollars as a control variable.
This variable is calculated on an SIC basis to 1996 and on a NAICS basis from 1997. GSP per
capita ranges from $25,000 (in 2009 dollars) to $72,000, with an average of about $43,000.
Four states, Alaska, Connecticut, North Dakota, and Wyoming, have GSP per capita above
$67,000 for one or more years during the sample period; and four others, Arkansas, Mis-
sissippi, Montana, and West Virginia, have GSP per capita below $28,000 for one or more
years. The year-to-year growth rate of per-capita GSP averages 1.5% over this sample; eight
states experienced growth above 9% at some point during the sample and five experienced
a decline greater than 9% at some point.
5Establishment payroll includes “all forms of compensation, such as salaries, wages, commissions, dis-missal pay, bonuses, vacation allowances, sick-leave pay, and employee contributions to qualified pensionplans paid during the year to all employees [. . . as well as] amounts paid to officers and executives [of corpora-tions, . . . but excluding] profit or other compensation of [the owner or owners of unincorporated businesses].”Source: http://www.census.gov/econ/cbp/definitions.htm, accessed August 19, 2013. Starting in 2012,full-service restaurants’ NAICS changed to 722511 and limited-service restaurants’ NAICS code changed to722513.
6
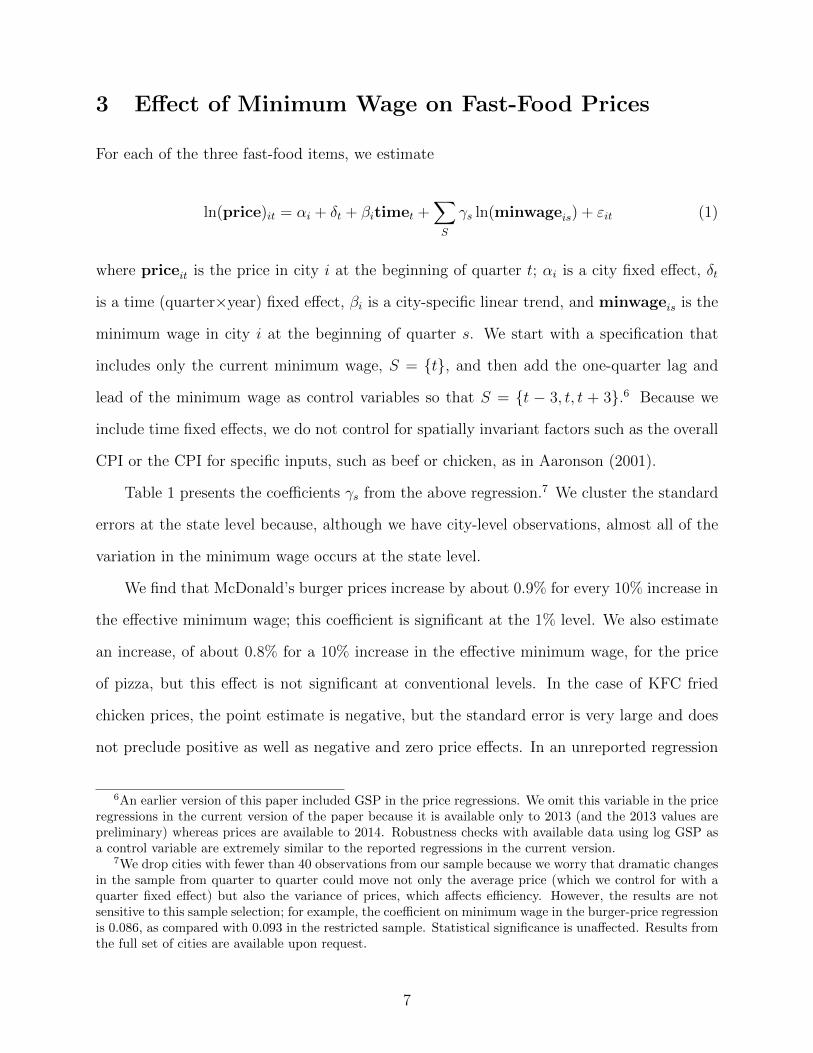
3 Effect of Minimum Wage on Fast-Food Prices
For each of the three fast-food items, we estimate
ln(price)it = αi + δt + βitimet +∑S
γs ln(minwageis) + εit (1)
where priceit is the price in city i at the beginning of quarter t; αi is a city fixed effect, δt
is a time (quarter×year) fixed effect, βi is a city-specific linear trend, and minwageis is the
minimum wage in city i at the beginning of quarter s. We start with a specification that
includes only the current minimum wage, S = {t}, and then add the one-quarter lag and
lead of the minimum wage as control variables so that S = {t − 3, t, t + 3}.6 Because we
include time fixed effects, we do not control for spatially invariant factors such as the overall
CPI or the CPI for specific inputs, such as beef or chicken, as in Aaronson (2001).
Table 1 presents the coefficients γs from the above regression.7 We cluster the standard
errors at the state level because, although we have city-level observations, almost all of the
variation in the minimum wage occurs at the state level.
We find that McDonald’s burger prices increase by about 0.9% for every 10% increase in
the effective minimum wage; this coefficient is significant at the 1% level. We also estimate
an increase, of about 0.8% for a 10% increase in the effective minimum wage, for the price
of pizza, but this effect is not significant at conventional levels. In the case of KFC fried
chicken prices, the point estimate is negative, but the standard error is very large and does
not preclude positive as well as negative and zero price effects. In an unreported regression
6An earlier version of this paper included GSP in the price regressions. We omit this variable in the priceregressions in the current version of the paper because it is available only to 2013 (and the 2013 values arepreliminary) whereas prices are available to 2014. Robustness checks with available data using log GSP asa control variable are extremely similar to the reported regressions in the current version.
7We drop cities with fewer than 40 observations from our sample because we worry that dramatic changesin the sample from quarter to quarter could move not only the average price (which we control for with aquarter fixed effect) but also the variance of prices, which affects efficiency. However, the results are notsensitive to this sample selection; for example, the coefficient on minimum wage in the burger-price regressionis 0.086, as compared with 0.093 in the restricted sample. Statistical significance is unaffected. Results fromthe full set of cities are available upon request.
7
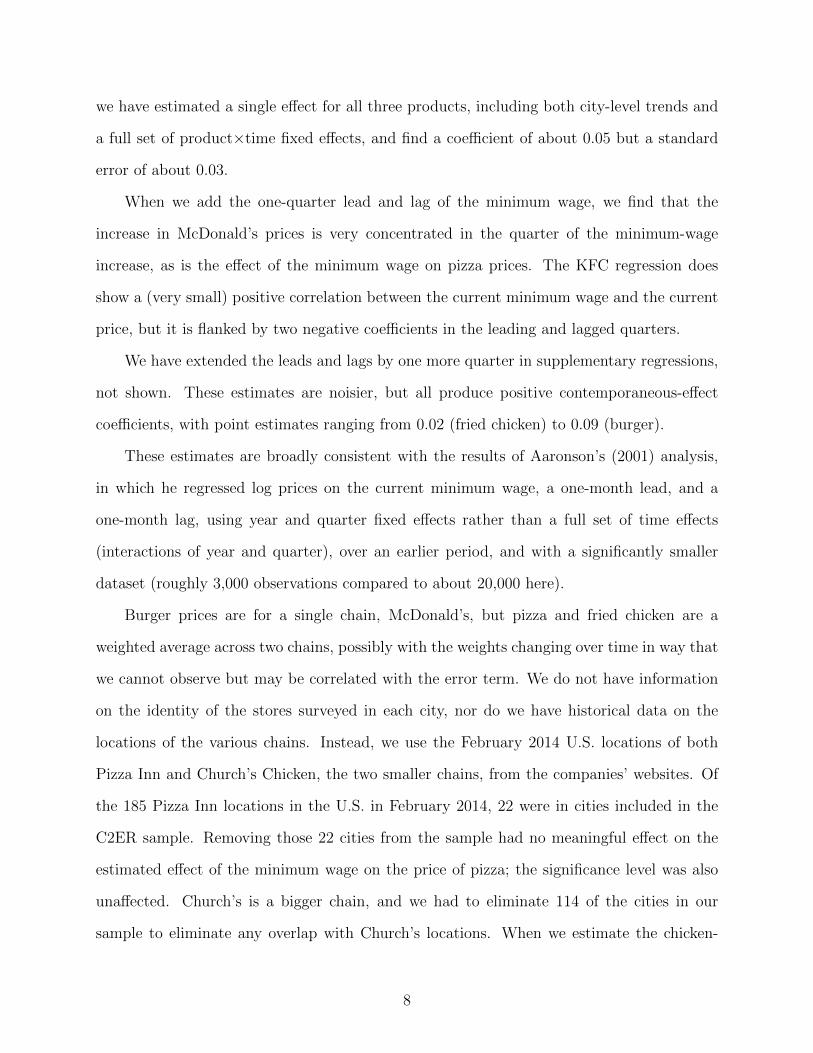
we have estimated a single effect for all three products, including both city-level trends and
a full set of product×time fixed effects, and find a coefficient of about 0.05 but a standard
error of about 0.03.
When we add the one-quarter lead and lag of the minimum wage, we find that the
increase in McDonald’s prices is very concentrated in the quarter of the minimum-wage
increase, as is the effect of the minimum wage on pizza prices. The KFC regression does
show a (very small) positive correlation between the current minimum wage and the current
price, but it is flanked by two negative coefficients in the leading and lagged quarters.
We have extended the leads and lags by one more quarter in supplementary regressions,
not shown. These estimates are noisier, but all produce positive contemporaneous-effect
coefficients, with point estimates ranging from 0.02 (fried chicken) to 0.09 (burger).
These estimates are broadly consistent with the results of Aaronson’s (2001) analysis,
in which he regressed log prices on the current minimum wage, a one-month lead, and a
one-month lag, using year and quarter fixed effects rather than a full set of time effects
(interactions of year and quarter), over an earlier period, and with a significantly smaller
dataset (roughly 3,000 observations compared to about 20,000 here).
Burger prices are for a single chain, McDonald’s, but pizza and fried chicken are a
weighted average across two chains, possibly with the weights changing over time in way that
we cannot observe but may be correlated with the error term. We do not have information
on the identity of the stores surveyed in each city, nor do we have historical data on the
locations of the various chains. Instead, we use the February 2014 U.S. locations of both
Pizza Inn and Church’s Chicken, the two smaller chains, from the companies’ websites. Of
the 185 Pizza Inn locations in the U.S. in February 2014, 22 were in cities included in the
C2ER sample. Removing those 22 cities from the sample had no meaningful effect on the
estimated effect of the minimum wage on the price of pizza; the significance level was also
unaffected. Church’s is a bigger chain, and we had to eliminate 114 of the cities in our
sample to eliminate any overlap with Church’s locations. When we estimate the chicken-
8

price regression excluding cities in which Church’s may have been surveyed, the coefficient
on the minimum wage increases from −0.03 to +0.03, but it remains imprecisely estimated.
We conclude that the confounding of multiple chains is not driving the pizza-price results,
but may have contributed to the negative estimate in the chicken-price regressions.
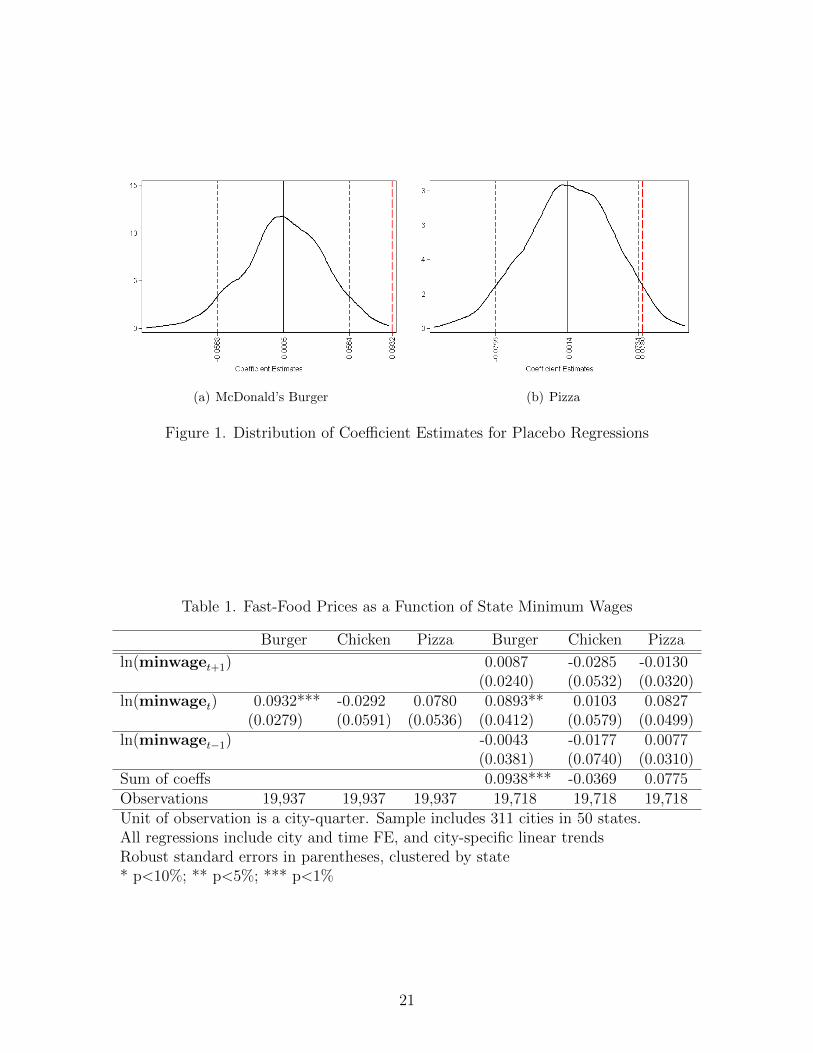
To test whether our results are spurious, we run a placebo exercise in which we assign
states’ minimum-wage histories randomly, with replacement, following Bertrand, Duflo, and
Mullainathan (2004). In each of 1,000 simulations, we put probability 1/50 on each of the 50
states, and use the selected state’s entire vector of minimum-wage history, then re-estimate
Equation (1). Using the price of a burger on the LHS, the mean of the 1,000 coefficient
estimates we obtain is 0.0005, or nearly zero; the range of estimates we obtain in these
simulations is −0.1177 to 0.0901: all fall below 0.0932, the point estimate from Equation (1).
A kernel density of these placebo estimates is shown in Figure 1(a). A solid vertical line
represents zero; dashed vertical lines are also shown at the 5th percentile, the mean, and the
95th percentile of the distribution; and a bold vertical line is shown at 0.0932. We conclude
that the clustered OLS standard errors are not under-estimated, and that the effect we
estimate is not spurious. Figure 1(b) shows the distribution of the placebo coefficients for
pizza; the point estimate from the OLS regression, 0.0780, exceeds the 95th percentile of the
distribution of placebo coefficients and is in that sense significant at the 10% level.8
As another robustness check, we also estimated the model using the BLS “food-away-
from-home” CPI. As noted earlier, we have monthly data for part or all of the sample period
from only ten MSAs in eight states that are contained entirely within a single state, and for
8The point estimate of the fried-chicken effect is below the mean of the falsification-exercise distribution;to save space we do not include it here. In unreported robustness checks, we have also removed the city-specific trends; the estimated pass-through of the minimum wage to pizza decreases in this specification,from a statistically insignificant 0.08 to a statistically insignificant 0.02; the estimated effect for burgerprices increases, from 0.09 to 0.11, and remains significant at the 1% level. We have also attempted tocontrol for time-varying city-level conditions by including the city’s unemployment rate, as reported by theBureau of Labor Statistics. City-level monthly unemployment rates are available for 280 of the 311 cities inour sample. These results are qualitatively and quantitatively almost identical to the estimates without theadditional control.
9

15 MSAs altogether. We have annual data for 17 single-state MSA in 13 states, and for 26
MSAs including ones that span state lines. Because of the limited number of observations
in this analysis, we estimate a simplified version of Equation (1), including only MSA and
time fixed effects as covariates.
These results are shown in Table 2. Not surprisingly, since we cluster standard errors at
the state level, the power in these regressions is quite limited, but they are broadly consistent
with the product-level regressions presented earlier.9 The monthly model with only single-
state MSAs, which has only ten MSAs in nine states, generates a near-zero point estimate
on the log of the minimum wages, but the estimated elasticities in the other three models —
respectively, monthly data for 15 MSAs, annual data for 17 single-state MSAs, and annual
data for 26 MSAs — are all positive and in the range of 0.03-0.05. Because clustered standard
errors in models with few clusters are known to be biased downwards, we also include in
the table the bootstrapped p-values from a percentile-t bootstrap (see Cameron and Miller,
2015, for a discussion).
Finally, we use the CAF data to estimate the effect of a minimum-wage increase on the
relative number of different types of restaurants. Since we have only three years of data at
the state level, we estimate
fractionit = αi + δt + γ ln(minwageit) + εit (2)
where fractionit is the fraction of restaurant revenues earned by restaurants whose prices
fall below $5, $10, or $15, respectively. These results are shown in Table 3. Given the small
number of observations per state, the power of this regression is limited, but the results are
consistent with our earlier findings. The one statistically significant coefficient (significant
9In the regressions that include MSAs spanning state borders, we use the mean of the logged minimumwages of all the states in the MSA as the LHS variable, and we cluster on “super-states,” a partition ofstates constructed so that no MSA crosses super-state lines and no further partition is possible withoutlosing this property. The largest super-state includes 12 states and five MSAs from Washington-Baltimoreto Boston-Brockton-Nashua.
10
at the 5% level) shows that a 10% increase in the minimum wage decreases the share of
restaurant sales at restaurants charging less than $10 per meal by about 1%.
4 Pass-through
We assume that marginal cost is composed of two separable components: a labor cost per
unit of output, which depends on the minimum wage, and a cost of supplies (beef, lettuce,
etc.), which is independent of the minimum wage. To calculate pass-through, we must first
determine the relative importance of these two separate components of marginal cost, and
then determine how much the labor portion increases with the minimum wage.
There are no definitive estimates of the labor share of marginal cost, so we approximate
these with the labor share of average costs. According to the 2002 Census of Business
Expenses (CBE), of a total of nearly $93 billion in operating expenses for limited-service
restaurants (NAICS 7222), payroll accounted for 41.8% and employer costs for fringe benefits
accounted for another 5.9%, totaling 47.7%.10
For the second task, we use annual data from the CBP, which includes, at the state
level, annual and first-quarter payroll figures for various restaurant subsectors. We estimate
ln(pay)it = αi + δt +βitimet +γ ln(minwageit) +ρ0 ln(GSPjt) +ρ1 ln(GSPj,t−1) + εit (3)
where payit is either real annual or real first-quarter payroll in state i in year t, and δt is a
year fixed effect. The minimum wage in year t is calculated as the algebraic average of the
12 monthly minimum wages in the state; and the first-quarter minimum wage is calculated
as the algebraic average of the three monthly minimum wages in the first quarter.
We estimate this regression separately for all restaurants and drinking places, full-service
restaurants, and limited-service restaurants. We have data on the first starting in 1993, but
10Available at: http://www2.census.gov/retail/releases/benchmark/2002_bes.pdf, Table 21. Ac-cessed December 20, 2014.
11

the breakdown by service level is only available starting in 1998. The results are reported
in Table 4. Our preferred specification uses first-quarter data since the minimum wage is
measured with less error in that specification (minimum-wage increases rarely occur within
a quarter). We find that total state-wide restaurant payroll increases by 1.4% for every 10%
increase in the average state effective minimum wage.
When we break down the payroll effect by type of restaurant, it is clear that the effect
on full-service restaurants is somewhat smaller — close to 1.1% — than the effect on limited-
service restaurants, which is 1.6%.11
Putting these all together, we can perform the following back-of-the-envelope calculation:
If payroll costs at limited-service restaurants increase by 1.6% for a 10% increase in the
minimum wage, and marginal cost consists of approximately 50% labor cost, then marginal
cost increases by 0.8% for every 10% increase in the minimum wage. Our finding that prices
increase by approximately that much implies, then, a full pass-through of minimum wages
to consumer prices.12
One concern about the above calculation is that minimum-wage increases may cause
hiring managers to change employment levels, thereby changing the labor share of marginal
costs endogenously. To assess the possible magnitude of this effect we have also estimated
Equation (3) replacing log payroll with log restaurant employment on the LHS, again from
CBP figures. The estimated elasticity of aggregate restaurant employment with respect to
the minimum wage is negative, ranging from −0.03 to −0.05, but statistically insignificant.
This is consistent with a competitive-labor-market model in which labor demand is very
11The coefficients on current and lagged gross state product (not shown) are all positive and statisticallysignificant. The elasticity of restaurant payroll with respect to current GSP ranges from 0.27-0.29, dependingon the specification, and is significant at least at the 5% level in all specifications. The elasticity of restaurantpayroll with respect to lagged GSP ranges from 0.31-0.39 and is significant at the 1% level except in allspecifications.
12If minimum-wage increases affect the labor costs of workers further up the supply chain — in theharvesting, warehousing, distributing of the raw food, for example — and are passed through in the cost ofraw materials for food production, then our calculation overstates the pass-through of the minimum wagein the fast-food sector.
12

inelastic. Although we cannot extrapolate to the effect of large changes in the minimum
wage, within the range of the increases in the 20-year period covered by this study, the effect
on employment is very small.
5 Concluding Remarks
We find robust, economically meaningful, and statistically significant effects of changes in the
effective minimum wage on the price of a burger; a slightly smaller and marginally significant
estimate of the effect on the price of pizza; and a very imprecise estimate of the effect on the
price of fried chicken. In making inferences from these estimates, we place the most weight
on the most precise estimate, an elasticity of 9%.
Our findings imply a full pass-through of that higher costs of production to consumers
in the form of higher prices. Even so, from a consumer’s standpoint, the price increases
are small. Our estimates imply that a 33% increase in the federal minimum wage, from
$7.25/hour to $10.10/hour, as has been proposed, could increase prices of fast-food and
similarly unskilled-labor intensive goods by 3% in the 27 states for which the federal minimum
wage is the effective minimum wage (as of December 2014), and by a lesser but still positive
amount in the remaining 23 states.
Even with full pass-through, the income effect of this price increase is likely to be very
small. The average price of a burger in 2014, according to the C2ER data used in this paper,
was approximately $3.77. A 3% increase in this price amounts to only about 10 cents.13 At
the extreme, consider a minimum-wage earner who eats a McDonald’s burger every single
day. If the minimum wage increases $7.25/hour to $10.10/hour, her monthly expenditure
13The predictive power of our estimates is strongest in the range over which we identify these estimates.The real minimum wage, in December 2014 dollars, ranges in our sample from $5.80 to $9.51, with theinterquartile range roughly between $6.70 and $7.70. If the minimum wage were to increase dramatically, to$15 per hour, as some have suggested, we expect its effect on all outcome variables to be magnified, but wecannot accurately predict the magnitude of the effect.
13

on burgers will increase by about $3 per month, an increase that is nearly fully offset by the
increase in just one hour’s earnings.
Moreover, the elasticity we estimate for these products is an upper bound on the over-
all price impact of the minimum wage. Fast-food products are most likely to be affected
by minimum-wage increases because the fast-food sector is low-skilled intensive and many
workers in this sector earn the minimum wage. The restaurant sector employs by far the
largest percentage of minimum-wage workers; MaCurdy (2015) estimates, using data from
the 1996 Survey of Income and Program Participation, that nearly 21% of minimum-wage
jobs and 18% of minimum-wage hours are in the restaurant sector. Within the restaurant
sector, low-skilled and low-wage workers are disproportionately employed in the fast-food
sector. In 2011, there were more than 200,000 limited-service restaurants in the U.S., ac-
counting for 37% of all restaurants and bars and for more than 35% of the sector’s employees,
but only 30% of its combined payroll.
The full distributional impact of this finding is indeterminate, because it depends on
expenditure shares of different types of earners in sectors differentially reliant on minimum-
wage earners.14 However, our calculations imply that even a full pass-through of minimum
wages to prices is unlikely to lead to large upward price pressure. Although consumers are
affected by minimum-wage increases, these effects are small relative to the direct wage effects.
14For example, expenditure on food eaten away from home increases with income, but low-income house-holds may spend disproportionately on fast food. We are not aware of any data set that tracks both consumerdemographics and expenditure on food consumed away from home by type of restaurant. The ConsumerExpenditure Survey combines expenditures at table-service restaurants, fast-food restaurants, cafes and barsinto one question.
14

A Data
A.1 Minimum Wages
The federal minimum-wage increased five times during the period of our study: October 1,
1996 (from $4.25 to $4.75 per hour); September 1, 1997 (to $5.15); July 24, 2007 (to $5.85);
July 24, 2008 (to $6.55); and July 24, 2009 (to $7.25). Figure A-1 shows the real federal
minimum wage, in December 2014 dollars, over the period of our study; real (CPI-deflated)
buying power of the minimum wage decreased by more than 25% between September 1997
and July 2007, before rising, in steps, to a level higher than that of September 1997.
Table A-1 lists the number of states (out of 50; Washington DC is omitted from the
data) that are affected in each of these ways by each of the five federal minimum-wage hikes.
This variation in the way the federal minimum wage affects states is at the heart of the
identification strategy of papers that use federal minimum-wage increases to identify the
effect on prices and employment. (To make things more complicated, some states adopted
the federal minimum wage of July 24, 2007, 2008, and 2009 effective July 1 of the same
year.)
Sandwiched between the federal minimum-wage increases are many instances of state
minimum-wage changes. In our analysis, the only minimum-wage changes of economic in-
terest are those where the effective minimum wage in a state changes as a result of either a
federal or a state minimum-wage hike. Figure A-2 shows the effective real minimum wage
in the median state over the same time period, along with the interquartile range. The me-
dian coincides with both the 25th and 75th percentiles of effective minimum wages through
2004. Since January 2005, following increases in the minimum wage in five states (IL, NY,
OR, VT, and WA), the 75th percentile has exceeded the median. From January 2007 until
mid-2009, the 25th percentile of effective minimum wages fell below the median; the federal
minimum-wage hike of July 2009 brought the 25th percentile back to the median, but the
two have since diverged again.
15

A federal minimum-wage hike can change the effective minimum wage in a state if (a)
the state effective minimum wage is set at the old federal level, in which case it receives the
full brunt of the new federal minimum-wage hike; (b) the state’s effective minimum wage is
between the old and the new federal levels, in which case the effective wage floor increases
by less than the full amount of the federal increase; (c) the state’s effective minimum wage
is at or above the new federal level, but state law pegs the state minimum wage at a fixed
level above the federal wage.15 States whose effective minimum wages are at or above the
new federal level and have no mandated contemporaneous increase see no minimum-wage
spikes following an increase in the federal wage floor. The effective minimum wage in a state
also increases when the state raises its minimum-wage level above the federal minimum-wage
rate by passing a law to that effect in the state legislature, or when, due to CPI pegging,
the minimum wage increases automatically on an annual basis. Since there was no federal
minimum-wage hike between 1997 and 2007, some states experienced several minimum-wage
changes during this period while others had no minimum-wage increases. We use this periodic
variability, along with the additional variation provided by the uneven impact of the federal
hikes in 1996, 1997, and the late 2000s, to identify the effects of minimum-wage changes on
prices and isolate them from the effects of other variables changing at the same time.
Table A-2 lists the number of effective minimum-wage increases by state over the period
of our study. A total of 321 instances are listed, two thirds of which are either due to
federal minimum-wage increases or take effect within six months (three months before to
three months after) of a federal increase. One hundred and one increases in 29 states are
completely independent of the federal increases and occur outside the six-month window.
Table A-3 repeats this analysis by year, excluding the federal hikes. We do not see any
minimum-wage increases during 1993; every later year has at least one effective minimum-
15This was the case in Alaska and Connecticut in the 1990s. Connecticut law automatically increases theminimum wage to 0.5% above the federal rate any time the federal minimum wage rate equals or becomeshigher than the state minimum.
16
wage increase, with clusters in years of federal action. On average across all states and
months in our data, a state’s minimum wage is about 4% above the federal level, with the
median state’s minimum wage set at the federal level. Fourteen states had minimum wages
set at or above 130% of the federal level at some point during the sample period, and Oregon
and Washington both exceeded 140% in the months immediately preceding the July 24, 2007
increase in the minimum wage.
For a few cities, we supplement the state and federal data with information on city-level
minimum wages. San Francisco enacted a minimum wage in 2004 and has raised it almost
every year since. Santa Fe also adopted a city minimum wage of $8.50 an hour in June 2004
(Yelowitz, 2005); in 2008, it was expanded to all private employees (prior to that it had only
applied to businesses with 25 or more employees), and has since increased on average every
other year. Finally, Albuquerque, New Mexico, has had a city minimum wage since 2008.16
A.2 Prices
The quarterly C2ER publications are constructed with the help of local Chambers of Com-
merce in participating cities. Prices are collected by local volunteers in the first week of
each quarter. The sample of cities in each quarterly publication varies from issue to issue as
participation in the price survey is strictly voluntary. As a result, some cities participate in
the survey every other quarter, others miss an occasional survey, and still others only report
prices for a few quarters before disappearing from the sample altogether. In 2007, C2ER
stopped collecting fourth-quarter prices, so we have price data for a maximum of 74 quarters
for each product and city. We do not know which, or even how many, outlets were surveyed
16In addition to these cities, Chicago, Oakland, Los Angeles, Seattle, Louisville, Kansas City, and Portland,ME have all adopted higher minimum wage rates that have either taken effect in 2015 or are due to takeeffect in 2016. Other cities, including Washington, DC, are considering such legislation as well.
17

in practice in each city.17,18
Some cities in the C2ER database are actually composites of several nearby cities (for
example Reno-Sparks, NV or Benton Harbor-St. Joseph, MI), but most are stand-alone
cities. A few cities, such as Kansas City and St. Louis, straddle state lines; since we do
not know the exact locations of establishments surveyed in these cities, we drop them to
eliminate ambiguity with respect to the applicable minimum wage.
After dropping any city that is included in the survey in fewer than 40 of the possible
80 quarters, we are left with a dataset that includes 311 cities in all 50 states (the District of
Columbia is omitted because it is part of a multi-state metropolitan area). Twenty nine cities
in 18 states are included in the survey every single quarter, and seven cities in seven states
are included for the minimum of 40 quarters. The real (December 2014 dollars) average
prices and the cross-sectional inter-quartile range for the three products are shown in the
appendix in Figure A-3.19
17According to Info Franchise News, Inc. (2000), Church’s Chicken had, at the time, 593 company-ownedoutlets and 604 franchised outlets; by contrast, KFC had 3,192 company-owned outlets and 6,239 franchisedoutlets. For this reason we refer to their product as “KFC chicken” although both chains are representedin the data. Pizza Inn is listed as having three company-owned outlets and 500 franchised outlets. PizzaHut is not listed in Info Franchise News, Inc. (2000), but Yum! Brands’ annual report for 2000 lists 7,927U.S. outlets. Again, we recognize that establishments from both chains are polled, but suspect the sampleis heavily biased towards Pizza Hut.
18In cities with fewer than five establishments in a given category, all relevant establishments are to besurveyed. In cities with no precise matches (e.g., no McDonald’s outlets), the survey includes the priceof the item at an establishment most closely matching the described item (if one exists); for example, theinstructions say, “If your area doesn’t have even one McDonald’s restaurant, report the average price at ‘fastfood’ restaurants for a hamburger sandwich with a -pound (before cooking) all-beef patty, cheese, pickle,onion, mustard, and ketchup” (ACCRA 2003, p. 2.21).
19The inter-quartile range of the price of pizza converges to a point in the third quarter of 2010, when justover half the cities – 152 of 303 – quoted a price of $10 for a pizza. This is highly unusual, and appears tobe motivated by a chain-wide sale, although we could not find any documentation for it.
18

References
Aaronson, D. (2001) “Price Pass-through and the Minimum Wage,” Review of Economicsand Statistics, 83(1), 158–169.
Aaronson, D., E. French, and J. MacDonald (2008) “The Minimum Wage, Restaurant Prices,and Labor Market Structure,” Journal of Human Resources, 43(3), 688–720.
Allegretto, S. A. (2013) “Waiting for Change: Is it Time to Increase the $2.13 SubminimumWage?,” unpublished paper.
Basker, E. (2005) “Selling a Cheaper Mousetrap: Wal-Mart’s Effect on Retail Prices,” Jour-nal of Urban Economics, 58(2), 203–229.
Bertrand, M., E. Duflo, and S. Mullainathan (2004) “How Much Should We Trust Differences-in-Differences Estimates?,” Quarterly Journal of Economics, 119(1), 249–275.
Cameron, A. C., and D. L. Miller (2015) “A Practitioner’s Guide to Cluster-Robust Infer-ence,” Journal of Human Resources, 50(2), 317–372.
Card, D. E., and A. Krueger (1994) “Minimum Wages and Employment: A Case Study ofthe Fast-Food Industry in New Jersey and Pennsylvania,” American Economic Review,84(4), 772–793.
Chevalier, J. A. (1995) “Do LBO Supermarkets Charge More? An Empirical Analysis of theEffects of LBOs on Supermarket Pricing,” Journal of Finance, 50(4), 1095–1112.
Chevalier, J. A., and D. S. Scharfstein (1996) “Capital-Market Imperfections and Counter-cyclical Markups: Theory and Evidence,” American Economic Review, 86(4), 703–725.
Choi, C.-Y., and J. Wu (2012) “Understanding Retail Price Differences across U.S. Cities:A Tale of Two Frictions,” unpublished paper, University of Texas at Arlington.
Courtemanche, C. J., and A. Carden (2014) “Competing with Costco and Sam’s Club: Ware-house Club Entry and Grocery Prices,” Southern Economic Journal, 80(3), 565–585.
Dube, A., S. Naidu, and M. Reich (2007) “The Economic Effects of a Citywide MinimumWage,” Industrial and Labor Relations Review, 60(4), 522–543.
Even, W. E., and D. A. Macpherson (2014) “The Effect of the Tipped Minimum Wage onEmployees in the U.S. Restaurant Industry,” Southern Economic Journal, 80(3), 633–655.
Fiscal Policy Institute (2006) “States with Minimum Wages above the Federal Level havehad Faster Small Business and Retail Job Growth,” http://www.fiscalpolicy.org/
FPISmallBusinessMinWage.pdf, accessed July 28, 2008.
Frankel, D. M., and E. D. Gould (2001) “The Retail Price of Inequality,” Journal of UrbanEconomics, 49(2), 219–239.
Info Franchise News, Inc. (various years) The 2001 Franchise Annual. Info Press, Inc.
19

Jones, M. R. (2015) “Measuring the Effects of the Tipped Minimum Wage Using W-2 Data,”Unpublished paper, U.S. Census Bureau.
Katz, L. F., and A. B. Krueger (1992) “The Effect of the Minimum Wage on the Fast-FoodIndustry,” Industrial and Labor Relations Review, 46(1), 6–21.
Lemos, S. (2008) “A Survey of the Effects of the Minimum Wage on Prices,” Journal ofEconomic Surveys, 22(1), 187–212.
MacDonald, J. M., and D. Aaronson (2006) “How Firms Construct Price Changes: Evi-dence from Restaurant Responses to Increased Minimum Wages,” American Journal ofAgricultural Economics, 88(2), 292–307.
MaCurdy, T. (2015) “How Effective Is the Minimum Wage at Supporting the Poor?,” Journalof Political Economy, 123(2), 497–545.
McGeehan, P. (2015) “New York Plans $15-an-Hour Minimum Wage for Fast Food Workers,”New York Times, July 22.
Neumark, D., and W. Wascher (2008) Minimum Wages. MIT Press, Cambridge, MA andLondon.
Parsley, D. C., and S.-J. Wei (1996) “Convergence to the Law of One Price without TradeBarriers or Currency Fluctuations,” Quarterly Journal of Economics, 111(4), 1211–1236.
Yelowitz, A. S. (2005) “How Did the $8.50 Citywide Minimum Wage Affect the Santa FeLabor Market? A Comprehensive Examination,” unpublished paper, University of Ken-tucky.
20
(a) McDonald’s Burger (b) Pizza
Figure 1. Distribution of Coefficient Estimates for Placebo Regressions
Table 1. Fast-Food Prices as a Function of State Minimum Wages
Burger Chicken Pizza Burger Chicken Pizza
ln(minwaget+1) 0.0087 -0.0285 -0.0130(0.0240) (0.0532) (0.0320)
ln(minwaget) 0.0932*** -0.0292 0.0780 0.0893** 0.0103 0.0827(0.0279) (0.0591) (0.0536) (0.0412) (0.0579) (0.0499)
ln(minwaget−1) -0.0043 -0.0177 0.0077(0.0381) (0.0740) (0.0310)
Sum of coeffs 0.0938*** -0.0369 0.0775Observations 19,937 19,937 19,937 19,718 19,718 19,718Unit of observation is a city-quarter. Sample includes 311 cities in 50 states.All regressions include city and time FE, and city-specific linear trendsRobust standard errors in parentheses, clustered by state* p<10%; ** p<5%; *** p<1%
21

Table 2. BLS “Food Away from Home” CPI as a Function of State Minimum Wages
(1) (2) (3) (4)
ln(minwaget) -0.0002 0.0478 0.0264 0.0436(0.0240) (0.0476) (0.0280) (0.0331)
Bootstapped Wald-t p-valuea 0.9940 0.8470 0.4980 0.4850Frequency monthly monthly annual annualMSAs 10 15 17 26Includes multistate MSAs N Y N YClusters 8 9 13 12Observations 1,323 2,175 365 563Unit of observation is a MSA-month or MSA-yearAll regressions include MSA and time FERobust standard errors in parentheses, clustered by state/multistate areaa Two-sided p value bootstrapped to correct for small number of clusters
Table 3. Share of Restaurant Sales at Restaurants, by Average Meal Price Range
Full-Service Restaurants Limited-Service RestaurantsUnder $5 Under $10 Under $15 Under $5 Under $10 Under $15
ln(minwaget) 0.0529 0.0513 -0.0392 -0.0495 -0.1048** -0.0207(0.0358) (0.0679) (0.0442) (0.0773) (0.0436) (0.0215)
Observations 136 136 134 127 127 125Unit of observation is a state-year. Sample includes 50 states in 1997, 2002, and 2007.All regressions include state and time FERobust standard errors in parentheses, clustered by state* p<10%; ** p<5%; *** p<1%
Table 4. Restaurant Payroll as a Function of State Minimum Wages
Full-Service Limited-ServiceAll Restaurants Restaurants Restaurants
Annual Q1 Annual Q1 Annual Q1
ln(minwaget) 0.1347*** 0.1402*** 0.0955*** 0.1061*** 0.1303** 0.1607***(0.0364) (0.0320) (0.0354) (0.0378) (0.0488) (0.0469)
Years 1993–2012 1993–2012 1998–2012 1998–2012 1998–2012 1998–2012Observations 1000 1000 750 750 748 748Unit of observation is a state-yearAll regressions include state and time FE, state-specific linear trends, and current
and lagged gross state productRobust standard errors in parentheses, clustered by state* p<10%; ** p<5%; *** p<1%
22
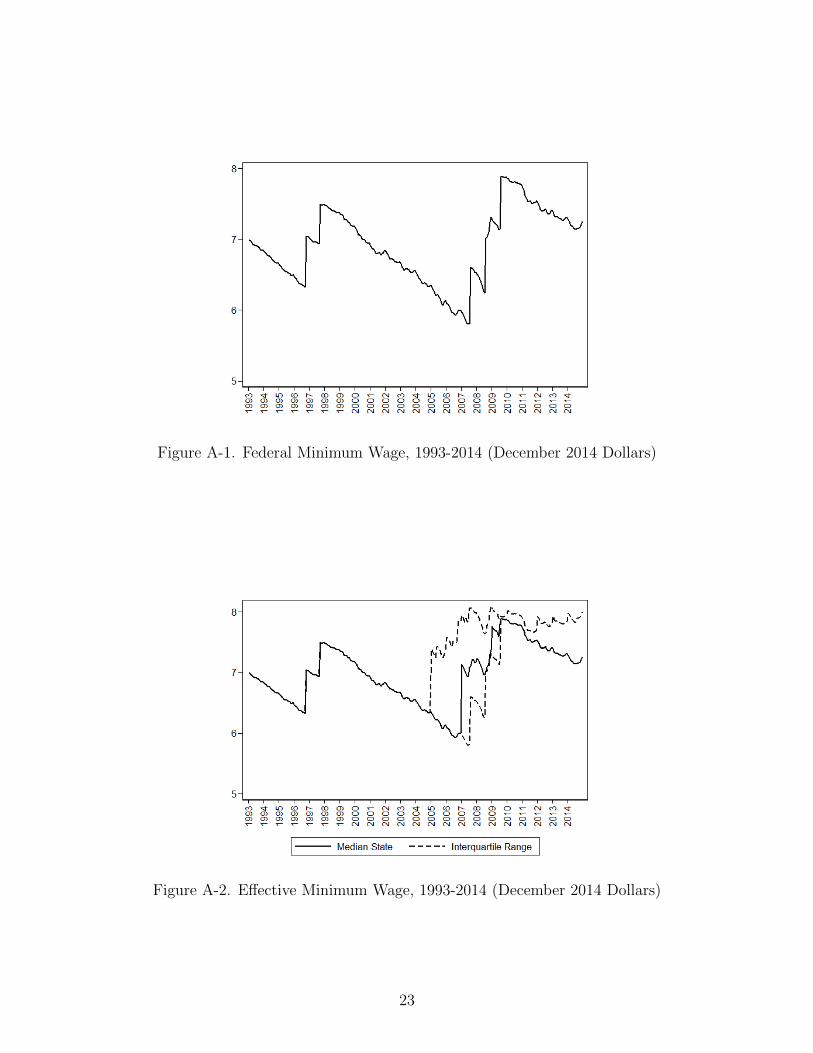
Figure A-1. Federal Minimum Wage, 1993-2014 (December 2014 Dollars)
Figure A-2. Effective Minimum Wage, 1993-2014 (December 2014 Dollars)
23

(a) McDonald’s Burger (b) Pizza
(c) KFC Fried Chicken
Figure A-3. Mean and Inter-Quartile Range of Real Price Series, by Product(December 2014 Dollars)
Table A-1. Number of U.S. States affected by Federal Minimum-Wage Hikes
Full Partial Other NoYear Effect Effect Pega Increaseb Effect
1996 39 2 2 1 61997 39 4 2 1 42007 20 0 0 5 252008 18 7 0 5 202009 23 8 0 2 17Excludes Washington, DCa State minimum wage increases automatically
to stay above the federal levelb Concurrent increase not required to comply
with federal increase
24

Tab
leA
-2.
Min
imum
-Wag
eIn
crea
ses,
by
Sta
te,
1993
–201
4
Excl
udin
gC
han
ges
Excl
udin
gC
han
ges
wit
hin
6M
onth
sof
wit
hin
6M
onth
sof
All
aF
eder
alIn
crea
seA
lla
Fed
eral
Incr
ease
Ave
rage
Ave
rage
Ave
rage
Ave
rage
Num
ber
ofP
erce
nt
Num
ber
ofP
erce
nt
Num
ber
ofP
erce
nt
Num
ber
ofP
erce
nt
Sta
teIn
crea
ses
Incr
ease
Incr
ease
sIn
crea
seSta
teIn
crea
ses
Incr
ease
Incr
ease
sIn
crea
seA
K5
10.6
126
.5M
T11
5.9
55.
6A
L5
11.3
0N
C5
11.4
119
.4A
R5
11.4
121
.4N
D5
11.3
0A
Z9
7.5
58.
0N
E5
11.3
0C
Aa
98.
75
10.4
NH
511
.30
CO
106.
95
8.6
NJ
510
.63
16.5
CT
135.
79
5.1
NM
a6
10.0
0D
E10
6.2
58.
6N
V7
10.0
214
.3F
L11
6.0
66.
1N
Y7
9.6
411
.3G
A5
11.3
0O
H9
7.6
58.
3H
I4
8.4
48.
4O
K5
11.3
0IA
412
.70
OR
144.
810
3.5
ID5
11.3
0P
A5
11.5
121
.4IL
88.
83
9.4
RI
96.
87
6.5
IN5
11.3
0SC
511
.30
KS
511
.30
SD
511
.30
KY
511
.30
TN
511
.30
LA
511
.30
TX
511
.30
MA
611
.14
12.4
UT
511
.30
MD
511
.41
19.4
VA
511
.30
ME
105.
95
5.6
VT
174.
412
4.7
MI
611
.92
22.5
WA
174.
814
4.9
MN
611
.22
14.9
WI
69.
42
12.4
MO
87.
63
9.9
WV
511
.31
13.6
MS
511
.30
WY
511
.30
Tot
al34
712
6E
xcl
udes
Was
hin
gton
,D
C.
The
stat
em
inim
um
wag
eis
the
max
imum
ofth
efe
der
alan
dst
ate
leve
la
Does
not
incl
ude
city
min
imum
-wag
ein
crea
ses
inSan
Fra
nci
sco,
Alb
uquer
que,
and
San
taF
e
25

Table A-3. Minimum-Wage Increases, by Year, 1993–2014
Excluding Changeswithin 6 Months of
All a Federal IncreaseAverage Average
Number of Percent Number of PercentYear Increases Increase Increases Increase1993 0 01994 1 15.3 1 15.31995 2 7.6 2 7.61996 a 3 8.0 2 8.71997 a 8 6.9 01998 2 10.4 1 11.71999 6 9.5 6 9.52000 5 11.0 5 11.02001 5 7.5 5 7.52002 5 7.3 5 7.32003 6 9.1 6 9.12004b,d 7 4.8 7 4.82005b 10 11.5 10 11.52006b,d 15 11.2 15 11.22007 a,b 28 13.8 19 14.22008 a,b,c 21 5.0 02009 a,b,c,d 15 6.3 02010b 5 4.4 2 6.22011b 7 1.4 7 1.42012b,d 8 4.2 8 4.22013b,c,d 10 2.0 10 2.02014b,c,d 17 5.2 17 4.5Excludes Washington, DC, federal, and city-level increases.
The effective minimum wage is the maximum of thefederal and state level
a Year with a federal minimum-wage increaseb Year with minimum-wage increases in San Francisco, CAc Year with minimum-wage increases in Albuquerque, NMd Year with minimum-wage increases in Santa Fe, NM
26