7003 danish taj
TRANSCRIPT
OLD ASIGNMENT ATTEMPTED
Student Name: DANISH TAJ
CMI No: 7650
Course Number and Name: 7003 FINANCIAL MANAGEMENT
Submission Date: 26/07/2010
Plagiarism Statement: I declare that, apart from properly referenced
quotations, this assignment/report is my own work and contains no
plagiarism; it has not been submitted previously for any other assessed unit
on this or other courses.
Candidate Signature: DANISH TAJ

CONTENTS
Introduction
This assignment focuses on the importance of measuring Financial Sources/what is financial
Management within an organization, its importance towards achieving the organization’s
strategic objectives as a whole. It also explains the benefits an organization has by
implementing an efficient and effective performance management system, and describes
one of the tools that can be used in evaluating the performance of different Financial
business functions, teams and individuals within the organization. The management of the
finances of a business / organization in order to achieve financial objectives Taking a
commercial business as the most common organizational structure, the key objectives of
financial management would be to, Create wealth for the business Generate cash, and Provide an
adequate return on investment bearing in mind the risks that the business is taking and the
resources invested There are three key elements to the process of financial managementThey are
some key elements which is necessary for ever firm need to be done for long planning for an
organization..So now we will discuss in this assignment some key elements i,e a firm be able to
analyse its financial data, Be Able To Assess Budgets Based on Financial Data To Support
Organizational Objectives. Be Able To Evaluate Financial Proposals For Expenditure
Submitted By others.
It points out different factors which influence the firm Financial performance of individuals within the team. It briefs about one of the systems to be used in evaluating Financial performance of the firm/team members and attempts to explain how to deal with underperforming individuals within the organization/team.
Be Able To Analyze Financial Data.
1.1 Obtain latest available financial statements of a public company of your choice. Analyze the financial data by calculating following types of ratios; Profitability ratios Liquidity ratios Efficiency ratios Investment ratios
The answer should show the formula of the ratio, the figures selected from the financial statements, and the ratio so obtained.
1.2 Make comments on the financial health of the organization on the basis of the information obtained in response to 1.1 above.
The answer should comprise of about 700 words, and contain references to the ratios calculated.
1.3 Do you think the financial statements have been based on financial data gathered according to generally accepted principles? Comment by citing some of the figures. The answer should comprise of about 300 words
Be Able To Assess Budgets Based on Financial Data To Support Organizational Objectives.
2.1 On the basis of following expected achievements and constraints prepare budgeted income statements for next three accounting years of the company you have chosen for question 1.
1. Sale revenue will increase by 20% each year 2. Closing inventory will be increased by 5% each year 3. Gross profit ratio will remain the same over these years. 4. The purchase budget will be adjusted to achieve the objectives set in the above
mentioned three items of information 5. All operating expenses will increase by 5 percent per year.
Tax rate will be 30%of the taxable income.
6. Dividends paid will also increase by 5% each year
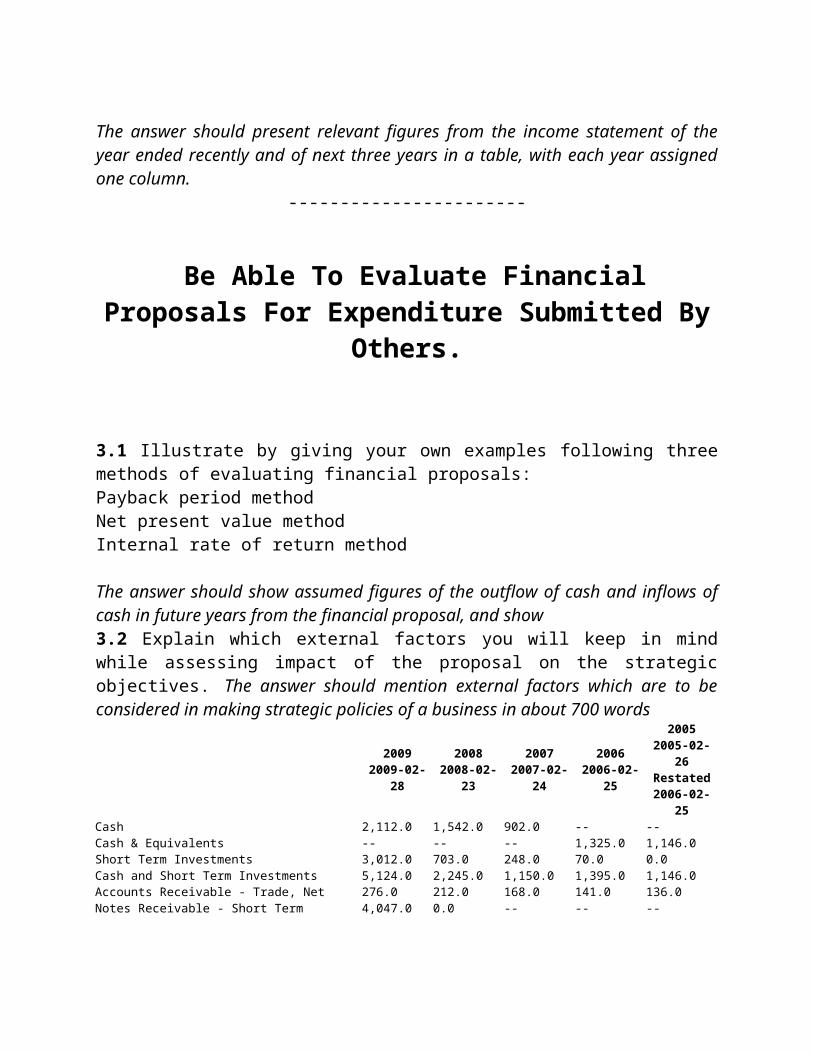
The answer should present relevant figures from the income statement of the year ended recently and of next three years in a table, with each year assigned one column.
‐‐‐‐‐‐‐‐‐‐‐‐‐‐‐‐‐‐‐‐‐‐‐
Be Able To Evaluate Financial Proposals For Expenditure Submitted By Others.
3.1 Illustrate by giving your own examples following three methods of evaluating financial proposals: Payback period method Net present value method Internal rate of return method
The answer should show assumed figures of the outflow of cash and inflows of cash in future years from the financial proposal, and show 3.2 Explain which external factors you will keep in mind while assessing impact of the proposal on the strategic objectives. The answer should mention external factors which are to be considered in making strategic policies of a business in about 700 words
20092009-02-28
20082008-02-23
20072007-02-24
20062006-02-25
20052005-02-26Restated
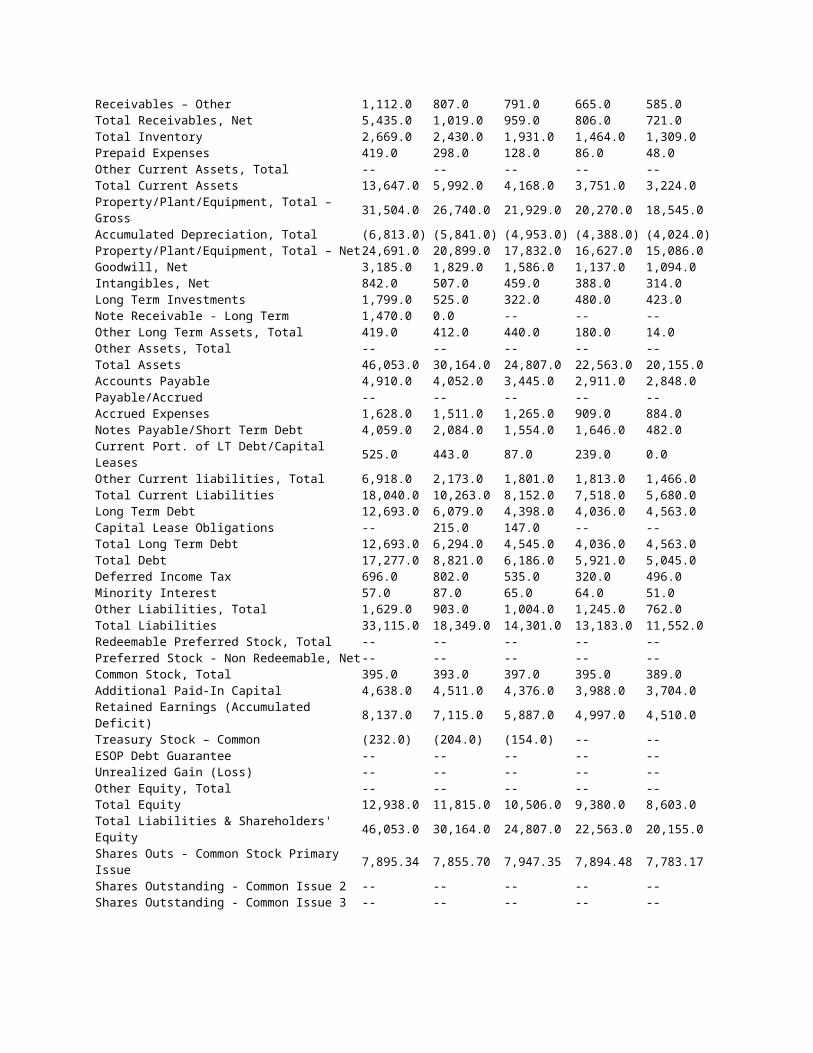
2006-02-25Cash 2,112.0 1,542.0 902.0 -- --Cash & Equivalents -- -- -- 1,325.0 1,146.0Short Term Investments 3,012.0 703.0 248.0 70.0 0.0Cash and Short Term Investments 5,124.0 2,245.0 1,150.0 1,395.0 1,146.0Accounts Receivable - Trade, Net 276.0 212.0 168.0 141.0 136.0Notes Receivable - Short Term 4,047.0 0.0 -- -- --Receivables – Other 1,112.0 807.0 791.0 665.0 585.0Total Receivables, Net 5,435.0 1,019.0 959.0 806.0 721.0Total Inventory 2,669.0 2,430.0 1,931.0 1,464.0 1,309.0Prepaid Expenses 419.0 298.0 128.0 86.0 48.0Other Current Assets, Total -- -- -- -- --Total Current Assets 13,647.0 5,992.0 4,168.0 3,751.0 3,224.0Property/Plant/Equipment, Total – Gross 31,504.0 26,740.0 21,929.0 20,270.0 18,545.0Accumulated Depreciation, Total (6,813.0) (5,841.0) (4,953.0) (4,388.0) (4,024.0)Property/Plant/Equipment, Total – Net 24,691.0 20,899.0 17,832.0 16,627.0 15,086.0Goodwill, Net 3,185.0 1,829.0 1,586.0 1,137.0 1,094.0Intangibles, Net 842.0 507.0 459.0 388.0 314.0Long Term Investments 1,799.0 525.0 322.0 480.0 423.0Note Receivable - Long Term 1,470.0 0.0 -- -- --Other Long Term Assets, Total 419.0 412.0 440.0 180.0 14.0Other Assets, Total -- -- -- -- --Total Assets 46,053.0 30,164.0 24,807.0 22,563.0 20,155.0Accounts Payable 4,910.0 4,052.0 3,445.0 2,911.0 2,848.0Payable/Accrued -- -- -- -- --Accrued Expenses 1,628.0 1,511.0 1,265.0 909.0 884.0Notes Payable/Short Term Debt 4,059.0 2,084.0 1,554.0 1,646.0 482.0Current Port. of LT Debt/Capital Leases 525.0 443.0 87.0 239.0 0.0Other Current liabilities, Total 6,918.0 2,173.0 1,801.0 1,813.0 1,466.0Total Current Liabilities 18,040.0 10,263.0 8,152.0 7,518.0 5,680.0Long Term Debt 12,693.0 6,079.0 4,398.0 4,036.0 4,563.0Capital Lease Obligations -- 215.0 147.0 -- --Total Long Term Debt 12,693.0 6,294.0 4,545.0 4,036.0 4,563.0Total Debt 17,277.0 8,821.0 6,186.0 5,921.0 5,045.0Deferred Income Tax 696.0 802.0 535.0 320.0 496.0Minority Interest 57.0 87.0 65.0 64.0 51.0Other Liabilities, Total 1,629.0 903.0 1,004.0 1,245.0 762.0Total Liabilities 33,115.0 18,349.0 14,301.0 13,183.0 11,552.0Redeemable Preferred Stock, Total -- -- -- -- --
Preferred Stock - Non Redeemable, Net -- -- -- -- --Common Stock, Total 395.0 393.0 397.0 395.0 389.0Additional Paid-In Capital 4,638.0 4,511.0 4,376.0 3,988.0 3,704.0Retained Earnings (Accumulated Deficit) 8,137.0 7,115.0 5,887.0 4,997.0 4,510.0Treasury Stock – Common (232.0) (204.0) (154.0) -- --ESOP Debt Guarantee -- -- -- -- --Unrealized Gain (Loss) -- -- -- -- --Other Equity, Total -- -- -- -- --Total Equity 12,938.0 11,815.0 10,506.0 9,380.0 8,603.0Total Liabilities & Shareholders' Equity 46,053.0 30,164.0 24,807.0 22,563.0 20,155.0Shares Outs - Common Stock Primary Issue 7,895.34 7,855.70 7,947.35 7,894.48 7,783.17Shares Outstanding - Common Issue 2 -- -- -- -- --Shares Outstanding - Common Issue 3 -- -- -- -- --Shares Outstanding - Common Issue 4 -- -- -- -- --Total Common Shares Outstanding 7,895.34 7,855.70 7,947.35 7,894.48 7,783.17Total Preferred Shares Outstanding -- -- -- -- --
http://www.reuters.com/finance/stocks/incomeStatement?stmtType=BAL&perType=ANN&symbol=TSCO.L
Profitability ratios
The profitability ratios and other ratios are key to understanding financial statements.
Profitability ratios are the financial statement ratios which focus on how well a business is
performing in terms of profit. It is a class of financial metrics that are used to assess a
business’s ability to generate earnings as compared to its expenses and other relevant costs
incurred during a specific period of time. For most of these ratios, having a higher value
relative to a competitor's ratio or the same ratio from a previous period is indicative that the
company is doing well.
http://www.bizwiz.ca/profitability_ratio_calculation_formulas/profitability_ratios.html
http://www.investopedia.com/terms/p/profitabilityratios.asp
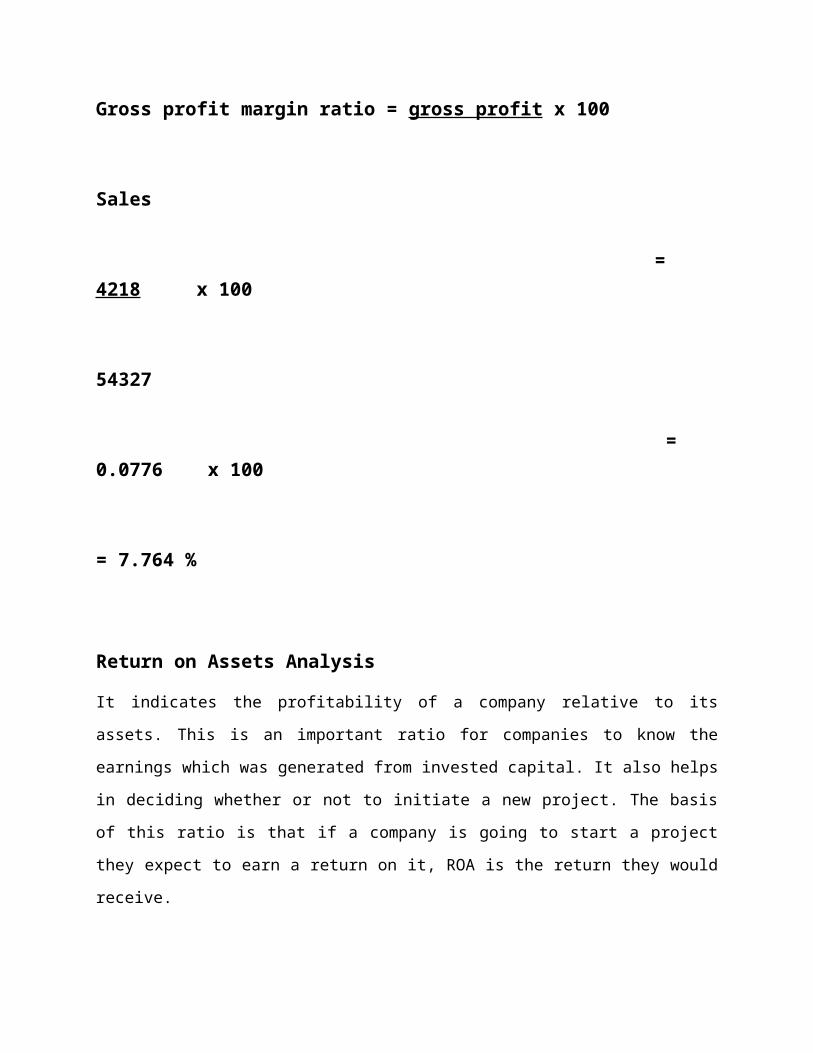
Gross profit margin ratio = gross profit x 100
Sales
= 4218 x 100
54327
= 0.0776 x 100
= 7.764 %
Return on Assets Analysis
It indicates the profitability of a company relative to its assets. This is an important ratio for
companies to know the earnings which was generated from invested capital. It also helps in
deciding whether or not to initiate a new project. The basis of this ratio is that if a company is
going to start a project they expect to earn a return on it, ROA is the return they would receive.
http://www.investopedia.com/terms/r/returnonassets.asp
Returns on assets = net profit before tax x 100
Total assets = 2954 x 100
46053

Returns on sales
The company’s operational efficiency is evaluated by ROS ratio, which is also know as firm’s
operating profit margin. An increasing ROS indicates the company is growing more efficiently,
while a decreasing ROS could signal looming financial troubles.
http://www.investopedia.com/terms/r/ros.asp
= Net profit x 100
Sale
= 2161 x 100
54327
= 0.0397 x 100
= 3.97%
Return on investment
A performance measure used to evaluate the efficiency of an investment or to compare the
efficiency of a number of different investments. To calculate ROI, the benefit (return) of an
investment is divided by the cost of the investment; the result is expressed as a percentage or a
ratio. Return on investment is a very popular metric because of its versatility and simplicity. That
is, if an investment does not have a positive ROI, or if there are other opportunities with a higher
ROI, then the investment should be not be undertaken.
http://www.investopedia.com/terms/r/returnoninvestment.asp
Return on investment = Net profit before tax x 100
Shareholder equity
= 2954 x 100
12938
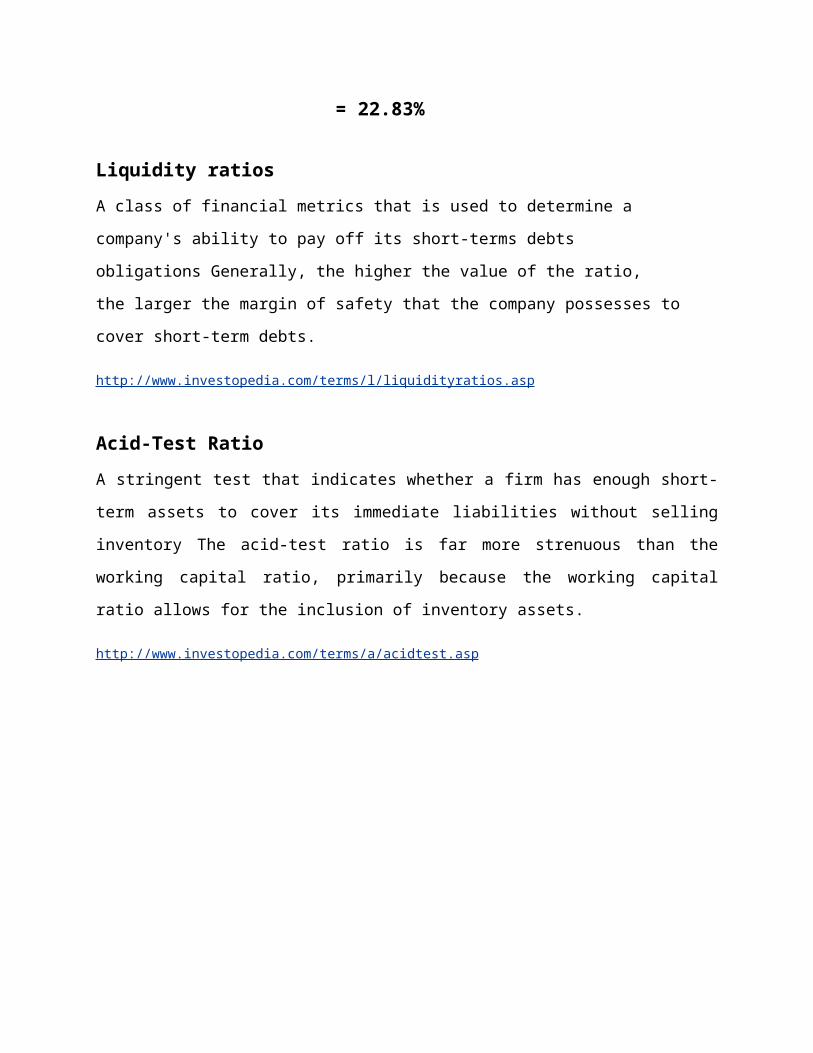
= 0.2283 x 100
= 22.83%
Liquidity ratios
A class of financial metrics that is used to determine a company's ability to pay off its short-
terms debts obligations Generally, the higher the value of the ratio, the larger the margin of
safety that the company possesses to cover short-term debts.
http://www.investopedia.com/terms/l/liquidityratios.asp
Acid-Test Ratio
A stringent test that indicates whether a firm has enough short-term assets to cover its immediate
liabilities without selling inventory The acid-test ratio is far more strenuous than the working
capital ratio, primarily because the working capital ratio allows for the inclusion of inventory
assets.
http://www.investopedia.com/terms/a/acidtest.asp
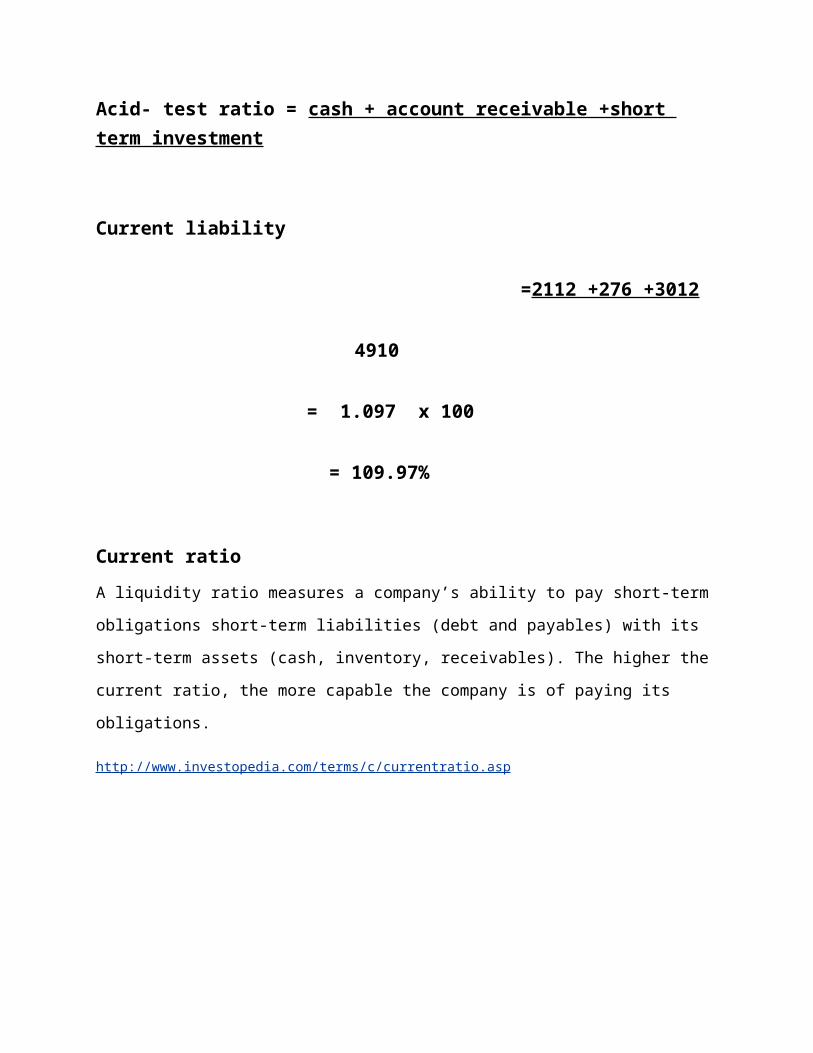
Acid- test ratio = cash + account receivable +short term investment
Current liability
=2112 +276 +3012
4910
= 1.097 x 100
= 109.97%

Current ratio
A liquidity ratio measures a company’s ability to pay short-term obligations short-term liabilities
(debt and payables) with its short-term assets (cash, inventory, receivables). The higher the
current ratio, the more capable the company is of paying its obligations.
http://www.investopedia.com/terms/c/currentratio.asp
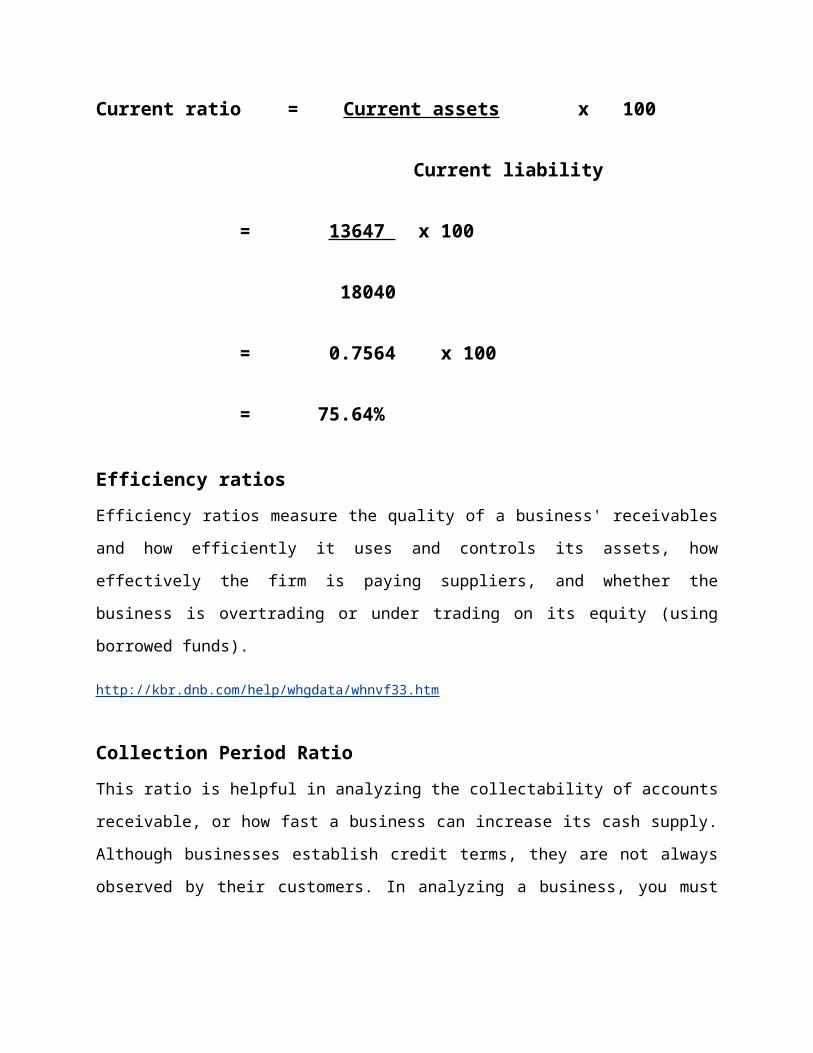
Current ratio = Current assets x 100
Current liability
= 13647 x 100
18040
= 0.7564 x 100
= 75.64%
Efficiency ratios
Efficiency ratios measure the quality of a business' receivables and how efficiently it uses and
controls its assets, how effectively the firm is paying suppliers, and whether the business is
overtrading or under trading on its equity (using borrowed funds).
http://kbr.dnb.com/help/whgdata/whnvf33.htm
Collection Period Ratio
This ratio is helpful in analyzing the collectability of accounts receivable, or how fast a business
can increase its cash supply. Although businesses establish credit terms, they are not always
observed by their customers. In analyzing a business, you must know the credit terms it offers

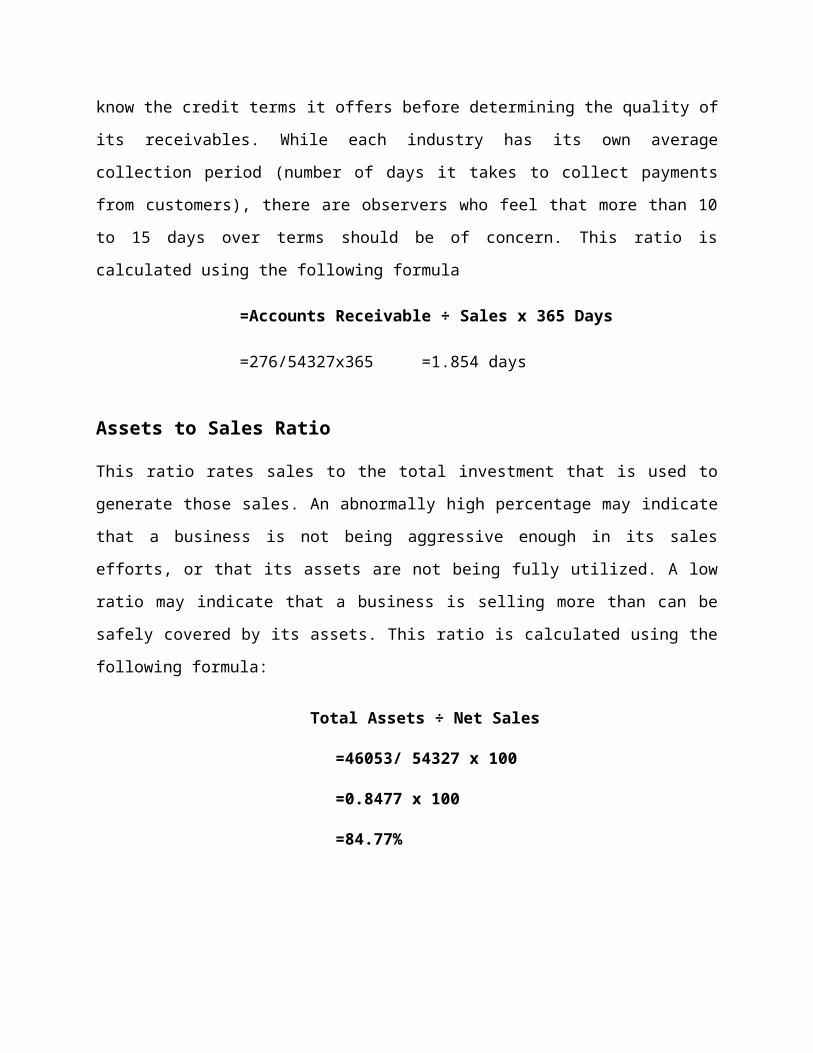
before determining the quality of its receivables. While each industry has its own average
collection period (number of days it takes to collect payments from customers), there are
observers who feel that more than 10 to 15 days over terms should be of concern. This ratio is
calculated using the following formula
=Accounts Receivable ÷ Sales x 365 Days
=276/54327x365 =1.854 days
Assets to Sales Ratio
This ratio rates sales to the total investment that is used to generate those sales. An abnormally
high percentage may indicate that a business is not being aggressive enough in its sales efforts,
or that its assets are not being fully utilized. A low ratio may indicate that a business is selling
more than can be safely covered by its assets. This ratio is calculated using the following
formula:
Total Assets ÷ Net Sales
=46053/ 54327 x 100
=0.8477 x 100
=84.77%
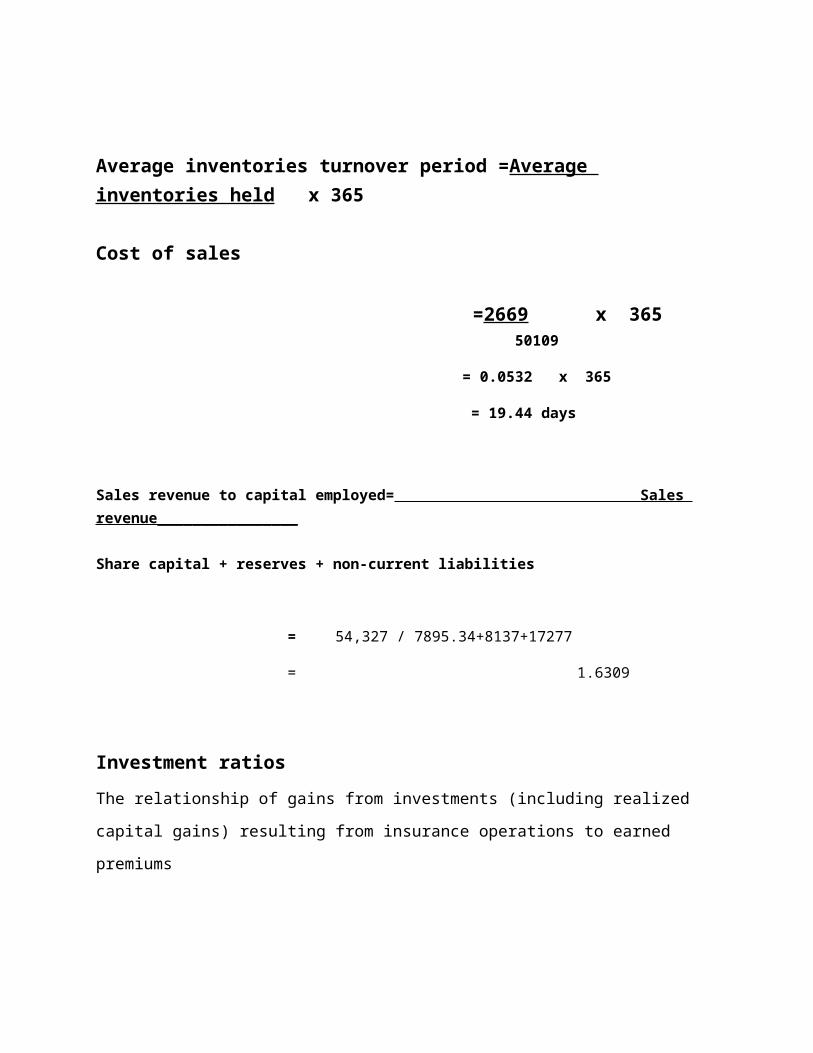
Average inventories turnover period =Average inventories held x 365 Cost of sales
=2669 x 365 50109
= 0.0532 x 365
= 19.44 days
Sales revenue to capital employed= Sales revenue________________ Share capital + reserves + non-current liabilities
= 54,327 / 7895.34+8137+17277
= 1.6309
Investment ratios
The relationship of gains from investments (including realized capital gains) resulting from
insurance operations to earned premiums
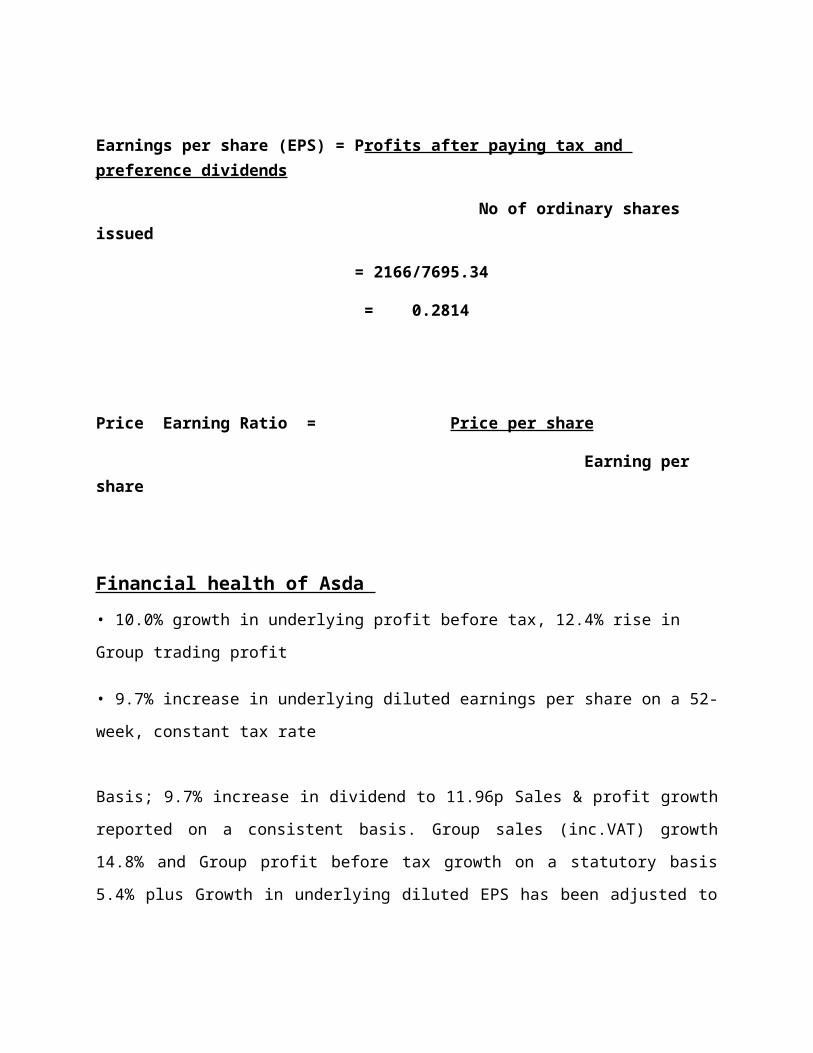
Earnings per share (EPS) = Profits after paying tax and preference dividends
No of ordinary shares issued
= 2166/7695.34
= 0.2814
Price Earning Ratio = Price per share
Earning per share
Financial health of Asda
• 10.0% growth in underlying profit before tax, 12.4% rise in Group trading profit
• 9.7% increase in underlying diluted earnings per share on a 52-week, constant tax rate
Basis; 9.7% increase in dividend to 11.96p Sales & profit growth reported on a consistent basis.
Group sales (inc.VAT) growth 14.8% and Group profit before tax growth on a statutory basis
5.4% plus Growth in underlying diluted EPS has been adjusted to reflect a constant tax rate year
on year. Growth was 7.0% on a statutory basis Across the Group Asda have made a good start to
the new financial year with total sales up by 9.2% in the first six weeks. For these Preliminary
results, sales and profit growth is reported on a consistent basis Underlying profit before tax rose
to £3,128m in the year (last year £2,843m), an increase of 10.0%. On a 52-week comparable
basis, underlying profit before tax rose by 8.8%. In the same year, In competitive market
conditions, the core business delivered a year of solid progress. UK sales increased by 9.5% to
£41.5bn (last year £37.9bn), including like-for-like growth of 4.3%, 2.7% growth from net new
stores, a contribution of 2.1% from the 53rd week and a first-time contribution from the
consolidation of TPF. Excluding petrol, like-for-like sales grew by 3.0%, with increases of 2.0%
and 2.7% in the third and fourth quarters respectively.
Increased productivity and good expense control enabled Asda to maintain solid margins and
deliver good profit growth despite these challenges, whilst also absorbing initial trading losses
totaling around £22m on Asda Direct. After these costs, UK trading profit rose 12.7% to
£2,381m (last year £2,112m), with trading margins at 6.2%, including TPF, slightly up on last
year. On a 52-week comparable basis, UK trading profit rose 10.7%. Asda share of profit (net of
tax and interest) for the year was £110m, an increase of £35m compared with last year. Asda has
a strong, property-backed balance sheet, with sufficient funding in place to meet the needs,
including no material bond maturities during the current financial year. Plan to fund the growth
of the group predominantly from internal sources – recognizing the current uncertainties in
financial markets – and this will be achieved by reducing capital expenditure to below our
operating cash flow.
Group capital expenditure (excluding acquisitions) rose to £4.7bn (last year £3.9bn), slightly
higher than the forecast made at our Interim Results. This increase compared with last year was
attributable principally to the purchase of a small number of trading stores from a competitor and
investment in new mixed-use development schemes in the UK, combined with higher
International capital expenditure, including our initial investment in freehold shopping centre
developments in China. Furthermore, International capital spending, and as a result total Group
expenditure, was impacted by the decline in Sterling relative to most of our trading currencies.
Cash flow from operating activities totaled £5.0bn (last year £4.1bn), including an improvement
of £582m within working capital, driven in part by good control of stock. Net debt rose to £9.6bn
at the year-end (last year £6.2bn). £1.9bn of this increase is attributable to the impact of
acquiring TPF and However, and a further £1bn to the effect of unfavorable currency
movements. The transactions completed so far – with pension funds, property companies and
other investors – have delivered aggregate proceeds of £2.2bn. Whilst yields have increased
modestly in recent months, it was expect to be able to complete further transactions on attractive
terms in the months ahead and Asda are currently in discussion with potential counterparties.
Proceeds for the remainder of this year will principally be used to pay down debt.
The net book value of our tangible fixed assets is £24.7bn, most of it in freehold store portfolio –
even after recent property divestments linked to our £5bn programmed. It was estimate the
current market value of these assets to be £30.4bn, representing a 23% premium to book value.
So over all Asda is in good position and there are good chances for Asda to grow in future
further more.
Question 2
2009 2010 2011
Revenue 54327x1.20 65192x1.20 78230
Cost of sales (50,109) (60,133) (72159)
Gross profit 4218 5059 6071
Selling/general/admin 1248x1.05 1310x1.05 1376
Unusual Expanses 236 248 260
Total operating expanse 51121 61193 73275
Operating income 3206 3997 4955
Payback period method
The payback is another method to evaluate an investment project. The payback method focuses
on the payback period. The payback period is the length of time that it takes for a project to
recoup its initial cost out of the cash receipts that it generates. This period is some time refered
to as" the time that it takes for an investment to pay for itself." The basic premise of the payback
method is that the more quickly the cost of an investment can be recovered, the more desirable is
the investment. The payback period is expressed in years. When the net annual cash inflow is the
same every year, the following formula can be used to calculate the payback period
Formula Payback period = Investment required / Net annual cash inflow
http://www.accountingformanagement.com/pay_back_method_of_capital_budgeting_decisions.htm
Example:1Year Cash Flow Needed Balance Payback Years
1 22,000 82,796 60,796 1.0
2 18,000 60,796 42,796 1.0
3 21,000 42,796 21,796 1.0
4 20,000 21,796 1,796 1.0
5 17,000 1,796 ----- 0.1
Total payback period in years ………………………4.1
Example:2
XYZ Company needs a new shredding machine. The company is considering two machines.
Machine A costs £15,000 and will reduce operating cost by £5,000 per year. Machine B costs
only £12,000 but will also reduce operating costs by £5,000 per year.
Calculation
Machine A payback period = £15,000 / £5,000 = 3.0 years
Machine B payback period = £12,000 / £5,000 = 2.4 years
According to payback calculations, XYZ Company should purchase machine B, since it has a shorter payback period than machine A.
Net present value method
Under the net present value method, the present value of a project's cash inflows is compared to the present value of the project's cash out flows. The difference between the present value of these cash flows is called "the net present value". This net present value determines whether or not the project is an acceptable investment. To illustrate consider the following data.
http://www.accountingformanagement.com/net_present_value_method.htm
Example1Year Cash Flow P.V. Factor Present value
0 (82,796) 1.000 (82,796)
1 22,000 .909 19,998
2 18,000 .826 14,868
3 21,000 .751 15,771
4 20,000 .683 13,660
5 17,000 .621 10,557
6 19,000 .564 10,716
7 18,000 .513 9,234
8 26,300 .467 12,282 Present value = 107,086 Net Present Value = 24290
Example2Samuel Company is contemplating the purchase of a machine capable of performing certain
operations that are now performed manually. The machine will cost £5,000, and it will last for
five years. At the end of five-year period the machine will have a zero scrap value. Use of the
machine will reduce labor costs by £1,800 per year. Samuel Company requires a minimum
pretax return of 20% on all investment projects.
Should the machine be purchased? Samuel Company must determine whether a cash investment
now of £5,000 can be justified if it will result in an £1,800 reduction in cost each year over the
next five years. It may appear that the answer is obvious since the total cost savings is £9,000 (5
× £1800). However, the company can earn a 20% return by investing its money elsewhere. It is
not enough that the cost reductions cover just the original cost of the machine. They must also
yield at least 20% return or the company would be better off investing the money elsewhere.
To determine whether the investment is desirable, the stream of annual £1,800 cost savings is
discounted to its present value and then compared to the cost of the new machine. Since Samuel
Company requires a minimum return of 20% on all investment projects, this rate is used in the
discounting process and is called the discount rate
Internal rate of return methodThe internal rate of return is the rate of return promised by an investment project over its useful
life. It is some time referred to simply as yield on project. The internal rate of return is computed
by finding the discount rate that equates the present value of a project's cash out flow with the
present value of its cash inflow In other words, the internal rate of return is that discount rate that
will cause the net present value of a project to be equal to zero.
The formulaFactor of internal rate of return = Investment required / Net annual cash inflow
Example
The factor derived from formula is then located in the present value tables to see what rate of
return it represents. Using formula and the data for school's proposed project, we get:
Investment required / Net annual cash inflow
= £16,950 / £3,000= 5.650
Thus, the discount factors that will equate a series of £ 3,000 cash inflows with a present
investment of £16,950. Now we need to find this factor in the table to see what rate of return it
represents. We would use the 10-period line in the table since the cash flows for the project
continue for 10 years. I we scan along the 10-period line, we find that a factor of 5.650
represents a 12% rate of return. We can verify this by computing the project's net present value
using a 12% discount rate.
REFRENCES
http://www.zeromillion.com/business/financial/business-finance.html
http://www.accountingformanagement.com/use_of_internal_rate_of_return_m.htm viewed 30 June 2009
http://www.reuters.com/finance/stocks/incomeStatement?stmtType=BAL&perType=ANN&symbol=TSCO.L viewed 02 July 2009
http://www.Asdaplc.com/plc/ir/pres_results/results/r2009/2009-04-21/2009-04-21.pdf viewed july 2009
http://www.accountingformanagement.com/net_present_value_method.htm viewed july 2009