6 do not duplicate - market traders...
TRANSCRIPT


6TRENDS ANDTRENDLINES
A TREND IS YOUR FRIEND
For some traders, learning to trade on the Forex is like learning how tobuild a car from scratch, without an instruction manual. Many of you haveacquired quality parts, such as breaks, wheels, motors, seats, and steeringwheels, yet as you attempt to put them together, you are not coming closeto building that perfect little car you envisioned.
To become a successful trader, you need the right parts, with the rightmanual, to put all the parts together and have your car work properly. Afterall, a part such as a $2.00 gasket can bring your car to a screeching halt. Justlook at what happened to the space shuttle Challenger.
I will never forget the day it happened. At the time, I owned a businessthat took photographs for NASA of all the work being done on the spaceshuttle at the Kennedy Space Center. We took pictures of all the differentphases, from construction, to liftoff, to landing, and then had a company inJapan print laser photographs of the images for resale to the public. Therewere just as many employees who worked on the shuttle seeking these qual-ity laser photoprints as there were tourists around the world wanting them.In fact, importing and exporting them is what introduced me to theexchange difference in currencies, which is how I became familiar withcurrency trading.
89
C H A P T E R
Do N
ot D
uplic
ate

By 1986, laser photoprints had caught on and our company was offeredlicensee rights for many national parks around the United States, as well asfor tourist parks such as Disney, SeaWorld, and Universal Studios.
Through our importing, we exchanged hundreds of thousands of U.S.dollars once or twice a week for Japanese yen. At the time, I really knewvery little about currency trading, but I did recognize the constant fluctua-tion of the currencies as I was exchanging them. I wasn’t trading the yenagainst the U.S. dollar to make money, but I saw that prices fluctuated upand down. So I watched the price movement to make sure I got the best dealat the time of the exchange; meaning, I was always waiting for the best timeto make an exchange, enabling me to get as many yen as possible for myU.S. dollars.
In the late 1980s, I almost went bankrupt—not from mismanagementof my company, as the company was growing by leaps and bounds, butfrom the yen strengthening from 280 yen against the U.S. dollar to 150 yento the U.S. dollar in less than 90 days. My cost of production doubled overa period of 90 days as the Japanese yen kept numerically falling and falling.The yen was increasing in value against the U.S. dollar as it dropped inprice until it stabilized around 140 to 150 yen to the dollar. That is whyproducts made from Japanese firms such as Sony and Sanyo doubled inprice back in the late 1980s. That shift in economy opened the doorsof opportunity for many U.S. manufacturers to now compete with theJapanese. It also forced the Japanese to start manufacturing their productshere in the United States.
It is amazing how one person’s loss becomes another person’s windfall.I was going bankrupt, losing millions of dollars, while successful currencytraders were making millions by shorting the market.
Had I taken the time to educate myself about currency trading andtrends back then, using a simple piece of trading software like what we useat MTI, I could have been making $130,000 to $1,300,000 from a relativelysmall investment in the currency market, instead of losing millions as theU.S. and Japanese economies shifted.
I was unable to find a chart of the yen falling 13,000 pips back in the1980s, however, I did find an example of a yen chart falling 3,100 pips inthree months, between August 1998 and October 1998.
Looking at the chart of Figure 6-1, trading 10 lots or shorting themarket with 10 lots by investing $10,000, brought a return to the trader of$300,000 in three months. Can you see how the inner trend line crossedover from the north to the south of the outer trend line, signaling a sell position for a long-term trader?
90 THE 10 ESSENTIALS OF FOREX TRADING
Do N
ot D
uplic
ate

TRADING A TREND UNTIL IT BENDS
Currency trading is very different than trading stocks. Companies can file bankruptcy, like Enron, or go completely out of business, taking theirshare value down to zero. On the other hand, with currency trading, there isno threat of a country going bankrupt. The country is not going to gobankrupt and turn the currency worthless. What can happen is that severeeconomic changes take place between countries, creating dramatic changesin the currency value of one country versus another. When that happens, itcan create an incredible financial return for savvy, educated currencytraders.
Study the four charts of Figure 6-2. In Figure 6-2A, the euro trendeddown 1,300 pips in four months, creating a $13,000 return trading one lot,or investing $1,000. How would you like to learn how to make this type ofpassive income trading long-term positions in currencies? A $10,000investment would have brought a return of $130,000.
In Figure 6-2B, the Swiss franc (CHF) trended up 1,400 pips in fourmonths, creating approximately a $13,000 return trading one lot, or investing
CHAPTER 6 TRENDS AND TREND LINES 91
FIGURE 6-1 USD/JPY (Daily Chart)
Do N
ot D
uplic
ate

FIGURE 6-2 Identifying Trend Direction on Different Currency Pairs
Do N
ot D
uplic
ate

FIGURE 6-2 Continued
Do N
ot D
uplic
ate
94 THE 10 ESSENTIALS OF FOREX TRADING
$1,000. The reason is that the CHF does not pay $10 per pip—it has a fluc-tuating pip value.
In Figure 6-2C, the British pound (GBP) trended down 1,600 pips infour months, creating approximately a $16,000 return trading one lot, orinvesting $1,000.
In Figure 6-2D, the Canadian dollar (CAD) traded against the U.S. dol-lar (USD) and trended down 2,400 pips in seven months, creating a returnof approximately $19,000 if you were trading one lot, or investing $1,000.The CAD also has a fluctuating pip value.
Trends appear across all time frames. They appear on monthly, weekly,and daily charts for long-term trading; they appear from eight-hour chartsdown to one-hour charts for day trading; and even on one-hour down tothree- to five-minute charts for scalping.
Learning how to spot a trend that can last several hours for scalping, sev-eral days for day trading, and several months for long-term trading can createan enormous financial return for the skilled and educated trader.
The Forex trades 24 hours a day, and any time during those 24 hoursyou can turn on your computer and sit down to trade. The most importantfirst step of success in trading currencies is determining market direction.The fact is if you want to make money currency trading, you will have totake a bullish or bearish position. One or the other—never both! You can-not make money taking a bullish and bearish position at the same time; youwould be in a net zero position, making and losing the same amount ofmoney with every pip movement.
People trade according to their personalities. Aggressive people love toscalp, while passive people prefer long-term trading. Figuring out your tradingstyle is very important before you trade. However, whether you are a passivetrader or an aggressive trader, you need to be able to determine market direc-tion before you trade. You need to learn how to find the current trend beforeyou enter the market, because you need to trade in the direction of the trend atall times. Do not fight the trend. Fighting a trend is like trying to swimupstream through violent forceful rapids. It doesn’t work. Traders can makemany mistakes. The biggest mistake is trading in the wrong direction!
One of the best ways to determine market direction is to have a piece oftrading software, such as MTI 4.0, with an automated trend indicator thatkeeps up with the trend direction on any time frames (see Figure 6-3). Asthe market moves, the trend lines move with it. You can see how the marketis constantly bouncing off the inner trend line. For example, on April 12,2005, if the uptrend is going to stay in place when the inner trend line isbroken, the market moves to the outer trend line and that is where the next
Do N
ot D
uplic
ate

bounce will take place. It is when the outer trend line is broken that themajority of the time the market incurs a major reversal, as you see takingplace around August 1, 2005, in Figure 6-3.
If you are an active trader and you use trading software that does nothave a moving trend line indicator, you will need to learn the skill ofdrawing correct trend lines—with correct being the operative word. Anincorrectly drawn trend line can mean the difference between making andlosing money on a trade. Drawing trend lines is a skill that can be taught,but I think it is always best to have an automated trend line indicated onyour software to keep up constantly with the trends you want to monitor.
In this chapter, we focus on finding, drawing, and monitoring threetrend lines:
1. An inner trend line2. An outer trend line3. A long-term trend line
These Three trend lines form on all time frames and in both uptrendsand downtrends (see Figure 6-4).
CHAPTER 6 TRENDS AND TREND LINES 95
FIGURE 6-3 USD/CHF (Daily Chart)
Do N
ot D
uplic
ate

As the market moves, it will only move in one of three directions: up,down, or sideways. When it moves in any direction, it waves. Those wavesbecome the emotional enemy of most traders. For some traders, it can takeyears to trust those waves and ride them to their end target.
SPOTTING AN UPTREND
If the market is going to move up, or trend up, on any time frame, it willwave up, creating higher highs, then wave back down, creating higher lows.I have never seen it go directly to the moon like an Apollo rocket. If it wereto go to the moon, it would wave as it went, creating higher highs andhigher lows. At some point, the trend will end, but until it ends, mostsuccessful traders try to take advantage of the move and take the ride upuntil it bends or ends. Believe it or not, most traders make all their moneyin trends and lose it all again in consolidation.
As the market trends in any direction, it moves at different speeds, justlike a car. Most trends travel at a 45-degree angle as they move, akin to acar driving at normal speed. The trend line that is used for that 45-degreemovement is called the outer trend. When a trend moves at a slower pace, along-term trend line is created. Every now and then, the trend gets on afreeway at highway speed, ascending at a greater angle than 45-degrees,creating what is called an aggressive trend, or the inner trend line. Up and
96 THE 10 ESSENTIALS OF FOREX TRADING
Drawing Uptrend LinesFIGURE 6-4
Do N
ot D
uplic
ate
CHAPTER 6 TRENDS AND TREND LINES 97
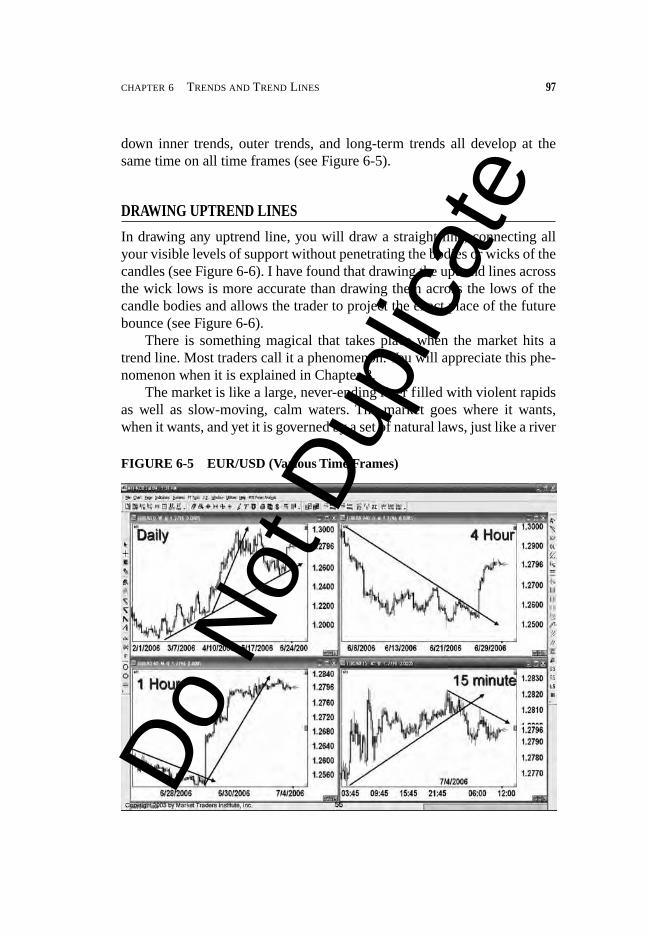
FIGURE 6-5 EUR/USD (Various Time Frames)
down inner trends, outer trends, and long-term trends all develop at thesame time on all time frames (see Figure 6-5).
DRAWING UPTREND LINES
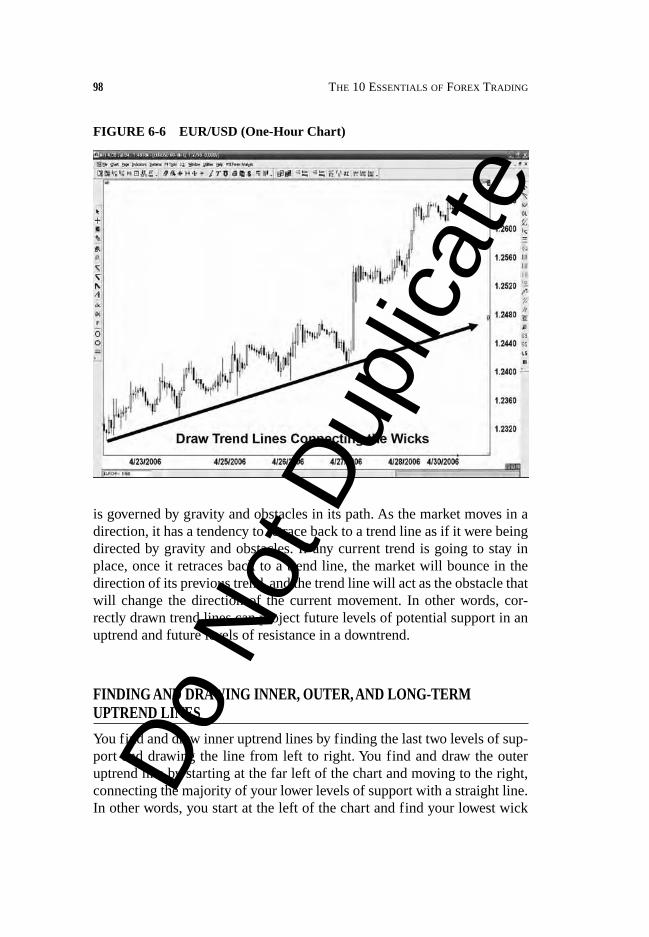
In drawing any uptrend line, you will draw a straight line, connecting allyour visible levels of support without penetrating the bodies or wicks of thecandles (see Figure 6-6). I have found that drawing the uptrend lines acrossthe wick lows is more accurate than drawing them across the lows of thecandle bodies and allows the trader to project the exact place of the futurebounce (see Figure 6-6).
There is something magical that takes place when the market hits atrend line. Most traders call it a phenomenon. You will appreciate this phe-nomenon when it is explained in Chapter 8.
The market is like a large, never-ending river filled with violent rapidsas well as slow-moving, calm waters. The market goes where it wants,when it wants, and yet it is governed by a set of natural laws, just like a river
Do N
ot D
uplic
ate
is governed by gravity and obstacles in its path. As the market moves in adirection, it has a tendency to retrace back to a trend line as if it were beingdirected by gravity and obstacles. If any current trend is going to stay inplace, once it retraces back to a trend line, the market will bounce in thedirection of its previous trend, and the trend line will act as the obstacle thatwill change the direction of the current movement. In other words, cor-rectly drawn trend lines can project future levels of potential support in anuptrend and future levels of resistance in a downtrend.
FINDING AND DRAWING INNER, OUTER, AND LONG-TERMUPTREND LINES
You find and draw inner uptrend lines by finding the last two levels of sup-port and drawing the line from left to right. You find and draw the outeruptrend line by starting at the far left of the chart and moving to the right,connecting the majority of your lower levels of support with a straight line.In other words, you start at the left of the chart and find your lowest wick
98 THE 10 ESSENTIALS OF FOREX TRADING
FIGURE 6-6 EUR/USD (One-Hour Chart)
Do N
ot D
uplic
ate
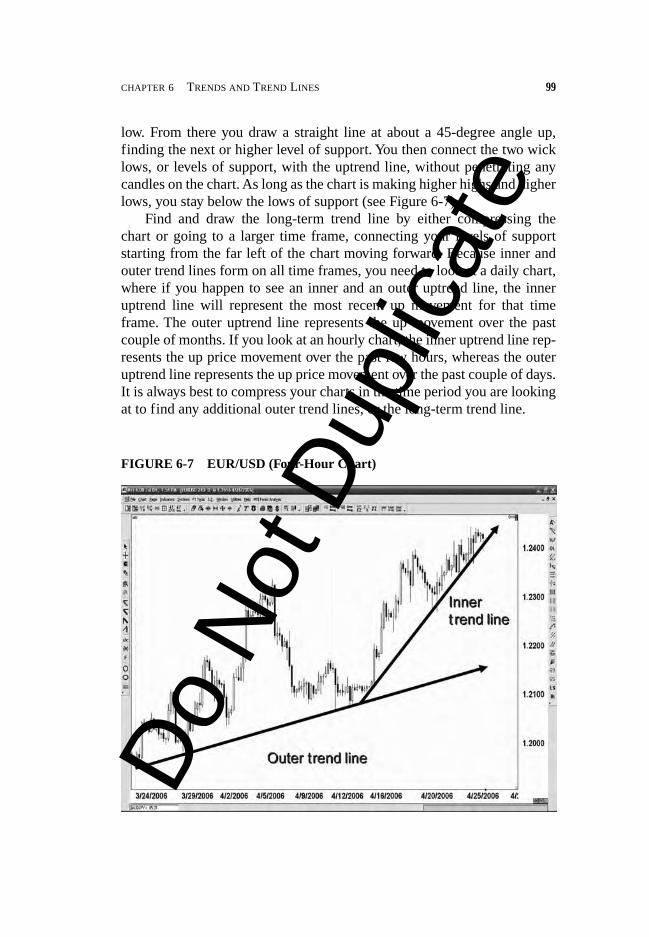
low. From there you draw a straight line at about a 45-degree angle up,finding the next or higher level of support. You then connect the two wicklows, or levels of support, with the uptrend line, without penetrating anycandles on the chart. As long as the chart is making higher highs and higherlows, you stay below the lows of support (see Figure 6-7).
Find and draw the long-term trend line by either compressing thechart or going to a larger time frame, connecting your levels of supportstarting from the far left of the chart moving forward. Because inner andouter trend lines form on all time frames, you need to look at a daily chart,where if you happen to see an inner and an outer uptrend line, the inneruptrend line will represent the most recent up movement for that timeframe. The outer uptrend line represents the up movement over the pastcouple of months. If you look at an hourly chart, the inner uptrend line rep-resents the up price movement over the past few hours, whereas the outeruptrend line represents the up price movement over the past couple of days.It is always best to compress your charts in the time period you are lookingat to find any additional outer trend lines, or the long-term trend line.
CHAPTER 6 TRENDS AND TREND LINES 99
FIGURE 6-7 EUR/USD (Four-Hour Chart)
Do N
ot D
uplic
ate

Successful traders constantly monitor all uptrend lines on all timeframes. Why? The movement on smaller time frames will always respond to the trend lines on larger time frames. This means that if the market isretracing back down toward an uptrend line on a daily chart, that retrace-ment on the daily chart may be a 200-pip retracement and will form a down-trend on a 60-minute chart. If you only look at the 60-minute chart to doyour analysis, you will be in a strong downtrend and your bias will be bearish. You will probably enter the market bearish. However, the way Murphy’s law works, you will be entering at the end of that 60-minute trend,because as soon as the market from the daily chart hits its up trend line, the60-minute chart will reverse and begin to rally, and you will be sitting therescratching your head, losing money and wondering what happened.
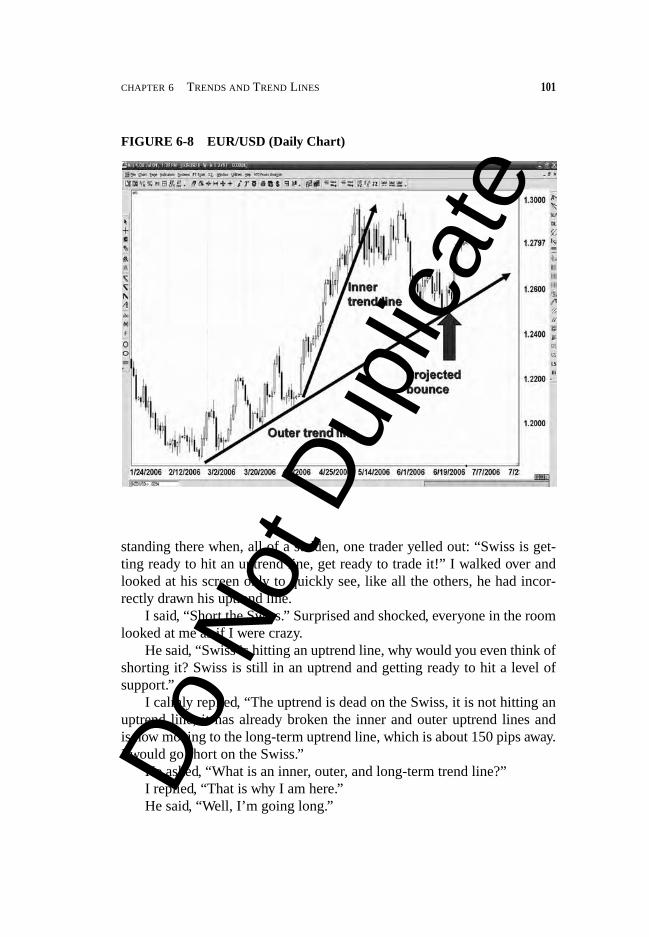
Once again, the inner, outer, and long-term uptrend lines can befound on any chart and on any time frame. Outer trend lines representthe overall movement on the chart for that time frame, and the inner trendline represents the most recent movement for the time frame. As long asthe market is above the outer uptrend line, there is an 80 percent chance themarket will continue bullish. You must remember, uptrend lines act as futurelevels of support. They are like a floor, and when the market hits them, theyusually bounce back up. If the inner trend line is broken, the market usuallymoves to the outer trend line and will bounce back up from there. If themarket breaks the outer trend line, the market will predominately move tothe long-term trend line and bounce back up from there. If the long-termtrend line is broken, as a rule there will be a major reversal (see Figure 6-8).
INCORRECT WAYS OF DRAWING UPTREND LINES
Correctly drawing trend lines will be critical to your success and will helpto prevent you from losing money.
On one of my many trips to South Africa, I flew down to Cape Town tomeet with a gentleman named Joubert who owned a trading company thatwas struggling. All their traders were losing way more money than theywere making.
As I walked around the room for the first time, looking at their tradingscreens, I saw screen after screen with nothing but incorrectly drawn trendlines. I said to myself “no wonder they are all losing money!”
As I continued to walk around the room, looking at their screens, Inoticed different trading systems and I wondered what other things they were doing wrong that they thought they were doing right. I was still
100 THE 10 ESSENTIALS OF FOREX TRADING
Do N
ot D
uplic
ate
standing there when, all of a sudden, one trader yelled out: “Swiss is get-ting ready to hit an uptrend line, get ready to trade it!” I walked over andlooked at his screen only to quickly see, like all the others, he had incor-rectly drawn his uptrend line.
I said, “Short the Swiss.” Surprised and shocked, everyone in the roomlooked at me as if I were crazy.
He said, “Swiss is hitting an uptrend line, why would you even think ofshorting it? Swiss is still in an uptrend and getting ready to hit a level ofsupport.”
I calmly replied, “The uptrend is dead on the Swiss, it is not hitting anuptrend line, it has already broken the inner and outer uptrend lines andis now moving to the long-term uptrend line, which is about 150 pips away.I would go short on the Swiss.”
He asked, “What is an inner, outer, and long-term trend line?”I replied, “That is why I am here.”He said, “Well, I’m going long.”
CHAPTER 6 TRENDS AND TREND LINES 101
FIGURE 6-8 EUR/USD (Daily Chart)
Do N
ot D
uplic
ate

102 THE 10 ESSENTIALS OF FOREX TRADING
FIGURE 6-9 EUR/USD (Daily Chart)
I looked at everyone and said, “I guess this will be a moment of truththen.” Then I looked at the traders and said, “From the screens I can see youare all drawing trend lines incorrectly. But if you believe in your uptrendline, then trade it and go long and I will understand.” Then I said, “Anyonewanting to make money on Swiss, go short for the next 125 to 150 pips,then reverse your position and go long for another major move up.”
As I walked into Joubert’s office I held my breath, hoping that themarket would continue to fall as I had predicted, knowing full well that themarket does what it wants to do. Fortunately, Swiss fell exactly 150 pips tothe long-term uptrend line and bounced back up like a basketball.
Trend lines need to be drawn correctly in order to make money trading.Learning the simple skill of correctly drawing trend lines can help youlearn where to get in and can help you learn how to preserve your equity bygetting out when it begins to turn. The following charts show the wrongways to draw uptrend lines. In Figure 6-9, you cannot draw your uptrendlines through the candles of support—they must be at the bottom wicks ofsupport.
Do N
ot D
uplic
ate

CHAPTER 6 TRENDS AND TREND LINES 103
FIGURE 6-10 EUR/USD (One-Hour Chart)
In Figure 6-10, the dotted line was at one point the correct uptrend line,but the market broke the uptrend line and retraced, continuing in anuptrend. As long as the market is making higher highs and higher lows, youcannot draw the line through the candles—you must draw the uptrend lineacross the lows of support.
In Figure 6-11, the uptrend is over and has been broken. The marketis reversing and is currently trending down creating lower lows andlower highs. In this case, with the market creating lower lows and lowerhighs, you need to draw the uptrend line across the lows of support, untilthe market quits making higher highs and higher lows. The moment the market stops making higher highs and higher lows and starts making lower lows and lower highs, that is the moment the market isreversing.
Figure 6-12 shows that your trend lines must always be straight; theycannot be crooked. Only automated trend lines from your computer canwave or be crooked.
Do N
ot D
uplic
ate
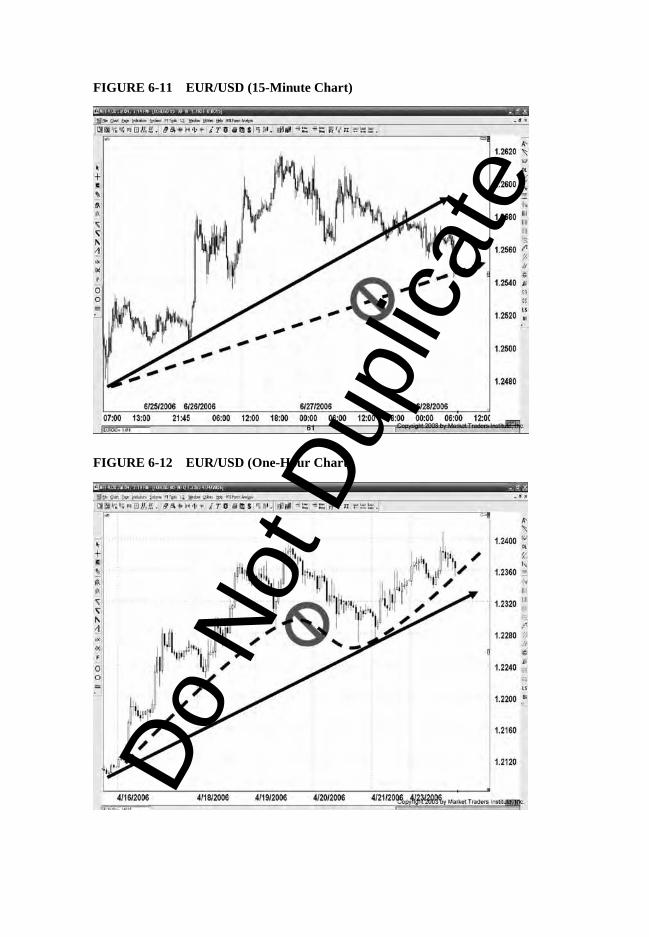
FIGURE 6-12 EUR/USD (One-Hour Chart)
FIGURE 6-11 EUR/USD (15-Minute Chart)
Do N
ot D
uplic
ate

CHAPTER 6 TRENDS AND TREND LINES 105
Drawing Downtrend Lines
The Long-term
Outer
Inner
FIGURE 6-13
FINDING AND DRAWING DOWNTREND LINES
One of the neatest things about learning to trade in this market is that in a downtrend, the market reacts the same way as an uptrend, but in theopposite direction. That means all the rules are the same, but in the oppo-site direction. Instead of the market making higher highs and higher lowsas it trends up, it makes lower lows and lower highs as it trends down.Instead of the market bouncing up off an uptrend line, which is a futurelevel of support, the market bounces down on a downtrend line, creating alevel of resistance. Downtrend lines act as ceilings for the market and arefuture projected levels of resistance.
Once again, the best way to determine market direction is to start draw-ing trend lines. If the candles are above the uptrend line, the market is prob-ably going to continue up. If the candles are below the downtrend line, themarket is probably going to continue to trend down. Drawing downtrendlines is a skill that just about anyone can learn.
At the risk of repeating myself, the rules for drawing downtrend linesare exactly the same as drawing in an uptrend, but in the opposite direction.It is like turning everything upside down. Instead of drawing the linesacross the lows of support we will draw the lines across the highs of resis-tance (see Figure 6-13).
Do N
ot D
uplic
ate
FINDING AND DRAWING INNER, OUTER, AND LONG-TERMDOWNTREND LINES
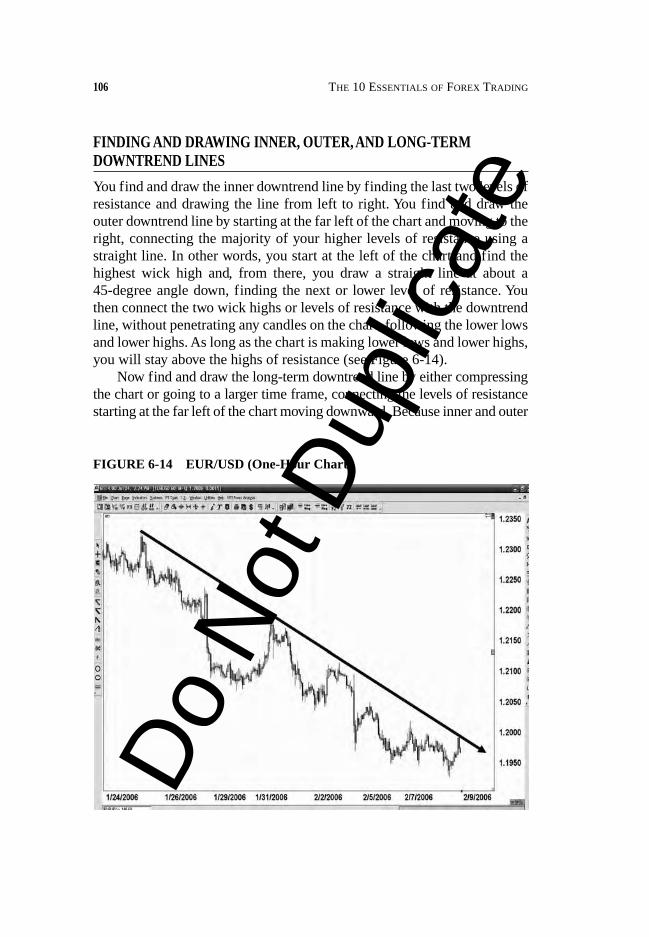
You find and draw the inner downtrend line by finding the last two levels ofresistance and drawing the line from left to right. You find and draw theouter downtrend line by starting at the far left of the chart and moving to theright, connecting the majority of your higher levels of resistance using astraight line. In other words, you start at the left of the chart and find thehighest wick high and, from there, you draw a straight line at about a 45-degree angle down, finding the next or lower level of resistance. Youthen connect the two wick highs or levels of resistance with the downtrendline, without penetrating any candles on the chart, following the lower lowsand lower highs. As long as the chart is making lower lows and lower highs,you will stay above the highs of resistance (see Figure 6-14).
Now find and draw the long-term downtrend line by either compressingthe chart or going to a larger time frame, connecting the levels of resistancestarting at the far left of the chart moving downward. Because inner and outer
106 THE 10 ESSENTIALS OF FOREX TRADING
FIGURE 6-14 EUR/USD (One-Hour Chart)
Do N
ot D
uplic
ate

trend lines form on all time frames, if you look at a daily chart and happen tosee an inner and an outer downtrend line, the inner downtrend line will rep-resent the most recent down movement for that time frame, or the movementover the past few days. The outer downtrend line will represent the downmovement over the past couple of months. If you are looking at an hourlychart, the inner downtrend line will represent the down price movement overthe past few hours, and the outer downtrend line may represent the downprice movement over the past couple of days. It is always best to compressyour charts in the time period you are looking at to find any additional outerdowntrend lines or any long-term uptrend or downtrend lines.
Successful traders are constantly aware and monitor all trend lines onall time frames because the movement on smaller time frames will alwaysrespond to the trend lines on larger time frames. For example, if the marketis retracing back up toward a downtrend line on a daily chart, that retrace-ment on the daily chart may be a 200-pip move up. A 200-pip retracementfrom a daily chart will be an uptrend on a 60-minute chart. If you only lookat the 60-minute chart to do your analysis, you will be in a strong uptrendand your bias will be bullish. You will probably enter the market bullish,however, the way Murphy’s law works, you will be entering at the end ofthat 60-minute trend, because as soon as the market from the daily charthits its trend line, the 60-minute chart will reverse and begin to dip, and youwill lose money.
Just like uptrend lines, the inner, outer, and long-term downtrend linescan be found on any chart and on any time frame (see Figure 6-15).
Outer downtrend lines represent the overall movement on the chart forthat time frame, and the inner trend line represents the most recent move-ment on that time frame. As long as the market is below the outer down-trend line, there is an 80 percent chance the market will continue bearish.Downtrend lines act as ceilings and future levels of resistance. If the innerdowntrend line is broken, the market usually moves to the outer downtrendline and will bounce back down from there. If the market breaks the outerdowntrend line, the market will generally move to the long-term downtrendline and bounce back down from there. If the long-term trend line isbroken, as a rule there will be a major reversal (see Figure 6-16).
INCORRECT WAYS OF DRAWING DOWNTREND LINES
The same rules apply to drawing incorrect downtrend lines as they do todrawing incorrect uptrend lines, but in the opposite direction. Traders need
CHAPTER 6 TRENDS AND TREND LINES 107
Do N
ot D
uplic
ate

FIGURE 6-16 GBP/USD (One-Hour Chart)
FIGURE 6-15 USD/CHF (Various Time Frames)
Do N
ot D
uplic
ate

to learn how to draw downtrend lines correctly in order to help them proj-ect the next bounce down. When you draw downtrend lines, you cannotdraw your lines through the candles of resistance—they must be at the topsof the wicks of resistance.
As long as the market is making lower lows and lower highs, you can-not draw the line through the candles—you must attach the downtrend lineacross the highs of resistance.
The downtrend is over when the market stops making lower lows andlower highs and begins making higher highs and higher lows. When thathappens, an inner, outer, or long-term downtrend line has been broken. Asa rule, the market will begin to reverse in the opposite direction.
TRENDS INSIDE OF TRENDS
As the market moves, it can create trends inside of trends (see Figure 6-17).In this chart, you see the market aggressively trending up on the north
CHAPTER 6 TRENDS AND TREND LINES 109
FIGURE 6-17 EUR/USD (Daily Chart)
Do N
ot D
uplic
ate
side of the outer uptrend line, then breaking the inner uptrend line andreversing. After it reverses, it trends back down, forming the inner down-trend line until it hits the outer uptrend line, where it bounces and begins totrend back up forming an inner uptrend line again.
TRADING CHANNELS
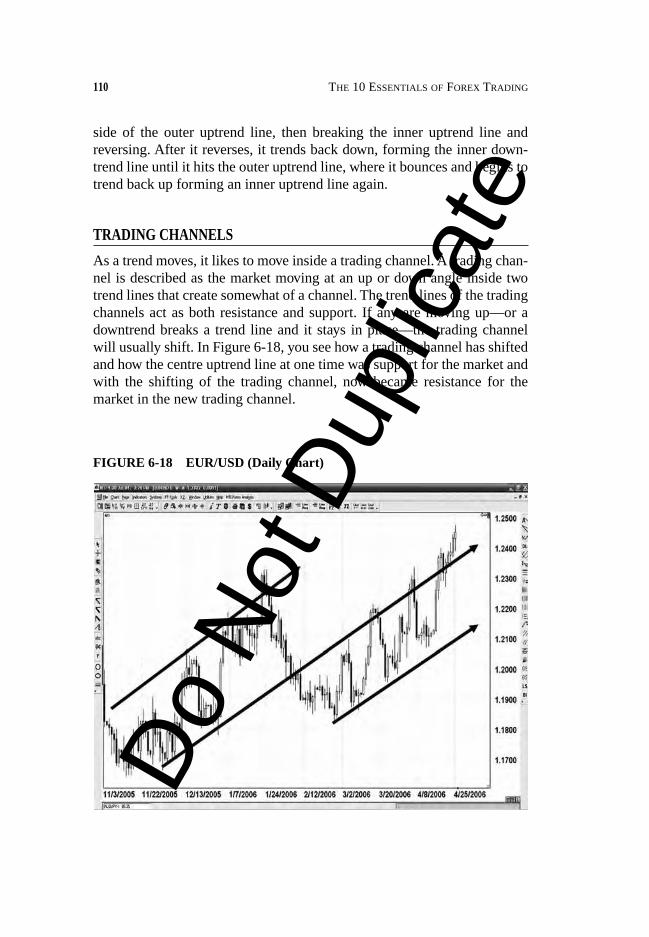
As a trend moves, it likes to move inside a trading channel. A trading chan-nel is described as the market moving at an up or down angle inside twotrend lines that create somewhat of a channel. The trend lines of the tradingchannels act as both resistance and support. If any are moving up—or adowntrend breaks a trend line and it stays in place—the trading channelwill usually shift. In Figure 6-18, you see how a trading channel has shiftedand how the centre uptrend line at one time was support for the market andwith the shifting of the trading channel, now became resistance for the market in the new trading channel.
110 THE 10 ESSENTIALS OF FOREX TRADING
FIGURE 6-18 EUR/USD (Daily Chart)
Do N
ot D
uplic
ate

THE VALUE OF TREND LINES
Using trend lines as part of your trading system, and in conjunction withother indicators, increases your chances of success. Why? Because of con-vergence, where there are several things taking place at a single price point,having several indicators could confirm and support trading decisions.
CONCLUSION
Uptrend and downtrend lines not only indicate market direction but also actas levels of support and resistance. In a downtrend, trend lines are futurelocations where the market may bounce back down. In an uptrend,trend lines are future locations where the market may bounce back up.Either way, they are just another little piece of the puzzle that increases theprobability of a continued move. The key is to always look for that conver-gence, along with a trend line bounce in the direction of a trend.
The following are always great tools to use when determining when toenter this market:
1. Trading software that can help determine trend direction with useof buy and sell signals
2. Bullish and bearish candlestick formations3. Finding levels of support and resistance4. The knowledge that past resistance many times becomes future
support, and vice versa5. The knowledge that trend lines act as floors of support and ceilings
of resistance in the market and become visible locations for the nextbounce in the direction of the trend
The more information you can gather as to why the market shouldbounce in a certain direction at a certain price point, the higher the proba-bility for success. You now have five great trading tools to add to yourtool kit, with more to come in future chapters. Regardless of how greata trade may look, it will always come down to trading within the equitymanagement rules, which you will be learning about in Chapter 12. Even ifyou found a convergence with 15 reasons why the market should bounce inyour direction, if the trade does not meet the equity management require-ments, you need to have the discipline to pass on the trade. Trading willalways be about risk versus your reward, just like life is.
CHAPTER 6 TRENDS AND TREND LINES 111
Do N
ot D
uplic
ate