6. current status of gis, remote sensing and mapping ... · 6. current status of gis, remote...
TRANSCRIPT
89
6. Current status of GIS, remote sensing and mapping applications in aquaculture from an ecosystem viewpoint
The purpose of this chapter is to provide an overview of GIS, Remote Sensing and mapping experience in terms of aquaculture applications relating to ecosystems and in particular to the EAA. The underlying objectives are to gauge the spatial analytical experience that could be brought to bear to support the EAA and to draw attention to technical and geographic gaps. Indicators include the types, breadth and numbers of spatial issues addressed, the numbers of spatial applications in aquaculture, the ecosystems at which or in which aquaculture spatial applications have been carried out, and the scales of the applications.
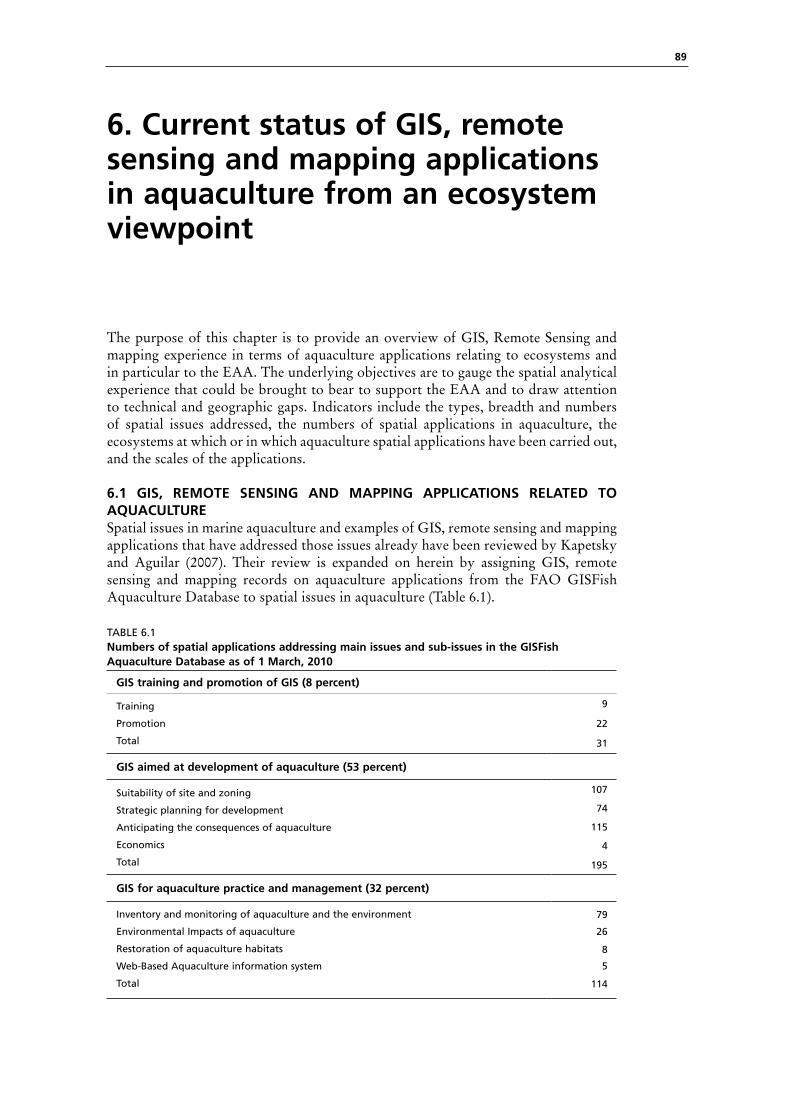
6.1 GIS, REMOTE SENSING AND MAPPING APPLICATIONS RELATED TO AQUACULTURESpatial issues in marine aquaculture and examples of GIS, remote sensing and mapping applications that have addressed those issues already have been reviewed by Kapetsky and Aguilar (2007). Their review is expanded on herein by assigning GIS, remote sensing and mapping records on aquaculture applications from the FAO GISFish Aquaculture Database to spatial issues in aquaculture (Table 6.1).
TABLE 6.1Numbers of spatial applications addressing main issues and sub-issues in the GISFish Aquaculture Database as of 1 March, 2010
GIS training and promotion of GIS (8 percent)
Training
Promotion
Total
9
22
31
GIS aimed at development of aquaculture (53 percent)
Suitability of site and zoning
Strategic planning for development
Anticipating the consequences of aquaculture
Economics
Total
107
74
115
4
195
GIS for aquaculture practice and management (32 percent)
Inventory and monitoring of aquaculture and the environment
Environmental Impacts of aquaculture
Restoration of aquaculture habitats
Web-Based Aquaculture information system
Total
79
26
8
5
114

The potential of spatial planning tools to support the ecosystem approach to aquaculture90
GIS for multisectoral development and management that includes aquaculture (7 percent)
Management of aquaculture together with fisheries
Planning for aquaculture among other uses of land and water
Total
9
16
25
Not specified 1
Grand total 366
All four main issues, along with their sub-issues, bear directly on the EAA; however, as can be seen in Table 6.1, the numbers of applications among the main issues are quite uneven. Particularly lacking are holistic applications dealing with aquaculture in the context of multidisciplinary approaches to management and specifically management of aquaculture together with fisheries. This is lack of attention to the broader aspects of the development and management of aquaculture suggests that integration with other complementary uses of land and water along with attention to competing and conflicting uses, in short, “spatial awareness” should be priorities for training in spatial analyses.
Clearly, promotion and training are key activities in increasing the capacity to use spatial tools in order to implement the EAA. This category has received relatively little representation as an issue (Table 6.1). In order to be successfully and widely applied, all of the spatial initiatives in the EAA will require training and promotion underpinnings. This, too, suggests that more emphasis will have to be brought to bear on training. In this regard, the Web Resources Database of GISFish that tracks opportunities for formal training, self-training (distance learning, on-line free courses) and freeware shows that there are many possibilities for formal and self-training in spatial tools and analyses that could be applied to aquaculture issues and to the EAA (available at www.fao.org/fishery/gisfish/id/1032). Thus, an important task will be to design and organize training using the most readily available and least costly means available, such as those found on the Internet.
In contrast to the main issues of training and multisectoral management, GIS aimed at the development of aquaculture and GIS for aquaculture practice and management have received much more attention. The former accounts for about one-half of the applications while the latter accounts for one-third Table 6.1). Within these two categories of issues, in relative terms there are noticeable gaps. The important issues of anticipating the consequences of aquaculture and of aquaculture economics arerelatively under-represented in the development category while in the practice and management category restoration and aquaculture information systems are poorly represented (Table 6.2).
TABLE 6.2
GIS aimed at the development of aquaculture, and GIS for practice and management
GIS aimed at the development of aquaculture (53 percent of total applications)
Suitability of site and zoning 107 54%
Strategic planning for development 74 37%
Anticipating the consequences of aquaculture 15 8%
Economics 4 2%
Total 195 100%
TABLE 6.1 Cont.Numbers of spatial applications addressing main issues and sub-issues in the GISFish Aquaculture Database as of 1 March, 2010

91
GIS for aquaculture practice and management (33% of total aquaculture applications)
Inventory and monitoring of aquaculture and the environment 79 67%
Environmental Impacts of aquaculture 26 22%
GIS aimed at the development of aquaculture (53 percent of total applications)
Restoration of aquaculture habitats 8 7%
Web-Based Aquaculture information system 5 4%
Total 114 100%
Because aquaculture and fisheries have many interests in common and in many instances occupy the same space, it would be thought that applications dealing with aquaculture and fisheries would receive more attention. Clearly, as shown in Table 6.3, this is not the case.
TABLE 6.3
GIS for multisectoral development and management that includes aquaculture
GIS for multisectoral development and management that includes aquaculture (5 percent of total aquaculture applications)Management of aquaculture together with fisheries 9 36%
Planning for aquaculture among other uses of land and water 16 64%
Total 25 100%
In this regard, an additional resource for the implementation of spatial analyses in support of the EAA that should not be overlooked is the availability of issues-related applications of spatial tools in inland fisheries (GISFish-Inland Fisheries Main Issues from Database available at www.fao.org/fishery/gisfish/id/2384). The count of inland records of potential use was nearly 250 in June, 2009. An important point about the inland applications is that, relative to aquaculture, they are very ecologically oriented and particularly numerous with regard to habitats, and that aquaculture and inland fisheries occur together in the same ecosystems and employ the same basic spatial and attribute data for analyses.
In summary, there are gaps in experience that can be made up by careful design of training programs to match issues. Overall, aquaculture applications of spatial tools from an issues viewpoint can be said to be mainly inward focused, not outward looking and holistic as the EAA demands. This outcome points to the need not only for technical training, but also for training in “spatial awareness” of competing, conflicting and complementary uses of land and water in an ecosystems context.
6.2 AN ASSESSMENT OF GIS, REMOTE SENSING AND MAPPING APPLICATIONS TO AQUACULTURE AS THEy RELATE TO SCALES AND ECOSySTEMSThe objectives here are to assess GIS, remote sensing and mapping applications in aquaculture in the context of the ecosystems to which they pertain and in relation to the scales that they have encompassed.
Data and methodsUsing the GISFish Aquaculture Database (www.fao.org/fishery/gisfish) from 1998 to October, 2007, 191 records in all, were examined. Of these, 159 records were classified both according to the kind of ecosystem involved and with regard to the scale of the application. The others were either too vague with regard to scale or ecosystem, or did not pertain (e.g. reviews). Although this sample is somewhat dated, there are only
TABLE 6.2 Cont.GIS aimed at the development of aquaculture, and GIS for practice and management
6. Current status of GIS, remote sensing and mapping applications in aquaculture from an ecosystem viewpoint
The potential of spatial planning tools to support the ecosystem approach to aquaculture92
25 additional entries for 2008 and 2009 and they are unlikely to be greatly different the records that were used for the survey. Names of ecosystems were tabulated according to their literal use in titles, abstracts and full papers or reports. Ecosystem names are often based on the geographic name of the place under investigation (e.g. Charlotte Harbor is a harbor). In a few cases local names for systems were converted to a more common ecosystem name, if a satisfactory definition could be found (e.g. lough to lagoon).
Experts at the FAO Workshop on “Building an ecosystem approach to aquaculture (EAA): Initial steps for guidelines”1 (Soto, Aguilar-Manjarrez and Hishamunda, 2008) identified four scales/levels of EAA application: the farm; the waterbody and its watershed; the aquaculture zone or region; and the global, market-trade level. The EAA scales are easily accommodated by GIS, remote sensing and mapping as applied to aquaculture, this being because GIS is capable of being applied at any scale. Practically, many spatial applications in aquaculture deal primarily with a natural or an artificial waterbody in its entirety or in part. Otherwise, the geographic reach of many applications is most often defined by some extra-national, national or sub-national level of administration, or national level of administration, or sub-national clusters of administrations.
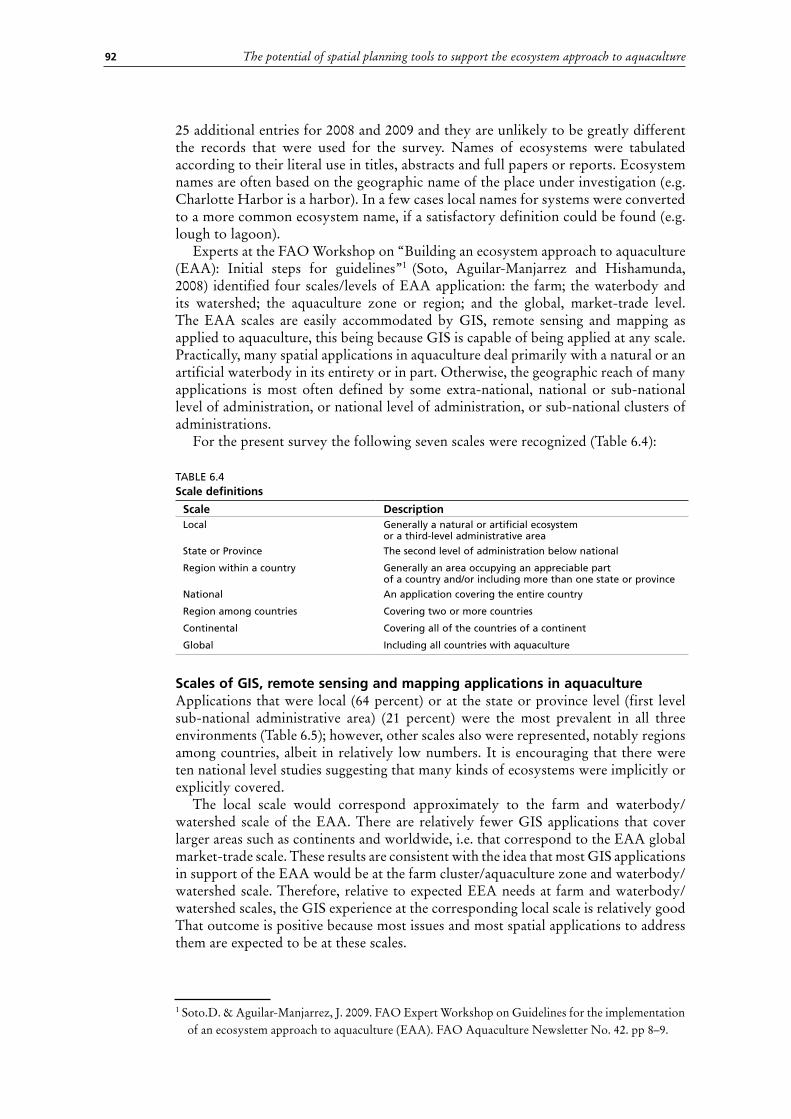
For the present survey the following seven scales were recognized (Table 6.4):
TABLE 6.4Scale definitions
Scale DescriptionLocal Generally a natural or artificial ecosystem
or a third-level administrative area
State or Province The second level of administration below national
Region within a country Generally an area occupying an appreciable part of a country and/or including more than one state or province
National An application covering the entire country
Region among countries Covering two or more countries
Continental Covering all of the countries of a continent
Global Including all countries with aquaculture
Scales of GIS, remote sensing and mapping applications in aquacultureApplications that were local (64 percent) or at the state or province level (first level sub-national administrative area) (21 percent) were the most prevalent in all three environments (Table 6.5); however, other scales also were represented, notably regions among countries, albeit in relatively low numbers. It is encouraging that there were ten national level studies suggesting that many kinds of ecosystems were implicitly or explicitly covered.
The local scale would correspond approximately to the farm and waterbody/watershed scale of the EAA. There are relatively fewer GIS applications that cover larger areas such as continents and worldwide, i.e. that correspond to the EAA global market-trade scale. These results are consistent with the idea that most GIS applications in support of the EAA would be at the farm cluster/aquaculture zone and waterbody/watershed scale. Therefore, relative to expected EEA needs at farm and waterbody/watershed scales, the GIS experience at the corresponding local scale is relatively good That outcome is positive because most issues and most spatial applications to address them are expected to be at these scales.
1 Soto.D. & Aguilar-Manjarrez, J. 2009. FAO Expert Workshop on Guidelines for the implementation of an ecosystem approach to aquaculture (EAA). FAO Aquaculture Newsletter No. 42. pp 8–9.

93
TABLE 6.5Scales relating to 159 spatial analysis applications in aquaculture among brackishwater, inland and marine environments
That so many applications were local or at the state or provincial level suggests that higher level planning for aquaculture, either at the national level or at the level of lake or river basin, is not taking advantage of spatial tools. This is may be another manifestation of the lack of attention by the aquaculture sector to competing, conflicting and complementary uses of land and water. A solution is the promotion of the spatial needs of aquaculture among a broad range of users of land and water, and training in spatial awareness of users of land and water for aquaculture.
Ecosystems included in GIS, remote sensing and mapping applications in aquaculture Regarding ecosystems, 13 of the 159 applications included a second ecosystem in the spatial analysis; however, these were ecosystems adjacent to the primary ecosystem. In the same light, although ponds are artificial ecosystems and predominate among the brackishwater and inland ecosystems as the targets of spatial analyses, many brackishwater and inland applications involve site selection for ponds so that the surrounding ecosystems (e.g. mangroves, creeks, rivers) also are taken into account in the application.
In all, 22 kinds of ecosystems related to the 159 applications. Three applications (2 percent) among the 159 were global in extent and implicitly included all aquaculture ecosystems (Table 6.6). Ecosystems in the marine environment accounted for 52 percent of the applications while brackishwaters accounted for 34 percent and the inland environment for 13 percent. In comparison, global aquaculture production in 2005 was about 50 percent from mariculture, 44 percent from freshwater and the remainder from brackishwater (FAO, 2007). Thus, numbers of GIS applications in the brackishwaters and freshwater environments are not proportional to production. For example, brackishwaters GIS applications (34% of the total) are many more than would be expected from the relative importance of brackishwater production (6% of total production). This may be accounted for in part by the relative high value of aquacultured products from brackishwaters. Similarly, GIS applications in freshwaters are less than would be expected based on global freshwater tonnage. This, too, may be due in part to the lower value of freshwater aquaculture products in comparison with those from marine and brackishwaters. This is not necessarily a gap. The results simply show that the distribution of applications among the three environments may be heavily influenced by economic considerations.
In the marine realm, bays were most frequently the targets of spatial studies (43 percent) followed by marine coastal ecosystems (38 percent). This latter ecosystem designation results from applications in which more specific identifications of ecosystems were not made. In contrast, the marine offshore designation (12 percent) consistently refers to offshore culture of fish in cages or of mussels on longlines. In brackishwaters, ponds were the most prevalent ecosystems (50 percent). These ponds are artificial ecosystems constructed mainly for penaeid shrimp culture. Estuaries (26
6. Current status of GIS, remote sensing and mapping applications in aquaculture from an ecosystem viewpoint
Scale All Brackishwater Inland Marine Grand TotalLocal - 36 67% 11 55% 55 67% 102 64%
State or province - 16 30% 3 15% 15 18% 34 21%
Region in country - 1 2% 0 0% 0 0% 1 1%
National - 1 2% 1 5% 8 10% 10 6%
Region amongcountries
- - - 3 15% 3 4% 6 4%
Continental - - - 1 5% - - 1 1%
Global 3 - - 1 5% 1 1% 5 3%
Grand Total 3 54 - 20 - 82 - 159 100%

The potential of spatial planning tools to support the ecosystem approach to aquaculture94
percent) were the second-ranking kind of ecosystem in brackishwaters. In inland areas artificial ponds (40 percent), too, were the prevalent ecosystem followed by lakes (20 percent).
TABLE 6.6Ecosystems as the targets of 159 spatial analyses among marine, brackishwater and inland environments
Ecosystem All Brackishwater Inland Marine Grand Totalponds, brackish - 27 50% - - - - 27
estuary - 14 26% - - - - 14
lagoon - 5 9% - - - - 5
mangroves - 4 7% - - - - 4
sound - 3 6% - - - - 3
fjord - 1 2% - - - - 1
ponds, inland - - - 8 40% - - 8
lake - - - 4 20% - - 4
river - - - 2 10% - - 2
river basin - - - 2 10% - - 2
creek basin - - - 1 5% - - 1
floodplain - - - 1 5% - - 1
reservoir - - - 1 5% - - 1
surface waterbodies - - - 1 5% - - 1
bay - - - - - 35 43% 35
marine, coastal - - - - - 31 38% 31
marine, offshore - - - - - 10 12% 10
land-based marine - - - - - 2 2% 2
canal, marine waters - - - - - 1 1% 1
gulf - - - - - 1 1% 1
harbour - - - - - 1 1% 1
ponds, marine - - - - - 1 1% 1
global, all ecosystems 3 - - - - - - 3
Grand Total 3 54 20 82 159
2% 34% 13% 52%
Looked at from a broad viewpoint, it can be said that nearly all applications of GIS, remote sensing and mapping in aquaculture include one or more ecosystems. For example, as shown in Table 6.6, aquaculture applications have operated in all varieties of “natural” waterbodies generally referred to as “ecosystems” (e.g. rivers, lakes, bays, estuaries) as well as in artificial waterbodies that may also be considered as ecosystems such as reservoirs, and ponds. It can be concluded that there is ample experience in the application of spatial analyses among natural and artificial ecosystems; however, as shown by the relative attention to main- and sub-issues (Table 6.2), there is relatively limited experience in dealing spatially with the social and economic components of ecosystems. Finally, the results are somewhat subjective because of the varying amount of information about each application conveyed by the title, abstract, or full report or paper. Also, some ecosystems could probably be combined (e.g. coastal lagoon and sound).
6.3 SUMMARy AND CONCLUSIONSThe purpose of this chapter was to provide an overview of spatial analysis experience in terms of spatial applications in aquaculture that relate to ecosystems and particularly to EAA. The underlying objective was to gauge the experience that could be brought to bear to support the EAA and to draw attention to technical and geographic gaps. Indicators included kinds and numbers of issues addressed, the geographic scales of the applications, and the kinds of ecosystems in which applications were carried out.
95
Regarding the issues addressed, experience is relatively good in the realms of spatial analyses for the development of aquaculture and for aquaculture practice and management. However, within these broad categories, experience is relatively weak in aquaculture economics. Experience in the main category issue of multisectoral planning and management is also relatively weak. The relatively poor showing of GIS applications aimed in this direction probably reflects the overall poor integration of aquaculture into land and water use planning, but, specifically with regards to spatial analyses, also could be indicative of a lack of awareness of GIS capabilities to support resolution of competition and conflicts for space and resources.
Clearly, promotion and training are key activities in increasing the capacity to use spatial tools for the implementation the EAA. One need for training, that of “spatial awareness”, is indicated by the apparent lack of use of GIS for aquaculture in broader planning. This kind of training is appropriate both at management and technical levels. The other kind of training that is required is at the technical level. The GISFish database covers a range of training opportunities including self-training with analytical freeware. However, resolving real-world issues should be the basis for the design of the technical training programs. Underlying this is a need to promote communication between managers and GIS analysts. An important consideration in designing training and promotion is to take a global view in order to recognize common needs and capacities so as to be able to realize efficiencies in the delivery of the training and technical assistance.
Fundamentally, since GIS can be applied at any scale. Any scale recognized by the EAA can be accommodated for spatial analyses. Scales among a sample of 159 applications within the three main environments – marine, brackishwater and freshwater – were broad and ranged from local to global. In all three environments the local scale was the most prevalent scale of application followed by the first level sub-national administrative boundary. In terms of the EAA scales, GIS applications applied to the farm, aquaculture zone or region are among the most numerous. That outcome is positive because most issues and most spatial applications to address them are expected to be at those scales. However, as shown by the relative numbers of applications among the main- and sub-issues (Section 6.2), there is relatively limited experience in dealing spatially with the social and economic components of ecosystems. Because the EAA is holistic and importantly includes these very two components, then it is clear that when priorities for training and promotion of GIS in the EAA are considered, they should include spatial analyses of the social and economic elements of ecosystems Training and promotion in these two spheres will lead to a more widespread appreciation of the need for spatial analyses in general that will benefit not only the aquaculture sector, but all users of land and water resources.
6. Current status of GIS, remote sensing and mapping applications in aquaculture from an ecosystem viewpoint


97
7. GIS-based decision support tools and modelling for aquaculture development
7.1 INTRODUCTIONThis section provides an overview of GIS-based decision support tools and models available to address key issues (e.g. site selection) and support decision-making activities for aquaculture development and management. First, the basics for decision-making in GIS are presented. Following this, a brief description of the various GIS-based models currently in existence is provided, highlighting particular features which have general relevance to the field of the ecosystem approach to aquaculture (EAA). The chapter concentrates on the currently available models representative of general types such as particulate waste distribution models, and dynamic flow models. General software descriptions are given and selected case studies are used to briefly describe the status and potential of these approaches. Some of the advantages, disadvantages and limitations of the decision support tools and models in addressing questions pertaining to EAA are discussed. The chapter concludes with some recommendations for introducing and implementing decision support tools and models to support EAA. This review is by no means exhaustive but it attempts to broadly capture the main model types that are well know, are widely available and that show potential as tools in this context – e.g. attention in this chapter is focused on GIS tools, however, there are a vast number of additional tools such as ecosystem-based modelling tools that would need to be assessed. Remote sensing and mapping are also briefly described in this chapter as two distinct approaches to spatial decision making and suggested reference are provided.
7.2 IMPLEMENTINGThe basic considerations which are necessary in setting up a GIS for the development and management of aquaculture and inland fisheries are outlined by Meaden and Kapetsky (1991) and Meaden and Do Chi (1996) provide a similar outline for marine fisheries. Such considerations are still valid to date and include: Why is a GIS Needed? How can GIS fit into an Organization? What are the financial considerations? What sort of GIS configuration should we adopt? What sort of software should we choose? What are our personnel needs? What are the procedures for setting up the GIS?. A new FAO Technical manual on “Geographic information systems and remote sensing in fisheries and aquaculture” is currently in preparation and will be made available in late 2010. This new manual is an update to the work by Meaden and Kapetsky (1991) and Meaden and Do Chi (1996).
A complementary document to this review and especially this chapter is a study by Carocci et al. (2009) on Geographic Information Systems to support the ecosystem approach to fisheries.
Decision-making is a process, so there are a number of alternative ways to organize the sequence of activities in the decision-making process, however, Nath et al. (2000) noted that applications of GIS for spatial decision support in aquaculture generally consist of seven phases: 1. Identifying project requirements, 2. Formulating specifications, 3. Developing the analytical framework, 4. Locating data sources, 5. Organizing and manipulating data for input, 6. Analysing data and verifying

The potential of spatial planning tools to support the ecosystem approach to aquaculture98
outcomes, and 7. Evaluating outputs. These seven phases are presented together with details of the degree of involvement of each category of personnel, associated activities and analytical procedures (Figure 7.1).
The seven phases can be summarized as follows:1. Identifying project requirementsThe process of identifying project requirements for a GIS is essentially a multiple stakeholder decision-making situation. This is because such work is invariably executed by a group of subject matter experts and analysts, and because results of the analyses are potentially useful to a range of decision-makers. Once project personnel, particularly end users, have had an opportunity to present their spatial decision support needs, discussions can begin on how GIS tools can address these needs, and clarify the limitations of such tools (e.g. spatial data availability and quality, software and hardware resources that may be needed, cost and time constraints, etc.).
2. Formulating specificationsOnce an overall understanding of project requirements has been developed among team members, it is helpful to develop a listing of more functional specifications corresponding to each of the requirements that have been identified, for instance, if the project requires that the final GIS be interactive (implying that the end users can explore alternate scenarios on their own).
3. Developing the analytical frameworkDevelopment of the analytical framework for a GIS project must consider how end-users needs will be addressed. Several methods have been used, either singly or in combination, by GIS practitioners to integrate spatial information into a useful format for analysis and decision-making. Some of the main analytical methods that have been used in aquaculture GIS include: Arithmetic operators; Classification; Interpolation; Simple overlay; Weighted overlay; Neighbourhood analysis; Connectivity analysis; Hierarchical models and Multi-objective land allocation.
4. Locating data sourcesOnce the analytical framework has been developed, it is necessary to identify data sources to be used in the project. This phase is largely restricted to GIS analysts, although subject matter specialists often provide helpful advice. Information for spatial decision-making and analysis is varied, and will usually consist of data describing the biophysical, economic, social and infrastructural environments. These data can come from a variety of sources ranging from primary data gathered in the field or satellite scenes to all forms of secondary data, including textual
99
databases and reports. It is generally both costly and time consuming to collect field (primary) data first hand, therefore, all GIS practitioners attempt to locate the data they need from existing secondary sources, either in paper or digital form. The initial consideration is identifying what data are needed for the overall analysis. This is followed by attempts to source the data, and to assess their age, scale, quality and relative cost.
5. Organizing and manipulating data for inputCollected datasets must be organized and manipulated for use in the target GIS. This phase is also largely restricted to GIS analysts, although depending on the type of application, occasional interaction with subject matter specialists may be warranted. Some of the key activities that occur in this phase include verification of data quality, data consolidation and reformatting, georeferencing and reprojection and database construction.
6. Analysing data and verifying outcomesActivities that may be encountered in analyzing data and verifying outcomes include executing analytical methods (i.e. overlays, model runs and/or other querying knowledge based systems, etc.), importing and exporting data as needed (e.g. intermediate GIS outputs which are required by other components within the overall analytical framework), computation of relevant statistics (e.g. means, standard deviations, ranges, classes, etc.), generation of output information (e.g. maps, tables, graphs, and reports), and verification of outcomes. Field verification as part of any GIS work is absolutely essential, both for quality control of certain data sources (as previously discussed) and for testing the outcomes of models (or other analytical tools).
7. Evaluating outputsIn the final phase of a GIS project, outputs generated are jointly evaluated by the overall team (i.e. end users, subject matter specialists and analysts. Several activities are likely to be encountered during this phase, including a summary review of key findings, more detailed examination of individual components of the project together with their underlying assumptions, limitations (if any) of the findings, and an evaluation of the degree to which each of the original requirements of the project have been met. The results of the latter activity provide a useful means of assessing the success of the project. However, it is often the case that outputs from a GIS project are not put to immediate use, but form a component of a larger (or later) decision making process (e.g. development of new policies and/or of development plans pertaining to).
It should be noted that the phases involved in any GIS study occur iteratively in the sense that project personnel may often conduct a pilot-scale study with available information, and then successively enhance and:or refine the analysis until a satisfactory end point is reached.
Implementing GIS presents a unique set of challenges. Even well-funded GIS projects can fail because of poor planning. In a recent study, Tomlinson (2008) outlined a 10-stage process for successfully deploying GIS from an “enterprise viewpoint” as follows: 1. Consider the strategic purpose; 2. Plan for the planning; 3. Determine technology requirements; 4. Determine the end products; 5. Define the system scope; 6. Create a data design; 7. Choose a data model; 8. Determine system requirements; 9. Analyze benefits and costs and 10. Make an implementation plan.
A complementary publication to the present review is that of Ross, Handisyde, and Nimmo (2009) on “Spatial decision support in aquaculture: the role of geographical information systems and remote sensing” The review is divided in five main sections: (1) Spatial planning context; (2) Database construction and project methodology;
7. GIS-based decision support tools and modelling for aquaculture development

The potential of spatial planning tools to support the ecosystem approach to aquaculture100
(3) Decision support systems and tools; (4) Selected applications and examples of geographical information systems in aquaculture (e.g. case study: climate change; case study: multi-site coastal zone planning); and (5) Summary and future trends.
A few topics and analytical methods are presented here in more detail because they represent key elements of a GIS project.
Geographical dataGeographical or spatial data are defined as undigested, unorganized, and unevaluated material that can be associated with a location. Data are of little value in and of themselves. To be useful they must be transformed into information. When data are organized, presented, analyzed, interpreted, and considered useful for a particular decision problem, they become information. Geographical information is defined as georeferenced data that have been processed into a form that is meaningful and of real or perceived value to decision-makers. Decision problems that involve geographical data and information are referred to as spatial decision problems (Malkzewski, 1999; Heywood, Cornelius and Carver, 2006).
Data are progressively converted into information to support the decision situation or decision problem. The decision situation determines the need and nature of the information required. To this end, it is useful to make a distinction between hard and soft information used for decision-making, sometimes referred to as objective and subjective information. Hard information is derived from reported facts, quantitative estimates, and systematic opinion surveys. Soft information represents the opinions of decision-makers. Any spatial decision-making must focus on a mix of hard and soft information. Central to spatial decision-making is the way in which these two types of information are combined to strike a balance for the desired level of predictability of the outcome. Decision problems can be categorized on a continuum ranging from predictable situations (perfect information) to situations that cannot be predicted (no information). The former is referred to as certainty or deterministic situation while the later is a decision problem under uncertainty. Uncertainty can be further categorized as stochastic (probabilistic) information and imprecise information (fuzzy decisions).
ClassificationIt is almost always the case that the source data, whether in real or integer format, will need to be further classified before further use. Classification is an essential part of any data reduction process, whereby complex sets of observations are made understandable. Although any classification process involves some loss of information, a good scheme not only aims to minimize this loss, but by identifying natural groups that have common properties, provides a convenient means of information handling and transfer (Burrough, 1986). Further, in any classification process, care must be taken to preserve the appropriate level of detail needed for sensible decision-making at a later stage (Burrough, 1986; Aguilar-Manjarrez, 1992; 1996; Ross, 1998).
Classification includes the use of “thresholds” for each data source to cast them into suitability classes for further modelling (e.g. high, medium, low suitability habitat for clams).Thresholds will entirely depend upon the nature of the project and are determined by the experts conducting the study using literature and consulting with other relevant experts. The source data together with their corresponding thresholds provide the basis for a GIS analysis.
As an example of classification the thresholds relating temperature to growth were determined by Kapetsky and Aguilar (2007) as one of the key criteria to estimate open ocean aquaculture potential for Cobia in the Atlantic and Gulf of Mexico and Puerto Rico-US Virgin Islands. Thresholds for cobia were based on Ueng et al. (2001) and M.J. Osterling (personal communication, 2005). Ueng et al. (2001) state that cobia growth

101
rates were highest from 28 to 32 oC and that growth decreased below 20 oC. They concluded that half of the growth rate variation was due to temperature variation. M.J. Osterling (personal communication, 2005) noted that cobia can be grown at temperatures from 21 to 28 oC and that better growth was attained at higher temperatures. He and others have observed that feed intake is reduced at temperatures below 20 oC.Aguilar-Manjarrez (1996) provides an exhaustive review of five methods that have been explored to classify data on land types for various uses that are equally relevant for classifying aquaculture data:
•The FAO land evaluation methodology which assesses land suitability in terms of an attribute set corresponding to different activities (e.g. very suitable (VS), suitable (S), moderately suitable (MS) and unsuitable (US)).
•The limitation method in which each land characteristic is evaluated on a relative scale of limitations (e.g. in the example above by Kapetsky and Aguilar (2007) the temperature thresholds were set using a limitation method for Cobia as < 20 oC, no feeding; 20-25 oC, growth; >25 oC better growth);
•The parametric method in which limitation levels for each characteristic are rated on a scale of 0 to 1, from which a land index (%) is calculated as the product of the individual rating values of all characteristics (e.g.. suitability scores are defined on an arbitrary scale ‘between” 0 and 1, where 0 defines a non-suitable area, and 1, the most suitable. This method provides a distinct advantage over traditional Boolean logic where an element must belong to a ‘crisp’ set (0 or 1) as it allows the discrimination of levels of suitability as opposed to a simple binary classification).
•The Boolean method which assumes that all questions related to land use suitability can be answered in a binary fashion, and that all important changes occur at a defined class boundary (an element must belong to a ‘crisp’ set (0 or 1), e.g. protected areas that are excluded for any aquaculture development altogether would be defined as 0);
•The fuzzy classification is usually defined on a continuous scale from zero to one, where zero is non-membership and one is full membership. Fuzzy classification may also be applied to geographic objects themselves, so that an object’s boundary is treated as a gradated area rather than an exact line. In GIS, fuzzy classification has been used in the analysis of soil, vegetation, and other phenomena that tend to change gradually in their physical composition and for which attributes are often partly qualitative in nature. (e.g. according to ICLARM and GTZ (1991), the most suitable slopes for large ponds (1-5 ha) in Africa should not exceed 1-2 percent. However, for small-scale farms where most ponds will be from 0.01-0.05 ha, slopes up to 5 percent are most favourable, thus the slope classification would range from 1-8 percent).
For GIS applications, all of the above methods can be used to classify source data into a point scale of suitability (with zero or one being the least suitable). However, the choice among classification and threshold methods to use is entirely dependent on the type of data and intended uses of the output information. From a GIS viewpoint classification and thresholds also allows normalization of all data layers, an essential pre-requisite for further modelling. From an EAA viewpoint, thresholds are useful in examining issues related to aquaculture and allow for the inclusion of policy decisions (e.g. pollution thresholds; carrying capacity limits, etc).
Multi-criteria evaluationDecision-analysis is a set of systematic procedures for analyzing complex decision problems. The basic strategy is to divide the decision problem into small, understandable parts; analyze each part; and integrate the parts in a logical manner to produce a meaningful solution (Malczewski, 1999).
7. GIS-based decision support tools and modelling for aquaculture development
The potential of spatial planning tools to support the ecosystem approach to aquaculture102
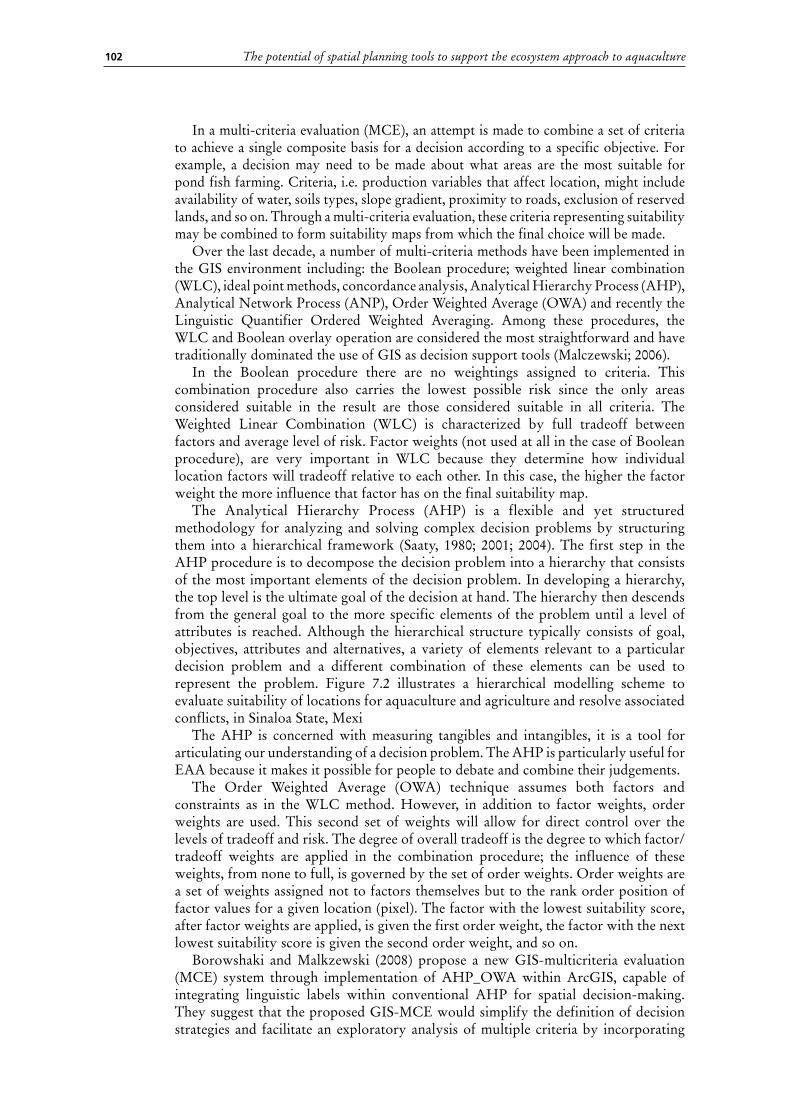
In a multi-criteria evaluation (MCE), an attempt is made to combine a set of criteria to achieve a single composite basis for a decision according to a specific objective. For example, a decision may need to be made about what areas are the most suitable for pond fish farming. Criteria, i.e. production variables that affect location, might include availability of water, soils types, slope gradient, proximity to roads, exclusion of reserved lands, and so on. Through a multi-criteria evaluation, these criteria representing suitability may be combined to form suitability maps from which the final choice will be made.
Over the last decade, a number of multi-criteria methods have been implemented in the GIS environment including: the Boolean procedure; weighted linear combination (WLC), ideal point methods, concordance analysis, Analytical Hierarchy Process (AHP), Analytical Network Process (ANP), Order Weighted Average (OWA) and recently the Linguistic Quantifier Ordered Weighted Averaging. Among these procedures, the WLC and Boolean overlay operation are considered the most straightforward and have traditionally dominated the use of GIS as decision support tools (Malczewski; 2006).
In the Boolean procedure there are no weightings assigned to criteria. This combination procedure also carries the lowest possible risk since the only areas considered suitable in the result are those considered suitable in all criteria. The Weighted Linear Combination (WLC) is characterized by full tradeoff between factors and average level of risk. Factor weights (not used at all in the case of Boolean procedure), are very important in WLC because they determine how individual location factors will tradeoff relative to each other. In this case, the higher the factor weight the more influence that factor has on the final suitability map.
The Analytical Hierarchy Process (AHP) is a flexible and yet structured methodology for analyzing and solving complex decision problems by structuring them into a hierarchical framework (Saaty, 1980; 2001; 2004). The first step in the AHP procedure is to decompose the decision problem into a hierarchy that consists of the most important elements of the decision problem. In developing a hierarchy, the top level is the ultimate goal of the decision at hand. The hierarchy then descends from the general goal to the more specific elements of the problem until a level of attributes is reached. Although the hierarchical structure typically consists of goal, objectives, attributes and alternatives, a variety of elements relevant to a particular decision problem and a different combination of these elements can be used to represent the problem. Figure 7.2 illustrates a hierarchical modelling scheme to evaluate suitability of locations for aquaculture and agriculture and resolve associated conflicts, in Sinaloa State, Mexi
The AHP is concerned with measuring tangibles and intangibles, it is a tool for articulating our understanding of a decision problem. The AHP is particularly useful for EAA because it makes it possible for people to debate and combine their judgements.
The Order Weighted Average (OWA) technique assumes both factors and constraints as in the WLC method. However, in addition to factor weights, order weights are used. This second set of weights will allow for direct control over the levels of tradeoff and risk. The degree of overall tradeoff is the degree to which factor/tradeoff weights are applied in the combination procedure; the influence of these weights, from none to full, is governed by the set of order weights. Order weights are a set of weights assigned not to factors themselves but to the rank order position of factor values for a given location (pixel). The factor with the lowest suitability score, after factor weights are applied, is given the first order weight, the factor with the next lowest suitability score is given the second order weight, and so on.
Borowshaki and Malkzewski (2008) propose a new GIS-multicriteria evaluation (MCE) system through implementation of AHP_OWA within ArcGIS, capable of integrating linguistic labels within conventional AHP for spatial decision-making. They suggest that the proposed GIS-MCE would simplify the definition of decision strategies and facilitate an exploratory analysis of multiple criteria by incorporating

103
qualitative information within the analysis. To illustrate the application of AHP_OWA in a real-world decision problem, the authors used data for a land suitability problem in Arva and Ilderton region, north of London, Ontario, Canada. One of the few applications using the OWA approach in aquaculture so far has been that conducted for a site selection analysis for oyster culture in the southern bay of the Florianópolis in Brazil (SEAP, 2007). This new AHP_OWA approach is useful for EAA in that it can assist in combining the right balance between the amount of hard and soft information used in the decision-making process.
7. GIS-based decision support tools and modelling for aquaculture development
In summary, decision-making is a sequential process. Any decision-making process begins with the definition of the problem or the objective to be reached. Once the decision problem is defined, what follows is setting up a set of criteria that reflect all aspects of the problem. The purpose of weights is to express the importance or preference of each criterion relative to other criteria. Alternatives are often determined by constraints, which limit the decision space of feasible alternatives. Decision rules integrate criteria, weights and preferences to generate an overall assessment of the alternatives. Recommendations are based on a ranking of the alternatives, with reference to possible uncertainties or sensitivities. Sensitivities are changes in the input of the analysis that bias the outcome.
7.3 MODELLINGFor the purpose of this report, the term “model” is defined as a simplified representation of reality used to simulate a process, understand a situation, predict an outcome, or analyse a problem. A model can be viewed as a selective approximation, which, by elimination of incidental detail, allows some fundamental aspects of the real world to appear or be tested (Crespi and Coche, 2008).
Four strategies are used to integrate GIS with spatial analysis and modelling. These are: embedding GIS into analysis and modelling; embedding analysis and modelling into GIS; tight coupling; and loose coupling (Figures 7.3a-d).

The potential of spatial planning tools to support the ecosystem approach to aquaculture104
An overview is given below of some of the GIS related modelling approaches in aquaculture in the context of their potential to support the EAA.
Particulate waste dispersion modelWaste production from aquaculture activities is probably perceived to be one of the most controversial and detrimental impacts from aquaculture on the environment. Literature is conflicting in terms of the magnitude of the effects. It has been proposed that these impacts may not in fact be too detrimental as only as small fraction of the total nutrients are added to coastal waters (Black, 2001).
Models for dispersion of fish wastes have been under development at the Institute of Aquaculture in Stirling since the early 1990’s. The model of dispersion of particulate wastes has developed through a series of stages, from simple spreadsheet-based calculations (Telfer, 1995) to more complex spreadsheet models using GIS functions (Walls, 1996; Perez et al., 2002; Brooker, 2002;) to a fully integrated GIS dispersion model (Corner et al., 2006), and through to a complex spreadsheet particulate model (Kimber, 2007). More recently, Hunter, Telfer and Ross (2006; 2007) and Hunter (2009) have developed multi-site particulate dispersion models for marine cage fish culture in Scotland at one metre resolution. The model was run on a range of coastal fjord systems and demonstrated the variation in particulate waste dispersion patterns in each fjord system. Hunter’s particulate model proved to be effective and rapid to deploy in multiple sites, and with further refinements this model could further extend the capabilities of current waste dispersal modelling.
105
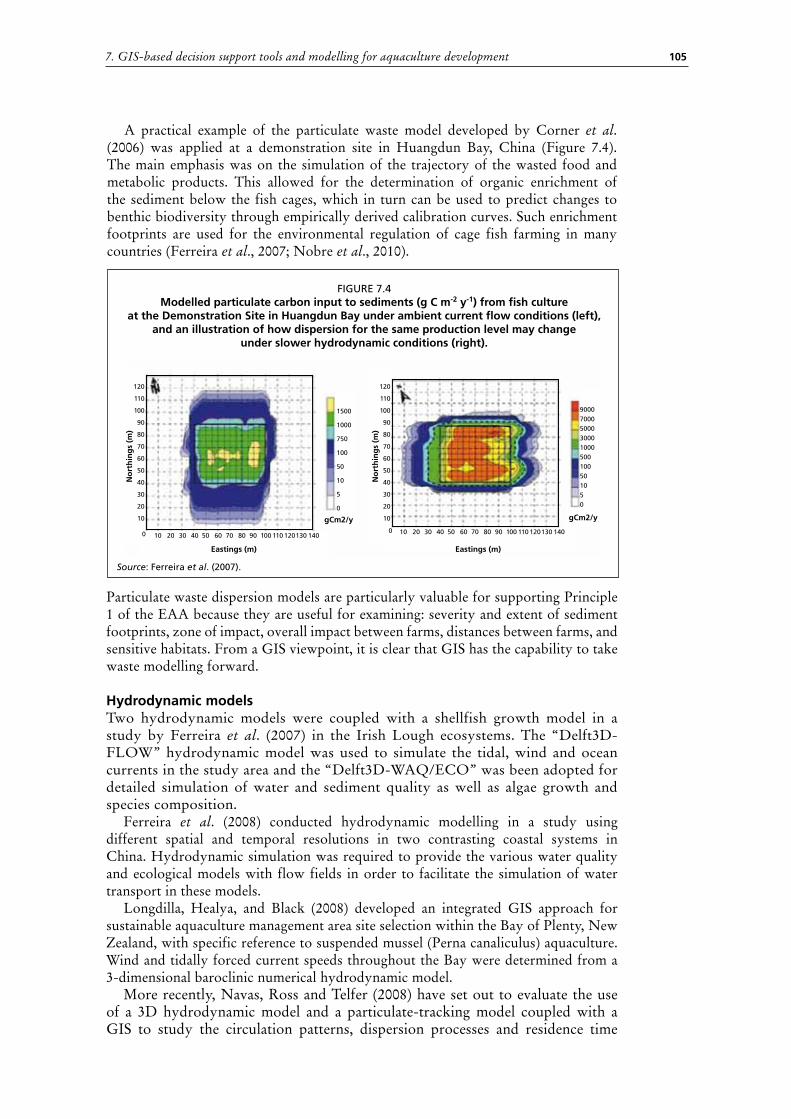
A practical example of the particulate waste model developed by Corner et al. (2006) was applied at a demonstration site in Huangdun Bay, China (Figure 7.4). The main emphasis was on the simulation of the trajectory of the wasted food and metabolic products. This allowed for the determination of organic enrichment of the sediment below the fish cages, which in turn can be used to predict changes to benthic biodiversity through empirically derived calibration curves. Such enrichment footprints are used for the environmental regulation of cage fish farming in many countries (Ferreira et al., 2007; Nobre et al., 2010).
7. GIS-based decision support tools and modelling for aquaculture development
FIGURE 7.4Modelled particulate carbon input to sediments (g C m-2 y-1) from fish culture
at the Demonstration Site in Huangdun Bay under ambient current flow conditions (left),and an illustration of how dispersion for the same production level may change
under slower hydrodynamic conditions (right).
Source: Ferreira et al. (2007).
Particulate waste dispersion models are particularly valuable for supporting Principle 1 of the EAA because they are useful for examining: severity and extent of sediment footprints, zone of impact, overall impact between farms, distances between farms, and sensitive habitats. From a GIS viewpoint, it is clear that GIS has the capability to take waste modelling forward.
Hydrodynamic modelsTwo hydrodynamic models were coupled with a shellfish growth model in a study by Ferreira et al. (2007) in the Irish Lough ecosystems. The “Delft3D-FLOW” hydrodynamic model was used to simulate the tidal, wind and ocean currents in the study area and the “Delft3D-WAQ/ECO” was been adopted for detailed simulation of water and sediment quality as well as algae growth and species composition.
Ferreira et al. (2008) conducted hydrodynamic modelling in a study using different spatial and temporal resolutions in two contrasting coastal systems in China. Hydrodynamic simulation was required to provide the various water quality and ecological models with flow fields in order to facilitate the simulation of water transport in these models.
Longdilla, Healya, and Black (2008) developed an integrated GIS approach for sustainable aquaculture management area site selection within the Bay of Plenty, New Zealand, with specific reference to suspended mussel (Perna canaliculus) aquaculture. Wind and tidally forced current speeds throughout the Bay were determined from a 3-dimensional baroclinic numerical hydrodynamic model.
More recently, Navas, Ross and Telfer (2008) have set out to evaluate the use of a 3D hydrodynamic model and a particulate-tracking model coupled with a GIS to study the circulation patterns, dispersion processes and residence time

The potential of spatial planning tools to support the ecosystem approach to aquaculture106
in an Irish fjord, and area of restricted exchange, geometrically complicated and host to many important aquaculture activities (Figure 7.5). The hydrodynamic model was calibrated and validated by comparison with sea surface and water flow measurement data collected in 2005 at two stations along the fjord. The model provided spatial and temporal information on circulation and renewal time and helped to determine the influence of winds on circulation patterns. Note: The full animation can be seen at: www.aqua.stir.ac.uk/GISAP/gis-group/juan.php
FIGURE 7.53D hydrodynamic model and a particulate-tracking model coupled with a GIS
to study the circulation patterns, dispersion processes and residence time in Mulroy Bay,a sea loch in the north-west of Ireland
Source: Navas, Ross and Telfer (2008).
Another good example of Hydrographic modelling of value to EAA is a study by White (2009) carrying out an Environmental Impact Assessment and monitoring of small-scale cage farms in Bolinao, Philippines. Hydrographic modelling was used to assess residence time and predictive modelling was used to estimate impact on the sediments and to identify the optimal areas for siting aquaculture zones and distances between these zones.
Hydrodynamic models are useful for the EAA because they can be used to resolve a number of relevant issues for aquaculture such as flushing and dispersion and residence time of particles (e.g. nutrients); pollution patterns, sea lice life cycle, etc. Also, the dynamic nature of these simulations make them particularly valuable for facilitating policy decisions.
Growth modelsA step in coupling GIS with fish growth models was taken by Kapetsky and Nath (1997) and by Aguilar-Manjarrez and Nath (1998) to assess fish farming potential in Latin America and Africa respectively. Two simulation models were used in these studies. The first of these was used to generate mean monthly water temperature profiles across each continent. This output was then used, among other input parameters, in a bioenergetics model to estimate fish yield potential (in crops per year) for indicator

107
species under small-scale and commercial farming conditions (Figures 7.6a,b). The resulting output was exported to GIS for further analysis and manipulation. Suitability maps from the farming system models were overlaid with those from the bioenergetics model to reach a combined evaluation that indicated the coincidence of each land quality suitability class with a range of yield potential.
From a EAA viewpoint, these studies are useful for examining spatial issues related to the development of aquaculture and illustrate how quantitative estimates of potential can be derived to show where and how much potential is available. From a GIS perspective, these studies are noteworthy because they managed to incorporate a bioenergetics model into the GIS to predict, for the first time, fish yields across Latin America and Africa. A follow-up to these studies could look at climate changes implications on growth.
7. GIS-based decision support tools and modelling for aquaculture development
Note: Figures 7.6a,b are outputs from the bioenergetics model. The outputs of the farming systems models (not shown in these figures) included land quality factors such as water resources, soils, population density, etc.
BiodiversitySeeking the sustainable development of marine cage sitting for aquaculture, Hunter (2009) developed a GIS-based model to show the distribution of important areas for biodiversity in coastal areas of the Western Isles in Scotland. The area is host to a wide variety of diverse habitats and species but is also a significant area for aquaculture in Scotland. GIS was used to develop species distribution and habitat suitability models to establish the interaction of biodiversity with aquaculture and the potential consequences of aquaculture development. A number of biodiversity indicators of sensitivity were included in the model, including endangered species, species sensitive to aquaculture, protected areas, fish spawning and nursery areas and species important to the Western Isles. The combination of these models highlighted areas of low and high biodiversity and the consequences that aquaculture development would have on the biodiversity of the area.
It is realistic to expect that aquaculture, being a human activity, will lead to some loss of biodiversity or affect ecosystems services to some extent. Thus from an EAA perspective this study is particularly useful because it used biodiversity indicators to assess the ability of coastal sites to incorporate aquaculture activities whilst still ensuring that the relevant biodiversity criteria such as endangered species are considered. From
FIGURE 7.6aPotential yield (crops/yr) of pacu fed at
75 percent satiation and harvested at 600 g
FIGURE 7.6bPotential yield (crops/yr) of African catfish -
Commercial farming
Source: Kapetsky and Nath (1997). Source: Aguilar-Manjarrez and Nath (1998).
1.5 - 2.01.0 - 1.50.5 - 1.0‹ 0.5No Crops
No Crops‹ 0.50.5 - 0.90.9 - 1.31.3 - 1.7ConstraintsCountry boundaries
The potential of spatial planning tools to support the ecosystem approach to aquaculture108
a GIS viewpoint this study is innovative because it deals with a combination of species and groups of indicator species and with very little modification these models could also be developed to cover the entire Scottish coastline and if relevant data is also available they could be applied in any coastal locations worldwide.
ECASA ToolboxECASA an ecosystem approach to sustainable aquaculture toolbox is an innovative environmental management resource developed specifically for European marine aquaculture. The toolbox has evolved over the course of the ECASA project with the aim of answering the needs of industry, regulators and environmental managers involved in marine aquaculture. The ECASA toolbox is an internet based source of information on a range of indicators, models and procedures that can be applied to shell-fish and fin-fish aquaculture, informing on Environmental Impact Assessment and effective site selection (www.ecasa.org.uk). A number of the models have been used in the case studies presented in this chapter (e.g. DEPOMOD), and they are a rich source of information.
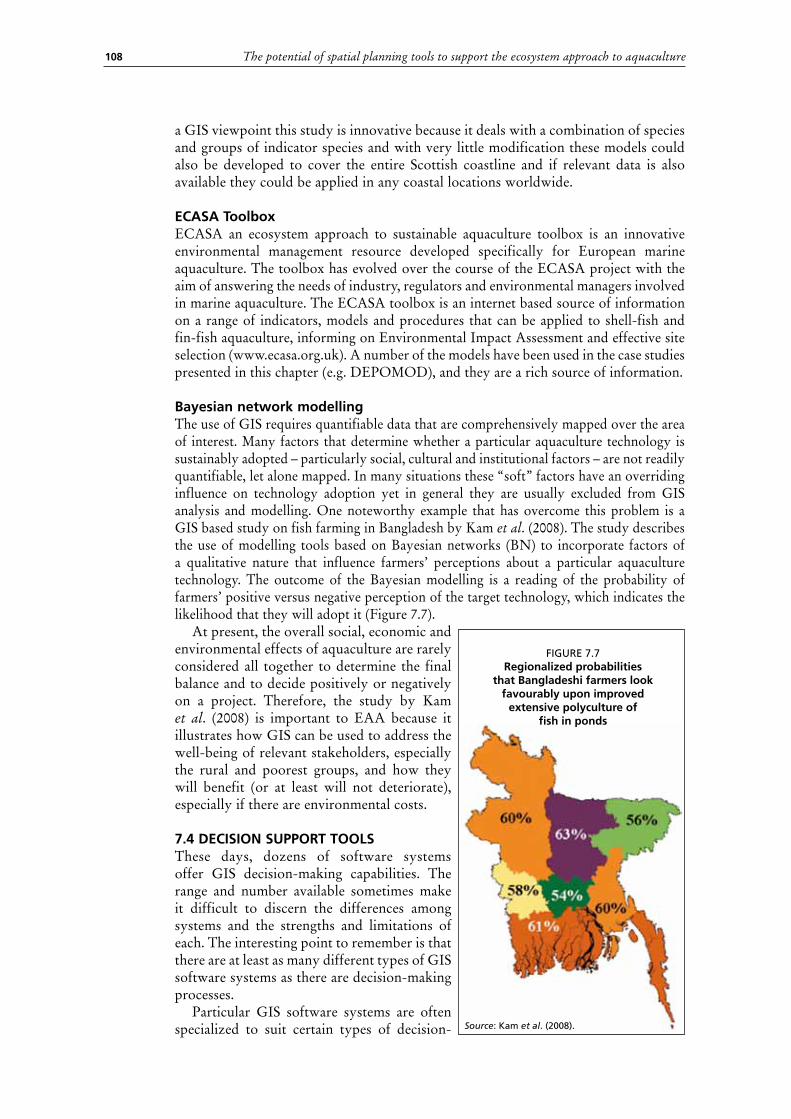
Bayesian network modellingThe use of GIS requires quantifiable data that are comprehensively mapped over the area of interest. Many factors that determine whether a particular aquaculture technology is sustainably adopted – particularly social, cultural and institutional factors – are not readily quantifiable, let alone mapped. In many situations these “soft” factors have an overriding influence on technology adoption yet in general they are usually excluded from GIS analysis and modelling. One noteworthy example that has overcome this problem is a GIS based study on fish farming in Bangladesh by Kam et al. (2008). The study describes the use of modelling tools based on Bayesian networks (BN) to incorporate factors of a qualitative nature that influence farmers’ perceptions about a particular aquaculture technology. The outcome of the Bayesian modelling is a reading of the probability of farmers’ positive versus negative perception of the target technology, which indicates the likelihood that they will adopt it (Figure 7.7).
At present, the overall social, economic and environmental effects of aquaculture are rarely considered all together to determine the final balance and to decide positively or negatively on a project. Therefore, the study by Kam et al. (2008) is important to EAA because it illustrates how GIS can be used to address the well-being of relevant stakeholders, especially the rural and poorest groups, and how they will benefit (or at least will not deteriorate), especially if there are environmental costs.
7.4 DECISION SUPPORT TOOLSThese days, dozens of software systems offer GIS decision-making capabilities. The range and number available sometimes make it difficult to discern the differences among systems and the strengths and limitations of each. The interesting point to remember is that there are at least as many different types of GIS software systems as there are decision-making processes.
Particular GIS software systems are often specialized to suit certain types of decision-

109
making. That is, they are customized to meet specific needs, e.g. to demographic forecasting, transportation planning, environmental resource analysis, urban planning, fisheries, aquaculture, coastal zone management, and so on. These systems may respond well to individual problems, but they are also limiting. Special-purpose GIS designed for airport planning and maintenance, for instance, will not be well suited to demographic modelling.
Other software systems are not so specialized. The Intergraph Corporation’s MGE/MGA system or ArcGIS (produced by the Environmental Systems Research Institute) have become well-known because they can be used in a wide number of applications. These general purpose systems also offer features that can be customized or made available as add-on extensions to meet various individual needs.
Other systems such as MapInfo attempt to provide functions that will be of value in one or more of the broad application domains, for instance in demographic analysis or marketing research. Yet quite apart from these more general systems, there are dozens of very specialized software systems that are best suited to one task, one application, or even to just one part of a broader decision-making process, for example for storing maintenance records of a highway system or for planning the expansion of an electric distribution network. Table 7.1 is a list of GIS and Decision Analysis software products that support many of the spatial decision analysis techniques and methods relevant to aquaculture.
Belton and Stewart (2002) state that software is essential for effective multi-criteria analysis. In this way the facilitator, analyst and decision-maker are free from the technical implementation details and are able to focus on the fundamental value judgment and choices. They conclude that although it is possible to set-up macros in a spreadsheet to achieve this, it is more convenient to use specially designed software. Janssen and van Herwijnen (2006) compiled a list of software tools (a few which are built into GIS) to support multi-criteria analysis that may aid aquaculture activities (siting, zoning, monitoring, etc). The list becomes rapidly outdated. Therefore, other listings of MCE software can be found at www.lionhrtpub.com/orms/ORMS-search.shtml.
Not all the GIS software listed in Table 7.1 are described below, and instead, the main GIS softwares used in aquaculture so far are described along with recent examples that are most relevant to EAA.
IdrisiTo date, IDRISI is still the industry leader for the development of decision support software. Based within the Graduate School of Geography at Clark University, Clark Labs is known for pioneering advancements in areas such as decision support, uncertainty management, classifier development, change and time series analysis, and dynamic modelling. Clark Labs is best known for its flagship product, the IDRISI GIS and Image Processing software. Over the past several years, the research staff at the Clark Labs have been specifically concerned with the use of GIS as a direct extension of the human decision-making process—most particularly in the context of resource allocation decisions. In 1993, IDRISI introduced the first instance of Multi-Criteria and Multi-Objective decision making tools in GIS.
Clark Labs worked with Conservation International over a period of several years to develop a modelling environment that could be used for a variety of land change scenarios and contexts. This cutting-edge tool, the Land Change Modeler for Ecological Sustainability, was released within the IDRISI software in 2006. In 2007, Clark Labs developed the Land Change Modeler as an extension for ArcGIS, broadening the accessibility of this
1 DEPOMOD is a particle tracking model used for predicting the sinking and resuspension flux of
particulate waste material (and special components such as medicines) from fish farms and the benthic
community impact of that flux.
7. GIS-based decision support tools and modelling for aquaculture development
The potential of spatial planning tools to support the ecosystem approach to aquaculture110
important tool for users concerned with land change, conservation and biodiversity. IDRISI’s pioneering advancements in decision support, uncertainty management, classifier development, change and time series analysis, and dynamic modelling are all useful in supporting EAA. The new Land Change Modeler will be particularly valuable tool for predicting the interactions between aquaculture and biodiversity.
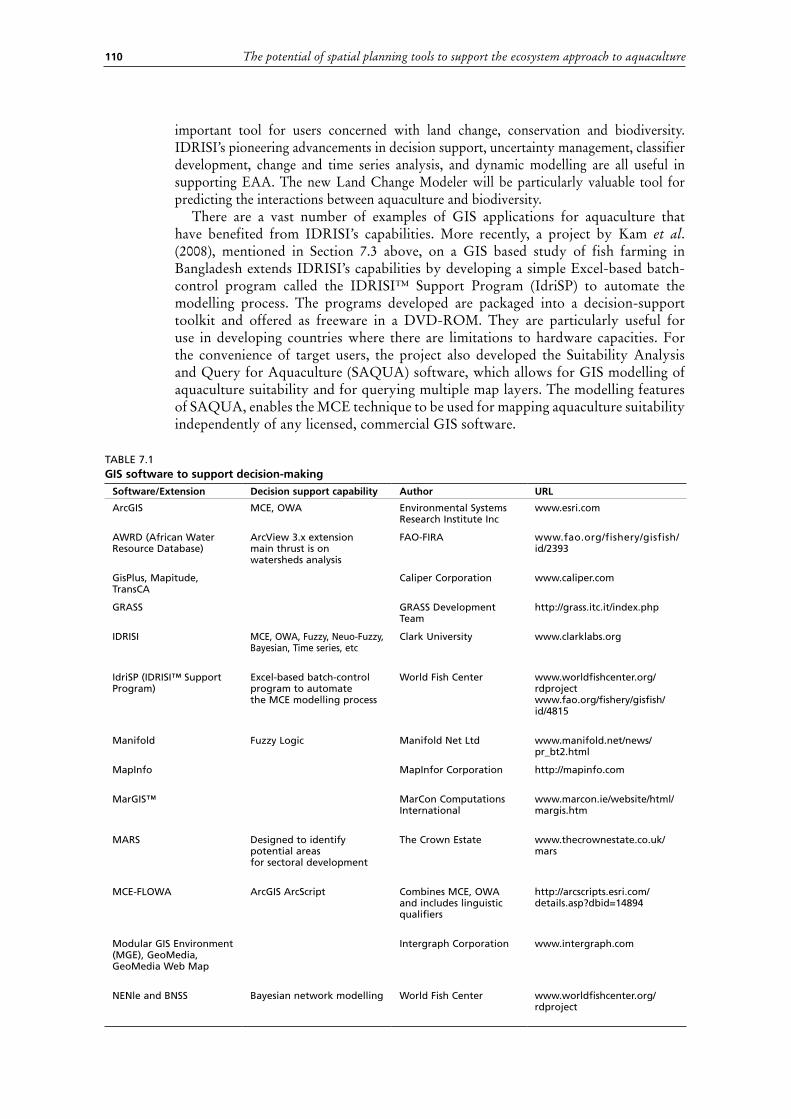
There are a vast number of examples of GIS applications for aquaculture that have benefited from IDRISI’s capabilities. More recently, a project by Kam et al. (2008), mentioned in Section 7.3 above, on a GIS based study of fish farming in Bangladesh extends IDRISI’s capabilities by developing a simple Excel-based batch-control program called the IDRISI™ Support Program (IdriSP) to automate the modelling process. The programs developed are packaged into a decision-support toolkit and offered as freeware in a DVD-ROM. They are particularly useful for use in developing countries where there are limitations to hardware capacities. For the convenience of target users, the project also developed the Suitability Analysis and Query for Aquaculture (SAQUA) software, which allows for GIS modelling of aquaculture suitability and for querying multiple map layers. The modelling features of SAQUA, enables the MCE technique to be used for mapping aquaculture suitability independently of any licensed, commercial GIS software.
TABLE 7.1GIS software to support decision-making
Software/Extension Decision support capability Author URL
ArcGIS MCE, OWA Environmental Systems Research Institute Inc
www.esri.com
AWRD (African Water Resource Database)
ArcView 3.x extension main thrust is on watersheds analysis
FAO-FIRA www.fao.org/fishery/gisfish/id/2393
GisPlus, Mapitude, TransCA
Caliper Corporation www.caliper.com
GRASS GRASS Development Team
http://grass.itc.it/index.php
IDRISI MCE, OWA, Fuzzy, Neuo-Fuzzy, Bayesian, Time series, etc
Clark University www.clarklabs.org
IdriSP (IDRISI™ Support Program)
Excel-based batch-control program to automate the MCE modelling process
World Fish Center www.worldfishcenter.org/rdprojectwww.fao.org/fishery/gisfish/id/4815
Manifold Fuzzy Logic Manifold Net Ltd www.manifold.net/news/pr_bt2.html
MapInfo MapInfor Corporation http://mapinfo.com
MarGIS™ MarCon Computations International
www.marcon.ie/website/html/margis.htm
MARS Designed to identify potential areas for sectoral development
The Crown Estate www.thecrownestate.co.uk/mars
MCE-FLOWA ArcGIS ArcScript Combines MCE, OWA and includes linguistic qualifiers
http://arcscripts.esri.com/details.asp?dbid=14894
Modular GIS Environment (MGE), GeoMedia, GeoMedia Web Map
Intergraph Corporation www.intergraph.com
NENle and BNSS Bayesian network modelling World Fish Center www.worldfishcenter.org/rdproject

111
Software/Extension Decision support capability Author URL
Smallworld GIS Smallworld Systems Inc. www.worldfishcenter.org/rdprojectwww.fao.org/fishery/gisfish/id/4815
SAQUA (Suitability Analysis and Query for Aquaculture)
MCE and Bayesiannetwork modelling
World Fish Center www.worldfishcenter.org/rdprojectwww.fao.org/fishery/gisfish/id/4815
SPANS (Spatial Analysis System)
TYDAC Research Inc. www.pcigeomatics.com
ArcGIS softwareESRI designs and develops the world’s most widely used GIS technology. ESRI software is used by more than 300 000 organizations worldwide (www.esri.com). To increase the capabilities of ESRI products, optional software modules (or extensions) add specialized tools and functionality. ESRI’s ArcGIS 9.3 desktop allows one to analyze data, examine relationships, test predictions, and ultimately make better decisions. It is a family of three products—ArcInfo, ArcEditor, and ArcView—that share the same core applications, user interface, and development environment. Each product provides additional GIS functionality whilst moving from ArcView to ArcEditor to ArcInfo (www.esri.com/software/arcgis/about/gis_for_me.html).
Specific to decision support, both the Analytical hierarchy process (AHP) and the Linguistic Quantifier Ordered Weighted averaging (OWA) procedures have been implemented individually in GIS environments. Eastman (1997) and Jiang and Eastman (2000) implemented OWA operators in GIS-IDRISI. Malczewski et al. (2003) implemented parameterized OWA procedures in ArcView 3.2 (i.e. a previous version of ArcGIS) environment as a GIS-OWA module. The AHP has been part of the IDRISI functionality for many years and it has also been implemented in the ArcGIS environment as a VBA macro (Marinoni, 2004).
A recent implementation of the AHP-OWA operators using fuzzy linguistic quantifiers has been developed by Boroushaki and Malczewski (2008) as an ArcScript extension (MCE-FLOWA). The AHP-OWA ArcScript brings the capabilities of the AHP and the OWA into ArcGIS environment for spatial decision-making problem solving.
MCE and OWA methods can be conducted manually, using map algebra in Excel and/or using a calculator or a model builder within a GIS software. However, the MCE-FLOWA ArcSrcipt facilitates the process by proving a single tool thus making the entire MCE/OWA process easier and faster and improving ArcGIS functionalities.
The MCE technique was used by Vianna (2007) to improve the decision-making process for assessing the potential of marine aquaculture in the southern bay of Florianópolis, Brazil. A simplified version of this study using a small subset of factors and criteria has been drafted by L. Vianna and Philip Scott using the MCE-FLOWA ArcSript to conduct a few GIS training courses in Brazil (L. Vianna, personal communication, 2010). The use of MCE-FLOWA is interesting from a GIS viewpoint because it is perhaps the first application to use the ArcScript for aquaculture. The novelty behind this approach is that it deals with uncertainty of imprecise information and the final maps are presented in a continuous scale from zero to one to illustrate areas from low to high aquaculture potential.
7. GIS-based decision support tools and modelling for aquaculture development
TABLE 7.1 Cont.GIS software to support decision-making

The potential of spatial planning tools to support the ecosystem approach to aquaculture112
ArcView 3.3ArcView started as a graphical program for spatial data and maps made using ESRI’s other software products. Over time more and more functionality was added to ArcView and it became a real GIS program capable of complex analysis and data management. Its simple GUI was preferred by many over the less user friendly, more powerful ARC/INFO. ArcView GIS 3.3 is still currently available, but as a retired product. Many users still use the older version, especially in developing countries because it is cheaper than ArcGIS and hardware requirements are less.
Jenness, et al. (2007a;b) created the “African Water Resource Database” (AWRD), a set of data and custom-designed tools, combined in a GIS analytical framework aimed at facilitating responsible inland aquatic resource management with a specific focus on inland fisheries and aquaculture (www.fao.org/fishery/gisfish/id/2389). The AWRD tool itself is an example of an ArcView 3.x extension to provide an assortment of new custom-designed applications and tools in addition to those provided by ArcView 3.x. The AWRD is valuable to EAA because it can be immediately applicable to assist in a wide variety of issues such as transboundary movements of aquatic species and increased participation of stakeholders in the decision-making process about watershed area uses. At present, two FAO Technical Cooperation projects in Cameroon and Mauritania are making use of the AWRD to support the development of master plans for the development of aquaculture in Cameroon, and aquaculture and inland fisheries in Mauritania. The AWRD also serves as an excellent tool for training.
MarGIS™The objectives of the Understanding Irish Shellfish Culture Environments (UISCE) project were to: 1) develop a suite of computer models to facilitate the prediction of different aquaculture and water quality scenarios which could influence the nature and/or scale of shellfish aquaculture activity in a bay area; 2) to provide decision support system, based on the suite of computer models to the aquaculture industry with respect to the best locations and optimal size of shellfish aquaculture sites; 3) to provide an information base and liaison facility for industry (Dallaghan, 2009).
The decision support system titled MarGIS™ is a near real time interactive software application, tailored specifically for shellfish growers around the Irish coast, which will enable them to optimise their operations and production in a sustainable and environmentally sensitive manner. By using near real time current conditions, MarGIS™ will allow a farmer to quickly see what effect on his productivity would be expected if he were to make stocking density changes, for example, or to reposition one or all of his mussel lines, or introduce more mussel lines in the vicinity of the existing farm. By allowing the optimization of husbandry techniques such as this, the software encourages farmers and communities to work together (A. Berry, personal communication, 2010).
MarGIS™ has been developed within the ESRI ArcView environment to facilitate location specific predictions from the suite of computer models and allows for the modelling and reporting on issues surrounding the shellfish aquaculture industry from a ‘macro’ or bay scale level through to a ‘micro’ or individual animal level (Figure 7.8).
The primary deliverable from the UISCE project is not a ‘once off’ report. The resultant desktop application can be used repeatedly by growers and functionality added and refined as required. This system gives growers access to the best science that’s out there and the knowledge, in software form, of international experts.

113
The system makes it easier to understand embayment from a food and flow perspective thus allowing growers to move away from ‘trial and error’ aquaculture. The data generated by this project forms an information base for industry and other state agencies. This data can be built upon and put to a variety of uses. An online demonstration of MarGIS™ can be seen at www.marcon.ie/website/html/margisdemo.htm.
7. GIS-based decision support tools and modelling for aquaculture development
FIGURE 7.8Menu options of the MarGIS_UISCE application
Source: Dallaghan (2009).
MarGIS™ is especially relevant to EAA for a number of reasons; it can be used to infer near real time scenarios of environmental impacts of aquaculture at both farm and bay scales; the application encourages farmers and communities to work together thus ensures stakeholders inputs and participation; it centralizes the best science available in the fields of shellfish growth, aquaculture, water quality and ecological models and it places all this expertise under one roof. In fact, the integration of models with the GIS framework and the construction of a mechanism whereby models could communicate to each other was one of the project cornerstones.
MaRSThe Crown Estate recognises that a strategic and proactive management approach will facilitate the equitable and sustainable use of the marine environment. MaRS (Marine Resource System) is being developed to increase expertise in the management of this key national asset and to ensure the multiple demands on this resource are managed in a responsible manner. MaRS is a decision-support tool using GIS technology to identify potential areas for sectoral development and has been successfully applied to wind farm development off shore (www.thecrownestate.co.uk/mars). The tool produces three key outputs: site suitability for potential business activity, the sustainability value of that activity and financial analysis of the potential revenue to the business which will enable long term informed decision-making for marine development.

The potential of spatial planning tools to support the ecosystem approach to aquaculture114
AquaModelAquaModel is an information system to assess the operations and impacts of fish farms in both water column and benthic environments, the first of its kind (www.aquamodel.org). AquaModel is a “plug-in” model that resides within the EASy Marine Geographic Information System which has been used on numerous studies and investigations involving fisheries and oceanographic topics. All environmental information from field measurements to satellite imagery is readily available for model development and use. AquaModel can be used to examine near and far field effects of individual or clusters of farms in the coastal shelf where nearshore or open-ocean aquaculture may develop. It is being adapted to deal with multiple, separate cages and multiple farm sites to meet this challenge. AquaModel is designed for: Administrators, who establish and enforce rules and extent of impact; Fish farmers, who wish to plan farms and obtain permits and; Investors, who wish to assess risks and opportunities (http://netviewer.usc.edu/aquamodel/OverviewAquaculture.html).
AquaModel runs on personal computers and describes benthic and water column effects concurrently. It has additional features not found in other models such as oxygen deficit plume modelling, sediment oxygen perturbation, phytoplankton stimulation, and zooplankton growth results from nutrient addition. A few options are shown in Figure 7.9.
FIGURE 7.9Example screen print of submerged fish farm model run,
with main scene showing deposition state of carbon on the sea bottomnear three fish farms of differing fish biomass
Source: Rensel, Kiefer and O’Brien (2007).
Rensel, Kiefer and O’Brien (2007) describe a practical implementation of the AquaModel looking at “Modelling Water Column and Benthic Effects of Fish Mariculture of Cobia (Rachycentron canadum) in Puerto Rico: Cobia AquaModel.
Web-based toolsRapid access to a broad spectrum of information and fast communication of ideas and data via the Internet are important stimuli to further development of GIS for aquaculture (examples are shown in Box 7.1).

1157. GIS-based decision support tools and modelling for aquaculture development
BOX 7.1Examples of Web based innovation projects in Aquaculture
Examples of work developed on Web-based applications for Aquaculture using GIS
• Brazil - The Special Secretariat for Aquaculture and Fisheries in Brazil (SEAP) created a National System for the Authorization of Aquaculture in Union Waters using GIS and Google Earth (http://200.198.202.145/seap/sinau_web/html2/google_earth.html).
• Canada – The Department of Agriculture and Aquaculture in New Brunswick maintains geographic information relating to the location of the province’s marine aquaculture resources. MASM is a new GIS support tool which displays maps of all New Brunswick Crown Land marine aquaculture sites, as well as some site specific information, such as a site’s size, the waterbody where it is located, and whether it is an approved site, a vacant site or a proposed site. Users of the tool will be able to view all marine aquaculture sites situated in tidal waters of New Brunswick (www.gnb.ca/0177/01770004-e.asp).– The Department of Fisheries and Oceans (DFO) is the leasing and licensing authority in the province of Prince Edward Island They have a mapping system that can be found at: www.glf.dfo-mpo.gc.ca/ao-bl/pei-ipe/leasing-baux/maps-cartes-e.php– Maps of aquaculture sites in British Columbia are available for download in GIS format at www.agf.gov.bc.ca/fisheries/finfish_main.htm under “Site Locations”.– The Nova Scotia Department of Fisheries and Aquaculture have developed Aquaculture Site Mapping for the Nova Scotia Fisheries and Aquaculture, Aquaculture Division (www.gov.ns.ca/fish/aquaculture/aquamap.shtml).
• Chile - Chiles Industry Association for Salmon created a very interesting Web site that contains a section on “environmental monitoring” and “aquaculture zoning” for the industry (www.salmonchile.cl/frontend/seccion.asp?contid=473&secid=6&secoldid=6&subsecid=141&pag=1).
• Ecuador - An interesting example on the use of GIS, Remote Sensing and the Internet for assessing health management of shrimp aquaculture is an alert system to monitor shrimp health in the Gulf of Guayaquil, Ecuador (www.saema.espol.edu.ec/Jsp/index.jsp?NavBarId=gi1&idioma=1).
• Norway - The Directorate of Fisheries in Norway has created an interactive and very detailed map showing the locations of all the individual farms and their attributes; however, the site is in Norse. (http://kart.fiskeridir.no/adaptive).
• Peru - The Department of Aquaculture at the Ministry of Production in Peru has created an online mapping system to inventory and zone aquaculture (http://gis-dga.produce.gob.pe:8181/CATASTRO_ACUICOLA/mapviewer.jsf).
• South Africa - The Aquaculture Activities in the Western Cape Web site for South Africa has one of the largest sets of GIS the matic resources for that area. While it includes admin is tra tive areas, there are also data for estuaries, dams, rivers, marine coastal resources and even shellfish sites (http://gis.pgwc.gov.za/AISAMapping_v3_20100323/Default.aspx).
• Thailand - The Fishery Information Technology Center at the Department of Fisheries, Thailand develops and maintains computer networking, GIS, management information systems, and fisheries data collection and statistics reports for end users in Thailand. Current projects are: Inventories of aquaculture and fisheries structures; Fish cage identification and inventory; Vessel Monitoring systems; Fishing gear detection; and Flood management. Outputs from the GIS analysis are displayed on the Internet using ArcIMS technology and for internal use (http://gis.fisheries.go.th/gis/WWW/index.jsp).
• Global - The National Aquaculture Sector Overview (NASO) map collection consists of Google maps showing the location of aquaculture sites and their characteristics at an administrative level (state, province, district, etc) mainly, and at an individual farm level depending on the degree of aquaculture development, the resources available to complete a data collection form, and the level of clearance provided by the country experts. The NASO maps will be presented in the NASO Fact Sheets (www.fao.org/fishery/naso/search/en) and will be made available for about 20 countries in mid 2010.
The potential of spatial planning tools to support the ecosystem approach to aquaculture116
Remote sensingThe scope of earth observation by satellite remote sensing, is very broad. It covers the physical system (e.g. surface temperature, winds, surface height, surface waves, ice cover and soon, surface salinity, land cover), as well as the ecosystem and water quality and surveillance. All of these are relevant to fisheries and aquaculture. Earth observation data have a very rich potential for both fisheries and aquaculture. Remotely-sensed data have been used in near-shore aquaculture site selection for more than 20 years (Kapetsky et al., 1987; Meaden and Kapetsky, 1991; Kapetsky and Aguilar-Manjarrez, 2007).
Remote sensing is as an essential tool for the capture of data subsequently to be incorporated into a GIS and for real time monitoring of environmental conditions for operational management of aquaculture facilities. Remote sensing has been used to map the location of relevant land cover features in catchment areas, as well as the relevant aquaculture structures (Travaglia et al.,2004; Ferreira, et al., 2008). Remote sensing also has an important role to play in the early detection of Harmful Algal Blooms (HABs). For example, a team led by Hatfield Consultants Ltd. (Hatfield), under the ESA-funded Chilean Aquaculture Project (CAP), has implemented an early warning service based on Earth Observation (EO) data, which delivers forecasts of potential HABs to aquaculture companies via a customised Internet portal (Figure 7.10).
Through funding provided by the European Space Agency (ESA), Hatfield demonstrated an information framework for future Near Real Time (NRT) data integration of environmental and spatial data to improve management and monitoring of aquaculture facilities. The Chilean Aquaculture Project (CAP) project was designed for the rapidly expanding aquaculture industry, specifically monitoring programs of multinational companies, such as Mainstream Chile, as well as industrial associations (www.hatfieldgroup.com/sectors/aquaculture/cap.aspx).The products delivered under the project include daily composites of:
• Chlorophyll-a pigment concentration (Figure 7.10)• Sea Surface Temperature (SST) • Transparency (Secchi depth) • Suspended Particulate Matter (SPM)
The International Ocean-Colour Coordinating Group (IOCCG, 2009) provides a recent and exhaustive report on Remote Sensing in Fisheries and Aquaculture with emphasis on marine related applications. The IOCCG report contains many examples of applications of remote sensing for the benefit of society, illustrating the advances that have been made. Similar rapid developments are expected in the future. This latter point is fundamental since remote sensing provides a global vision in an era of climate change and highly impacted and deteriorating marine ecosystems (Halpern et al., 2008; Bundy et al., 2009; Shin et al. 2009).
Google EarthGoogle Earth is a virtual globe, map and geographic information program that was originally called Earth Viewer, and was created by Keyhole, Inc, a company acquired by Google in 2004 (http://earth.google.com). It maps the Earth by the superimposition of images obtained from satellite imagery, aerial photography and GIS 3D globe. The product, re-released as Google Earth in 2005, is currently available for free and for use on personal computers. Google Maps on the Web and Google Earth as a 3D interactive atlas software application are ideal tools for sharing geographical information in a simple way. GIS data can be incorporated as layers in Google Earth. This means that project data and/or outputs from spatial analysis can be better understood when overlaid on-top of Google Maps/Earth and these overlays can also facilitate communication and be used for wider dissemination and outreach.

117
FIGURE 7.10A simplified version of the Chilean Aquaculture Project portal illustrating Chlorophyll-a pigment concentration in the Gulf of Ancud and Corcovado,
South of Puerto Montt in Chile
Source: Hatfield Consultants, 2009.
Ocean in Google Earth (http://earth.google.com/ocean), which launched February 2, 2009, will build on the popular 3-D mapping tool Google Earth by allowing users of Google Earth to dive beneath the water surface, explore 3D underwater terrain and browse ocean-related content contributed by leaders in ocean science and advocacy. Google is currently using Google Earth to map the world’s oceans, complete with maps of seabeds and underwater imagery that can show the effects of climate change on seas. Its use for marine aquaculture is yet to be explored but the tools are very promising.
The Aquaculture Service (FIRA) of FAO is currently in the process of creating maps using “Google Maps and Google Earth” technology to assist member countries inventory and monitor aquaculture. These maps will become an integral part of National Aquaculture Sector Overviews (or NASO) – a series of fact sheet collections which have been posted in FAO’s Aquaculture Gateway page (www.fao.org/fishery/naso/search/en). These maps will be of prime interest for the development and management of aquaculture from a EAA perspective because aquaculture needs to be mapped in order to place it into an ecological and administrative context.
A practical example of the use of Google Earth for aquaculture development has been reported in Brazil. Andrade and Mafra (2008) report that the Special Secretariat for Aquaculture and Fisheries in Brazil (SEAP) created a National System for the Authorization of Aquaculture in Union Waters (Sistema de Informação das
7. GIS-based decision support tools and modelling for aquaculture development

The potential of spatial planning tools to support the ecosystem approach to aquaculture118
Autorização de Uso das Águas de Domínio da União para Aqüicultura - SINAU) using Google Earth for communication and outreach to manage the concession of aquaculture areas in federal waterbodies (see Figure 7.11 and http://200.198.202.145/seap/sinau_web/html2/google_earth.html).
FIGURE 7.11Information system for the request of Exploitation permits for aquaculture
in Federal waterbodies in Brazil - SINAU
Source: Andrade and Mafra (2008).
MapsA map is a graphic representation of the physical features (natural, artificial, or both) of a part or the whole of the Earth’s surface, by means of signs and symbols or photographic imagery, at an established scale, on a specified projection, and with the means of orientation indicated (Crespi and Coche, 2008).
Maps are usually one of the outputs of a GIS, but can be effective tools for spatial communication in their own right. Mapping is the most straightforward way to visualize spatial relationships involved with the development and management of aquaculture and one of the easiest ways to communicate the two-dimensional needs of aquaculture for space among technical people and to the public in general.
There is a broad range of sophistication in mapping related to its purpose. Mapping for aquaculture development and management is considered in three categories: (1) Maps to delineate aquaculture sites and zones usually as accompaniments to technical reports, (2) Maps and varied attribute information accessed via the Internet that are aimed at a broad audience of government, commercial and private users involved with aquaculture development and management. (3) Interactive Internet mapping usually aimed at broad audiences that is accomplished by Internet map servers in which there is a choice of layers to view, layer attributes and descriptions and various functions such as zoom and pan. Kapetsky and Aguilar-Manjarrez (2007) provide some examples illustrating each mapping category for marine aquaculture.

119
La Tene Maps is an example of category one maps. It is a company based in Dublin, Ireland specialising in the research and production of maps, educational posters and associated data products. The company works mainly in areas which are constantly changing and particularly in the fields of Aquaculture, Fisheries, Oil and Gas Exploration, Renewable Energy, Energy/Power Generation, Marine Environment and Leisure Subjects. The company has a whole series of maps covering many parts of the world. La Tene Maps is worth mentioning and is relevant to EAA because they show the diversity of aquaculture activity in the area covered by the map by a set of specifically designed symbols to differentiate the species and type of activity carried out (www.latene.com/index.php/1/category/1/aquaculture).
In addition to the above, there are huge numbers of additional maps not described in this chapter that could be useful including all those from national mapping agencies and other specialized mapping agencies that are relevant to the EAA.
Marine fisheries GIS for EAAMarine fisheries GIS is particularly relevant to EAA in that aquaculture and marine fisheries GIS have many issues in common (e.g. data, models, training, experience, etc), therefore, synergies between aquaculture and fisheries must be strengthened for development of ecosystem approach strategies.
A study by Kapestky and Aguilar-Manjarrez (2007) on “Geographic Information Systems, remote sensing and mapping for the development and management of marine aquaculture” addresses several synergies related to marine fisheries. These include the lessons that could be learnt from MPAs analysis to address marine aquaculture issues.
The MPA Center and the NOAA Coastal Services Center (www.mpa.gov) compiled an “Inventory of GIS-Based Decision-Support tools for MPAs (Pattison, dos Reis and Hamilton, 2004). The aim of this inventory is to make the MPA community aware of existing GIS-based decision-support tools that may aid them in a variety of MPA-related activities (siting, zoning, monitoring, etc).
Much of the data use in marine fisheries GIS is also relevant to marine aquaculture (bathymetry, temperature, currents, coastlines, territorial seas, economic exclusive zones, etc). A case study by Kapetsky and Aguilar-Manjarrez (2007) and Kapetsky and Aguilar-Manjarrez (in press) illustrate how freely downloadable data can be used to estimate open ocean aquaculture potential from national and global perspectives using many of these datasets.
The review by Carocci et al. (2009) on Geographic Information Systems to support the ecosystem approach to fisheries, describes a wealth of information, tools, models and data that are relevant to EAA.
A brief description of the various modelling approaches which have general relevance to the field of the ecosystem approach to fisheries (EAF) described by Plagányi (2007) is also a rich source of information from which synergies between EAA and EAF could be identified which utilise GIS.
EBM Tools NetworkThe EBM Tools Network (www.ebmtools.org) is an alliance of EBM tool developers, practitioners, and training providers dedicated to promoting EBM tools and support their use in EBM implementation in coastal and marine environments and the terrestrial environments that affect them (watersheds). The EBM Tools Network deals with any and all “software” tools that could be helpful for ecosystem-based management of coastal and marine environments including their watersheds. So they consider marine fisheries and aquaculture tools. Also, the Network deals with a wide range of tools in addition to marine fisheries and aquaculture, and one of their goals is to investigate how tools from different sectors can be brought together for planning. Since approximately half of ecosystem tools
7. GIS-based decision support tools and modelling for aquaculture development
The potential of spatial planning tools to support the ecosystem approach to aquaculture120
have a spatial component (Robinson and Frid, 2003), GIS could be used in the future as the main operational platform.
The EBM Network tools analysis of tool functionality needed/tool categorization could be of immense value to FIMF’s efforts/initiative on a toolbox for the ecosystem approach to fisheries (EAF). Likewise information about the EAF toolbox is very valuable to the EBM Network. The EBM has little aquaculture expertise in the Network and there are very few tools in the EBM that are dedicated to aquaculture, but they plan to include them, so EAA could also benefit from this EBM tools analysis/compilation once these plans materialise.
7.5 SUMMARy, DISCUSSION AND CONCLUSIONSAs fisheries and aquaculture are fundamentally spatially distributed, responsible management requires a solid understanding of the underlying spatial dimension. GIS and remote sensing provide the technologies for mapping and analyzing the distribution of aquatic resources, their environment, fishery management units, production systems, etc. which can support decision-making. Indeed, the ultimate aim of GIS is to support spatial decision-making. A GIS has the capacity to integrate information from a variety of sources into a spatial context and is well suited to support decision-making procedures. GIS can act as a tool in helping the decision-makers evaluate alternatives, visualise choices and explore certain alternatives, but it is the decision-maker who determines the criteria, the factors, the constraints, the individual weighting and the decision rules. There are a multitude of approaches to decision-making, and consequently, there is great room for bias in the decision-making process. GIS helps to provide objectivity to decision-making in the spatial realm.
Implementing GISSince decision-making is a sequential process, however, it is difficult to prescribe a standard methodology (e.g. for aquaculture site selection different sites have their own set of characteristics and an approach that works for one site may not work for another). Additionally, decision-making tools have broad applications in aquaculture of which site selection is an important one. In some cases, GIS may be a complex and time consuming process to implement fully, however even at its simplest level, GIS mapping and spatial analysis will enhance future implementation of the EAA.
Investment in GIS should be made with a clear understanding of what should be accomplished with such capabilities, and the decision support needs of the stakeholders that GIS can fulfil. In many cases, GIS capabilities are primarily used as tools for generating and displaying maps. However, the current state of spatial methods and technology, clearly indicates that GIS capabilities go beyond data management and visualization alone.
It may be difficult to properly assess the value of the information generated by a GIS project, and therefore its contribution towards decision support. Maguire, Kouyoumjian and Smith (2008) propose a new standardized Return on Investment (ROI) methodology for identifying, prioritizing, and calculating the business value of GIS technology for any organization. Given the increasing demands to improve accountability, efficiencies, competitive advantage, and resource utilization, the ROI method is an interesting way to help prioritize and target investment in GIS technology and address how and when that investment will deliver tangible benefits.
ModellingIt is difficult to prescribe the models to use because the choice of model depends entirely on the issue and research objectives. An ideal scenario for EAA is one in which a suite of models is developed and computed. It is also important to remember

121
that the better the background data, the more precise the output of the modelling will be. It is also worth considering the fact that many of the models developed have the utility of functioning outside or within a GIS platform (Figure 7.3a-d).
Decision support toolsAll decision-making has a degree of uncertainty, ranging from a predictable (deterministic) situation to an uncertain situation (Malczewski, 1999). Consequently, particularly in uncertain situations, decision making involves the risk of making a “wrong” decision, because the information acquired is insufficient or the approach used is inappropriate. When uncertainty is part of the process, this uncertainty may in some cases be quantified and as such add another decision criterion to the evaluation process. Such tools are important for EAA and are likely to develop in the future. Key future improvements on decision support tools (DST) for aquaculture include: an increased use of socio-economic data, and the development of custom made tools and/or the use of DST used or created in other sectors to better address specific decision problems for marine aquaculture.
An important limitation to operational implementation of the EAA will be the sparse availability of information on the state of the wider ecosystem structure and processes. Implementation of the EAA requires a wide information-base for decision-making. Remote sensing from satellites has revolutionised our view of the surface of planet Earth, on land, in the atmosphere and in the sea. Remote sensing already provides real-time information of potential use to mariculture (e.g. sea surface temperature, chlorophyll, Harmful Algal Blooms), Also, archived remote sensing data can be used to analyze change spatially and temporally. Therefore, it would be of utmost value if remote sensing data could be made more readily available to non specialists for the EAA.
Future of models and GIS-based decision support tools as applied to aquaculture. Following the initial development of GIS in the 1960s, GIS has evolved from computer mapping and visualization to spatial database management to spatial analysis and modelling to web-based applications. Major opportunities for fisheries GIS scientists in the future are: (1) sharing data, information and applications through the Internet, (2) multidimensional GIS (i.e. 3 and 4 dimensional GIS, dynamic flow modelling), and (3) data acquisition through sensors and sensor networks (e.g. GPS-enabled mobile devices).
The Internet offer the possibilities for a new kind of distributed information and collaboration system. Such systems support the efficient working and collaboration process among the different involved experts of distributed projects. Web access to spatial data is becoming increasingly common, therefore standards are becoming increasingly important to GIS systems, as compliance with effective common standards is the only way disparate applications can access externally managed data and become interoperating components of a working GIS system. There is an increase in the use of Open Source (OS) GIS software, and, at least for now, this may offer some advantages for GIS users over more proprietary solutions.
Remote sensing data have a very rich potential in fisheries and aquaculture. The information and software will become more widely available, user friendly, and accessible to managers rather than just to specialist remote-sensing scientists.The main theme of the Fourth International Symposium on GIS/Spatial Analyses (www.esl.co.jp/Sympo/index.htm) was the move towards EAA and EAF, and this is likely to become increasingly dominant over the next decade. The EAA and EAF have many issues in common (e.g. data, models, training, experience, etc) therefore synergies between aquaculture and fisheries must be strengthened for development of EA strategies.
There is still very little attention given to economic or social factors relating to
7. GIS-based decision support tools and modelling for aquaculture development

The potential of spatial planning tools to support the ecosystem approach to aquaculture122
spatial aspects of fisheries or aquaculture, so they merit further analysis to be able to fully support EAA. With EAA and EAF now looming large it is expected that more attention will be given to these important factors.
There are a mixture of methods and applications which involve management to different degrees. One of the main challenges identified is the need for dynamic information to be made more readily available to decisions-makers and stakeholders on a real-time basis and that more research be conducted on how to best teach decision-makers to utilize spatial information.

123
8. Case studies of GIS, remote sensing and mapping applications in aquaculture in relation to EAA implementation
This chapter has two objectives. The first is to show the relevance of GIS capabilities in aquaculture to EAA principles in a general way. This sets the stage for the second objective that is to illustrate by actual application examples the ways in which GIS, remote sensing and mapping can contribute to the implementation of the EAA through case studies and a variety of other applications in aquaculture.
8.1 THE RELEVANCE OF GIS CAPABILITIES TO EAA PRINCIPLESUnderlying the implementation of the EAA is the fundamental need to define ecosystems spatially and by their attributes. GIS can be used for this purpose, but experts from many disciplines have to be involved to assist with the definition of each component of the ecosystem (e.g. ecologists for the natural components, sociologists and economists for the human components).
1.the natural environment as modified by man including the atmosphere, land and water;
2.the human environment with its major elements all of which have an economic underpinning including the physical realm and infrastructure, the chemical realm with inputs to, and outputs from atmosphere, terrestrial and aquatic environments, and finally; and
3.the biological environment one part of which is subject to extractive activities such as agriculture, forestry, and fisheries.
The strength of GIS is in its capability to spatially integrate and analyze the natural and human environments. Natural environments are defined spatially by natural physical features, basically land and water boundaries. Human boundaries are defined administratively with a combination of natural features (rivers, mountains) and artificial geographic boundaries established by a coordinate system. GIS can be used to integrate spatial natural environments with human spatially defined areas (e.g. administrative) at a range of scales.
8.2 THE RELATIONSHIP OF SPATIAL ANALySES TO SUPPORT EAA PRINCIPLESThere are three EAA principles. This section illustrates how spatial analyses relate to each principle.EAA principle 1 – Aquaculture development and management should take account of the full range of ecosystem functions and services, and should not threaten the sustained delivery of these to society
Ecosystem functions from the human viewpoint provide; good quality air, water, arable land and healthy crops as well as renewable resources such as fish and wood products.
Ecosystem functions from the aquaculture viewpoint provide an environment for rapid growth and high survival rates for cultured products and a safe environment

The potential of spatial planning tools to support the ecosystem approach to aquaculture124
for culture structures and support installations. This Principle corresponds to spatial analysis of the natural environment.
The main application in aquaculture in relation to the EAA is defining the boundaries of natural ecosystems so that, in turn, the ecosystem functions and services within those boundaries can be defined and examined in relation to aquaculture. Other applications include: predicting the effects of variability in the environment on aquaculture for:
1.estimates of potential, zoning and siting;2.real-time management of aquaculture operations;3.estimating carrying capacity; and4.estimating ecosystem resilienceIntegrated Multitrophic Aquaculture also comes under this principle as a kind of
mitigation of aquaculture impacts
EAA Principle 2 – Aquaculture should improve human well-being and equity for all relevant stakeholdersThe general application in aquaculture for EAA is the state of well-being measured in socio-economic terms within spatial boundaries such as gross domestic product, poverty,livelihoods and markets.
The aquaculture applications are:1.spatial distribution and spatial analyses of aquaculture and of other stakeholder
activities (production facilities, transportation and marketing chains, technical support installations, plant and animal health and tracing/tracking); and
2.spatial distribution and spatial analyses of aquaculture and of its status (livelihoods, poverty, etc).
EAA Principle 3 – Aquaculture should be developed in the context of other sectors, policies and goalsThis corresponds to spatial analyses of the natural environment together with the human environment. Most of the aquaculture issues fall within this principle. The main application in aquaculture is minimizing or eliminating competing and conflicting uses while also identifying complementary uses through spatial analyses.
8.3 CASE STUDIES OF GIS, REMOTE SENSING AND MAPPING APPLICATIONS IN AQUACULTURE IN RELATION TO EAA PRINCIPLES AND SCALESBecause the EAA is a new more holistic strategy, there are no case studies specifically so targeted. However, there are numerous examples of spatial planning applications in aquaculture that have an EAA orientation. Expanding on Chapter 6, the underlying purpose is to further demonstrate that spatial analyses can be easily designed to meet a variety of EAA needs with respect to scales and principles.
The case studies listed in Tables 8.1 and 8.2 below have two characteristics:• They call attention to a wide variety of applications that have contributed to
solving important issues that affect the sustainability of aquaculture;• They also provide information usually lacking from scientific papers and reports,
namely, in what ways, and with what commitments of time and specialized personnel the work has been completed.
Thus, these case studies are aimed at two kinds of audience: (1) Those with limited knowledge of the benefits and constraints of spatial tools applied to aquaculture who can best appreciate how spatial tools can be of use by associating their own experiences and issues with descriptions of applications, and (2) those with GIS technical skills who can benefit from new methodological approaches revealed by these case studies.

125
Table 8.1 lists featured case studies selected on the basis of quality which are also illustrative of innovative ways to address issues in aquaculture with GIS. As a measure of economy, the full case studies are not repeated here. Rather, their main attributes with respect to the EAA are tabulated in Table 8.1. They can be accessed in full from the GISFish (www.fao.org/fishery/gisfish) by searching on the GISFish ID provided. Amongst the applications listed in Table 8.1, six were selected to describe the use of GIS-based models and spatial decision support of relevance to EAA principles and scales (Table 8.2).
The case studies and EAA-relevant examples are tabulated according to the EAA principles, the EAA scale, the issues associated with each EAA principle, the environment and/or ecosystem targeted, and the scale of the GIS application. A brief comment on the relevance of the example application to the EAA is also included.
8. Case studies of GIS, remote sensing and mapping applications in aquaculture in relation to EAA implementation

The potential of spatial planning tools to support the ecosystem approach to aquaculture126
Au
tho
r, ye
ar, T
itle
, *G
ISFi
sh ID
Co
un
try
Envi
ron
men
tEA
A
pri
nci
ple
EAA
sca
leG
IS s
cale
Mai
n is
sue
Sub
-iss
ue
Rel
evan
ce t
o t
he
EAA
EAA
Pri
nci
ple
1 -
Aq
uac
ult
ure
dev
elo
pm
ent
and
man
agem
ent
sho
uld
tak
e ac
cou
nt
of
the
full
ran
ge
of
eco
syst
em f
un
ctio
ns
and
ser
vice
s, a
nd
sh
ou
ld n
ot
thre
aten
th
e su
stai
ned
del
iver
y o
f th
ese
to s
oci
ety
Pop
ulu
s. e
t al
. (20
03)
Geo
mat
ics
for
the
man
agem
ent
of
oys
ter
cult
ure
leas
es a
nd
pro
du
ctio
n
id/g
f241
Fran
ceB
rack
ish
wat
er1
Wat
erb
od
yB
ayPr
acti
ce a
nd
m
anag
emen
tIn
ven
tory
an
d
mo
nit
ori
ng
of
aqu
acu
ltu
re a
nd
th
e en
viro
nm
ent
Co
mb
ines
en
viro
nm
ent
wit
h in
tra-
spec
ific
in
tera
ctio
ns
and
ef
fect
s o
n g
row
th
and
su
rviv
al
Pop
ulu
s et
al.
(200
3)G
IS in
su
pp
ort
to
dat
a an
alys
is f
or
enh
ance
d s
ust
ain
abili
ty o
f sh
rim
pfa
rmin
g in
th
e M
eko
ng
Del
ta,
Vie
t N
am
id/1
946
Vie
t N
amB
rack
ish
wat
er1
Wat
ersh
edSt
ate/
Pro
vin
cePr
acti
ce a
nd
m
anag
emen
tIn
ven
tory
an
d
mo
nit
ori
ng
of
aqu
acu
ltu
re a
nd
th
e en
viro
nm
ent
Aq
uac
ult
ure
in
rela
tio
n t
o t
he
envi
ron
men
t an
d
eco
syst
ems
Bac
her
et
al. (
2003
)M
od
ellin
g t
he
effe
ct o
f fo
od
dep
leti
on
o
n s
callo
p g
row
th in
San
gg
ou
Bay
(C
hin
a)
id/1
240
Ch
ina
Bra
ckis
hw
ater
1W
ater
bo
dy
Bay
Dev
elo
pm
ent
Suit
abili
ty o
f si
te a
nd
zo
nin
gC
arry
ing
cap
acit
y
Bay
ot
et a
l. (2
002)
Sist
ema
de
aler
ta e
pid
emio
lóg
ico
y
de
man
ejo
par
a la
acu
icu
ltu
ra
del
cam
aró
n e
n E
cuad
or
id/1
291
Ecu
ado
rM
arin
e an
d
bra
ckis
hw
ater
1W
ater
bo
dy
Gu
lfD
evel
op
men
tA
nti
cip
atin
g t
he
con
seq
uen
ces
of
aqu
acu
ltu
re
Earl
y w
arn
ing
sys
tem
Pére
z (2
002)
Use
of
a G
IS-b
ased
par
ticu
late
w
aste
dis
trib
uti
on
mo
del
as
a to
ol
to a
id m
arin
e fi
sh c
age
site
sel
ecti
on
id
/123
6
All
coas
tal
cou
ntr
ies
Mar
ine
1Fa
rmO
pen
oce
anPr
acti
ce a
nd
m
anag
emen
tEn
viro
nm
enta
l Im
pac
ts
of
aqu
acu
ltu
reO
ne
of
the
few
far
m-s
cale
ap
plic
atio
ns
Bu
shek
et
al. (
1998
)La
nd
-use
pat
tern
s, h
ydro
dyn
amic
s an
d t
he
spat
ial p
atte
rn o
f D
erm
o
dis
ease
in t
wo
So
uth
Car
olin
a es
tuar
ies
id/g
f40
Un
ited
St
ates
of
Am
eric
a
Bra
ckis
hw
ater
1W
ater
shed
Wat
erb
od
yEs
tuar
yPr
acti
ce a
nd
m
anag
emen
tIn
ven
tory
of
aqu
acu
ltu
re
and
th
e en
viro
nm
ent
On
e o
f fe
w e
xam
ple
s d
ealin
g w
ith
dis
ease
s re
late
d t
o t
he
envi
ron
men
t
Ferr
eira
et
al..
(200
8)SP
EAR
Su
stai
nab
le o
pti
on
s fo
r Pe
op
le, c
atch
men
t an
d A
qu
atic
Res
ou
rces
id
/538
0
Ch
ina
Mar
ine
1 (3
)W
ater
bo
dy
Bay
GIS
fo
r aq
uac
ult
ure
p
ract
ice
and
m
anag
emen
t
Envi
ron
men
tal I
mp
acts
o
f aq
uac
ult
ure
This
pro
ject
is
valu
able
to
EA
A
bec
ause
it is
a
ho
listi
c as
sess
men
t o
f aq
uac
ult
ure
on
th
e b
asis
of
peo
ple
, p
lan
et a
nd
pro
fit
* N
ote:
To
loca
te t
he p
ublic
atio
n st
ored
in G
ISF
ish
sim
ply
add
the
id t
o th
e en
d of
the
GIS
Fis
h U
RL
(e.
g. w
ww
.fao.
org/
fish
ery/
gisf
ish/
id/1
284)
TAB
LE 8
.1C
ase
stu
die
s fr
om
GIS
Fish
an
d t
hei
r re
leva
nce
to
EA
A p
rin
cip
les
and
sca
les
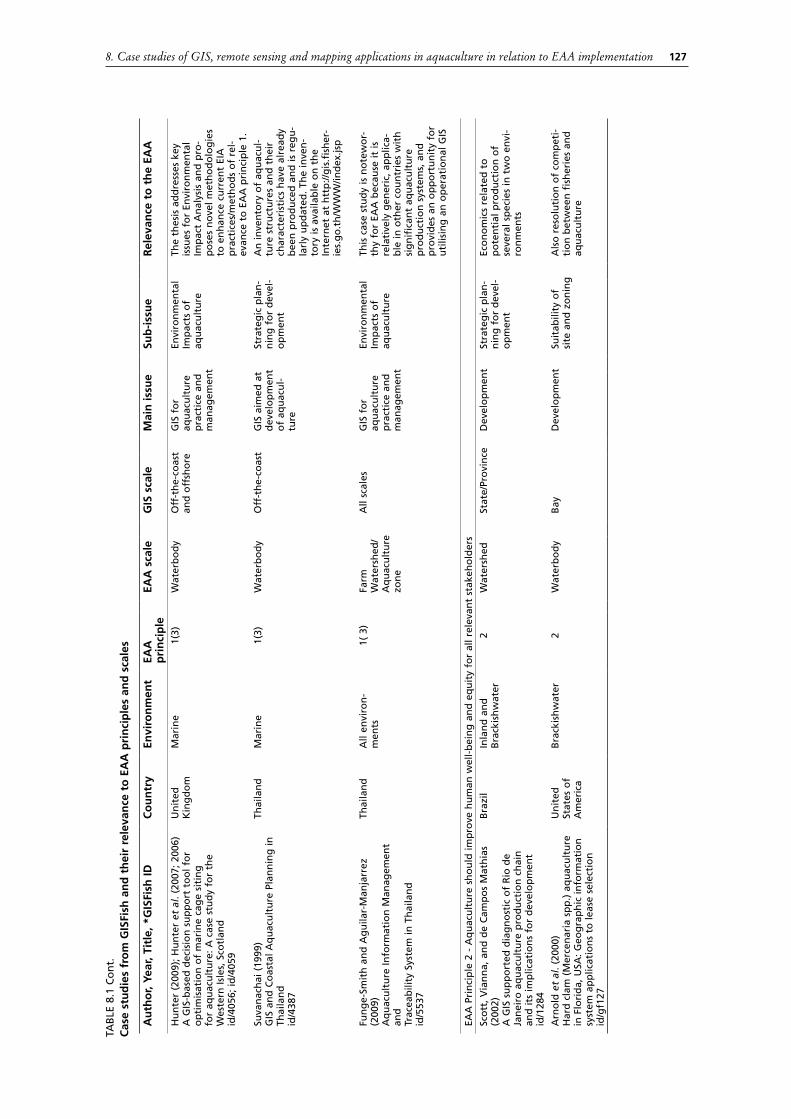
127
Au
tho
r, ye
ar, T
itle
, *G
ISFi
sh ID
Co
un
try
Envi
ron
men
tEA
A
pri
nci
ple
EAA
sca
leG
IS s
cale
Mai
n is
sue
Sub
-iss
ue
Rel
evan
ce t
o t
he
EAA
Hu
nte
r (2
009)
; Hu
nte
r et
al.
(200
7; 2
006)
A G
IS-b
ased
dec
isio
n s
up
po
rt t
oo
l fo
r o
pti
mis
atio
n o
f m
arin
e ca
ge
siti
ng
fo
r aq
uac
ult
ure
: A c
ase
stu
dy
for
the
Wes
tern
Isle
s, S
cotl
and
id
/405
6; id
/405
9
Un
ited
K
ing
do
mM
arin
e1(
3)W
ater
bo
dy
Off
-th
e-co
ast
and
off
sho
reG
IS f
or
aqu
acu
ltu
re
pra
ctic
e an
d
man
agem
ent
Envi
ron
men
tal
Imp
acts
of
aqu
acu
ltu
re
The
thes
is a
dd
ress
es k
ey
issu
es f
or
Envi
ron
men
tal
Imp
act
An
alys
is a
nd
pro
-p
ose
s n
ove
l met
ho
do
log
ies
to e
nh
ance
cu
rren
t EI
A
pra
ctic
es/m
eth
od
s o
f re
l-ev
ance
to
EA
A p
rin
cip
le 1
.
Suva
nac
hai
(19
99)
GIS
an
d C
oas
tal A
qu
acu
ltu
re P
lan
nin
g in
Th
aila
nd
id/4
387
Thai
lan
dM
arin
e1(
3)W
ater
bo
dy
Off
-th
e-co
ast
GIS
aim
ed a
t d
evel
op
men
t o
f aq
uac
ul-
ture
Stra
teg
ic p
lan
-n
ing
fo
r d
evel
-o
pm
ent
An
inve
nto
ry o
f aq
uac
ul-
ture
str
uct
ure
s an
d t
hei
r ch
arac
teri
stic
s h
ave
alre
ady
bee
n p
rod
uce
d a
nd
is r
egu
-la
rly
up
dat
ed. T
he
inve
n-
tory
is a
vaila
ble
on
th
e In
tern
et a
t h
ttp
://g
is.f
ish
er-
ies.
go
.th
/WW
W/in
dex
.jsp
Fun
ge-
Smit
h a
nd
Ag
uila
r-M
anja
rrez
(2
009)
Aq
uac
ult
ure
Info
rmat
ion
Man
agem
ent
and
Trac
eab
ility
Sys
tem
in T
hai
lan
did
/553
7
Thai
lan
dA
ll en
viro
n-
men
ts1(
3)
Farm
W
ater
shed
/A
qu
acu
ltu
re
zon
e
All
scal
esG
IS f
or
aqu
acu
ltu
re
pra
ctic
e an
d
man
agem
ent
Envi
ron
men
tal
Imp
acts
of
aqu
acu
ltu
re
This
cas
e st
ud
y is
no
tew
or-
thy
for
EAA
bec
ause
it is
re
lati
vely
gen
eric
, ap
plic
a-b
le in
oth
er c
ou
ntr
ies
wit
h
sig
nif
ican
t aq
uac
ult
ure
p
rod
uct
ion
sys
tem
s, a
nd
p
rovi
des
an
op
po
rtu
nit
y fo
r u
tilis
ing
an
op
erat
ion
al G
IS
EAA
Pri
nci
ple
2 -
Aq
uac
ult
ure
sh
ou
ld im
pro
ve h
um
an w
ell-
bei
ng
an
d e
qu
ity
for
all r
elev
ant
stak
eho
lder
s
Sco
tt, V
ian
na,
an
d d
e C
amp
os
Mat
hia
s (2
002)
A G
IS s
up
po
rted
dia
gn
ost
ic o
f R
io d
e Ja
nei
ro a
qu
acu
ltu
re p
rod
uct
ion
ch
ain
an
d it
s im
plic
atio
ns
for
dev
elo
pm
ent
id/1
284
Bra
zil
Inla
nd
an
d
Bra
ckis
hw
ater
2W
ater
shed
Stat
e/Pr
ovi
nce
Dev
elo
pm
ent
Stra
teg
ic p
lan
-n
ing
fo
r d
evel
-o
pm
ent
Eco
no
mic
s re
late
d t
o
po
ten
tial
pro
du
ctio
n o
f se
vera
l sp
ecie
s in
tw
o e
nvi
-ro
nm
ents
Arn
old
et
al. (
2000
)H
ard
cla
m (
Mer
cen
aria
sp
p.)
aq
uac
ult
ure
in
Flo
rid
a, U
SA: G
eog
rap
hic
info
rmat
ion
sy
stem
ap
plic
atio
ns
to le
ase
sele
ctio
n
id/g
f127
Un
ited
St
ates
of
Am
eric
a
Bra
ckis
hw
ater
2W
ater
bo
dy
Bay
Dev
elo
pm
ent
Suit
abili
ty o
f si
te a
nd
zo
nin
gA
lso
res
olu
tio
n o
f co
mp
eti-
tio
n b
etw
een
fis
her
ies
and
aq
uac
ult
ure
TAB
LE 8
.1 C
on
t.C
ase
stu
die
s fr
om
GIS
Fish
an
d t
hei
r re
leva
nce
to
EA
A p
rin
cip
les
and
sca
les
8. Case studies of GIS, remote sensing and mapping applications in aquaculture in relation to EAA implementation

The potential of spatial planning tools to support the ecosystem approach to aquaculture128
Au
tho
r, ye
ar, T
itle
, *G
ISFi
sh ID
Co
un
try
Envi
ron
men
tEA
A
pri
nci
ple
EAA
sca
leG
IS s
cale
Mai
n is
sue
Sub
-iss
ue
Rel
evan
ce t
o t
he
EAA
van
Bra
kel a
nd
Ro
ss (
2008
)In
teg
rati
ng
so
cio
-eco
no
mic
dat
a in
to
a sp
atia
l fra
mew
ork
fo
r aq
uac
ult
ure
d
evel
op
men
t id
/495
5
Thai
lan
d
and
C
amb
od
ia
Inla
nd
2W
ater
shed
Loca
l an
d
Stat
e/Pr
ovi
nce
Aq
uac
ult
ure
p
ract
ice
and
m
anag
emen
t
Eco
no
mic
sLi
nke
d s
oci
o-e
con
om
ic a
nd
ad
min
istr
ativ
e d
atas
ets
fro
m
vari
ou
s so
urc
es in
teg
rate
d
into
a s
pat
ial f
ram
ewo
rk f
or
aqu
acu
ltu
re d
evel
op
men
t
Wet
lan
ds
Man
agem
ent
Dep
artm
ent,
M
inis
try
of
Wat
er a
nd
En
viro
nm
ent,
U
gan
da;
Ug
and
a B
ure
au o
f St
atis
tics
;In
tern
atio
nal
Liv
esto
ck R
esea
rch
In
stit
ute
; an
d W
orl
d R
eso
urc
es In
stit
ute
(2
009)
Map
pin
g A
Bet
ter
Futu
re. H
ow
Sp
atia
l A
nal
ysis
Can
Ben
efit
Wet
lan
ds
and
R
edu
ce P
ove
rty
In U
gan
da
id/5
291
Ug
and
aIn
lan
d2
Wat
erb
od
yN
atio
nal
M
ult
isec
tora
l d
evel
op
men
t an
d
man
agem
ent
Plan
nin
g f
or
aqu
acu
ltu
re
amo
ng
oth
er
use
s o
f la
nd
an
d w
ater
Emp
has
is p
lace
d o
n p
ove
rty
and
live
liho
od
s lin
ked
to
an
aq
uat
ic e
cosy
stem
m
anag
emen
t co
nte
xt
Kam
et
al. (
2008
)D
eter
min
atio
n o
f H
igh
-Po
ten
tial
A
qu
acu
ltu
re D
evel
op
men
t A
reas
an
d
Imp
act
in A
fric
a an
d A
sia
id/4
815
Cam
ero
on
, M
alaw
i, B
ang
lad
esh
an
d C
hin
a
Inla
nd
2(3)
Aq
uac
ult
ure
zo
ne
Reg
ion
sD
evel
op
men
tSt
rate
gic
p
lan
nin
g f
or
dev
elo
pm
ent
Ensu
red
eq
uit
y fo
r al
l rel
evan
t st
akeh
old
ers.
Incl
ud
ed s
oci
olo
gic
al
anal
ysis
of
qu
alit
ativ
e so
cio
-in
stit
uti
on
al f
acto
rs
EAA
Pri
nci
ple
3 -
Aq
uac
ult
ure
sh
ou
ld b
e d
evel
op
ed in
th
e co
nte
xt o
f o
ther
sec
tors
, po
licie
s an
d g
oal
s
Kap
etsk
y an
d N
ath
(19
97)
A s
trat
egic
ass
essm
ent
of
the
po
ten
tial
fo
r fr
esh
wat
er f
ish
far
min
g in
Lat
in
Am
eric
a id
/gf1
0
Lati
n
Am
eric
aIn
lan
d3
Mar
ket
Co
nti
nen
tal
Dev
elo
pm
ent
Stra
teg
ic
pla
nn
ing
fo
r d
evel
op
men
t
Eco
no
mic
su
rro
gat
e fo
r ac
cess
to
mar
kets
Trav
aglia
, Kap
etsk
y an
d P
rofe
ti (
1999
)In
ven
tory
an
d m
on
ito
rin
g o
f sh
rim
p
farm
s in
Sri
Lan
ka b
y ER
S-SA
R d
ata
id/1
244
Sri L
anka
Bra
ckis
hw
ater
3W
ater
shed
Reg
ion
in
cou
ntr
yPr
acti
ce a
nd
m
anag
emen
tIn
ven
tory
an
d
mo
nit
ori
ng
of
aqu
acu
ltu
re
and
th
e en
viro
nm
ent
Inex
pen
sive
, co
mp
reh
ensi
ve,
po
ten
tial
ly m
ult
i-te
mp
ora
l m
on
ito
rin
g
Trav
aglia
et
al. (
2004
)M
app
ing
co
asta
l aq
uac
ult
ure
an
d
fish
erie
s st
ruct
ure
s b
y sa
telli
te im
agin
g
rad
ar. c
ase
stu
dy
of
the
Lin
gay
en G
ulf
, th
e Ph
ilip
pin
es i
d/1
368
Phili
pp
ines
Bra
ckis
hw
ater
an
d m
arin
e3
Wat
erb
od
yG
ulf
Prac
tice
an
d
man
agem
ent
Inve
nto
ry a
nd
m
on
ito
rin
g o
f aq
uac
ult
ure
an
d t
he
envi
ron
men
t
Als
o r
eso
luti
on
of
com
pet
itio
n
bet
wee
n f
ish
erie
s a
nd
aq
uac
ult
ure
Wh
ite
(200
9)EI
A a
nd
mo
nit
ori
ng
fo
r cl
ust
ers
of
smal
l-sc
ale
cag
e fa
rms
in B
olin
ao B
ay: a
cas
e st
ud
y.id
/484
0
Phili
pp
ines
Mar
ine,
B
rack
ish
wat
er
and
Inla
nd
3A
qu
acu
ltu
re
zon
eLa
ke, e
stu
ary
and
bay
Dev
elo
pm
ent
Suit
abili
ty o
f si
te a
nd
zo
nin
gM
ult
i-fa
cete
d s
tud
y in
clu
din
g c
arry
ing
cap
acit
y an
d e
nvi
ron
men
tal i
mp
act
asse
ssm
ent
for
siti
ng
an
d
zon
ing
TAB
LE 8
.1 C
on
t.C
ase
stu
die
s fr
om
GIS
Fish
an
d t
hei
r re
leva
nce
to
EA
A p
rin
cip
les
and
sca
les

129
Au
tho
r, ye
ar, T
itle
, *G
ISFi
sh ID
Co
un
try
Envi
ron
men
tEA
A
pri
nci
ple
EAA
sca
leG
IS s
cale
Mai
n is
sue
Sub
-iss
ue
Rel
evan
ce t
o t
he
EAA
Kap
etsk
y an
d A
gu
ilar-
Man
jarr
ez (
in
pre
ss)
Sp
atia
l p
ersp
ecti
ves
on
o
pen
o
cean
aq
uac
ult
ure
po
ten
tial
in
th
e U
S ea
ster
n
Excl
usi
ve E
con
om
ic Z
on
es
*In
pre
ss
Un
ited
St
ates
of
Am
eric
a
Mar
ine
3A
qu
acu
ltu
re
zon
eR
egio
n in
co
un
try/
op
en
oce
an
Dev
elo
pm
ent
Stra
teg
ic
pla
nn
ing
fo
r d
evel
op
men
t
Un
iqu
e in
est
imat
ing
po
ten
tial
fo
r o
pen
oce
an a
qu
acu
ltu
re
incl
ud
ing
inte
gra
ted
mu
lti-
tro
ph
ic a
qu
acu
ltu
re
Ag
uila
r-M
anja
rrez
(19
96)
Dev
elo
pm
ent
and
eva
luat
ion
of
GIS
-bas
ed m
od
els
for
pla
nn
ing
an
d
man
agem
ent
of
coas
tal a
qu
acu
ltu
re: A
ca
se s
tud
y in
Sin
alo
a, M
exic
o
id/g
f211
Mex
ico
Bra
ckis
hw
ater
3W
ater
shed
Stat
e/Pr
ovi
nce
Dev
elo
pm
ent
Stra
teg
ic
pla
nn
ing
fo
r d
evel
op
men
t
Exce
llen
t ex
amp
le o
f m
od
el
inte
gra
tio
n a
nd
mu
ltip
le
crit
eria
dec
isio
n-m
akin
g
An
dra
de
and
Maf
ra (
2008
)In
form
atio
n s
yste
m f
or
the
req
ues
t o
f ex
plo
itat
ion
per
mit
s fo
r aq
uac
ult
ure
in
fed
eral
wat
er b
od
ies
in B
razi
l-SI
NA
U
id/4
998
Bra
zil
Mar
ine,
b
rack
isw
ater
an
d in
lan
d
3W
ate
rbo
dy/
Wat
ersh
edC
ou
ntr
yPr
acti
ce a
nd
m
anag
emen
tW
eb-b
ased
aq
uac
ult
ure
in
form
atio
n
syst
em
Prac
tica
l sys
tem
fo
r p
erm
itti
ng
b
ut
wit
h p
ote
nti
al
for
inco
rpo
rati
ng
mu
ltip
le u
ses
incl
ud
ing
EA
A
Do
lmer
an
d G
eitn
er (
2004
)In
teg
rate
d C
oas
tal Z
on
e M
anag
emen
t o
f cu
ltu
res
and
fis
her
y o
f m
uss
els
in
Lim
fjo
rden
, Den
mar
k id
/193
4
Den
mar
kM
arin
e an
d
bra
ckis
hw
ater
3W
ater
bo
dy
Estu
ary
Mu
ltis
ecto
ral
dev
elo
pm
ent
and
m
anag
emen
t
Man
agem
ent
of
aqu
acu
ltu
re a
nd
fi
sher
ies
Take
s in
to a
cco
un
t cu
ltu
re a
nd
ca
ptu
re o
f o
ne
spec
ies
and
co
mp
etit
ion
fo
r sp
ace
wit
h
ano
ther
in C
ZM c
on
text
Her
shn
er a
nd
Wo
od
s (1
999)
Shal
low
wat
er r
eso
urc
e u
se c
on
flic
ts:
clam
aq
uac
ult
ure
an
d s
ub
mer
ged
aq
uat
ic v
eget
atio
n
id/g
f120
an
d id
/126
1
Un
ited
St
ates
of
Am
eric
a
Bra
ckis
hw
ater
3 (1
)W
ater
bo
dy
Bay
Mu
ltis
ecto
ral
dev
elo
pm
ent
and
m
anag
emen
t
Man
agem
ent
of
aqu
acu
ltu
re
tog
eth
er w
ith
fi
sher
ies
Als
o a
nti
cip
atin
g t
he
con
seq
uen
ces
of
aqu
acu
ltu
re
on
th
e en
viro
nm
ent
Han
dis
yde
et a
l. (2
006)
The
effe
cts
of
clim
ate
chan
ge
on
wo
rld
aq
uac
ult
ure
: a g
lob
al p
ersp
ecti
veid
/452
2
Wo
rld
Inla
nd
, m
arin
e an
d
bra
ckis
hw
ater
3 (1
)G
lob
alG
lob
alPr
acti
ce a
nd
m
anag
emen
tIn
ven
tory
an
d
mo
nit
ori
ng
of
aqu
acu
ltu
re
and
th
e en
viro
nm
ent
Incl
ud
es s
oci
al a
nd
eco
no
mic
co
nsi
der
atio
ns
wit
h c
limat
e ch
ang
e a
fun
dam
enta
l iss
ue
Ren
sel,
Kie
fer
and
O’B
rien
(20
07)
Aq
uaM
od
el: C
om
pre
hen
sive
A
qu
acu
ltu
re M
od
ellin
g S
oft
war
e id
/477
5
Un
ited
St
ates
of
Am
eric
a
Mar
ine
3 (1
)W
ater
bo
dy
Loca
l/ w
ater
bo
dy
Dev
elo
pm
ent
An
tici
pat
ing
th
e co
nse
qu
ence
s o
f aq
uac
ult
ure
Prac
tica
l exa
mp
le o
f p
re-
mo
del
ling
aq
uac
ult
ure
imp
acts
o
n t
he
envi
ron
men
t -
wat
er
colu
mn
an
d b
ott
om
Gra
nt
et a
l. (2
007)
Rem
ote
sen
sin
g o
f p
arti
cle
dep
leti
on
by
coas
tal s
usp
ensi
on
-fee
der
s id
/462
5
Can
ada
Bra
ckis
hw
ater
3 (1
)W
ater
bo
dy
Loca
l/ w
ater
bo
dy
Prac
tice
an
d
man
agem
ent
Envi
ron
men
tal
Imp
acts
of
aqu
acu
ltu
re
Un
iqu
e fo
r d
emo
nst
rati
ng
ec
osy
stem
sca
le im
pac
t o
f aq
uac
ult
ure
on
th
e en
viro
nm
ent
8. Case studies of GIS, remote sensing and mapping applications in aquaculture in relation to EAA implementation
TAB
LE 8
.1 C
on
t.C
ase
stu
die
s fr
om
GIS
Fish
an
d t
hei
r re
leva
nce
to
EA
A p
rin
cip
les
and
sca
les

The potential of spatial planning tools to support the ecosystem approach to aquaculture130
Au
tho
r, ye
ar, T
itle
, *G
ISFi
sh ID
Co
un
try
Envi
ron
men
tEA
A
pri
nci
ple
EAA
sca
leG
IS s
cale
Mai
n is
sue
Sub
-iss
ue
Rel
evan
ce t
o t
he
EAA
Ro
ss a
nd
Sal
am (
1999
)G
IS m
od
ellin
g f
or
aqu
acu
ltu
re in
So
uth
-w
este
rn B
ang
lad
esh
: Co
mp
arat
ive
pro
du
ctio
n s
cen
ario
s fo
r b
rack
ish
an
d
fres
hw
ater
sh
rim
p a
nd
fis
h
id/g
f102
Ban
gla
des
hIn
lan
d a
nd
B
rack
ish
wat
er3
(1)
Wa
ters
he
d/
Wat
erb
od
yR
egio
n in
co
un
try/
op
en
oce
an
Dev
elo
pm
ent
Suit
abilt
iy o
f th
e si
te a
nd
zo
nin
g
Mu
ltip
le s
pec
ies
in t
wo
en
viro
nm
ents
Pem
sl e
t al
. (20
06)
Det
erm
inin
g h
igh
po
ten
tial
aq
uac
ult
ure
p
rod
uct
ion
are
as -
an
alys
is o
f ke
y so
cio
-ec
on
om
ic a
do
pti
on
fac
tors
id
/425
5
Ban
gla
des
h
and
Mal
awi
Inla
nd
3 (1
)W
ater
shed
Co
un
try
Dev
elo
pm
ent
Eco
no
mic
sB
len
ds
envi
ron
men
t an
d s
oci
o-
eco
no
mic
s
Gre
enh
awk,
Jo
rdan
an
d S
mit
h (
1995
)M
aryl
and
oys
ter
geo
gra
ph
ical
in
form
atio
n s
yste
m: M
anag
emen
t an
d
scie
nti
fic
app
licat
ion
sid
/gf5
4
Un
ited
St
ates
of
Am
eric
a
Bra
ckis
hw
ater
3 (1
)W
ater
bo
dy
Bay
Prac
tice
an
d
man
agem
ent
Res
tora
tio
n o
f h
abit
atH
abit
at a
sses
smen
t an
d
pla
nn
ing
fo
r re
sto
rati
on
Kap
etsk
y an
d A
gu
ilar-
Man
jarr
ez (
2008
)Th
e p
ote
nti
al o
f o
pen
oce
an a
qu
acu
ltu
re
in E
xclu
sive
Eco
no
mic
Zo
nes
fro
m g
lob
al
and
nat
ion
al p
ersp
ecti
ves
id/4
974
Wo
rld
Mar
ine
3 (1
)G
lob
alO
ffsh
ore
/EEZ
Dev
elo
pm
ent
Stra
teg
ic
pla
nn
ing
fo
r d
evel
op
men
t
Esti
mat
es a
rea
loss
to
off
sho
re
aqu
acu
ltu
re o
f fo
reg
oin
g
dev
elo
pm
ent
in e
colo
gic
ally
se
nsi
tive
zo
nes
van
Bra
kel,
Ng
uye
n-K
ho
a1 a
nd
& R
oss
(2
008)
An
ag
ro-e
cosy
stem
s ap
pro
ach
to
aq
uac
ult
ure
an
d in
lan
d f
ish
erie
s: f
ish
ou
t o
f th
e w
ater
?id
/496
8
Cam
bo
dia
Inla
nd
3(1)
Wat
ersh
edD
istr
ict
and
Pr
ovi
nce
GIS
fo
r m
ult
isec
tora
l d
evel
op
men
t an
d
man
agem
ent
that
incl
ud
es
aqu
acu
ltu
re
Man
agem
ent
of
aqu
acu
ltu
re
tog
eth
er w
ith
fi
sher
ies
Pro
po
sed
a m
eth
od
to
o
per
atio
nal
ize
eco
syst
ems
app
roac
hes
to
fis
her
ies
and
aq
uac
ult
ure
by
del
inea
tin
g
reso
urc
e b
ou
nd
arie
s. T
hey
d
eriv
ed s
uch
‘bo
un
dar
ies’
fro
m
envi
ron
men
tal d
ata
in o
rder
to
ch
arac
teri
ze a
gro
-eco
syst
ems
as d
isti
nct
so
cial
-eco
log
ical
re
sou
rce
go
vern
ance
un
its,
o
f w
hic
h a
qu
acu
ltu
re a
nd
fi
sher
ies
are
inse
par
able
co
mp
on
ents
.
Pére
z, T
elfe
r an
d R
oss
(20
03)
Use
of
GIS
-bas
ed m
od
els
for
inte
gra
tin
g
and
dev
elo
pin
g m
arin
e fi
sh c
ages
wit
hin
th
e to
uri
sm in
du
stry
in T
ener
ife
(Can
ary
Isla
nd
s)
id/1
792
Spai
nM
arin
e3
(2)
Wat
erb
od
ySe
aco
ast
Mu
ltis
ecto
ral
dev
elo
pm
ent
and
m
anag
emen
t
Plan
nin
g f
or
aqu
acu
ltu
re
amo
ng
oth
er
use
s o
f la
nd
an
d
wat
er
Spec
ific
ally
tak
es in
to a
cco
un
t h
um
an e
lem
ents
an
d t
hei
r ec
on
om
y in
CZM
TAB
LE 8
.1 C
on
t.C
ase
stu
die
s fr
om
GIS
Fish
an
d t
hei
r re
leva
nce
to
EA
A p
rin
cip
les
and
sca
les

1318. Case studies of GIS, remote sensing and mapping applications in aquaculture in relation to EAA implementation
8.4 CASE STUDIES FOR SPATIAL DECISION SUPPORT The selected cases listed in section 8.3 represent a broad sampling across geographic scales ranging from local areas (i.e. a small bay), to sub-national regions (i.e. individual states: provinces), to national and continental regions. They also vary with regard to types of species and culture systems and to the degree to which GIS outcomes have been used for practical decision-making. Further, the case studies demonstrate the thematic extent of GIS applications that are possible in aquaculture including: site selection for targeted species, environmental impact assessment and monitoring, conflicts and trade-offs among alternate uses of natural resources, and consideration of the potential for aquaculture from the perspectives of technical assistance and alleviation of food security. The cases also vary significantly with regard to complexity of the analytical methods used (i.e. ranging from simple overlays to weighted combinations to use of relatively sophisticated models). Finally, the case studies are indicative of the diversity of GIS software that is available. In this section, we examine six cases in some detail from the perspective of their applications for spatial decision support for the EAA (Table 8.2). These case studies represent practical examples and the current state-of-the-art in GIS applications in aquaculture. Each of them is presented in the following format:
• Objectives• Target decision support audience• Geographic area and scale of analysis• Analytical framework and results• Relevance to EAA
This chapter can provide only a limited range of case studies. Additional case studies and examples of applications pertinent to the EAA are listed in Table 8.1 and guidance is given as to where the original material can be obtained as well as indicating the general purposes for which GIS can be beneficial for EAA purposes.

The potential of spatial planning tools to support the ecosystem approach to aquaculture132
TAB
LE 8
.2G
IS a
pp
licat
ion
s in
aq
uac
ult
ure
acc
ord
ing
to
th
e m
od
els
and
dec
isio
n s
up
po
rt u
sed
No
.A
uth
ors
year
Co
un
try
Syst
emSp
ecie
sSo
ftw
are
GIS
Inte
gra
tio
n a
nd
Mo
del
sD
ecis
ion
su
pp
ort
EAA
p
rin
cip
le
1Pa
leru
d e
t al
., (2
008)
; Le
go
vic
et a
l. (2
008)
; W
hit
e (
2009
).id
/484
0
2008
2009
Phili
pp
ines
Cag
es
Stak
es
Milk
fish
(C
han
os
chan
os)
Oys
ters
(C
rass
ost
rea
ired
alei
)
Arc
GIS
9.1
Lo
ose
co
up
ling
TRO
POM
OD
, MER
AM
OD
an
d
DEP
OM
OD
NO
MC
E p
er
se w
as u
sed
.1(
3)
2Fe
rrei
ra e
t al
.id
/538
020
08C
hin
aC
ages
, Lo
ng
lines
, Po
nd
s
Mac
roal
gae
: Lam
inar
ia ja
po
nic
a an
d P
orp
hyr
a h
aita
nen
sis;
Fo
ur
spec
ies
of
biv
alve
: th
e Pa
cifi
c o
yste
r C
rass
ost
rea
gig
as, A
sian
-Pac
ific
o
yste
r O
stre
a p
licat
ula
, raz
or
clam
Sin
on
vacu
la c
on
stri
cta
and
ar
k sh
ell T
egill
arca
gra
no
sa; T
wo
sp
ecie
s o
f fi
nfi
sh: t
he
Jap
anes
e se
abas
s La
teo
lab
rax
jap
on
icu
s an
d t
he
larg
e ye
llow
cro
aker
La
rim
ich
thys
cro
cea
Arc
GIS
9.1
Loo
se c
ou
plin
g
Fift
een
mo
del
s w
ere
use
d:
ASS
ETS,
Co
BEx
-EC
O, D
elft
3D-
FLO
W, D
elft
3D-W
AQ
/EC
O,
Eco
Win
2000
,FA
RM
, MA
RK
ET,
MO
M, S
aaS,
Sh
ellS
IM, S
WA
T, T
GC
, W
insh
ell,
and
LM
Praw
n
NO
MC
E p
er
se w
as u
sed
. 1(
3)
3H
un
ter,
Telf
er a
nd
Ro
ss
Hu
nte
rid
/405
6; id
/405
9
2006
; 200
7
2009
Sco
tlan
dC
ages
Atl
anti
c Sa
lmo
n, S
alm
o s
alar
Spec
ies
add
ress
ed in
Bio
div
ersi
ty
sub
-mo
del
: Th
e W
este
rn Is
les
has
a
rela
tive
ab
un
dan
ce o
f u
niq
ue
and
ra
re s
pec
ies
fro
m s
ea b
ird
s to
sea
m
amm
als
Idri
si A
nd
esEm
bed
din
g G
IS in
sp
atia
l an
alys
is
and
mo
del
ling
.
Mu
lti-
crit
eria
eva
luat
ion
mo
del
s
Des
k-st
ud
y M
CE
wit
h a
sm
all
gro
up
of
exp
erts
u
sin
g d
iscr
ete
thre
sho
lds.
1(3)

1338. Case studies of GIS, remote sensing and mapping applications in aquaculture in relation to EAA implementation
No
.A
uth
ors
year
Co
un
try
Syst
emSp
ecie
sSo
ftw
are
GIS
Inte
gra
tio
n a
nd
Mo
del
sD
ecis
ion
su
pp
ort
EAA
p
rin
cip
le4
An
dra
de
and
Maf
raid
/499
820
08B
razi
lA
ll cu
ltu
re
syst
ems
All
spec
ies
Arc
GIS
9.1
Emb
edd
ing
GIS
in s
pat
ial a
nal
ysis
an
d m
od
ellin
g.
Mu
lti-
crit
eria
eva
luat
ion
mo
del
s
Prac
tica
l use
of
MC
E w
ith
a la
rge
nu
mb
er o
f st
ake-
ho
lder
s u
sin
g
fuzz
y th
resh
old
s
3
5K
am e
t al
.id
/481
520
08C
amer
oo
n,
Mal
awi,
Ban
gla
des
h
and
Ch
ina
Pon
ds
Fres
hw
ater
(e.
g. T
ilap
ia).
SAQ
UA
; Id
riSP
; G
eNle
an
d
BN
SS; I
DR
ISI;
Arc
Vie
w,
Arc
GIS
; A
GR
AU
A.
Op
tio
ns
for
Emb
edd
ing
GIS
in
spat
ial a
nal
ysis
an
d m
od
ellin
g
and
als
o f
or
Loo
se c
ou
plin
g.
Bay
esia
n n
etw
ork
; Ag
ro-
eco
log
ical
(Th
erm
al g
row
th
per
iod
; po
nd
wat
er a
vaila
bili
ty;
fish
yie
lds)
MC
E u
sin
g d
is-
cret
e an
d f
uzz
y th
resh
old
s.
2(3)
6Fu
ng
e-Sm
ith
an
d
Ag
uila
r-M
anja
rrez
id/5
537
2009
Thai
lan
dA
ll cu
ltu
re
syst
ems
All
spec
ies
Arc
GIS
9.3
Mo
del
ling
has
yet
to
be
dev
el-
op
edM
CE
will
be
on
e o
f th
e d
ecis
ion
-m
akin
g t
oo
ls t
o
use
.
1(3)
TAB
LE 8
.2 C
on
t.G
IS a
pp
licat
ion
s in
aq
uac
ult
ure
acc
ord
ing
to
th
e m
od
els
and
dec
isio
n s
up
po
rt u
sed

The potential of spatial planning tools to support the ecosystem approach to aquaculture134
Case Study 1:Development of programmatic EIAs and monitoring programmes for clustersof small scale cage farmers (Source: Palerud et al. (2008); Legovic et al. (2008);and White (2009). The work was undertaken by the NORAD funded EMMA project (EnvironmentalMonitoring and Modelling of Aquaculture impact in risk areas of the Philippines) andthe EU FP6 funded PHILMINAQ project (Mitigating impact from aquaculture in thePhilippines (www.philminaq.eu).
ObjectiveThe purpose of the project was to increase the organisation and representation of farmers so that “clusters” of farms could be effectively monitored and managed, thus avoiding the classic boom and bust cycle of small scale aquaculture avoided.
Target decision support audienceGovernment aquaculture planners and managers
Geographic area and scale of analysisThe study was centred on three areas in the Philippines, Bolinao Bay (marine), Dagupan estuary (brackish) and Taal Lake (freshwater). This case study describes the methodology used in Bolinao Bay.
Analytical framework and resultsPalerud et al. (2008) and Legovic et al. (2008) developed a methodology for the estimation of safe aquaculture carrying capacity, optimal site selection, and zoning of aquaculture parks for sustainable aquaculture development for small scale farmers in Bolinao Bay in the Philippines.
In Taal lake there were found to be 9 500 cages generating 120 000 tonnes of fish per annum. In Bolinao bay there were 460 fish cages of which 322 were operational (70 percent) and 138 were not operational (30 percent) with an annual production of 8 844 tonnes from cage culture, 13 755 tonnes from pen culture and 3 289 tonnes from mussel culture. In both areas there was found to be little planning, management and control of aquaculture development.
The project involved a range of activities including GIS and assessment of carrying capacity, zoning and development of zone committees, cluster level environmental assessment and monitoring, training/awareness, capacity building and institutional strengthening.
Using a depositional model TROPOMOD1, three rows of cages were tested for each aquaculture zone (Figure 8.1a). The area of high and severe impact was found to occupy the majority of the zone area and little area was available between rows for remediation of impact (Figure 8.1b). Thus, in all aquaculture zones except Zone 4, two rows of 18 cages were found to be optimum. As larger cages were present in Zone 4, two rows of 12 cages were recommended.
Relevance to EAAMany studies have noted the inadequacy of Environmental Impact Assessment (EIA) to address the cumulative impacts of large numbers of small scale development, typical of much aquaculture production worldwide (FAO, 2009;GESAMP, 2001). Therefore this study is particularly valuable to EIA and hence to EAA because it illustrates an example of a strategic environmental assessment, or environmental assessment applied to clusters of farms, coupled with analysis
1 TROPOMOD is a particle tracking model used for predicting output, movement and deposition of particulate waste material (with resuspension) and associated benthic impact of fish farms.

1358. Case studies of GIS, remote sensing and mapping applications in aquaculture in relation to EAA implementation
of environmental capacity issues and it addresses the importance of ecosystem-based co-management of a shared waterbodies (White et al., 2008; White and San Diego-McGlone, 2008). Moreover, a large number of countries have referred to the lack of monitoring systems or capacity for field evaluations and checking EIA effectiveness (FAO, 2009) therefore this study is also particularly valuable to EIA and EAA because it addresses this issue by proposing three types of survey for monitoring the impact of aquaculture. These ranged from low cost through intermediate to fully scientific surveys and differ in terms of cost, complexity and accuracy but all give a good indication of the level of aquaculture impact. A field manual of methodology for the three categories of monitoring survey can be downloaded from www.philminaq.eu.
From a GIS viewpoint this study is useful because it shows how a number of models can be coupled with GIS to identify zones, estimate the maximum number of cages in a zone, estimate the minimum distance between zones and undertake scenario testing to identify management options for minimising impact.
Case study 2:Sustainable Options for People, Catchment and Aquatic Resources (source: Ferreira et al., 2008)This SPEAR project (2004-2007) was financed by the European Union INCO-DEV programme (www.biaoqiang.org). It was a follow-up to the experiences gained in the Sustainable Mariculture in Northern Irish Loughs Ecosystems (SMILE) project (2004-2006) for determining environmentally sustainable carrying capacity for shellfish aquaculture for Irish loughs (Ferreira et al., 2007).
ObjectivesThe general objective of SPEAR was to develop and test an integrated framework for management of the coastal zone, using two test cases where communities depend primarily upon marine resources.
Target decision support audienceCoastal zone planners and managers.

The potential of spatial planning tools to support the ecosystem approach to aquaculture136
Source: Ferreira et al. (2008).
Geographic area and scale of analysisTwo contrasting coastal systems in China were used as study areas. Sanggou Bay is in a rural area in the North, and Huangdun Bay is an industrialized area south of Shanghai, that is subject to substantial human pressure at both local and regional levels.
Analytical methods and resultsThe overall SPEAR framework accounted for watershed interactions, ecological structure and human activities. The interdisciplinary approach used combined natural and social sciences, and addressed the complex scaling issues inherent in integrated management. The main objectives of model development at the ecosystem scale were to: Simulate the ecosystem processes on a multi-year scale for each bay; simulate the aquatic resources produced in the bays; develop the socio-economic components to dynamically integrate this framework; and to calibrate and validate the research model suite. A key feature of the general modelling approach used in SPEAR was to integrate the various models in order to develop a robust ecosystem modelling framework where GIS and Remote Sensing play an integral part (Figure 8.2).
From a technical standpoint, outputs from the SPEAR project represent the state-of-the-art in coastal management, featuring web-based models, hybrid ecological-economic approaches, and management tools to be used at a variety of scales. Technological developments will mean that the tools themselves will evolve fairly rapidly, but the underlying scientific paradigms are expected to change more slowly.
Relevance to EAAThis project is valuable to EAA because it is a holistic assessment of aquaculture on the basis of people, planet and profit. The challenge of bringing the various components of the People-Planet-Profit equation together as a holistic indicator of sustainable carrying capacity in coastal areas appears both achievable and appropriate for integrated coastal management.
From a GIS viewpoint this project is noteworthy in a number of ways: First, it represents a good example of integration of spatial data across different scientific disciplines; secondly, it is novel because it combines models running at widely different time and space scales for different ecosystem components as a requirement for scaling and as co-validators of each other, lending confidence to the outcomes and thirdly a socio-economic viewpoint was included using the MARKET model. Also valuable are the set of management scenarios proposed by the project team and stakeholders that clearly illustrate the role and value of GIS (Table 3).

137
In summary, GIS was used throughout the project in several key roles:• In decision support as the geographic component of key variables. This helped in
the decision-making process and interpretation of results;• In modelling, by providing input values relevant for parameterization and
calibration, by serving as a platform for communication between different models and by allowing a first approach at 2D validation processes, allowing the use of spatialized assessment of model results by applying relevant indexes (e.g. index of agreement); and
• In visualisation at several stages of the project by allowing the spatialization of relevant inputs and results, and by performing spatial analysis of model results.
However, most models used in this project were not fully integrated within a GIS software. This was done in a follow-up project, Understanding Irish Shellfish Culture Environments (UISCE), on carrying capacity in Ireland, where an application in ArcGIS was used to run the various models (J.G. Ferreira, personal communication, 2009).
It may be difficult to properly assess the value of the information generated by
8. Case studies of GIS, remote sensing and mapping applications in aquaculture in relation to EAA implementation
TABLE 8.3Development scenarios for Huangdum Bay and Sanggou Bay
System Scenario description ToolsHuangdum Bay Assess impact of change to fish cage numbers and sizes.
Assess impact of nutrient discharge reduction from waste water treatment plantsCombination of the two scenarios above
GIS, EcoWin2000
SWAT, Delft3D, EcoWin2000
As aboveSanggou Bay Reduce culture densities for shellfish alone by 50%
(achieved by increasing distance between longlines and/or droppers, to assess consequences for total production value.Alter species composition: currently there are 450 Mu*of fish cages, 50 000 Mu of Laminaria, 40 000 Mu of shellfish, proposed change to a 70:20:10 (kelp:filter:finfish)Replace oyster culture (1500 Mu) with abalone culture (1000 Mu) and fish cages (400 Mu)
GIS, EcoWin2000
GIS, EcoWin2000
MOM, FARM
* Mu is the Chinese Unit of area. In aquaculture, the culture Mu is used for licensing, and although nominally rated as 1/15 of one hectare, its size is variable according to the productivity of the system, i.e. a less productive system has a larger Mu. Typical values range from 1000-5000 m2.
Figure 8.3 illustrates one of the management scenarios from the project. The farm selected as a demonstration site is located in Box 4 of Sanggou Bay, where Pacific oyster (Crassostrea gigas) raft culture, Japanese Flounder (Paralicthys olivaceus) and Puffer fish (Fugu rubripes) cage culture coexist.
FIGURE 8.3Box layout of Sanggou Bay and the location of FARM simulation area
Source: Ferreira et al. (2008).

The potential of spatial planning tools to support the ecosystem approach to aquaculture138
SPEAR, and therefore its contribution towards decision support. However, a number of follow-up actions have taken place and give a positive indication of their impact. No specific management measures are reported in China as a direct result of SPEAR, although indirectly there was an increase in management awareness both of
i. the options available to address some of the problems, such as high mortality of young fish in Huangdun Bay, or over-exploitation of aquaculture in Sanggou Bay;
ii. the tools which can be used to look at the outcome of different management approaches.
As a follow-up to SMILE and SPEAR, the Institute of Marine Research (IMAR) has been working with others on individual shellfish modelling over the past two years. In particular IMAR has developed a new model called AquaShell, which aims to include the minimum set of equations required to successfully simulate bivalve growth, and has implemented it for the Pacific oyster and applied it to oyster cultivation in Chile. IMAR has a proposal (in review) led by Mr. Cedric Bacher (IFREMER) which aims to further develop efforts by SMILE and SPEAR,to interface GIS, individual-, farm-, and ecosystem-scale models (J. G. Ferreira, personal communication, 2009).
Case study 3:A GIS-based decision-support tool for optimisation of marine cage siting for aquaculture: A case study for the Western Isles, Scotland (source: Hunter, Telfer, and Ross (2006); Hunter, Telfer and Ross (2007); Hunter (2009).This project focuses on GIS models developed by the Institute of Aquaculture, at the University of Stirling (www.aqua.stir.ac.uk/GISAP/gis-group/donna.php).
ObjectivesThe main objective of the study was to develop a holistic management tool for sustainable coastal marine aquaculture through the development of a multi-faceted model that allows consideration of sensitive environments.
Target decision support audienceAs the Scottish government promotes better collaboration and integration of all involved in coastal zone governance (Baxter et al., 2008) this study illustrates the benefits to be gained from harmonized management of information in a GIS.
Geographic area and scale of analysisThe chosen study area for this research was the Western Isles also known as the Outer Hebrides, off the North West coast of Scotland at a latitude 58 00o N and a longitude of 7 00o W in the north Atlantic Ocean.
Analytical framework and resultsTo date, GIS models for aquaculture management have usually had a single focus based on selection of fish farm sites, prediction of wastes, etc. This project seeks to integrate and develop existing approaches and to develop and integrate novel tools for considering all available environmental information in conjunction with the distribution of waste, other aquatic stakeholder uses, anthropogenic and natural inputs, land resources and effects on the marine environment, river systems, visual impacts of the development and area designation (i.e. conservation areas and their overlaps with existing area management). All of these factors need to be taken into account when implementing environmental management and investigating carrying capacity. In addition, implementation of the EU Water Framework Directive (WFD) will require a combined, multi-site approach in consideration of environmental data. Models that enable the integration of all this information will be

1398. Case studies of GIS, remote sensing and mapping applications in aquaculture in relation to EAA implementation
extremely useful for coastal management and will form a “second generation” environmental management tool for modelling and regulation of fish farming in Europe.
This project builds on further development of models developed by the Institute of Aquaculture, at the University of Stirling, using the extensive modelling tools and geographic information capabilities within GIS to construct a completely integrated coastal environmental management package. This can then be used for both environmental regulation of whole coast systems in which fish farming occurs and for environmental management of multiple farm systems, taking into account all inputs to the coastal environment which impinge on its carrying capacity.
The GIS support tools evaluated and integrated by Hunter, Telfer and Ross (2006); Hunter,Telfer and Ross (2007) and Hunter (2009) were based on four main sub-models. These were: Cage site suitability; Particulate waste dispersal, Biodiversity sensitivity indicators and Visual landscape capacity. Each of these sub-models may contain other important sub-models, such as significant wave height and period, and all can either operate as stand-alone decision-making tools or be combined into a holistic model which incorporates a flexible method of trade-off management. The main thrust of combining these sub-models was to link complex databases of environmental (including requirements of Environmental Impact Assessment and monitoring), socio-economic, farm level production information and governmental policy information.
Figure 8.4 shows a conceptual model framework providing holistic decision support for marine aquaculture in the Western Isles, Scotland. The schematic shows a range of primary data sources feeding into four principal sub-models, each of which has a number of sub-model components. All sub-models may be operated as stand-alone tools, or the outcomes may be combined into an overall decision support system. The decision rules at different levels of the model are set by “Policy” which covers environmental limits, engineering tolerances, national policy and regulatory drivers. Figures 8.5a-d illustrate some of the resulting outputs from each of the sub-models.
FIGURE 8.4Conceptual model framework providing decision support for marine aquaculture
in the Western Isles, Scotland.Decision rules at different levels of the model are set by environmental limits,
engineering tolerances, national policy and regulatory drivers
Source: Hunter (2009).
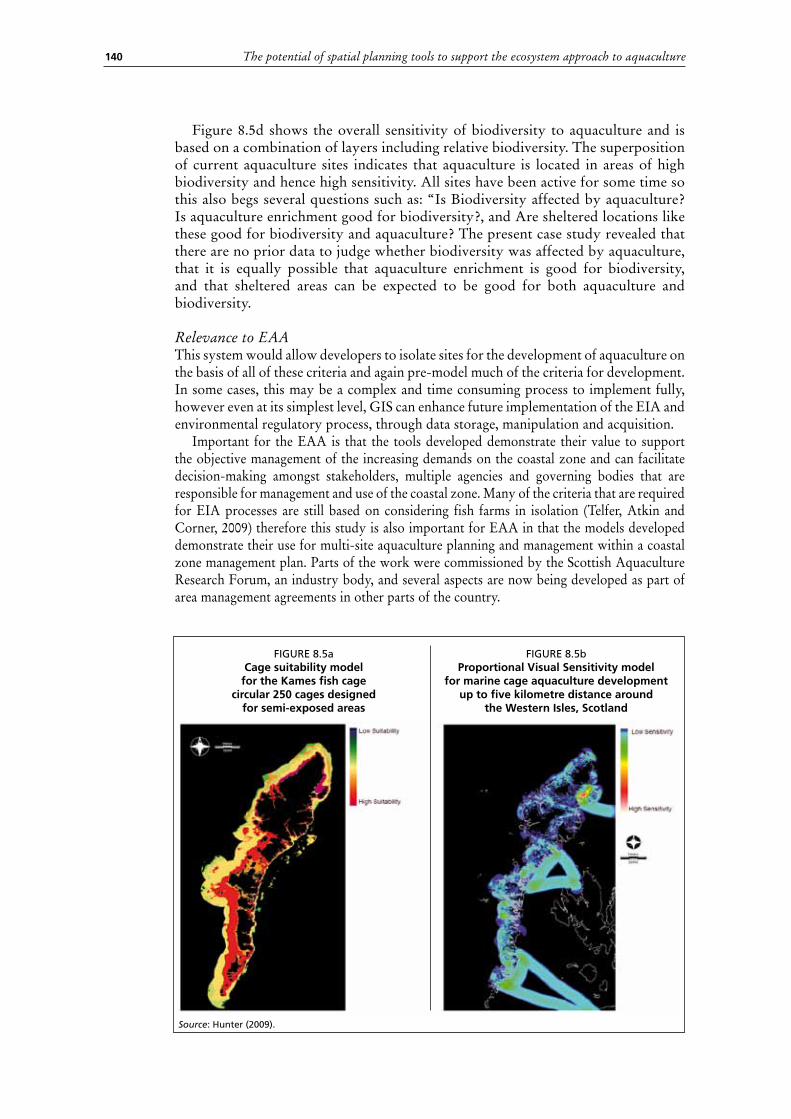
The potential of spatial planning tools to support the ecosystem approach to aquaculture140
Figure 8.5d shows the overall sensitivity of biodiversity to aquaculture and is based on a combination of layers including relative biodiversity. The superposition of current aquaculture sites indicates that aquaculture is located in areas of high biodiversity and hence high sensitivity. All sites have been active for some time so this also begs several questions such as: “Is Biodiversity affected by aquaculture? Is aquaculture enrichment good for biodiversity?, and Are sheltered locations like these good for biodiversity and aquaculture? The present case study revealed that there are no prior data to judge whether biodiversity was affected by aquaculture, that it is equally possible that aquaculture enrichment is good for biodiversity, and that sheltered areas can be expected to be good for both aquaculture and biodiversity.
Relevance to EAAThis system would allow developers to isolate sites for the development of aquaculture on the basis of all of these criteria and again pre-model much of the criteria for development. In some cases, this may be a complex and time consuming process to implement fully, however even at its simplest level, GIS can enhance future implementation of the EIA and environmental regulatory process, through data storage, manipulation and acquisition.
Important for the EAA is that the tools developed demonstrate their value to support the objective management of the increasing demands on the coastal zone and can facilitate decision-making amongst stakeholders, multiple agencies and governing bodies that are responsible for management and use of the coastal zone. Many of the criteria that are required for EIA processes are still based on considering fish farms in isolation (Telfer, Atkin and Corner, 2009) therefore this study is also important for EAA in that the models developed demonstrate their use for multi-site aquaculture planning and management within a coastal zone management plan. Parts of the work were commissioned by the Scottish Aquaculture Research Forum, an industry body, and several aspects are now being developed as part of area management agreements in other parts of the country.
FIGURE 8.5aCage suitability modelfor the Kames fish cage
circular 250 cages designedfor semi-exposed areas
FIGURE 8.5bProportional Visual Sensitivity model
for marine cage aquaculture developmentup to five kilometre distance around
the Western Isles, Scotland
Source: Hunter (2009).

1418. Case studies of GIS, remote sensing and mapping applications in aquaculture in relation to EAA implementation
Case study 4:Local Plans for Marine Aquaculture Development in Brazil (source: Andrade and Mafra, 2008)There are specific regulations to guide the development of planning applications to demarcate marine aquaculture parks in Brazil. Normative Instruction No. 17/2005 sets the criteria and procedures for the elaboration and approval of Local Plans for Marine Aquaculture Development (Planos Locais de Desenvolvimento da Maricultura – PLDM), in order to delimit coastal aquaculture parks and preferred areas for traditional communities.
FIGURE 8.5dCurrent active fish farm locations in the Western Isles (indicated as cyan dots) overlaid
on the overall model of Biodiversity sensitivity to aquaculture for the Western Isles
Source: Hunter (2009).

The potential of spatial planning tools to support the ecosystem approach to aquaculture142
Normative Instruction No. 11/2008 provides some improvement on the guidelines for the PLDM elaboration, with more guidance on GIS products that must be developed as part of the plan, and procedures to select suitable areas for the aquaculture parks (http://tuna.seap.gov.br/seap/html/aquicultura/index.htm).
ObjectivesThe primary objective of this work was the development of guidelines to demarcate marine aquaculture parks in Brazil.
Target decision support audienceEnvironmental agencies, navy, universities, fishermen and aquaculture organizations, extension agencies and NGOs.
Geographic area and scale of analysisMarine and inland aquaculture in Brazil
Analytical methods and resultsThe PLDM process begins with a strategic environmental analysis at the local level, with the identification and localization of environmental reserves, review of users of coastal resources (navigation, leisure, tourism and fishery grounds), detailed environmental characterization of selected marine areas and surrounding land activities that might negatively impact aquaculture development, logistic considerations and the biological requirements of target aquaculture species. Once elaborated, draft versions of the PLDM are discussed at state and local committees with participants from the environmental agencies, navy, universities, fishermen and aquaculture organizations, extension agencies and NGOs.
A similar approach is used in the demarcation of inland aquaculture parks, although there is no specific regulation as for the PLDM for marine areas. For inland aquaculture, the main hydroelectric reservoirs have been the object of studies to demarcate aquaculture parks. These studies include carrying capacity analysis according to the method proposed by Dillon and Rigler (1974) adapted by Beveridge (1987). The method requires information about phosphorous content effects in feed and fishes, food conversion ratios, sedimentation rates and residence time in order to calculate the sustainable stocking density of each reservoir. The planning process also includes the development of a GIS for the selection of suitable areas and demarcation of aquaculture parks. An example of GIS developed for one major hydroelectric reservoir can be viewed at http://ecologia.icb.ufmg.br/~rpcoelho/Parques_Aquicolas/website/ or http://200.145.243.69/parqueaquicola/index.php
For coastal aquaculture, the planning and management process through the PLDM is under development in 11 states and 77 municipalities along the Brazilian coastline. The first PLDM approved, at Santa Catarina state, demarcated 36 000 ha of marine aquaculture parks with 2 420 ha of production areas for bivalves and seaweeds (SEAP, 2007). These parks will regularize 800 aquaculture farmers already in operation and also plan the allocation of further production areas for 2 585 new farmers. Estimated direct and indirect employment generated with this action is 7 740 and 31 000 respectively. The GIS developed for the PLDM in Santa Catarina can be viewed at
http://arcims.ciram.com.br/sigeo/mapadinamico/viewer•htm?service=PLDM&ovmap=PLDM
The southern bay of Florianópolis in Santa Catarina was chosen as a pilot study to test the methodology developed (Figure 8.6). Thirty-five site selection factors identified by a group of 18 experts including oceanographers, geographers, cartographers, administrative personnel including extension agents, mariculture

143
Relevance to EAA and GISThe PLDM process is particularly important for the EAA because it includes a strategic environmental analysis at local level and because once elaborated, the PLDMs are discussed amongst a broad range of relevant stakeholders and consensus is reached. From a GIS viewpoint this study is noteworthy because it illustrates the use of a simple analytical framework and it is a good example of a fully fledged practical application of the MCE method using the Analytical Hierarchy Process (AHP) to support decision-making for marine and inland aquaculture development.
Case study 5:Determination of High-Potential Aquaculture Development Areas and Impact in Africa and Asia (source: Kam et al., 2008).A three-year research project, titled “Determination of High-Potential Aquaculture Development Areas and Impact in Africa and Asia”, was carried out to develop and supply the tools for integrative analysis to support informed decision-making on promoting and scaling out target technologies for pond aquaculture (www.worldfishcenter.org/rdproject).
8. Case studies of GIS, remote sensing and mapping applications in aquaculture in relation to EAA implementation
FIGURE 8.7aSouthern bay of the Florianòpolis in Santa
Catarina to test the models developed.Areas with potential were found along
the western and eastern coastlines(proposed fish farm locations are
presented in black squares)
FIGURE 8.7bOne of the main hydroelectric reservoirs
in Brazil used to demarcate inlandaquaculture parks
(http://200.145.243.69/parqueaquicola/index.php)
Source: SEAP (2007).
technicians, and mussel and oyster farmers were used. The factors were grouped into eight sub-models. They were: hydrodynamic, physical, pollution. Socio-economic, infrastructure, markets, production and bio-ecological and the MCE applied to derive a final suitability map. Figure 8.7a illustrates potential areas for marine aquaculture in the southern bay of the Florianópolis and Figure 8.7b illustrates one of the main hydroelectric reservoirs in Brazil to demarcate inland aquaculture parks.

The potential of spatial planning tools to support the ecosystem approach to aquaculture144
ObjectivesThe main project objective was to determine recommendation domains for promoting the development of freshwater pond aquaculture aimed at improving household food security and the livelihoods of smallholder farmers. Recommendation domains are places and sets of conditions for which a particular target aquaculture technology is considered feasible and therefore good to promote.
Target decision support audienceThe project results will be useful for policy planners and decision-makers in national, regional and local governments and development funding agencies, aquaculture extension workers in regional and local governments, and researchers in aquaculture systems and rural livelihoods.
Geographic area and scale of analysisThe project was piloted in four countries: Cameroon and Malawi in Africa, and Bangladesh and China (focusing on Henan Province) in Asia. These countries occupy various stages along the spectrum of aquaculture development, thereby allowing researchers to test the applicability and usefulness of the decision-support tools under differing sets of circumstances.
Analytical framework and resultsThe project adopted a framework, depicted in Figure 8.8, that integrates the various multidisciplinary components into a knowledge-based analytical and decision-support system to provide an informed basis for recommending particular aquaculture practices and technologies. An important first step in the research was to gain an understanding of the main factors influencing the potential for successfully adopting the target aquaculture technology. This then served as the basis for using the GIS and Bayesian network

145
modelling techniques developed by the project to analyze the data collected on these influencing factors. The resulting decision-support toolkit can help various target users identify both the locations and the conditions suitable for smallholder freshwater pond aquaculture, as well as the aquaculture systems and technologies suited to these locations.
The main outputs of the project were: (1) an integrated knowledge base of freshwater pond aquaculture systems and practices, as well as the driving factors for their adoption and continued development; and (2) an analysis and decision-support package that can be used to (a) identify places and situations in which freshwater aquaculture is feasible; and (b) elucidate the nature of constraints requiring appropriate interventions to realize the potential of the target areas.
Relevance to EAAThis project is noteworthy to EAA for a number of reasons:
• The project developed a comprehensive framework that was able to integrate modelling of both quantifiable and qualitative factors using Bayesian (belief) networks. The outcome of the Bayesian modelling was a reading of the probability of farmers’ positive versus negative perception of the target technology, which indicates the likelihood that they will adopt it.
• The combination of the GIS and Bayesian network tools identify places and sets of conditions for which a particular target aquaculture technology is considered feasible and therefore good to promote and also identify the nature of constraints to aquaculture development and thereby shed light on appropriate interventions to realize the potential of the target areas (Figure 8.9).
8. Case studies of GIS, remote sensing and mapping applications in aquaculture in relation to EAA implementation
Terminology: HH (Households).

The potential of spatial planning tools to support the ecosystem approach to aquaculture146
• Also included in the decision support toolkit are software programs developed to estimate and map (a) the thermal growth period, which is the duration when water temperature is conducive for fish growth; (b) the duration of pond water availability for fish culture, based on water balance modelling and taking into account agro-ecological and hydrological conditions of the target area; and (c) fish growth and yield based on the von Bertalanffy growth model and the optimum growth period estimated using (a) and (b).
• Participation of national partners in the model development process was always encouraged and played an important part of the project
• These decision-support tools were matched to target user’s roles, knowledge and skills to ensure the sustained use of such decision-support tools so that the required skill sets and expertise are either available, acquired or outsourced.
Case study 6:Aquaculture information management and traceability system in Thailand (source: Funge-Smith and Aguilar-Manjarrez, 2009)Aquaculture development in Thailand has grown consistently for the past 25 years. Sectoral development policies of successive governments have been directed towards intensification and expansion of the sector, as clearly evidenced by shrimp aquaculture development in coastal and, subsequently, inland areas. With expansion and growth, problems relating to environmental degradation and losses due to animal health emerged. An FAO Technical Cooperation Project Facility (TCP-F), requested by the Department of Fisheries, Thailand, (DoF Thailand), addressed these issues through creation of decentralized capacity for the DoF Thailand to better manage the environment, aquatic animal health and traceability of aquatic products through a comprehensive aquaculture management information system (AMIS). A TCP-F mission was conducted in February2008, and the follow-on to this mission is a full-scale project that will become operational in 2011.
ObjectivesThe project is aimed at improving sustainability and livelihood security of aquaculture stakeholders, improving quality and traceability of aquaculture products, and sustaining or expanding trade in aquaculture products. These goals correspond with a stated vision of DoF Thailand for sustainable aquaculture development.Target decision support audienceThe stakeholders include the provincial and district offices of the DoF as well as DoF central offices and research centres, other ministries and departments that have mandates for lands, waters and the environment as well as the entire aquaculture sector. The target beneficiaries are the aquaculture producers, harvesters, transporters, marketers, processors and exporters as well as the government agencies who take decisions on the allocation of lands and waters for aquaculture and other uses. Ultimately, the target beneficiaries are the consumers of Thai aquaculture products on international and national markets.
Geographic area and scale of analysisThailand’s total area, including areas under inland waterbodies and some coastal waterways, is 513 115 km2
Analytical framework and resultsAn Aquaculture Management Information System would be operated mainly by provincial and district DoF personnel and research centres, with wider application and participation by personnel at all levels the fisheries department as well as other

147
Note: Hawths tools have now been replaced by the Geospatial Modelling environment (L.G. Ross, personal communication, 2010).
Relevance to EAAThe project is noteworthy because it has the elements to guarantee its sustained use.
8. Case studies of GIS, remote sensing and mapping applications in aquaculture in relation to EAA implementation
departments, ministries and NGOs. The system will support the development of tools for increased traceability and improved management of aquaculture information in Thailand.
Top-level management support, GIS awareness, technical capacity, and the scope and quantities of data for aquaculture zoning and planning in Thailand are already largely in place. Therefore, the main constraints appear to be a lack of data sharing, shortage of awareness of the analytical/modelling capabilities that GIS can provide, lack of access to experience concerning how GIS can be deployed. Thus, this FAO project aims to improve/enhance cooperation amongst Divisions at the DoF and existing institutions/ministries having expertise in GIS, and Remote Sensing for collaborative work and data sharing.
The Fishery Information Technology Centre at the DoF is responsible for developing and maintaining computer networking, GIS, information management systems, and fisheries data collection and statistical reports for end users in Thailand. Current projects on GIS at the Centre are: Inventories of aquaculture and fisheries structures; Fish cage identification and inventory; Vessel Monitoring Systems development; Fishing gear detection; Exclusive Economic Zone for Aquaculture management and Flood monitoring. Outputs from the GIS analysis are displayed on the Internet using ArcIMS® technology and for both internal and external use (http://gis.fisheries.go.th). An example of the type of information already in existence at the DoF is illustrated in Figure 8.10. This figure shows how GIS tools can be used to randomly select farm ponds in Thailand. Of relevance to the EAA is the capacity of these tools to be able to inventory aquaculture structures, monitor aquaculture performance and predict production.
FIGURE 8.10Geographic Information System of the Department of Fisheries, Thailand.
These selected pond farms (highlighted in red) were randomly and spatiallysampled using Hawths’Tool in ArcGIS®
Source: Department of Fisheries, Thailand, 2009.

The potential of spatial planning tools to support the ecosystem approach to aquaculture148
Importantly, the project was requested by the Department of Fisheries, Thailand (DoF), themselves and there is a strong interest within the Department of Fisheries, Thailand at both central and local levels to find ways to improve the management of information and traceability. This strong interest will ensure the commitment of DoF. The technical support given under the project will build on the existing capacities within the DoF to ensure a continued implementation of the overall objective after the end of the project.
This case study is noteworthy for EAA because it is relatively generic, applicable in other countries with significant aquaculture production systems, and provides an opportunity for utilising an operational GIS to support a comprehensive Aquaculture Management Information System. This is a timely initiative as DoF Thailand is committed to secure/sustain the use of GIS for fisheries and aquaculture at all administrative levels. The Fishery Information Technology Centre, well equipped with skilled manpower and data, could provide strong support to the project. Successful implementation of this full-scale project would lead to improved operational decision-making on aquaculture management and development and enhanced aquaculture planning and policy capabilities.
8.5 SUMMARy AND CONCLUSIONSThis chapter had two objectives. The first was to relate GIS applications in aquaculture to EAA principles in a general way and to illustrate the strength of GIS through its capability to spatially integrate and analyze the natural and human environments. In this way each of the three EAA principles can be viewed in terms of the relevance of various kinds of spatial tools and analyses that can be applied to attaining the objectives, both explicit and implicit, of each principle.
The second objective was to illustrate ways in which GIS, remote sensing and mapping can contribute to the implementation of the EAA through case studies and other examples.Twenty-one case studies spanning all of the EAA principles and scales have been selected and summarized in tabular format, and further access to these is provided via the FAO GISFish gateway. From these case studies, six were selected to be described from a decision-making and modelling viewpoint. These case studies clearly demonstrate that spatial analyses can be easily designed to meet a variety of EAA needs with respect to scales and principles, and are indicative of the state of the art, allowing readers to make their own assessment of the benefits and limitations of use of these tools in their own disciplines. The complete original studies are accessible via GISFish.
An approach for incorporating much of the information needed for the Environmental Impact Assessment (EIA) and Strategic Environmental Assessment (SEA) processes through a single modelling and data collation process involves the use of GIS. Models such as those developed by Hunter (2009) could be widely adopted to integrate this process. These models are still under development but they clearly illustrate that GIS already has the capability to take environmental impact modelling forward, and can provide a clear foundation for creating more powerful and robust tools that are easy to replicate, are rapidly updatable and that can be policy-driven in their application.
Although most models developed in SMILE and SPEAR were not implemented or fully integrated within a GIS software, the progress which was made in both projects illustrate the role of GIS to support the implementation of a national programme for sustainable aquaculture, drawing upon excellent collaboration among science, management and industry, and harmonizing the concerns of fishers and environmental decision-makers, the aquaculture industry and conservation agencies.