6-2 cogen and renewables t si cemfasttrack 03 26 12
TRANSCRIPT

3/29/2012
1
COMBINED HEAT AND POWER
AND
RENEWABLE ENERGY SOURCES
S TSECTION T
COMBINED HEAT AND POWER
Also known as: Combined heat and power (CHP) Cogeneration Combined cooling, heating and power (CCHP) Building cooling, heating and power (BCHP)g g, g p ( )
Definition: Simultaneous production and use of useful
mechanical and useful thermal energy Mechanical energy is frequently used to turn a
generator producing electrical energy Thermal energy can be used to generate
cooling (i.e., absorption chiller)
Section T - 2
WHY CHP?
CHP has the opportunity to: Improve system efficiency (as compared to
typical power generation without useful heat recovery)R d t t l ti t ( d t Reduce total operating costs (compared to purchasing or generating electricity and heat energy in separate systems)
Improve system reliability and availability (when CHP is used a primary and the utility systems are used as a back-up source)
Section T - 3
CHP ENERGY BALANCE
Section T - 4
Source: EPA Combined Heat and Power Partnership (www.epa.gov/chp)
3/29/2012
2
TYPES OF CYCLES
Three primary types of cycles: Topping cycle Bottoming cycle Combined cycle (which is usually a dual topping
cycle)cycle)
Why is the type of cycle important? Regulations apply differently based on type of cycle More on this when we get to qualified facilities
Section T - 5
TOPPING CYCLE
Primary energy first produces mechanical energy and residual thermal energy is recovered and used Example 1: High-pressure boiler steam is used
to power a turbine The resulting shaft power to power a turbine. The resulting shaft power turns a motor or generator. In addition, steam out of the turbine provides useful heat energy to a process.
Example 2: Diesel engine turns a generator producing electric power. Waste heat recovery is applied to the exhaust gas and engine coolant producing useful hot water.
Section T - 6
TOPPING CYCLE EXAMPLE 1
SteamTurbine
GeneratorProcess/Heating
High-PressureSteam
Intermediate-PressureSteam
Section T - 7
SteamGenerator
Condenser
DAFeedwater Tank
Low-PressureSteam
CondensateReturn
Make-Up Water
Very Low-PressureSteam
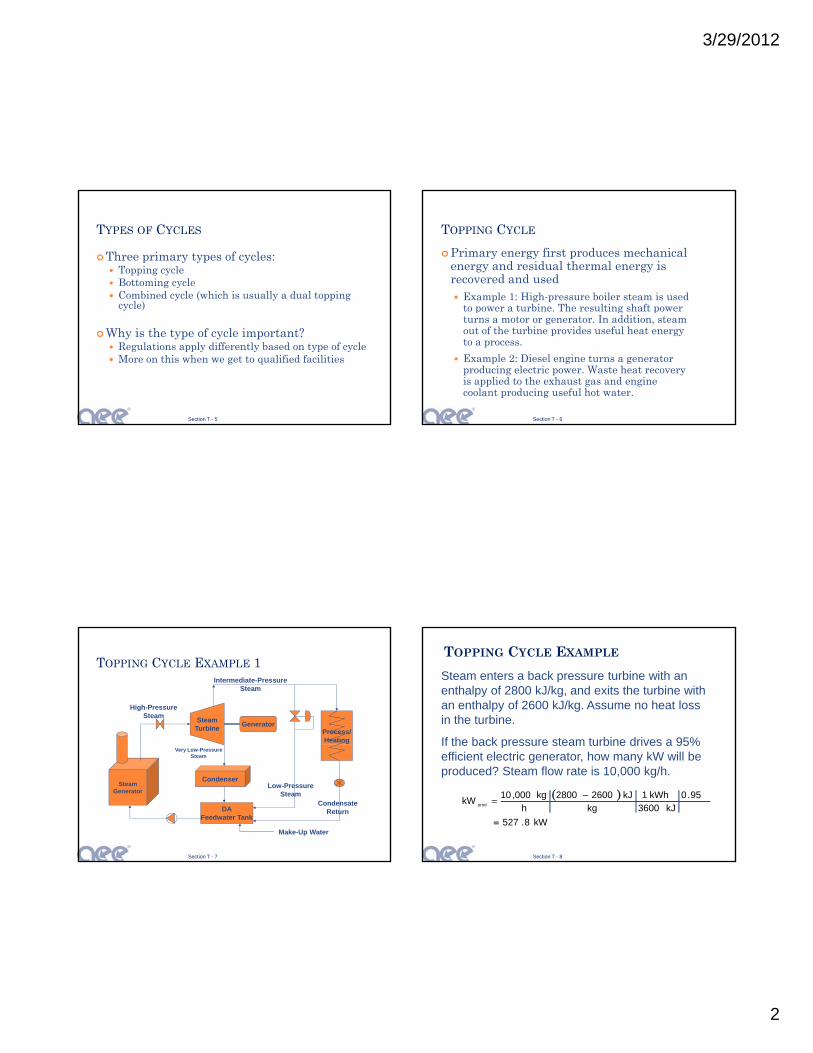
TOPPING CYCLE EXAMPLE
Steam enters a back pressure turbine with an enthalpy of 2800 kJ/kg, and exits the turbine with an enthalpy of 2600 kJ/kg. Assume no heat loss in the turbine.
If the back pressure steam turbine drives a 95%
Section T - 8
If the back pressure steam turbine drives a 95% efficient electric generator, how many kW will be produced? Steam flow rate is 10,000 kg/h.
kW8.527
95.0kJ3600
kWh1kg
kJ26002800h
kg000,10kW prod

3/29/2012
3
TOPPING CYCLE EXAMPLE 2
Heat RecoveryEngine
Coolant
Useful Heat Supply
ReturnR
adia
tor
Section T - 9
Generator
HeatRecoveryExhaust Gas
Useful Heat Supply
Exhaust Gas
Return
R
IC Engine
BOTTOMING CYCLE
Primary energy first satisfies a thermal demand, such as a furnace, and residual thermal energy is recovered and used to produce useful mechanical or electrical power. Example: A large combustion process, such as
a heat treating furnace, where the exhaust is used in a waste heat boiler to develop steam that is used to power a turbine. The resulting shaft power turns a motor or generator.
Section T - 10
BOTTOMING CYCLE EXAMPLE
Process/Heating
SteamTurbine
Generator
Very Low-Pressure Steam
High-PressureSteam
Section T - 11
SteamGenerator
orFurnace
Condenser
DAFeedwater Tank
Low-PressureSteam
CondensateReturn
Make-up Water
COMBINED CYCLE
Cycle produces useful mechanical energy at two different stages within the process. Residual thermal energy is utilized at least once in the process. Example: A combustion (gas) turbine creates shaft
power which powers a generator (a topping cycle) The power, which powers a generator (a topping cycle). The exhaust gas (perhaps with supplemental firing) is used in a waste heat recovery boiler to develop steam, which is used to power a steam turbine. The shaft power from the turbine is used to power a motor or generator (normally a topping cycle but used here as a bottoming cycle). In addition, steam out of the turbine, either as extraction or back-pressure steam, provides useful heat energy to a process. (the useful thermal energy makes this CHP).
Section T - 12

3/29/2012
4
COMBINED CYCLE EXAMPLE
SteamTurbine
Generator
Fuel W t h t
ExhaustGases
High-PressureSteam
Intermediate-Pressure Steam
Section T - 13
Generator
Process/Heating
DAFeedwater Tank
Low PressureSteam
CondensateReturn
Make-up Water
Burner
FuelCompressed
Air
Air
Waste heatBoiler
Gas Turbine
CHP TECHNOLOGIES
Technology Advantages Limitations
Steam Turbines Long lifeCan burn solid fuels
Low electric generating efficiency
Combustion Turbines
High-temperature heat outHigh efficiency in larger systems
Smaller systems have low electric generating efficiencyy
Intermediate sizes availabley
Internal Combustion Engines
High efficiency in smaller sizesSmall and intermediate sizes available
Low temperature heat recovery
Microturbines Small and intermediate sizes available
ExpensiveReliability needs improvement
Fuel Cells Small and intermediate sizes availableLowest emissions
Very expensiveNot (really) commercially available
Section T - 14
OTHER ITEMS
CHP is (typically) a type of DG CHP can work well with
District heating systems Thermal energy storage systems
Gas cooling s stems Gas cooling systems
Energy security and surety issues are giving CHP and DG more justification
Section T - 15
DISTRIBUTED GENERATION
Also known as: Distributed Generation (DG) Distributed Energy (DE) Distributed Energy Resources (DER), although
DER can include more that DG (flywheels, batteries, etc.)S lf ti Self generation
Definition: (and there are several) Any small-scale power generation that provides
electric power at a site closer to the end user than central generation, and is usually interconnected to the distribution system or directly to the end user’s facility [Reference 2]
Any method of producing power that will be used on or near the site at which it is generated [Reference 5]
Section T - 16

3/29/2012
5
RENEWABLE ENERGY
SOLAR
WIND
BIOMASS
Section T - 17
RENEWABLE ENERGY
Definition: Energy that comes from a renewable source What is a renewable energy source? Renewable energy is energy from natural resources,
which are naturally replenished in the short term, typically within a year or so
Section T - 18
typically within a year or so.
RENEWABLE ENERGY
The definition gets political High-head hydro, which can disrupt stream flows
and fish habitat, is frequently excluded from the definition.
Ground-source heat pumps, which consume
Section T - 19
Ground source heat pumps, which consume conventional electric energy but can be more efficient because of heat sink/source temperatures, are frequently included.
Biomass, or the burning of agricultural products, increases local emissions, but is included because we assume the emissions (CO2 and mineral ash) support the growth of new agricultural products.
RENEWABLE ENERGY-ELECTRIC
Photovoltaic (fixed or tracking)Wind-power generators
Horizontal axis Vertical axisH d
Section T - 20
Hydropower High-head Low-head and “kinetic” hydropower
Ocean Energy Surface wave or wave column Tidal and current power

3/29/2012
6
RENEWABLE ENERGY-ELECTRIC OR THERMAL
Concentrating solar thermal Tower or dish, usually tracking
Dish Stirling Geothermal (usable heat from below ground)
Section T - 21
Geothermal (usable heat from below ground) Biomass and bagasse Waste-to-energy Landfill gas
RENEWABLE-THERMAL
Solar thermal panelsConcentrating solar thermal Transpired solar collectors (solar air
preheaters)
Section T - 22
Thermal mass systems (Trombe wall)Ocean energy
Thermal gradient Ocean thermal energy conversion (OTEC) uses the
temperature difference that exists between deep and shallow waters to run a heat engine
RENEWABLE ENERGY-OTHER Daylighting Solar lighting-indirect Biofuels
(ethanol, bio-diesel, algae, others)
Section T - 23
RENEWABLE ENERGY TECHNOLOGIES
Wind-powered generators Large systems (600+ kW) are cost effective in select
locations Smaller systems (2 kW to 500 kW) are available but more
expensive
Section T - 24
Wind is an intermittent source, so storage or another power source is required for a stable supply

3/29/2012
7
3 KW PICTORIAL OF SYSTEM
Section T - 25
RENEWABLE ENERGY TECHNOLOGIES
Photovoltaics (PV) Still very expensive but the cost continues to come down.
Equipment costs around $8,000 to $12,000/kW (installed) PV is an intermediate source, so storage (i.e., battery) or
another power source is required for a stable supply
Section T - 26
Can be cost effective in remote locations
PHOTOVOLTAIC PANELSTypical PV Panels Thin Film Style
Section T - 27
RENEWABLE ENERGY
TECHNOLOGIES
Solar Ventilation Preheat Preheats make-up air to building Best applied to south face Passive heat recovery, can be cost effective Uses a by-pass during summer conditions Uses a by-pass during summer conditions
Section T - 28

3/29/2012
8
SOLAR VENTILATION PREHEAT
Section T - 29
NET METERING
Many States require utilities to offer net-metering programs for renewable energy systems. As of 2009, 43 States plus DC have net
metering policiesmetering policiesNet metering measures the difference
between the energy consumed from the utility and the energy produced by the generating equipment.
Requires a meter with net metering capability.
Section T - 30
RENEWABLE ENERGY CERTIFICATES
Also known as RECs, green certificates, green tags, or tradable renewable certificates.
Represent the environmental attributes of the power produced from renewable energy projects and are sold separate from commodity
Section T - 31
projects and are sold separate from commodity electricity.
Customers can buy RECs whether or not they have access to green power through their local utility and do not have to switch electric suppliers. Cost can range from 0.5¢ to 6¢/kWh, depending on type and location.
NET ZERO ENERGY
Several organizations have the goal of developing net zero energy buildings
Net zero energy buildings are highly efficient but still consume energy
Energy needs are met through self generation and
Section T - 32
gy g ginterconnection to the utility grid and utilize net metering
“Net” zero is typically defined on an annual basis

3/29/2012
9
NET ZERO ENERGY
Efficiency is still “job one” Reducing energy requirements through energy
efficiency is generally less expensive than renewable energy
Make the building as efficient as possible until
Section T - 33
Make the building as efficient as possible until renewable energy resources become cost effective
General rule of thumb: 75% EE & 25% RE
POWER-PURCHASE AGREEMENTS
POPULAR FOR RENEWABLE
ENERGY
3rd Party finances project installation 3rd Party sells you the solar energy produced on
i ( k i ) f 5 25 your site (at a known price) for 15-25 years. They like it because it will likely payback for them in
10 years or less.
You get “green” power and a known future energy cost (lower risk)
Section T - 34
REFERENCES
1. Kowlanowski, Bernard F. Small Scale Cogeneration Handbook, The Fairmont Press, Inc. Atlanta, GA, 2000.
2. McKinley, Sarah, “Untapped,” Energy Decisions, January-February 2000, pages 34-38.
3. Parks, William, et al. Reliable and Economic Natural Gas Distributed Generation Technologies, US Department of Energy, Washington DC.
Section T - 35
Energy, Washington DC. 4. Petursson, Gestur, Reducing Operating Costs Through On-Site
Generation of Electricity, Working Paper, Oklahoma Industrial Assessment Center, Oklahoma State University, Stillwater, OK.
5. Sturdevant, Nicole, “Getting On Track with On-Site Power,” Building Operating Management, July 2000, pages 79-88.
6. Wong, Jorge B. and Kovacik, John M., “Cogeneration,” Energy Management Handbook (Chapter 12), 5th edition, The Fairmont Press, Inc., Atlanta, GA.
REFERENCES
7. Landreth, Michael, “On-Site Power Generation: Items to Consider,” Proceedings Strategic Energy Forum, May 18, 2000.
8. Blazewicz, Stan and Walker, Stow, “Distributed Generation: What Will it Take to Deliver Grid Reliability?” Power Value, July-August 2000, page 12.
9. Gas Research Institute, “Natural Gas-Fueled Reciprocating
Section T - 36
, p gEngines; Fastest-growing Prime Movers for Distributed Generation,” Natural Gas Application in Industry, GRI.
10. US Department of Energy-Federal Energy Management Program, “Using Distributed Energy Resources—A How-to Guide for Federal Energy Managers,” Cogeneration and Competitive Power Journal, Vol. 17, No. 4, The Fairmont Press, Atlanta, GA, Fall 2002, pages 37-68.
3/29/2012
10
REFERENCES
11. DOE, The Green Power Network, Net Metering Policies. http://apps3.eere.energy.gov/greenpower/markets/netmetering.shtml
12. DSIRE, Database of State Incentives for Renewables & Efficiency, State Policies for Net Metering. www.dsireusa.org/
13. EPA Combined Heat and Power Partnership. www.epa.gov/chp
Section T - 37
p p g p14. DOE Office of Electricity Delivery and Energy Reliability.
http://www.eere.energy.gov/de/publications.html15. American Wind Energy Association
www.awea.org
APPENDIX
Section T - 38
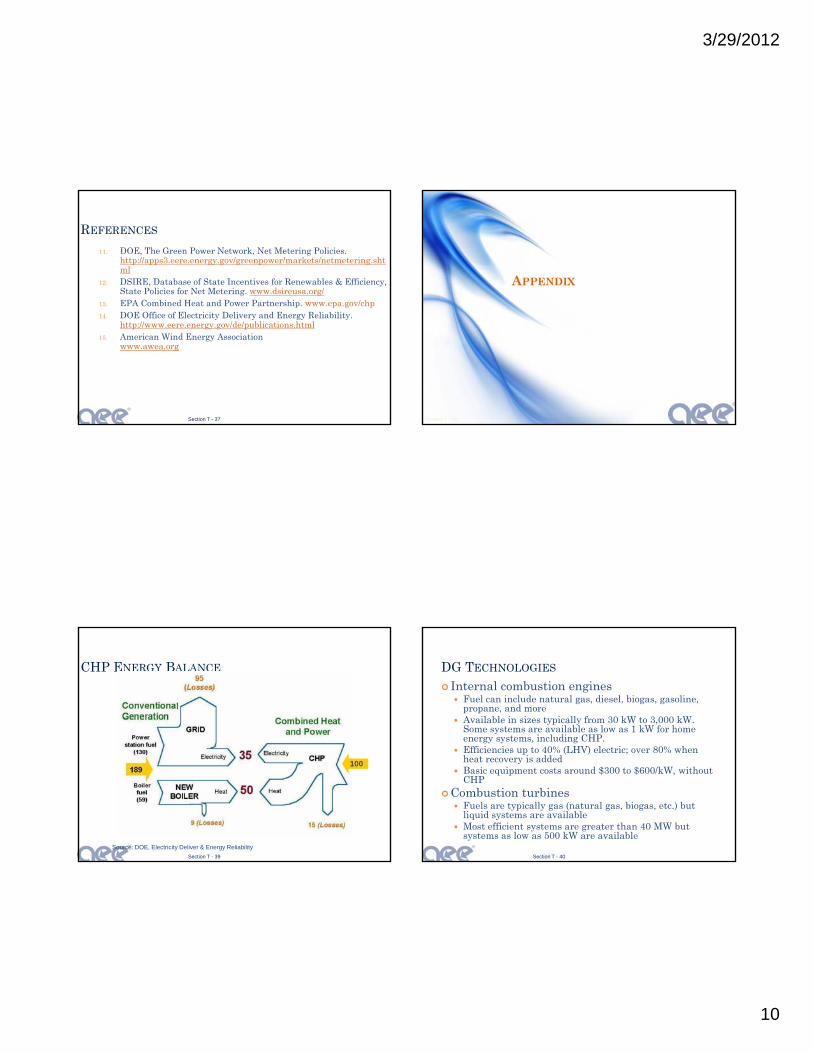
CHP ENERGY BALANCE
Section T - 39
Source: DOE, Electricity Deliver & Energy Reliability
100
DG TECHNOLOGIES
Internal combustion engines Fuel can include natural gas, diesel, biogas, gasoline,
propane, and more Available in sizes typically from 30 kW to 3,000 kW.
Some systems are available as low as 1 kW for home energy systems, including CHP.
Efficiencies up to 40% (LHV) electric; over 80% when heat recovery is added
Basic equipment costs around $300 to $600/kW, without CHP
Combustion turbines Fuels are typically gas (natural gas, biogas, etc.) but
liquid systems are available Most efficient systems are greater than 40 MW but
systems as low as 500 kW are available
Section T - 40

3/29/2012
11
DG TECHNOLOGIES
Wind-Powered Generators Large systems (600 kW and above) are becoming
cost effective in select locations Smaller systems (2 kW to 500 kW) are
commercially available but more expensive Wind is an intermittent source so another power Wind is an intermittent source, so another power
source is frequently required for a stable supplyPhotovoltaics (PV)
Still very expensive but the cost continues to come down. Equipment around $6,000 -$10,000/kW today
PV is an intermediate source, so another power source (i.e., battery) is frequently required for a stable supply
Can be cost effective in remote locations
Section T - 41
DG TECHNOLOGIES
Microturbines Fuels are typically gas but liquid systems are being
developed Size range is limited because technology is still being
developed. 30 kW, 60 kW, 70 kW and 250 kW systems are available
Electrical efficiency is low but emission levels are tt tiattractive
Fuel Cells Fuel cells use a chemical reaction rather than a
combustion process. They require hydrogen as a fuel source.
Fuel processors extract hydrogen from other fuels Emission levels are excellent because of non combustion
reaction Technology is still developmental and very (very)
expensive Fuel processor, maintenance costs, and fuel cell stack
life are current concerns
Section T - 42
PERFORMANCE COMPARISONSTechnology Size Range
(kW)Installed Cost
($/kW)(2)
Heat Rate(kJ/kWh)
Approx.Efficiency
(%)
VariableO&M
($/kWh)
Emissions (1)(kg/kWh)/2.2
NOx CO2
Diesel Engine 1-10,000 350-800 7,800 45 0.025 0.017 1.7
Natural Gas Engine 1-5,000 450-1,100 9,700 35 0.025 0.0059 0.97
Natural Gas Engine w/CHP (3) 1-5,000 575-1,225 9,700 35 0.027 0.0059 0.97
Dual-Fuel Engine 1-10,000 625-1,000 9,200 37 0.023 0.01 1.2
Microturbine 15-60 950-1,700 12,200 28 0.014 0.00049 1.19
Microturbine w/CHP (3) 15-60 1,100-1,850 12,200 28 0.014 0.00049 1.19
Combustion Turbine 300-10,000 550-1,700 11,000 31 0.024 0.0012 1.15
Combustion Turbine w/CHP (3) 300-10,000 700-2,100 11,000 31 0.024 0.0012 1.15
Fuel Cell 100-250 5,500++ 6,850 50 0.01-0.05 0.000015 0.85
Photovoltaic 0.01-8 8,000-13,000 -- N/A 0.002 0.0 0.0
Wind Turbine 0.2-5,000 1,000-3,000 -- N/A 0.010 0.0 0.0
Battery 1-1,000 1,100-1,300 -- 70 0.010 (4) (4)
Flywheel 2-1,600 400 -- 70 0.004 (4) (4)
SMES 750-5,000 600 -- 70 0.02 (4) (4)
Hybrid System 1-10,000 (6) (5) (5) (5) (5) (5)
(1) Nationwide utility averages for emissions from generating plants are 0.00176 kg/kWh of NOx and 0.6 kg/kWh of CO2.(2) The high end of the range indicates costs with NOx controls for the most severe emissions limits (internal combustion technologies only).(3) Although the electric conversion efficiency of the prime mover does not change much, CHP significantly improves the fuel utilization efficiency of a DER
system.(4) Storage devices have virtually no emissions at the point of use. However, the emissions associated with the production of the stored energy will be those
from the generation source.(5) Same as generation technology selected.(6) Add cost of component technologies.
Section T - 43
SOURCE; DOE-FEMP. Reference 10
COMPARISON OF DG TECHNOLOGIESComparison Factor
Diesel Engine
Gas Engine Simple Cycle Gas Turbine
Microturbine Fuel Cell Photovoltaic
Product Availability
Commercial Commercial Commercial 2000 1996-2010 Commercial
Size Range (kW/unit)
20 to 10,000+
50 to 5,000+ 1,000 to 30,000
20 to 200 50 to 1000+ 1+
Typical DG Range (kW/unit)
200 to 2,000 300 to 3,000 1,000 to 10,000
20 to 100 50 to 200 1 to 5
Efficiency (HHV)
36 to 43% 28 to 42% 21 to 40% 25 to 30% 35 to 54% n.a.(HHV)
Genset Package Cost ($/kW)
125 to 300 250 to 600 300 to 600 300 to 600 1,500 to 3,000 n.a.
Turnkey Cost-With no heat recovery ($/kW)
350 to 500 600 to 1,000 650 to 900 650 to 900 1,900 to 3,500 5,000 to 10,000
Heat Recovery Added Cost ($/kW)
100 to 200 75 to 150 100 to 200 75 to 350 Included n.a.
O&M Cost ($/kWh)
0015 to 0.010
0.007 to 0.015 0.003 to 0.008 0.005 to 0.010 0.005 to 0.010 0.001 to 0.004
Section T - 44
Source: Gas Research Institute (2000)

3/29/2012
12
WIND RESOURCE MAP
Section T - 45
MANY MANUFACTURERS
Southwest Windpower
Section T - 46
Southwest Windpower Skystream 2.4 kW
Bergey Excel 10 kW
Aerostar 10 kW
ARE 110 2.5 kW
Entegrity EW50 50 kW
Source: http://www.awea.org/smallwind/smsyslst.html
Section T - 47
Pair of 400 Watt Wind Turbines
3 kW Wind Turbine in Yokohama
400 Watt Hybrid Street Lamp in Hiroshima
Section T - 48

3/29/2012
13
3 KW BASIC ONE LINE DRAWING
Section T - 49
REC Meter
SOLAR RESOURCE MAPS
Section T - 50
Source: http://www.nrel.gov/gis/maps.html
SOLAR RESOURCE MAP
Section T - 51 Section T - 52

3/29/2012
14
Section T - 53 Section T - 54
BIOMASS RESOURCE MAP
Section T - 55
NET METERING
In general, the utility bills you for the “net” energy consumed.
This means that excess electricity generated is valued at the retail price, provided you are a net consumer of electricity (not a net
Section T - 56
generator).Any excess energy you generate goes into the
electric grid and creates a “credit” for future energy consumed.
“Net” may be defined as a billing period (monthly) or annually, depending on the utility.

3/29/2012
15
NH: 100MA: 60/1,000/2,000*RI: 1,650/2,250/3,500*CT: 2,000*
DSIRE: www.dsireusa.org January 2009
100100
1,000
4020
2,0001,000
25OH: no limit500
VT: 250
NY: 25/500/2,000*PA: 50/3,000/5,000*NJ: 2,000*DE: 25/500/2,000*
30
10
10050 * *
**
**
*
**
25
100
25/2,000
* 25/100
40*
*
25/2,000 co-ops, munis:
25
*20
NET METERING POLICIES
State-wide net metering for certain utility types only (e.g., investor-owned utilities)
Net metering offered voluntarily by one or more individual utilities
Net metering is available in
43 states + D.C.
100
80,000
,
50
10010/100
LA: 25/300
25/300
MD: 2,000DC: 1,000VA: 10/500*NC: 20/100*
30
State-wide net metering for all utility types
*
*
Note: Numbers indicate individual system size limit in kilowatts (kW). Some states’ limits vary by customer type, technology and/or system application; this is the case when multiple numbers appear for one state. Other limits may also apply. For complete details, see www.dsireusa.org.
*
FL: 2,000*
*
(KIUC: 50)
10/25
20/100AZ: no limit
*
Image courtesy of North Caroline University, North Carolina Solar Center
Section T - 57
GREEN POWER
Green power/green energy typically refers to: On-site renewable energy generation Buying green energy from the utility generated from
renewable energy generation Buying renewable energy certificates (RECs)
Section T - 58
Remember, not limited to electricity. Landfill gas, biomass, bio-diesel and other sources may be considered green energy.
END OF SECTION T
Section T - 59