6 13 12 17 9 10 14 7 2 3 4 16 8 11 5 151 18. paf101 paf 101 “if you don’t measure results, you...
TRANSCRIPT

6
13
12 17
9
10
14
72
3
4
16
8 11
5
151
18

PAFPAF 101101
“If you don’t measure results, you can’t tell success from failure.”
~ David Osborne & Ted Gaebler
Module 4, Lecture 2

Agenda
AnnouncementsOverview of Benchmarking Speaker from the real world

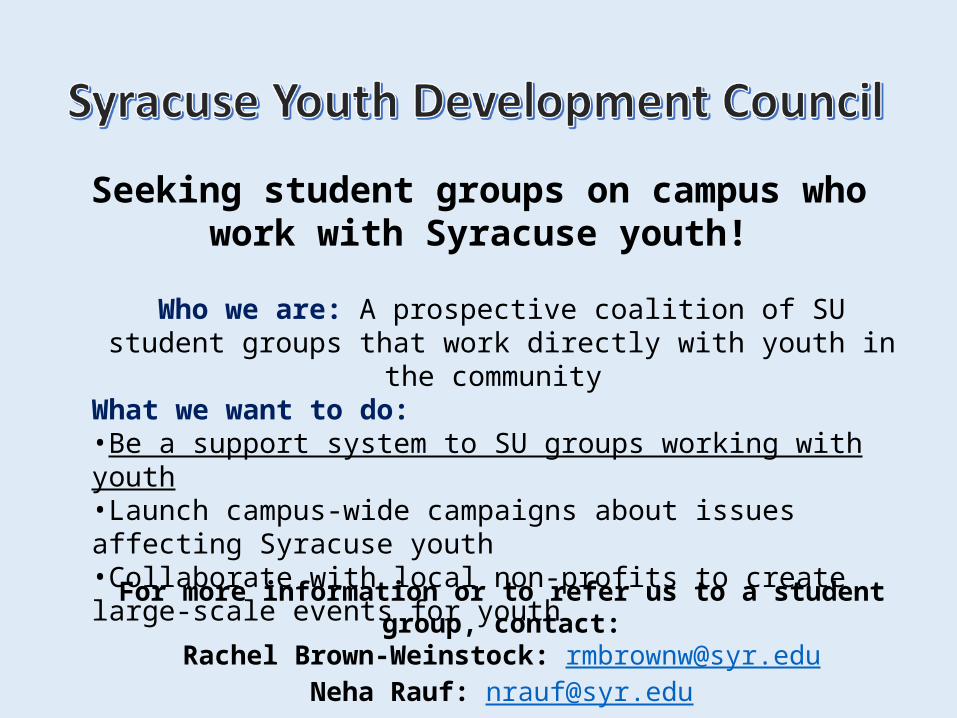
Who we are: A prospective coalition of SU student groups that work directly with youth in the community
What we want to do:•Be a support system to SU groups working with youth•Launch campus-wide campaigns about issues affecting Syracuse youth•Collaborate with local non-profits to create large-scale events for youth
Seeking student groups on campus who work with Syracuse youth!
For more information or to refer us to a student group, contact:Rachel Brown-Weinstock: [email protected]
Neha Rauf: [email protected]
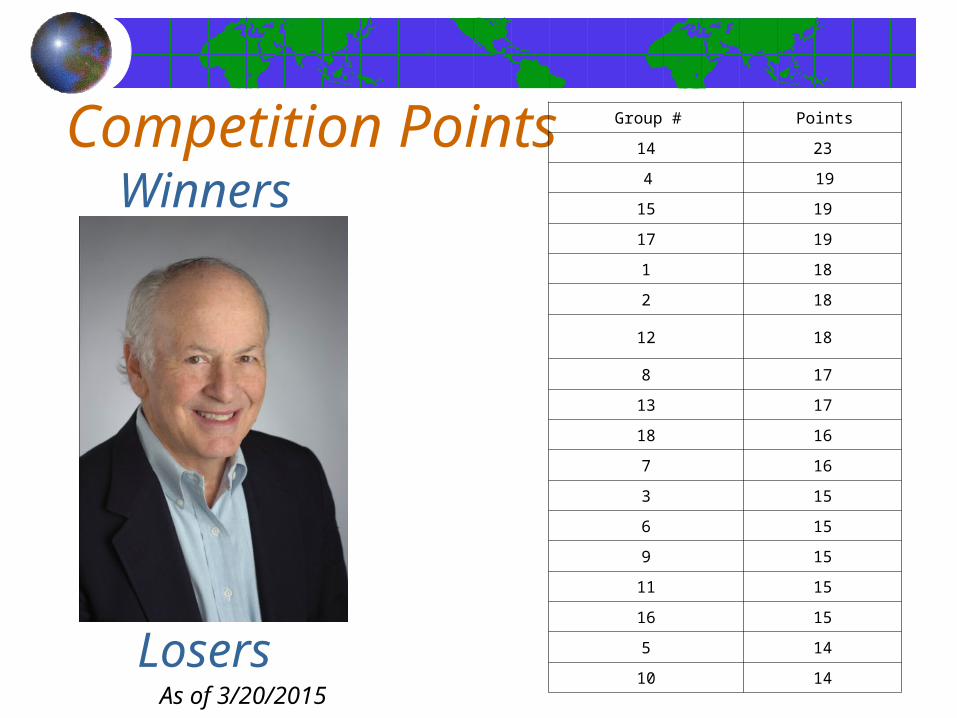
Competition Points
As of 3/20/2015
WinnersWinners
Group # Points
14 23
4 19
15 19
17 19
1 18
2 18
12 18
8 17
13 17
18 16
7 16
3 15
6 15
9 15
11 15
16 15
5 14
10 14Losers

Course Calendar3/20 Fri Benchmarking
3/23 Mon Speaker – Renee Captor
3/25 Wed Speaker – Marissa Mims
3/27 Fri Module 4 Competition Bring Ex. 8.2 On Class Topic
3/30 Mon Competition Debriefing
4/1 Wed Competition Debriefing 2
4/3 Fri Module 4 Due, Introduction to Module 5
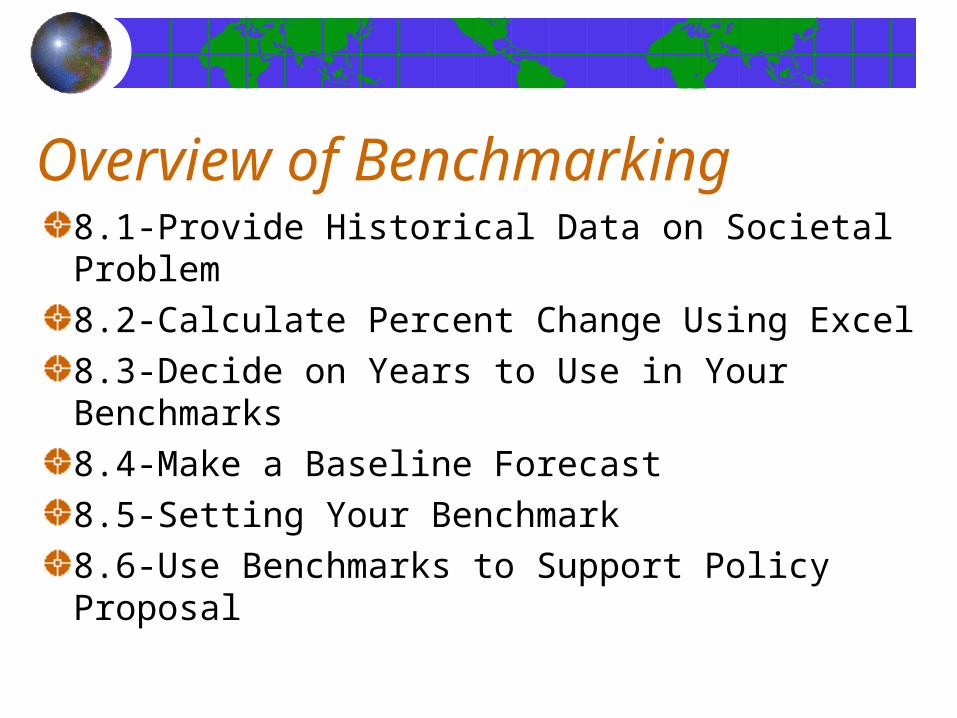
Overview of Benchmarking8.1-Provide Historical Data on Societal Problem8.2-Calculate Percent Change Using Excel8.3-Decide on Years to Use in Your Benchmarks8.4-Make a Baseline Forecast8.5-Setting Your Benchmark8.6-Use Benchmarks to Support Policy Proposal
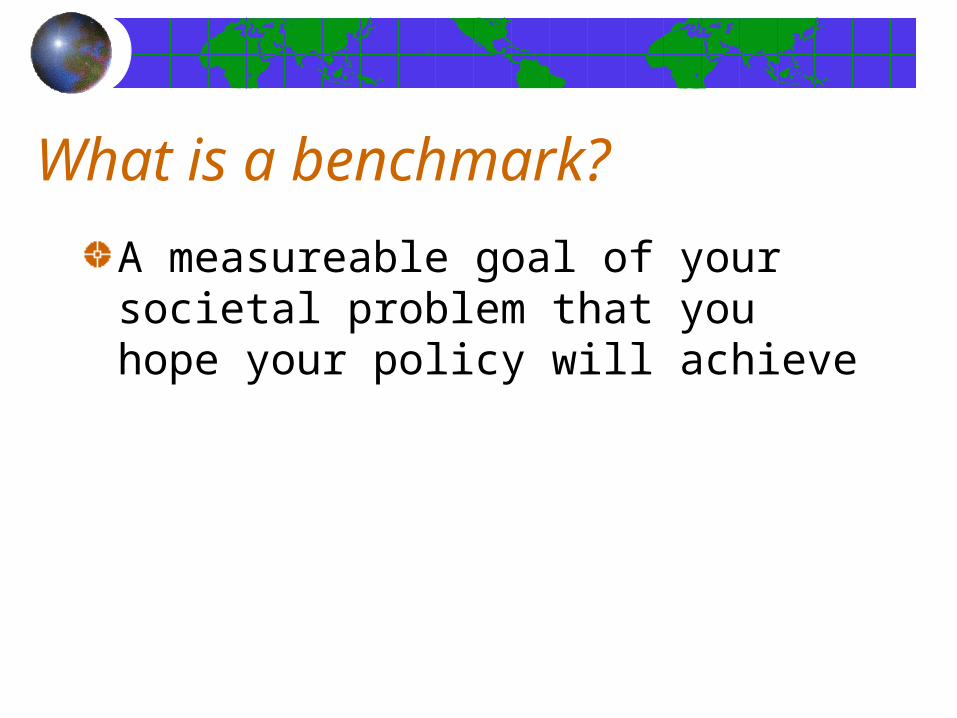
What is a benchmark?
A measureable goal of your societal problem that you hope your policy will achieve
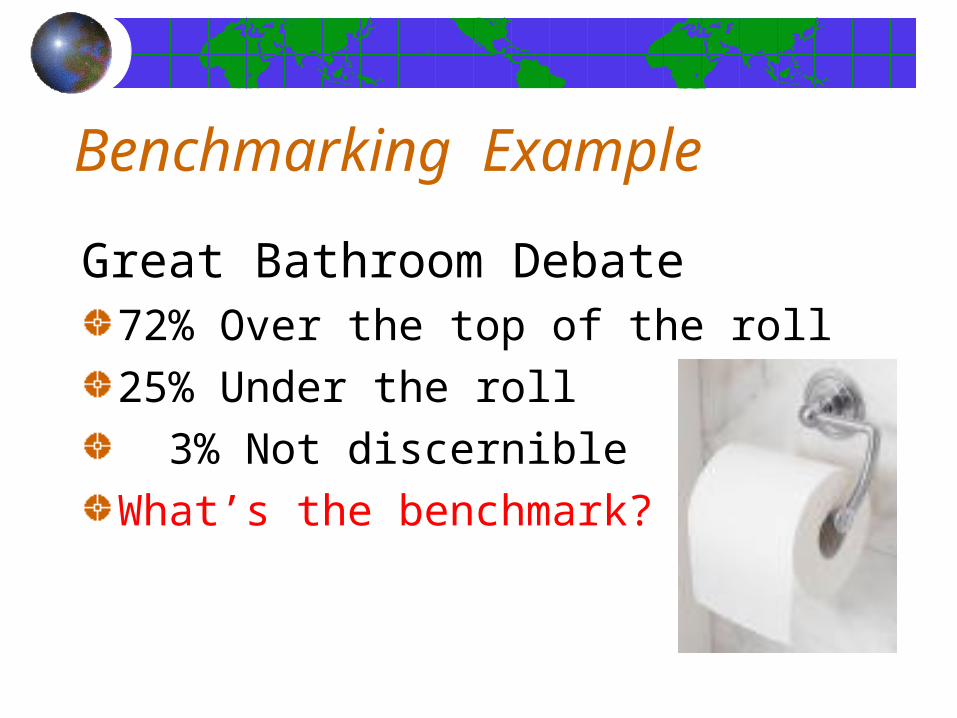
Benchmarking Example
Great Bathroom Debate72% Over the top of the roll25% Under the roll 3% Not discernible What’s the benchmark?

What to Benchmark
The policy you indicated in Exercise 7.1A measurable goal for the societal problem you policy seeks to improve.

Ex. 8.1: Historical DataOne piece of real data at a minimumProvide source for real data and rationale for estimatesPrint out data source and circle the number Refer to Figure 8.1 on pg. 88 in the Maxwell Manual
4 Years ending in most recent calendar year
Where Have You Already Done This?

Academic Years ExampleEnough of this academic year has passed to estimate for the rest of it.The last piece of historical data should be 2013-2014e
School Year First Year Drop Out Rate
2010-2011 7.6%
2011-2012 8.3%
2012-2013 9.9%
2013-2014e 9.1%
Source: Office of Institutional Research & Assessment

Halls at Citrus University, per 1,000 students, 2010-2013.Time
PeriodNumber of Larcenies Source or Rationale
2010 136Citrus Univ. Security Dept. Annual Report, 2010
2011 123Citrus Univ. Security Dept. Annual Report, 2011
2012 142Citrus Univ. Security Dept. Annual Report, 2012
2013e 126Between January and June 2013, 63 larcenies were reported. The estimate was made for all of 2013 by doubling that number because about the same number of larcenies occur each sixth month period.

8.2 Do Percent Change for the following Years:
1. Between the 1st and 2nd year2. Between the 2nd and 3rd year3. Between the 3rd and 4th year4. Between the 1st and 4th year
Years don’t have to be consecutive but must have same intervals between them
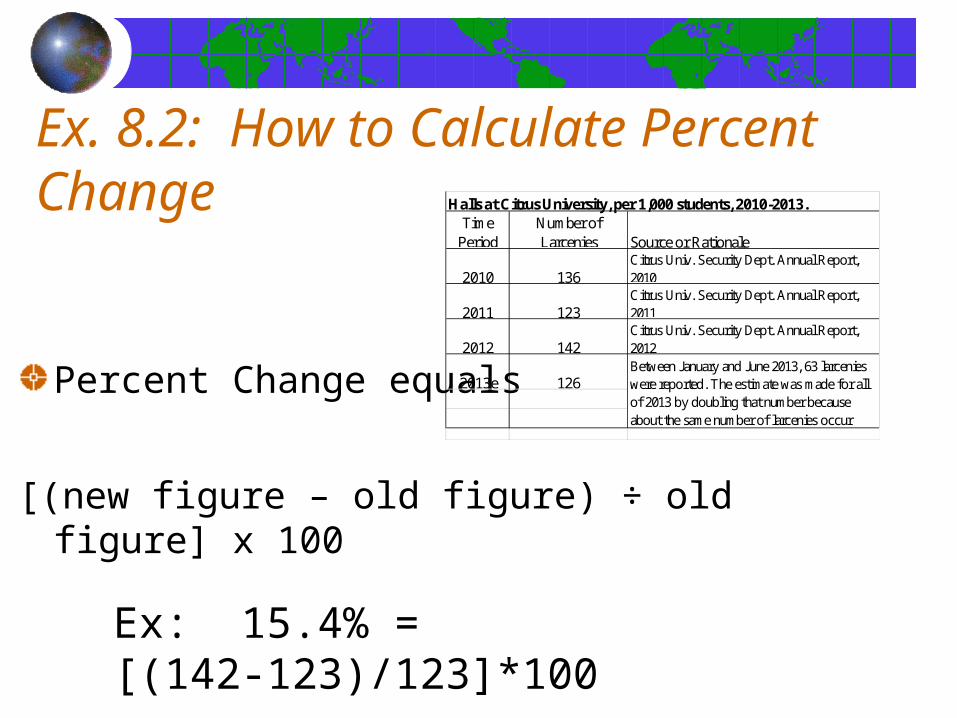
Ex. 8.2: How to Calculate Percent Change
Percent Change equals
[(new figure – old figure) ÷ old figure] x 100
Ex: 15.4% = [(142-123)/123]*100
Halls at Citrus University, per 1,000 students, 2010-2013.Time
PeriodNumber of Larcenies Source or Rationale
2010 136Citrus Univ. Security Dept. Annual Report, 2010
2011 123Citrus Univ. Security Dept. Annual Report, 2011
2012 142Citrus Univ. Security Dept. Annual Report, 2012
2013e 126Between January and June 2013, 63 larcenies were reported. The estimate was made for all of 2013 by doubling that number because about the same number of larcenies occur each sixth month period.

Without Excel between years 1 and 2 (8.2A)With Excel for the chart (8.2B)
Here is what the print out will look like if you do it correctly:
Time Period Number of Larcenies per
1,000 StudentsPercentage Change
2010 1362011 123 -9.6%2012 142 15.4%
2013e 126 -11.3%
Compare 2010 to 2013e -7.4%Source: Citrus Univ. Security Dept. Annual Report, 2010-2012
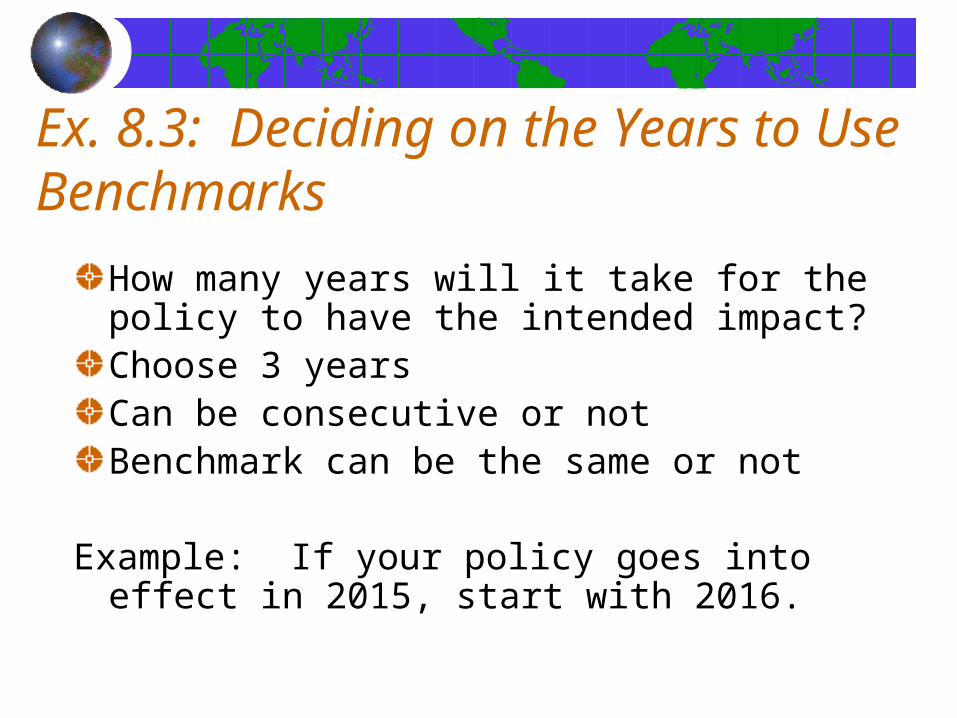
Ex. 8.3: Deciding on the Years to Use Benchmarks
How many years will it take for the policy to have the intended impact?Choose 3 yearsCan be consecutive or notBenchmark can be the same or not
Example: If your policy goes into effect in 2015, start with 2016.
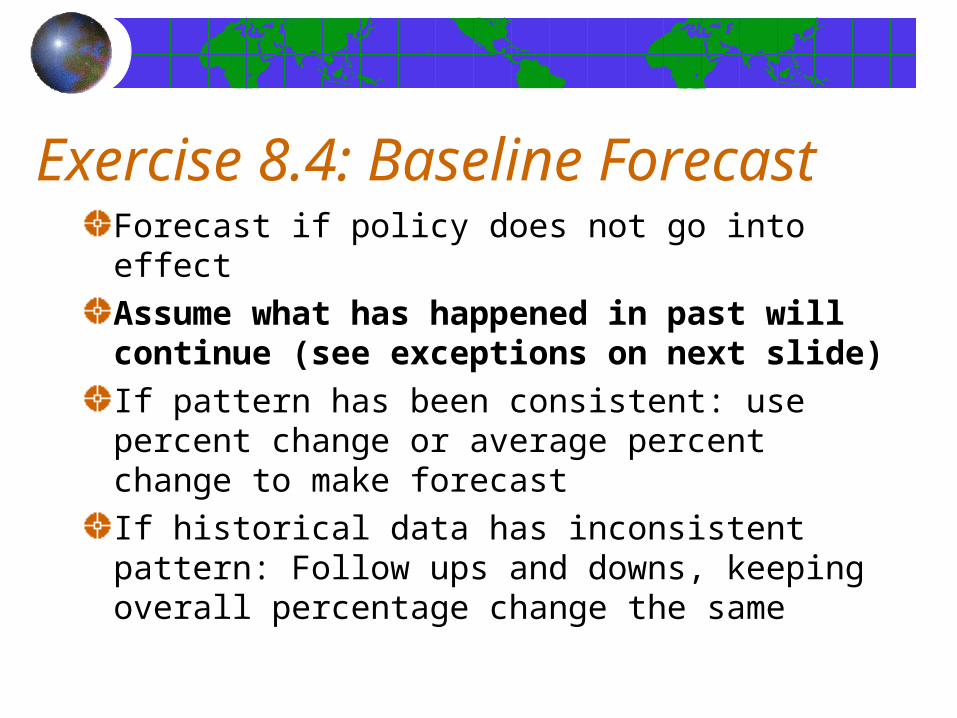
Exercise 8.4: Baseline ForecastForecast if policy does not go into effectAssume what has happened in past will continue (see exceptions on next slide)If pattern has been consistent: use percent change or average percent change to make forecastIf historical data has inconsistent pattern: Follow ups and downs, keeping overall percentage change the same

Exercise 8.4: Baseline Forecast Cont’dConsider conditions that will change the trend
Major outside event (ex: economic growth)Trend approaching outer limitDemographic factorsCyclical pattern
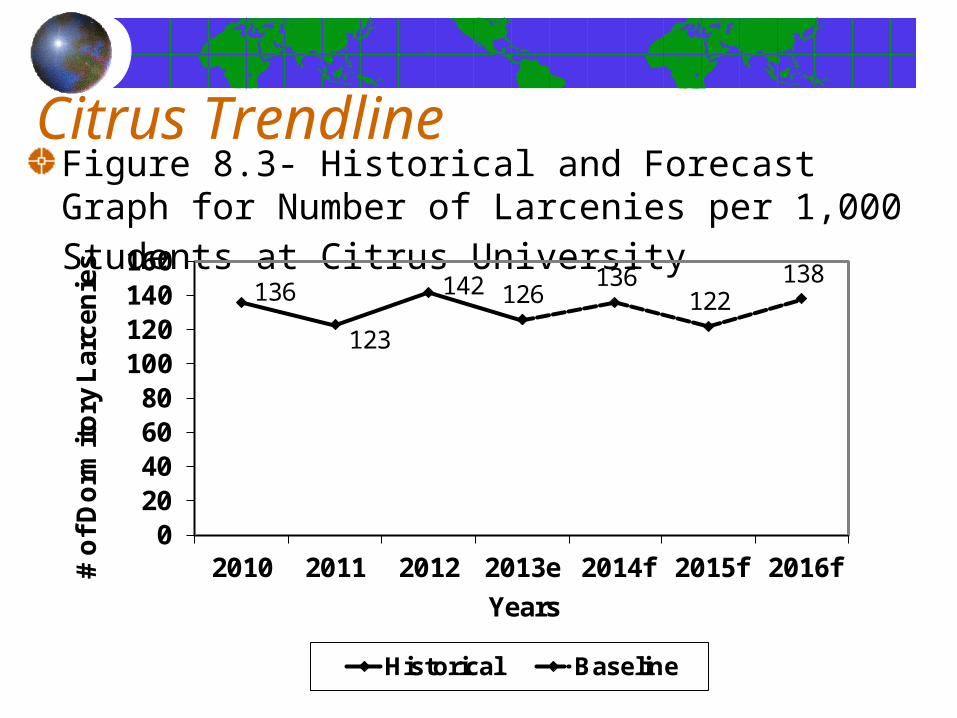
Citrus Trendline Figure 8.3- Historical and Forecast Graph for Number of Larcenies per 1,000 Students at Citrus University
136
123
142 126136
122138
020406080
100120140160
2010 2011 2012 2013e 2014f 2015f 2016f# o
f D
orm
ito
ry L
arce
nie
s
Years
Historical Baseline

Exercise 8.5: Choosing BenchmarksPay close attention to baseline forecastDecide how powerful factors contributing to problem areEstimate strength of government resources in implementing policyCompare to similar areas with similar policiesUse authoritative sources
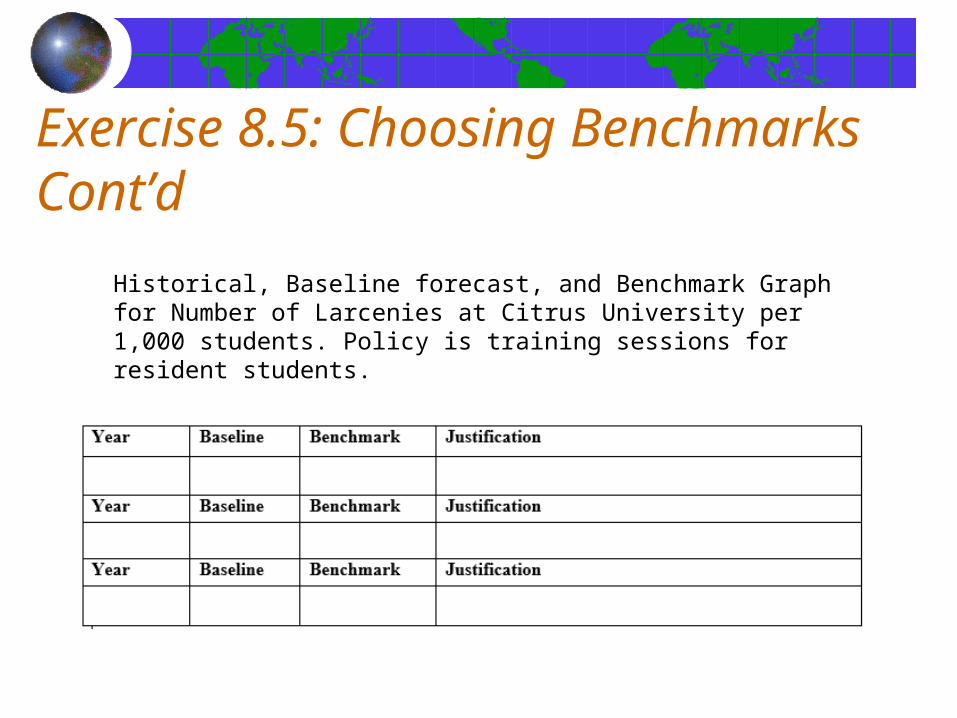
Exercise 8.5: Choosing Benchmarks Cont’d
Historical, Baseline forecast, and Benchmark Graph for Number of Larcenies at Citrus University per 1,000 students. Policy is training sessions for resident students.
Exercise 8.6Using your Benchmark to support your policyPresentations to players should be short and to the pointCreate a graph showing trendline, baseline and policy forecast
The Trend Line GraphFOLLOW INSTRUCTIONS IN CHAPTER 8!!!Graphs in 8.4 and 8.6 – use the corresponding instructions from the Ch. 8 sectionsRead directions carefully + pay attention to detail
= NO POINTS LOST

Trend line/Baseline Graph
136
123
142
126
136
122
138
126 126
120115
100105110115120125130135140145
2010 2011 2012 2013e 2014f 2015f 2016f
# of
Dor
mito
ry L
arce
nies
Years
Historical Baseline Benchmark
Historical, Baseline, and Benchmark Graph for Number of Larcenies at Citrus University per 1,000 Students

Exercise 8.6c
Compare baseline forecast to policy forecast in specific detail
Example: If the policy works, the improvement over the baseline will be x%
BE REALISTIC

4 Next Class
Complete all exercises in Ch. 7 NOW
Because 8 is a bear
Module 4 due 4/3/15