4 exposure and health risks from incineration - who.int · 24 and the community. this should...
TRANSCRIPT

24
and the community. This should include the use of approved incinerator designs that can achieve appropriate combustion conditions (e.g., minimum temperature of 800 C, minimum chimney heights); appropriate siting practices (e.g., away from populated areas or where food is grown); adequate operator training (including both classroom and practical training); appropriate waste segregation, storage, and ash disposal facilities; adequate equipment maintenance; managerial support and supervision; and sufficient budgeting.
4 Exposure and health risks from incineration Section 6.1 presents the conceptual framework of health risk assessment (HRA), as well as some details and citations supporting the approach. Subsequent sections apply this approach to small-scale incinerators.
4.1 Health risk assessment framework The objective of HRA is to estimate effects of incinerator emissions, in this case, air pollutants, on human health, including short-term acute impacts (systemic diseases) and chronic (long-term) impacts (e.g., cancer). The goal generally is to assess the overall risk associated with exposure to emissions, e.g., the ‘risk’ quantified as the probability of harm, the fraction of the population potentially affected, and/or the number of cases of disease.
Historically, health concerns raised by incineration focused on communities living near the incinerator. More recently and rather definitively, the NRC (1999) identified three potentially exposed populations: (1) the local population, which is exposed primarily through inhalation of airborne emissions; (2) workers at the facility, especially those who clean and maintain the pollution control devices; and (3) the larger regional population, who may be remote from any particular incinerator, but who consume food potentially contaminated by one or more incinerators and other combustion sources that release persistent and bioaccumulative pollutants
The analysis will follow the general steps of hazard assessment, toxicity assessment, exposure assessment, and risk characterization, as summarized below. The assessment is screening in nature, as described below.
4.1.1 Hazard assessment In hazard assessment, causative agents are identified and the feasibility of linkages and mechanisms between air pollutants and adverse health effects are demonstrated. Much of this has been completed by the development of lists of priority chemicals, regulations, etc.
4.1.2 Dose-response assessment The dose-response assessment describes the toxicity of the chemicals identified above using models based on human (including clinical and epidemiologic approaches), and animal studies. Dose-response relationships depend on the pollutants:
• Systemic toxicants. Many studies have indicated a threshold or 'no-effect' level, that is, an exposure level where no adverse effects are observed in test populations, as cell mechanisms are able to repair or isolate damaged cells. Some health impacts may be reversible once the chemical insult is removed. In this case, a reference dose or concentration, for use in the risk characterization as a component of the hazard index.
• Carcinogens. Both linear and nonlinear dose-response models are used for carcinogens. With linear models, doubling the exposure doubles the predicted risk. Cancer potencies are typically provided for each exposure pathway or for total intake.

25
• “Conventional” pollutants, e.g., particulate matter and SO2. Dose-response relationships for morbidity and mortality are often derived using epidemiological studies.
High quality peer-reviewed databases should utilized, e.g., US EPA’s Integrated Risk Information System (IRIS), WHO, IARC, etc. It is important to realize that these databases are primarily useful for long-term exposures to toxics.
The dose-response analysis involves a review of the literature to summarize the basis of the dose-response relationship, the nature of studies, health endpoints, the weight of the evidence, uncertainties, extrapolations, and other adjustments used to derive the dose-response relationship. Analyses should emphasize those agents that are judged to cause most of the risks and human health impacts.
4.1.3 Exposure assessment The exposure assessment identifies exposed populations and details the type, level, duration and frequency of exposure. Typically, exposure assessment consists of a number of steps.
• Estimation of ambient air concentrations using air pollution monitors or other predictive air quality models, including analysis of spatial and temporal trends and distributions
• Identification of any special groups that may be at risk due to high exposure (due to proximity, diet, or other factors) or vulnerability (due to preexisting disease or other factors) to the pollutants. Special groups often include children and pregnant women.
• Development of appropriate exposure assumptions, e.g., activity factors (e.g., time spent outdoors), locational factors (mobility), uptake/dosimetry factors (breathing rates, absorption rates, etc.), and other factors that may affect exposure to pollutants for each group.
• Estimation of the numbers of exposed individuals based on demographic and other data.
• Validation of exposure analysis using monitoring or other means.
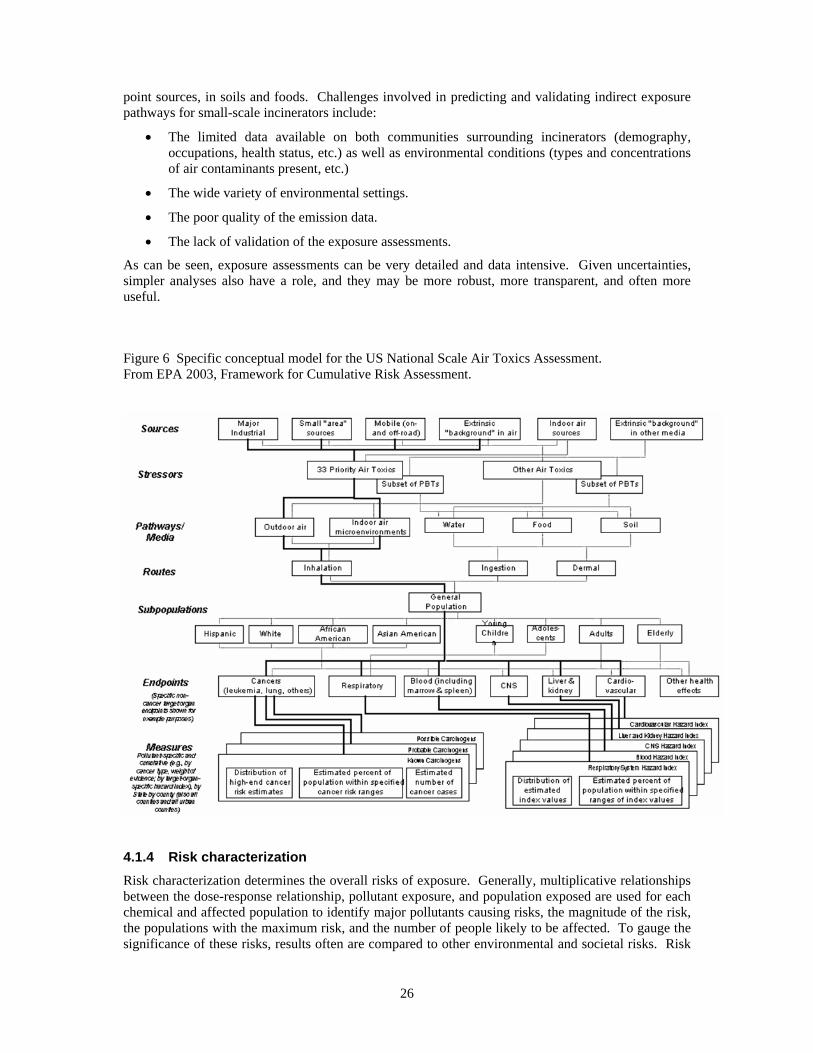
Several exposure ‘pathways’ may pose risks. Figure 6 provides the conceptual framework for the HRA recently used for air toxics in the US. Only the portion in bold in the figure was attempted in this large study. This diagram is useful for orientation purposes as it describes linkages from emission sources to measures of health risk impacts.
The ‘indirect exposure pathways’ for air pollutants may pose significant health risks in certain settings. These pathways may include, for example, consumption of locally produced meat, eggs, and dairy products, consumption of fish from local waterways that are contaminated by air pollutants, and dermal contact with contaminated soils. These pathways are important for persistent pollutants that can bioaccumulate into food, a result of the deposition of toxic emissions onto plants and soil with subsequent ingestion by farm animals, or, in the case of fish contamination, from deposition directly into water bodies or onto soil and runoff into surface waters with subsequent uptake in fish. Indirect exposure pathways can be important for dioxins, furans and other emissions if:
• Food is grown near the incinerator.
• Animals are raised on fields near the incinerator.
• Lakes, ponds, or other surface drinking water sources have a local catchment area.
• Subsistence fishers or farmers in the area obtain most of their food from local sources.
• Children play in dirt subjected to significant atmospheric deposition.
Modeling of indirect exposure pathways involves considerable uncertainty and difficulties for several reasons: (1) The methodology is relatively new, complex, under refinement and peer review; (2) substantial site-specific parameters – that may not be available – are required; and (3) validation efforts using measurements of contaminants along the pathway (e.g., in food, blood, urine, etc.) are tremendously important to ensure model credibility and the significance of air emission sources. Indeed, recent follow-up studies in developed countries have collected and analyzed a sufficient number of samples to characterize trace metals, dioxin/furans, and other pollutants emitted from major
26
point sources, in soils and foods. Challenges involved in predicting and validating indirect exposure pathways for small-scale incinerators include:
• The limited data available on both communities surrounding incinerators (demography, occupations, health status, etc.) as well as environmental conditions (types and concentrations of air contaminants present, etc.)
• The wide variety of environmental settings.
• The poor quality of the emission data.
• The lack of validation of the exposure assessments.
As can be seen, exposure assessments can be very detailed and data intensive. Given uncertainties, simpler analyses also have a role, and they may be more robust, more transparent, and often more useful.
Figure 6 Specific conceptual model for the US National Scale Air Toxics Assessment. From EPA 2003, Framework for Cumulative Risk Assessment.
4.1.4 Risk characterization Risk characterization determines the overall risks of exposure. Generally, multiplicative relationships between the dose-response relationship, pollutant exposure, and population exposed are used for each chemical and affected population to identify major pollutants causing risks, the magnitude of the risk, the populations with the maximum risk, and the number of people likely to be affected. To gauge the significance of these risks, results often are compared to other environmental and societal risks. Risk

27
characterizations provide information that can help to rank and prioritize risks, anticipate future monitoring needs, and evaluate alternative management strategies.
Risk characterization should include an uncertainty analysis that includes: a discussion of alternative exposure characterizations; alternative dose-response characterizations; weight-of-evidence discussions; and evaluation of uncertainties in the exposure assessment.
4.1.5 Uncertainties, variability and data gaps Despite considerable effort and progress in evaluating health risks of incineration in developing countries, there are several critical data limitations and inadequacies, including (NRC 1999, McKone 2000, Snary 2002):
• Limited availability of emissions data for characterizing events other than normal operation. Dioxins and many other organic compounds are products of incomplete combustion (PICs). PICs are minimized under ideal combustion conditions, including appropriate temperature, residence time, and turbulence conditions. Emissions are likely to be much greater under when the incinerator is started, shutdown, charged with waste and fuel, or if an upset occurs. Relatively few stack samples for each pollutant are collected and analyzed. There is virtually no information regarding emissions under upsets or even less than optimal conditions.
• Exclusion of workers and larger regional populations. Workers come into close contact with stack emissions, and they also clean and maintain equipment, remove and dispose of ash, etc. Incinerator operators may have elevated exposures to dioxins, lead and other metals, particulate matter, PAHs, urinary mutagens and other pollutants. While emission restrictions are intended to reduce emissions from the facility, they may not change work conditions and worker exposure.
• Insufficient data for characterizing intermedia transfers of emitted chemicals from ambient air to food webs and indoor environments. These indirect multimedia, multipathway exposures remain poorly characterized, and there is a continuing absence of scientific studies, models, and direct measurements of human contact. Both measured data and models, including the intermedia transfer factors (ITFs) used to predict indirect exposures, have low reliability.
• Inadequate justification for assumptions (e.g., pathways selected) and inadequate peer review. Many simplifying assumptions are required.
All of these concerns apply to small-scale incinerators. Furthermore:
• Actual emissions from small-scale incinerators in-use under field conditions are unknown.
• The ability to achieve and sustain low emissions from small-scale incinerators by best practices at present is unknown but seems unlikely.
• Field data exists for validation and for reducing uncertainties, e.g., dioxin measurements in milk, are largely absent.
4.1.6 Comparative and screening risk assessments Risk assessment can provide a useful contribution to decision-making, policy development, and standard setting. Such assessments can be used to help evaluate preferred options for health-care waste treatment. In this context, it is important to distinguish two applications for risk assessment:
• Comparative assessments in which one or another option is preferred due to presumed lower risks.

28
• Screening assessments in which case estimates of probable to maximum (worst-case) risks are compared to some norm or standard, e.g., acceptable risk level,12 maximum number of individuals affected, 99.99% disinfection rate, etc. As a result:
o Preferred options would fall well below the norm or standard. The logic is that under typical rather than worst-case conditions, risks of preferred options should be even lower. Further analysis may not be warranted.
o Options exceeding the norm or standard should either be eliminated from consideration, or they require further and more refined analysis, e.g., using site-specific conditions, monitoring, etc.
Both comparative and screening assessments should make assumptions well-founded and explicit, use the best available information in models, and discuss, bound and otherwise treat uncertainties. Also, both types of applications should consider relevant technical, social and economic factors, e.g., the presence of acceptable options that might restrict technical options, e.g., immediate elimination of incinerators.
In theory, comparative risk assessments of incineration and other waste treatment options can be credible and useful. Practically, however, this appears difficult or infeasible given the very large uncertainties in attributing health impacts to incinerators. When uncertainty and variability become large, it is difficult to interpret or assign relevance to the estimated magnitude of exposure and health risk (NRC 1999). As a simple example, assume technology A yields a maximum predicted individual lifetime risk of 10-2 and an average population risk of 10-6, while technology B gives individual and population risks of 10-4 and 10-5. Technology A might be preferred as the maximum individual risk is reduced 100-fold, yet technology B might be preferred as the broader risks are reduced 10-fold. Uncertainties in each case might be 100-fold and thus the risk information might have very little relevance to the decision. While contrived, this example is relevant since available risk assessments due to small-scale incinerator emissions are incomplete and uncertain for reasons discussed earlier.
A second issue with comparative assessment deals with comparisons and valuations of different types of impacts. For example, in comparing incinerator and non-burn technologies, different health endpoints must be assessed, e.g., chemical risks (cancer) versus infectious risks (hepatitis). Such situations may require the use of quality-adjusted life years (DALYs) or other such metrics, involving further assumptions and complexity.
Risk assessments used for screening purposes can avoid some of these issues. In this case, major difficulties can surround the selection of a norm (acceptable risk) and reasonable worst-case scenarios. Such assessments also involve variability and uncertainties, similar to comparative applications. However, screening applications do not use the numerical evaluation of risks as the sole or even primary evaluative criterion for decision-making.
The remainder of this section now turns to the specific analysis risks posed by dioxins and furans from small-scale incinerators.
4.2 Hazard identification – dioxins and furans Incinerators produce dioxins (polychlorinated dibenzo-para-dioxins or PCDDs) and furans (polychlorinated dibenzofurans or PCDFs) (drawn in Figure 7) as a result of the combustion of chlorine-containing wastes, e.g., polyvinyl chloride and other plastics (WHO 2001; WHO 1999). Dioxin and furans include a group of chemically similar compounds (75 chlorinated dibenzo-dioxins
12 The notion of acceptable risk level is subjective, context-specific, and based on available, but imperfect information. Some may believe that there is no “safe level” of exposure, e.g., the US EPA cancer risk model does not utilize a threshold effect. Others may believe that the assumptions and uncertainties inherent in risk assessments represent fatal flaws and such assessments should not be used to justify activities that may cause harm (instead of taking a precautionary approach). Pragmatically, risks that are small in comparison to other known risks may be acceptable, but many factors affect individual’s views on this matter.

29
or PCDDs, and 135 chlorinated dibenzo-furans or PCDFs). These chemicals are toxic, persistent (do not readily break down in the environment) and bio-accumulative (able to move up the food chain). In general, exposure to dioxins and furans is mostly due to food intake (WHO 2001, Domingo 2002, Travis et al. 1999).
Human health risks due to dioxin and furan exposure have been reported extensively. Evidence for dioxin and furan toxicity in humans comes from studies of populations that have been exposed to high concentrations occupationally or in industrial accidents. Evidence for chronic low-level exposures in humans is more limited. The International Agency for Research on Cancer classifies 2,3,7,8 tetrachlorinated dioxin as a known human carcinogen based on to strong evidence on animal experiments and enough evidence on human studies (IARC 1997, WHO 1999). Short-term (called acute) exposures may result in skin lesions and altered liver function. Long-term or chronic exposure is linked to impairment of the immune system, the developing nervous system, the endocrine system and reproductive functions. The toxicity of the 17 dioxin/furans congeners that are tetrachlorinated in the 2,3,7 and 8 positions is generally determined by summing weighted concentrations to arrive at a toxic equivalent index, expressed as 2,3,7,8-TCDD equivalents (TEQs).
Figure 7 Molecules of 2,3,7,8-tetrachlorodibenzo-p-dioxin and tetrachlorodibenzofuran. From Wellington Labs, Guelph, Ontario, Canada.
4.2.1 Dose response and exposure evaluation There are several ways to consider dose-response relationships for dioxin/furans. Several are based on endpoints, others are based on relative doses or emissions. Several endpoints have been defined:
• General toxicological effects. WHO has established a tolerable daily intake (TDI) of dioxin/furans of 1 – 4 pg TEQ/kg-day, a provisional tolerable monthly intake (PTMI) for dioxins, furans, and dioxin-like polychlorinated biphenyls of 70 pg/kg of body weight (FAO/WHO, 2001). The PTMI is an estimate of the amount of the chemical dosage from all sources that can be ingested from food or water over a lifetime without appreciable health risk (WHO, 1996). For an adult with a body weight of 70 kg, this is equivalent to 4.9 ng TEQ/month or 59 ng TEQ/year. For a child weighing 15 kg, this is equivalent to 10 ng TEQ/year.
• Carcinogenic effects. US EPA expresses the probability of contracting cancer over a 70 year lifetime using an upper-bound cancer potency factor of 0.001 per pg TEQ/kg/day (EPA 2002). Typical risk benchmark values are 10-6 and 10-4. For an excess lifetime cancer risk of 10-6, the cancer potency factor yields an exposure of 0.001 pg/kg/day or 0.03 ng TEQ/year. For an excess cancer risk of 10-4, the corresponding exposure is 0.1 pg/kg/day or 2.6 ng TEQ/year. (These values are 248 and 2.5 times lower than the WHO guideline.) EPA considers 2,3,7,8-dioxin to be a probable carcinogen.
• Noncancer effects. US EPA derived a range of 10 – 50 ng TEQ/kg body burden as a point of departure for calculating the margin of exposure (MOE), that is, the likelihood that noncancer effects may occur in the human population at environmental exposure levels. A MOE is calculated by dividing the human, or human-equivalent animal, lowest observed adverse effect

30
levels (LOAEL) or no observed adverse effect level (NOAEL) with the human exposure level of interest. MOEs in range of 100 to 1000 are generally considered adequate to rule out the likelihood of significant effects in humans based on sensitive animal responses.13
Background exposures. Exposures from incinerator emissions represent only a portion of an individual’s total exposure. Exposures due to other sources, known as ‘background exposures,’ are especially important for dioxin/furans. For example, estimates for several developed countries show that most exposure comes via the dietary pathway, and only about 1% of total exposure arises from local incinerators (WHO 2001, Domingo 2002, Travis et al. 1999). Unfortunately, background exposures in developing countries are unknown, but they are also likely to be significant. Thus, it should be recognized that in many cases current exposures to dioxin/furans already approach or exceed recommendations, and that exposures from incinerators represent incremental exposures adding to the baseline exposure. This leads to the use of relative intake and relative emissions as indicators for evaluating the impacts of MWI exposures:
• Relative intake rates. Exposure due to MWIs can be compared to the background (current) exposure. Several estimates of background exposure are provided below.
o Spain: Around an incinerator, the estimated dietary exposure was estimated as 43 to 77 ng TEQ/year (117 to 210 pg TEQ/day) (Domingo et al. 2002).
o US: The adult daily exposure to dioxin-like compounds (as of the mid-1990s) averages 65 pg TEQ/day or 24 ng TEQ/year (EPA 2000); the median report in FAO/WHO (2001) is 42 pg TEQ /kg-month or 35 ng TEQ/year (70 kg person assumed). The median exposure to co-planar PCBs is 9 pg TEQ/month or 8 ng TEQ/year (70 kg person assumed) (FAO/WHO 2001).
o Western Europe: The median exposure to dioxin/furan compounds is 33 to 40 pg TEQ/kg-month or 28 to 34 ng TEQ/person (70 kg person assumed). The median exposure to co-planar PCBs is 30 to 47 pg TEQ/month or 25 to 39 ng TEQ/year (70 kg person assumed) (FAO/WHO 2001).
o Germany: Dioxin uptakes (via food) for the 1994-8 period are similar to that in the US. Based on a review by Parzefall (2002), adult intake ranges from 1.6 – 2.6 ng TEQ/kg-day, equivalent to 9 to 14 ng TEQ/year. Adult uptake ranges from 0.5 – 1.5 ng TEQ/kg-day, equivalent to 13 to 38 ng TEQ/year.
• Relative body burden. Increases can be compared to current tissue levels. US EPA estimates that tissue levels of CDD/CDF/PCB for the general adult U.S. is 25 ppt (TEQDFP-WHO98, lipid basis). This category can be viewed as similar to provisional tolerable intake values since the former is derived from 70 pg/kg-month dose intake of PCDDs, PCDFs, and coplanar compounds.
• Relative emissions. Both local and aggregate incinerator emissions can be examined in light of regional and/or global emissions. Continuous efforts to reduce environmental levels of dioxins/furans are required by addressing all sources, especially those indicated in recent inventories.
o Current US emissions, for example, are estimated to be 3 300 TEQ g/yr.
o Incinerators are believed to emit a significant fraction of the global emissions of dioxin and furans. In 1987, for example, medical waste incinerators were estimated to account for nearly 21% of known sources of dioxins and furans emissions in the US
13 The US EPA Science Advisory Board review of the EPA dioxin reassessment indicates that the point of departure for the MOE is based on essentially a 99% confidence level and suggests that EPA harmonize the approach to that used for other chemicals that uses a 90% level. This would have the effect of increasing the point of departure.

31
(UNEP 1999). At the present, the fraction due to incinerators is likely to be considerably lower.
As a result of stricter emission standards for dioxins and furans promulgated in the last 10 years, dioxin and furan emissions have been significantly reduced in several countries (WHO, 1999). In Western European countries, dioxin and furan concentrations in many types of food (including mother’s milk) have decreased sharply (UNEP, 1999). In the US, dioxin and furan intake from foods has also significantly decreased in recent years (EPA 2001). Thus, the use of the indicators suggested above, namely, relative intake rates and relative emissions, should utilize the most recent data.
4.3 Emissions of dioxins/furans from small-scale incinerators This section estimates emissions from small-scale incinerators.
4.3.1 Emissions and dioxin formation Incinerators release dioxin/furans to air via chimney (stack) exhaust and via fugitive releases, e.g., air leaks when charging the incinerator with fuel and/or waste. Dioxin and furans also may be contained in fly ash, in bottom ash and other dusts (though to a smaller extent), and in other waste streams, e.g., water and sludge discharges if a wet scrubber is used to treat exhaust gases. Dioxin/furan releases to air are believed to be the most significant exposure pathway (UNDP 2003). Air releases of dioxins/furans occur in both vapor and particulate phases (including sorbed to fly ash).
In combustion, dioxins/furans are formed by either (1) so-called “de novo” synthesis from dissimilar non-extractable carbon structures, and (2) by precursor formation/reactions via aryl structures derived from incomplete aromatic oxidation or cyclization of hydrocarbon fragments. Generally, formation may take place given the presence of a carbon surface or structure (e.g. fly ash), organic or inorganic chlorine, copper or iron metal ions (serving as catalysts), an oxidizing atmosphere, and, ideally, a temperature range of 250 - 450 C (Huang 1996). Dioxin/furan emissions depend on many factors, including:
• Chemical and physical characteristics of the waste (e.g., organic carbon, chlorine, ammonia, amines, metals, moisture, sulfur, ash contents).
• Process/combustion conditions (e.g., the availability of oxygen, chlorine, other precursors/catalysts, temperature, time, mixing/turbulence, reactor materials).
• Downstream conditions (e.g., temperature, residence time, precursor concentrations, the quantity and specific surface area of flyash).
• Presence and efficiency of air pollution control devices (e.g., wet scrubbing, dry absorption using lime, carbon, etc.)
While the understanding of dioxin/furan formation conditions is incomplete, some statements are generally supported, e.g., formation is roughly proportional to the post-combustion residence time in 200 – 400 C environment (e.g., Stanmore 2000). Even in high temperature incinerators (>800 C), temperatures may not be uniform and dioxins and furans can form in cooler pockets or during start-up or shut-down periods. Dioxin/furan formation is minimized by ensuring that incineration only takes place at temperatures above 800 C (Rossi and Schettler 2000).
4.3.2 Methods to estimate emissions Dioxin/furan and other emissions can be estimated using several methods:
1. Predictive models based on statistical or physical-chemical processes (e.g., Stanmore 2000). The complexity and variability of the processes involved generally require measurements to characterize the performance of any specific incinerator, thus, available data do not allow use of predictive models for small-scale incinerators at this time.
2. Stack gas measurements at specific incinerators. This is the preferred approach, but relative few facilities are tested due to cost and other practical considerations.

32
3. Stack exhaust measurements at comparable incinerators.
4. Emission factors that relate the amount of pollutant emitted in the flue gas to the amount of waste incinerated. Several emission factors for dioxin/furan emissions from incinerators are available, however, their accuracy for small-scale incinerators may be questioned, mainly due to insufficient information about the wastes incinerated waste, e.g., Ferraz et al. (2003) recently has published factors for one incinerator design and 5 waste types. Ideally, separate emission factors would be required for each type of incinerator design, waste type, and possibly other factors.
5. Regulatory standards/limits. In risk assessments and other applications, an incinerator may be assumed to be emitting at the regulatory limit. This represents a maximum legal level or sometimes a worst-case scenario. Of course, this is not a worst-case scenario if true emissions exceed the regulatory limit. In cases, the regulatory standards/limits may be useful as they may reflect the emission rates that can be achieved using specific, typical, or best-available controls and practices, depending on the type of regulation.
The accuracy of any these methods will depend on many factors including the representativeness of the units sampled, combustion conditions tested, the variability in waste composition, the number of measurements available, and the performance of the emission testing method. Accuracies will vary by pollutant, e.g., emission estimates for dioxins/furans will be much less reliable than say NOx or CO, in part reflecting capabilities of the measurement technologies. Indeed, EPA (1993) provides quality ratings for emission factors, giving “excellent” to NOx and CO, “above average” (uncontrolled) to “poor” for SO2, and generally “poor” for other pollutants. For dioxins, the UNDP Dioxin toolkit (2003) states estimates are good to an order of magnitude (factor of 10) at best.
It is emphasized that estimates obtained from models, emission factors, and measurements at other sites will provide only preliminary estimates of air emissions, that the differences between measured and estimated emissions can be orders of magnitude, and that it may be difficult to bound uncertainties. Generally, the use of repeated tests on facilities of interest is the best way to determine air emissions from a particular source (EPA 1993).
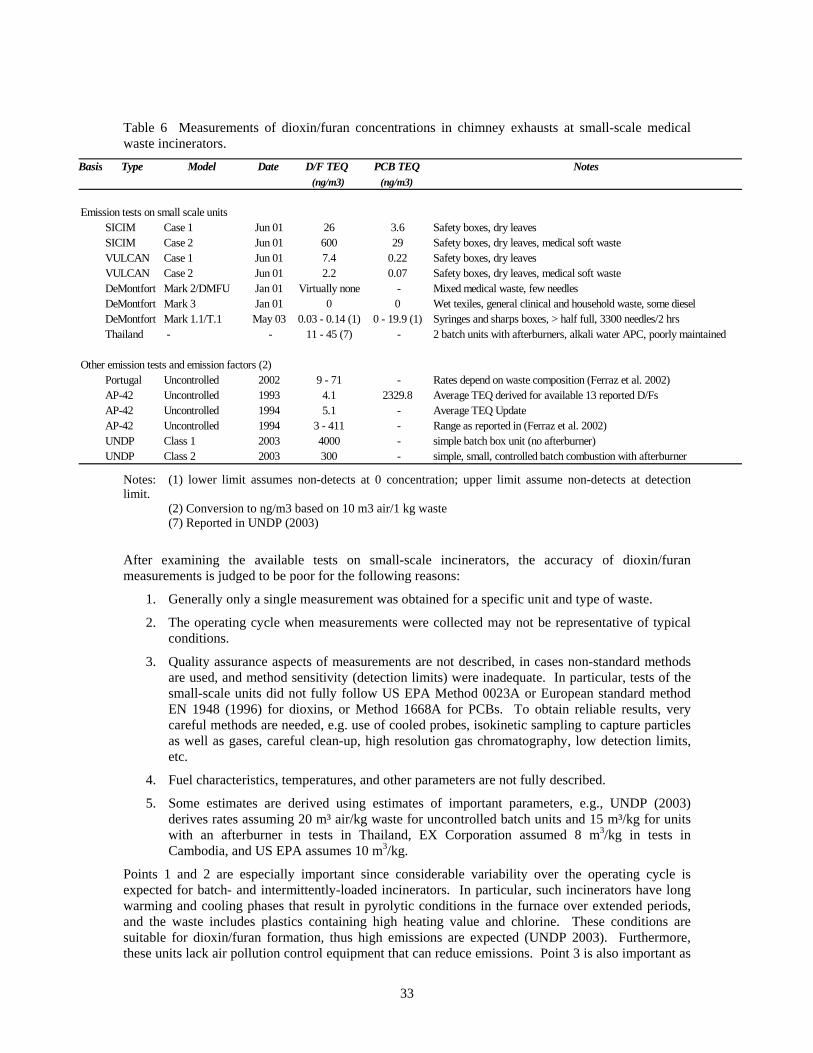
4.3.3 Available estimates of dioxin/furan emissions Table 6 lists measurements or estimates of dioxin/furans concentrations made in small-scale incinerator stacks. Concentrations derived from emission factors (discussed later) are also shown in the table.
Emission estimates range from non-detect to 4000 ng TEQ/Nm3, though the upper end is based on measurements without a secondary combustion chamber (afterburner) tested in Thailand. SICIM and VULCAN incinerators are metal stove-like units that were tested in Cambodia. The highly loaded SICIM Case 2 test produced very high concentrations, possibly due to improper ratio of mixed hospital wastes (including safety boxes as well as plastic packaging, latex gloves, compresses and cotton pads) to complementary fuels (dry leaves and paper) (Oka 2003). Excluding the Thailand test, the highly loaded SICIM unit (Case 2), and the January 2001 test on the De Montfort unit that did not appear to utilize sufficiently sensitive measurement methods, emissions range from 0.14 to 300 ng TEQ/Nm3. Excluding the UNDP estimate, the origin of which is unclear, the AP-42 estimate of 4 to 5 ng TEQ/Nm3 is a central number. In developing these estimates, US EPA used test results at 37 incinerators that were felt to be representative and sufficiently complete. AP-42 excluded poorly maintained or operated incinerators (e.g., poor temperature control, need for repairs). It also excluded facilities with missing data, e.g., if process or waste is not adequately described. Typically, each qualified facility was tested 3 to 10 times.
33
Table 6 Measurements of dioxin/furan concentrations in chimney exhausts at small-scale medical waste incinerators.
Basis Type Model Date D/F TEQ PCB TEQ Notes(ng/m3) (ng/m3)
Emission tests on small scale unitsSICIM Case 1 Jun 01 26 3.6 Safety boxes, dry leavesSICIM Case 2 Jun 01 600 29 Safety boxes, dry leaves, medical soft wasteVULCAN Case 1 Jun 01 7.4 0.22 Safety boxes, dry leavesVULCAN Case 2 Jun 01 2.2 0.07 Safety boxes, dry leaves, medical soft wasteDeMontfort Mark 2/DMFU Jan 01 Virtually none - Mixed medical waste, few needlesDeMontfort Mark 3 Jan 01 0 0 Wet texiles, general clinical and household waste, some dieselDeMontfort Mark 1.1/T.1 May 03 0.03 - 0.14 (1) 0 - 19.9 (1) Syringes and sharps boxes, > half full, 3300 needles/2 hrsThailand - - 11 - 45 (7) - 2 batch units with afterburners, alkali water APC, poorly maintained
Other emission tests and emission factors (2)Portugal Uncontrolled 2002 9 - 71 - Rates depend on waste composition (Ferraz et al. 2002)AP-42 Uncontrolled 1993 4.1 2329.8 Average TEQ derived for available 13 reported D/FsAP-42 Uncontrolled 1994 5.1 - Average TEQ UpdateAP-42 Uncontrolled 1994 3 - 411 - Range as reported in (Ferraz et al. 2002)UNDP Class 1 2003 4000 - simple batch box unit (no afterburner)UNDP Class 2 2003 300 - simple, small, controlled batch combustion with afterburner
Notes: (1) lower limit assumes non-detects at 0 concentration; upper limit assume non-detects at detection limit.
(2) Conversion to ng/m3 based on 10 m3 air/1 kg waste (7) Reported in UNDP (2003)
After examining the available tests on small-scale incinerators, the accuracy of dioxin/furan measurements is judged to be poor for the following reasons:
1. Generally only a single measurement was obtained for a specific unit and type of waste.
2. The operating cycle when measurements were collected may not be representative of typical conditions.
3. Quality assurance aspects of measurements are not described, in cases non-standard methods are used, and method sensitivity (detection limits) were inadequate. In particular, tests of the small-scale units did not fully follow US EPA Method 0023A or European standard method EN 1948 (1996) for dioxins, or Method 1668A for PCBs. To obtain reliable results, very careful methods are needed, e.g. use of cooled probes, isokinetic sampling to capture particles as well as gases, careful clean-up, high resolution gas chromatography, low detection limits, etc.
4. Fuel characteristics, temperatures, and other parameters are not fully described.
5. Some estimates are derived using estimates of important parameters, e.g., UNDP (2003) derives rates assuming 20 m³ air/kg waste for uncontrolled batch units and 15 m³/kg for units with an afterburner in tests in Thailand, EX Corporation assumed 8 m3/kg in tests in Cambodia, and US EPA assumes 10 m3/kg.
Points 1 and 2 are especially important since considerable variability over the operating cycle is expected for batch- and intermittently-loaded incinerators. In particular, such incinerators have long warming and cooling phases that result in pyrolytic conditions in the furnace over extended periods, and the waste includes plastics containing high heating value and chlorine. These conditions are suitable for dioxin/furan formation, thus high emissions are expected (UNDP 2003). Furthermore, these units lack air pollution control equipment that can reduce emissions. Point 3 is also important as

34
the upper (more conservative) estimate of De Montfort unit emissions is nearly completely driven by the method detection limits, rather than positive detection of actual compounds.14
4.3.4 Emission factor estimates Table 7 lists available emission factors relevant to small-scale medical waste incinerators.
• AP42 estimates are from US EPA and were compiled in 1993. These are relevant to incinerators without air pollution control technology. The 12 units tested included batch, intermittent and continuously fed units. The reported emission factor is derived in TEQs using the average emissions reported for 13 (of 17 – not all) dioxin and furan congeners, and thus is somewhat underestimated. These incinerators had afterburners and were considerably larger (up to about 150 kg/waste per hour) than those considered in UNDP Classes 1 and 2. US EPA considers the data quality poor (grade “E”) for the dioxin/furan estimates.
• UNDP Class 1 incinerators are very small and simple, small box type incinerators operated intermittently (in which a load of waste is ignited and left) with no secondary combustion chamber, no temperature controls and no pollution control equipment. As mentioned, UNDP (2003) considers the accuracy of dioxin/furan estimates to be within an order of magnitude.
• UNDP Class 2 “applies to all medical waste incinerators with controlled combustion and equipped with an afterburner, which, however, are still operated in a batch type mode. UNDP (2003) considers the accuracy of dioxin/furan estimates to be within an order of magnitude.
Ferrez (2002) and other have pointed out that emission factors strongly depend on composition of the waste incinerated. This is directly affected by the waste type, classification, segregation practice, and management methodology. Ferrez (2002) suggests that that emission factors not associated to the waste composition may have limited usefulness.
Table 7 Dioxin/furan emission factors relevant to small-scale medical waste incinerators.
Basis Type D/F TEQ Emis Notes(mg/Mg)
AP-42 Uncontrolled 0.04 Based on 12 units, 13 congeners, 1993 documentAP-42 0.25 3.96 1996 update, short residence timeAP-42 0.5 s 0.91 1996 update, short residence timeAP-42 2 s 0.07 1996 updateUNDP Class 1 (5) 40.00 simple batch box unit (no afterburner)UNDP Class 2 (5) 3.00 simple, small, controlled batch combustion with afterburner
4.3.5 Uncertainty and variability in emission factors The estimates in Table 7 do not reflect variability and uncertainty. This is a key problem, especially since so few measurements are available for small-scale incinerators. To understand and estimates the variability, the data underlying the AP-42 estimates were examined and distributions derived for two key emission measurements, 2,3,7,8-TCDD and 2,3,7,8-TCDF. Figures 8 and 9 show the distribution of the measurements used in the AP42 emission factor. A lognormal distribution was fitted to these data using maximum likelihood estimates. 14 The contract document for the 2003 tests of the De Montfort incinerator indicated that “Sampling will be for a continuous period of up to 6 hours and will be undertaken using a method as far as possible in accordance with the requirements of BS EN 1948.” However, test results show high detection limits that render these tests inaccurate.

35
Figure 8 Distribution of emission factor estimates of 2,3,7,8 TCDD at uncontrolled incinerators. Based on 50 measurements from 12 facilities using AP42 data (EPA 1995). Fitted distribution shown as solid line.
0.00
0.05
0.10
0.15
1.0E
-4
1.8E
-4
3.2E
-4
5.6E
-4
1.0E
-3
1.8E
-3
3.2E
-3
5.6E
-3
1.0E
-2
1.8E
-2
3.2E
-2
5.6E
-2
1.0E
-1
1.8E
-1
3.2E
-1
5.6E
-1
Emission Factor (mg/Mg)
Prob
abili
ty
Figure 9 Distribution of emission factor estimates of 2,3,7,8 TCDF at uncontrolled incinerators. Based on 60 measurements from 12 facilities using AP42 data (EPA 1995). Fitted distribution shown as solid line.
0.00
0.05
0.10
0.15
0.20
1.0E
-3
1.8E
-3
3.2E
-3
5.6E
-3
1.0E
-2
1.8E
-2
3.2E
-2
5.6E
-2
1.0E
-1
1.8E
-1
3.2E
-1
5.6E
-1
1.0E
+0
1.8E
+0
3.2E
+0
5.6E
+0Emission Factor (mg/Mg)
Prob
abili
ty
Table 8 summarizes statistics from fitting 2,3,7,8-TCDF and 2,3,7,8-TCDD to individual measurements and to the 12 facilities (the latter based using facility averages). These two compounds did show a reasonable linear relationship (though with considerable scatter). Also, it was determined that the dioxin/furan TEQ emission rate was on average 1.5 times greater than the 2,3,7,8-TCDD concentration. These data allow the determination of a distribution for dioxin/furan TEQ emission rate by the following procedure:
1. Estimate the geometric mean of TEQ emission rate as 1.5 times the geometric mean of the 2,3,7,8-TCDD data from AP-42 measurements. This may be done for individual measurements and for facilities (using the facility average).
2. Estimate the geometric standard deviation of the TEQ emission rate as the average of the geometric standard deviation of the 2,3,7,8-TCDD and 2,3,7,8-TCDF data. The standard deviation derived from the TCDF data are included as this compound is correlated with TCDD, and TCDF are found at higher levels and thus may be measured more accurately. In practice, the geometric standard deviations for TCDF are smaller than those for TCDD, meaning that higher percentile values will be more moderate.

36
3. Account for variability and uncertainty by estimating the TEQ emission rate at an upper percentile, e.g., 90th percentile, using the inverse log-normal distribution, the geometric mean, and the standard deviation from above. Again, this may be done for individual measurements and at the facility level.
Table 8 Statistics from fitting AP42 data for 2,3,7,8-TCDF and 2,3,7,8-TCDD emission factors (kg/Mg) from uncontrolled incinerators to lognormal distributions.
Statistic 2,3,7,8-TCDF 2,3,7,8-TCDD TEQ EstimatesIndividual Facility Individual Facility Individual Facility
Observ. Average Observ. Average Observ. Average
Arith. Mean 0.207 0.129 0.046 0.027 0.069 0.041
Geo. Mean 0.077 0.074 0.011 0.008 0.017 0.012Geo. Std. Dev. 5.450 4.523 8.009 6.085 6.729 5.304
75th percentile 0.242 0.204 0.045 0.026 0.060 0.03690th percentile 0.678 0.509 0.159 0.079 0.191 0.09995th percentile 1.256 0.880 0.339 0.152 0.382 0.18299th percentile 3.988 2.462 1.400 0.520 1.401 0.567
In practice, including the TCDF data and using statistics at the facility level moderates results, e.g., standard deviations are smaller. Still, the AP42 show very large standard deviations, e.g., 90th percentile values are roughly 10 times the geometric mean. It should also be noted that the AP-42 estimate is equivalent to approximately the 75th percentile. This results as the emission data are roughly lognormally distributed, and EPA’s use of the arithmetic mean value gives the highest values (extrema) disproportionate influence, thus inflating the emission factor.
It is suggested that reasonable and useful estimates of emission rates for small-scale incinerators that reflect ‘best practices’ can be estimated from this analysis. Here we utilize the 90th percentile estimate for facility averages, namely, an emission rate of 0.1 kg TEQ/Mg. This is equivalent to a chimney gas concentration of 10 ng TEQ/Nm3, which is within the values measured in small-scale units, though by no means the highest. This is believed to represent a reasonable value for a well-maintained, properly operated, small-scale incinerator. The major concerns affecting the usefulness of this estimate are (1) different waste types; (2) the relatively long start-up and cool-down periods of small-scale units relative to the units in the AP42 database; and (3) differences in temperature and residence times.
4.3.6 Regulatory emission limits Regulatory limits may also be used to approximate emissions. Existing limits were shown in Table 5.
4.3.7 Emission estimates of other pollutants As mentioned, small-scale incinerators will emit other pollutants of concern. Very few of these incinerators have been measured. Uncontrolled incinerators in AP42 are considered to reflect the magnitude of these emissions, and average of emission measurements were shown in Table 5.
4.3.8 Summary of dioxin emission estimates The available data relevant to small-scale incinerators (without air pollution control equipment) appear to fall into three groups:

37
1. Best practices. Properly operated and maintained units utilizing sufficient temperatures, afterburners and other features that limit dioxin/furan production. A reasonably conservative estimate of the emission concentration is taken from the 90th percentile AP-42 emission factor analysis presented earlier, specifically, 10 ng TEQ/Nm3. While conservative for the AP-42 units, however, this value may not be conservative for small brick units like the De Montfort design that have short and variable residence times (see Table 2).
2. Expected practice. Improperly designed, constructed, operated or maintained units that feature afterburners. Emissions from the SIMCIN, Thailand and UNDP Class 2 tests range to 600 ng TEQ/Nm3, though most tests are lower. Using a 500 ng TEQ/Nm3 value may be conservative, however, the available data here are admittedly scarce.
3. Worst-case. Incinerators without an afterburner. UNDP estimates an emission concentration of 4000 ng TEQ/Nm3 for this simple technology.
4.4 Exposure and risk estimates This section derives exposure and risk estimates for small-scale incinerators.
4.4.1 Methods to estimate exposures There are multiple pathways by which humans can be exposed to dioxin emissions. For non-occupationally exposed persons, 16 pathways are considered in EPA risk guidance (Table 9). A number of simplifying assumptions are needed to handle this complexity, and minor or unlikely pathways are often deemphasized. Dispersion modeling or monitoring may be used to estimate concentrations in air and contaminants deposited to soil and plants, simplified hydrologic models account for soil and water movement and erosion, and transfer factors represent uptake among biological media.
• Assessments tend to be site-specific:
o The composition and emission rate of pollutants vary by source.
o Dispersion and accumulation into the environment depends on prevailing meteorology, ground cover, soil erosion rates, and other local environmental factors.
o Land use and activities, specifically, the presence of farms and fishing, dictates the environmental pathways that must be considered.
• Uncertainties in exposure assessments are very high, thus:
o Explicit treatment of uncertainty is strongly recommended.
o Worst-case are used to be conservative.
o Field monitoring program to confirm exposures and other estimates, and to establish local relationships between air emissions, concentrations in soil, foods, etc., are helpful and essential for validation purposes (Lorber et al. 1998; Sandalls et al. 1998).
• The food pathway is likely to dominate exposures, thus:
o Locally produced food must be considered.
o Children will have higher exposures due to different consumption behavior, e.g., more milk.
4.4.2 Previous exposure studies Several studies have examined human exposures and risks from incinerator emissions. Most have looked at municipal or hazardous waste incinerators, which tend to be larger than medical waste incinerators. Few validation studies have been completed. As mentioned earlier, as a result of stricter

38
emission standards for dioxins and furans in the EU and the US, releases of these substances have been significantly reduced in several countries (WHO, 1999), and concentrations in many types of food (including mother’s milk) have decreased sharply (UNEP, 1999).
Domingo (2002) shows effects of decreasing stack gas concentrations emitted from a municipal solid waste incinerator in Montcada, Spain from ~10 ng TEQ/m3 to below 0.1 ng TEQ/m3 (air pollution control devices added included acid gas scrubbing, fabric filtration, and activated carbon) that reduced environmental exposures from 0.051 to 0.012 pg TEQ/kg-day for adults, and from 0.081 to 0.027 pg TEQ/kg-day for children, based on measured soil and plant concentrations measured 500 m from the incinerator, and modeling inhalation, dermal contact, and incidental soil and dust ingestion. Other dietary pathways were excluded as vegetables, grains, fruits, cereals and livestock were not raised in the urban area.

39
Table 9 Pathways of exposure considered in EPA guidance
1. Air Human inhalation
2. Air Soil Human deposition ingestion
3. Air Above-ground Vegetable Human deposition + uptake of vapor phase ingestion
4. Air Soil Root Vegetable Human deposition uptake of pore water ingestion '
5. Air Soil + Above-ground Vegetable Beef Subsistence Farmer
(see above) ingestion ingestion 6. Air Soil + Above-ground Vegetable Milk Subsistence Farmer
(see above) ingestion ingestion 7. Air Waterbody Fish Subsistence Fisher
deposition + runoff + erosion bioaccumulation ingestion 8. Air Soil Human
deposition dermal contact 9. Air Surface Water Human
deposition ingestion 10. Air Soil Surface Water Human
deposition overland flow ingestion 11. Air Surface Water Human
deposition dermal contact 12. Air Soil Surface Water Human
deposition overland flow dermal contact 13. Air Surface Water Cattle (Beef + Milk) Farmer
deposition ingestion ingestion 14. Air Soil Surface Water Cattle (Beef + Milk) Farmer
deposition overland flow ingestion ingestion
15. Air Biological Media Human deposition ingestion
16. Air Mother’s Breast Milk Infant all inhalation, non-inhalation exposures ingestion
Bennett et al. (2002) estimates individual intake fraction or iFi for dioxin (and other compounds). The iFi is defined as that fraction of the emissions taken in by a specific individual over all exposure pathways. Thus, the iFi represents the source-to-dose transfer coefficient that accounts for dispersion, transformations, bioaccumulation, etc. Based on US data including the estimated intake of 63 pg TEQ/day (due to intake from air, vegetable fat, meat, dairy, milk, eggs, poultry, pork, fish and soil), and estimates of dioxin emissions (3 300 g TEQ), iFi = 7 x 10-12. Based on the CalTOX model, iFi = 2.1 x 10⁻¹². It should be noted that these values represent a time and space average over the US, not values that might apply to a highly exposed individual (but see below).
Nouwen et al. (2001) estimated exposures near two large municipal incinerators near Antwerp, Belgium for several scenarios, including one assuming high consumption rates of locally produced foods, e.g., 25% of vegetables, 50% of meat, and 100% of milk. For this scenario, 1980 exposures with high emissions (18.9 g TEQ/yr) were 2.8 and 11.3 pg TEQ/kg-day for adults and children,

40
respectively, most coming from milk and meat ingestion. Due to air pollution controls (lowering emissions to 3.1 g TEQ/yr), 1997 exposures were 0.73 and 2.4 pg TEQ/kg-day for adults and children, respectively. Inhalation accounted for about 1% of adult exposure, and 0.5% of child exposure. Measured soil concentrations did not correspond to predictions. From the total TEQ emissions reported in the paper, the local individual intake fraction iFi was derived, specifically, the adult iFi = 1.0 x 10⁻⁹, and the child iFi = 1.8 x 10⁻⁸ (based on averaging estimates for 1980 and 1997). It should be noted that these values are 150 and 520 times greater than that derived by Bennett et al. (2002), but they apply for an exposed population (within ~3 km of the incinerators).
4.4.3 Dioxin intake and risks for a single incinerator – all exposure pathways Dioxin exposures are derived using estimates of annual emissions and individual intake fractions (iFi), defined earlier as that fraction of the emissions taken in by a specific individual over all exposure pathways. The iFi derived for the Belgium study (Nouwen et al. 2001) is used as a reasonable worst-case since it represents a large fraction of locally grown food in the diet. Reasonable worst-case conditions are justified in a screening application.
It should be recognized that the iFi is pollutant- and site-specific, thus, no single value will be representative of local conditions. This suggests that site-specific modeling is necessary, or at least various representative regimes (e.g., dessert, temperate, subtropical, mountain, plan, etc.,) might be modeled. In the present case, the use of the iFi value derived from the Belgium study raises several issues:
• It is based on a relatively high consumption of meat, egg, dairy, etc., thus intake will be overestimated for populations eating primary grains.
• The relatively wet climate in Belgium increases wet deposition locally, compared to dry climates.
• The moderate stack height and flat land in Belgium will decrease air concentrations, compared to short stacks and hilly or mountainous areas, thus decreasing deposition and dose.
• It represents an average value for an impact area, but not necessarily the most exposed actual person (MEAP).
• It does not account for all pathways, e.g., fish and breast milk consumption are omitted.
Emission estimates are derived for four scenarios utilizing single small-scale incinerators:15
• Low usage – equivalent to 1 hr of incineration per month, 12 kg waste per month, or about 277 syringes per day.
• Medium usage – equivalent to 2 hr of incineration per week, 100 kg waste per month, or about 2308 syringes per day.
• High usage – equivalent to 2 hr of incineration per day, 700 kg waste per month, or about 1346 syringes per day.
• Universal usage of small-scale incinerators – burning 12 000 to 20 000 kg sharps waste from injections in the developing world. (In this scenario, the Bennett et al. (2002) – not the Nouwen et al. (2001) iFi – is used, as explained later.)
The emission estimates are based on 10 m3 air per kg waste16 and three dioxin stack gas TEQ concentrations:
15 The total waste quantity is estimated assuming a De Montfort incinerator operating at capacity, 12 kg/hr. Syringe number estimates assume most waste incinerated is syringes at 100 syringes per kg waste. 16 This flow rate may be underestimated. Some reports in larger scale facilities show flow rates of 15 m3/kg. This would increase TEQ emissions by 50%. Also, operating the De Montfort incinerator at optimal capacity, about 6 kg/hr, would have the effect of doubling burn time, emissions and exposures.

41
• Best practices - 10 ng TEQ/m3 representing a conservative estimate.
• Actual practices - 500 ng TEQ/m3 representing a conservative estimate.
• Worst-case - 4000 ng TEQ/m3 representing for single chamber incinerators.
The total annual doses for children and adults are estimated assuming body weights of 15 and 70 kg, respectively:
Child dose (ng TEQ/yr) = [1.8 x 10⁻⁸ g intake child)/(kg-yr)]/[(g emission)/yr] x [15 kg/child] x [109 ng/g]
Adult dose (ng TEQ/yr) = [1.0 x 10⁻⁹ g intake adult)/(kg-yr)]/[(g emission)/yr] x [70 kg/adult] x [109 ng/g]
The lifetime excess cancer risk is calculated using the US EPA upper bound cancer risk slope factor:
Child risk = [0.001 kg-day/pg] x [child/15 kg] x [year/365 days] x [Child dose ng/yr] x [1000 pg/ng]
Adult risk = [0.001 kg-day/pg] x [child/70 kg] x [year/365 days] x [Adult dose ng/yr] x [1000 pg/ng]
Results are calculated for both children and adults, and compared to the WHO provisional values of acceptable intake in Table 10. In the medium usage scenario, for example, childhood exposures for well to poorly controlled incinerators represent 0.02 to 12% of WHO’s provisional intake value, and lifetime cancer risks from 4 x 10⁻⁷ to 2 x 10⁻⁴. To properly interpret these results, the following should be recognized:
• Predicted exposures and risks portray those experienced by the local community that consumes locally produced food. Within this group, the exposures and risks do not necessarily reflect the maximum expected, but instead reflect an average for individuals living within several km of the incinerator.
• Children are predicted to have higher exposures (doses) than adults, a consequence of different iFi values that reflect differences in diets and exposure patterns.
• The WHO provisional value represents a total intake level that includes all sources of exposure. Further, because the actual current exposures in most countries is unknown, and that current exposures already represent a significant fraction of WHO provisional values (e.g., an average of 24 ng TEQ/year in the US, nearly half of the provisional intake value), a source contributing more than a small fraction (perhaps 1%) of the provisional value may be significant.
• While the selection of a particular quantitative level for “acceptable risks” is context-specific and always involves an arbitrary component, risks to public health from environmental agents that exceed 10-4 to 10-6 are often viewed as unacceptable.17
• Risks due to occupational exposures and contact with ash are not included.
Table 10 Dioxin (TEQ) intakes and risks for an individual incinerator under three usage scenarios and three emission conditions.
17 An acceptable risk level depends on many factors, e.g., the number of people exposed, the nature and consequence of the exposure, ability to taken defensive actions, etc. As examples, the US Clean Air Amendments specify a risk level of 10-6 in regulating air toxics. The US Superfund program uses a 10-4 risk to define an imminent hazard requiring cleanup. Other criteria may be considered, e.g., the probability of an adverse event, the number of people at risk, and the nature of harm.

42
Scen- Burn Burn Stack TEQ Total Dose Ratio to WHO ADI EPA Cancer Riskario Frequency Period Waste TEQ Conc. Air flow Emissions Child Adult Child Adult Child Adult
(times/yr) (hr/burn) (kg/year) (ng/m3) (m3/kg) (g/yr) (ng/yr) (ng/yr) (%) (%) (prob) (prob)
Low usage - equivalent to 1 hour of incineration per month12 1 144 10 10 0.00001 0.0003 0.0000 0.002 0.000 4.7E-8 5.9E-1012 1 144 500 10 0.00072 0.0130 0.0008 0.125 0.002 2.4E-6 2.9E-812 1 144 4000 10 0.00576 0.1038 0.0060 0.998 0.012 1.9E-5 2.4E-7
Medium usage - equivalent to 2 hours of incineration per week50 2 1200 10 10 0.00012 0.0022 0.0001 0.021 0.000 4.0E-7 4.9E-950 2 1200 500 10 0.00600 0.1082 0.0063 1.040 0.013 2.0E-5 2.4E-750 2 1200 4000 10 0.04800 0.8653 0.0501 8.320 0.103 1.6E-4 2.0E-6
High usage - equivalent to 2 hours of incineration per day350 2 8400 10 10 0.00084 0.0151 0.0009 0.146 0.002 2.8E-6 3.4E-8350 2 8400 500 10 0.04200 0.7571 0.0438 7.280 0.090 1.4E-4 1.7E-6350 2 8400 4000 10 0.33600 6.0569 0.3505 58.239 0.723 1.1E-3 1.4E-5
Results in Table 10 are interpreted for the three emission conditions:
• Best practice (10 ng TEQ/m3 emission rate): Incinerator emissions at any usage level represent well below 1% of the WHO provisional intake value for children and adults. Cancer risks do exceed 10-6 risk in the case of high usage.
• Expected practice (500 ng TEQ/m3): Only the low usage scenario keeps the intake to a small fraction of the WHO provisional intake, although again the 10-6 risk level is exceeded.
• Worst-case emissions (4000 ng TEQ/m3): Even under low usage rates, intake and risks may be unacceptable.
4.4.4 Dioxin intake and risks for widespread use of incinerator
This section expands the scenario to consider the use of small-scale incinerators for much of the sharps waste in developing countries, roughly 1.2 billion injections per year producing 12 000 to 20 000 tons of waste per year (discussed earlier in Section 3). This scenario has the advantage of obtaining a more representative estimate of exposure as this scenario relaxes the site-specific assumptions implied using the intake fraction estimated for a single environment. In this case, the adult intake fraction iFi = 7 x 10-12, as taken from Bennett et al. (2002). No comparable child value is available, thus as a preliminary estimate, the child iFi is increased by 17 times, reflecting predictions by Nouwen et al. (2001). While the accuracy of the adult iFi is considered fair, the extrapolation for the child value is less certain. The specific assumptions for this scenario are:
• All sharps resulting from vaccination campaigns are incinerated using small-scale incinerators
• The individual intake fraction derived for adults in the US is relevant to local conditions
• The individual intake fraction for children can be adjusted by factors derived from Nouwen et al. (2001).
• Dioxin emissions occur over the continental scale
Somewhat surprising, exposures and risks resulting from widespread use of incinerators (Table 11) are similar to that obtained for a single unit. Under the best practices case, aggregate incinerator

43
emissions range between 1 and 2 g TEQ/year, and the resulting exposures represent well below 1% of the provision WHO value, though some risks exceed 10-6. Under actual practices to worst-case emissions, between 60 and 800 g TEQ/year are emitted, adult exposures range from 1 to 12% of the WHO provisional value, and risks are in the 10-5 to 10-4 range. Child levels are higher by 17 times. Overall, only with emissions at the lowest level, reflecting best practices, are exposures and risks small.
Table 11 Dioxin (TEQ) intakes and risks for widespread use of incinerators under three emission conditions.
Waste Stack TEQ Total Dose Ratio to WHO ADI EPA Cancer RiskEstimate Waste TEQ Conc. Air flow Emissions Child Adult Child Adult Child Adult
(kg/year) (ng/m3) (m3/kg) (g/yr) (ng/yr) (ng/yr) (%) (%) (prob) (prob)
Lower range1.2E+7 10 10 1 0.145 0.008 0.08 0.02 2.7E-5 3.3E-71.2E+7 500 10 60 7.257 0.420 4.04 0.87 1.3E-3 1.6E-51.2E+7 4000 10 480 58.060 3.360 32.31 6.93 1.1E-2 1.3E-4
Upper range2.0E+7 10 10 2 0.242 0.014 0.13 0.03 4.4E-5 5.5E-72.0E+7 500 10 100 12.096 0.700 6.73 1.44 2.2E-3 2.7E-52.0E+7 4000 10 800 96.766 5.600 53.85 11.55 1.8E-2 2.2E-4
4.4.5 Dioxin intake and risks for a single incinerator from inhalation only Ambient air concentrations are estimated using dispersion modeling, in particular, screening-level models to estimate worst-case concentrations. This purpose of this modeling is to estimate maximum exposures that might occur to workers or others very close to the incinerator, and to assess the effect of stack height on these exposures.
The US EPA Screen3 model, a Gaussian plume model, is used to estimate ambient air concentrations within 5 km of the incinerator. Predictions from the model represent a 1-hour average concentrations at breathing height (2 m), directly downwind. Concentrations are a function of the source parameters (Table 12) and meteorological parameters.
Gaussian plume models have several limitations. First, these models typically are used for downwind distances from 0.1 km to about 100 km. Results outside this distance range require careful interpretation. Second, these models cannot be used to predict dispersion in calms (winds less than 1 m/s). (In most open locations, calms occur no more than roughly 1 – 5% per year.) Third, these models are not applicable to dispersion within forests, in very hilly complex terrain, or elsewhere where the assumption of a generally uniform wind field is not valid.
Key source parameters for modeling a typical De Montfort type incinerator are listed in Table 12. It should be noted that these parameters also will vary among sites, e.g., some facilities may have higher stacks. Also, several parameters will vary over the operating (burn) cycle, e.g., emission rates, stack gas temperatures and exit velocities.
Meteorology is site and time specific. The Screen3 model is used to estimate worst-case concentrations over a range of meteorological scenarios, and in particular, the sensitivity to stability class and stack height.18
18 Generally, to estimate long-term concentrations relevant to chronic exposures, multiple years of hourly site-specific meteorological data are needed to obtain a representative predictions from a simulation model.

44
Table 12 Parameters for dispersion modeling.
Parameters Nominal Value Range Justification Model Screen3 - Simple Gaussian plume model Emission rate 1 g/s (adjusted as needed) Nominal value selected for
convenience Stack/chimney height 4 m 3 – 6 Stack/chimney diameter 0.12 m - Stack/chimney exit temp. 450 C / 723 K 400 – 700 C Stack/chimney exit velocity 4 m/s 2 – 7 m/s Downwind distances > 100 m 10 – 5000 m Results at <100 m are highly
uncertain
Figure 10 shows sensitivity to stack (chimney) height for three stability classes, representing a wide range of meteorological conditions from unstable (sunny, low winds) to neutral (higher winds) to very stable (night, clear skies, low winds). Model results indicate the following:
• Plume rise for the modeled source is negligible (about 1 m). Even this may be overestimated since most small-scale incinerators have a rain shield that horizontally disperses the plume with the effect of reducing plume rise. The rain shield would have the effect of increasing concentrations, but the effect is minor.
• Maximum concentrations are produced at downwind distances from 0 to 800 m, with distances increasing under stable conditions. During the day (neutral and unstable conditions), maximum concentrations are produced within 100 m.
Figure 10 Dispersion model results showing sensitivity to chimney heights from 3 to 6 m and stability classes A, D and F. Left panel shows breathing height concentrations for a 1 g/s emission rate. Right panel shows dilution ratio. Modeled source uses nominal parameters (stack dia = 0.12 m, gas temp = 723 K).
Stability class A (stable, U = 1 m/s)
1
10
100
1000
10000
100000
10 100 1000 10000Distance (m)
Con
cent
ratio
n (u
g/m
3)
3 m4 m5 m6 m
10
100
1000
10000
100000
1000000
10 100 1000 10000Distance (m)
Dilu
tion
Fact
or
3 m4 m5 m6 m
Stability class D (neutral, U = 3 m/s)

45
1
10
100
1000
10000
100000
10 100 1000 10000Distance (m)
Con
cent
ratio
n (u
g/m
3)3 m4 m5 m6 m
10
100
1000
10000
100000
1000000
10 100 1000 10000Distance (m)
Dilu
tion
Fact
or
3 m4 m5 m6 m
Stability class F (stable, U = 1 m/s)
1
10
100
1000
10000
100000
10 100 1000 10000Distance (m)
Con
cent
ratio
n (u
g/m
3)
3 m4 m5 m6 m
10
100
1000
10000
100000
1000000
10 100 1000 10000Distance (m)
Dilu
tion
Fact
or
3 m4 m5 m6 m
• Increasing stack height from 3 to 6 m significantly lowers concentrations by 5 to 13 times during daytime, and the major effect is observed close to the source (relevant for operators). Higher stack heights decrease concentrations at nighttime near the source, but differences at distances over 200 m are negligible.
• Dilution ratios below 1000 occur at distances below 100 m for daytime conditions, regardless of stack height. At night, dilution ratios below 1000 can occur only with the shortest stack height (3 m) and from distances from 200 to 500 m.
• Dilution ratios below 200 occur at distances up to 30 to 50 m for day time conditions for short-stack heights (3 – 4 m).
To couple these results to exposures, a number of simplifying assumptions are made that equate to the maximum exposed individual (MEI), a hypothetical scenario that results in exaggerated exposure:
• Waste is burned under 3 scenarios (low, medium, high usage) and under 3 emission conditions, as discussed earlier.
• The dilution ratio is 1000.
• A person inhales air directly downwind of the incinerator for each hour that it is operating at a rate of 0.32 or 0.83 m3/hr, child and adults, respectively.

46
Results are shown in Table 13. Because the MEI scenario is extreme and unrealistic, the interpretation differs from that used previously. In reality, individuals will not be downwind 100% of the time that the facility is operating. Accounting for the variability of wind directions and the mobility of individuals, a person is not likely to be directly downwind of the incinerator and within the plume more than about 10% of the time.19 This would have the effect of decreasing exposures by 10-fold. With this interpretation, only low and medium usages under the best practices emissions give exposures below 1% of the provision WHO limit.
Table 13 Maximum inhalation exposures to children and adults assuming a dilution ratio of 1000.
Scen- Burn Burn Stack TEQ Inhalation Dose Only Ratio to WHO ADI EPA Cancer Riskario Frequency Period Waste TEQ Conc. Air flow Emissions Child Adult Child Adult Child Adult
(times/yr) (hr/burn) (kg/year) (ng/m3) (m3/kg) (g/yr) (ng/yr) (ng/yr) (%) (%) (prob) (prob)
Low usage - equivalent to 1 hour of incineration per month12 1 144 10 10 0.00001 0.03 0.08 0.3 0.2 5.2E-6 2.9E-612 1 144 500 10 0.00072 1.43 3.75 13.7 7.7 2.6E-4 1.5E-412 1 144 4000 10 0.00576 11.40 30.00 109.6 61.9 2.1E-3 1.2E-3
Medium usage - equivalent to 2 hours of incineration per week50 2 1200 10 10 0.00012 0.24 0.63 2.3 1.3 4.3E-5 2.4E-550 2 1200 500 10 0.00600 11.88 31.25 114.2 64.4 2.2E-3 1.2E-350 2 1200 4000 10 0.04800 95.00 250.00 913.5 515.5 1.7E-2 9.8E-3
High usage - equivalent to 2 hours of incineration per day350 2 8400 10 10 0.00084 1.66 4.38 16.0 9.0 3.0E-4 1.7E-4350 2 8400 500 10 0.04200 83.13 218.75 799.3 451.0 1.5E-2 8.6E-3350 2 8400 4000 10 0.33600 665.00 1750.00 6394.2 3608.2 1.2E-1 6.8E-2
4.5 Uncertainty As highlighted earlier, screening level (and all other types of) risk assessments involve considerable uncertainty. This applies to estimates of needle infection rates from unsterilized sharps, cancer rates due to dioxin exposures, and many other aspects. Still, the technical exercise of estimating exposures and risks is a useful input in decision- and policy-making. Assessments should define the range of technically feasible possibilities, identify major uncertainties, provide reasonable upper and lower bounds, interpret the results, highlight issues and uncertainties, and if necessary, stimulate further work to provide the necessary and appropriate information.
This report used screening analyses for the purpose of examining emissions, exposures and risks associated with dioxin and furans. The screening level analysis utilized a number of conservative assumptions, in part due to large uncertainties and data gaps. In particular, exposure estimates would be improved by:
• Better emission data.
• Information describing current dioxin exposures, both to validate the models as well as to indicate current background exposure levels.
• Analyses in which the most probable exposures and risks are estimated for occupational and local populations, in addition to most exposed populations.
19 In some applications, Screen3 predictions of maximum hourly concentrations are adjusted to maximum 24 hour concentration averages by multiplying by 0.08. While simplified box and other models may be used, simulation modeling using site-specific and hourly meteorology is necessary to obtain long term (annual average) predictions of concentrations and exposures.

47
The analysis excluded a number of issues
• Occupational risks. Although not quantified, incinerator operators may receive the highest exposures and risks of any group exposed to incinerator emissions. At present, this is based on largely anecdotal evidence that indicates potential for excessive exposures, including:
o Surveys indicating that operator training is deficient.
o Improper use of personal protective equipment.
o Exposure to ‘fugitive’ emissions when charging units with waste and fuel.
o Exposure when raking grates and disposing of ash.
• Effects of other pollutants. In particular, incinerator emissions of heavy metals and particulate matter may be sufficiently large to raise health concerns.
• Additional exposure pathways, e.g., maternal breast milk to infant, local fish consumption, etc.
• Secondary impacts resulting from technological choices. For example,
o Incineration may discourage waste segregation and waste reduction efforts.
o Ash and other waste disposal options may become a secondary concern.
o Possible shortages of fuel/firewood in some situations.