3i capital markets seminar · pdf file09.03.2018 · refresher on action business...
TRANSCRIPT

3i Capital Markets SeminarAction
9 March 2018
Agenda
Introduction to Action Simon Borrows
Update on strategic delivery Sander van der Laan
Refresher on Action Business model Sander van der Laan
2017 performance and beyond Sander van der Laan
Financial performance Frederik Lotz
2

Introduction to Action
Simon Borrows
3

3i acquired Action in September 2011
• Acquired from founders in primary buyout for 8.3x EBITDA
• Investment triggered by proactive approach from 3i
• Six months exclusive off market due diligence process
4

1
105127
149170 190
220245
269
321
406
514
655
852
1095
1993 >> 2004 2005 2006 2007 2008 2009 2010 2011 2012 2013 2014 2015 2016 2017
Netherlands Belgium & Luxembourg Germany France Austria Poland
Acceleration of international growth under 3i’s ownership
5
• Transitioned from founders to professional management
• Strengthened the team and built systems and processes
• Accelerated international growth and expanded into seven European markets
• New CEO and CFO appointed in 2015 to lead next phase of development
Milestones 2011-2017
Buyout
Total no. of Action stores
CAPITAL MARKETS SEMINAR

Strong value creation and continued potential
Source: 3i Annual and Half-yearly reports.
(1) Gross cash proceeds over cash invested in euro terms. Valuations of remaining investment are included in the multiple.
• £2,312m carrying value at December 2017
• Valued at 16.0x run-rate EBITDA multiple post liquidity discount
• Action reported EBITDA of €387m in 2017
• 26.5x 3i gross money multiple in euro terms at December 2017, including realisations up to December 2017(1)
• Net proceeds of c.€321m to 3i from theMarch 2018 recap
• March 2018 recap will increase gross realised3i money multiple over cost in euro terms to 8.1x
131 143 173280 299
501573 592
712
902
1,549
1,708
2,009
2,312
59 10113
168187
Sep11
Mar12
Sep12
Mar13
Sep13
Mar14
Sep14
Mar15
Sep15
Mar16
Sep16
Mar17
Sep17
Dec17
Mar18
Carrying valuation Realisations
Action – 3i carrying value, £m
6
c. 287
6

Today’s speakers
7
Sander van der Laan
Chief Executive Officer
Frederik Lotz
Chief Financial Officer
• Joined in October 2015
• 27 years of Consumer & Retail experience
• Various positions at Ahold (1998 – 2015)
– CEO Albert Heijn (2011 – 2015)
– COO Ahold Europe
– General Manager Albert Heijn
– CEO Giant Food Stores (Ahold USA)
– EVP Marketing & Merchandising Albert Heijn
– General Manager Gall & Gall
• Joined in August 2015
• >16 years of CFO experience
• Previous CFO roles:
– CFO Arla Foods 2010 – 2015
– CFO Danfoss 2007 – 2009
– CFO Ferrosan 2002 – 2006
• Held various financial positions at Maersk
• Significant international experience (France, China)

Update on strategic delivery
08/03/20188 CAPITAL MARKETS SEMINAR
Sander van der Laan

9
1New
country
5.3% Like-for-
Like sales growth
243 Stores added
€387Million
Operating EBITDA
2New
distribution centres
CAPITAL MARKETS SEMINAR
Update on strategic delivery: 2017 proved to be another successful year
€3,418 Million
revenue, +28%

Update on strategic delivery
CAPITAL MARKETS SEMINAR10
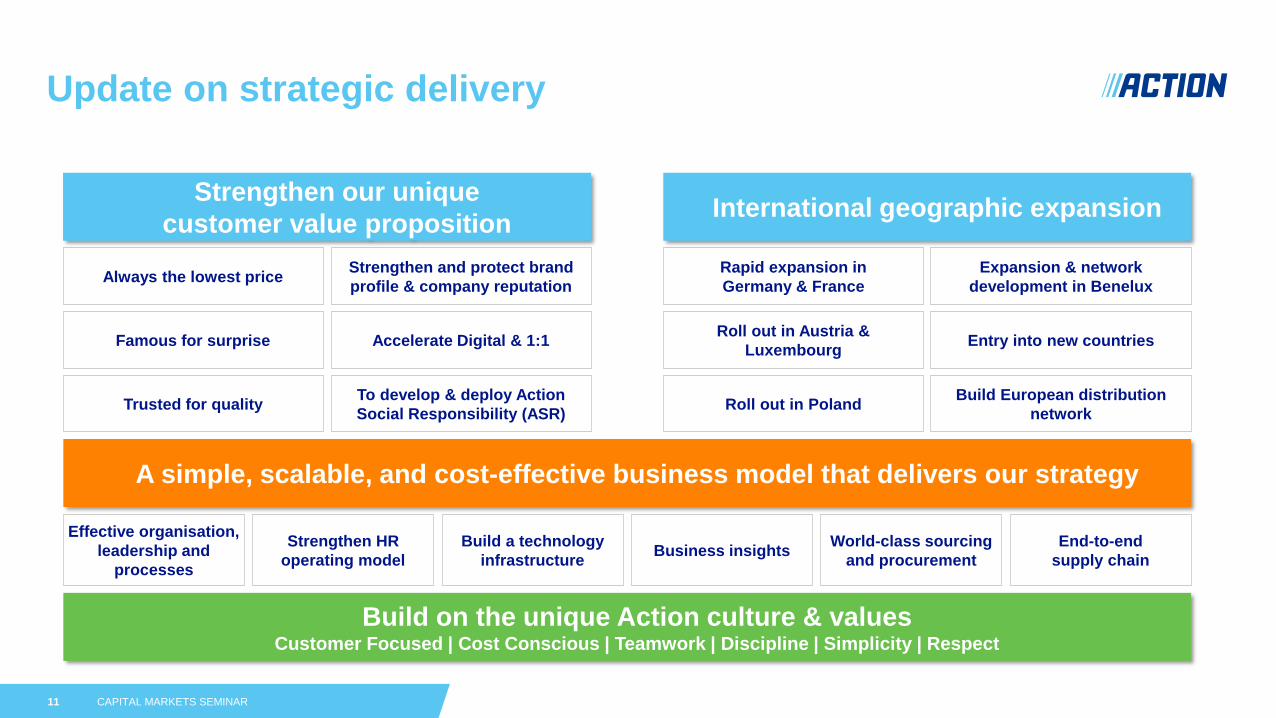
Strengthen our unique
customer value proposition
(International) geographic
expansion
A cost-effective, simple and scalable business model that delivers
our strategy
1 2
Build on the unique Action culture & values
3
4
Update on strategic delivery
CAPITAL MARKETS SEMINAR11
Build on the unique Action culture & valuesCustomer Focused | Cost Conscious | Teamwork | Discipline | Simplicity | Respect
Famous for surprise
Rapid expansion in
Germany & France
Roll out in Austria &
Luxembourg
Strengthen our unique
customer value propositionInternational geographic expansion
A simple, scalable, and cost-effective business model that delivers our strategy
Expansion & network
development in Benelux
Entry into new countries
Always the lowest price
Build European distribution
network
Effective organisation,
leadership and
processes
Strengthen HR
operating model
Build a technology
infrastructureBusiness insights
World-class sourcing
and procurement
Strengthen and protect brand
profile & company reputation
Accelerate Digital & 1:1
To develop & deploy Action
Social Responsibility (ASR)Trusted for quality
End-to-end
supply chain
Roll out in Poland

Update on strategic delivery: significant international growth since the investment by 3i in 2011
CAPITAL MARKETS SEMINAR12
# of stores
367
335
149216
18
6
4
€m Revenue # of stores % NL revenue # of DCs
607 3,418 245 1,095 ~95% ~33% 1 71
1) Including 2 DCs under construction2010 2017

Update on strategic delivery: consistent high growth track record
CAPITAL MARKETS SEMINAR13
387
310
226166
128998671
4939
2017201620152014201320122011201020092008
2,675
1,9951,506
1,155873718607515426
3,418
2017201620152014201320122011201020092008
Strong net sales growth (€m) Strong EBITDA growth (€m)
Rapid store expansion Increasing DC network
514406
655
852
1,095
321269245220190
2011 201720162015201420132012201020092008
3
22
111111
2017201620152014201320122011201020092008
5
7

Refresher on Action Business model
08/03/201814 CAPITAL MARKETS SEMINAR
Sander van der Laan

Price
Unique business model providing sustainable competitive advantage
15
SurpriseOne brand &
one format
Scalable
business
model
PeopleCustomers
CAPITAL MARKETS SEMINAR

• Stores between 700 to 1,100 sqm
• More than 90% of assortment is the same across all countries
• Focus on simplicity enables fast growth
One concept across all countries
1brand
1 store format
1 store
operating
model
CAPITAL MARKETS SEMINAR16
One brand

Unbeatable prices offered to our customers
Unbeatable prices for competition(1)
CAPITAL MARKETS SEMINAR17
Price
(1) GfK Image and Awareness Study December 2017 / Source: Company information
163
100
100
100
100
161
160
154
Action Competitor minimal basket
% of products in different price ranges
€0-1 €1-2 €2-5 €5-10 >€10
Primary offering
2%
7%
25%
30%
35%~
~
~
~
~

Unbeatable prices offered to our customers
CAPITAL MARKETS SEMINAR18
Price
Oral-B Power Electric
Toothbrush
Sesame snaps
Sento Caring Shampoo
Freija cat food
Green Boots green
mould remover
Lifecare pregnancy
test
Panasonic AAA
Batteries

We buy bigvolumes
Low marketingexpenditure
No fixedassortment
Standardised storeprocesses
Efficient logistics
No high streetlocations
Low overheadcosts
Simple businessmodel
Unbeatable price offering based on multiple factors
CAPITAL MARKETS SEMINAR19
Price

Seasonal offers
Surprising assortment essential for our strong customer proposition
2/3 of the assortment is constantly changing
> 150 new articles every week
Weekly specials
CAPITAL MARKETS SEMINAR20
Surprise

(1) GfK Image and Awareness Study December 2017 / Source: Company information
Loyal customer base is spreading the word
CAPITAL MARKETS SEMINAR21
42
22
79
97
70
58
79
97
Total country-wide brand awareness and catchment area brand awareness(1)
Total country Catchment area
Prizes won in 2017 (country wide awards)
Customer
Living
accessories
& gifts
Best price
level
Household
goods
Department
store
Department
storeGiftsGeneral Discount

(1) GfK Image and Awareness Study December 2017 / Source: Company information
(2) % clients that purchased one or more products at Action in the previous six months
Strong brand with a very strong conversion towards buying at Action
CAPITAL MARKETS SEMINAR22
Buying behaviour(2)
Conversion from consideration to purchase
Consideration
Awareness
Conversion from awarenessto consideration
97% 79% 58% 70%
73% 47% 43% 38%
70% 45% 31% 36%
75%
96%
59%
95%
74%
73%
54%
95%
Customer
National Within catchment area

Proposition travels across borders, allowing fast roll-out in several countries simultaneously
23
# of stores across countries
1751
262
132268
303
524593
324
1
12076
117
341
7
220
136
135
354
618
335
216
153
367
Total # of stores
321
406
514
655
852
1,095
201720162015201420132012
Scalable
CAPITAL MARKETS SEMINAR

CAPITAL MARKETS SEMINAR24
Scalable supply chain with 2 new DCs in 2017 and 2 more DCs under construction
DC-A (Zwaagdijk, NL)
DC-B (Echt, NL)
DC-D (Biblis, DE)
DC-C (Moissy, FR)
DC-E (Labastide, FR)DC-F (Belleville, FR)
DC-G (Peine, DE)Under
constructionExisting
New in 2017
Under construction
Scalable
Open Q2
2014
Open Q2
2017
Open Q3
2017
Open Q2
2016Under
construction
Open
2003
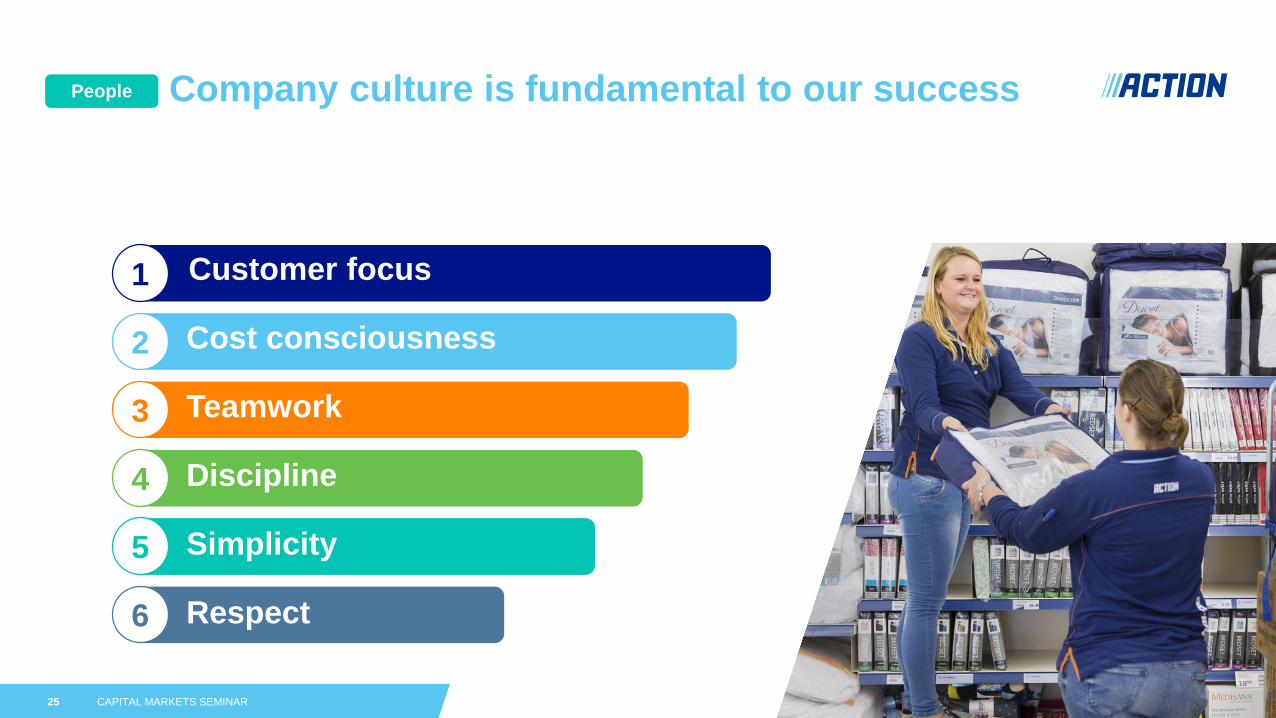
Company culture is fundamental to our success
07/11/201725
Customer focus1
Cost consciousness2
Teamwork3
Discipline4
Simplicity5
6 Respect
CAPITAL MARKETS SEMINAR
People

Experienced management team continues to deliver profitable growth
CAPITAL MARKETS SEMINAR26
Action operating team
CEO
Sander van der Laan
Marketing Director
René Repko
Legal Director
Rob Wesseling
IT Director
Jens Burgers
HR Director
Liz van der Werf
Commercial Director
Hajir Hajji
CFO
Frederik Lotz
Operations Director
Bart Raeymakers
Communications
Director
Yvette Moll
Real Estate Director
Angus Booth
Executive Board members
People
Supply Chain Director
Joost Bous

Significant focus on Action Social Responsibility
CAPITAL MARKETS SEMINAR27

2017 performance and beyond
08/03/201828 CAPITAL MARKETS SEMINAR
Sander van der Laan

Action has an ambition to become a €10 billion company
CAPITAL MARKETS SEMINAR29
3,418
2,675
1,9951,506
1,155873718607515426
20122008 20142013 201720162015 20xx20112009 2010
€10bAction revenue in €m

2017 was another strong year
CAPITAL MARKETS SEMINAR30
• Like-for-Like sales growth
in all countries
• Store openings pace
increasing
• Underlying margins
improving
Underlying performance
remains strong
• Supply chain transition
costs
• Soft performance in
Decoration and Fashion
…but some areas
required attention
• Like-for-Like at 5.3%
• 243 stores added
• EBITDA €387m (EBITDA
margin of 11.3%)
2017 was another strong
year…
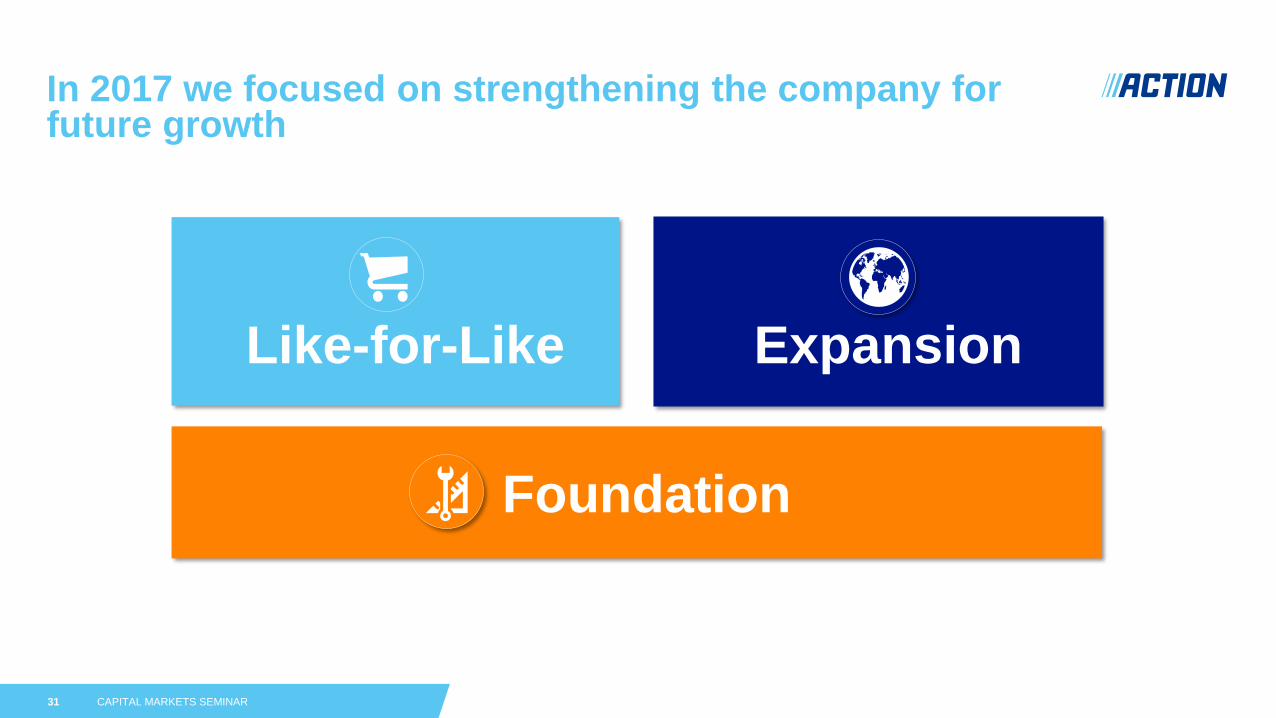
In 2017 we focused on strengthening the company for future growth
CAPITAL MARKETS SEMINAR31
Like-for-Like Expansion
Foundation

32
Marketing Programme
New Category
Sports
Refresh Format
Private Label Programme
Digital Transformation
CAPITAL MARKETS SEMINAR
Strong Like-for-Like sales growth in 2017 to be delivered again in 2018
Drive Like-for-Like all
categories

33 CAPITAL MARKETS SEMINAR
Like-for-Like – continuous development of all 14 categories
• Overall Like-for-Like sales growth of 5.3% in 2017
• Healthy Like-for-Like growth in all markets
• Q4 showed softness in two of our product categories (Fashion & Decoration)
• Within categories, focus on:
→ Price
→ Surprise (newness)
→ Quality
14 categories

34 CAPITAL MARKETS SEMINAR
Like-for-Like – Sports will be introduced as our 14th category
• 14th category within Action assortment, taking over store space from fashion
• In store from March 2018 onwards with 9 meters of racking
• Starting with ~80 SKUs from existing assortment, increasing to ~125 SKUs by the end of 2018
• Assortment to focus on:
→ Sports clothing
→ Fitness equipment
• Own private label named Kaytan to be introduced during 2018
Existing assortment

35 CAPITAL MARKETS SEMINAR
Like-for-Like – steadily expanding our range of private labels
• Over the next years we want to invest significantly in our private
label portfolio
• Private labels are a big opportunity for Action:
→ Stronger Like-for-Like sales growth and margin performance
compared to other non-branded products
→ Improves customers quality perception
• Action has 53 private labels in its assortment, spread across all
categories (17 more private labels compared to 2016)

36 CAPITAL MARKETS SEMINAR
Like-for-Like – pilot started for a refreshed Action format
• Pilot started in 2017 in Haarlem (Netherlands)
• First findings positive:
→ Stimulates Like-for-Like development of stores
→ Enhances customer store experience
→ Brings innovation to the store
• Refreshed format will also be tested in Germany and Belgium
• Successful characteristics of refreshed store format to be incorporated in:
→ Blueprint new stores
→ Blueprint stores to be remodelled

37 CAPITAL MARKETS SEMINAR
Like-for-Like – digital transformation on the move
Since launch of
action.com, the
average number
of visits per day
has increased
significantly
Social media base
grew by almost
400% to 1.2
million followers
Independent fan
groups in FR and
NL counted more
than 350.000
members each
• Customer experience to be strengthened over the coming years through improved digital presence via:
→ Website (www.action.com launched in 2017)
→ Social media
• Action has significantly invested in its digital customer proposition in order to drive traffic and Like-for-Like sales growth, and will continue to do so in the coming years

6 times per year in 3 media
6 times per year in 2 media
38 CAPITAL MARKETS SEMINAR
Like-for-Like – optimising our non-digital marketing spend
2017
48 times per year
2018
New non-digital marketing spend expected to increase store traffic and Like-for-Like growth

39
Opening profileGermany RemodellingPoland
Quality of execution
CAPITAL MARKETS SEMINAR
Continuous acceleration of growth via expansion to new countries and more store openings
France

Expansion - acceleration of store opening pace continued in Germany, with 80 new stores in 2017
CAPITAL MARKETS SEMINAR40
# of stores 2012 - 2017
722
4576
136
216
• Country entered in 2009
• 80 new stores in 2017
• Local headquarter in Düsseldorf
• 1 distribution centre operational in Biblis and 1 distribution centre under construction in Peine
Country statistics
• Population
• Action stores
• Population per store
82.8m
216
383k
17.1m
367
47k

Expansion - growth in France has been significant, with 115 new stores in 2017
CAPITAL MARKETS SEMINAR41
1 1352
120
220
335
• Country entered in December 2012
• 115 new stores in 2017
• Local headquarter in Paris
• Replaced Warehouse Service Provider for Moissy with XPO in 2017
• 2 distribution centres operational in France and 1 distribution centreunder construction in Belleville
# of stores 2012 - 2017 Country statistics
• Population
• Action stores
• Population per store
67.0m
335
200k
17.1m
367
47k

Expansion – successful entry into Poland in 2017
CAPITAL MARKETS SEMINAR42
• Six pilot stores were opened in the South-West of Poland in the fourth quarter
• Action formula appeals to our new Polish customers and we are planning to open more stores in Poland in 2018
• In the process of setting up a local office in Katowice

Expansion - further foundation for expansion
CAPITAL MARKETS SEMINAR43
Opening profileRemodelling Quality of execution
• Step up in number of remodellingswith focus on NL and Belgium
• 2017:
→ 10 store relocations
→ 3 store enlargements
→ 14 store refurbishments
• Continuous improvement in quality of new stores
• Focus on improvement of people, processes and equipment
• Create more equal spread of store openings throughout the year
• Current opening spread skewed towards Q4
Q1 Q2 Q3 Q4
Illustrative

44 CAPITAL MARKETS SEMINAR
Foundation
Sourcing SystemsPeople

Foundation – developing Sourcing and Supply infrastructure to support long-term growth
CAPITAL MARKETS SEMINAR45
• Network of ~1,000 suppliers, of which >400 direct suppliers
• Diversity in sourcing models requires intensification in planning activities
• Additional distribution centres required in the coming years to underpin store openings
A-brands / local
sourcing
Direct Sourcing
Europe
Wholesalers
Far East
Sourcing
Sourcing models (illustrative)

Foundation – growth to be supported by the right Systems & People
CAPITAL MARKETS SEMINAR46
Systems (key focus areas)
People
In-store technology
(Payment terminals,
upgraded POS software,
headsets)
Supply Chain
(Planning, upgraded
Warehouse Management
software)
HR
(Cloud-based system for all
countries)
Digital
(CRM)
Significant leadership upgrades
Further strengthening of country
organisations
Very strong engagement levels
Rapid improvement of employer branding

Store roll out over the years (2013 – 2015 – 2017)
CAPITAL MARKETS SEMINAR47
201720152013

Still significant potential in existing and new countries
48 CAPITAL MARKETS SEMINAR
28217 67
BeLux
12
DE Other EU
38
FRNL PLAU
83 9
% p
en
etr
ati
on
Population in million

Financial performance
08/03/201849 CAPITAL MARKETS SEMINAR
Frederik Lotz
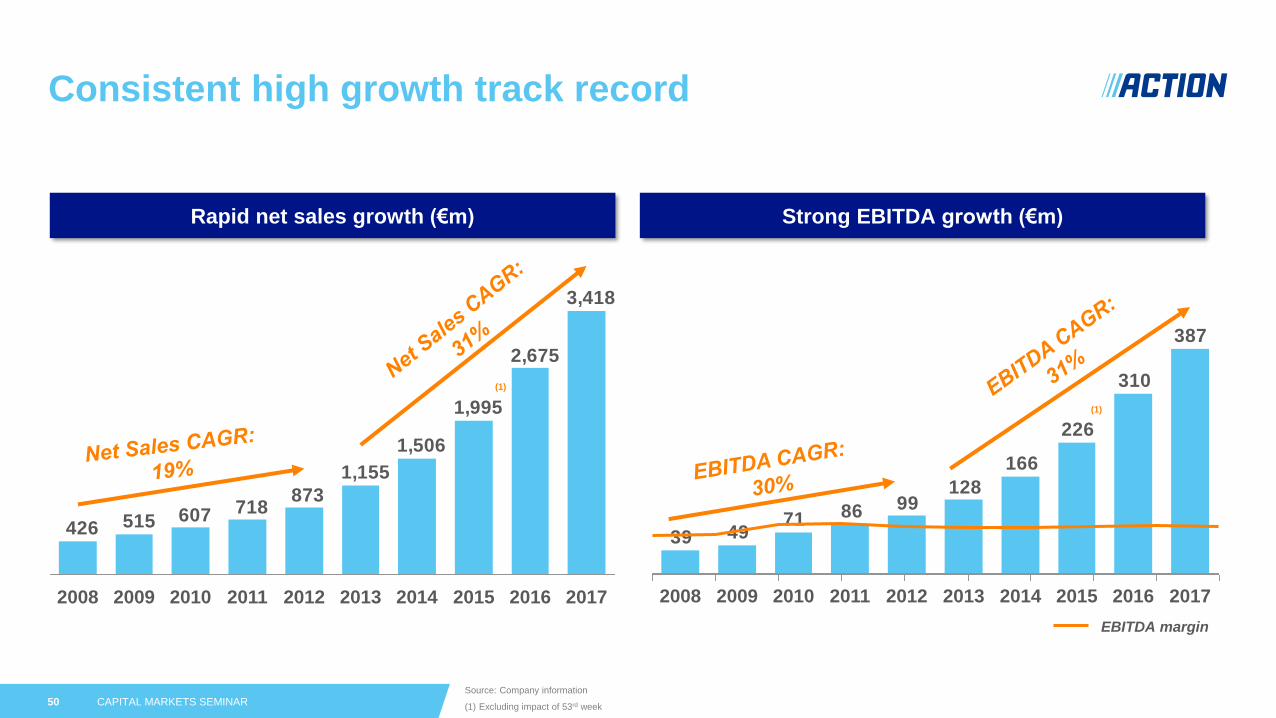
Consistent high growth track record
50
387
310
226
166
128998671
4939
201620152014201320122011201020092008 2017
3,418
2,675
1,995
1,506
1,155
873718607515426
2008 2009 2016 2017201220112010 201520142013
Rapid net sales growth (€m) Strong EBITDA growth (€m)
(1)
(1)
Source: Company information
(1) Excluding impact of 53rd week
EBITDA margin
CAPITAL MARKETS SEMINAR

Action’s repeatable economic model
51
Clear value
drivers
Tight centralised financial governance and control
5
• Like-for-Like sales growth
• # new stores
• EBITDA margin
Superior store
economics
• Consistent gross margin
across categories
• All Like-for-Like stores
profitable
• Converting EBITDA margins
Excellent cash
generation
• Low capital intensity
• Negative working capital
• Very fast pay-back
Strong
economic
model
• Proven
• Consistent
• Predictable
• Robust
1
3
2
4
CAPITAL MARKETS SEMINAR

Strong Like-for-Like sales growthKey Like-for-Like driver is increase in number of customers
52
5.3%
6.9%
7.6%7.2%
2017201620152014
Source: Company information
1
CAPITAL MARKETS SEMINAR
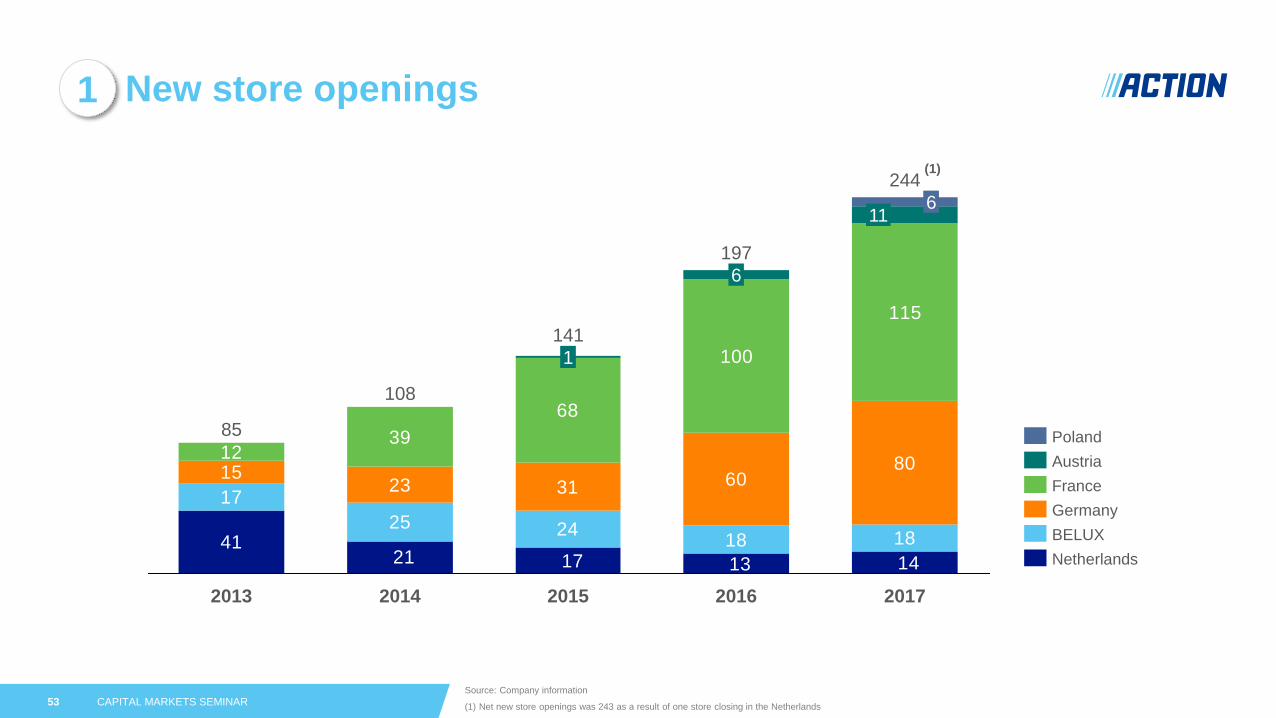
New store openings
53Source: Company information
(1) Net new store openings was 243 as a result of one store closing in the Netherlands
1
41
17
25 2418 18
1523 31 60
8012
39
68
100
115
14131721
141
2015 2016
197
1
2017
244
11
2014
108
6
2013
85
6
Germany
France
Netherlands
Poland
Austria
BELUX
(1)
CAPITAL MARKETS SEMINAR

Limited seasonality in sales
54Source: Company information
Note: Q1 comprises 4 periods of 4 weeks; Q2, Q3, Q4 all comprise of 3 periods of 4 weeks
Net sales by trading period EBITDA by trading period
Q4Q3Q2Q1 Q4Q3Q2Q1
2016201520142013 2017
1
CAPITAL MARKETS SEMINAR

Balanced revenue mix between countriesAlready over 60% of sales generated outside the Netherlands
55Source: Company information
201720162015201420132012
Netherlands
Belgium
Germany
France
Luxembourg
Poland
Austria
1S
ale
s s
ha
re b
y c
ou
ntr
y
CAPITAL MARKETS SEMINAR

Superior growth versus selection of peers
56
1
24.6%24.7%25.0%
31.0%
14.8%
12.1%
8.0%9.9%10.6%11.3%
2012-2
01
7E
Sa
les
CA
GR
Source: Company information, broker research
Note: Sales not calendarised, fiscal year ending in January for Five Below, Dollar Tree, Inditex and Dollarama; in February for Dollar General; in March for B&M
and Poundland; in November for H&M; in December Europris;
(1) Mar-13 to Mar-18E CAGR; (2) Based on J.P. Morgan Research estimate (as of Dec-17); (3) Based on Dec-17A sales
(1) (2) (3)
Average 17.5%
CAPITAL MARKETS SEMINAR

Consistent margins across all categories
57
Source: Company information
(1) (Net sales - Cost of goods sold) / Net sales
(2) Excluding 14th category Sports
0%
10%
20%
30%
40%
50%
60%
1 2 3 4 5 6 7 8 9 10 11 12 13
% G
ross m
arg
in(1
)
2
Category(2)
CAPITAL MARKETS SEMINAR

All Like-for-Like stores¹ are consistently profitable across all countries
58
Source: Company information
Note: Chart shows store contribution (€k) and store contribution as % of net sales (2017). Store contribution is store EBITDA before indirect store expenses
(1) Like-for-Like stores includes all stores opened before 1 January 2017
0
600
Store Contribution YTD Store Contribution % YTD
Sto
re C
on
trib
uti
on
(’0
00
)
2
CAPITAL MARKETS SEMINAR

Underlying country EBITDA margins increasing over time
59
2
Source: Company information
Co
un
try
EB
ITD
A m
arg
in (
%)
CAPITAL MARKETS SEMINAR
Action Group
EBITDA
2016 2017
+ ~70 bps + ~100 bps
+ ~150bps + ~150bps
-/- ~30bps

Very attractive pay-back periods for new stores
60
Source: Company information
1) Including opening costs for new stores (2) Based on total sales/total number of stores (3) Including opening costs for new stores
Average payback of new stores (illustrative)
• Rapid sales ramp-up post-opening
• Real estate discipline driving low rent costs:
→ No high street locations
→ At market or lower than market rent
→ Low maintenance capex
Highly attractive new store dynamics
0.5
3.0
-0.5
Store
EBITDA
Revenue
per store
Upfront
capex
~1 year
payback
period
~
~
~
(1) (2) (3)
3
CAPITAL MARKETS SEMINAR

Cashflow in 2016 benefitted from a non-recurring structural improvement
61
Source: Company information
1) Excluding capex for new DCs
Operating cashflow 2016 - 2017
• Reported operating cashflow in 2017 declines vs 2016
• Significant difference as a result of structural improvement in credit terms in 2016
• This windfall gain did not re-occur in 2017
• CAPEX per store in 2017 remains on par with 2016
• Future operating cashflow ratios will depend on level of investments and will vary with fluctuations to year-end balances
3
CAPITAL MARKETS SEMINAR
Cashflow
2017
268
OtherSupply
Chain
investments
Cashflow
2016
223
Impact
improvement
DPO
Normalised
cashflow
2016
Higher
EBITDA
2017
Higher
expansion
capex 20171

Action enjoys negative structural working capital
62
3
P8 P9 P10 P11 P12 P13P2 P3 P4 P5 P6 P7P1
Net
wo
rkin
g c
ap
ital in
€m €0
2016 2017
CAPITAL MARKETS SEMINAR
• Total net working capital in Action is negative throughout the calendar year
• Creditors are fully financing company inventories
• The faster Action grows, the stronger the cash flow performance
Source: Company information
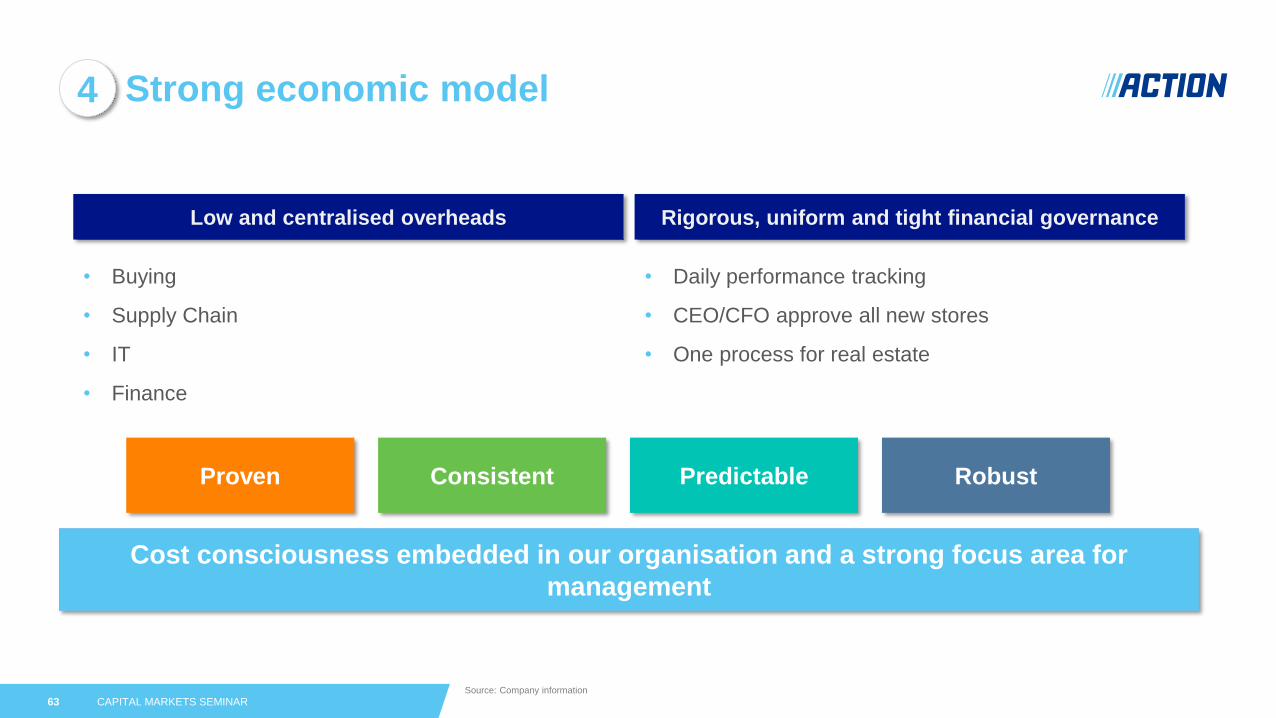
Strong economic model
63
Low and centralised overheads Rigorous, uniform and tight financial governance
• Buying
• Supply Chain
• IT
• Finance
• Daily performance tracking
• CEO/CFO approve all new stores
• One process for real estate
Cost consciousness embedded in our organisation and a strong focus area for
management
Proven Consistent Predictable Robust
4
CAPITAL MARKETS SEMINARSource: Company information

Action continued to deliver strongly in 2017
64
2017 2016 Change
Sales (€m) 3,418 2,675 +28%
Like-for-Like sales growth 5.3% 6.9%
Operating EBITDA (€m) 387 310 +25%
EBITDA margin 11.3% 11.6%
Number of stores 1,095 852 +243
Source: Company information
CAPITAL MARKETS SEMINAR

Action presents a compelling long-term growth opportunity
65
Sales development of selected peers after reaching $1bn in sales
To
tal s
ale
s in
$ b
illi
on
Years after reaching $1 billion in salesSource: Company information, FactsetNote: Dollar General acquired Family Dollar (July 2015);a TJX figures from 1988 post sale of Zayre to Ames; sales start from $1.9bn b Walmart data as of 1st of January 1985 - no data available prior to 1985
CAPITAL MARKETS SEMINAR

What do we expect from Reckitt Benckiser
07/11/2017RECKITT BENCKISER 66
Thank you for your attention!