26. magnetostratigraphy of the north aoba · pdf file26. magnetostratigraphy of the north aoba...
TRANSCRIPT

Greene, H.G., Collot, J.-Y, Stokking, L.B., et al., 1994Proceedings of the Ocean Drilling Program, Scientific Results, Vol. 134
26. MAGNETOSTRATIGRAPHY OF THE NORTH AOBA BASIN1
Xixi Zhao,2 Pierrick Roperch,3 and Laura B. Stokking4
ABSTRACT
The goal of Ocean Drilling Program (ODP) Leg 134 was to study the tectonic history of the central New Hebrides Island Arcsystem (Vanuatu). ODP Sites 832 and 833 were drilled in the intra-arc North Aoba Basin. Volcanic sandstone and siltstone andclayey silty limestone make up most of the recovered basin-fill sediment. The magnetic susceptibility in the sediment is high,varying on average from 0.005 to 0.03 S1 because of the high volcanic influxes derived either from erosion of volcanic rocksfrom nearby islands or from the output of active volcanoes. Determination of the timing of the tectonic and volcanic eventsrecorded in the sedimentary sequences requires the establishment of a high-resolution stratigraphic framework. The magnetostrati-graphic data presented here are based on a combination of shipboard whole-core pass-through cryogenic measurements, made at5-cm intervals on all archive core halves after alternating field (AF) demagnetization (usually 10 mT), and shipboard andpost-cruise progressive AF and thermal demagnetization analyses of 466 (Site 832) and 715 (Site 833) discrete samples.
The volcanic-rich sediment yielded complex remanent magnetizations having widespread drilling-induced magnetic over-prints. Detailed AF and thermal demagnetizations of discrete samples indicate that the volcanic sandstones have a stable,normal-polarity magnetization that is probably of viscous origin acquired during the late Brunhes Chron.
At Site 832, in the north central part of the basin, a major stratigraphic unconformity is found at 700 meters below sea floor(mbsf). Above the breccia unit that defines the unconformity, numerous slump structures have disturbed primary depositionalremanent magnetizations, so a reliable magnetostratigraphy is not possible from 150 to 700 mbsf. The Brunhes/Matuyamaboundary was not identified. Below the unconformity, a reliable magnetostratigraphic record from 700 to 825 mbsf was obtainedin silty limestone. In conjunction with biostratigraphic data, correlation of the magnetostratigraphic sequence with the geomagneticpolarity time scale indicates that the sediments were deposited from the late Miocene (Chron 5) to the Pliocene/Pleistoceneboundary. The inteΦretation of the magnetostratigraphic record in turn suggests that the volcanic breccia unit accumulated duringearly Pleistocene time.
At Site 833, located on the eastern flank of the basin, the Brunhes/Matuyama boundary and the Jaramillo Subchron can berecognized from 200 to 260 mbsf. From 260 to 650 mbsf, numerous volcanic sandstone layers, which have relative high magneticsusceptibilities (0.01-0.03 S1), record a predominant normal polarity of possibly viscous origin that makes the establishment ofa reliable magnetostratigraphic record difficult. The Mammoth subchron tentatively has been recognized from 650 to 700 mbsf.The magnetostratigraphy at Site 833 implies a sedimentation rate of about 10 cm/k.y. during the middle Pliocene, which is incontrast to the low sedimentation rate (about 1.5 cm/k.y.) estimated at Site 832 for the same period.
INTRODUCTION
The primary objective of Leg 134 was the study of the collisionaltectonic history of the central New Hebrides Island Arc system(Vanuatu) in the southwestern Pacific Ocean. Eastward subduction ofthe Australia-India Plate beneath the New Hebrides Island Arc hasbeen active since the late Miocene. The complex tectonics of the NewHebrides Island Arc involve the d'Entrecasteaux zone (DEZ), whichis composed of two aseismic ridges that are colliding with the centralpart of the arc (Collot, Greene, Stokking, et al., 1992). Rapid subduc-tion of the North d'Entrecasteaux Ridge (2500 m high) uplifts a groupof islands in the front- and backarc, with simultaneous subsidence ofthe intra-arc Aoba Basins (Collot et al., 1985).
In the North Aoba Basin, Sites 832 and 833 penetrated more than1000 m of upper Miocene to Holocene volcaniclastic and carbonatesediment, as well as basaltic sills. Magnetic directions in these twosites were obtained by measuring archive half sections using the ship-board pass-through cryogenic magnetometer measurements and byprogressive thermal and AF demagnetization experiments of discretesamples on shore.
More than 1000 discrete samples were selected to determine thecharacteristic directions. The measurement of discrete samples actsas a valuable calibration of the results obtained using the pass-through
1 Greene, H.G., Collot, J.-Y., Stokking, L.B., et al., 1994. Proc. ODP, Sci. Results,134: College Station, TX (Ocean Drilling Program).
2 Earth Science Department, U.C. Santa Cruz, CA 95064, U.S.A.3 ORSTOM, BP 48, 06230 Villefranche-sur-Mer, France.4 ODP, Texas A&M University, College Station, TX 77845, U.S.A.
cryogenic magnetometer onboard the ship. The magnetic polaritypatterns contained within cores from these two sites, when unambig-uously correlated with the sequence of magnetic polarity chrons ofthe geomagnetic polarity time scale (GPTS) (Berggren et al., 1985),should serve as both an important tool for estimating age and forstratigraphic correlations between the two sites and as additional datathat may help improve the calibration of the geomagnetic polaritychrons. In this paper we describe and discuss the paleomagneticanalysis of the sediment and volcanic rocks recovered from these twosites, focusing on the intervals that provided the most reliable data,and then interpret the polarity sequences used in conjunction withbiostratigraphy and the GPTS to present a magnetostratigraphy forthe two basin sites.
SITE SETTING AND STRATIGRAPHY
The site locations and tectonic history of the North Aoba Basinhave been documented in detail in the 134 Initial Reports volume andappropriate papers (Collot, Greene, Stokking, et al., 1992; Greene etal., this volume) and are only briefly summarized here.
Site 832 is located at 14°47'S, 167°34'E in a water depth of 3089 mbelow sea level (mbsl). This site is centered on the flat basin floor ofthe North Aoba Basin, approximately 50 km northeast of the northerntip of the Queiros Peninsula of Espiritu Santo Island, and 45 km southof the active volcanic island of Santa Maria (Fig. 1). At Site 832, twoholes were drilled that penetrated more than 1100 m of basin-filldeposits. Seven lithostratigraphic units were identified at Site 832.The uppermost lithostratigraphic Unit I is a 385.6-m-thick Pleistocenesequence of sandy to clayey volcanic silt with interbedded volcanic
457

X. ZHAO, P. ROPERCH, L.B. STOKKING
166°E 167° 168°
ODP Sites LegActive volcano
-17°
Figure 1. Regional bathymetry map of the New Hebrides Arc showing thelocation of Leg 134 drill sites (after Collot, Greene, Stokking, et al, 1991).
ash layers. Lithostratigraphic Units II (385.6-461.5 mbsf) and III(461.5-625.7 mbsf) correspond to calcareous mixed sediment, withsubstantial volcanic material in Unit IL Lithostratigraphic Unit IV(625.7-702 mbsf) is composed of Pleistocene or upper Pliocenepartially lithified basaltic breccia. Unit V (702-865.7 mbsf) is com-posed of a Pliocene to upper Miocene silty limestone. The mostrelevant paleomagnetic results at Site 832 were obtained in this unit.Sandstone and breccias are found lower, in Units VI and VII.
Units II and III show numerous slump structures, whereas stratain Unit V are essentially flat lying. Normal faults with slickensideswere observed in Unit V (Pelletier et al., this volume). However, thedisplacements of the faults are millimeters in magnitude and wereinterpreted as a response to bedding parallel extension. This smallamount of deformation is not penetrative and should not significantlyaffect the remanent magnetization. Similar structural features werealso observed at Site 833 in similar lithologic rocks.
Site 833 is located at 14°52'S, 167°52'E, in a water depth of 2629mbsl. This site is located on the lower northwestern flank of MaewoIsland, about 24 km northwest of the northern tip of Maewo Island,and about 72 km southeast of the active volcanic island of Santa Maria.Two holes also were drilled at Site 833. Five lithostratigraphic unitswere defined. Like Site 832, nearly 400 m of Pleistocene sediment wererecovered at Site 833. Lithostratigraphic Unit III (375.8-577.8 mbsf)is a thick upper Pliocene to lower Pleistocene volcanic sandstone andfine-grained basaltic breccia. Lithostratigraphic Units IV (577.8-830.3mbsf) and V (8 3 0.3-1001.1 mbsf) are lower Pliocene to upper Pliocenemixed sediment with foraminiferal sandy volcanic siltstone. Basalticsills are interlayered with calcareous silty volcanic claystone or silt-stone. Formation MicroScanner (FMS) and structural data indicate thatbedding is tilted about 10° toward the west in most units. Slumpstructures are scattered but are especially well developed in the bottompart of the hole (Cores 134-833B-74R through -79R, 760-818 mbsf).
The North Aoba Basin underwent a major tectonic event duringearly Pleistocene or late Pliocene time, as indicated at Site 832 by theabrupt transition from horizontal, well-stratified, silty calcareous de-posits to overlying slumped and coarse volcanic deposits. This tectonicevent, marked by an angular unconformity in seismic reflection data,appears to be synchronous with the uplift of Espiritu Santo Island,which occurred about 2 Ma (Collot, Greene, Stokking, et al., 1992).Despite the occurrence of this tectonic event, the stratigraphic correla-tions between Sites 832 and 833 are not straightforward. Sediments atSite 833 are more coarse-grained than those at Site 832 and the well-defined breccia layer observed at Site 832 (Unit IV) is broader at Site833, with less marked lithologic contrasts. The Pliocene sequence atSite 833 is much thicker than its counterpart at Site 832. Variationsin sedimentary thicknesses between Sites 832 and 833 suggest thatthe axis of the basin migrated westward during the Pleistocene. Thismigration may be contemporaneous with the Pleistocene uplift of theEastern Belt.
BIOSTRATIGRAPHY
Age control in the sediment at both Sites 832 and 833 is primarilyfrom nannofossil and planktonic foraminifer biostratigraphy. The bio-stratigraphy of the two basin sites was first described in Collot, Greene,Stokking, et al. (1992); updated biostratigraphic data for the drillingsites in North Aoba Basin were also obtained from R. Perembo andS. Staerker (pers. comm., and this volume). A summary is given inTable 1. Detailed biostratigraphic interpretation is hindered by dilu-tion from volcaniclastic sediment that results in nannofossil abun-dances fluctuating between common and rare.
The sediments at Site 832 were deposited during the followingtimes: 0-600 mbsf, Pleistocene; 600-711 mbsf, early Pleistocene tolate Pliocene; 711-769 mbsf, late Pliocene; 769-856 mbsf, earlyPliocene, with the possibility that sediment from 817 to 856 mbsf maybe of late Miocene age, 924-962 mbsf earliest middle Miocene, and962-972 mbsf latest early Miocene. A plot of sediment accumulationrate shows a change in slope near 700 mbsf, above which rates are>IOO m/m.y. and below which rates are about 50 m/m.y. (Collot,Greene, Stokking, et al, 1992).
Application of foraminiferal and nannofossil biostratigraphies atSite 833 was severely limited by the abundance of volcanic ash,volcaniclastic sediment, and turbidites. As a result, many sampleswere barren or contained only a few specimens that did not confirmages. Despite this, planktonic foraminiferal zones N22 to N19 (Holo-cene to early Pliocene) were recognized in the sedimentary section atSite 833. A general age stratification was established and is as follows:
Table 1. Biostratigraphic datums, Holes 832B and833B.
Biostratigraphic datum
Hole 832BLAD D. brouweri (N)FAD G. truncatulinoides (F)LAD D. pentaradiatus (N)LAD D. surculus (N)LAD D. tamalis (N)LAD S. abies (N)FAD G. tumida (F)
Hole 833BFAD P. finalis(F)FAD G. truncatulinoides (F)FAD G. tosaensis (F)FAD G. crassaformis (F)FAD G. tumida (F)
Age(Ma)
1.891.902.352.422.653.455.20
1.301.903.104.305.20
Depth(mbsf)
705.41-706.90716.00718.12-721.3724.31-725.8735.21-740.33746.58-747.74839.00
252.00396.00646.00753.00938.00
Note: N = nannofossil; F = foraminifer; FAD = first-appearancedatum; LAD = last-appearance datum.
458

MAGNETOSTRATIGRAPHY OF THE NORTH AOBA BASIN
Pleistocene, between 0 and 375.0 mbsf; late Pliocene, between 375.0and 635.6 mbsf; and early Pliocene, between 635.6 and 945.0 mbsf.The interval between 193.1 and 375.0 mbsf (Samples 134-833B-12R-CC to -31R-CC) is early Pleistocene (early N22) in age, based on thescattered co-occurrence of Globorotalia tosaensis s.l. and Globoro-talia truncatulinoides, along with Globorotalia tumida tumida.
LABORATORY AND ANALYTICAL METHODS
Sampling
Discrete samples in soft sediment were taken using oriented stand-ard plastic sampling boxes (7 cm3). To reduce the deformation of thesediment, cores were cut using a thin stainless-steel spatula beforepressing the plastic sampling boxes into the sediment. Minicores (2.5cm diameter, 2.3 to 2.5 cm in length) were drilled from lithified sedi-mentary rocks and igneous rocks using a water-cooled nonmagneticdrill bit attached to a standard drill press. Obvious slumped or dis-turbed intervals were generally avoided, but a few samples were takento investigate the origin of the remanent magnetization. A total of 466paleomagnetic samples were obtained from Site 832, and 715 sampleswere collected from Site 833.
Magnetic Measurement Procedures
The paleomagnetic data presented here are of two different types:those obtained using the shipboard pass-through cryogenic magne-tometer and those derived from measurements of discrete samples. Inthe shipboard pass-through system, natural remanent magnetization(NRM) measurements of sediment and rocks were performed by pass-ing continuous archive-half core sections through a 2G cryogenicmagnetometer; these were taken at intervals of either 5 or 10 cm alongthe core and after AF demagnetization at 5,10, and 15 mT. Most sec-tions were AF demagnetized at 10 mT and measured at 5-cm intervals.Some discrete samples (145 samples from Site 832 and 133 samplesfrom Site 833) were measured and demagnetized using shipboardequipment. Magnetic measurements of discrete samples in shore-based studies were performed using a 2G cryogenic magnetometerand a Schonstedt spinner magnetometer housed in a field-free roomin the paleomagnetic laboratory at the University of California atSanta Cruz (Site 832), and using a Molspin spinner in the paleomag-netic laboratory in ORSTOM, Villefranche-sur-Mer, France (Site833). Both standard thermal and AF demagnetization experimentswere conducted using Schonstedt and Molspin equipment to evaluatethe directional stability and coercivity/unblocking temperature spec-tra of each sample. Isothermal remanent magnetizations (IRM) areremanences acquired in a strong direct current (DC) field and weregiven with a Bruker electro-magnet. Anhysteretic remanent magneti-zations (ARM) were given with the Schonstedt AF demagnetizer ina DC field of 45 mT and a peak AF of 95 mT.
Analysis of Directions
All samples were step-wise demagnetized, and a vector demagneti-zation diagram (Zijderveld, 1967) was used to identify the differentcomponents of magnetization. Magnetic components were determinedby fitting least-squares lines to segments of the vector demagnetizationplots that were linear in three-dimensional space ("the principal com-ponent analysis" of Kirschvink, 1980).
MAGNETIC STABILITY AND RELIABILITYOF PALEOMAGNETIC DATA
Whole-core Pass-through Measurements
One of the major experimental requirements in paleomagneticresearch is to isolate the characteristic remanent magnetization (ChRM)by selective removal of any secondary remanences. Pass-through cryo-genic paleomagnetic records have a high sampling resolution (usually
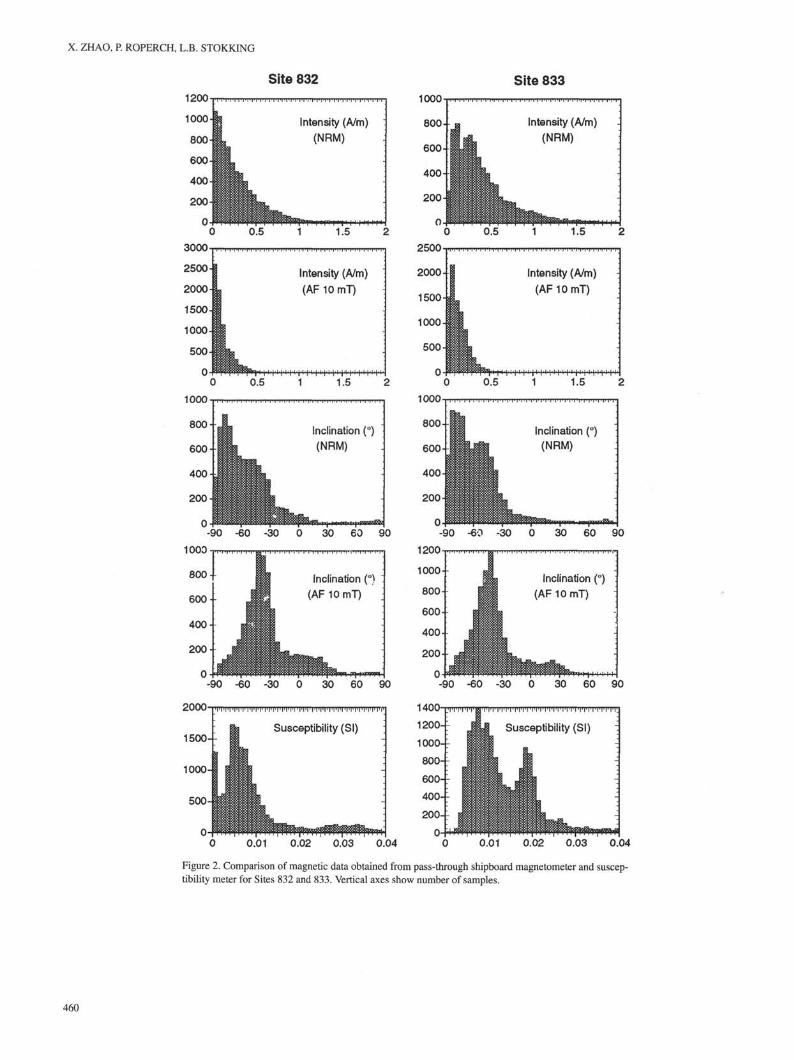
5 cm), but the low level AF demagnetization (usually 10 mT) allowedon ODP archive halve cores does not always ensure a completeremoval of secondary magnetizations. In Figure 2, we summarize theNRM intensities and inclinations, both before and after 10 mT AFdemagnetization, observed in rotary cores from Holes 832B and 833B.Stronger intensities of remanent magnetization were observed at Site833 than at Site 832, and the difference also was observed in thedistribution of susceptibility values (Fig. 2). On average, sedimentrecovered at Site 833 is richer in volcanic siltstone and sandstone thansediment at Site 832. However, no difference in the distribution ofinclinations is seen between the two sites. At both sites, NRM inclina-tions are strongly biased toward high negative inclinations. Upondemagnetization to 10 mT, a shift toward shallower inclinations occurs,but the distributions still are not centered on the expected geocentricaxial dipole fields (around -30° [+30°] for a normal [reversed] polar-ity). Most of the data are from rock units that are of Pliocene to middlePleistocene age, which implies that both polarities should have beenrecorded. Although most of the drilling-induced magnetization wasremoved by AF demagnetization at 10 mT, the bias in the distributionof inclination values indicates that a residual drilling-induced magneti-zation and viscous magnetization acquired during the last period ofnormal polarity are present in the pass-through records.
The pervasive remagnetization imparted by coring is commonlyencountered, as noted during previous legs (Schneider and Kent,1990). From various observations made aboard ship (see "Explana-tory Notes," Collot, Greene, Stokking, et al., 1992, Fig. 8, p. 78), wefound that the remanent magnetic field of a steel coring barrel couldbe imparted on the sediment contained within it. This remagnetizationmost severely affected the external portions of the cores (presumablybecause the outside of the core is physically closer to the magnetizedcore barrel). During standard drilling procedures, two core barrels areused. One is lowered into the pipe for recovery of the next core, whilethe previous core in the plastic core liner is taken out of the other corebarrel. Figure 3 shows the effect of alternating core barrels upon theintensity of the NRM magnetizations of discrete samples. Intensitiesof NRM in discrete samples from even-numbered cores are higherthan in odd-numbered cores. This difference disappears after 10-mTAF demagnetization. Thus, the magnetic field from a magnetized corebarrel seems to be responsible for the remagnetization process andnot the drill string or pipe. The use of stainless steel core barrels wouldperhaps reduce the acquisition of the drilling-induced magnetization.The drilling overprint is more important in volcanic-rich siltstone andsandstone than in less magnetic calcareous units (Fig. 4), for which areverse polarity pattern is clearly defined by both pass-through anddiscrete measurements.
AF and Thermal Demagnetization of Discrete Samples
To investigate the nature of the remanent magnetization of thediscrete samples, all samples were step-wise AF or thermally demag-netized. Demagnetization demonstrates that the remanent magnetiza-tion is the sum of three magnetizations: the characteristic primarymagnetization of either normal or reversed polarity, a viscous over-print acquired during the last normal Brunhes Chron, and an upward,steep, drilling-induced overprint.
The drilling-induced overprint was generally removed by AF de-magnetization at 5- to 10-mT while thermal demagnetization (TH) upto 300°C was necessary to remove the steep secondary magnetization(Fig. 5). Although AF is more efficient than TH in removing thedrilling overprint, we found that removal of the viscous overprint wasbetter accomplished through thermal demagnetization. For example,Samples 134-833B-26R-1, 4 5 ^ 7 cm, and -26R-1, 50-52 cm, arefrom the same piece, and the primary reverse magnetization is betterisolated using TH than AF demagnetization (Fig. 6). Due to highmagnetic susceptibilities and low intensities of the remanent magneti-zation (low Koenigsberger ratios), the acquisition of spurious mag-netizations during AF demagnetization such as anhysteretic, gyro-
459
X. ZHAO, P. ROPERCH, L.B. STOKKING
1200 M ! I , | , ,.,.... ,
-90 -60 -30 30 60 901000
800
600
400
200
0
J Inclination (°) '(AFiOnVT) :
: • i
-90 -60 -30 30 60 90
0.01 0.02 0.03 0.04
Site 833
0.01 0.02 0.03 0.04
Figure 2. Comparison of magnetic data obtained from pass-through shipboard magnetometer and suscep-tibility meter for Sites 832 and 833. Vertical axes show number of samples.
460

NRM
MAGNETOSTRATIGRAPHY OF THE NORTH AOBA BASIN
AF demagnetized (10 mT)
480
500 -–
520 -–
540 ---•
560 -–
580 -–
600
620 -–
640
-– ••• |*
D OCP
D
GD
•-•f"-
% w• ^ D
• D D D
G D
• % %
4a
CP• 3?
Pa α§
Q rp
ya• 1
• • • •
• • • '
• • • • -
• • • • ' •
0.5 1Intensity (A/m)
1.5 0.5 1Intensity (A/m)
1.5
• odd Core number D even Core number
Figure 3. Variation in the drilling-induced magnetization overprint in different core barrels from successive cores inHole 833B at the depth interval 480-640 mbsf. NRM intensity is significantly higher in even-numbered cores althoughthere is no significant difference after AF demagnetization at 10 mT.
magnetic, or rotational remanent magnetizations (ARM, GRM, RRM)was often observed at AF peak fields higher than 50 mT. Thus, thedetermination of the magnetization carried by high-coercivity mag-netic grains was hindered.
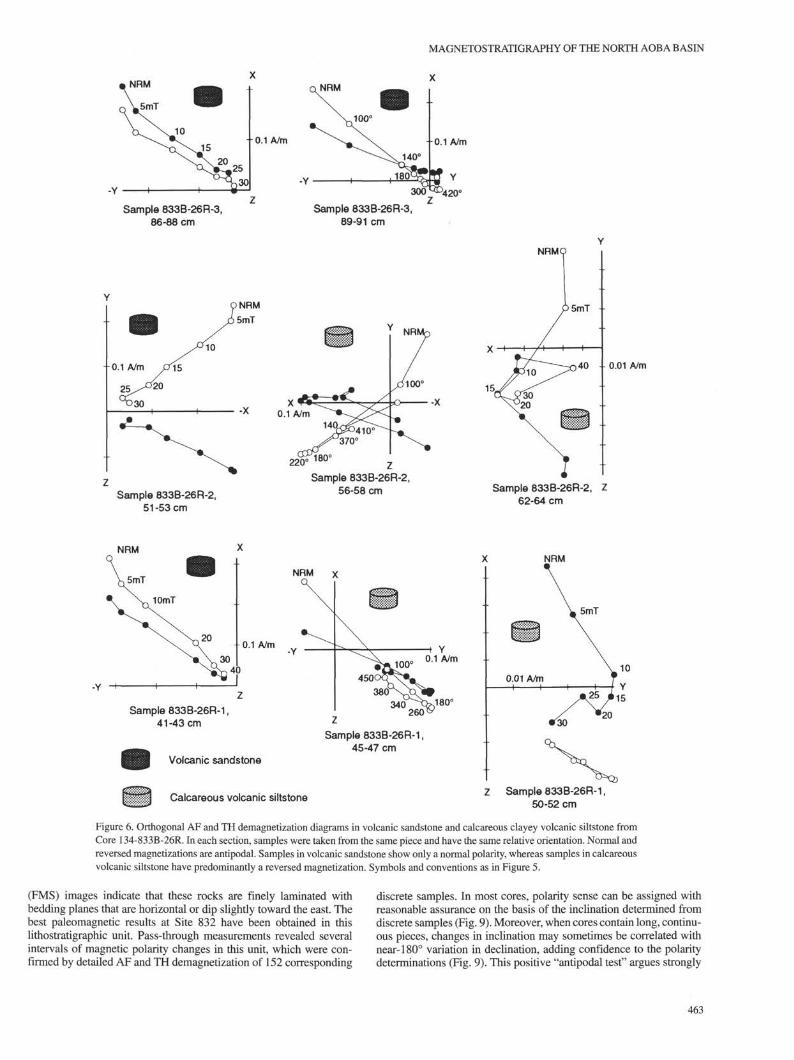
Demagnetization of discrete samples also shows that the remanentmagnetization is strongly dependent upon the lithology. A good exam-ple is given by samples from Core 134-833B-26R (Fig. 6). Calcareousclayey volcanic siltstone beds alternate with vitric silty volcanic sand-stone layers. Results of AF and TH demagnetizations for eight samplestaken from Core 134-833B-26R are shown in Figure 6; in each section(134-833B-26R-1, -26R-2, -26R-3), all selected samples belong to thesame piece and have the same relative orientation. AF demagnetizationof samples taken in the sandstone indicates a single component ofmagnetization of normal polarity, while AF and TH demagnetizationsof calcareous siltstone reveal a reversed component. Antipodal relativedeclinations within the same piece imply that the magnetization is notmodified by physical disturbances, such as an undetected slump. AFand TH demagnetizations performed in two specimens from a sand-stone layer in Section 134-833B-26R-3 clearly demonstrate that thesingle component isolated in AF is not primary. Upon TH demagneti-zation (Sample 134-833B-26R-3, 89-91 cm, Fig. 6), the magnetiza-tion shifts toward a positive inclination, but the primary characteristicdirection is not clearly defined because the unblocking temperaturesof the secondary magnetizations are widely distributed up to 400°C.These high unblocking temperatures suggest that the magnetization isnot only viscous, but may have been acquired during late diageneticprocesses of Brunhes age. Thus, if the normal component of magneti-
zation isolated by AF demagnetization is interpreted as a primaryremanence then it would imply a succession of apparent reversals andgives a misleading magnetostratigraphic signal. Several other suchexamples were observed at Site 832 and particularly at Site 833, wherethe sedimentary sequence shows numerous sandstone beds interlay-ered with more clayey and calcareous siltstone. However, no differ-ence can be seen in the acquisition of IRM and in the AF demagneti-zation spectrum of ARM among samples from calcareous and sand-stone layers (samples from Core 134-833B-26R, Fig. 7). Thus, thereis no significant difference in magnetic mineralogy between the dif-ferent samples, and the different NRM behaviors are probably relatedto differences in deposition. Measurements of the anisotropy of mag-netic susceptibility indicate that calcareous beds have an oblate shapefabric coplanar with the stratification while sandstone layers have noorganized fabric (Roperch et al., this volume). The rapid deposition ofcoarse-grained sandstone prevented the acquisition of a detrital rema-nent magnetization.
MAGNETIC RESULTS
Hole 832A
Most sediment recovered at Hole 832A are unlithified sandy toclayey volcanic silt. Pass-through measurements indicate that rema-nent magnetization in Cores 134-832A- 1H to -11H (0-81.5 mbsf) afterAF demagnetization at 10 mT is of normal polarity, with intensitiesranging from about 0.1 to 0.3 A/m. Characteristic magnetizations ofthe corresponding discrete samples were easily identified from the
461
X. ZHAO, P. ROPERCH, L.B. STOKKING
Declination (°)90 180 270
Inclination (°)360 -90 -60 -30 0 30 60 90
" 1
-• .
-
,
q
D
B
g
..,
Q
lini
-
•
D
-
_
-
-
-
, ,
V
\
-
_
/a
p'
D,
712 -
713 -
714 µ
f 715ΦQ
716 -
717 -
718 -
719
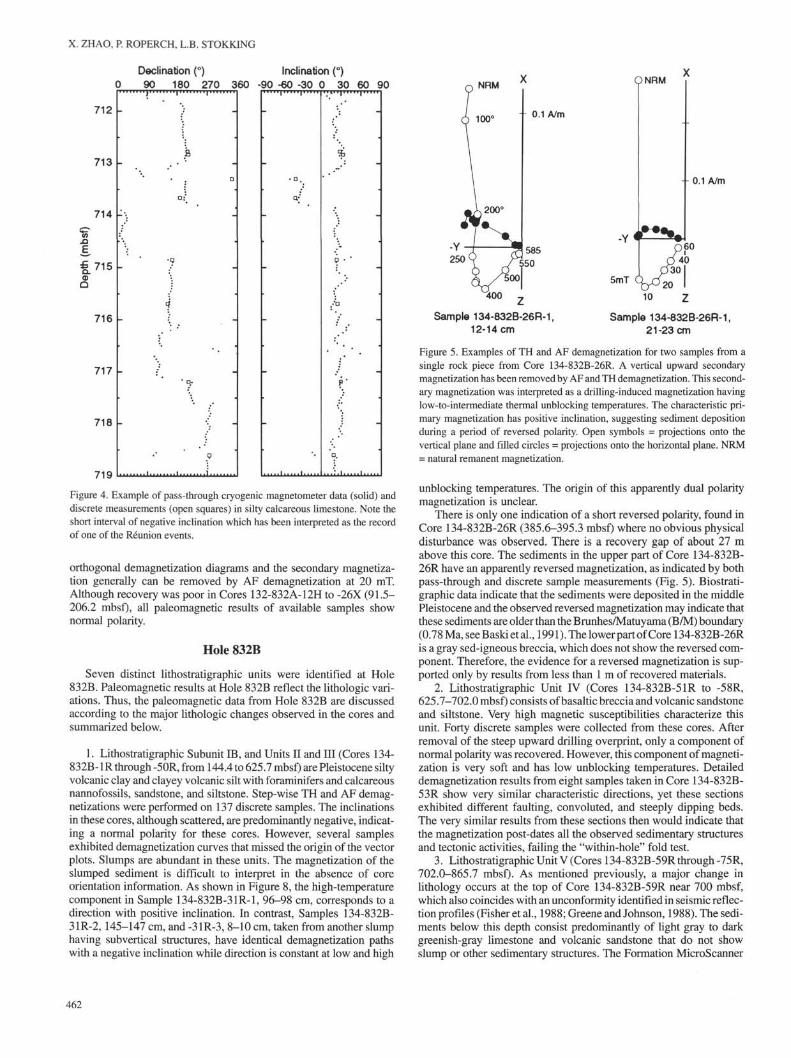
Figure 4. Example of pass-through cryogenic magnetometer data (solid) anddiscrete measurements (open squares) in silty calcareous limestone. Note theshort interval of negative inclination which has been interpreted as the recordof one of the Reunion events.
orthogonal demagnetization diagrams and the secondary magnetiza-tion generally can be removed by AF demagnetization at 20 mT.Although recovery was poor in Cores 132-832A-12H to -26X (91.5-206.2 mbsf), all paleomagnetic results of available samples shownormal polarity.
Hole 832B
Seven distinct lithostratigraphic units were identified at Hole832B. Paleomagnetic results at Hole 832B reflect the lithologic vari-ations. Thus, the paleomagnetic data from Hole 832B are discussedaccording to the major lithologic changes observed in the cores andsummarized below.
1. Lithostratigraphic Subunit IB, and Units II and III (Cores 134-832B-1R through -50R, from 144.4 to 625.7 mbsf) are Pleistocene siltyvolcanic clay and clayey volcanic silt with foraminifers and calcareousnannofossils, sandstone, and siltstone. Step-wise TH and AF demag-netizations were performed on 137 discrete samples. The inclinationsin these cores, although scattered, are predominantly negative, indicat-ing a normal polarity for these cores. However, several samplesexhibited demagnetization curves that missed the origin of the vectorplots. Slumps are abundant in these units. The magnetization of theslumped sediment is difficult to interpret in the absence of coreorientation information. As shown in Figure 8, the high-temperaturecomponent in Sample 134-832B-31R-1, 96-98 cm, corresponds to adirection with positive inclination. In contrast, Samples 134-832B-31R-2, 145-147 cm, and -31R-3, 8-10 cm, taken from another slumphaving sub vertical structures, have identical demagnetization pathswith a negative inclination while direction is constant at low and high
ONRM
- 0.1 A/m
- 0.1 A/m
Sample 134-832B-26R-1,12-14 cm
5mT
Sample 134-832B-26R-1,21-23 cm
Figure 5. Examples of TH and AF demagnetization for two samples from asingle rock piece from Core 134-832B-26R. A vertical upward secondarymagnetization has been removed by AF and TH demagnetization. This second-ary magnetization was interpreted as a drilling-induced magnetization havinglow-to-intermediate thermal unblocking temperatures. The characteristic pri-mary magnetization has positive inclination, suggesting sediment depositionduring a period of reversed polarity. Open symbols = projections onto thevertical plane and filled circles = projections onto the horizontal plane. NRM= natural remanent magnetization.
unblocking temperatures. The origin of this apparently dual polaritymagnetization is unclear.
There is only one indication of a short reversed polarity, found inCore 134-832B-26R (385.6-395.3 mbsf) where no obvious physicaldisturbance was observed. There is a recovery gap of about 27 mabove this core. The sediments in the upper part of Core 134-832B-26R have an apparently reversed magnetization, as indicated by bothpass-through and discrete sample measurements (Fig. 5). Biostrati-graphic data indicate that the sediments were deposited in the middlePleistocene and the observed reversed magnetization may indicate thatthese sediments are older than the Brunhes/Matuyama (B/M) boundary(0.78Ma,seeBaskietaL, 1991). The lower part of Core 134-832B-26Ris a gray sed-igneous breccia, which does not show the reversed com-ponent. Therefore, the evidence for a reversed magnetization is sup-ported only by results from less than 1 m of recovered materials.
2. Lithostratigraphic Unit IV (Cores 134-832B-51R to -58R,625.7-702.0 mbsf) consists of basaltic breccia and volcanic sandstoneand siltstone. Very high magnetic susceptibilities characterize thisunit. Forty discrete samples were collected from these cores. Afterremoval of the steep upward drilling overprint, only a component ofnormal polarity was recovered. However, this component of magneti-zation is very soft and has low unblocking temperatures. Detaileddemagnetization results from eight samples taken in Core 134-832B-53R show very similar characteristic directions, yet these sectionsexhibited different faulting, convoluted, and steeply dipping beds.The very similar results from these sections then would indicate thatthe magnetization post-dates all the observed sedimentary structuresand tectonic activities, failing the "within-hole" fold test.
3. Lithostratigraphic Unit V (Cores 134-832B-59R through -75R,702.0-865.7 mbsf). As mentioned previously, a major change inlithology occurs at the top of Core 134-832B-59R near 700 mbsf,which also coincides with an unconformity identified in seismic reflec-tion profiles (Fisher et al., 1988; Greene and Johnson, 1988). The sedi-ments below this depth consist predominantly of light gray to darkgreenish-gray limestone and volcanic sandstone that do not showslump or other sedimentary structures. The Formation MicroScanner
NRM
- 0.1 A/m
Sample 833B-26R-3,86-88 cm
MAGNETOSTRATIGRAPHY OF THE NORTH AOBA BASIN
X
0.1 A/m
420°
Sample 833B-26R-3,89-91 cm
NRMQ
Sample 833B-26R-2,51-53 cm
0.1 A/m
22Q
Sample 833B-26R-2,56-58 cm
0.01 A/m
Sample 833B-26R-2, Z62-64 cm
NRM
0.1 A/m-Y
Sample 833B-26R-1,41-43 cm
Volcanic sandstone
Calcareous volcanic siltstone
-t Y0.1 A/m
450
Sample 833B-26R-1,45-47 cm
NRM
5mT
Z Sample 833B-26R-1,50-52 cm
Figure 6. Orthogonal AF and TH demagnetization diagrams in volcanic sandstone and calcareous clayey volcanic siltstone fromCore 134-833B-26R. In each section, samples were taken from the same piece and have the same relative orientation. Normal andreversed magnetizations are antipodal. Samples in volcanic sandstone show only a normal polarity, whereas samples in calcareousvolcanic siltstone have predominantly a reversed magnetization. Symbols and conventions as in Figure 5.
(FMS) images indicate that these rocks are finely laminated withbedding planes that are horizontal or dip slightly toward the east. Thebest paleomagnetic results at Site 832 have been obtained in thislithostratigraphic unit. Pass-through measurements revealed severalintervals of magnetic polarity changes in this unit, which were con-firmed by detailed AF and TH demagnetization of 152 corresponding
discrete samples. In most cores, polarity sense can be assigned withreasonable assurance on the basis of the inclination determined fromdiscrete samples (Fig. 9). Moreover, when cores contain long, continu-ous pieces, changes in inclination may sometimes be correlated withnear-180° variation in declination, adding confidence to the polaritydeterminations (Fig. 9). This positive "antipodal test" argues strongly

X. ZHAO, P. ROPERCH, L.B. STOKKING
AF demagnetizationof ARM
** ,
35
10 20 30 40 50 60 70 80 90
Alternating peak field (mT)
Figure 7. AF demagnetization of ARM and acquisition of IRM for six samples from Core 134-833B-26R.
0.1 0.2 0.3 0.4 0.5 0.6 0.7 0.8 0.9 1 1.1 1.2
Applied field (T)
that the polarity zones represent magnetizations established near thetime of deposition, although this test is not sufficient by itself. Pass-through whole-core measurements after AP demagnetization at 10 mTand data from discrete samples are plotted for three depth intervals thatcover most of Unit V (Figs. 10A, 10B, and 10C). Changes in the signof the inclination from negative to positive are correlated with a largedecrease in the intensity of the remanent magnetization and a signifi-cant increase in the dispersion of the paleomagnetic results. Thesecorrelations may also reflect the effect of incomplete removal of a lateviscous overprint at 10-mT demagnetization. (The magnetostratigraphicrecord will be further discussed in the magnetostratigraphy section.)
4. Lithostratigraphic Unit VI (Cores 134-832B-77R to -84R, 865.7-952.6 mbsf) comprises lithified volcanic sandstone that becomes coarser-grained from top to bottom. Both pass-through cryogenic measurementand 37 discrete samples from these cores showed predominantlynegative inclinations. However, the low unblocking temperatures andthe poor stability of the magnetization suggest that the NRM might bedominated by an unremoved normal polarity overprint.
5. Lithostratigraphic Unit VII (Cores 134-832B-85R to -100R,952.6-1106.7 mbsf) consists mainly of basaltic breccia and conglom-erate. The NRM intensities and magnetic susceptibilities in thisunit are significantly lower than those of the overlying units whichprobably reflects an increase in the amount of alteration of magneticminerals. The volcanic breccia of the lowest layers of this unit wereprobably the product of submarine volcanism, because they containa matrix with abundant alteration products such as palagonite, chlo-rite, clay minerals, and zeolite. The magnetization is dominated bysoft secondary magnetizations and, thus, we consider that this unitdoes not contain a reliable magnetostratigraphic record.
Hole 833A
Like their counterparts at Site 832, sediments recovered at Hole833A are interbedded unlithified volcanic ashes and sandy to clayeyvolcanic silts (lithostratigraphic Unit I). Both pass-through cryogenicmeasurement and progressive AF demagnetization on discrete sam-ples show that remanent magnetizations in Cores 134-833A-1H to-8H (0-58.1 mbsf) are of normal polarity. Sediments were disturbedand recovery rate was poor from 58.1 to 199.5 mbsf (Cores 134-833 A- 9H to -26X), but the inclinations of discrete samples from thesecores show no evidence for reversed polarity.
Hole 833B
Five lithostratigraphic units have been described at Site 833.Demagnetization behavior varied with the lithostratigraphic units.Thus, paleomagnetic results again are discussed according to relationto lithostratigraphic units.
1. Lithostratigraphic Unit II (Cores 134-833B-1R through -31R,from 77.4 to 375.8 mbsf) is composed of alternating layers of highlybioturbated sedimentary rock interbedded with calcareous clayey vol-canic siltstone and clayey volcanic silt. All inclinations of Cores 134-833B-1R to -13R are negative, indicating normal polarity from 77.4 toabout 202.8 mbsf. Several intervals of alternate apparent polaritiescan be found below a depth of 210 mbsf, from Cores 134-833B-14Rthrough -3 IR. However, changes in the sign of the inclination appearto correlate with changes in lithology between volcanic calcareoussiltstone and sandstone as shown in Figure 6. Detailed TH demagneti-zations demonstrate that the normal component magnetization iso-lated by AF demagnetization in sandstone is probably a secondaryviscous remanent magnetization (VRM) overprint.
2. Lithostratigraphic Unit III (Cores 134-833B-32R to -54R,375.8-577.7 mbsf) is mostly composed of fine to coarse-grainedvolcanic sandstone and basaltic breccia. The inclinations observed inmeasurements obtained from both archive-half sec ions (after AFdemagnetizations at 10 mT) and discrete samples (progressive AF andTH demagnetization on more than 90 samples) are predominantlynegative, suggesting a normal polarity for these cores. Comparison ofdata obtained from archive-half sections measured using the pass-through cryogenic magnetometer and discrete samples are shown forCores 134-833B-38R and -39R (Fig. 11). The consistency of resultsbetween both sets of measurements does not indicate whether a pri-mary magnetization was preserved or whether these sediments onlyrecorded a present-day normal viscous overprint. In Core 134-833B-39R, thin layers of chloritic claystone with corresponding low mag-netic susceptibility values are interbedded with the sandstone. The onlyevidence for a reversed magnetization was found in one discretesample at 444.1 mbsf in the chloritic claystone layer or clast. Althoughthe thin beds of claystone appear to have an almost horizontal layering,they may correspond to large clasts incorporated in the sandstone. Ifthese layers are really interbedded in the sandstone, the reverse mag-netization, observed in one discrete sample at 444 mbsf, is an argumentfor deposition of the sandstone during a period of reversed polarity.Alternatively, if the claystones are displaced clasts, then depositionduring a period of normal polarity cannot be rejected. Biostratigraphicanalyses indicate a relatively higher sedimentation rate for this interval(-300 m/m.y.) and so the absence of reversal does not necessarily ruleout the possibility that a primary magnetization was recorded: thesandstone may have been deposited during the normal polarity GaussChron or Olduvai Subchron. In some samples, the moderate to goodstability of the magnetization may favor a primary origin (Fig. 12).However, the preferred interpretation is that the normal component isa VRM overprint with a relatively long relaxation time.
3. Lithostratigraphic Unit IV (Cores 134-833B-55R to -81R, 577.8-830.3 mbsf) consists of fine-grained volcanic sandstone and siltstoneinterbedded with calcareous fine siltstone and claystone. From 577.8
464

NRM
MAGNETOSTRATIGRAPHY OF THE NORTH AOBA BASIN
Y NRM
100°C
0.05 A/m
Sample 134-832 B-31R-1,96-98 cm
Sample 134-832B-31R-2,145-147cm
Sample 134-832B-31R-3,8-10 cm
Figure 8. Examples of TH demagnetization in slumped layers in Core 134-832B-31R. Apparent reversed and normal magnetizations wereobserved, but in the absence of absolute geographic orientation, interpretation of the magnetization was not straightforward. Symbols andconventions as in Figure 5.
NRM
NRM
0.1 A/m
Sample 134-832B-61R-3,75-77 cm
Sample 134-832B-61R-3,119-121 cm
Figure 9. Orthogonal diagrams of TH demagnetization from two samples fromCore 134-832B-61R showing a reversal of polarity in Section 134-833B-61R-3.Symbols and conventions as in Figure 5.
to about 766 mbsf, the bedding planes dip gently (about 10°) and noimportant structural perturbations occur. Again, the magnetization iscomplex and the pass-through cryogenic record shows evidence fornormal and reversed magnetizations with a clear link to the lithology.AF and TH demagnetization data confirm the difficulty in identifyingthe characteristic primary magnetization. TH demagnetization some-times reveals clearly a reversed component that was not isolated byAF (see example for two samples from the same single piece in Core134-833B-69R demagnetized by AF and TH, Fig. 13). Despite thedifficulty for isolating the primary magnetization accurately, an ap-parent magnetostratigraphic record was observed in this lithostrati-graphic unit (Fig. 14). For the interval from 579 to 658 mbsf, allsamples clearly indicate a normal polarity. A reversed interval wasobserved from 660.9 to 668.7 mbsf (from Sections 134-833B-63R-5to -64R-2), which is defined by both pass-through measurements anddata from nine corresponding discrete samples. Another reversed
interval occurs in Cores 134-833B-67R to -73R (from 699.2 to 755.2mbsf). The primary nature of the characteristic component is sup-ported by the reversed polarity throughout this interval. From Core134-833B-75R (770 mbsf) downward, the polarity pattern is ob-scured by strong sedimentary structures (such as slumps).
4. Lithostratigraphic Unit V (Cores 134-833B-82R to -99R, 830.3-1001.1 mbsf) consists of basaltic sills interstratified with some layersof sedimentary rocks. The sedimentary rocks have the same lithologyand exhibit magnetic properties similar to those from Cores 134-833B-75R to -8IR of Unit IV, mentioned above.
The NRM intensities of the sills are very high (up to 100 A/m), asare magnetic susceptibilities (Collot, Greene, Stokking, et al., 1992),but they vary among the sills as indicated in the variations of intensityof magnetization after AF demagnetization at 5 mT (Fig. 15). Thesedifferences provide evidence for different phases of intrusions. Thesills recovered in Cores 134-833B-81R to -87R (830-885 mbsf) havehigh intensities of magnetization and relatively stable magnetic direc-tions (Fig. 16). Disrupted pieces of silty limestone were found in Core134-833B-84R that may indicate that there is a boundary between atleast two sills. All samples below this boundary, recovered in Cores134-833B-84R, -85R, -86R, and -87R, have stable magnetic directionswith characteristic positive inclinations, which suggests intrusion dur-ing a reversed period (Fig. 16). In contrast, all samples in the sill abovethe disrupted sediment (Cores 134-833B-81R to -84R) have moreshallow inclinations upon AF demagnetization (Fig. 16). These shal-low inclinations, if not the result of incomplete removal of secondarycomponents, may indicate intrusion at a slightly different time than forthe underlying sill unit. Lacking azimuthal orientation, we cannotaccurately determine the polarity for these cores: large geomagneticsecular variations may also result in shallow inclinations. Another sillwas found in Cores 833B-91R and -92R (910-934 mbsf). The intensityof magnetization is lower and the magnetization is less stable than thatobserved in the upper sills, but a few samples provide evidence (Fig.17) indicating intrusion in a reversed period. Results from the lowersills from Core 134-833B-94R down to the bottom of the hole areuncertain. The magnetization in these cores is very soft, as indicatedby the AF demagnetization of Sample 134-833B-97R-3, 20-22 cm(Fig. 17), one of the most straightforward demagnetization diagramsout of 23 discrete samples taken in this sill.
MAGNETOSTRATIGRAPHY
As with all applications of magnetostratigraphy, correlation ofpolarity zones with the GPTS must be formulated in conjunction with
465

X. ZHAO, P. ROPERCH, L.B. STOKKING
A Declination (°) Inclination (°) Intensity (A/m)
0 90 180 270 360 -90 -60 -30 0 30 60 90 0.00 0.20 0.40 0.60 0.80
705 -
710 -
715 -
E
£720 -
725 -
730 -
*
t
G -
J
K
i..
1 1
* !*̂"α
-
' 1#J3
• •, , . 1 , , , i , L . , . . ,
•f "
*/p
•
•
1 1 , , . , .740
Figure 10. Data obtained using the pass-through cryogenic magnetometer (after 10 mT AF demagnetization) and characteristic directions from discrete samplesin three depth intervals from Hole 832B. A. 702-740 mbsf. B. 740-770 mbsf. C. 795-825 mbsf. All covering the Pliocene and late Miocene time. TheinteΦretation of the magnetostratigraphy is also given; zones in black (white) correspond to normal (reversed) polarity, and shaded areas correspond to gapsin the sampling. The plot of the unoriented relative declination is given to highlight the homogeneity of the magnetization within long undisturbed pieces.Reversed magnetization seems to be associated with low intensity of magnetization because of incomplete removal of secondary oveΦrinting at 10 mT.
the analyses of all independent age constraints available, in this studythis is done primarily from nannofossil and planktonic foraminiferdata. We used the chronology of Berggren et al. (1985) as a foundationand correlated magnetozones with the GPTS in the manner that appearsmost consistent with both the magnetic and biostratigraphic data. Innaming the various polarity intervals, we used the familiar propernames for the Pliocene-Pleistocene magnetic chrons (Brunhes, Ma-
tuyama, Gauss, and Gilbert) and subchrons (e.g., Jaramillo and Oldu-vai). Recent radiometric studies using 39~40Ar (Baski et al., 1991) haverefined the calibration of the GPTS. Also, Hilgen (1991) recentlysuggested an astronomical calibration of the GPTS based on the tuningfrom sapropel paleoclimatic related cycles. These studies are still inprogress, and we prefer to stick with the GPTS proposed by Berggrenet al. (1985). When constructing a magnetostratigraphy for the two
466

MAGNETOSTRATIGRAPHY OF THE NORTH AOBA BASIN
B Declination (°) Inclination (°) Intensity (A/m)
0 90 180 270 360 -90 -60 -30 0 30 60 90 0.00 0.10 0.20 0.30 0.40740
745 -
750 -
£Q.ΦQ
755
760 -
765
D*
•
α
α
-
rQ
* *
α
α ** \ .*'
**/Λ
σ *
* V
it
/; *
...
' \
.p.
α .%α.
D*. D *
» * **
. . . .
*
L. V . t l .
i.
α
* ,* t<•» * f*
α ~
-
at*/α -
t* *
-
α
• *
€
*?
*t α
. i . . . . . i . . . .V770
Figure 10 (continued).
sites, results from the fine-grained lithologies (claystone, fine siltstone,and mudstone) were preferentially used because fine-grained sedi-ments acquire depositional remanent magnetization more efficientlythan coarser lithologies, and fine-grained sedimentary layers usuallyhave low permeability and are less susceptible to acquisition of sec-ondary chemical remanent magnetization. However, incomplete corerecovery and uncertain magnetizations resulting from drilling andviscous overprints impede a straightforward correlation of the ob-served polarity pattern to the GPTS. The paleomagnetic results previ-ously discussed are summarized in Figure 18 and Table 2.
• . D
* *Q
* *« ( G
*/ „>
, αα
• . ' . ; i v . ,A . I
The characteristic magnetizations observed in Holes 832A and833Aare of normal polarity. Biostratigraphic data indicate that the sedi-ment recovered from both holes are of late Pleistocene to Holocene(Zone N22) age. Thus, both paleomagnetic results and biostratigraphysuggest that these sediments were deposited within the Brunhes Chron(<0.78 Ma). Secular variations of geomagnetic field could not bedetected from these cores because of the drilling remagnetization. Thegeomagnetic excursions previously reported in the Brunhes Chron(Champion et al., 1988; Harrison, 1980) also were not observed atthese two holes.
467

X. ZHAO, P. ROPERCH, L.B. STOKKING
C Declination (°) Inclination (°) Intensity (A/m)
0 90 180 270 360 -90 -60 -30 0 30 60 90 0.00 0.10 0.20 0.30 0.40795
800 -
805
•Ba.ΦQ
810 -
815 -
820 -
-
r- ay
CU,
[.# <
α
- v
° **«*,» *
i".
Λ
.A
•• <
* - V
>
•
-
D*•
π «.D <
-
825
Figure 10 (continued).
>
.s
.y
^
,.:. '..*
. *π
?* α
Hole 832B
The Brunhes/Matuyama boundary was not identified in Hole 832B.The first evidence for a reverse magnetization occurs in Core 134-832B-26R. Samples between 318.1 and 529.2 mbsf have been assignedto the early Pleistocene based on the co-occurrence of Globorotαliαtruncαtulinoides and Globorotαliα tosαensis, but slumps and magneticoverprints prevented a reliable magnetostratigraphic interpretation.
The best magnetostratigraphic record was found in calcareousclaystone below the unconformity with the volcanic breccias at 702
mbsf (Fig. 19). The first appearance dating (FAD) of Globorotαliαtruncαtulinoides (1.9 Ma) at 716 mbsf and the last appearance dating(LAD) of D. brouweri (1.89 Ma) at 706 mbsf indicate that the reversalat 707 mbsf should correspond to the lower Olduvai boundary. LADof D. penαrαdiαtus (2.35 Ma) and LAD of D. surculus (2.42 Ma)occur between 718 and 725 mbsf and constrain the Gauss/Matuyamaboundary at 724.7 mbsf. The very short normal polarity interval from713.2 to 713.7 mbsf might represent the record of one of the Reunionevents. LAD of S. αbies (3.45 Ma) is found at 747.7 mbsf near theGilbert/Gauss boundary at about 748 mbsf, which is expected from
468

MAGNETOSTRATIGRAPHY OF THE NORTH AOBA BASIN
90
Paleomagnetic record - Cores 833B-38R and 833B-39R
Declination (°) Inclination (°) Intensity (A/m) Susceptibility (S1)
180 270 360 -90 -60 -30 0 30 60 90 0 0.2 0.4 0.6 0.8 1 0.00 0.01 0.02 0.03434
435
436
437
438
439
440
f 441
442
443
444
445
446
447
448
449
450
451
452 µ
Figure 11. Data obtained using the pass-through cryogenic magnetometer, characteristic magnetization, and susceptibility data from volcanic sandstone fromCores 134-833B-38R and-39R. ShaΦ contrasts in the susceptibility data correspond to interbedded layers of highly bioturbated chloritic claystone.
<*
i
: {
'-. Λ
-
- of'
-
|T
j ;
• • • 1 ;
-
• V"I*>*s
• J
• to '*
• 1
j !
- \ t
V
' " " i • • • • • i • • • • i
-
-
-
-
-
-
-
:
1 .
I ,
1 .
1
the interpretation of the paleomagnetic data. The absence of theplanktonic foraminifer Globorotalia crassaformis below 759 mbsfsuggests that sediments below that depth were deposited prior to 4.2Ma, because the FAD of Globorotalia crassaformis occurs generallyabove the Sidufjall Subchron. Because of poor core recovery and lesssatisfactory magnetic properties, the magnetostratigraphy is unknownfrom 770 to 795 mbsf, but the FAD of Globorotalia tumida tumida(5.2 Ma) at about 810 mbsf suggests that the reversal at 810 mbsfcorresponds to the boundary between Chron 5 and Gilbert.
Hole 833B
The first polarity reversal was found in Core 134-833B- 14R (202.8mbsf). Below this depth (to about 375 mbsf), the inclinations of discretesamples from Cores 134-833B-14R to -32R are predominantly posi-tive (Fig. 18); thus, the interval may correspond to a period of predomi-nantly reversed polarity (Maruyama Chron). Preliminary biostrati-graphic evidence also suggests that sediments from Cores 134-833B-
13R to -3IR are of early Pleistocene age. Thus, the first magneticpolarity shift from normal to reversed observed between Cores 134-833B-13R and -14R may represent the Brunhes/Matuyama boundary(-0.78 Ma). A transition from reversed to normal occurs in Core134-833B-18R and might record the upper limit of the JaramilloSubchron. Sediments in Core 134-833B-20R are fairly homogeneous,and a reversal from normal to reversed can be identified and maycorrespond to the lower Jaramillo boundary. The FAD of P. finalis (1.3Ma) is found at 311 mbsf and is usually midway between the Jaramilloand Olduvai subchrons. Because the magnetization is predominantlyreversed from 300 to 375 mbsf, the Olduvai Subchron (and the Plio-cene/Pleistocene boundary) should be found lower in the section, butoverprints in volcanic sandstone hide primary information. Based onthe FAD Globorotalia tosaensis (3.1 Ma) at 646 mbsf, the short,well-defined reversed interval from 660 to 670 mbsf might correspondto the Mammoth Subchron. The upper part of the reversed GilbertChron might be recorded from 700 to 755 mbsf. Mixed polaritieslinked to lithological variations and the presence of basaltic sills pre-
469

X. ZHAO, P. ROPERCH, L.B. STOKKING
NRM
-Y
VδmT
Q.10
— — 1 1
20
\
V 1
0.6 A/m-
-
30
\ 40
Nik**0"4 1
NRM
k 100°C
Y 140
^ \£270< °%320
— ( — I — I — I —
0.9 A/m
410
\ > Q 4 8 5 "
"VH I—-1
Inclination (°)
-90 -60 -30 0 30 60 90
Sample 134-833B-38R-2,
123-125 cm
-Y
Z
Sample 134-833B-38R-2,
128-130 cm
Figure 12. Example of AF and TH demagnetizations in the fine-grained
sandstone in Core 134-833B-38R. The apparent high stability of the magneti-
zation would imply a characteristic normal polarity in this core. Symbols and
conventions as in Figure 5.
NRM
-x
•B
Sample 134-833B-69R-7,
28-30 cm
Sample 134-833B-69R-7,
32-34 cm
Figure 13. AF and TH demagnetizations of two samples from a single piece
from Section 134-833B-69R-7. Symbols and conventions as in Figure 5.
Table 2. Paleomagnetic datums, Holes 832B and 833B.
Paleomagnetic datum
Hole 832BLower OlduvaiGauss-MatuyamaUpper KaenaLower KaenaUpper MammothLower MammothGilbert-GaussUpper CochitiLower CochitiUpper SidufjallLower SidufjallUpper ThveraLower ThveraChron 5- GilbertR-N3AN-R3A
Hole 833BBrunhes-MatuyamaUpper JaramilloLower JaramilloUpper MammothLower MammothGilbert-GaussUpper Cochiti
Age(Ma)
1.882.472.922.993.083.183.403.883.974.404.474.574.775.355.535.68
0.730.910.983.083.183.403.88
Depth(mbsf)
706.0-707.5724.5-725740.6-740.8741.2-741.4742.5-743.0744.0-745.0748.5-749.0753.0-753.5754.8-755.2760.1-760.4761.6-761.9763.2-763.4766.4-766.6808.5-809.5816.3-816.6819.3-819.6
196.0-202.8241.9-242.4260.8-262.2660.3-660.9667.5-668.0698.0-700.0756.5-757.1
580
600
620
640
660
680
700
720
740
760
780
800
820
- ' • • • • • π Φ
Bo
α α
, , , . , I , , , • ,1 , „ ..
1 I I I . ! I ! . ! ! _ ! _
m
α oa
aΦ n
Ip
,B Q
Figure 14. Inclination record from discrete samples in lithostratigraphic Unit
IV at Site 833.
470

MAGNETOSTRATIGRAPHY OF THE NORTH AOBA BASIN
Basaltic sills (Hole 833B)
800 •
850 - –
900 -–Q.Φ
Q
950 -–
MP,1000-
0.1 1 10 100 1000
Intensity of Remanent Magnetization at 5mT (A/m )
Figure 15. Intensity of the remanent magnetization in basaltic sills at Site 833.The 5-mT demagnetization level was chosen to reduce the dispersion producedby the drilling-induced overprint.
Cores 833B-81R, 82R, 83R
0 10 20 30 40Alternating field (mT)
Cores 833B-84R, 85R, 86R, 87R
180
10 20 30 40Alternating field (mT)
180
Figure 16. Variations of the normalized intensity with AF peak demagnetizationand stereographic projection of AF demagnetization paths from discrete samplesof the upper basaltic sills. Samples from Cores 833B-81R, -82R, and-83R haveshallower magnetization than those from Cores 833B-84R, -85R, -86R, and-87R, which is evidence for intrusion and cooling during a reversed polarityperiod. Open circles = negative inclinations; filled circles = positive inclinations.
1 Am
5mT
Sample 134-833B-91R-1,26-28 cm
Sample 134-833B-97R-3,20-22 cm
Figure 17. Typical demagnetization diagrams in the lower sills. Symbols andconventions as in Figure 5.
vented the interpretation of the magnetostratigraphic record in thelower part of the hole.
SEDIMENTATION RATE AND CORRELATIONS
The unconformity at 700 mbsf at Site 832 was interpreted asevidence for the uplift of Espiritu Santo Island in response to thecollision of the D'Entrecasteaux Zone (Collot, Greene, Stokking, etal., 1992). Over 700-m of sediment was thus deposited in less than 2m.y. while only about 100-m was deposited during the Pliocene. Theapparent sedimentation rate was as low as 1.5 cm/k.y. during middlePliocene time, although values for the magnetic susceptibility are stillhigh, from 0.005 to 0.01 S1.
In contrast, the interpretation of the paleomagnetic record from650 to about 750 mbsf at Site 833 implies a sedimentation rate ofabout 10 cm/k.y. during middle Pliocene time. On the other hand,there is no well-defined lithostratigraphic boundary at Site 833 thatcould correspond to the major unconformity recovered at Site 832.
However, the sedimentary record at Site 833 can be correlated withonshore geology from the nearby Maewo Island, summarized inMacfarlane et al. (1988). The upper Miocene to lower PlioceneMaewo Group (Bwatigau Formation), composed of submarine vol-canics, pillow lavas, and associated intrusions, was not reached at Site833. However, the Marino Formation at Maewo Island consists ofmassively bedded gray calcareous mudstone with intercalated coarserbeds. Intruding basaltic stocks and sills in the Marino Formationsuggest correlations with sediment recovered in the lower part of Hole833B from 750 to 1000 mbsf. The Nasawa Formation at MaewoIsland corresponds to the Pliocene-Pleistocene deposits. These shal-low-water deposits consist of white-to-yellow bedded sandstone andmudstone with minor volcanic constituents. In contrast, at Site 833,the magnetic susceptibility record clearly shows a large influx ofsediment of volcanic origin throughout the Pliocene. From 750 to 600mbsf, numerous magnetic susceptibility peaks up to 0.03 S1 correlatewith a gradual increase in the relative importance of volcanic influxesthat may indicate uplift and erosion on nearby volcanic islands. Thisincrease in the importance of sandstone layers during the Pliocenewithin lithostratigraphic Unit IV suggests a continuous sedimentationprocess with no unconformity at the transition from Unit IV to III. Anormal polarity magnetization is recorded by the sandstone at thetransition from litostratigraphic Unit IV to lithostratigraphic Unit III.Viscous overprint associated with late consolidation of the volcanicsandstone is our preferred interpretation for the origin of this mag-netization. Another interpretation might be that the sandstone was
471

X. ZHAO, P. ROPERCH, L.B. STOKKING
Site 832
Inclination (°)
-90 -60 -30 0 30 60 90
I
Site 833
Inclination (°)
-90 -60 -30 0 30 60 90
50
100
150
200
250
300
350
Revei
T3
ump
s
CO
cf
rtai
8
ion
s
to
1Φσ>(0
ε
cµCÜΘΛ
O
3
8•>
400
450
500
550
600
650
700
750
800
850
900
950
1000
Jaramillo
Mammoth
Cochiti
1100
Figure 18. Comparison of the inclination records from discrete samples at Sites 832 and 833 with magnetostratigraphic inteΦretation.
472

MAGNETOSTRATIGRAPHY OF THE NORTH AOBA BASIN
Geomagnetic Polaritytime-scale
age (Ma)
Hole 832B
I - 705 LAD D. brouweri (1.89 Ma)
-710
LAD D. pentaradiatus (2.35 Ma)LAD D. surculus (2.42 Ma)
735 LAD D. tamalis (2.65 Ma)
745 LAD S. abies (3.45 Ma)
810 FAD G. tumida (5.2 Ma)
Figure 19. Correlation of the magnetostratigraphic record at Site 832 from 702 to 825 mbsf with the geomagneticpolarity time-scale (Berggren et al, 1985). Black = normal polarity; white = reversed polarity; shading indicatesgaps in sampling or uncertain polarities. The key biostratigraphic datums used to constrain this correlation also areshown. LAD = last appearance datum; FAD = first appearance datum.
473

X. ZHAO, P. ROPERCH, L.B. STOKKING
deposited during a period of normal polarity. At Site 833, depositionduring the normal Gauss Chron during late Pliocene time cannot berejected. However, the normal Olduvai Subchron was not identified,and deposition of the volcanic sandstone during early Pleistocenetime correlates with the breccia unit of early Pleistocene age at Site832. This second hypothesis agrees better with the simultaneousuplifts of the backarc and frontal arc and the subsidence in the AobaBasin proposed by Collot et al. (1985).
The period from the middle Pliocene to early Pleistocene unfor-tunately was not accurately recorded in the magnetostratigraphicrecord in Hole 83 3B. The magnetostratigraphy cannot constrain thetiming of the tectonic events affecting the backarc during this period.
CONCLUSION
The magnetostratigraphy of the two drilled sites in the North AobaBasin was seriously limited by the absence of characteristic primaryremanent magnetizations in volcanic sandstone. At Site 832, slumpsand sedimentary disturbances have reset the initial depositional rema-nent magnetization above the stratigraphic unconformity marked bya thick breccia layer. However, an almost complete sequence ofPliocene and late Miocene age was recovered from 700 to 850 mbsf.The sedimentation rate was low during Pliocene time (-1.5 to 2cm/k.y.) compared to a very high accumulation rate (-35 cm/k.y.)during the Pleistocene (700 m in less than 2 Ma).
At Site 833, the Brunhes/Matuyama boundary and the JaramilloSubchron were identified from 200 to 260 mbsf, indicating an averageaccumulation rate of about 25 cm/k.y. during late Pleistocene time. ThePliocene/Pleistocene boundary was not identified at Site 833. Only themiddle Pliocene record from the Cochiti to the Kaena subchrons couldbe recognized at Site 833. The sedimentation rates during the Pliocenewere significantly higher at Site 833 (-10 cm/k.y.) than those at Site832, which implies that the detrital sediments probably were derivedfrom volcanism that occurred along the eastern belt.
ACKNOWLEDGMENTS
We thank the Ocean Drilling Program for inviting us to participatein Leg 134. The Leg 134 scientific party and technical staff toleratedour extensive sampling and provided valuable insights into the bio-stratigraphy and sedimentary and tectonic histories. Financial supportwas provided by a grant from the U.S. Science Advisory Committee.
REFERENCES*
Baski, A., Houghton, B., McWilliams, M., Tanaka, H., and Turner, G., 1991.What is the age of the Brunhes-Matuyama polarity transition? AGU1991Fall Meeting Abstract Vol., 135.
Berggren, W.A., Kent, D.V., and Van Couvering, J.A., 1985. The Neogene:Part 2. Neogene geochronology and chronostratigraphy. In Snelling, NJ.(Ed.), The Chronology of the Geological Record. Geol. Soc. LondonMem., 10:211-260.
Champion, D.E., Lanphere, M.A., and Kuntz, M.A., 1988. Evidence for a newgeomagnetic reversal from lava flows in Idaho: discussion of short polarityreversals in the Brunhes and Late Matuyama polarity chrons. J. Geophys.Res., 93:11667-11681.
Collot, J.-Y, Daniel, J., and Burne, R.V., 1985. Recent tectonics associatedwith the subduction/collision of the d'Entrecasteaux zone in the centralNew Hebrides. Tectonophysics, 112:325-356.
Collot, J.-Y., Greene, H.G., Stokking, L.B., et al., 1992. Proc. ODP, Init. Repts.,134: College Station, TX (Ocean Drilling Program).
Fisher, M.A., Falvey, D.A., and Smith, G.L., 1988. Seismic stratigraphy of thesummit basins of the New Hebrides island arc. In Greene, H.G., and Wong,F.L. (Eds.), Geology and Offshore Resources of Pacific Island Arcs—Vanuatu Region. Circum-Pac. Counc. Energy Miner. Resour., Earth Sci.Sen, 8:201-223.
Greene, H.G., and Johnson, D.P., 1988. Geology of the Central Basin regionof the New Hebrides Arc inferred from single-channel seismic-reflectiondata. In Greene, H.G., and Wong, F.L. (Eds.), Geology and OffshoreResources of Pacific Island Arcs—Vanuatu Region. Circum-Pac. Counc.Energy Miner. Resour., Earth Sci. Ser., 8:177-200.
Harrison, C.G.A., 1980. Secular variation and excursions of the earuYs mag-netic field. J. Geophys. Res., 85:3511-3522.
Hilgen, FJ., 1991. Astronomical calibration of Gauss to Matuyama sapropelsin the Mediterranean and implication for the Geomagnetic Polarity TimeScale. Earth Planet. Sci. Lett., 104:226-244.
Kirschvink, J.L., 1980. The least-squares line and plane and analysis ofpalaeomagnetic data. Geophys. J. R. Astron. Soc, 62:699-718.
Macfarlane, A., Carney, J.N., Crawford, A.J., and Greene, H.G., 1988. Vanu-atu—a review of the onshore geology. In Greene, H.G., and Wong, F.L.(Eds.), Geology and Offshore Resources of Pacific Island Arcs—VanuatuRegion. Circum-Pac. Counc. Energy Miner. Resour., Earth Sci. Ser.,8:45-91.
Schneider, D.A., and Kent, D.V., 1990. Paleomagnetism of Leg 115 sediments:implications for Neogene magnetostratigraphy and paleolatitude of theReunion hotspot. In Duncan, R.A., Backman, J., Peterson, L.C., et al.,Proc. ODP, Sci. Results, 115: College Station, TX (Ocean Drilling Pro-gram), 717-736.
Zijderveld, J.D.A., 1967. AC demagnetization of rocks: analysis of results. InCollinson, D.W., Creer, K.M., and Runcorn, S.K. (Eds.), Methods inPalaeomagnetism: New York (Elsevier), 254-286.
Abbreviations for names of organizations and publications in ODPreference lists followthe style given in Chemical Abstracts Service Source Index (published by AmericanChemical Society).
Date of initial receipt: 9 May 1992Date of acceptance: 16 June 1993Ms 134SR-025
474