magnetostratigraphy of the columbia river basalt
TRANSCRIPT
RHO-BWI-C-110
Magnetostratigraphy of theColumbia River Basalt,Pasco Basin and Vicinity,Washington
D.R. Van AlstineS.L. Gillett
Prepared for the United StatesDepartment of EnergyUnder Contract DE-AC06-77RL01030
Rockwell International
Rockwell Hanford OperationsEnergy Systems GroupRichland, WA 99352

RHO-BWI-C-110
iii
ABSTRACT
A paleomagnetic study was performed on about 500 surface and subsurface
samples of the Columbia River Basalt Group from the Pasco Basin and vicinity,
southeastern Washington. This study also included reanalysis and integration of
paleomagnetic data collected during three previous paleomagnetic investigations.
Emphasis was placed on testing and extending the magnetostratigraphic interpretation
of the Columbia River basalts beneath the Hanford Site.
A consistent magnetostratigraphy of Grande Ronde Basalt emerges from the
surface and core hole paleomagnetic data. A change from reversed polarity (below) to
normal polarity (above) occurs at a depth of 0,500 ft below the Vantage horizon. This
polarity change is the R2-N2 contact, previously mapped in surface outcrops on the
Columbia Plateau. Within the two magnetozones of the upper Grande Ronde Basalt,
between-flow inclination differences of up to 60° probably reflect the Miocene
geomagnetic secular variation. These distinctive changes in paleoinclination permit
subdivision of the Grande Ronde-R2 magnetozone into three magnetic intervals
(designated GR-R2α through γ) and of the Grande Ronde-N2 magnetozone into five
magnetic intervals (GR-N2α through ε).
The Wanapum and Saddle Mountains Basalts contain at least four
magnetozones and large variations in magnetic susceptibility as well as in inclination.
Thus, the potential for using paleomagnetism to correlate Wanapum and Saddle
Mountains Basalts is just as promising as for the Grande Ronde Basalt.
In the Pasco Basin core holes, the consistency of paleomagnetic directions at
equivalent stratigraphic horizons indicates that these holes penetrated few if any dikes.
RHO-BWI-C-110
v
CONTENTS
Introduction ..............................................................................................................1
Sample Collection ...................................................................................................1 Surface Exposures..........................................................................................1 Core Holes .....................................................................................................4
Laboratory Measurements ......................................................................................5
Data Analysis ..........................................................................................................7
Results ....................................................................................................................8
Saddle Mountains Basalt ................................................................................9 Elephant Mountain Member...................................................................9 Pomona Member ................................................................................11 Esquatzel Member ...............................................................................13 Asotin Member ....................................................................................13 Wilbur Creek Member .........................................................................16 Umatilla Member .................................................................................16
Wanapum Basalt ..........................................................................................18 Priest Rapids Member .........................................................................18 Roza Member ......................................................................................20 Frenchman Springs Member ...............................................................20
Grande Ronde Basalt ...................................................................................21 Surface Exposures ..............................................................................21 Core Hole DC-7....................................................................................23 Other Core Holes ................................................................................28
Discussion..............................................................................................................32
Drilling-Induced Remagnetization In Core Holes ........................................34
Magnetostratigraphy of the Columbia River Basalt .....................................38 Saddle Mountains and Wanapum Basalts ..........................................38 Grande Ronde Basalt .........................................................................41
Additional Comments The Problem of Structural Corrections ........................................................46 The Question of Dikes in Core Holes ..........................................................48 Discordance Between Fluxgate Orientation Lines and
NRM Declinations ......................................................................................50
Conclusions ...........................................................................................................54
References ............................................................................................................55
FIGURES:
1. Stratigraphy of Columbia River Basalt Group .........................................2 2. Paleomagnetic Site Locations ..................................................................3 3. Remanent Magnetization Direction Diagrams: Elephant Mountain Flows ......................................................................10

RHO-BWI-C-110
vi
FIGURES (Contd): 4. Remanent Magnetization Direction Diagrams: Pomona Members...................................................................................12 5. Remanent Magnetization Direction Diagrams: Esquatzel Member. .................................................................................14 6. Remanent Magnetization Direction Diagrams: Asotin and Wilbur Creek Members ........................................................15 7. Remanent Magnetization Direction Diagrams: Sillusi and Umatilla Flows.......................................................................17 8. Remanent Magnetization Direction Diagrams: Priest Rapids, Sentinel Gap, Sand Hollow, and Ginkgo Flows ..................................................................................19 9. Remanent Magnetization Direction Diagrams: Grande Ronde Flows..............................................................................22 10. Log of Paleomagnetic Inclination and Magnetic Susceptibility of Samples from Core Hole DC-7 ...................................24 11. Vector Demagnetization Diagrams of Three Samples from Flow GR-33 of DC-7 ......................................................................26 12. Vector Demagnetization Diagrams of Two Samples from Flow GR-36 of DC-7 ...............................................................................27 13. Magnetostratigraphy of the Grande Ronde Basalt, Pasco Basin ............................................................................................30 14. Vector Demagnetization Diagrams of Three Samples from Flow GR-16 of DC-6 ......................................................................33 15. Log of Inclination and Intensity of Natural Remanent Magnetization Vectors from Core Hole DH-4 ........................................35 16. Log of Inclination and Intensity of Natural Remanent Magnetization Vectors from Core Holes DC-7 and DC-8 .....................37 17. Composite Magnetostratigraphic Correlation Chart for Wanapum and Saddle Mountains Basalts, Both Surface Sites and Core Holes. . ..........................................................................39 18. Mean Site Poles for Pomona Flows Before and After Structural Correction ..............................................................................47 19. Remanent Magnetization Direction Diagrams from Core Hole DC-7.......................................................................................52 20. Natural Remanent Magnetization Direction Diagrams from Core Holes DH-4, DC-4, and DH-5................................................53

RHO-BWI-C-110
1
INTRODUCTION
The Columbia River Basalt Group beneath the Hanford Site in the Pasco Basin,
Washington is being evaluated for its suitability for underground storage of radioactive
waste (e.g., Myers, Price, and others, 1979; BWIP, 1980). Stratigraphic correlation
among various units of this thick basaltic section are often difficult to make because
many of the flows are chemically and physically similar. Recent paleomagnetic
investigations by Coe and others (1978), Beck and others (1978), and Packer and Petty
(1979) have demonstrated that certain flows in this sequence can be correlated on the
basis of paleomagnetic directions. The purpose of the present investigation is to
strengthen magnetostratigraphic correlations within the Columbia River Basalt Group
(Figure 1), particularly those involving the upper part of the Grande Ronde Basalt.
This study involved paleomagnetic analysis of 519 samples obtained from 68
flows. These samples were about equally divided between outcrops and core holes,
including core from the deepening of borehole DC-7, which was being investigated
paleomagnetically for the first time. Emphasis was placed on integrating the surface and
subsurface data to test and extend the magnetostratigraphy of the Pasco Basin. A major
part of this effort involved merging this new data set with those from previous workers.
SAMPLE COLLECTION
SURFACE EXPOSURES
Twenty-nine surface exposures of Columbia River basalt were sampled over an
area of 5,800 mi2 (Figure 2). These included 20 sites in Saddle Mountains Basalt, four
sites in Wanapum Basalt, and five sites in Grande Ronde Basalt. Design of the project
was made by P. E. Long and S. P. Reidel, who also provided site locations and
structural attitudes. Field sampling was conducted by D. R. Van Alstine, S. W. Bogue,
and M. F. Linker of Sierra Geophysics, and M. Hagood and N. J. Davidson of Rockwell
Hanford Operations, over the period June 11 through 22, 1980.


RHO-BWI-C-110
4
Eight samples were collected from a single flow at each site. The samples were
obtained using a portable gasoline-powered drill fitted with a diamond bit. To avoid
possible secondary magnetizations, samples were obtained away from flow tops,
bottoms, or fractures. The samples, which were 3 to 5 in. long, were oriented using both
a solar compass and a Brunton compass affixed to a 1.5-ft-long brass sleeve. Wherever
possible, magnetic compass measurements were checked by sighting on distant
landmarks. For all samples, the sun compass measurements were judged to be more
accurate and were used in all paleomagnetic calculations. As in the study by Beck and
others (1978), the deviation between solar and magnetic compass measurements was
typically a few degrees, although large (>10°); probably lightning-produced deviations
were also encountered.
CORE HOLES
Thirty-nine flows were sampled from the continuous core obtained from seven
different core holes penetrating Columbia River basalts in the Pasco Basin. These
included 30 flows in Grande Ronde Basalt (22 flows in DC-7, five flows in DC-6, and one
flow in each of DH-4, DH-5, and DDH-3); seven flows in Saddle Mountains Basalt (two in
DC-8, one in DB-7, two in DH-5, and two in DH-4); and two flows in Wanapum Basalt
(both from the Roza Member in DH-5). Core hole sampling was conducted between
June 20 and 25, 1980 by D. R. Van Alstine and S. W. Bogue of Sierra Geophysics,
assisted by R. D. Landon, N. J. Davidson, and M. Hagood of Rockwell Hanford
Operations.
Generally, eight samples per flow were collected from DC-7 and seven samples
per flow from the six other core holes. As with the surface outcrops, flow tops, bottoms,
and fracture zones were avoided. An estimate was made as to whether samples were
located in entablature or colonnade to check for possible correlations between flow
morphology and paleomagnetic properties.
Samples were collected at the core storage warehouse using a drill press fitted
with a water-cooled diamond bit. Before drilling, each core segment was marked with its
drilled depth and up direction. Pieces
RHO-BWI-C-110
5
of broken core were fitted together wherever possible, and a common axial line was
scribed on each segment to preserve the relative orientation of the pieces. This
reference line was parallel to the fluxgate orientation line, if that had been marked. (The
fluxgate orientation line is an attempt to define a consistent orientation line using a
fluxgate magnetometer.) No fluxgate orientation line had been determined for the DC-7
core.
LABORATORY MEASUREMENTS
All laboratory work was done in the Sierra Geophysics paleomagnetics
laboratory. The core samples were first cut into cylindrical specimens 1.0 in. in length
using a rock saw. One specimen was cut from each sample. The specimens were
taken from the back (least weathered) part of the surface-exposure samples and from
the middle of subsurface samples.
All measurements of natural remanent magnetization (NRM) were made on a
three-axis, 2.5-in.-access superconducting (SQUID) magnetometer manufactured by
Superconducting Technology, Inc. This instrument has a dynamic range between 10-8
and 10+1 emu. The magnetometer is interfaced to a PRIME 550 computer, which
permits real-time computation of magnetic directions, intensities, induced/remanent
ratios, uniformity of magnetization parameters, structural corrections, and virtual
geomagnetic poles. All data pertaining to the measurement are printed out,
simultaneously stored on magnetic disk, and later archived onto magnetic tape, making
the complete data set readily accessible to future investigators.
Laboratory analysis consisted of measuring the bulk magnetic susceptibility,
NRM, and the progressive alternating field (AF) or thermal demagnetization behavior of
all samples from each flow.
Magnetic susceptibilities were measured using a low-field (0.5 Oe) bridge
manufactured by Bison Instrument Company. The susceptibility values were periodically
checked on the cryogenic magnetometer.

RHO-BWI-C-110
6
Alternating-field demagnetization was performed using a Schonstedt Model
GSD-1 specimen demagnetizer which provides peak fields up to 1,000 Oe (100 mT).
Each specimen was demagnetized around three orthogonal axes; the order of the axes
around which the specimen was demagnetized was changed from one demagnetization
step to the next to minimize any effects from acquisition of anhysteretic remanent
magnetization (ARM). In addition, this procedure precludes the acquisition of rotational
remanent magnetization (RRM), because specimens are not rotated or tumbled.
To complement the AF demagnetization studies, thermal demagnetization was
conducted to investigate the blocking temperature spectra of the NRM of Grande Ronde
Basalts. Thermal demagnetization was performed on 50 samples using a Schonstedt
thermal demagnetizer modified for insertion of a thermocouple probe to monitor the
temperature of each sample.
A minimum of six demagnetization steps (either AF or thermal) were performed
on every sample from each flow. The peak alternating fields at these six steps were
between 25 and 500 Oe, and the peak temperatures were between 150° and 600°C. If
the characteristic magnetization direction had not been isolated by 500 Oe, additional AF
steps were performed up to 800 Oe. For several samples, combined thermal-after-AF
demagnetization experiments were conducted.
All measurements and all demagnetization experiments were carried out in a 6-ft
by 6-ft magnetically shielded room, within which the ambient magnetic field is about 75
gammas (nT). This reduces the contribution of any viscous components of remanent
magnetization (VRM) to the total NRM of the specimen and results in smoother vector
demagnetization diagrams (Zijderveld, 1967).

RHO-BWI-C-110
7
DATA ANALYSIS
For each sample, vector analysis was performed to identify the multiple
components of magnetization that might be present. This is most accurately
accomplished by fitting least-squares lines to segments of the vector demagnetization
diagrams that are linear in three-space. The advantage of this technique, which we
have refined after a method described by Kirschvink (1980), is that scatter of directions
due to effects of VRM or ARM are minimized in the final computation of the mean
direction for a flow.
The component with the highest coercivity or blocking temperature was
considered to be the characteristic magnetization (Zijderveld, 1967) of the sample. The
characteristic magnetization directions were used to compute mean paleomagnetic
directions for each flow by a variety of techniques.
For surface flows, where fully oriented samples are obtained, the statistics of
Fisher (1953) were calculated; the statistical uncertainty in the estimated mean is
represented by the half-angle of the cone of 95% confidence, a95 (e.g., McElhinny, 1973).
In addition to Fisher statistics, "moment of inertia" statistics (Dimroth-Watson and
Bingham cf. Mardia, 1972) were computed for surface flows. These statistics have only
recently been applied in paleomagnetism (e.g., Onstott, 1980), and they offer
advantages over Fisher statistics in certain instances.
For core hole samples, where only the paleomagnetic inclination has been
recovered, Fisher statistics cannot be computed by traditional means. Thus, in past
studies of the Pasco Basin core holes, only arithmetic mean inclinations were
determined, together with their standard deviations. This made it difficult to compare
surface and core hole paleoinclination data, because surface α95 values (which measure
the uncertainty in the estimated mean inclination) were being compared with core hole
standard deviations of mean inclinations (which measure the scatter of inclination
values).

RHO-BWI-C-110
8
Using a technique described by Kono (1980), it is now possible to calculate the
Fisher statistics of inclination-only data. In the present investigation, Kono's method has
been used in computing mean directions from the subsurface flows. Kono's technique
has also been employed to recompute mean flow statistics for each flow sampled in the
previous core hole studies (Beck and others, 1978; Packer and Petty, 1979). This
results in a homogeneous data set that can be directly compared to the statistics from
surface flows.
RESULTS
The results from this paleomagnetic investigation are summarized and
interpreted below; they are presented in detail in separate data volumes which are
available in the library of the Basalt Waste Isolation Project. The data volumes present,
in both tabulated and graphical form, the complete demagnetization history of each of
the 519 samples analyzed in this study. The tables list the magnetization directions
(before and after structural correction), corresponding virtual geomagnetic poles,
intensities as a function of demagnetization step, subtracted vectors between
demagnetization steps, bulk magnetic susceptibilities, and output from the statistical
analysis programs. The graphs show vector demagnetization information in the form of
vector demagnetization diagrams, stereonet plots of directional change upon
demagnetization, and normalized intensity versus demagnetization level.
For subsurface samples, color plots are also presented showing paleomagnetic
results as a function of depth below the surface. These plots include NRM and cleaned
paleomagnetic inclinations, NRM intensities, magnetic susceptibilities, and mean flow
inclinations with their α95 values.

RHO-BWI-C-110
9
SADDLE MOUNTAINS BASALT
Elephant Mountain Member
Forty-one samples were obtained at five sites in the Elephant Mountain Member.
Nearly all samples had NRM directions dominated by a normal-polarity VRM aligned
approximately with the present axial dipole field. Upon progressive AF demagnetization,
however, most directions moved toward a reversed-polarity inclination in the southeast
quadrant (Figure 3). Fewer than half (46%) of the samples actually achieved stable
reversed-polarity endpoints on vector demagnetization diagrams. One site (EM1C3)
was too overprinted with the normal-polarity component to permit calculation of a
characteristic magnetization direction. At another site (EM2D2), three of the samples
achieved stable reversed-polarity endpoints, but only after removing over 96% of the
NRM intensity. Samples at site EM2C4 best exhibited the reversed-polarity
characteristic magnetization of this flow; 75% of these samples achieved stable end-
points after cleaning to about 300 Oe.
A mean direction (declination D = 133.2°, inclination I = -39.2°, α95 = 8.6°) has
been computed giving unit weight to the four Elephant Mountain sites from which
reversed-polarity directions could be isolated. This inclination is quite close to that
obtained from core hole data.
Two Elephant Mountain flows were sampled by Packer and Petty (1979) in DDH-
3, and one Elephant Mountain flow was sampled in this study from DB-7. Packer and
Petty (1979) reported a reversed inclination of -39° for "EMI" and were unable to isolate
a characteristic magnetization for "EM2," possibly because none of the samples were AF
demagnetized higher than 125 Oe. Since their "EMI" samples were obtained
stratigraphically higher than "EM2," their reported "EMI" inclination really applies to the
upper (EMIT) Elephant Mountain flow. The seven samples from EM1 of Packer and
Petty (1979) were combined with the seven samples of this study to yield a mean
subsurface paleoinclination of -37.5° (α95 = 6.4°).

RHO-BWI-C-110
11
Based on the results from surface outcrops and core holes, it seems certain that
both Elephant Mountain flows have reversed-polarity characteristic magnetizations.
Both flows, however, tend to be heavily overprinted with normal-polarity VRM. This
probably accounts for the normal polarity reported from fluxgate magnetometer
measurements of the upper Elephant Mountain flow.
Pomona Member
Thirty-nine samples were obtained at five sites in the Pomona Member. All of
these samples had negative-inclination directions at NRM and throughout progressive
AF demagnetization (Figure 4). Most samples exhibited a single component of
magnetization with a median destructive field (MDF; defined as the peak AF field
required to reduce the NRM intensity by one-half) between 300 and 600 Oe. At site
PF1, however, the MDF was anomalously low, between 75 and 150 Oe.
The Pomona flows yield some of the best groupings of paleomagnetic directions
of any of the Columbia River basalt flows; Fisherian concentration parameters, k, ranged
between 250 and 1,200. Even with eight samples per site, the largest α95 value obtained
for any site was 3.5°. Curiously, the mean directions computed for all Pomona sites,
both before and after structural correction, are statistically distinct from one another.
This problem, which is not unique to the Pomona flows, will be discussed at greater
length in a later section of this report.
A mean Pomona direction (D = 193.5°, I = -52.7°, α95 = 9.5°) was computed
giving unit weight to each of the five surface site means. This paleoinclination derived
from surface flows compares well with the subsurface data of Packer and Petty (1979)
from DC-11. Mean inclinations computed separately for each of two Pomona flows in
DC-11 are nearly identical (-52.5° and -50.1°). Giving unit weight to each of the 14
samples from the DC-11 Pomona flows yields a mean subsurface Pomona inclination of
-51.3° (α95 = 2.8°).


RHO-BWI-C-110
13
Esquatzel Member
Thirty-two samples were obtained at four sites in the Esquatzel Member. At
three of these sites, all samples achieved stable normal-polarity endpoint directions
(Figure 5). Most of these samples (particularly at sites EC6A and EC6B) contained only
a single component of magnetization with an MDF of about 300 Oe. At site ER,
however, five of the eight samples exhibited multiple components of magnetization with
overlapping stability spectra. Thus, a reliable characteristic magnetization direction
could not be determined for site EF1.
The other three Esquatzel sites yielded well-grouped paleomagnetic directions
with α95 < 3.0°. Although the directions from sites EC6A and EC6B are nearly identical,
that from site EF2 is statistically distinct, both before and after structural correction.
A mean Esquatzel direction (D = 348.4°, I = +64.8°, α95 = 8.6°) was computed
giving unit weight to each of the three surface sites. This inclination is consistent with
Esquatzel(?) paleomagnetic directions determined by Packer and Petty (1979) from DB-
1. A mean inclination has been recomputed from seven samples of the upper flow (I =
+66.2°, (α95 = 6.6°) and from five samples of the lower flow (I = +78.3°, α95 = 20.6°).
Asotin Member
Eight samples were obtained at one site (A2C1) known to be in the Asotin
Member. All of these samples had NRM directions with shallow positive inclinations.
After progressive AF demagnetization, six of these directions achieved stable endpoints,
tightly clustered about a mean at D = 335.2°, I = +67.4°, a95 = 2.6°, after structural
correction (Figure 6).
Three Asotin flows were sampled from subsurface core. In DH-4, where the
flows dip 2° to the southwest, an Asotin (Huntzinger) flow was sampled by Packer and
Petty (1979) and resampled during this study. Combining results from both studies
yields a mean inclination of +69.0° (N = 20, α95 = 2.3°). In addition, two Asotin flows
were sampled during this study in DH-5, in which the flows dip 9° to the south. These
flows


RHO-BWI-C-110
16
yielded a structurally corrected mean inclination of +78.8° (N = 7, α95 = 8.1°) and +80.7°
(N = 7, a95 = 2.9°), respectively (+70.6° and +72.9° before correction).
An additional eight samples were collected in surface outcrop from a flow which,
on the basis of recent field mapping by S. P. Reidel, is part of the Asotin Member or
older. Its chemical composition suggests that it is probably the Asotin Member, but wide
variation in Asotin chemical composition makes it impossible to distinguish clearly from
older flows based on chemical composition (Reidel and Fecht, 1981). All eight samples
have a steep, positive-inclination characteristic magnetization with a mean direction of D
= 23.7°, I = +80.6°, α95 = 4.5° (Figure 6). Since the Asotin is the only member of the
Saddle Mountains or Wanapum Basalts with such a steep inclination, this flow is
probably Asotin and has been designated A?C5 in this report.
Wilbur Creek Member
Eight samples were collected at one site from the Wilbur Creek Member. Six of
these contain only a single, normal-polarity magnetization with a structurally corrected
mean at D = 345.7°, I = +72.1°, α95 = 3.4° (Figure 6). This component has a high MDF,
averaging about 500 Oe. The other two samples contain a second component, which
may be a lightning-produced isothermal remanent magnetization (IRM) in this ridge-crest
exposure.
A Wilbur Creek (Wahluke) flow was sampled in DH-4 by Packer and Petty (1979)
and resampled in this study. Combining results from the two studies yields a structurally
corrected mean inclination of +66.1° (N = 14, α95 = 3.2°). This inclination is 6° shallower
than the inclination found at the single surface site.
Umatilla Member
Twenty-four samples were collected at three sites in the Umatilla Member.
Nearly all of these exhibited a single, normal-polarity magnetization with an MDF of 150
to 200 Oe (Figure 7). At locality E, which is


RHO-BWI-C-110
18
the type locality of the Umatilla Member, eight samples were collected from the Umatilla
flow (site UE1), and eight from the overlying Sillusi flow (site SE2). After AF
demagnetization, these two flows have well grouped directions with a mean only 2° apart
(UE1: D = 324.3°, I = +31.7°, α95 = 3.4°; SE2: D = 321.7°, I = +32.2°, α95 = 2.6°). This
suggests that the Umatilla and Sillusi flows cooled at about the same time.
Magnetization directions from the eight Umatilla samples at site UF1 are not well
grouped (k = 30), and their structurally corrected mean (D = 354.6°, I = +52.0°, α95 =
11.2°) deviates significantly from that of the locality E flows. This undoubtedly reflects
the poor outcrop at locality UF1, where only small, probably rotated, blocks are exposed.
The paleomagnetism of the Umatilla has been studied fairly extensively in the
subsurface. Two Umatilla flows were sampled by Packer and Petty (1979) from DDH-3
and two were sampled in this study from DC-8. The DDH-3 flows yielded mean
stratigraphic inclinations of +50.8° (N = 7, α95 = 1.1°) and +53.0° (N = 3, α95 = 4.3°),
compared with +41.0° (N = 6, α95 = 6.1°) and +40.1° (N = 5, α95 = 12.0°) from DC-8. The
core hole inclination of +40° to +50° is more consistent with the uncorrected surface
mean inclination of +41° from the locality E sites, suggesting that the structural attitudes
used to correct the data may be in error.
WANAPUM BASALT
Priest Rapids Member
The eight paleomagnetic samples collected from the Priest Rapids Member, Lolo
flow at site PRC 1 exhibited only reversed-polarity directions, well grouped about a mean
at D = 190.5°, I = -64.9°, α95 = 2.8° (Figure 8). This is entirely consistent with results
from DC-2, where Packer and Petty (1979) sampled two flows (WI and W2) in the strati-
graphic position of the Priest Rapids that gave inclinations of -60.5° (N = 7, α95 = 4.5°)
and -65.3° (N = 7, α95 = 3.8°), respectively.


RHO-BWI-C-110
20
Roza Member
Although the Roza Member was not sampled at the surface during this study, it
was sampled in two flows from DH-5. These flows yielded structurally corrected mean
inclinations of +3.3° (N = 7, α95 = 5.3°) and +7.5° (N = 5, α95 = 5.2°). The Roza was also
sampled in DC-2 by Packer and Petty (1979). Of nine samples obtained in that study,
only five yielded stable directions on vector demagnetization diagrams; these five
samples have a mean inclination of -1.9° (α95 = 9.0°). The Roza has the shallowest
paleomagnetic inclination of any flow sampled from the Saddle Mountains, Wanapum, or
Grande Ronde Basalts.
Frenchman Springs Member
Twenty-four samples were collected at three sites in the Frenchman Springs
Member. Five of eight samples from the Sentinel Gap flow at site SGA3 contain only a
single component of magnetization. The other three samples apparently contain a
lightning-produced IRM, since their NRM directions are scattered and their intensities
are anomalously high. The six samples from which stable endpoint directions were
isolated had a structurally corrected mean of D = 5.0°, I = +62.8°, α95 = 2.2° (Figure 8).
Paleomagnetic results from the Sand Hollow (site SHA1) and Ginkgo (site GA2)
flows were nearly identical, with each flow exhibiting two components of magnetization.
One component, removed below 300 Oe, had a steep northerly direction, probably
reflecting the present axial dipole field direction. The other component, isolated at higher
demagnetization steps in all samples, had a structurally corrected mean of D = 144.7°, I
= +39.8°, α95 = 3.6° for the Sand Hollow and D = 146.1°, I = +42.1°, α95 = 2.6° for the
Ginkgo (Figure 8). Sheriff and Bentley (1980) reported a nearly identical direction of D =
147°, I = +41°, a95 = 4.5° from six sites in Ginkgo flows near Vantage. This direction,
which is about 90° from the Miocene axial dipole field direction, probably records part of
a geomagnetic reversal or excursion.

RHO-BWI-C-110
21
GRANDE RONDE BASALT
Surface Exposures
Forty samples of Grande Ronde Basalt were obtained at three localities on the
Columbia River north of Vantage. Three flows were sampled at Crescent Bar, one flow
at Quilomene Bay, and one flow at Tekison Bay. The flows at all three localities are
essentially flat lying, so no structural corrections were applied to the paleomagnetic
directions.
The goal of the sampling at Crescent Bar was to determine paleomagnetic
directions of flows directly above and below the magnesium (Mg) horizon. This horizon
is a prominent chemical marker in the upper Grande Ronde Basalt, dividing low-Mg
flows of the Schwana sequence below from higher Mg flows of the Sentinel Bluffs
sequence above (Myers, Price, and others, 1979). In the Pasco Basin, the flow directly
underlying the Mg horizon is, in all but one core hole, the Umtanum flow. This flow is
recognized by its distinctive chemistry relative to other Grande Ronde flows that lie
stratigraphically close to the Mg horizon. The Mg horizon coincides with a
magnetostratigraphic marker, a change from high paleomagnetic inclination above to
shallow inclination below (cf. Packer and Petty, 1979). At Crescent Bar, the Mg horizon
occurs at the top of the flow sampled at site CB/GR-6.
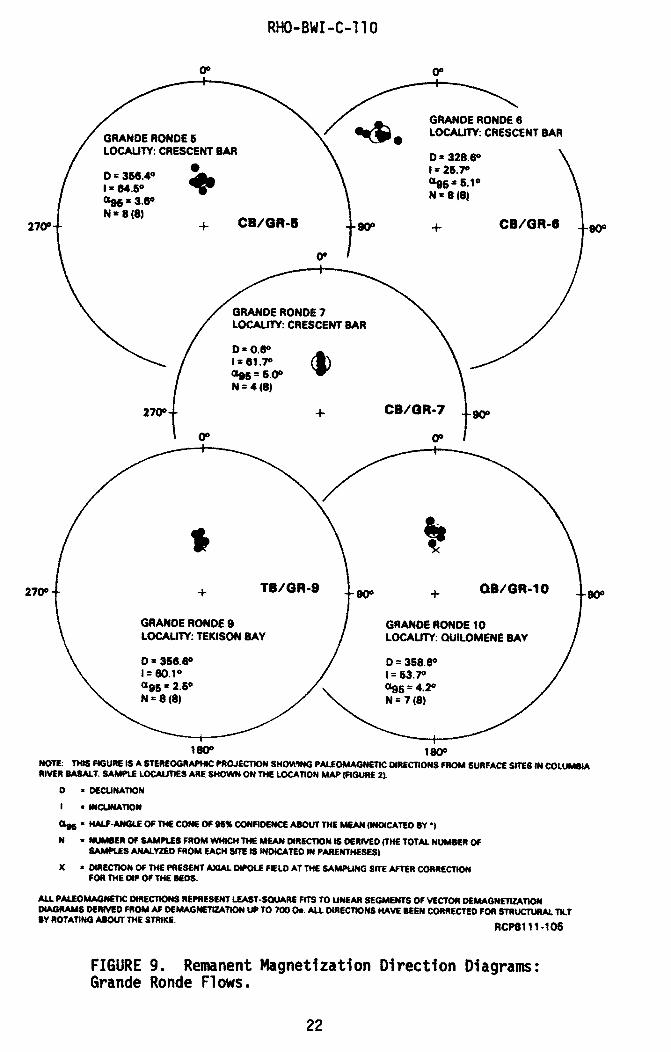
In the highest flow sampled at Crescent Bar (site CB/GR-5), all eight samples
contained a single component of magnetization with an MDF of about 150 Oe and a
mean at D = 356.4°, I = +64.5°, α95 = 3.6° (Figure 9).
The underlying flow (site CB/GR-6) contains two components of magnetization
with partly overlapping stability spectra. During progressive AF demagnetization, the
magnetization directions consistently migrate away from the present axial dipole field
direction toward a shallow-inclination direction in the northwest quadrant. None of these
directions can confidently be said to have achieved a stable endpoint even at the highest
demagnetization step of 700 Oe. Thus, the +26° inclination calculated for this flow (D =
328.6°, I = +25.7°, α95 - 5.1°) should be regarded as an upper limit.

RHO-BWI-C-110
23
Of the eight samples from the lowest flow sampled at Crescent Bar (site CB/GR-
7), four contain a single component of magnetization with an MDF of 200 to 400 Oe and
a mean at D = 0.6°, I = +61.7°, α95 = 5.0°. The other four samples from this site contain
scattered but stable components that mask any characteristic magnetization of the flow.
From these results, it appears that the magnetostratigraphic interval of shallow
inclination below the Mg horizon is restricted to a single flow at Crescent Bar.
All eight samples collected from the single flow at Tekison Bay (site TB/GR-9)
contain a single component of magnetization with an MDF between 150 and 250 Oe and
a mean at D = 356.6°, I = +60.1°, α95 = 2.5° (Figure 9). In the flow sampled at
Quilomene Bay (site QB/GR-10), seven of the eight samples contain a single component
with an MDF of 200 Oe and a mean at D = 358.6°, I = +53.7°, α95 = 4.2° (Figure 9).
These results indicate that the flows sampled at Tekison and Quilomene Bays both lie
above the R2-N2 magnetic polarity transition, which separates reversed from normal
polarity flows in the upper Grande Ronde sequence.
Core Hole DC-7
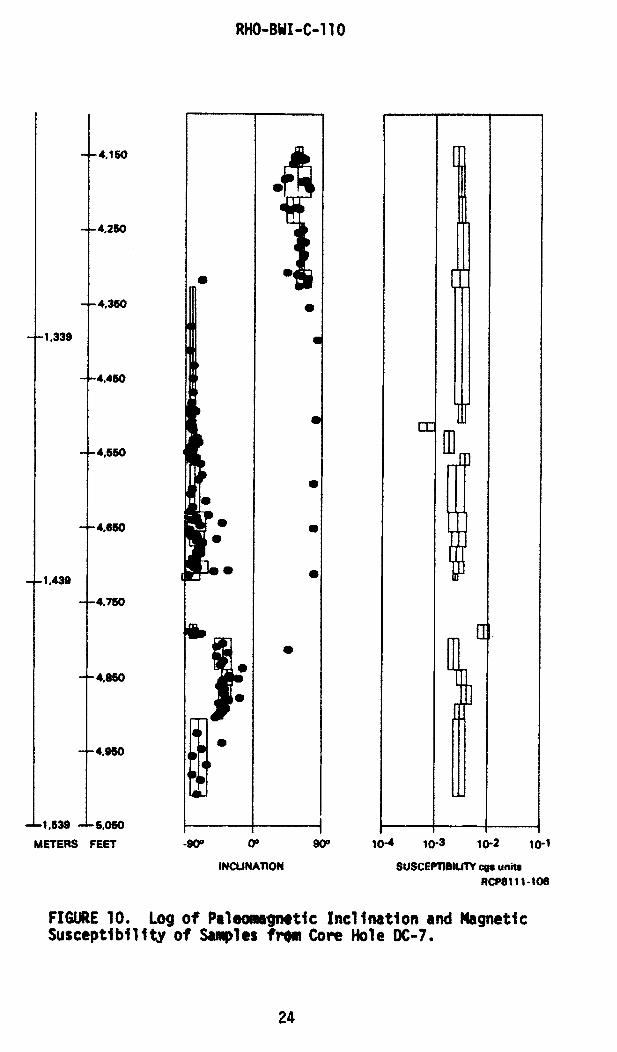
Paleomagnetic investigation of DC-7 included 169 samples from 22 flows. These
flows, numbered GR-16 (highest) through GR-37 (lowest), occurred at depths between
4,137 and 5,008 ft below the surface.
The upper five flows, to a depth of 4,326 ft, contain only positive inclination
(normal-polarity) characteristic magnetizations (Figure 10). Most of these samples
exhibited only a single component of magnetization with an MDF ranging between 100
and 300 Oe. In some samples, however, other components were revealed at lower
demagnetization steps (below 75 Oe). These components, which commonly have
shallow inclinations, may reflect secondary magnetizations acquired during storage or
sample preparation, while the cores are in a horizontal position.
From the top of flow GR-21 (4,326 ft) to the bottom of DC-7, all characteristic
magnetizations have reversed polarity. In many samples,

RHO-BWI-C-110
25
the reversed-polarity component has been almost totally obscured by a lower coercivity
normal-polarity component. The relative magnitude of the normal and reversed
components determines the polarity of the NRM vector, which can be of either sign even
within a single flow. As illustrated in Figure 11, the normal-polarity component can be as
much as 98% of the NRM intensity. In most cases, the stability spectra of the two
components are sufficiently different that the lower coercivity magnetization can be
totally removed by AF demagnetization to 500 Oe. Commonly, however, there is no
trace of an underlying reversed-polarity component until about 150 Oe.
Except for the hematitic flows described below, all flows beneath flow GR-20
exhibited some degree of two-component magnetization. Within each flow, there is no
apparent correlation between ratio of normal to reversed polarity component versus such
morphological features as colonnade, entablature, or zones of core disking. There is a
suggestion, however, that the more vesicular intervals exhibit less normal-polarity
overprinting.
The most hematitic flows consistently had the least amount of normal-polarity
overprinting. In particular, flows GR-22 through GR-25 and flow GR-36 showed little or
no evidence of normal-polarity components. Results of combined AF and thermal
demagnetization experiments (Figure 12) suggest that the characteristic magnetization
of these flows resides in both magnetite and hematite. Although AF demagnetization
removes most of the NRM intensity by 500 Oe, the presence of up to 25% of the NRM
intensity at 600°C (cf. magnetite's Curie temperature of ~580°C) indicates that a
substantial fraction of the NRM resides in hematite. The similarity in magnetization
direction between the high-blocking-temperature component (in hematite) and the
component removed by AF demagnetization (in magnetite) suggests that the hematite
formed penecontemporaneously (within 1,000 yr) with flow emplacement.
The inclination of the characteristic magnetization of normal-polarity flows GR-16
through GR-20 (4,137 to 4,326 ft) averages about +65°, with a variation of only about
±7°. Similarly, the inclination of


RHO-BWI-C-110
28
flows GR-21 through GR-32 (4,326 to 4,798 ft) is remarkably uniform at -80±7°. Except
for the change in geomagnetic polarity between flows GR-20 and GR-21 at 4,326 ft, the
paleomagnetic signature of these flows is rather featureless.
Flows GR-33 to GR-36 (4,798 to 4,906 ft), however, record a much shallower
negative inclination of -40°, while flow GR-37 again has a steep inclination of -70°. This
interval of relatively shallow negative inclination provides a valuable stratigraphic marker
in the upper R2 magnetozone of the Grande Ronde sequence.
The bulk magnetic susceptibility of the 22 flows in DC-7 generally shows little
variation about a mean of 5 x 10⁻³ cgs units (centimeter gram seconds) (Figure 10). Two
notable exceptions are flows GR-23 and GR-32. Flow GR-23 has an anomalously low
susceptibility of 8 x 10⁻⁴ cgs units, probably reflecting the high hematite content
suggested by the red coloration of this flow. The cause of the high susceptibility of flow
GR-32 is less certain, but might reflect an unusually high magnetite content.
It is noteworthy that the two samples from flow GR-31 do not have anomalously
high susceptibility. These two samples were collected to test whether the interval from
4,711 to 4,798 ft might consist of a single flow. Apparently, either flow GR-32 is a
separate unit from flow GR-31, or flow GR-32/31 has a large gradient in magnetic
susceptibility.
Other Core Holes
Fifty-six samples were obtained from eight additional Grande Ronde flows from
four other core holes. These flows were sampled to investigate particularly important
intervals, especially where there were discrepancies among the previous paleomagnetic
studies. Results from these flows will be presented in the context of the specific problem
to which they are addressed.
RHO-BWI-C-110
29
Polarity of Flows in the Upper Sentinel Bluffs Sequence. Packer and Petty (1979)
concluded that there is a reversed-polarity flow in DDH-3 and DH-5, less than 250 ft
below the Vantage horizon (FBV). However, reversed-polarity flows had not been found
in the Grande Ronde this near the Vantage in any of the other core holes or in surface
exposures. Moreover, Beck and others (1978) had sampled the same flow in DH-5 (GR-
3) as Packer and Petty (1979), but had found only normal-polarity directions.
Upon further analysis, it can be demonstrated that both observations of reversed-
polarity flows just beneath the Vantage are artifacts of sampling errors. The original core
sampling log from the study of Packer and Petty (1979) lists flows GR-1 through GR-8
as having been sampled at depths of 3,184 to 4,083 ft in DH-5. Thus, the top of these
eight flows lies at 1,470 FBV, not the 136 FBV shown in Figure 5 of Packer and Petty
(1979). The boundary between magnetozones GR-R2 and GR-N2 (magnetic correlation
line W of Packer and Petty, 1979) occurs at a depth of 3,152 ft in DH-5 (or 1,438 FBV).
Thus, the sequence of eight flows sampled by Packer and Petty (1979) falls below this
boundary and would be expected to have reversed-polarity magnetization, as is indeed
apparent by inspection of vector demagnetization diagrams.
The absence of a reversed-polarity flow just beneath the Vantage in DH-5 is confirmed
by resampling of this interval in this study. Of seven samples obtained between 1,858
and 1,961 ft below the surface, all but one showed only normal-polarity components of
magnetization upon both AF and thermal demagnetization. (The uppermost sample,
which exhibits apparently reversed polarity, is probably from an inverted core segment
as it is also reversed at NRM.) Moreover, the mean inclination of these samples agrees
with that from the same interval reported by Beck and others (1978).
In the revised magnetostratigraphic correlation chart (Figure 13), the DH-5
samples of Packer and Petty (1979) have been included at the stratigraphic depths
indicated in their original core logs.


RHO-BWI-C-110
31
The report of a reversed-polarity flow 100 FBV in DDH-3 is also spurious.
Packer and Petty (1979) concluded that flow GR-2 (GR-19; at a depth between 2,289
and 2,300 ft) has reversed polarity. However, inspection of core from this interval
revealed that the up arrows marked on the core during the original paleomagnetic
sampling are inverted with respect to the true up-hole direction as labeled on the core
box. This is further supported by resampling of this same flow in DDH-3 during this
study. All seven samples showed only single-component, normalpolarity magnetizations
upon both AF and thermal demagnetization. The absolute value (73°) of the
paleomagnetic inclination of these samples is the same as the- mean inclination for this
flow reported by Packer and Petty (1979).
The corrected core hole data are now consistent with the surface observations of
only normal-polarity flows within the first 1,500 FBV (Figure 13).
The Lower Part of DC-6. Packer and Petty (1979) found the paleomagnetic signature in
the lower part of DC-6 to be complicated by the presence of both normal- and reversed-
polarity components in the same flow. Flow GR-16 was particularly puzzling, as it
"appears to consist of a magnetically reversed section and a normal section." It was
concluded that this flow has a normal-polarity characteristic magnetization, although it
was noted that this conflicted with observations of reversed polarity at this horizon in DH-
4 and DH-5.
To help resolve this ambiguity, 28 additional samples were obtained in this study
from flows GR-13 through GR-16 of DC-6. The 17 samples from flows GR-13 through
GR-15 exhibited only normal-polarity magnetizations upon both progressive AF and
thermal demagnetization. Nearly all of these samples showed a large loss of NRM
intensity by 130 Oe or 250°C. The vector subtracted at these low steps pointed steeply
downward, generally between 70° and 80°. At higher demagnetization steps, the
intensity loss was much less pronounced and usually resulted in vector demagnetization
diagrams that were linear to the origin.

RHO-BWI-C-110
32
Of the 11 samples obtained from flow GR-16, all exhibited reversed-polarity
characteristic magnetizations upon AF demagnetization above 100 Oe. In most of these
samples, however, this reversed-polarity component was isolated only after stripping
away more than 97% of the NRM intensity, and in five samples more than 99.5% of the
NRM intensity had to be removed (Figure 14). This was generally not achieved until AF
demagnetization to at least 300 Oe.
Based on these results, the reluctance of Packer and Petty (1979) to identify flow
GR-16 as reversed can be attributed largely to insufficient demagnetization. Of the 15
samples obtained from this flow by Packer and Petty (1979), only one was AF
demagnetized above 100 Oe and that sample displays an unambiguously reversed-
polarity characteristic magnetization. Of the samples obtained from this flow in this
study, over 80% would have been declared "normal polarity" if demagnetization had
been stopped below 150 Oe.
Flow GR-16 of DC-6 provides an excellent example of the difficulty in
determining characteristic magnetization directions from core holes in Grande Ronde
Basalt. As discussed below, inadequate AF cleaning is probably responsible for most of
the discrepancies in previous magnetostratigraphic correlations of these flows.
DISCUSSION
This investigation has revealed a difficulty in determining the in situ
paleomagnetic directions of Columbia River basalts using samples from core holes; in
many core holes, the original thermoremanent magnetization (TRM) of the flows has
been strongly overprinted by a normal-polarity magnetization that is probably induced by
drilling. This problem is described in more detail below, and a revised
magnetostratigraphy of the Saddle Mountains, Wanapum, and Grande Ronde Basalts is
presented.


RHO-BWI-C-110
34
DRILLING-INDUCED REMAGNETIZATION IN CORE HOLES
A low-coercivity low-blocking-temperature magnetization is observed in basalt
samples from most core holes in the Pasco Basin. This component always points
steeply downward, commonly at an angle exceeding 80°. Although this magnetization is
present to some degree in nearly every flow, it is most insidious where it has strongly
overprinted a reversed-polarity TRM. In this case, vector demagnetization diagrams
show the remanence vector decaying almost linearly to the origin, losing over 90% of its
intensity by 100 Oe. This gives a false sense that the sample contains only a single,
normal-polarity magnetization and encourages the experimenter to discontinue further
demagnetization. At higher demagnetization steps, however, the remanence vector will
change sign (possibly even increasing in Intensity) and then decay linearly to the origin
(cf. Figures 11 and 14).
A spectacular example of the effects of magnetic overprinting is presented in
Figure 15, which compares NRM intensities and NRM inclinations from DH-4, studied by
Packer and Petty (1979). Note that the NRM intensity varies with depth by nearly two
orders of magnitude (between 3 x 10⁻³ emu/cm3 and 1 x 10⁻¹ emu/cm3). Moreover, there
is a distinct tendency for the NRM inclinations to steepen with increasing NRM intensity;
when the NRM intensity rises above 2 x 10⁻² emu/cm3, the NRM inclination becomes
nearly vertical. Yet another interesting relationship emerges by comparing Figure 15
with the magnetostratigraphic correlation chart of Packer and Petty (1979). Below about
2,800 ft in DH-4, normal-polarity flows on their chart correspond to maximums in the
NRM intensity oscillations, and reversed-polarity flows correspond to minimums.
These trends in the paleomagnetic data from DH-4 are curious for at least three
reasons. First, given the relatively homogeneous chemistries and magnetic
susceptibilities of the Grande Ronde flows, it is highly unlikely that their TRM intensities
would vary by two orders of magnitude. Second, the inclination angle of a TRM
generally should not correlate with its intensity. Finally, there is no geophysical reason
why the polarity of a TRM should correlate with its intensity.


RHO-BWI-C-110
36
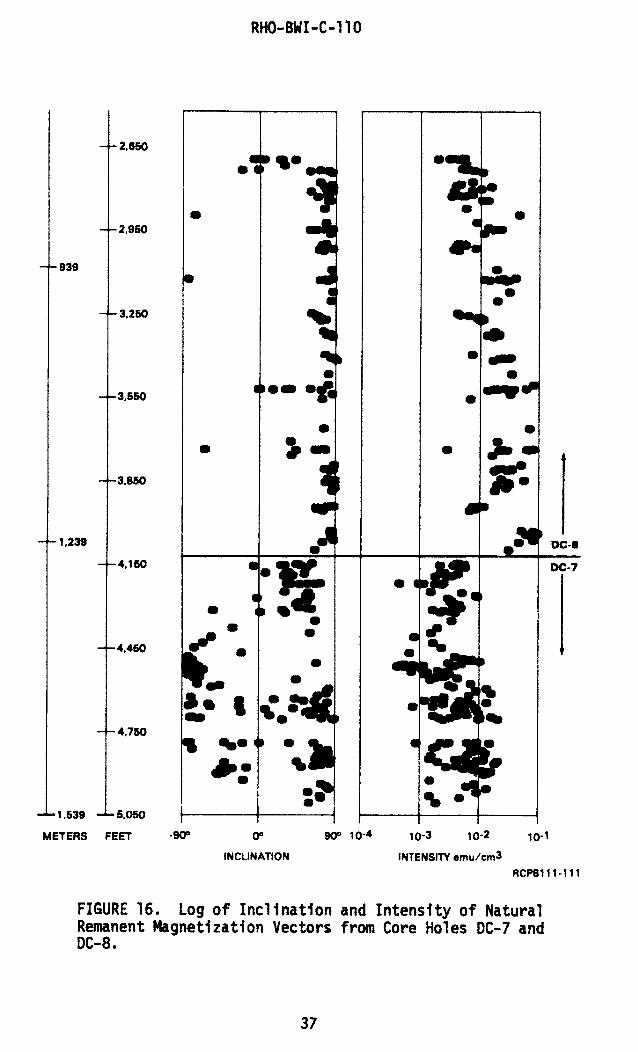
Further suspicions about the core hole paleomagnetic data are aroused by
comparing results from DC-8 (Packer and Petty, 1979) and DC-7 (this study). As shown
in Figure 16, the NRM intensity in DC-8 increases with depth from about 5 x 10⁻³
emu/cm3 (at 2,650 ft) to 8 x 10⁻² emu/cm3 (at 4,100 ft). In contrast, the NRM intensity in
DC-7 increases less dramatically with depth and is systematically lower than in DC-8,
varying between 8 x 10⁻⁴ and 2 x 10⁻² emu/cm3. Moreover, the NRM inclinations in DC-7
are nearly all shallower than in DC-8. Even more spectacular is the sharp drop (by a
factor of 25) in NRM intensity between the bottom of DC-8 and the top of DC-7; yet,
these two core holes are separated by a horizontal distance of only about 50 ft (Fenix
and Scisson, 1979). It would be highly fortuitous if this difference in NRM intensity
reflected a real difference in the TRM intensity, especially since the susceptibility log in
DC-7 is so uniform at its top (Figure 10). Nor can this discordance be attributed to
miscalibration of the two different magnetometers used in the DC-8 versus DC-7 studies;
eight Grande Ronde flows sampled by Packer and Petty (1979) were resampled in this
study, with no discernible difference in NRM intensity.
The evidence presented above strongly suggests that the original TRM of these
Grande Ronde flows has been distorted by a drilling-induced remanent magnetization
(DIRM) pointing almost directly down hole. This magnetization cannot be a chemical
remanent magnetization (CRM) or a VRM acquired during storage. Because the cores
are stored horizontally, any component acquired while the cores are in this position will
have a shallow apparent paleomagnetic inclination (between ±21°).
Although the exact origin of DIRM is unknown, it has been observed in
paleomagnetic samples from core holes in deep-sea basalts (e.g., Johnson and Ade-
Hall, 1975; Ade-Hall and Johnson, 1976; Johnson, 1979; Rice and others, 1980). A
near-vertical (downward) DIRM is also present in paleomagnetic results of Van der Voo
and Watts (1978) from basic igneous rock at 3.3 mi depth in a Michigan basin core hole;
this DIRM was not removed until AF demagnetization at 800 Oe. We have also
observed near-vertical (downward) DIRM in several core holes from sedimentary rocks
of the western United States. Any explanation of the DIRM

RHO-BWI-C-110
38
in the Columbia River basalts must account for the different degrees to which it is
developed in various core holes; it is strongly developed in DH-4 and DC-8, but is far
less pervasive in DC-2 and DC-7. Efforts are currently being made to understand this
phenomenon.
MAGNETOSTRATIGRAPHY OF THE COLUMBIA RIVER BASALT
In establishing a magnetostratigraphy of the Columbia River basalts, differences
in TRM directions of flows are used to identify chronostratigraphic units. The presence
of geomagnetic reversals in these basalts facilitates magnetostratigraphic correlations,
because flows with opposite polarities have paleomagnetic directions more than 90°
apart. However, because geomagnetic reversals are relatively infrequent (the highest
known reversal rate is one per ~200,000 yr--in the late Cenozoic), geomagnetic
fluctuations over a shorter time scale would be even more useful as time markers.
Fortunately, the geomagnetic dipole and non-dipole fields interact over a time
scale of decades to produce just the required directional variations for high-resolution
magnetostratigraphy. Termed "geomagnetic secular variation" (GSV), these directional
fluctuations have a quasiperiod of several thousand yr and produce deviations of up to
45° from the "time-averaged" or axial dipole field direction.
Unraveling the stratigraphy of the Columbia River basalts using geomagnetic
reversals and secular variation is a major goal of this and previous paleomagnetic
investigations of this sequence.
Saddle Mountains and Wanapum Basalts
Current knowledge of the magnetostratigraphy of the Saddle Mountains and
Wanapum Basalts is summarized in the composite stratigraphic section of Figure 17.
Paleomagnetic results from Packer and Petty (1979) and from this study are shown for
all flows (both surface and core hole) from which at least five samples yielded reliable
characteristic magnetization directions based on analysis of vector demagnetization
diagrams.


RHO-BWI-C-110
40
The paleomagnetic data are plotted as logs of mean site inclinations (with 95%
confidence circles) and geometric mean magnetic susceptibilities (with standard
deviations).
Paleomagnetic directional variations provide a number of stratigraphic markers in
the Saddle Mountains and Wanapum Basalts. At least four magnetozones can be
recognized in this sequence. A reversed zone in the upper Saddle Mountains Basalt
includes the Ice Harbor, Elephant Mountain, and Pomona Members. An underlying
normal-polarity zone extends to the base of the Saddle Mountains Basalt and includes
the Esquatzel, Asotin, Wilbur Creek, and Umatilla Members. The underlying Priest
Rapids Member of the Wanapum Basalt is reversely magnetized, the Roza Member is
transitional, and the Frenchman Springs Member is normal, except for some transitional
flows (Sand Hollow and Ginkgo) near its base.
Within these polarity zones, additional magnetostratigraphic correlation horizons
are provided by the GSV. In the reversed zone of the Saddle Mountains Basalt, the
Elephant Mountain Member has a distinctly shallower inclination than the overlying Ice
Harbor or underlying Pomona Members. Similarly, in the normal zone of the Saddle
Mountains Basalt, the Umatilla Member has a considerably shallower inclination than the
Esquatzel, Asotin, or Wilbur Creek Members.
Variations in magnetic susceptibility also show promise for correlating Saddle
Mountains and Wanapum Basalts. Values for flow-average magnetic susceptibility vary
between 7.6 x 10⁻⁵ cgs units (Asotin at surface site A2C1) and 2.9 x 10⁻³ (Umatilla at site
UE1). The between-flow variation (factor of 40) is considerably larger than the within--
flow variation, which is always less than a factor of 6. Thus, magnetic susceptibility may
provide another means of correlating certain Saddle Mountains and Wanapum Basalts,
particularly for distinguishing flows with similar paleomagnetic inclinations (e.g.,
Esquatzel versus Wilbur Creek).
RHO-BWI-C-110
41
Grande Ronde Basalt
Because of the effects of the previously unrecognized DIRM in samples from
Pasco Basin core holes, the paleomagnetism of some Grande Ronde flows has been
misinterpreted in past core hole studies. The revised magnetostratigraphy of the Grande
Ronde Basalt is displayed in Figure 13 and Plate 1 (in the pocket). This represents a
synthesis of data sets of Coe and others (1978), Beck and others (1978), Packer and
Petty (1979), and this study. All flow averages from previous core hole studies have
been recomputed, using only samples that had been AF demagnetized to at least 100
Oe. Error bars around the mean inclinations are not the standard deviations, as
reported in previous studies, but 95% confidence (α95) circles (cf. Kono, 1980).
Although a cutoff of 100 Oe has been used as a minimum AF demagnetization,
this by no means solves the problem of inadequate AF cleaning of the DIRM. Much of
the core hole data still reflect some amount of unremoved overprint. This has the effect
of smoothing out and steepening paleomagnetic inclinations within normal-polarity zones
and of causing large scatter in inclinations within reversed-polarity zones. With this
caveat, we will first discuss the revised polarity zonation of the Grande Ronde flows in
the subsurface and then comment on magnetostratigraphic units defined by the GSV.
Magnetozones. The stratigraphically highest polarity change in Grande Ronde flows of
the Pasco Basin occurs at a depth of about 1,500 FBV. (The presence of a reversed-
polarity flow Just beneath the Vantage has been discounted, as discussed previously in
this report.) This change from reversed (below) to normal (above) was designated
magnetic correlation line W by Packer and Petty (1979). Correlation line W had been
recognized in DH-5 at 1,438 FBV (Beck and others, 1978), in DH-4 at 1,429 FBV
(Packer and Petty, 1979), and in the Sentinel Gap field section at 1,560 FBV (Coe and
others, 1978).
Magnetic correlation line W had not been positively identified by Packer and
Petty (1979) in DC-6, because of the extensive drilling-induced normal-polarity
overprinting of flow GR-16. Based on resampling

RHO-BWI-C-110
42
and reanalysis of GR-16 in this study, it now seems certain that this flow has a reversed-
polarity TRM and that correlation line W occurs in DC-6 between GR-16 and GR-15 at a
depth of 3,687 ft (1,531 FBV).
Correlation line W was identified in the present study at a depth of 4,326 ft (1,641
FBV) in DC-7. Thus, correlation line W has now been recognized in every section that
has included flows at a sufficient depth (1,535 ± 105 FBV).
All other reported geomagnetic reversals below correlation line W in the Pasco
Basin core holes are probably artifacts of the drilling-induced normal-polarity
remagnetization. The correlation chart of Packer and Petty (1979) shows five
alternations in polarity below correlation line W in DH-4 and two below correlation line W
in DH-5.
In DH-4, every "normal-polarity" flow below correlation line W has an
anomalously high NRM intensity and steep inclination, probably reflecting more
pervasive overprinting of the original TRM. These flows were judged to be "clean" at
very low demagnetization steps; no sample from GR-19, for example, was
demagnetized above 50 Oe. In many of these "normal-polarity" flows, those samples
that had been demagnetized at steps above 100 Oe consistently had, or trended toward,
reversed inclinations (e.g., flows GR-17 and GR-32). The "selected demagnetization
level" for flows GR-26 through GR-31 are all between 25 and 100 Oe (Packer and Petty,
1979); the anomalously small standard deviations and steep inclinations of these flows
merely reflect the pervasive DIRM and tell nothing about any underlying TRM.
In studying DH-5, Beck and others (1978) reported two additional polarity
changes below correlation line W. Both of these apparent polarity changes are probably
artifacts of the previously unrecognized normal-polarity overprinting of these flows. Most
samples from flow GR-20 (flow T of Beck and others, 1978) were demagnetized at a
single step (600 Oe) and showed negative inclinations, generally after 98% of the NRM
intensity had been removed. No sample from a flow lower than GR-20 was
demagnetized higher than 400 Oe, except those from GR-22 (flow V).

RHO-BWI-C-110
43
All samples from flow GR-22 exhibit a reversed-polarity high-coercivity magnetization on
vector demagnetization diagrams. Most samples from the lower part of DH-5 have the
signs of a strong normal-polarity overprint: steep positive NRM inclinations, NRM
intensities >2 x 10⁻² emu/cm 3, and MDF's <100 Oe.
Thus, the lower parts of DH-4 and DH-5 have apparently been extensively
remagnetized during drilling. Previous reports of normal-polarity TRM from these
intervals are probably erroneous, since the most thoroughly demagnetized samples
contain reversed-polarity characteristic magnetizations. In particular, correlation line X,
proposed by Packer and Petty (1979) to mark a change from normal polarity below to
reversed polarity above, is not a reliable magnetostratigraphic horizon.
In summary, the presently available paleomagnetic data suggest that the Grande
Ronde Basalt is entirely normally magnetized from 0 to about 1,500 FBV and may be
entirely reversely magnetized from 1,500 to at least 3,300 FBV.
It seems likely that the polarity change at about 1,500 FBV is the "R2-N2" contact
(cf. Swanson and others, 1979), an important regional stratigraphic horizon in the
Grande Ronde Basalt mappable over most of the Columbia Plateau. In this report,
magnetic correlation line W of Packer and Petty (1979) is redesignated GR-R2/GR-N2.
Geomagnetic Secular Variation. Packer and Petty (1979) established four correlation
lines (S, T, U, and V) in the normal-polarity flows of the GR-N2 zone. These lines, which
define significant changes in mean paleomagnetic inclinations, can be recognized in
many of the core hole and field sections at about the same stratigraphic position. The
inclination differences may well reflect changes in the paleofield direction produced by
GSV. In this report, correlation lines S, T, U, and V have been used to subdivide the
GR-N2 and GR-R2 magnetozones into intervals of relatively uniform paleoinclination.
These intervals are here designated GR-N2a through GR-N2e and GR-R2a through GR-
R2Y (Figure 13 and Plate 1).
RHO-BWI-C-110
44
The GR-N2a interval is bounded by the Vantage horizon at the top and is
characterized by paleoinclinations of +75° to +80°. The GR-N2α interval is underlain by
GR-N2β, which has a typical inclination of +60° to +65°. The contact between GR-N2α
and GR-N2β can be recognized in the two field sections and in all core holes except
DDH-3.
The next magnetostratigraphic marker is a subtle change to a somewhat steeper
inclination of +70° within GR-N2γ. The contact between GR-N2β and GR-N2γ can be
recognized in the Sentinel Gap field section and in DH-5, DH-4, DC-6, DC-8, and DDH-
3; however, it is obscure or absent in the Umtanum Ridge field section and in DC-4 and
DC-2.
The GR-N2γ interval is underlain by GR-N2δ, which has a much shallower
paleomagnetic inclination. The GR-N2δ interval includes a thick flow (the Umtanum flow)
that is distinguished from flows above and below on the basis of Mg and titanium (Ti)
content. This interval is readily recognized in every surface and core hole section of the
upper Grande Ronde Basalt. The large variation (+15° to +60°) in reported
paleomagnetic inclinations from this interval, however, suggests that the TRM of the
Umtanum flow is obscured in surface and subsurface samples by secondary
components (high-coercivity VRM or DIRM) with steeper positive inclination.
The cleaned direction (D = 344°, I = +40°) determined by Beck and others (1978)
for the Umtanum flow at the Umtanum Ridge field section is based on AF
demagnetization to 200 Oe. Vector demagnetization diagrams of two Umtanum
samples from that study suggest that the characteristic magnetization of the Umtanum is
considerably shallower than observed at the 200-Oe step. The Umtanum flow (D) at the
Sentinel Gap field section (Coe and others, 1978) yielded a similar direction (D = 349°, I
= +42°). However, that mean direction, which was based on cleaning at 300 Oe, was
derived from one of the most scattered distributions of the entire Sentinel Gap section.
This scatter in paleomagnetic directions may reflect the presence of unremoved
secondary magnetizations, causing a steepening of the apparent TRM direction of the
Umtanum.
RHO-BWI-C-110
45
In this study, a Grande Ronde flow in the stratigraphic position of the Umtanum
(directly beneath the Mg horizon) was sampled at surface site CB/GR-6. After
demagnetization at 700 Oe, the direction from this flow was D = 329°, 1 = +26°.
However, vector demagnetization diagrams show that even at the highest
demagnetization steps, the remanence vector is still moving toward a shallower
inclination. This suggests that the inclination of interval GR-N2δ might be even <+26°.
The base of GR-N26 is well defined by a change to the +65° to +85° inclination of
GR-N2ε . The GR-N2ε interval is the lowest recognized in the GR-N2 magnetozone of the
upper Grande Ronde Basalt.
Directly beneath the GR-N2/GR-R2 contact is GR-R2α, characterized by
paleomagnetic inclinations of -75° to -85°. This interval is underlain by GR-R2β which
has a distinctively shallower reversed inclination of about -40°. The contact of GR-R2β
with underlying GR-R2γ is easily recognized in DC-7 as a change to a markedly steeper
inclination of about -70°.
Subdivisions of the GR-R2 magnetozone are difficult to recognize in the other
deep core holes (DH-4, DH-5, and DC-6). The extensive normal-polarity overprinting in
these core holes generally has not been removed, causing large scatter in
paleomagnetic inclinations. There is a suggestion, however, that GR-R2β may include
flows GR-18 and GR-19 in DH-4, flow GR-14 in DH-5, and flow GR-17 in DC-6.
Magnetic Susceptibility. Magnetic susceptibilities were determined for all Grande Ronde
flows from DC-7, for the five Grande Ronde flows sampled in surface exposures, and for
eight Grande Ronde flows resampled in DH-4, DH-5, DC-6, and DDH-3. In GR-N2α
through GR-N2δ, flow-average susceptibilities are about 8 x 10⁻⁴ cgs units, very similar to
susceptibilities of the overlying Wanapum and Saddle Mountains Basalts. Magnetic
susceptibility of Grande Ronde flows appears to increase with depth, rising to about 2 x
10-3 cgs units at the GR-N2/R2 boundary and to 3 x 10⁻³ cgs units in GR-R2β and GR-R2γ.
This increase in susceptibility with depth may partly explain the tendency for deeper
Grande Ronde flows to be more affected by DIRM.

RHO-BWI-C-110
46
Magnetic susceptibility variations appear to be smoother in the Grande Ronde
Basalt than in Wanapum and Saddle Mountains Basalts. Whereas average
susceptibility values for Wanapum and Saddle Mountains flows vary by a factor of 40,
values for Grande Ronde flows vary by little more than a factor of 10. Thus, magnetic
susceptibility is probably less useful for correlating Grande Ronde flows than for cor-
relating Wanapum and Saddle Mountains Basalts.
ADDITIONAL COMMENTS
The Problem of Structural Corrections
A potential limit to the accuracy of magnetostratigraphic correlations involves
uncertainties in correcting for geologic structure. For many of the Columbia River
basalts, the TRM is so stable and the paleomagnetic directions so well grouped that α95
circles smaller than 3° are attainable, even with fewer than 10 samples per flow. It is
disconcerting, therefore, when mean directions from the same flow from different sites
fail to converge upon structural correction.
This problem is perhaps best illustrated in comparing the surface and subsurface
paleomagnetic data from the Pomona flows (Figure 18). The Pomona was sampled in
this study at five surface sites and by Packer and Petty (1979) in DC-11. The average
dip of these flows was 10°, with a range between 5° (sites P1D1 and P2D1) and 16°
(site PF2). Before structural correction, all of the mean paleomagnetic directions from
surface sites are statistically distinct, since none of their α95 circles overlap; the Fisherian
concentration parameter (giving unit weight to the five site means) is 55. Upon structural
correction (rotating about the strike), the α95 circles still do not overlap, and the
concentration parameter increases insignificantly (to 65). At the two sites with the lowest
dips (P1D1 and P2D1), the means actually move apart upon structural correction. This
is unlikely to reflect a significant time difference (and, hence, secular variation) between
the two Pomona flows, since two contiguous Pomona flows in DC-11 yield
paleomagnetic inclinations differing by only 1°. Nor does this dispersion in Pomona
mean directions reflect incomplete cleaning of


RHO-BWI-C-110
48
multicomponent NRM. Pomona samples usually contain only a single component of
magnetization, yielding distributions of directions from each site with k ranging between
250 and 1,200.
The scatter of mean flow directions cannot be attributed solely to vertical-axis
tectonic rotations documented for other parts of the Columbia Plateau (cf. Watkins and
Baksi, 1974). Vertical-axis rotations produce dispersion only in paleomagnetic
declinations; this would not account for the 10° to 20° between-site differences in
observed inclinations for the Pomona, Esquatzel, Asotin, and Umatilla Members (Figure
17).
It is unlikely that these 10° to 20° discrepancies result from local anomalies in the
Miocene ambient field recorded by the flows. In an extensive paleomagnetic study of
Holocene lava flows from throughout the western United States, Champion (1980)
considered the possible sources of dispersion in paleomagnetic directions from different
sites in the same flow. He found that local magnetic anomalies (at 5 ft height above
flows free of edge and lightning effects) averaged <1.5° and that sites in the same flow
separated by up to 19 mi could yield mean directions <0.3° apart. Champion determined
that the angular standard deviation of mean directions from sites in the same flow
ranged from 1.5° to 10.8°, with a mean of 4.0°. He concluded that "review of the known
sources of error suggests that rotation of relatively small structural blocks at each
sampling site is the principal cause of observed dispersion of measured directions of
magnetization."
The paleomagnetic results of the present study indicate that uncertainties in the
actual paleofield directions at the time each flow cooled may be considerably larger than
the α95 values obtained at individual sites.
The Question of Dikes in Core Holes
When directions are found in one core hole that are not reproducible in any other
section at comparable stratigraphic depth, there is a possibility that a dike has been
sampled. Inconsistencies of this kind were noted by Packer and Petty (1979) in DH-4
(near the base of GR-N2δ of this study) and in DC-6 (near the base of GR-N2β). The
presence of

RHO-BWI-C-110
49
dikes was also a possibility in units that exhibited both normal and reversed
magnetizations, such as flow GR-16 of DC-6 (Packer and Petty, 1979) and flow GR-14
of DH-5 (Beck and others, 1978).
Many of these candidates for dikes now can be dismissed in recognition of the
probability that much of the core hole paleomagnetic data reflect DIRM. This
phenomenon certainly accounts for the presence of two components of opposite polarity
in a single flow, especially in the GR-R2 magnetozone.
There will always be some core hole samples with characteristic magnetizations
differing from others in the same flow (e.g., eight of 169 samples in DC-7). In most
cases, these can be explained as inverted core segments, which often are derived from
the most fractured parts of flows. The inversion of core segments can generally be
inferred with high confidence by comparing the vector demagnetization diagram from a
suspect sample with those from adjacent samples in the same flow.
Detecting a dike of the same polarity as a host flow is extremely difficult, unless
the sampling density is high and the two units have much different inclinations. While
this might explain the absence of some magnetostratigraphic boundaries in several of
the core holes, many of these discrepancies probably reflect inadequate cleaning of the
DIRM. Unrecognized changes in structural attitudes in the core holes would also blur
the more subtle magnetostratigraphic features.
A totally different approach to testing for the occurrence of dikes in the Pasco
Basin core holes was suggested by recent work of Buchan and others (1980). These
authors reported results from a paleomagnetic investigation of the contact zones
between Columbia River basalts and feeder dikes. They showed that thermal
demagnetization successfully isolated the primary TRM of the host rock; whereas, AF
demagnetization yielded only a stable but widely scattered direction. In this case, the
flow and dike had overlapping coercivity spectra, but distinctly different blocking tem-
peratures. Moreover, the dikes and contact zones studied by Buchan and others (1980)
consistently showed far lower MDF's than the host flows. These observations suggested
that two magnetic signatures of a dike might be an unusually low coercivity and low
blocking temperature.
RHO-BWI-C-110
50
These two characteristics proved to be inadequate for distinguishing possible
dikes from flows in the Pasco Basin core holes. As discussed previously, many of the
core hole paleomagnetic samples contain a drilling-induced magnetization. This DIRM
generally exhibits a coercivity <200 Oe and a blocking temperature <25C°C. Thus,
unless the TRM of a dike had a reversed or shallow paleomagnetic inclination, it could
not be distinguished from the DIRM on the basis of low coercivity or blocking
temperature.
Discordance Between Fluxgate Orientation Lines and NRM Declinations
On many of the Pasco Basin bore cores, an effort has been made to mark a
consistent orientation line, as determined using a fluxgate magnetometer. This
procedure, which measures the component of the NRM perpendicular to the core axis, is
used in determining relative orientation of fractures.
In an attempt to check the accuracy of these fluxgate orientation lines, Packer
and Petty (1979) computed angular differences between the fluxgate lines and the NRM
declinations as measured on the cryogenic magnetometer in the laboratory. Because
the angular differences in samples from five core holes showed a wide scatter, they
concluded that there was little correspondence between NRM declinations and fluxgate
orientation lines.
This observation is puzzling, especially since Packer and Petty (1979) reported
that "discrepancies of approximately 30° occurred between the actual physical fit of the
section of core and the marked [orientation] line." This suggests that the direction of
magnetization measured by the fluxgate was relatively uniform and certainly not as
diffuse as suggested by the laboratory NRM values.
One explanation for this discrepancy is that perhaps a secondary magnetization
had been acquired by the samples between the time of the fluxgate and cryogenic
magnetometer measurements. If this were the case, the distribution of NRM directions
could be either (1) random, if the spurious magnetization were non-systematically
imparted; or (2) biased toward some preferred declination, if the spurious component
were systematically imparted.

RHO-BWI-C-110
51
Addition of a systematic secondary magnetization is strongly suggested by
analysis of stereographic projections of NRM directions from the Pasco Basin core holes
(Figures 19 and 20). In DC-4, for which ~85% of the samples collected by Packer and
Petty (1979) were drilled on the fluxgate orientation line, the distribution of NRM
declinations is biased toward a declination of 296° (the mode of specimen directions as
determined by the technique of Van Alstine, 1980). If the fluxgate orientation line were
accurate and if no additional magnetic components were subsequently imparted, the
direction of bias should have been 0°. Moreover, the distribution of NRM directions from
DH-4 is biased toward about the same declination as specimens from DC-4. Yet,
specimens from DH-4 were not drilled on a fluxgate orientation mark, so their NRM
declinations should have been randomly distributed.
The most likely time of acquisition of a systematic secondary component is
during sample collection or specimen preparation. This could occur either during coring
with a drill press or during trimming with a rock saw (cf. Burmester, 1977). The drill
press is the more likely source of systematic bias, since the specimens are drilled per-
pendicular to their reference scribe line.
This interpretation of NRM declination bias in core hole paleomagnetic data was
independently formulated by Bleil (1980). Massive flow basalts drilled from the Bermuda
Rise on Leg 51 of the Deep Sea Drilling Project showed a strong bias in NRM
declination; whereas, pillow basalts from the same core hole did not. Bleil concluded
that a systematic spurious component had been acquired during the ship-board
minicoring process.
Acquisition of a secondary remanence from the drill press would be a milder form
of DIRM imparted during drilling of the core in the subsurface. The component of DIRM
acquired during specimen preparation is easily removed by AF demagnetization, as
evidenced by the reduction or absence of directional bias in cleaned magnetization
directions (Figure 20). However, the absence of directional bias in cleaned directions
from fluxgate-oriented core (e.g., DC-4) indicates that the fluxgate is not measuring the
TRM declinations.


RHO-BWI-C-110
54
These results indicate that in situ magnetization directions of Columbia River
basalts are difficult to extract from NRM directions of specimens from subsurface cores.
These results also suggest that the fluxgate magnetometer is generally not measuring
the actual TRM directions of the flows, especially considering so many of the cores had
already been overprinted with DIRM acquired in the drill string. In no way, however,
does this impugn the accuracy of paleomagnetic directions based on thoroughly cleaned
specimens.
CONCLUSIONS
Paleomagnetic correlation within the Columbia River Basalt Group is as
promising as ever, especially now that a consistent magnetostratigraphy is emerging.
The Grande Ronde Basalt of the Pasco Basin (to a depth of ~5,000 ft below the surface)
contains two magnetozones: reversed-polarity zone GR-R2 underlies normal-polarity
zone GR-N2, with a contact at a depth of ~l,500 FBV.
In addition to the R2-N2 contact, six distinctive changes in paleomagnetic
inclination can be recognized at equivalent stratigraphic horizons in basalts of the Pasco
Basin. These inclination differences of up to 60° probably reflect the Miocene GSV and
permit subdivision of the R2 and N2 magnetozones into three and five magnetic intervals,
respectively. A new nomenclature has been established in which these magnetic
intervals are designated GR-R2α through γ and GR-N2α through ε .
The Wanapum and Saddle Mountains Basalts contain four magnetozones. As in
the Grande Ronde Basalt, paleomagnetic inclination variations in the Wanapum and
Saddle Mountains Basalts are large and should permit subdivision of these formations
into additional magnetic intervals.
Although magnetic susceptibility of the Grande Ronde Basalt is relatively
uniform, susceptibility variations in the Wanapum and Saddle Mountains Basalts are
large and could be used to complement correlations based on flow chemistry and
paleomagnetic directions.

RHO-BWI-C-110
55
The consistency of paleomagnetic directions at equivalent stratigraphic horizons
in Pasco Basin core holes indicates that these holes penetrated few if any dikes.
Although the Columbia River basalts preserve an excellent record of the Miocene
geomagnetic field, several sources of "noise" evidently can blur the paleomagnetic
signal. In specimens from subsurface core, the main source of magnetic noise is DIRM
acquired predominantly in the drill string. The coercivity and blocking temperature
spectra of the DIRM and TRM are sufficiently distinct, however, that the TRM can usu-
ally be isolated by AF demagnetization to 500 Oe or thermal demagnetization to 300°C.
In surface outcrops of the Pasco Basin and vicinity, inclination discrepancies of 10° to
20° are observed between different sites in the same flow. These between-site
differences, which may be caused by local structural rotations, suggest that ~15°
inclination differences may be the limit of magnetostratigraphic resolution in this part of
the Columbia Plateau.
REFERENCES
Ade-Hall, J. M. and Johnson, H. P., 1976, Paleomagnetism of basalts, Leg 34: Initial Repts. Deep Sea Drilling Project, v. 34, p. 513-532.
Beck, M. E., Engebretson, D. C., and Plumley, P. W., Western Washington University, 1978, Magnetostratigraphy of the Grande Ronde sequence: RHO-BWI-C-18, Rockwell Hanford Operations, Richland, Washington.
Bleil, U., 1980, Paleomagnetism of basalts, Leg 51: Initial Repts. Deep Sea Drilling Project, v. 51, p. 1351-1357.
Buchan, L. L., Schwarz, E. J., Symons, D. T. A., and Stupavsky, M., 1980, Remanent magnetization in the contact zone between Columbia Plateau flows and feeder dikes: Evidence for groundwater layer at time of intrusion: Jour. Geophys. Res., v. 85, p. 1888-1898.
Burmester, R. F., 1977, Origin and stability of drilling induced remanence: Geophys. Jour. Roy. Astron. Soc., v. 48, p. 1-14.
BWIP, 1980, Basalt Waste Isolation Project, annual report - fiscal year 1980: RHO-BWI-80-100, Rockwell Hanford Operations, Richland, Washington.
RHO-BWI-C-110
56
Champion, D. E., 1980, Holocene geomagnetic secular variation in the western United States: Implications for the global geomagnetic field: Ph.D. Dissert., Calif. Inst. of Tech., 314 pp.
Coe, R. S. and Bogue, S., University of California at Santa Cruz, and Myers, C. W., 1978, Paleomagnetism of the Grande Ronde (lower Yakima) Basalt exposed at Sentinel Gap: Potential use for stratigraphic correlation: RHO-BWI-ST-2, Rockwell Hanford Operations, Richland, Washington.
Fenix & Scission, Inc., 1979, Hole history, core hole DC-8, Hanford, Washington: RHO-BWI-C-29, Rockwell Hanford Operations, Richland, Washington.
Fisher, R. A., 1953, Dispersion on a sphere: Proc. Roy. Soc. Lond., v. A125, p. 54-59.
Johnson, H. P., 1979, Paleomagnetism of igneous rock samples -- DSDP Leg 45: Initial Repts. Deep Sea Drilling Project, v. 45, p. 387-395.
Johnson, H. P. and Ade-Hall, J. M., 1975, Magnetic results from basalts and sediments from the Nazca plate: Nature, v. 257, p. 471-473.
Kirschvink, J. L., 1980, The least-squares line and plane and the analysis of paleomagnetic data: Geophys. Jour. Roy. Astron. Soc., v. 62, p. 699-718.
Kono, M., 1980, Statistics of paleomagnetic inclination data: Jour. Geophys. Res., v. 85, p. 3878-3882.
Mardia, K. V., 1972, Statistics of directional data: Academic Press, New York.
McElhinny, M. W., 1973, Paleomagnetism and plate tectonics: Cambridge Univ. Press, 358 pp.
Myers, C. W., Price, S. M., Caggiano, J. A., Cochran, M. P., Czimer, W. J., Davidson, N. J., Edwards, R. C., Fecht, K. R., Holmes, G. E., Jones, M. G., Kunk, J. R., Landon, R. D., Ledgerwood, R. K., Lillie, J. T., Long, P. E., Mitchell, T. H., Price, E. H., Reidel, S. P., and Tallman, A. M., 1979, Geologic studies of the Columbia Plateau: a status report: RHO-BWI-ST-4, Rockwell Hanford Operations, Richland, Washington.
Onstott, T. C., 1980, Application of the Bingham distribution function in paleomagnetic studies: Jour. Geophys. Res., v. 85, p. 1500-1510.
Packer, D. R. and Petty, M. H., Woodward-Clyde Consultants, 1979, Magneto-stratigraphy of the Grande Ronde Basalt, Pasco Basin, Washington: RHO-BWI-C-46, Rockwell Hanford Operations, Richland, Washington.

RHO-BWI-C-110
57
Reidel, S. P. and Fecht, K. R, in Myers, C. W. and Price, S. M., eds., Subsurface geology of the Cold Creek syncline, RHO-BWI-ST-14, Rockwell Hanford Operations, Richland, Washington.
Rice, P. D., Hall, J. M., and Opdyke, N. D., 1980, Deep drill 1972: A paleomagnetic study of the Bermuda Seamount: Can. Jour. Earth Sci., v. 17, p. 232-243.
Sheriff, S. D. and Bentley, R. D., 1980, Anomalous paleomagnetic directions from the Miocene Wanapum Basalt, Washington and Oregon: Trans. Am. Geophys. Un. (E.O.S.), v. 61, GP-67.
Swanson, D. A., Wright, T. L., Hooper, P. R., and Bentley, R. D., 1979, Revisions in stratigraphic nomenclature of the Columbia River Basalt Group: U.S. Geological Survey Bulletin 1457-G.
Van Alstine, D. R., 1980, Analysis of the modes of directional data, with particular reference to palaeomagnetism: Geophys. Jour. Roy. Astron. Soc., v. 61, p. 101-113.
Van der Voo, R. and Watts, D. R., 1978, Paleomagnetic results from igneous and sedimentary rocks from the Michigan Basin borehole: Jour. Geophys. Res., v. 83, p. 5844-5848.
Ward, A. W., 1976, Petrology and chemistry of the Huntzinger flow, Columbia River basalt, Washington: ARH-SA-272, Atlantic Richfield Hanford Company, Richland, Washington.
Watkins, N. D., and Baksi, A. K., 1974, Magnetostratigraphy and oroclinal folding of the Columbia River, Steens, and Owyhee basalts in Oregon, Washington, and Idaho: Amer. Jour. of Sci., v. 274, p. 148.
Zijderveld, J. D. A., 1967, A. C. demagnetization of rocks: Analysis of results: in Methods in paleomagnetism, edited by D. W. Collinson, K. M. Creer, and S. K. Runcorn, Elsevier, New York, p. 254-286.