26 february 2009 - telstra · sol trujillo, ceo 26 february 2009 ... operating expenses 7.3 7.4...
TRANSCRIPT
Telstra Corporation Limited ACN 051 775 556
ABN 33 051 775 556
26 February 2009 Company Announcements Office Australian Stock Exchange 4th Floor, 20 Bridge Street SYDNEY NSW 2000
Office of the Company Secretary Level 41 242 Exhibition Street MELBOURNE VIC 3000 AUSTRALIA General Enquiries 08 8308 1721 Facsimile 03 9632 3215
ELECTRONIC LODGEMENT Dear Sir or Madam Analyst Briefing – Half year results presentation pack In accordance with the listing rules, I attach a copy of a presentation to be made today, for release to the market. This Announcement has been released simultaneously to the New Zealand Stock Exchange. Yours sincerely
Carmel Mulhern Company Secretary
1
First Half 2009 Financial Results
Sol Trujillo, CEO 26 February 2009
Disclaimer • These presentations include certain forward-looking statements that are based on information and assumptions
known to date and are subject to various risks and uncertainties. Actual results, performance or achievements could be significantly different from those expressed in, or implied by, these forward-looking statements. Such forward-looking statements are not guarantees of future performance and involve known and unknown risks, uncertainties and other factors, many of which are beyond the control of Telstra, which may cause actual results to differ materially from those expressed in the statements contained in these presentations. For example, the factors that are likely to affect the results of Telstra include general economic conditions in Australia; exchange rates; competition in the markets in which Telstra will operate; the inherent regulatory risks in the businesses of Telstra; the substantial technological changes taking place in the telecommunications industry; and the continuing growth in the data, internet, mobile and other telecommunications markets where Telstra will operate. A number of these factors are described in Telstra’s 2008 Annual Debt Issuance Prospectus lodged with the ASX.
• The Chinese online business results are from unaudited management accounts converted from local currency into Australian Dollars.
• All forward-looking figures in this presentation are unaudited and based on A-IFRS. Certain figures may be subject to rounding differences. All market share information in this presentation is based on management estimates based on internally available information unless otherwise indicated.
• All amounts are in Australian Dollars unless otherwise stated.
2
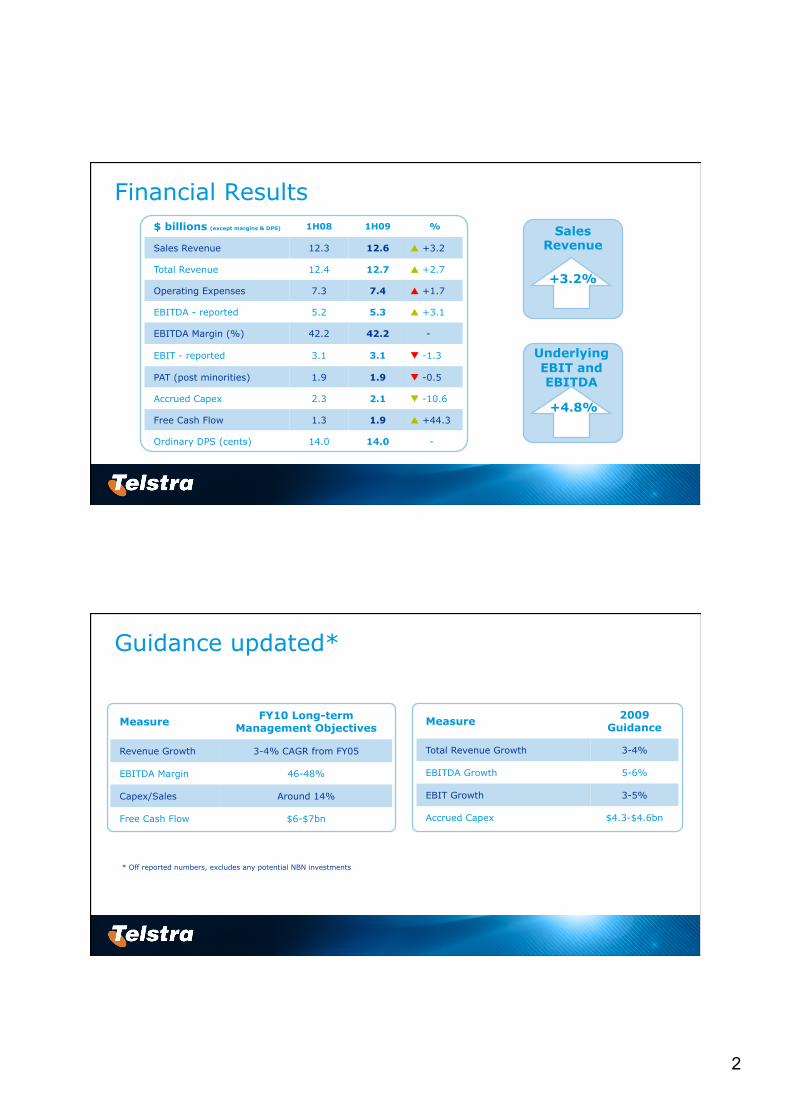
Financial Results
Underlying EBIT and EBITDA
Sales Revenue
+3.2%
$ billions (except margins & DPS) 1H08 1H09 %
Sales Revenue 12.3 12.6 +3.2
Total Revenue 12.4 12.7 +2.7
Operating Expenses 7.3 7.4 +1.7
EBITDA - reported 5.2 5.3 +3.1
EBITDA Margin (%) 42.2 42.2 -
EBIT - reported 3.1 3.1 -1.3
PAT (post minorities) 1.9 1.9 -0.5
Accrued Capex 2.3 2.1 -10.6
Free Cash Flow 1.3 1.9 +44.3
Ordinary DPS (cents) 14.0 14.0 -
+4.8%
Guidance updated*
Measure 2009 Guidance
Total Revenue Growth 3-4%
EBITDA Growth 5-6%
EBIT Growth 3-5%
Accrued Capex $4.3-$4.6bn
Measure FY10 Long-term Management Objectives
Revenue Growth 3-4% CAGR from FY05
EBITDA Margin 46-48%
Capex/Sales Around 14%
Free Cash Flow $6-$7bn
* Off reported numbers, excludes any potential NBN investments
3
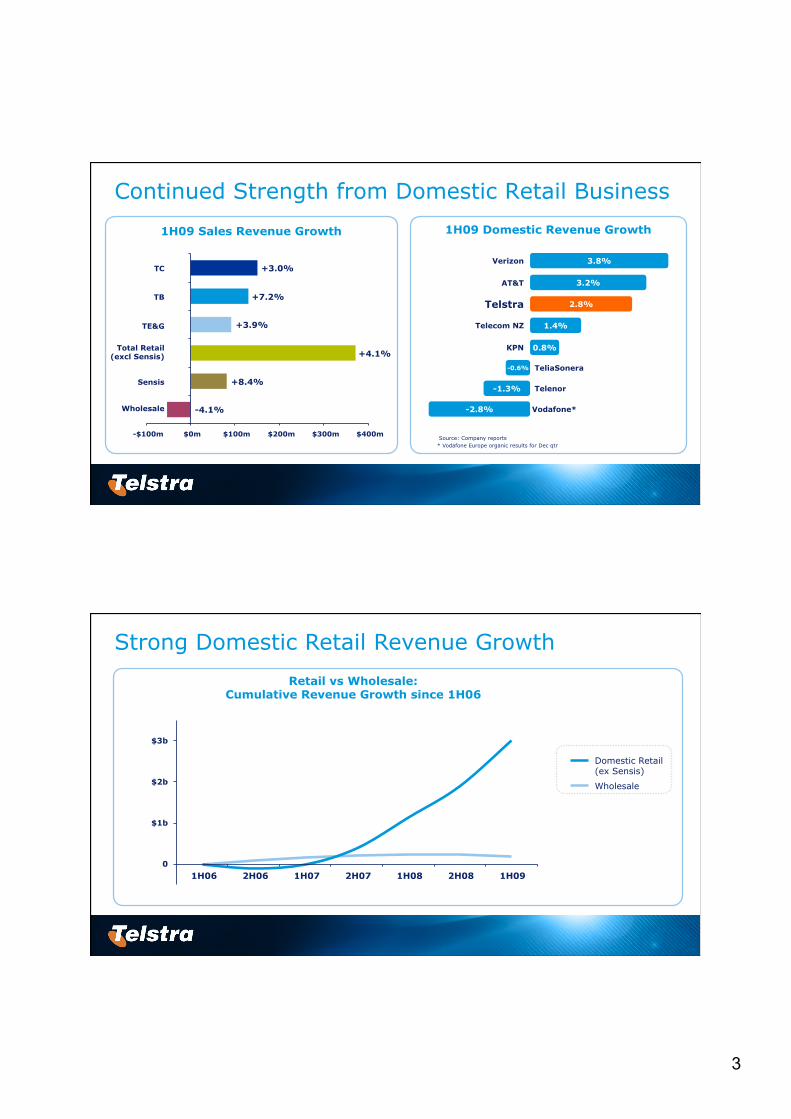
Continued Strength from Domestic Retail Business
1H09 Sales Revenue Growth
-$100m $0m $100m $200m $300m $400m
Wholesale
TB
TC
TE&G
Sensis
Total Retail (excl Sensis)
+3.0%
+7.2%
+3.9%
+4.1%
+8.4%
-4.1%
Source: Company reports
1H09 Domestic Revenue Growth
* Vodafone Europe organic results for Dec qtr
-2.8%
-1.3%
-0.6%
0.8%
1.4%
2.8%
3.2%
3.8%
Vodafone*
Telenor
TeliaSonera
KPN
Telecom NZ
Telstra
AT&T
Verizon
Strong Domestic Retail Revenue Growth
Retail vs Wholesale: Cumulative Revenue Growth since 1H06
Domestic Retail (ex Sensis)
Wholesale
0
$1b
$2b
$3b
1H06 2H06 1H07 2H07 1H08 2H08 1H09
4
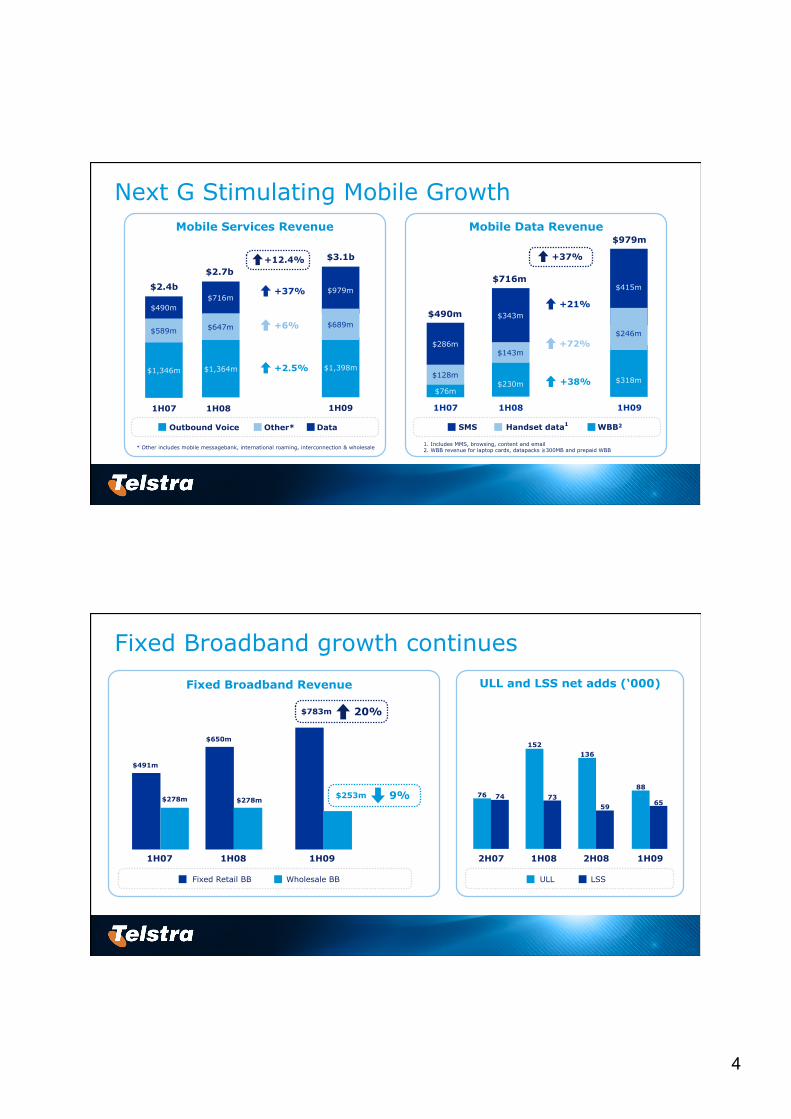
Next G Stimulating Mobile Growth
$589m
1H07
$1,364m
$716m
1H08
Data Outbound Voice Other*
$647m
$2.4b
$2.7b
$1,346m
$490m
Mobile Services Revenue
$1,398m
$979m
1H09
$689m
$3.1b
* Other includes mobile messagebank, international roaming, interconnection & wholesale
+2.5%
+6%
+37%
+12.4%
$128m
1. Includes MMS, browsing, content and email 2. WBB revenue for laptop cards, datapacks ≥300MB and prepaid WBB
1H07
$230m
$343m
1H08
SMS WBB2 Handset data1
$143m
$490m
$716m
$76m
$286m
Mobile Data Revenue
1H09
$318m
$415m
$246m
+38%
+72%
+21%
$979m
+37%
Fixed Broadband growth continues
Fixed Broadband Revenue
Fixed Retail BB Wholesale BB
ULL and LSS net adds (‘000)
ULL LSS
1H08 2H07 1H09 2H08
76 74
152
73
136
59
88
65
$491m
$278m
$650m
$278m
1H07 1H08
$783m
$253m
20%
9%
1H09
5
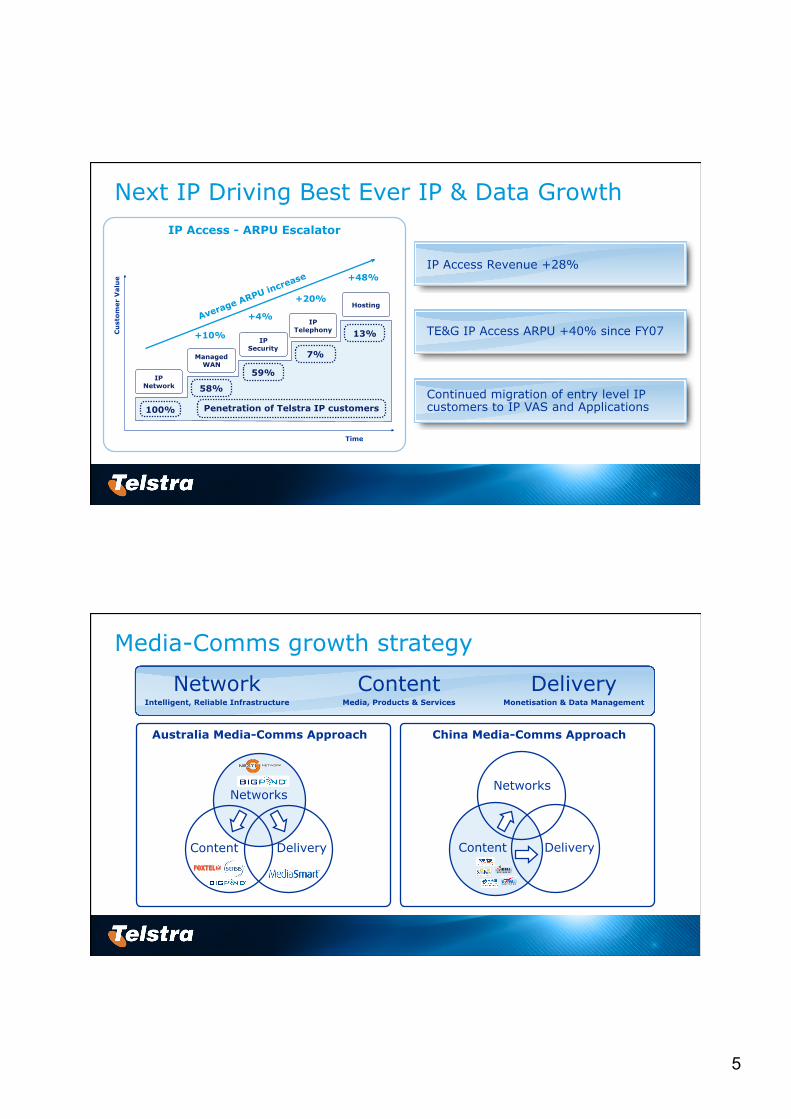
Next IP Driving Best Ever IP & Data Growth IP Access - ARPU Escalator
Time
IP Telephony
IP Network
Managed WAN
IP Security
Hosting
Cu
sto
mer
Valu
e
58%
59%
7%
13%
Penetration of Telstra IP customers
Average ARPU increase
100%
+10%
+4%
+20%
+48% IP Access Revenue +28%
TE&G IP Access ARPU +40% since FY07
Continued migration of entry level IP customers to IP VAS and Applications
Media-Comms growth strategy
Content Media, Products & Services
Delivery Monetisation & Data Management
Network Intelligent, Reliable Infrastructure
Australia Media-Comms Approach China Media-Comms Approach
Content Delivery
Networks
Delivery Content
Networks
6
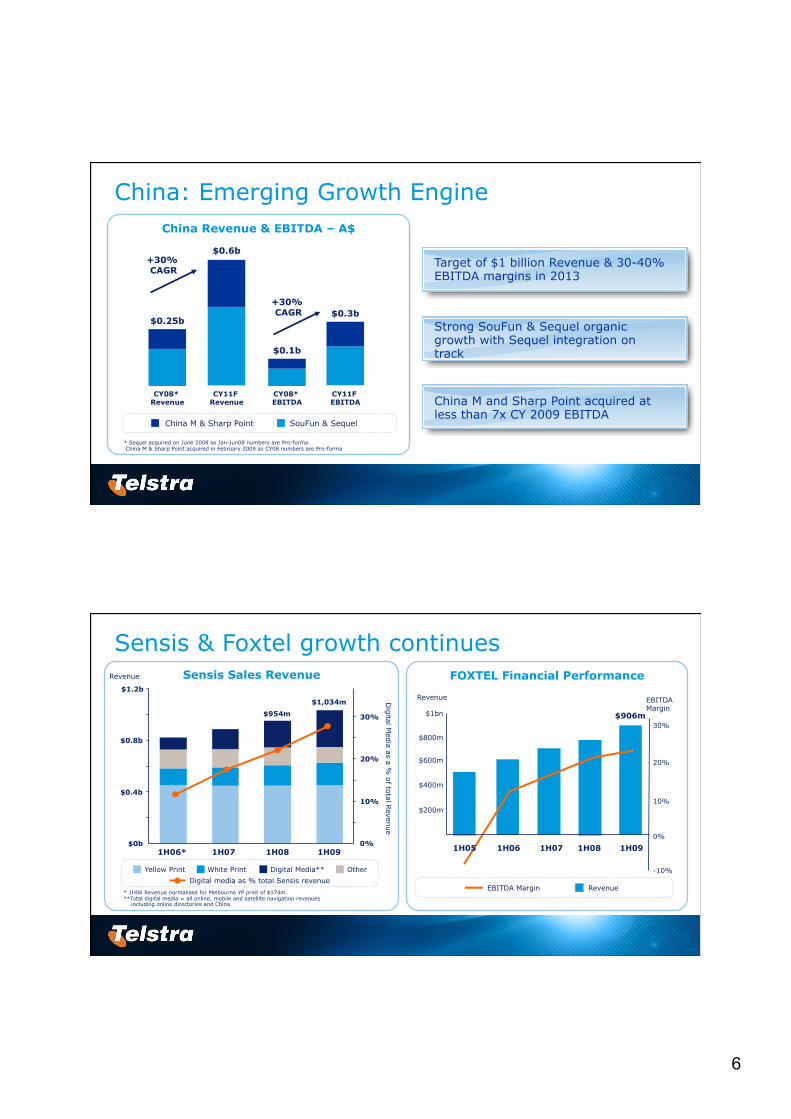
China: Emerging Growth Engine
Target of $1 billion Revenue & 30-40% EBITDA margins in 2013
* Sequel acquired on June 2008 so Jan-Jun08 numbers are Pro-forma. China M & Sharp Point acquired in February 2009 so CY08 numbers are Pro-forma
China Revenue & EBITDA – A$
CY08* Revenue
$0.25b
$0.6b
CY11F Revenue
CY08* EBITDA
CY11F EBITDA
$0.1b
$0.3b
China M & Sharp Point SouFun & Sequel
+30% CAGR
+30% CAGR
Strong SouFun & Sequel organic growth with Sequel integration on track
China M and Sharp Point acquired at less than 7x CY 2009 EBITDA
Sensis & Foxtel growth continues
Yellow Print White Print Digital Media** Other
Digital media as % total Sensis revenue
* 1H06 Revenue normalised for Melbourne YP print of $174m. **Total digital media = all online, mobile and satellite navigation revenues
including online directories and China.
EBITDA Margin Revenue
Revenue EBITDA Margin
30%
20%
10%
0%
-10%
$600m
$400m
$200m
$800m
FOXTEL Financial Performance
$906m $1bn
Sensis Sales Revenue
1H05 1H06 1H07 1H08 1H09
Dig
ital Med
ia as a % o
f total R
evenue
$0b
$0.4b
$0.8b
$1.2b
1H06* 1H07 1H08 1H09 0%
10%
20%
30%
Revenue
$954m
$1,034m
7
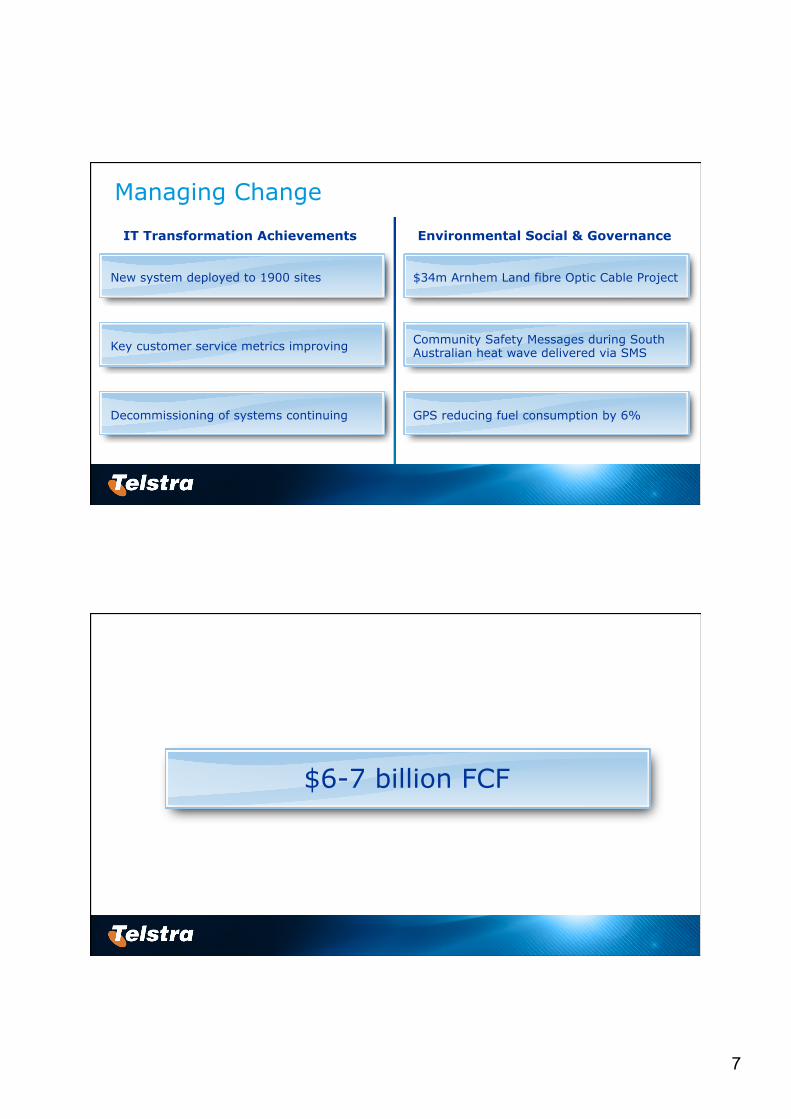
Managing Change
IT Transformation Achievements Environmental Social & Governance
$34m Arnhem Land fibre Optic Cable Project
Community Safety Messages during South Australian heat wave delivered via SMS
GPS reducing fuel consumption by 6%
Key customer service metrics improving
Decommissioning of systems continuing
New system deployed to 1900 sites
$6-7 billion FCF
8
Appendix
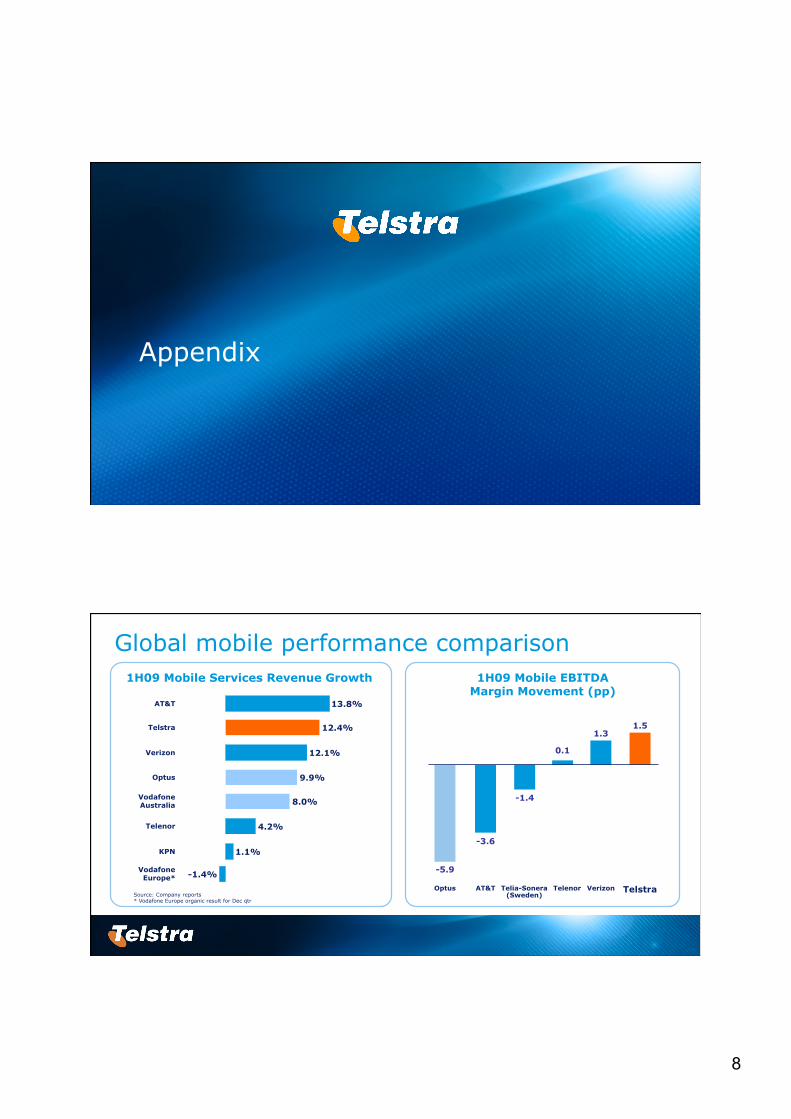
Global mobile performance comparison
Source: Company reports * Vodafone Europe organic result for Dec qtr
1H09 Mobile Services Revenue Growth
12.4%
9.9%
12.1%
1.1%
8.0%
-1.4%
Telstra
KPN
Vodafone Europe*
Optus
Vodafone Australia
Verizon
13.8% AT&T
4.2% Telenor
1H09 Mobile EBITDA Margin Movement (pp)
Optus AT&T Verizon Telstra Telenor
1.5
-3.6
1.3
-5.9
0.1
-1.4
Telia-Sonera (Sweden)
1
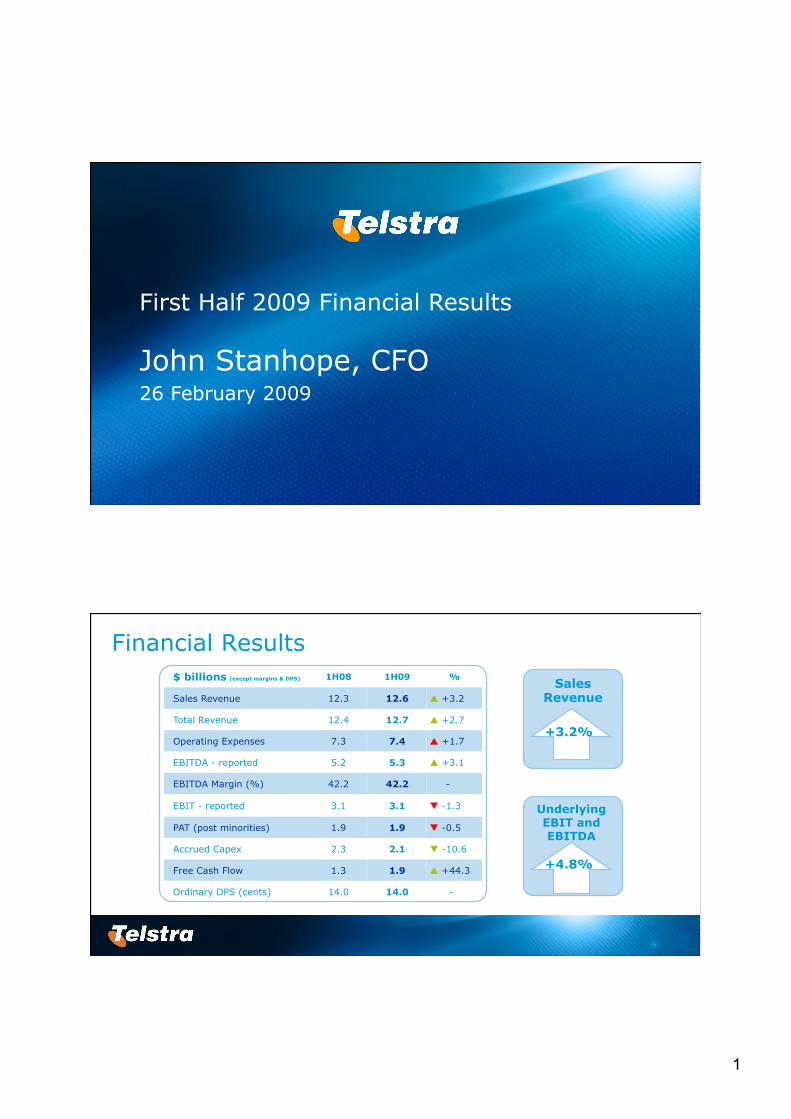
First Half 2009 Financial Results
John Stanhope, CFO 26 February 2009
Financial Results $ billions (except margins & DPS) 1H08 1H09 %
Sales Revenue 12.3 12.6 +3.2
Total Revenue 12.4 12.7 +2.7
Operating Expenses 7.3 7.4 +1.7
EBITDA - reported 5.2 5.3 +3.1
EBITDA Margin (%) 42.2 42.2 -
EBIT - reported 3.1 3.1 -1.3
PAT (post minorities) 1.9 1.9 -0.5
Accrued Capex 2.3 2.1 -10.6
Free Cash Flow 1.3 1.9 +44.3
Ordinary DPS (cents) 14.0 14.0 -
Sales Revenue
+3.2%
Underlying EBIT and EBITDA
+4.8%
2
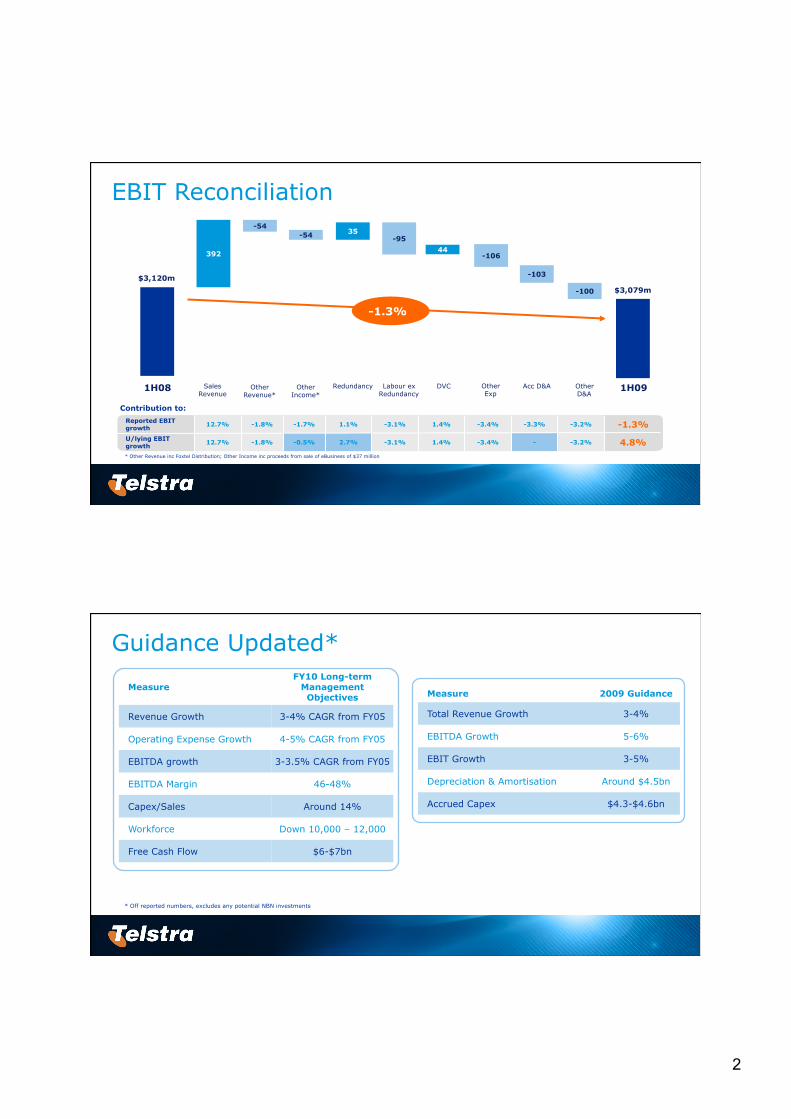
Reported EBIT growth
12.7% -1.8% -1.7% 1.1% -3.1% 1.4% -3.4% -3.3% -3.2% -1.3%
U/lying EBIT growth
12.7% -1.8% -0.5% 2.7% -3.1% 1.4% -3.4% - -3.2% 4.8%
EBIT Reconciliation
392
35
44 -106
-95
-103
-100
$3,120m $3,079m
1H08 Sales Revenue
Redundancy Labour ex Redundancy
DVC Other Exp
Acc D&A Other D&A
1H09 Other Revenue*
Other Income*
-54 -54
-1.3%
* Other Revenue inc Foxtel Distribution; Other Income inc proceeds from sale of eBusiness of $37 million
Contribution to:
Guidance Updated*
Measure 2009 Guidance
Total Revenue Growth 3-4%
EBITDA Growth 5-6%
EBIT Growth 3-5%
Depreciation & Amortisation Around $4.5bn
Accrued Capex $4.3-$4.6bn
Measure FY10 Long-term
Management Objectives
Revenue Growth 3-4% CAGR from FY05
Operating Expense Growth 4-5% CAGR from FY05
EBITDA growth 3-3.5% CAGR from FY05
EBITDA Margin 46-48%
Capex/Sales Around 14%
Workforce Down 10,000 – 12,000
Free Cash Flow $6-$7bn
* Off reported numbers, excludes any potential NBN investments
3
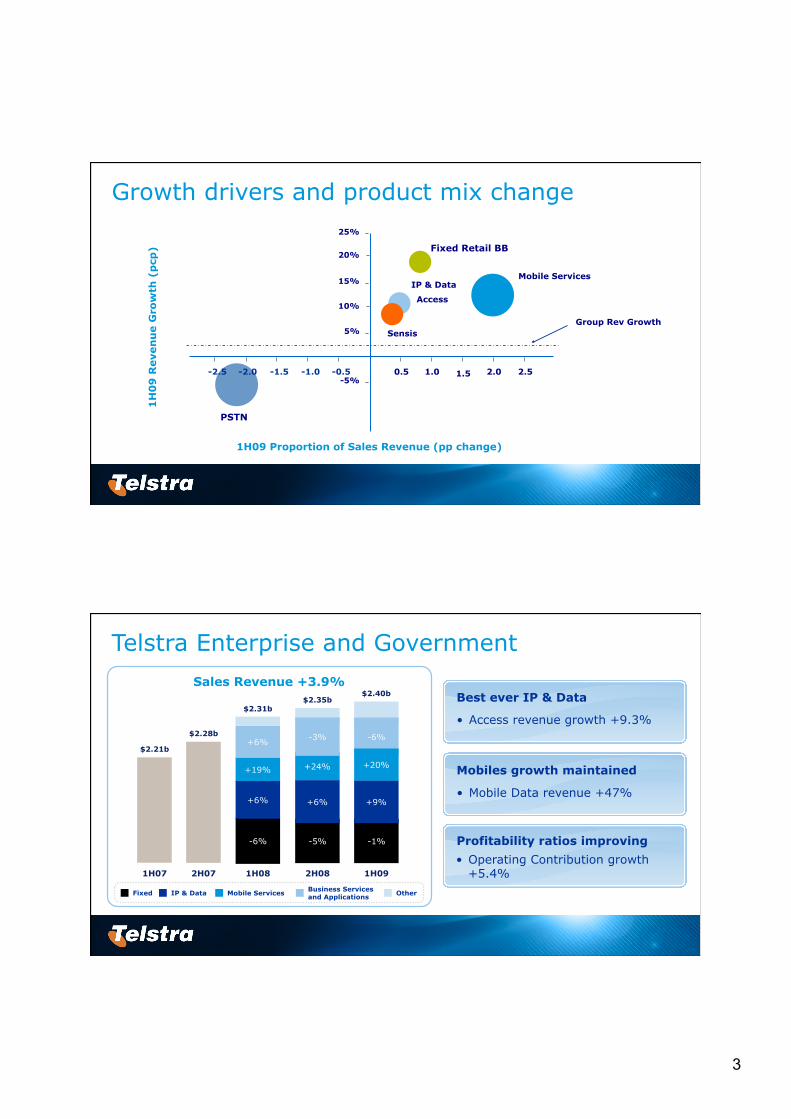
Growth drivers and product mix change
Fixed Retail BB
IP & Data
Access
-5%
5%
15%
25%
1H09 Proportion of Sales Revenue (pp change)
1H
09
Reven
ue G
row
th (
pcp
)
PSTN
Group Rev Growth
Mobile Services
Sensis
10%
20%
-2.5 -2.0 -1.5 -1.0 -0.5 0.5 1.0 1.5 2.0 2.5
Telstra Enterprise and Government
Sales Revenue +3.9%
IP & Data Mobile Services Fixed Business Services and Applications Other
• Access revenue growth +9.3%
• Mobile Data revenue +47%
1H09 1H07
$2.31b
$2.21b
2H07
$2.28b
$2.40b
1H08
-6%
+19%
+6%
+6%
-1%
+9%
-6%
2H08
$2.35b
+24%
-5%
+6%
-3%
+20%
Best ever IP & Data
Mobiles growth maintained
Profitability ratios improving
• Operating Contribution growth +5.4%
4
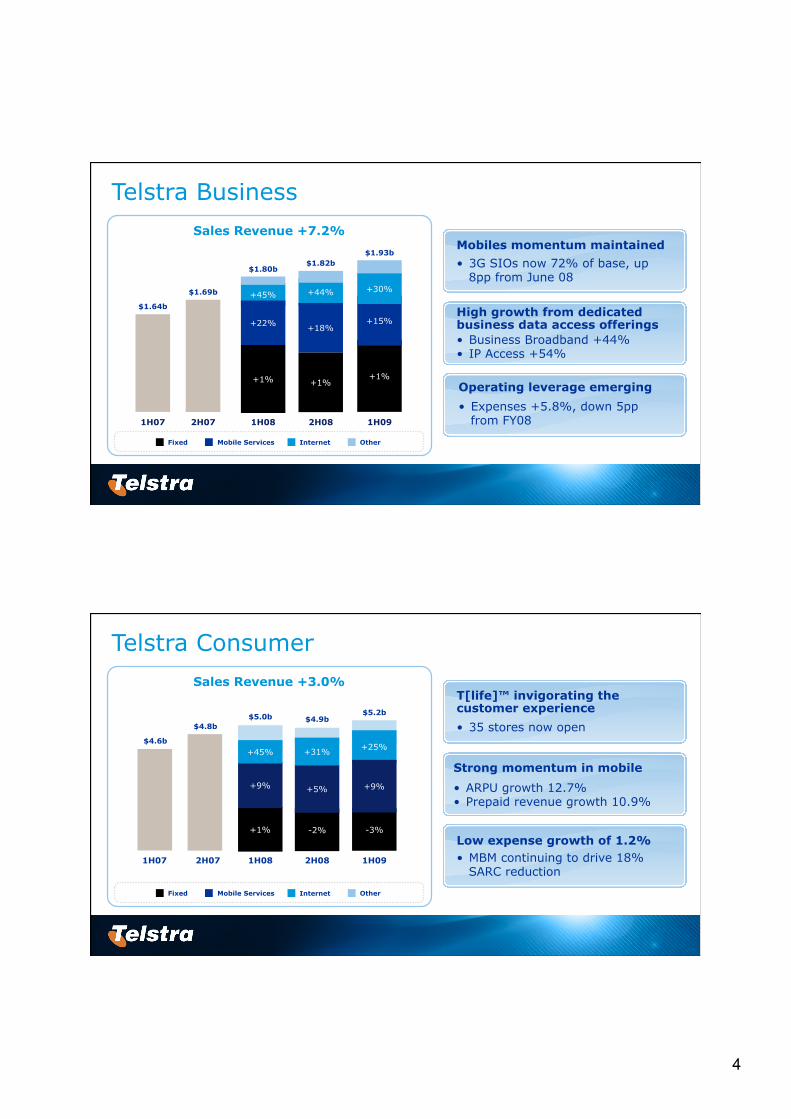
Telstra Business
• 3G SIOs now 72% of base, up 8pp from June 08
• Business Broadband +44% • IP Access +54%
2H08 1H07
$1.80b
$1.64b
2H07
$1.69b
$1.82b
1H08
+1%
+45%
+22%
+44%
+1%
+18%
1H09
$1.93b
+1%
+15%
Mobile Services Internet Fixed Other
+30%
• Expenses +5.8%, down 5pp from FY08
Mobiles momentum maintained
High growth from dedicated business data access offerings
Operating leverage emerging
Sales Revenue +7.2%
Telstra Consumer
1H09 1H07 2H07 1H08 2H08
$5.0b
$4.6b
$4.8b
$5.2b
+1%
+9%
-3%
$4.9b
-2%
+5%
+45% +31% +25%
+9%
Sales Revenue +3.0%
Mobile Services Internet Fixed Other
• 35 stores now open
T[life]™ invigorating the customer experience
Strong momentum in mobile
• ARPU growth 12.7% • Prepaid revenue growth 10.9%
Low expense growth of 1.2% • MBM continuing to drive 18%
SARC reduction
5
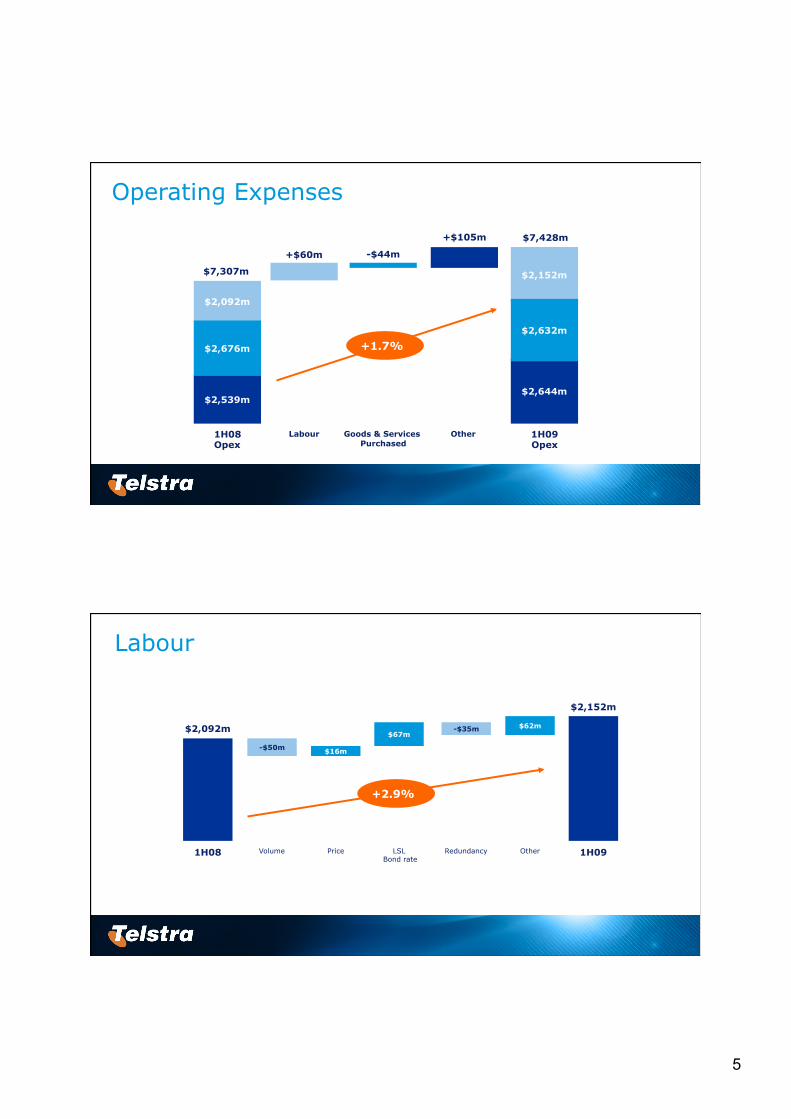
Operating Expenses
1H08 Opex
-$44m
Other Goods & Services Purchased
+$105m
1H09 Opex
+$60m
Labour
$2,644m
$2,152m
$2,632m
$2,539m
$2,092m
$2,676m
$7,307m
$7,428m
+1.7%
Labour
$16m
$67m $62m
-$50m
-$35m
$2,152m
LSL Bond rate
1H08 Volume Price Redundancy Other 1H09
$2,092m
+2.9%
6
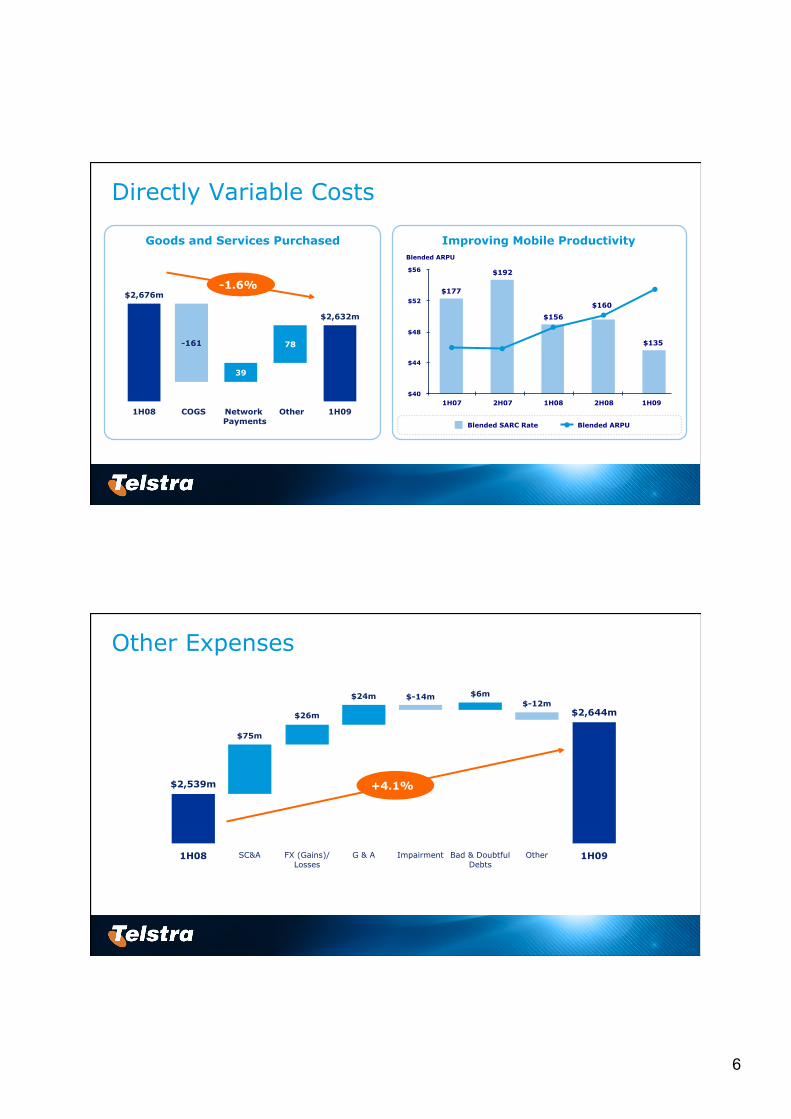
Directly Variable Costs
39
78 -161
$2,632m
$2,676m
1H08 COGS Network Payments
Other 1H09
Improving Mobile Productivity
-1.6% $177
$192
$156 $160
$135
1H07 2H07 1H08 2H08 1H09 $40
$44
$48
$52
$56 Blended ARPU
Blended SARC Rate Blended ARPU
Goods and Services Purchased
Other Expenses
1H08 1H09 SC&A FX (Gains)/ Losses
G & A Impairment Other
$75m
$26m
$24m $-14m $-12m
$2,539m
$2,644m
+4.1%
Bad & Doubtful Debts
$6m
7
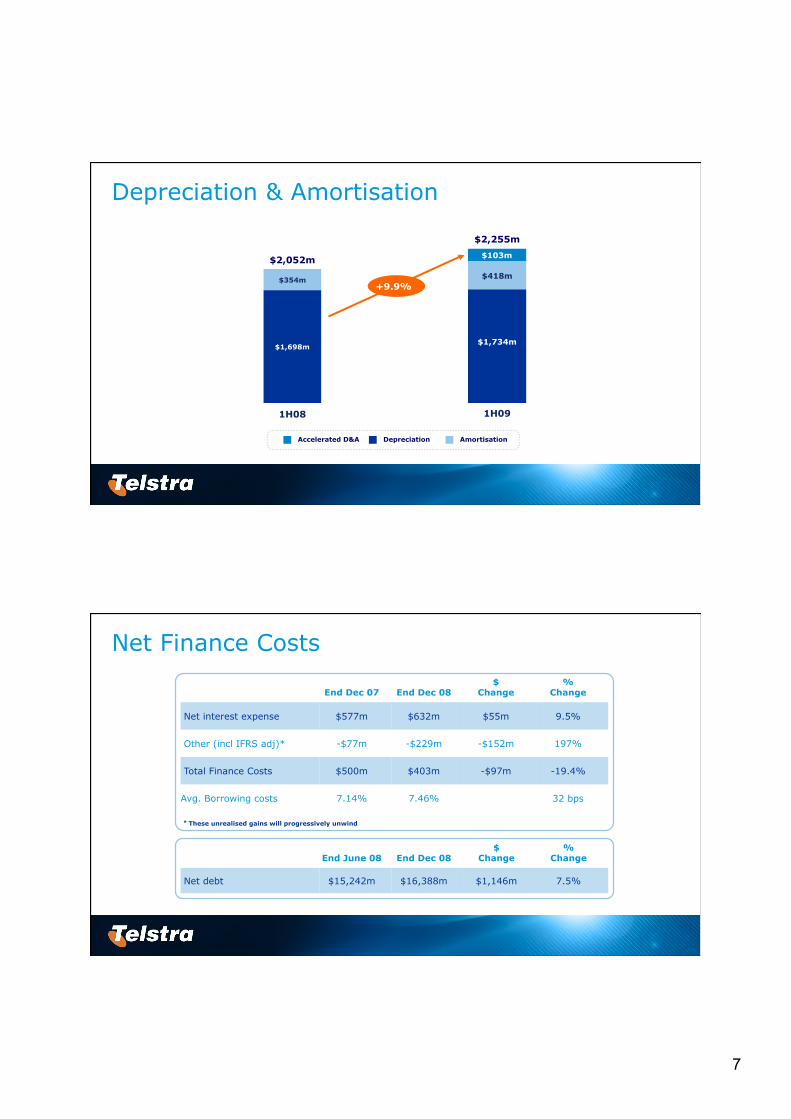
Depreciation & Amortisation
$103m
$418m $354m
$1,698m $1,734m
1H08 1H09
$2,052m
$2,255m
+9.9%
Accelerated D&A Depreciation Amortisation
Net Finance Costs
End Dec 07 End Dec 08 $
Change %
Change
Net interest expense $577m $632m $55m 9.5%
Other (incl IFRS adj)* -$77m -$229m -$152m 197%
Total Finance Costs $500m $403m -$97m -19.4%
Avg. Borrowing costs 7.14% 7.46% 32 bps
* These unrealised gains will progressively unwind
End June 08 End Dec 08 $
Change %
Change
Net debt $15,242m $16,388m $1,146m 7.5%
8
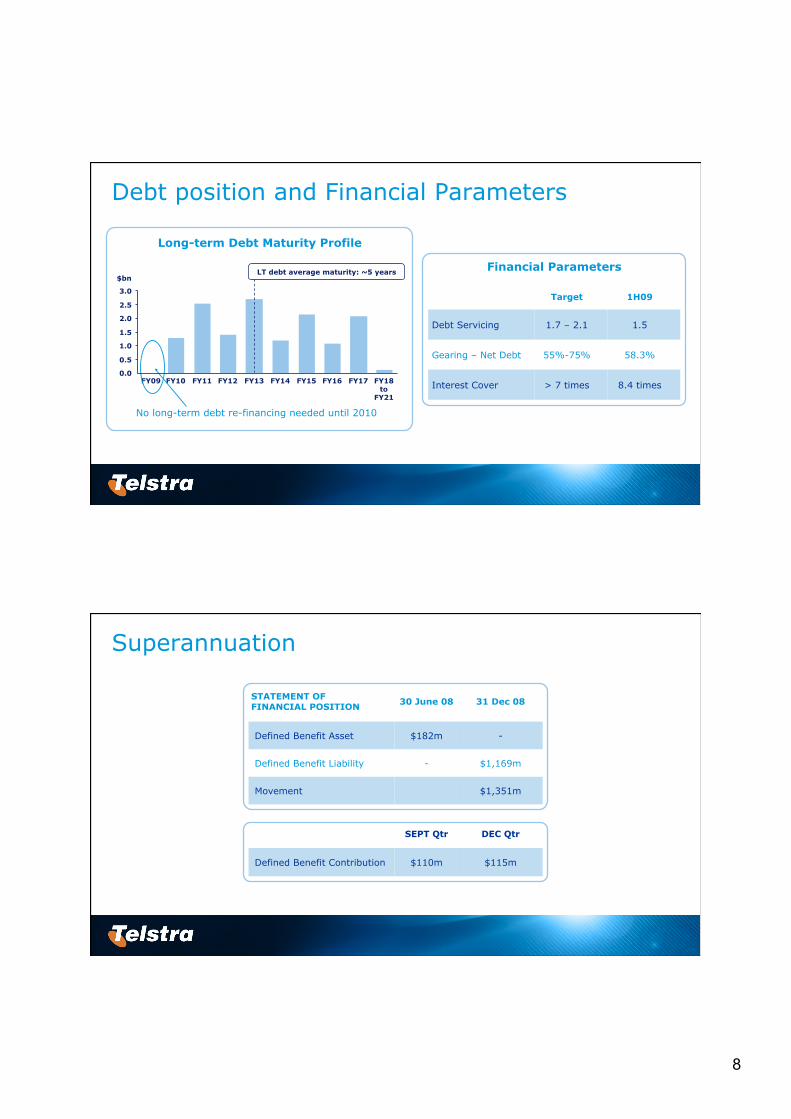
Debt position and Financial Parameters
Long-term Debt Maturity Profile
FY18 to
FY21
$bn
0.0
0.5
1.0
1.5
2.0
2.5
3.0
FY09 FY10 FY11 FY12 FY13 FY14 FY15 FY16 FY17
No long-term debt re-financing needed until 2010
LT debt average maturity: ~5 years Financial Parameters
Target 1H09
Debt Servicing 1.7 – 2.1 1.5
Gearing – Net Debt 55%-75% 58.3%
Interest Cover > 7 times 8.4 times
Superannuation
STATEMENT OF FINANCIAL POSITION 30 June 08 31 Dec 08
Defined Benefit Asset $182m -
Defined Benefit Liability - $1,169m
Movement $1,351m
SEPT Qtr DEC Qtr
Defined Benefit Contribution $110m $115m
9
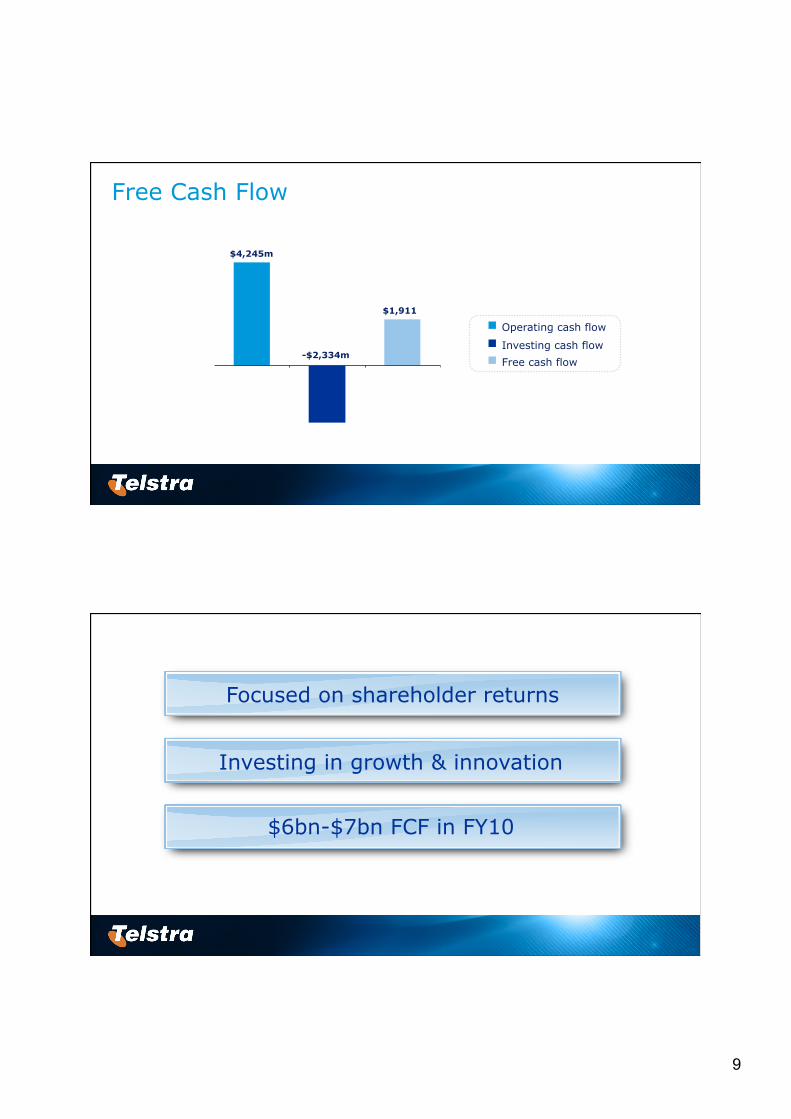
Free Cash Flow
Operating cash flow
Investing cash flow
Free cash flow
$4,245m
-$2,334m
$1,911
Focused on shareholder returns
Investing in growth & innovation
$6bn-$7bn FCF in FY10
10
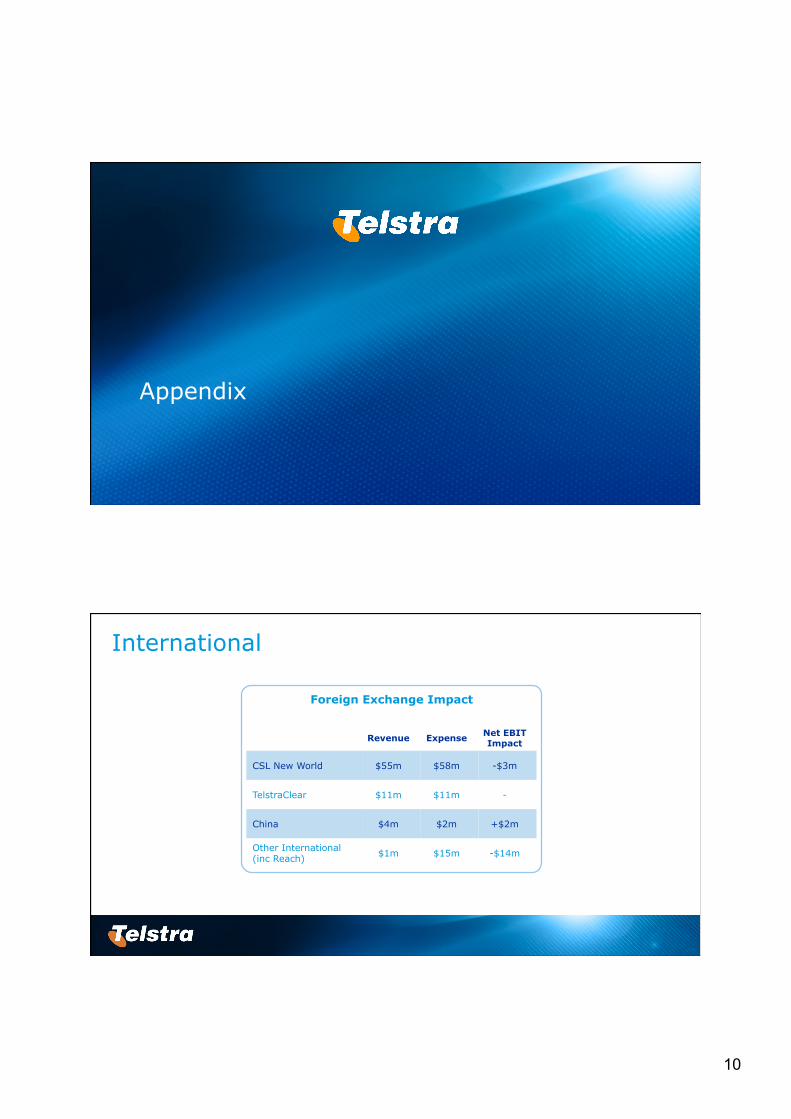
Appendix
International
Foreign Exchange Impact
Revenue Expense Net EBIT Impact
CSL New World $55m $58m -$3m
TelstraClear $11m $11m -
China $4m $2m +$2m
Other International (inc Reach) $1m $15m -$14m
11
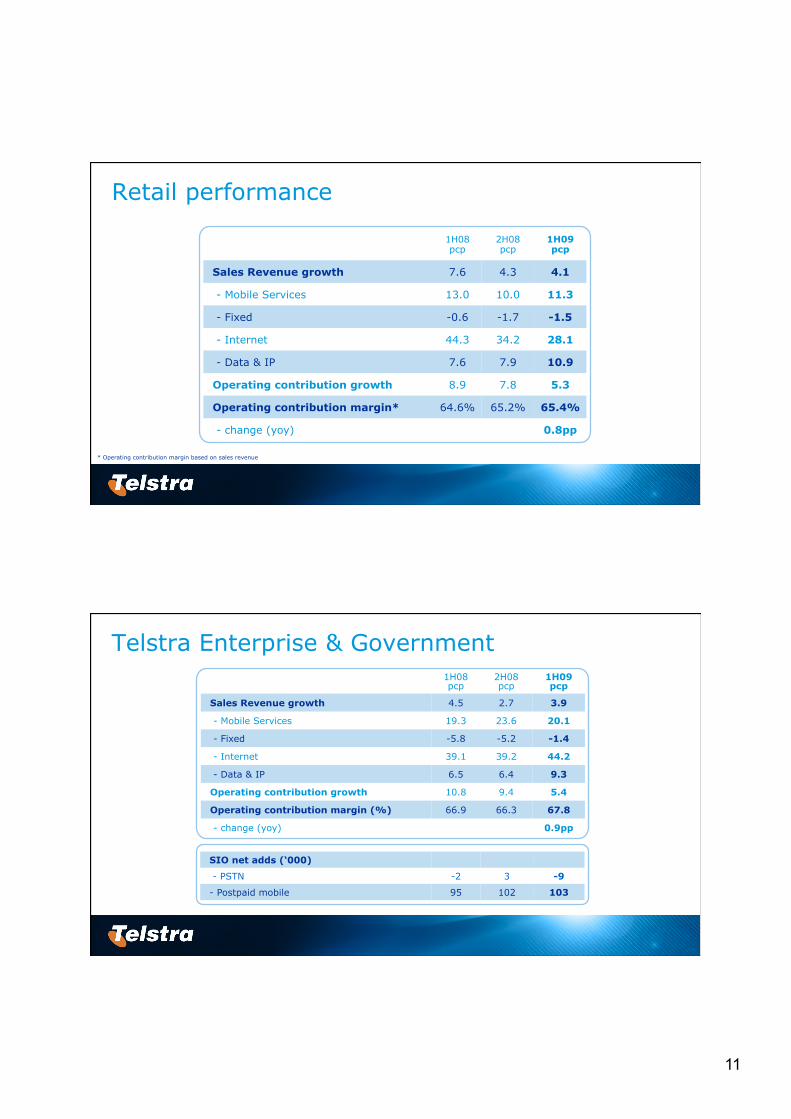
Retail performance
1H08 pcp
2H08 pcp
1H09 pcp
Sales Revenue growth 7.6 4.3 4.1
- Mobile Services 13.0 10.0 11.3
- Fixed -0.6 -1.7 -1.5
- Internet 44.3 34.2 28.1
- Data & IP 7.6 7.9 10.9
Operating contribution growth 8.9 7.8 5.3
Operating contribution margin* 64.6% 65.2% 65.4%
- change (yoy) 0.8pp
* Operating contribution margin based on sales revenue
Telstra Enterprise & Government 1H08 pcp
2H08 pcp
1H09 pcp
Sales Revenue growth 4.5 2.7 3.9
- Mobile Services 19.3 23.6 20.1
- Fixed -5.8 -5.2 -1.4
- Internet 39.1 39.2 44.2
- Data & IP 6.5 6.4 9.3
Operating contribution growth 10.8 9.4 5.4
Operating contribution margin (%) 66.9 66.3 67.8
- change (yoy) 0.9pp
SIO net adds (‘000)
- PSTN -2 3 -9
- Postpaid mobile 95 102 103
12
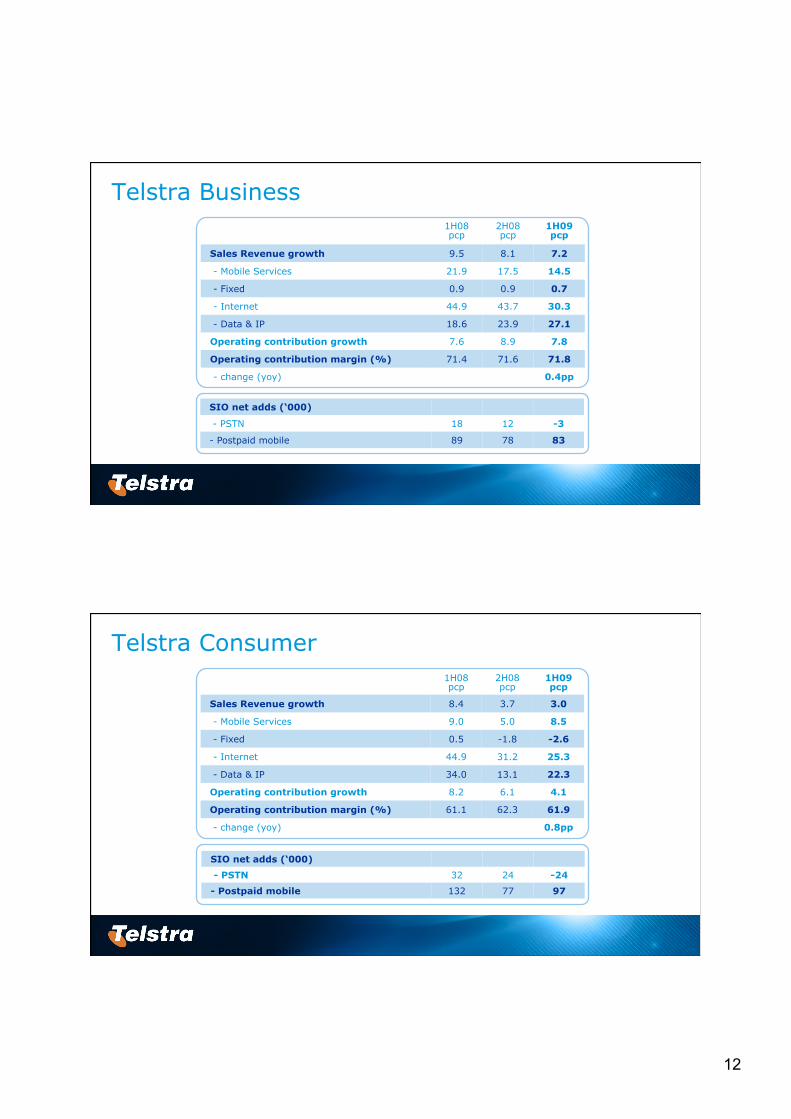
Telstra Business 1H08 pcp
2H08 pcp
1H09 pcp
Sales Revenue growth 9.5 8.1 7.2
- Mobile Services 21.9 17.5 14.5
- Fixed 0.9 0.9 0.7
- Internet 44.9 43.7 30.3
- Data & IP 18.6 23.9 27.1
Operating contribution growth 7.6 8.9 7.8
Operating contribution margin (%) 71.4 71.6 71.8
- change (yoy) 0.4pp
SIO net adds (‘000)
- PSTN 18 12 -3
- Postpaid mobile 89 78 83
Telstra Consumer 1H08 pcp
2H08 pcp
1H09 pcp
Sales Revenue growth 8.4 3.7 3.0
- Mobile Services 9.0 5.0 8.5
- Fixed 0.5 -1.8 -2.6
- Internet 44.9 31.2 25.3
- Data & IP 34.0 13.1 22.3
Operating contribution growth 8.2 6.1 4.1
Operating contribution margin (%) 61.1 62.3 61.9
- change (yoy) 0.8pp
SIO net adds (‘000)
- PSTN 32 24 -24
- Postpaid mobile 132 77 97
13
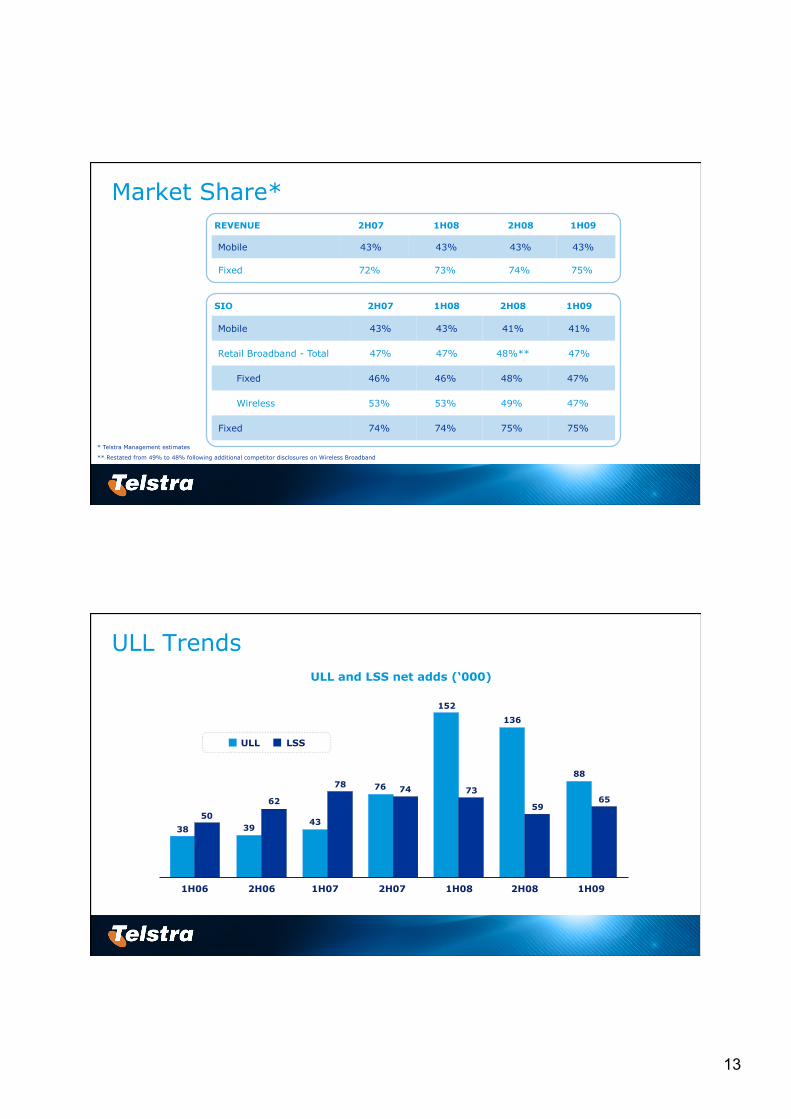
Market Share*
* Telstra Management estimates
** Restated from 49% to 48% following additional competitor disclosures on Wireless Broadband
SIO 2H07 1H08 2H08 1H09
Mobile 43% 43% 41% 41%
Retail Broadband - Total 47% 47% 48%** 47%
Fixed 46% 46% 48% 47%
Wireless 53% 53% 49% 47%
Fixed 74% 74% 75% 75%
REVENUE 2H07 1H08 2H08 1H09
Mobile 43% 43% 43% 43%
Fixed 72% 73% 74% 75%
ULL Trends ULL and LSS net adds (‘000)
1H08 1H06 2H06 1H07 2H07 1H09 2H08
ULL LSS
38
50 39
62
43
78 76 74
152
73
136
59
88
65