2.1. how to configure the modules, measurement points and
TRANSCRIPT

2.1. How to configure the modules, measurement points and parameters? The CONFIGURATION menu assists the user in defining the modules and inserting the corresponding drafts. The pictures can be copied using the copy (CTRL + C) and paste (CTRL + V) commands. Some comments are introduced depending on the selected model. For this case study only cement grinding #1 and #3 are used. This is explained also in the Fig. 4.
Fig. 4. The Technological Process Flow The cement plant architecture is “captured” module by module in the next pictures. The Fig. 5 presents the Marl Crushing Modules. The same drawing is used for all marl crushing units. The Raw Materials Drying – Grinding module description is giving in the Fig. 6, and the Slag Drying module is presented in the Fig. 7.
2 - 3
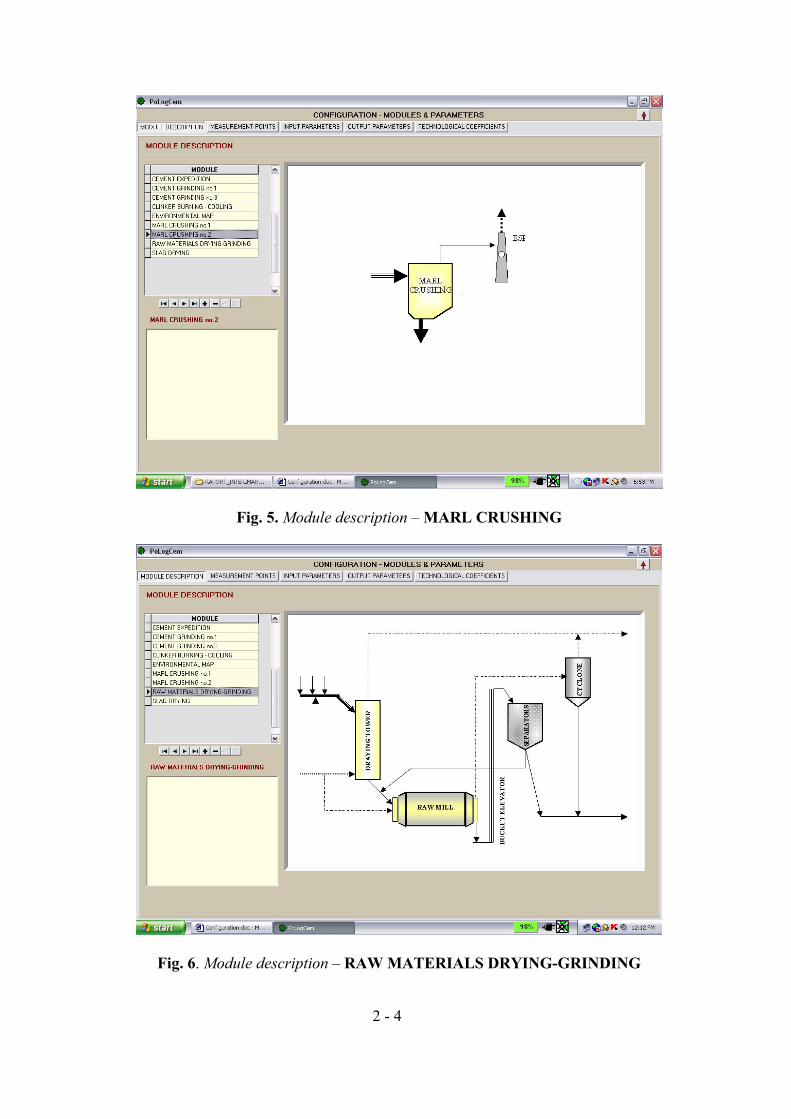
Fig. 5. Module description – MARL CRUSHING
Fig. 6. Module description – RAW MATERIALS DRYING-GRINDING
2 - 4

Fig. 7. Module description – SLAG DRYING
From the point of view of the environmental protection, the clinker burning is the most important part of the process because the key environmental emissions are nitrogen oxides (NOx), sulphur dioxide (SO2) and gray dust. For further remarks, an important report is ECR . The control of the pollution dynamics asks for taking into account the whole pollution chain. According to CEPROCIM , the measurement was achieved by using special instruments and adequate procedures: TESTO 350, TESTO 400, TESTO 440, TESTO 450, TESTO 920, PS 003 LM, JIS K 103, etc. The Clinker Burning – Cooling module is described in the Fig. 8.
Fig. 8. Module description – CLINKER BURNING - COOLING
2 - 5

The Cement Grinding modules is described in the Fig. 9, and the Cement Expedition unit is shown in the Fig. 10. The Tasca cement plant uses three cement grinding units, but actually, there are used only two of them (the units no. 1 & no. 3).
Fig. 9. Module description – CEMENT GRINDING
Fig. 10. Module description – CEMENT EXPEDITION
2 - 6

The environmental map can be introduced as shown in the Fig. 11. A satellite view of the Tasca region, captured by http://maps.google.com, is shown in the Fig. 12. See also the link http://www.indexmundi.com/z/?lat=46.9&lon=26.0166667&t=p&r=13080&p=tasca&cc=ro&c=romania.
Fig. 11. Module description – The ENVIRONMENTAL MAP
Fig. 12. The TASCA region – Google Imagery (acknowledgement) 2 - 7

The measurement points can be recorded in a usually way (the options add, delete and scroll are available). For every module can be defined the input/output points (a code, the coordinates and a short description, if necessary). The procedure is repeated for every module.
The layout of the working window is captured in the Fig. 13 for the Clinker Burning-Cooling module. Both classes of measurement points (input and output) can be processed.
The list of the input points.
The list of the output points.
Fig. 13. The Measurement Points Tag
The Fig. 14 describes the working window for defining the input parameters. The operation is repeated for all the modules and measurement points. Similar images are shown for the output parameters in the Fig. 15. Also technological coefficients can be defined and used in the optimization module.
As a general rule, input and output data must have different names. By activating the button
the minimum and maximum values of the parameters based on the existing measurements will be provided.
The parameters can belong to the following data types: • The numeric value, • The alphanumeric value (string type), • The date-time value.
For the appropriate types an interval of values will be associated. For the technological parameters will be provided a name, a value and some additional description.
2 - 8

Fig. 14. The Input Parameters Tag
Fig. 15. The Output Parameters Tag
2 - 9