2019 national budget national budget volume 1 economic and development policies for the year ending...
TRANSCRIPT
I
2019 NATIONAL BUDGET
VOLUME 1 ECONOMIC AND DEVELOPMENT POLICIES
For the year ending 31st December 2019
PRESENTED BY
HON. CHARLES ABEL, MP
DEPUTY PRIME MINISTER AND MINISTER FOR TREASURY
ON THE OCCASION OF THE PRESENTATION OF THE 2019 NATIONAL BUDGET

2019 National Budget, Volume 1
ii
HON. CHARLES ABEL, MP
DEPUTY PRIME MINISTER AND MINISTER FOR TREASURY

2019 National Budget, Volume 1
iii
FOREWORD
On behalf of the O’Neill-Abel Government, I am delighted to present the 2019 National Budget under the theme: “Building A Broader Based Economy.” Our development journey continues to be guided by the groundwork laid particularly since 2011/12 under the leadership of Prime Minister, Hon. Peter O’Neill and the coalition agreement, Alotau Accord I. Since returning to power in 2017 under Alotau Accord II, the new coalition Government responded to some difficult circumstances through the 100 Day/25 Point Plan (25PP) to; “ENSURE SOUND MACROECONOMIC AND FISCAL MANAGEMENT, RESTORE CONFIDENCE AND GENERATE INVESTMENT by - MAINTAINING FISCAL DISCIPLINE, BOOSTING FOREIGN EXCHANGE, GROWING REVENUES, STRENGTHENING OUR ECONOMIC BASE, IMPROVING GOVERNANCE AND ACTING STRATEGICALLY. The 25PP commenced with the 2017 Supplementary Budget which necessitated significant cuts to the capital budget to maintain the fiscal deficit and debt parameters of the 2017 Budget proper. The 2018 Budget, also a feature of the 25PP continued the reforms and has seen significant progress on many fronts. The 2019 budget builds on the considerable progress that has been made under this framework. We have increased revenue collection, improved fiscal discipline, and enhanced governance arrangements through the substantial reforms that have been put in place under this Government’s Medium Term Revenue Strategy (a 25PP initiative), Medium Term Fiscal Strategy, and Medium Term Debt Strategy. Together these measures provide for sound macroeconomic and fiscal management to keep building confidence in our economy, increase and diversify investment, replace imports, boost exports and reduce reliance on debt, in order to deliver better social services, infrastructure and employment and business opportunities for the people of Papua New Guinea. All of which are consistent with the aspirations of the people as articulated through the National Planning Framework, including Vision 2050, StaRS and the Medium Term Development Plan III (2018 - 2022). The declining trend in government revenues in the years up to 2016 has been turned around. The reforms under the Medium Term Revenue Strategy 2018-2022 underpinning this turnaround will continue. Non grant revenue for 2018 is expected to exceed what was forecast in the budget and come in at K2.603 billion above the out turn for 2016. The revised estimate for total revenue and grants for 2018 is K13,400.3 million against the budget estimate of K12,730.7 million, which represents approximately 15.0 per cent of GDP (up from 13.0 per cent in 2016). Importantly, the revenue increases are due to growth in both mineral and non-mineral receipts. This result was despite the massive earthquake that struck in February which caused severe social and economic disruptions and dampened GDP growth significantly. These effects were mitigated by increased nameplate production from the PNG LNG Project and improved oil and gas prices. Additionally, the mobilisation of non-tax revenue through the enactment of the Public Monies Management Regularisation (PMMR) Act 2017 resulted in the transfer of significant funds to the Consolidated Revenue Fund in support of the Budget execution.

2019 National Budget, Volume 1
iv
The successes of the 2018 Budget have only been marred by some continued expenditure overruns related to rising government payroll costs. Instructions have been issued to tighten spending over the remaining months of 2018 to minimise this, and we will redouble our efforts to control expenditure into the new year. The Government target is to keep personnel emoluments to six per cent of GDP. Commencing on 1st January 2019, we intend to completely overhaul the payroll process with salaries and wages controlled by warrants and hard ceilings, just as is the case for the purchase of goods and services. Any agency that overspends on their payroll will have to find savings elsewhere in their budget. The procurement process to engage independent auditors to review the payroll system has commenced. We expect to see revenues continue to grow in 2019, with an increase of 45.0 per cent on 2016 non-grant revenues anticipated, further reflecting the turn-around in revenue growth since then. Amongst other measures, this Budget introduces a 50.0 per cent minimum dividend
policy rate for State Owned Enterprises to increase returns to the Government. Total revenue and grants for 2019 is projected at K14,266.8 million, which is an increase of approximately 12.1 per cent over the 2018 Budget.
The better than expected revenue forecasts means that we have been able to increase the expenditure envelope, which is set at K16,133.5 million, representing an increase in the order of 9.0 per cent over the 2018 Budget estimate and K2.3 billion more than in 2016. The Government will continue to meet its primary commitments to Infrastructure, Education, Health, Law and Order, Agriculture, Tourism and SMEs. Subnational empowerment continues through Provincial Government's and Districts and the capital budget introduces new intervention programs to support this. Importantly, this Government’s reform agenda has led to unprecedented success in achieving our ambitious international financing plan. Raising USD500.0 million through the 10-year sovereign bond issue was a significant milestone for our country. In difficult international circumstances, the bond was oversubscribed by as much as seven times, demonstrating very strong interest and investor confidence in our economy and the Government’s fiscal and financial management. Strategically, the country’s first ever bond issue coincided with the enormous boost to our global profile that has come from the investment we have made in hosting the APEC Leaders’ Summit. Greater international interest and appreciation of our country bodes well for attracting future investment, which is crucial to create more and better paying jobs, continue diversifying our economy, and make it more inclusive; notably through advances in tourism, agricultural productivity, local value-added industries, and by harnessing the digital revolution. The foundations for these advances will be sustained by continuing investments in the priority areas of health and education, law and order, nation building infrastructure, support for the development of our small and medium enterprises, and advancing financial inclusion through financial literacy programs, adopting digital financial services and spreading mobile banking capabilities. The injection of international financing from the sovereign bond issue has been coupled with breakthrough access to direct budget support through facilities provided for the first time by the Asian Development Bank (USD300.0 million over three years), and for the first time in over 20 years by the World Bank (USD300.0 million over three years). Additionally, the Government is in discussions with a large commercial bank for a further low-cost budget support loan of USD300.0 million to support the 2019 Budget.

2019 National Budget, Volume 1
v
These new external financing facilities exemplify the growing confidence in, and respect for, our current approach to fiscal discipline, and the robustness of our systems. These have been successfully tested through the acute international scrutiny that came through engaging in these processes. We welcome such tests as they not only highlight the advances that have been made in recent years, but also serve to ensure we are continually improving. As we deepen our relationships with our multilateral and bilateral partners in this way, we will be better placed to fully align these partnerships to our national vision and priorities. Importantly, the proceeds from these external financing streams will be used to fund the financing requirements of the 2019 operational and development budgets, break the reliance on expensive short term domestic debt, and help extinguish the foreign exchange imbalance. Already, the 2018 drawdowns have helped ease the delay in fulfilling orders for foreign exchange, but we will not rest until balance is restored so our businesses can trade without hindrance. The bond and budget support are an essential ingredient of the planned debt restructuring, solving the foreign exchange problem, and to deliver the other priorities outlined in the 25PP and the National Planning Framework. They have been carefully applied so there are no significant additional debt service costs to the fiscal programme. The expected 2018 fiscal deficit (estimated at K1,897.2 million, being 2.3 per cent of GDP) is lower than anticipated, with the debt to GDP ratio expected to end the year at 30.9 per cent. This is well within the 30 to 35 per cent range prescribed by the Fiscal Responsibility Act (Amended 2017), and the 25PP target of being capped at 30 per cent by 2022. The 2019 Budget anticipates these trends to continue, with net borrowing set at K1,866.7 million (2.1 per cent of GDP), which will translate into a debt to GDP ratio of 30.8 per cent. The Fiscal Responsibility Act also requires that the Government target a zero average non-resource primary balance over the medium term, and we are also trending in the right direction in this respect. The prudent fiscal and financial management of this Government has given us the opportunity to provide personal tax relief that is targeted at helping low income earners. The 2019 Budget therefore raises the threshold for the two lower tax brackets. Empowering our business community and promoting opportunities for increasing and diversifying private sector investment remains an ongoing priority of this Government. We have enacted measures to support the expansion of our manufacturing and agricultural sectors. Changes to the tariff and excise rates in 2018 resulted in a significant boost in investment by local businesses, with no discernible increase in prices. We have also witnessed how the changes to the fisheries subsidies resulted in a considerable increase in onshore production. The 2019 Budget makes allowances for further changes in excise and tariff rates to further boost investment, local production, and import replacement. A framework and structure has also been put in place to tackle illicit trade, and we expect to see positive results as these are implemented in 2019. Other proposed changes are geared towards ensuring that we have a fair taxation system that continues to evolve at a pace commensurate with promoting sustainable and equitable economic growth. These are all essential components to expand both the size and makeup of the economy, which is a significant feature of the 25PP.

2019 National Budget, Volume 1
vi
By the end of 2018, all of the commodities boards should be properly constituted and functional. This Government is committed to the ongoing strengthening of governance, especially as it relates to increasing the transparency and effective management of public monies. In 2019 some of the large infrastructure projects that have been initiated under the 25PP will come online, including the international submarine cable and domestic broadband cable that will vastly improve connectivity and reduce costs. Progress will continue on the other key national infrastructure programs, including the Highlands Highway, the Port Moresby, Lae Ports and provincial ports upgrades, the missing link roads program, and the hydro and gas power generation, airport terminal and runway upgrading. These are vital transformational projects that will reduce costs for businesses and consumers, improve market access for rural farmers, and promote the further expansion of the private sector. Amidst the successes of 2018, we also experienced a number of significant difficulties. Not least of which was the devastating earthquake that tragically claimed so many lives, took away the livelihoods of families and communities, severely disrupted business and industry, and threatened a deep economic downturn. So much so that the country’s credit rating was downgraded. In the face of this and other adversities, including the polio outbreak, we rallied together as a nation in support of the people affected, to minimise the broader impacts, and quickly set the country back on the path to recovery. As we look to 2019 and beyond, this year has shown how substantial progress can be made even in the face of adversity. The progress highlighted above demonstrates that the O’Neill-Abel Government approach towards implementing the Alotau Accord II has balanced the level of ambition against the need for fiscal responsibility, by ensuring we spend wisely and within our means. Critically, our strategies seek to ultimately get the country to a position where we can fully fund our recurrent costs, significantly expand our capital budgets and generate savings for future generations through a Sovereign Wealth Fund. As we wind up APEC activities and bid farewell to our international guests, we not only retain the substantial infrastructure improvements built for this historic event and the bolstered trade and economic relationships, we also takeaway the rejuvenated sense of pride and resilience that have underscored the national spirit this year. If we continue to harness this spirit, together we can continue to build a better future for our country. The 2019 Budget is a holistic framework to fix lingering issues from our past, serve the needs of today, and set the foundations to further “Building A Broader Economic Base”. I commend the 2019 Budget to the Honorable Members and to the people of Papua New Guinea.
..........................................
HON. CHARLES ABEL, MP DEPUTY PRIME MINISTER AND MINISTER FOR TREASURY
2019 National Budget, Volume 1
vii
Contents HON. CHARLES ABEL, MP ..................................................................................................................VI
CHAPTER 1: BUDGET OVERVIEW ..................................................................................................... 1
1.1 ECONOMIC OUTLOOK ........................................................................................................................... 1
1.2 FISCAL DEVELOPMENTS IN 2018 ........................................................................................................... 2
1.3 2018 SUPPLEMENTARY BUDGET .......................................................................................................... 5
1.4 THE 2019 BUDGET AND OUTLOOK ....................................................................................................... 6
1.5 TAX EXPENDITURES .............................................................................................................................. 8
1.6 NATIONAL REFORM AGENDA ............................................................................................................... 9
1.7 IMPROVING STATE’S COMMERCIAL INVESTMENTS .......................................................................... 11
CHAPTER 2: ECONOMIC DEVELOPMENTS AND OUTLOOK ........................................................ 14
2.1 WORLD ECONOMIC GROWTH AND OUTLOOK – CHALLENGES TO STEADY GROWTH ....................... 14
2.2 EXCHANGE RATE DEVELOPMENTS ..................................................................................................... 24
2.3 DOMESTIC ECONOMIC DEVELOPMENTS AND OUTLOOK .................................................................. 25
2.4 2019 ECONOMIC OUTLOOK ................................................................................................................ 29
2.5 LABOUR MARKET ................................................................................................................................ 32
2.6 MONETARY DEVELOPMENTS ............................................................................................................. 34
2.7 CONSUMER PRICE INDEX .................................................................................................................... 35
2.8 BALANCE OF PAYMENTS AND INTERNATIONAL RESERVES ............................................................... 38
2.9 RISKS TO MACROECONOMIC STABILITY ............................................................................................. 41
CHAPTER 3: FISCAL STRATEGY AND OUTLOOK ......................................................................... 43
3.1 FISCAL BACKGROUND - 2018 BUDGET UPDATE ................................................................................. 43
3.2 2018 SUPPLEMENTARY BUDGET ........................................................................................................ 46
3.3 THE 2019 BUDGET STRATEGY ............................................................................................................. 49
3.4 THE MEDIUM TERM FISCAL OUTLOOK ............................................................................................... 52
3.5 MEDIUM TERM FISCAL STRATEGY 2018-2022 .................................................................................... 56
CHAPTER 4: REVENUE ..................................................................................................................... 63
4.1 2018 AND 2019 REVENUE DEVELOPMENTS AND OUTLOOK .............................................................. 63
4.2 TAX REVENUE ...................................................................................................................................... 64
4.3 OTHER REVENUE ................................................................................................................................. 68
4.4 GRANTS ............................................................................................................................................... 69
4.5 MEDIUM TERM REVENUE OUTLOOK .................................................................................................. 71
CHAPTER 5: TAX AND NON-TAX MEASURES AND DEVELOPMENTS ......................................... 74
5.1 OVERVIEW .......................................................................................................................................... 74
5.2 MTRS GOALS AND PROGRESSIVE UPDATE ......................................................................................... 75
5.3 MAJOR TAX POLICY MEASURES .......................................................................................................... 77
5.4 MINOR TAX POLICY MEASURES .......................................................................................................... 83
5.5 TECHNICAL AND HOUSE KEEPING AMENDMENTS ............................................................................. 86
5.6 ANNOUNCEMENTS OF POLICY DEVELOPMENT AREA IN 2019 ........................................................... 87
CHAPTER 6: EXPENDITURE ............................................................................................................. 91
6.1 OVERVIEW .......................................................................................................................................... 91
6.2 DONOR FUNDING FROM DEVELOPMENT PARTNERS ........................................................................ 93
6.3 BUDGET REFORMS .............................................................................................................................. 95
6.4 SECTOR EXPENDITURE ........................................................................................................................ 96

2019 National Budget, Volume 1
viii
6.5 NON-FINANCIAL INSTRUCTIONS ...................................................................................................... 108
6.6 TRUST ACCOUNTS ............................................................................................................................. 111
6.7 APPROPRIATION FOR TRUST ACCOUNTS: 2017 – 2018 .................................................................... 112
6.8 TRUST ACCOUNT FUND MOVEMENTS IN 2018 ................................................................................ 113
CHAPTER 7: TAX EXPENDITURE ................................................................................................. 116
7.1 OVERVIEW ........................................................................................................................................ 116
7.2 TAX EXPENDITURE STATEMENTS (TES) ............................................................................................ 116
7.3 TAX INCENTIVES IN THE INCOME TAX ACT 1959 .............................................................................. 117
7.4 GOODS AND SERVICE TAX (GST) ACT 2003 ....................................................................................... 123
7.5 TAX INCENTIVES ADMINISTERED BY THE CUSTOMS TARIFF ACT 1990 ............................................ 123
7.6 PNG LNG TAX EXPENDITURE ESTIMATES ......................................................................................... 124
7.7 CHALLENGES AND WAY FORWARD .................................................................................................. 127
CHAPTER 8: FINANCING AND DEBT MANAGEMENT STRATEGY ............................................ 128
8.1 FINANCING BACKGROUND TO THE 2018 BUDGET ........................................................................... 128
8.2 FINANCING REQUIREMENTS 2018 BUDGET AND 2019-22 PERIOD .................................................. 130
8.3 MEDIUM TERM DEBT STRATEGY (MTDS) .......................................................................................... 133
8.4 OPERATIONAL STRATEGIES 2019-2022/23 ...................................................................................... 134
8.5 MANAGING PORTFOLIO RISK 2019-23 ............................................................................................. 135
CHAPTER 9: NATIONAL REFORM AGENDA ................................................................................ 137
9.1 OVERVIEW ........................................................................................................................................ 137
9.2 PUBLIC SECTOR REFORM .................................................................................................................. 138
9.3 A COMPETITIVE AND DYNAMIC PRIVATE SECTOR ........................................................................... 144
9.4 ASIA PACIFIC ECONOMIC COOPERATION (APEC) ............................................................................. 149
9.5 IMPLEMENTATION OF THE SOVEREIGN WEALTH FUND OF PAPUA NEW GUINEA .......................... 150
CHAPTER 10: IMPROVING STATE’S COMMERCIAL INTEREST .................................................. 152
10.1 OVERVIEW ........................................................................................................................................ 152
10.2 SOE OBJECTIVE & STATE’S INVESTMENT PERFORMANCE ................................................................ 152
10.3 MANAGING MINING AND PETROLEUM ASSETS ............................................................................... 157
10.4 BROADER REFORMS ......................................................................................................................... 158
10.5 PUBLIC PRIVATE PARTNERSHIPS (PPP) ............................................................................................. 160
10.6 PNG EXTRACTIVE INDUSTRIES TRANSPARENCY INITIATIVE (PNGEITI) ............................................ 160

2019 National Budget, Volume 1
ix
Tables
TABLE 1: BUDGET BALANCE 2017 – 2019 (KINA, MILLION) ............................................................................................... 6
TABLE 2: 2018 SUPPLEMENTARY BUDGET ..................................................................................................................... 47
TABLE 3: DEFICIT FINANCING PROJECTIONS BY INSTRUMENT AND DEBT OUTSTANDING 2018 .................................................. 48
TABLE 4: 2019 BUDGET AND MEDIUM TERM REVENUE PROJECTIONS (KINA, MILLION) ......................................................... 50
TABLE 5: 2019 CAPITAL EXPENDITURE BUDGET (KINA, MILLION) ....................................................................................... 51
TABLE 6: 2019 CAPITAL BUDGET EXPENDITURE BY SECTORS (KINA, MILLION) ....................................................................... 51
TABLE 7: BUDGET BALANCE 2017 – 2019 (KINA, MILLION) ............................................................................................. 52
TABLE 8: BUDGET BALANCE 2018–2023 (% OF GDP) .................................................................................................... 55
TABLE 9: KEY REFORMS INCLUDED IN THE MEDIUM-TERM REVENUE STRATEGY 2018-2022 ................................................... 57
TABLE 10:KEY MEASURES INCLUDED IN THE MEDIUM TERM EXPENDITURE STRATEGY ............................................................ 60
TABLE 11:KEY MEASURES INCLUDED IN THE MEDIUM TERM DEBT STRATEGY ....................................................................... 61
TABLE 12: TOTAL REVENUE AND GRANTS (KINA, MILLION) ............................................................................................... 63
TABLE 13:TAXES ON INCOME AND PROFITS .................................................................................................................... 64
TABLE 14:TAXES ON PAYROLL AND WORKFORCE ............................................................................................................. 66
TABLE 15:TAXES ON GOODS AND SERVICES .................................................................................................................... 66
TABLE 16:TAXES ON INTERNATIONAL TRADE AND TRANSACTIONS ....................................................................................... 68
TABLE 17:OTHER REVENUE (KINA, MILLION).................................................................................................................. 68
TABLE 18:DONOR GRANT (KINA, MILLION) .................................................................................................................... 70
TABLE 19: PIT REFORMS, REVENUE IMPACT AND BENEFITS TO TAX PAYER IN 2019............................................................... 82
TABLE 20: 2019 AGGREGATE EXPENDITURE ................................................................................................................... 92
TABLE 21: 2019 EXPENDITURE BY SECTOR (KINA, MILLION) ............................................................................................. 93
TABLE 22: 2019 LOANS, GRANTS AND GOVERNMENT COUNTERPART FUNDING (KINA, MILLION) ............................................ 95
TABLE 23: GENERIC NFIS .......................................................................................................................................... 109
TABLE 24: SPECIFIC NFIS .......................................................................................................................................... 110
TABLE 25: UPDATE ON AMALGAMATING AGENCIES ....................................................................................................... 111
TABLE 26: SUMMARY OF TRUST ACCOUNTS MOVEMENTS: 2005 – 30TH SEPTEMBER 2018 (KINA, MILLION) ......................... 112
TABLE 27: APPROPRIATION OF 2018 PROGRAMS ADMINISTERED THROUGH TRUST (KINA, MILLIONS) .................................... 113
TABLE 28: MOVEMENT OF FUNDS IN TRUST ACCOUNTS 1ST JANUARY 2018 TO 30TH SEPTEMBER 2018 ................................... 113
TABLE 29: RECEIPTS INTO AND PAYMENTS OUT OF THE 2018 EARTHQUAKE DISASTER RESTORATION TRUST ............................ 115
TABLE 30: DEFICIT FINANCING PROJECTIONS BY INSTRUMENT AND DEBT OUTSTANDING 2017-18 ......................................... 130
TABLE 31:DEFICIT FINANCING PROJECTIONS BY INSTRUMENT 2018-2023 ( KINA, MILLION) ................................................ 132
TABLE 32: DEBT STOCK AS A SHARE OF GDP 2018-2022 (KINA, MILLION) ....................................................................... 133
TABLE 33:MERGING AGENCIES .................................................................................................................................. 139
TABLE 34: GENERAL BUSINESS TRUST (GBT ASSETS), AS AT 31ST DECEMBER 2017 ............................................................ 154
TABLE 35: DIVIDENDS PAID TO THE STATE. (K MILLION) .................................................................................................. 156

2019 National Budget, Volume 1
x
Charts
CHART 1: WORLD ECONOMIC GROWTH (1993-2023) .................................................................................................... 16
CHART 2:WORLD INFLATION (PER CENT GROWTH) .......................................................................................................... 18
CHART 3: IMF ALL COMMODITY PRICE INDEX ................................................................................................................. 19
CHART 4: PNG ALL COMMODITY PRICE INDEX ................................................................................................................ 19
CHART 5: CRUDE OIL PRICE ......................................................................................................................................... 19
CHART 6:CRUDE OIL PRICE AGAINST STOCK .................................................................................................................... 19
CHART 7: COPPER PRICE ............................................................................................................................................. 21
CHART 8: COPPER PRICE AGAINST STOCK ....................................................................................................................... 21
CHART 9: GOLD PRICE ................................................................................................................................................ 22
CHART 10: PRICE INDEX OF PALM OIL & COFFEE ............................................................................................................. 24
CHART 11: PRICE INDEX OF COPRA & COCOA ................................................................................................................. 24
CHART 12:TRADE WEIGHTED INDEX ............................................................................................................................. 25
CHART 13:EXCHANGE RATE DEVELOPMENTS .................................................................................................................. 25
CHART 14: REAL ECONOMIC GROWTH (2007-2022) ...................................................................................................... 27
CHART 15: CONTRIBUTION TO GROWTH BY SECTORS, 2018 AND 2019 .............................................................................. 30
CHART 16: EMPLOYMENT INDEX .................................................................................................................................. 32
CHART 17:TOTAL EMPLOYMENT GROWTH ..................................................................................................................... 32
CHART 18: MINING & NON MINING EMPLOYMENT GROWTH ........................................................................................... 33
CHART 19: INDUSTRIAL EMPLOYMENT GROWTH ............................................................................................................ 33
CHART 20: WAGES INDEX ........................................................................................................................................... 34
CHART 21: MONEY SUPPLY (ANNUAL, KINA MILLION) ..................................................................................................... 35
CHART 22: HEADLINE & UNDERLYING CPI- QUARTERLY ................................................................................................... 36
CHART 23:HEADLINE & UNDERLYING CPI- THROUGH-THE-YEAR ........................................................................................ 36
CHART 24:TRADEABLE VS NON-TRADEABLE INFLATION - ................................................................................................... 37
CHART 25: TRADEABLE VS NON-TRADEABLE ................................................................................................................... 37
CHART 26: INFLATION OUTCOME AND PROJECTION 2005-2023 ........................................................................................ 38
CHART 27: BALANCE OF PAYMENT (BOP)...................................................................................................................... 39
CHART 28: INTERNATIONAL RESERVES ........................................................................................................................... 40
CHART 29:NET BORROWING (-) / NET LENDING (+) AS A PERCENTAGE OF GDP OVER THE MEDIUM TERM ................................ 56
CHART 30:MEDIUM TERM FISCAL OUTLOOK .................................................................................................................. 56
CHART 31: ANNUAL REVENUE INFLOWS PNG LNG PROJECT – PROJECTIONS 2014-2040 ..................................................... 72
CHART 32:MEDIUM TERM REVENUE (2018-2023), KINA MILLION ................................................................................... 73

2019 National Budget, Volume 1
1
CHAPTER 1: BUDGET OVERVIEW 1.1 ECONOMIC OUTLOOK
Global growth is projected at 3.7 per cent for 2018-19, 0.2 percentage points lower for both years than forecasted in the April 2018 World Economic Outlook (WEO) report and rates are set to soften over the medium-term. This has been mainly attributed to suppressed economic activity in early 2018 in some major advanced economies, the negative effects of trade measures implemented or approved between April and mid-September, coupled with a weaker outlook for some key emerging markets and developing economies arising from tighter financial conditions, geo-political tensions and rising oil prices. Consequently, the global economy is enduring new challenges especially with international relations becoming more delicate in 2018. This has affected commodity prices with each episode having quite opposite effects on PNG’s key mineral exports including oil, gas, copper and gold. With extractive projects still at the forefront of PNG’s development aspirations, such cyclicality will continue to affect GDP growth and Government revenues. In terms of domestic economic growth, in 2018, the economy is expected to grow at 0.3 per cent, lower than the 1.0 per cent projected at Mid-Year Economic and Fiscal Outlook (MYEFO) and the 2.4 per cent projected at the time of the 2018 Budget. In 2018, the agriculture, forestry and fishery sector is expected to expand by 3.3 per cent in real terms driven by increased cocoa, palm oil and steady coffee output. This is expected to be offset by the lower output of copra oil due to lower prices. In contrast, oil and gas sector production is expected to contract by 9.4 per cent predominately due to the negative impact of the earthquake in February 2018 and despite the quick re-start of production soon after and at rates above pre-quake levels, the impact was deeper than expected resulting in the downward revision to real growth for 2018. The mining and quarrying sector was also adversely affected by the quake and is now expected to only expand by 0.2 per cent in 2018. The non-resources sector is expected to be bolstered by the delivery of the 2018 APEC Leaders’ Summit. With preparations gearing up for the Summit in November, associated Government and participant spending is expected to lift incomes and purchases of goods and services, providing a boost to business activities in the final quarter of the year. However, the domestic economy also continued to be adversely affected by fiscal tightness and by the shortage of foreign exchange which have subdued non-APEC spending and investment. In 2019, the PNG economy is expected to pick up, reaching a real GDP growth rate of 4.0 per cent which reflects more buoyant domestic conditions fuelled by the recovery in the oil and gas sector and by the early works and services from large new mining and petroleum projects, coupled with the extinguishment of the foreign exchange imbalance and improved fiscal management following the achievement of the successful financing agenda. The medium-term outlook for PNG is now much more optimistic than earlier estimates. Between 2019 and 2023, the economy is expected to grow at an average annual compound rate of 5.0 per cent buoyed by the incorporation of early works and construction phases of the new mining and petroleum projects into the baseline. Much of the impact from the planning and construction phases will flow through to the non-mining economy as direct and indirect benefits in the form of additional jobs, increased incomes and higher Government revenue.

2019 National Budget, Volume 1
2
In 2018, the Government has also delivered on its commitment to secure 3 year program budget support funding from the ADB and the World Bank, the first of its kind for nearly 20 years and was also successful in obtaining its first sovereign bond issue in October 2018 with proceeds amounting to USD500.0 million and the result was overwhelmingly positive with the Government successfully pricing the inaugural 10 year bond offering at a yield of 8.375 per cent. This is a rare achievement after previous failed attempts of the past and a big testament to investors’ confidence in the Government’s fiscal and financial management. The Government is also in discussions with a large commercial bank for a further low-cost budget support loan of USD300.0 million that could be disbursed as early as the first quarter in 2019. Importantly, the proceeds from these external issuances will be used to fully fund the financing requirements of the 2018 and 2019 operational and development budgets, and redeem the necessary high cost and illiquid domestic Government securities to fund the extinguishment of the foreign exchange imbalance which will provide much needed relief to businesses as we move into 2019 and allow the domestic economy to reap the full benefits of the optimism generated by APEC. In 2018, the PNG Kina exchange rate has generally stabilised after the significant falls in recent years. From early 2018, PNG’s Trade Weighted Index1 (TWI) started to reverse a downward trend observed since mid-2013 and while it is clear that the Kina has depreciated against the US dollar in nominal terms, on a trade weighted basis, it has appreciated against major trading partner currencies, especially the Australian dollar, which makes up more than half of the TWI basket. In 2019, inflation is projected to ease to around 5.4 per cent as the economy stabilises after the APEC spending boost in the preceding year to move modestly higher to 5.5 per cent in 2020 as the early works of the new mining and petroleum projects move into the early construction phase. Increased mobilisation of resources including labour is expected to boost incomes and spending, increasing prices in that year. In 2019, the current account surplus is expected to be K21,062.5 million or 23.8 per cent of GDP which is a 4.3 per cent decline from the 2018 estimate. The foreign exchange imbalance is expected to be extinguished in 2019 as a result of the Government’s large external borrowings in 2018-19, increases in Mining and Petroleum Tax (MPT) collections throughout the year, dividend inflows from state shares in mining and petroleum projects and the remittance of royalty and development levies from PNG LNG project. 1.2 FISCAL DEVELOPMENTS IN 2018
The 2018 Budget was the first budget of the new Medium Term Fiscal Strategy 2018-22 which was formulated against a very difficult set of fiscal and financing constraints at that time. Economic growth had slowed since 2014, commodity prices were lower, a foreign exchange imbalance was widening and the market for Government securities had been exhausted and even though the Government pursued a firm fiscal consolidation path, enacting restrictive supplementary budgets, a number of expenditure categories expanded that were of a rigid nature, such as personal emoluments2, rentals, utilities and education and health subsidies and much of the burden of fiscal consolidation fell on reductions to Capital Budget expenditures, as well as an accumulation of arrears.
1 The Trade Weighted Index (TWI) measures the value of the Kina against a basket of currencies of PNG’s major trading partners.
2 Compensation of employees

2019 National Budget, Volume 1
3
Following the 2017 Supplementary Budget and the Government’s 25PP, a number of policies were established that accelerated fiscal adjustment, but challenges remained over access to domestic financing, where banks appeared to reach prudential limits, and arrears to the private sector accumulated. The challenges for fiscal policy were clearly apparent, and the impact of both the budget constraints and the foreign exchange imbalance adversely affected private sector growth. To confront these dire fiscal and financing challenges, the Government made strong fiscal and financing commitments in 2018 which adopted the recommendations in the Government’s 25PP and incorporated these into the Medium Term Fiscal Strategy (MTFS) 2018-22 which is the foundation of the 2018 Budget. Fiscal discipline was to be maintained such that fiscal deficits would decline as a proportion of GDP over the term of the plan, resulting in the debt to GDP ratio declining to 30.0 per cent by 2022. This was to be achieved by reversing the previous years’ declining revenue to GDP trend through adoption of PNG’s first comprehensive Medium Term Revenue Strategy (MTRS) 2018-22 and through engineering a declining expenditure to GDP trend. Importantly, within this declining expenditure trend, there was to be a compositional shift between rising operational spending and towards more development spending and at a decentralised level. Furthermore, to solve the intractable financing and exchange rate constraints, a coherent and well-designed Medium Term Debt Strategy (MTDS) 2018-22 was formulated that would seek to fund the fiscal deficits and fix the exchange rate imbalance through a significant shift in the mix of financing toward external loans and this was to be achieved without adding significant debt service costs to the fiscal program. Overall, in 2018, substantial progress was made in achieving the ambitious goals and targets presented in the three medium-term plans covering expenditure, revenue and debt strategies which was quite remarkable given the devastating earthquake that struck PNG in February 2018 and the need for PNG to focus on the recovery efforts from such a serious natural disaster, while at the same time mobilising activities to undertake the daunting task of preparing for an inaugural sovereign bond issuance program and undertaking the massive preparations for the substantial APEC Summit. In the 2018 MYEFO report, Total Revenue and Grants was projected to be K213.1 million higher than the 2018 Budget estimates, predominately due to an increase in the estimated collection of mining and petroleum taxes. By end-2018, a further anticipated increase in mining and petroleum taxes and dividends will see revenue collections rise somewhat further than the MYEFO projection, reaching an estimated K13,400.3 million, which is K670.0 million above budget. Total Expenditure and Net Lending was projected in the MYEFO to be K213.1 million higher than the 2018 Budget estimates maintaining the budget deficit at K1,987.2 million. However, while tight control over operational and capital warrants in the final months will keep the respective expenditure categories in check, the Government’s payroll expenditure growth continues to provide challenges. Nevertheless, while expenditures will be above budget in 2018, the increase in revenue should offset the increase, leaving the budget deficit modestly lower by K90.0 million compared with the 2018 projected deficit. Overall, while the Government’s payroll costs remain problematic, the success in implementing the Government’s 25PP, targeted at fiscal consolidation, reducing the foreign exchange imbalance and moving some of the projects forward, was unquestionably successful. The 2018 MYEFO report estimated that total public debt would reach K25,545.5 million, or 31.2 per cent of GDP by end-2018 compared to 32.2 per cent projected in the 2018 Budget. By end-2018, it is now expected that the debt to GDP ratio would have declined

2019 National Budget, Volume 1
4
to 30.9 per cent and this can be attributed to the upward revision in nominal GDP projections for 2017 and 2018. At these rates, however, debt levels were clearly within the 30-35.0 per cent band as prescribed in the Fiscal Responsibility Act and were trending lower, also consistent with the 30.0 per cent FRA target by 2022. Despite elevated fiscal risks from these expenditure challenges, coupled with higher country risk from the devastating earthquake, the domestic financing challenges, the foreign exchange imbalances and the need to fund and stage APEC – all of which led to a credit rating downgrade on PNG’s outlook - the Government overcame these obstacles and achieved unprecedented success in 2018 in achieving its ambitious international financing agenda. The set of financing milestones, not seen before in PNG, comprised the final tranche of the Credit Suisse loan facility loan (US$190.0 million), the US$100.0 million first tranche of the US$300.0 million ADB Budget Support Loan, the US$150.0 million first tranche of the US$300.0 million World Bank Budget Support Loan and the PNG’s inaugural sovereign bond issuance of US$500.0 million. The success of this external debt raising program in raising US$940.0 million in 2018 has allowed the financing mix to be favourably altered in 2018 and will result in a substantial domestic debt redemption program to be initiated in late 2018 that will underpin both the full funding of the 2018 deficit, as well as major inroads into extinguishing the foreign exchange imbalance by providing the market with liquidity and the foreign exchange reserves to back it up. Importantly, with the balance in the Bond Trust Account being an estimated K800.0 million at end-2018, this will provide a solid financing base to execute the 2019 Budget program without the need to resort to warrant restrictions early in the year. Other achievements in 2018 included the mobilisation of non-tax revenue through the enactment of the Public Money Management Regularisation (PMMR) Act 2017 which resulted in the transfer of significant funds to the Consolidated Revenue Fund (CRF) to support the Government’s budget. The O’Neill-Abel Government’s important achievement in reversing the previous adverse revenue trends was critical in mobilising additional revenue through the commencement of the MTRS 2018 – 2022. Consistent with reforms encapsulated in its 25PP, the Government has continued in 2018 to launch new projects in health, transport, telecommunications and energy sectors of the economy that will underpin higher economic growth and improved social conditions for our people. Equally important have been the implementation of further reforms in public financial management, particularly in procurement practices, that will ensure greater accountability and transparency. The preparations for the 2018 APEC Leaders’ Summit have provided some impetus for further growth with a number of key infrastructure projects being initiated such as the submarine fibre-optic cable, the Port Moresby Sewerage project, the upgrading of the Port Moresby road network, the construction and expansion of hotel accommodation and conference facilities, and the expansion of the Port Moresby International Airport. While a number of challenges from 2018 remain to be addressed, such as the expanding PE budget and a significant level of arrears, these have been overwhelmingly offset by the marked achievements in 2018 relating to the timely and effective recovery efforts from the earthquake, the higher revenue generation and revenue policy reforms, vastly improved debt management and financing milestones, reductions in the foreign exchange imbalance and the successful staging of the APEC Leaders’ Summit. With expectations of further positive announcements at the upcoming APEC Leader’s Summit, PNG will begin 2019 on a very sound fiscal basis, with all the reform programs enshrined in the medium-term plans on track and gathering pace and, for the first time in many years, with the financing in place to allow the efficient execution of the 2019 Budget from day one.

2019 National Budget, Volume 1
5
1.3 2018 SUPPLEMENTARY BUDGET
The 2018 MYEFO Report showed a modest deterioration in fiscal conditions with personnel emolument expenditures (PE) showing the continuation of the previous adverse trend. This was offset by expectations of higher MPT collections. It was noted that the final tranche of the Credit Suisse loan, which was programmed for late 2017, had been received. A number of directives were issued to remedy the adverse expenditure trends. Following the September outturn report, it is estimated that an additional (above budget) K671.0 million in revenue is likely to be collected by end 2018. The increase is predominately due to a lift in MPT to K725.0 million against the original budget projection of K179.0 million. Kumul Petroleum Holding Limited (KPHL) dividend payments are also expected to increase by K400 0million to K700.0 million against the K300.0 million projected for 2018. Personal Income Tax collections have come in marginally lower than expected in the 2018 Budget due to subdued domestic economic conditions, although more recent data suggests that this tax could achieve its budget target. In contrast, Corporate Income Tax and GST receipts are running marginally above budget. Export Tax is expected to be significantly higher than budget reflecting the changed tax arrangements and higher export prices. However, the 2018 September Outturn report is projecting 2018 Budget expenditures to blowout substantially, largely from PE of over K500.0 million. This includes the payment of the NSL exit payment arrears in September 2018 which were only partly appropriated. The expenditure increase is being offset by a reduction in warrants for goods and services and capital expenditures. To maintain the 2018 Budget deficit on a declining trend, measures have been effected to limit the PE blowout to no more than K400.0 million, such as switching off off-line payments from the Alesco payroll system, cessation of unessential overtime payments, etc. Savings of K277.0 million have been identified from the Government of PNG capital expenditure. With these savings measures in place and with the additional revenues projected of K671.0 million, it is estimated that the budget deficit will decline slightly to K1,897.2 million or 2.3 per cent of GDP. Nevertheless, a Supplementary Budget will still need to be submitted to cater for the over expenditures in these particular categories. (The Supplementary Budget Bill is provided in the
attached documents).
Personnel Emoluments K400.0 million Provisions for Works, Medicine, Utilities, Rental and Other Arrears: K310.0 million Superannuation Exit Arrears: K146.1 million Debt Service (Interest Cost): K72.0 million TFF (Commodity Component) K20.0 million
Total K948.1 million
The total expenditure increase of K948.1 million will be funded by the projected revenue increase of K671.1 million and the expenditure savings of K277.0 million from the reallocation of capital from the PIP Budget, thereby maintaining the 2018 Budget deficit fiscal anchor. With the fiscal deficit being maintained under the budgeted amount of K1,897.2 million and with the Bond Trust account balance being offset against total debt outstanding, the statutory debt level will increase by the fiscal deficit amount, taking the statutory debt level to

2019 National Budget, Volume 1
6
K25,455.5 million, or 30.9 per cent of GDP which maintains the declining trend as targeted under the Fiscal Responsibility Act (FRA) 2006. 1.4 THE 2019 BUDGET AND OUTLOOK
The 2019 Budget will build on the exceptional achievements in 2018 and it will continue to be guided by the Government’s 25PP and its longer term development plans. The 2019 Budget marks the second year of the MTFS 2018-22 which incorporates the more detailed MTdS and MTRS. The 2019 Budget is framed against a still supportive world economic environment, although risks to international economic growth are rising but the outlook has improved as the Government makes significant inroads into its domestic fiscal and financing challenges, as a number of large resource projects move forward, and in light of the optimism that has been created from the anticipated successful APEC Leader’s Summit.
1.4.1 Revenue
In the 2019 Budget, the Government will continue to place emphasis on lifting revenue collections through a further substantial increase in compliance efforts, coupled with new revenue measures, as well as ongoing non-tax revenues measures through the PMMR reforms. Total Revenue and Grants for the 2019 Budget is projected at K14,266.8 million, which is an increase of K1,536.1 million or 12.1 per cent on the 2018 Budget and K866.5 million or 6.5 per cent) on the estimated 2018 outturns. Additional revenues in the 2019 Budget will be used to fund the Government’s priority infrastructure and social program, but importantly, a significant proportion will go to reduce arrears, complete on-going projects and fund expenditure savings initiatives and revenue raising reforms so that the increases are not locked in and detract from fiscal space in the medium term. In 2018, solid progress was made on implementing the first phase of the MTRS with most of the programmed measures on track including the establishment of the MTRS Steering Committee, the launching of the Large Taxpayers Office, introduction of the Tax Administration Act and a number of reforms by PNG Customs. Most of the tax revenue targets were met, with a substantial increase in Mining and Petroleum Tax, although personal income tax collections continue to be adversely impacted by the subdued state of the domestic economy. Table 1: Budget Balance 2017 – 2019 (Kina, Million)
Economic Activity 2017 Actual 2018 Budget 2019 Budget
Revenue 11,525.1 12,730.7 14,266.8
Expenditure 13, 319.7 14,717.9 16,133.5
Net Borrowing (-) -1,794.7 -1,987.2 1,866.7
% of GDP -2.4% -2.5%* -2.1%
% of Debt to GDP 31.9% 32.2% 30.8%
Non-Resource Primary Balance (% of non-resource GDP)
-946 -1.7%
-592.3 -1.0%
-1,743.4 -2.7%
Source: Department of Treasury. * Rounded off from 2.5 per cent
1.4.2 Expenditure
In terms of expenditure policy, there is a clear recognition by the Government that a number of operational spending categories need to be brought under stricter controls but that, because of the contractual/statutory nature of many of these expenditures, it will take time to achieve
2019 National Budget, Volume 1
7
the required adjustment without forcing major adverse social consequences on the civil service and the private sector. The Government further understands that, given the current subdued domestic economic conditions, there needs to be a concurrent lift in public investment, particularly in the outside provinces, that will stimulate economic activity, while at the same time, funding the Government’s priority programs in the health, law and order and education sectors. The Government's investment in APEC is part of this strategy to get some momentum behind the economic growth trajectory. External financing of the budget strategy will also be critical, given recognition of the limits on the domestic financial system and the ongoing impact of the foreign exchange imbalance. Given this strategy, the 2019 Budget Expenditure envelope is set at K16,133.5 million, an increase of K1,415.6 million (or 9.6 per cent) on the 2018 Budget estimate and K836.0 million (or 5.5 per cent) on the expected 2018 outturns. In terms of key expenditure items, the Government will focus on adequately funding its key programs covering Tuition Fee Free Education, Free Primary Health Care, key national Infrastructure Projects, the Provincial and District Services Improvement Program, Agriculture, Tourism and Small to Medium Enterprises (SMEs). Given the intractable nature of the public payroll expenditures, the 2019 Budget will undertake the necessary detailed audit to comprehend the problems, whilst at the same time implement strict controls to contain personal emolument expenditure within budget ceilings. In this respect, several issues have contributed to successive blow outs and these will be a direct foci of the PE containment program. At a minimum, this program will address the following issues:
• Under-budgeting – There have been some industrial awards and superannuation benefits that the Government has not budgeted for and so every effort has to be made to recognise these going forward. Government has both sought to force some savings through recruitment freezes, agency amalgamations, agency abolishment, staff right-sizing but these have not materialised to the extent expected. Similarly the intake into the teaching, police and defence services has continued unchecked;
• A priority will be to establish correct manpower data to assess staff on strength and intake into the services will be evaluated and budgeted correctly. The entering of new structures into the Alesco system without reference to budget ceilings will need to be controlled;
• Hard controls in the Payroll Management Systems (IFMS and Alesco) – There are currently no ceilings in the system and therefore no flags are raised when the increases on the budgeted amounts commence. A process has been designed where there is funds checking against warrants (refer Chapter 9); and
• Teachers, Health Workers, Police and Defence – As these are areas where there are large movements of personnel, including intake and retirement, and so special efforts will made to ensure that persons in these sectors are fully accounted for and the correct numbers are uploaded into the personnel management systems.
With the capital budget expected to be implemented in full in 2019, further reforms will also be introduced to ensure capital expenditure is well targeted and accountable.

2019 National Budget, Volume 1
8
1.4.3 Financing
The successful financing strategy employed in 2018 will continue in 2019, but now will also be directed at containing interest costs. The Nambawan Super exit payment arrears were addressed in 2018 and the 2019 Budget will now make an adequate provision for the ongoing monthly exit payment obligations. The increase in one-off revenue measures in the 2019 Budget will be used to significantly reduce the outstanding arrears, allowing the 2019 Budget to be executed without dealing with a substantial prior year fiscal overhang. In this respect, the Government has approved a firm close-of-accounts policy for end 2018. The net borrowing (deficit) requirement for the 2019 Budget is set at K1,866.7 million or 2.1 per cent of GDP which will translate into a debt to GDP ratio of 30.8 per cent, which is within the 30–35.0 per cent boundary prescribed in the FRA (Amended 2017). The FRA also requires that the Government target a zero average annual non-resource primary balance over the medium term. As in the successful 2018 financing program, the Government will fund the full 2019 financing requirement from external sources which will also finance additional net domestic debt redemptions of K629.4 million. External financing will comprise funding from development policy operations of the World Bank (US$50.0 million) and the Asian Development Bank (US$100.0 million), the carry over balance in the sovereign bond trust account (K800.0 million), concessional project loans (US$250.0 million) and other bilateral budget support loans (US$300.0 million) expected to be announced at the APEC Leader’s Summit. Once the debt retirement plan is completed in mid-2019 and the foreign exchange imbalance extinguished, the Government plans to develop the domestic debt market aimed at lowering and flattening the domestic yield curve which will result in greater domestic liquidity at lower interest costs and will also reduce the crowding out effect of Government financing, allowing increases in private sector credit. The rising trend in public debt interest costs will be halted in 2019 where these costs are expected to fall from 2.4 per cent of GDP in 2018 to 2.2 per cent in 2019. Over the next few years, the Government also aims to increase revenues substantially and rebalance expenditures which will result in the fiscal deficit declining to around 1.0 per cent of GDP by end 2022 and at the same time, the debt to GDP ratio is expected to decline to under 30.0 per cent by 2022 and beyond. As the new large resource projects move into production and, as the budget moves back into surplus, the Sovereign Wealth Fund (SWF) will be activated and start to accumulate balances. The Government can then move from its non-resource primary fiscal balance target to the SWF stabilisation targets. 1.5 TAX EXPENDITURES
There are a number of tax incentives provided by the Government to tax payers in order to achieve certain public policy objctives but are aimed primarily to attract and retain investments in the domestic economy. This is based on the idea that under certain circumstances, such as the Resource companies building public infrastructre in remote areas, that the private sector may have a comparative advantage in providing goods and services on behalf of the Government and it yields a net positive effect on the economy. This category is deemed Tax Expenditure.

2019 National Budget, Volume 1
9
Historically, tax expenditures have been abused and so the design of the incentive and the monitoring and evaluation of the tax expenditure is extrememly important. This assessment is essential in order to justify continuation of the tax incentives and to underpin improved policy design in the future. As part of strenghtening the governance and reporting of tax expenditure, the Governemnt published its first tax expenditure report in the 2018 Budget. In this Budget, the Government expands its coverage of the Tax Expenditure Statement (TES) by capturing additional tax incentives provided in the Income Tax Act 1959 Goods and Services Act 2003 and Customs Tariff Act 1990. These provide some transparency on the available incentives, which is a stepping stone to move onto the evaluation of the outcomes that will enable an informed assessment to be made of the productivity of the various incentives.
1.6 NATIONAL REFORM AGENDA
In 2019, the Government will continue to implement enabling reforms to ensure macroeconomic stability and sustainable economic growth which are crucial to achieving its development goals and aspirations as outlined in its development policies and strategies, including Vision 2050, Alotau Accord II and MTDP III. A number of public finance management reforms will continue in 2019 to strengthen and promote governance, in particular transparency and effective management of public monies in the delivery of public goods and services under the broader theme of enhancing the Public Expenditure and Financial Accountability (PEFA). The PMMR reforms will be continued through 2019, in preparation for these entities to be brought back on budget in 2020. Furthermore, the Government will also continue to pursue a comprehensive national reform agenda to support greater private sector participation at the micro-level aimed at creating an enabling and conducive environment for private sector growth and development. The Government will continue to partner with key stakeholders in removing barriers to doing business and investment in PNG in order to promote greater private sector participation. Another significant concern has been the decline in non-mining formal employment levels. Whilst there was growth in formal sector employment up to mid-2018 due to mining employment growth, non-mining sector employment declined by 3.2 per cent. It is clear from Treasury’s Business Liaison Survey that the most significant impediment to business investment and sentiment relates to problems in accessing foreign currency and in dealing with government arrears. However, all of the decline in non-mining employment over the first half of 2018 can be attributed to the earthquake and its effect on business costs and confidence. Formal employment in both the mining and non-mining sectors is expected to have increased strongly in the second half of 2018. The number of taxpayer registrations are up a substantial 26.7 per cent in 2018, of which company new registrations are up 14.3 per cent. Measures taken in the 2017 Supplementary Budget and the 2018 Budget to encourage import substitution, support local manufacturing and to provide a level playing field for domestic industry impacted by foreign market subsidises had a quick impact on local investment and employment in the value added sectors. This year local manufacturers commenced more than one billion kina in capital investment and expansion, and reported increases in output between 10.0 and 30.0 per cent. Changes in the application of subsidises for the fishing sector has seen significant increases in domestic production, with the largest operators having added an additional shift (equivalent to more than 15,000 additional paid hours per
2019 National Budget, Volume 1
10
week). Advice from the manufacturing sector is that they anticipate employment growth of 15 per cent in 2018 with further growth in 2019-20. Growth in manufacturing will also drive investment and employment growth in the service sector. This shows our Governments’ policies are working and this employment growth in domestic value-added industries and local manufacturing are the early results of our plan to build a broad based economy. Importantly this growth has not been confined to the large multinationals operating in PNG. Small, medium and large local manufacturers are also investing and expanding.
In the 2019 Budget, a number of measures have been announced that will accelerate broad-based private sector investment, activity and formal employment levels particularly in the non-mining sector. These comprise:
i. The foreign exchange imbalance - through the debt management program wherein substantial external loans have been raised in 2018 and similar commitments have been received for 2019 which will provide the domestic liquidity from the very large domestic debt retirement plan that will fund the extinguishment of the foreign exchange imbalance;
ii. In the 2019 Budget, the Government has allocated a significantly higher amount for the clearance of arrears which, together with the removal of restrictions on foreign exchange, will support business confidence and stimulate investment;
iii. Further substantial adjustments to tariffs and excises are contained in the 2019 Budget to assist domestic manufacturing against cheaper imports and, as in the case of alcohol and tobacco, to confront illicit imports that have undermined domestic production;
iv. The domestic debt retirement program should halt the trend whereby Government demand for domestic securities crowded out private sector credit. With Government effectively withdrawing from the domestic market, the increase in liquidity can flow more into private sector loans;
v. The Government, in collaboration with Kumul Consolidated Holdings, has a substantial reform agenda for 2019 and beyond to improve the performance of the State-owned enterprise sector;
vi. The Government, for the first time in a number of years, has financing available from the start of the fiscal year which will mean that warrants will be able to be released from the start of the year, resulting in full execution of the budget, including both the operational budget and the capital program which should support a lift in growth;
vii. The Government expects a number of large mining and petroleum projects to kick start in 2019 and, while production may be some way off, the early services and works will have a significant impact on the economy and buoy business confidence; and
viii. Announcements from the APEC Summit are expected to be very positive, not just relating to international trade and tax policies which will be beneficial to PNG, but also in direct support to PNG, particularly in the area of infrastructure development.
More broadly, the hosting of APEC meetings in 2018 has been a significant focus of the Government. More importantly, it has been an opportunity for the Government to utilise the collective expertise of the APEC economies to further PNG’s domestic reform efforts through

2019 National Budget, Volume 1
11
improved trade relations in the APEC region and to also encourage longer-term inclusive and sustainable investment and development in PNG. 1.7 IMPROVING STATE’S COMMERCIAL INVESTMENTS
1.7.1 State-Owned Enterprises
Most of the commercially oriented State assets were consolidated and are now managed through the Kumul structure. This structure consists of three Kumul entities namely: Kumul Consolidated Holdings Limited (KCHL); Kumul Mineral Holdings (KMH); and Kumul Petroleum Holdings Limited (KPHL). In terms of performance of the SOEs under KCHL, gross revenues increased modestly in 2017 compared with 2016, with increases in revenue by Telikom, MVIL and Water PNG being offset predominately by declining revenues in Air Niugini Limited (ANL) and PNG Power. In terms of net profit before tax, significant declines were recorded for Air Niugini, National Development Bank (NDB) and PNG Power, while profits were lifted in Eda Ranu, MVIL, PNG Ports, Water PNG and Post PNG. Overall total net profits before tax of the unquoted assets declined sharply from K128.3 million in 2016 to K55.9 million in 2017. This resulted in a sharp decline in dividend payments to KCH from K162.7 million in 2016 to K103.2 million in 2017, although much of the decline can be attributed to the failure of MVIL to remit a dividend payment in 2017. In 2018, KCH has focused on a number of major projects, including the Ramu 2 Power Project, the POM Sewerage System Upgrade project, the Lae Port Development, the POM Port Precinct Redevelopment, GBT land and property sales, additional developments under Kumul Agriculture (particularly on dairy and rice production), the merger of entities under Kumul Telikom Holdings, the Sydney International Submarine Cable, the merging of the two water SOEs under Kumul Water, advancement of the Pacific Maritime Industrial Zone in Madang and the facilitation of SOE deliverables for APEC. Solid progress has generally been achieved on all these projects and a number of important appointments have been secured. In particular, KCHL is currently restructuring the three telecommunication entities (Telikom, Bemobile, and PNG Dataco) into one communications service provider. Under the Government’s National Energy Policy, PPL is in the process of being restructured into distinct entities operating in the generation, transmission, distribution and retail and regulatory roles to improve efficiency and encourage competition. As part of an overall industry reform, KCHL is currently reviewing the existing operations of ANL with a view to streamlining non-core business activities and exploring options related to the separation of the international and domestic route services. KPHL is the mandated state nominee and participant in oil and gas projects, currently holding the State’s interest in oil and gas projects including a participating 16.57 per cent interest in the PNG Liquefied Natural Gas (LNG) project. KPH paid K200.0 million in dividends to the State in 2016 and K300.0 million in 2017. In 2018, the State has received K250.0 million as dividends to date which excludes the K50.0 million paid earlier in 2018 to the SHP as part of the earthquake relief efforts. The receipt of substantial dividends from Exxon expected in December 2018 due to higher gas prices has lifted projected receipts from KPHL to K700.0 million for 2018 and a further K800.0 million in dividends is programmed in the 2019 Budget which reflects the budget assumptions for oil and gas prices and the elevated expected production volumes in 2019.
2019 National Budget, Volume 1
12
A review into the Kumul structure will be undertaken in 2020 as part of the Public Finance Management (PFM) reforms currently being undertaken by the National Government which will aim to ensure prudent fiscal management of state investments. In parallel with the review into the Kumul legislation, the formulation of an asset management plan is also being considered which will require assessment reports to be undertaken on all assets currently being managed by state agencies, especially the SOEs’ and this is all a part of the Government’s broader policy intervention to improve governance frameworks for reporting and monitoring under the implementation of the Government Finance Statistics (GFS) 2014 reform work.
1.7.2 Mining and Petroleum Assets
Effectively managing the mining and petroleum sectors is important to the PNG economy and these sectors comprise significant portions of the State’s asset holdings. Potential future mining and petroleum projects include the Papua LNG, Pasca A Gas, Stanley Gas, P’nyang Gas, Yandera mining, Woodlark mining, Wafi-Golpu and Frieda River mining projects which are expected to contribute substantially to the domestic economy. On the proposed petroleum and gas projects, the Government established the State Negotiating Team in mid-2018 to facilitate the Gas Agreement which sets out the administrative, technical, regulatory and fiscal arrangements for the new LNG projects. Term sheets have been submitted and significant progress has been made with agreement expected to be reached over coming months with the project proponents. The Government will ensure the necessary policy and legislative changes are established to better regulate the sector and ensure revenue gains are optimised over the life of the project, learning from the lessons of the PNG LNG project. In 2019, the Government will embark on a number of policy and legislative changes including amendments to the Mining Act 1992 and the Petroleum Act 1998, a policy guiding state participation in resource projects and third party access in the oil and gas sector, a policy to guide the distribution and management of benefits to landowners and subnational governments, and the introduction of a policy on domestic market obligations for gas and petroleum products. Whilst the Government embarks on the policy and legislative changes, it also recognises the need to strengthen its concessional fiscal regime. In this respect, the Government will focus on a major reform towards getting a standardised fiscal regime that is globally competitive and that provides appropriate returns from resource extraction at minimal cost and acceptable risk levels.
1.7.3 Broader Reforms
In 2019, broad sector reforms will focus on reviewing the agricultural and other renewable resource sectors (forestry, fisheries, tourism, agriculture and livestock) to identify constraints and opportunities to increase production and any need for state support. A review is being conducted with various state agencies involved in the renewable resource sectors, including commodity boards. The review started in 2017 and was done purposely to identify major challenges and opportunities in these sub sectors and it further intends to identify appropriate government intervention programs and will continue into 2019. In 2019, a review of the Public Private Partnership (PPP) Act will be undertaken, with subsequent amendments aimed to simplify the administration of the 2014 approved PPP

2019 National Budget, Volume 1
13
legislation will be submitted to Parliament. The implementation of the 2014 PPP legislation will, however, continue in 2019 and a high level work plan has been developed to this end.

2019 National Budget, Volume 1
14
CHAPTER 2: ECONOMIC DEVELOPMENTS AND OUTLOOK 2.1 WORLD ECONOMIC GROWTH AND OUTLOOK – CHALLENGES TO STEADY GROWTH
World economic growth rates and the outlook for key macroeconomic variables are increasingly important for PNG. World economic growth remains robust, but downside risks are increasing. International factors are critical for our outlook and the 2019 Budget. These factors include movements in prices of commodities received by PNG for its exports and foreign investment inflows and the timing of new project developments. The world inflation rates also affects the price paid by PNG consumers and business on their imports and revenue flows to Government. The PNG Kina exchange rate and interest rate are affected which in turn affect PNG’s borrowing from overseas markets. The amount of overseas aid and financing can alter depending on the economic performance of our partners. The 2019 Budget needs to make a number of assumptions on international variables and the basis for these assumptions are presented in the following section. 2.1.1 Economic Activity
Growth in the global economy for 2018-19 is projected to maintain growth rates around the improved 2017 levels. However, this expansion has become less balanced and may have peaked in some major economies. Downside risks to global growth have arisen in the past six months and the potential for upside surprises has waned. Global growth is projected at 3.7 per cent for 2018-19, 0.2 percentage point lower for both years than forecast in the April 2018 World Economic Outlook (WEO) report and rates are set to soften over the medium-term. The downward revision to the global outlook reflects surprises that suppressed activity in early 2018 in some major advanced economies, particularly the negative effects of trade measures implemented or approved between April and mid-September, as well as, a weaker outlook for some key emerging markets and developing economies. The weaker outlook for emerging markets has arisen from country-specific factors, tighter financial conditions, geopolitical tensions, and higher import bills. Beyond the next couple of years, as output gaps close and the monetary policy setting of major economies begin to normalise, growth in most advanced economies is expected to decline to potential long-run rates which are well-below the averages reached before the global financial crisis a decade ago. In advanced economies, economic activity lost some momentum in the first half of 2018 after peaking in the second half of 2017 with growth in advanced economies projected to expand by 2.4 per cent in 2018, a marginally faster pace than in 2017 and 2.1 per cent in 2019. In 2020, growth in the advanced economies is expected to decline to 1.7 per cent as the US tax cuts are partially reversed, and to 1.5 per cent in 2022-23 as the working age population growth continues to slow. Growth in the US is expected to peak at 2.9 per cent in 2018, supported by the pro-cyclical fiscal stimulus after eight consecutive years of expansion and still-accommodative financial conditions despite expected monetary tightening. Growth is projected to soften to 2.5 per cent

2019 National Budget, Volume 1
15
in 2019, a downward revision of 0.2 percentage point relative to the April 2018 WEO due to the recently introduced trade measures, and to drop to 1.8 per cent in 2020 as the fiscal stimulus begins to unwind. Strong domestic demand is projected to push the economy above full employment and increase imports and the current account deficit. Medium-term growth is forecast to temporarily decline below potential at 1.4 per cent as the positive output gap is gradually closed. Growth is projected to remain strong in the euro area, but has been revised down by 0.4 percentage points to 2.0 per cent for 2018, reflecting a weaker-than-expected performance in the first half of the year. Growth is forecast to gradually slow further to 1.9 per cent in 2019, 0.1 percentage point lower than the April forecast and healthy consumer spending and job creation amid supportive monetary policy are expected to continue to provide strong aggregate demand, though at a moderating pace. In Japan, growth is projected to moderate to 1.1 per cent in 2018 from a strong, above trend outturn of 1.7 per cent in 2017, before softening to 0.9 per cent in 2019. The downward revision of 0.1 percentage point for 2018 relative to the April 2018 WEO is largely due to the contraction observed in the first quarter of 2018. However, given the uptick in growth and domestic demand in the second quarter of 2018, this is likely to have temporary impact rather than the beginning of a turn in the cycle, however, Japan’s medium-term prospects are impeded by unfavourable demographics and a trend decline in the labour force. Growth in emerging markets and developing economies is expected to remain steady at 4.7 per cent in 2018-19, and to rise modestly over the medium-term. In China, growth is projected to moderate from 6.9 per cent in 2017 to 6.6 per cent in 2018 and 6.2 per cent in 2019, reflecting slowing external demand growth and the necessary financial regulatory tightening. The 0.2 percentage point downgrade to the 2019 growth forecast is attributable to the negative effects of the recent tariff actions, assumed to be partially offset by policy stimulus. Over the medium-term, growth is expected to gradually slow to 5.6 per cent as the economy continues to transition to a more sustainable growth path with continued financial de-risking and greater environmental controls. Growth is projected to remain strong elsewhere in emerging and developing Asia. India’s growth is expected to increase from 6.7 per cent in 2017 to 7.3 per cent in 2018 and 7.4 per cent in 20193 driven by increases in oil prices and the tightening of global financial conditions. With this acceleration reflecting a rebound from temporary shocks – the currency exchange initiative and implementation of the national Goods and Services Tax, with strengthening public investment and robust private investment. India’s medium-term growth prospects remain strong at 7.7 per cent, benefiting from ongoing structural reform, but has been marked down by 0.5 percentage points relative to the April 2018 WEO. Growth in Latin America and Caribbean is projected to decrease modestly from 1.3 per cent in 2017 to 1.2 per cent in 2018 and to rise to 2.2 per cent in 2019 - a more subdued recovery than envisaged in the April 2018 WEO. Brazil is expected to grow at 1.4 per cent and 2.4 per cent in 2018 and 2019 respectively driven by a recovery in private demand.
3 Slightly lower than in the April WEO 2018 for 2019

2019 National Budget, Volume 1
16
The growth forecast for 2018 is lower than in the April 2018 WEO by 0.9 percentage point on account of disruptions caused by the nationwide truck drivers’ strike and tighter external financial conditions. Growth is expected at 2.2 per cent in the medium-term. Chart 1: World Economic Growth (1993-2023)
Source: International Monetary Fund (IMF), World Economic Outlook (WEO) October 2018
Overall, in 2019, the global economy is projected at 3.7 per cent, 0.2 percentage point lower than forecast in April 2018 WEO largely due to increased downside risks in the past six (6) months. This has been mainly attributed by suppressed economic activity in early 2018 in some major advanced economies and the negative effects of trade measures implemented or approved between April and mid-September. A weaker outlook for some key emerging markets and developing economies arising from tighter financial conditions, geo-political tensions, and rising oil prices also adds to the downside risks. Beyond 2019, growth in most advanced economies is expected to be held back by slow labour force growth and weak labour productivity. In emerging markets and developing economies, growth is projected to remain robust, although income convergence toward advance economy levels would likely be less favorable for countries undergoing substantial fiscal adjustment, economic transformation or conflicts. Importantly for PNG, near term risks to the global outlook have shifted to the downside and some have partially materialised. Trade barriers have risen, with adverse consequences for investment and growth. Financial conditions in most emerging markets and developing countries have tightened since mid-April with capital flows to some of these countries having declined, reflecting weak fundamentals, higher political risks and the normalisation of the US monetary policy. While financial conditions in advanced economies remain broadly accommodative, inflation surprises and currency instability could lead to an abrupt tightening of monetary policy across countries. Further, some key risks include escalation in trade tensions, political and policy uncertainties, challenges to borders through illegal migration and growing inequality. The recent

2019 National Budget, Volume 1
17
intensification of trade tensions and the potential for further escalation pose a substantial risk to global growth and welfare. Unilateral trade actions and retaliatory measures could disrupt global supply chains, weaken investor confidence, lower commodity prices and undermine broader multilateral cooperation at a time when it is urgently required to address shared challenges. Some of these issues will be discussed at the upcoming APEC meetings in Port Moresby. Medium-term risks remain elevated, in particular the build-up of financial vulnerabilities over the past few years of very accommodative financial conditions, including high and rising public and corporate debt, and stretched asset valuations in some major markets. In the recent 2018 International Monetary Fund (IMF) and the World Bank (WB) Group Annual Meetings held in Bali, Indonesia, both the IMF and the WB Group have called for the need to promote mutual cooperation and solidarity to settle economic uncertainties and economic imbalances globally. Moreover, respective communiques from the IMF/WB Group have called for more prudent macroeconomic policy and multilateral cooperation to mitigate financial shocks. It is also important for member countries to reduce financial vulnerability and advance policies and reforms to protect expansion, mitigate risks, rebuild policy space, enhance resilience and raise medium-term growth prospects for the benefit of all. The PNG Government’s Medium Term Fiscal Strategy (MTFS) 2018-22 sits well with these proposed policy positions, as too the placement of many of these issues on the APEC Agenda. 2.1.2 Commodity Prices
According to the latest IMF’s October 2018 WEO, energy prices have increased since the release of the April 2018 WEO mostly driven by high oil prices. Notwithstanding record-high US production, tight supply conditions and sustained economic activity in the first half of 2018 pushed up oil prices in May and June to their highest levels since November 2014. Since then, however, higher production in Saudi Arabia and Russia, and exemptions on Iran’s exports, have rebalanced the oil market. Oil futures point to a decline in prices to US$60.0 per barrel by 2023. Baseline IMF assumptions suggests average annual prices of US$69.3 a barrel in 2018, an increase of 31.0 per cent from the 2017 average, and US$68.8 a barrel in 2019. A decline in the demand for metals from China and the impact of trade tensions have exerted downward pressure on metal prices. In contrast, the broader agricultural market fundamentals remain solid and have partially offset the introduction of tariffs on some key agriculture commodities. 2.1.3 World Inflation Inflation in advanced economies is projected at 2.0 per cent in 2018, up from 1.7 per cent in 2017. In the US, headline consumer price inflation is projected to increase to 2.4 per cent in 2018 and moderating to 2.1 per cent in 2019, from 2.1 per cent in 2017. Core personal consumption expenditure price inflation is expected to be 2.1 per cent in 2018 and 2.3 per cent in 2019 compared with 1.6 per cent in 2017, as a result of sizable fiscal expansion. Toward the end of the projection horizon (2022-23), inflation is assumed to decline to the target, attributable to a monetary policy that will keep expectations and actual inflation well anchored.

2019 National Budget, Volume 1
18
Chart 2:World Inflation (Per cent Growth)
Source: International Monetary Fund (IMF), World Economic (WEO) October 2018 Note: Advance Economies inflation in 2009 was 0.162 per cent.
Inflation in emerging markets and developing economies, excluding Venezuela, is expected to increase to 5.0 per cent in 2018, up from 4.3 per cent in 2017. These weighted averages mask significant variations across countries depending on their cyclical positions as well as the impact of currency depreciations and rising energy prices. In China, headline inflation is expected to pick up to 2.2 per cent in 2018, up from 1.6 per cent in 2017, and to about 3.0 per cent over the medium-term, driven by higher food and energy prices. Inflation in India is on the rise, estimated at 3.6 per cent in fiscal year 2017-18 amid accelerating demand and rising fuel prices.
2.1.4 Mineral and Petroleum Commodities Movements in commodity prices continued to track developments in the global economy in 2018 with prices of PNG’s major mineral exports, including crude oil, copper and gold displaying contrasting trends in 2018. Despite the decline in recent weeks, crude oil prices have trended higher in 2018, while copper and gold prices have remained volatile in 2018. Important global institutions and events including the OPEC and non-OPEC decisions on oil supply, the strengthening of the US economy and its associated macro-policies, wage negotiations at the world’s top copper mine and the challenging international relations especially, the US-China trade war have all contributed to the varying trajectories that commodity prices have displayed in 2018. The Bank of Papua New Guinea’s (BPNG) All Price Commodity Index4 is a relevant indicator in assessing movements in PNG’s key commodity export prices, showed that in the first half of 2018, prices of PNG’s major exports increased by 10.0 per cent compared to the same period in 2017. Recent data shows the prices of crude oil and base metals easing somewhat,
4 BPNG 2017 June quarter QEB data.

2019 National Budget, Volume 1
19
while cocoa prices are gradually improving, copra oil is slowly declining, while gold and other agricultural commodities are fluctuating around recent average levels. Chart 3: IMF All Commodity Price Index Chart 4: PNG All Commodity Price Index
Source: International Monetary Fund (IMF) October WEO Source: Bank of PNG
Crude Oil Crude oil prices have sustained an upward trend since mid-2017, rising from a low of US$42.5 per barrel in June 2017 to trade around an average of US$71.0 per barrel in October 2018, despite the decline in the last week of October 2018. While oil demand has continued to rise supported by the strong global demand maintained from earlier in the year, supply-side concerns, including OPEC and non-OPEC decisions on supply and disruptions including involuntary outages from Venezuela and sanctions on Iran, have tilted the oil market into a shortage driving the increase in prices observed over the past year. Over the year to October 2018, oil prices averaged around US$67.0 per barrel, 32.0 per cent higher than average 2017 prices. With sanctions on Iran to be fully effected in November supply could fall further before the year ends. However, some exemptions have been granted to countries importing Iranian oil and demand expected to contract as the world economy slows somewhat, downward pressure on prices could continue over the remainder of 2018. Balancing the eminent supply risks ahead with the slightly dampened demand, oil prices are expected to average around US$68.0 per barrel in 2018. Chart 5: Crude Oil Price Chart 6:Crude Oil Price against Stock
Source: International Monetary Fund (IMF) & US Energy Information Administration (EIA)
Looking ahead into 2019, developments around OPEC and non-OPEC countries conforming or deviating from their 2018 targets will be crucial in bolstering supply but much will also

2019 National Budget, Volume 1
20
depend on how the cartel and its allies use spare capacities to plug the shortfalls from Iran and others affected by geo-political and political tensions. How soon they respond to this will also be critical. Balancing these developments with prevailing uncertainties around supply, the oil price assumption underpinning the 2019 Budget is for oil prices to average around US$ 68.0 per barrel in 2019. Box 1: The Relationship between Crude Oil and Liquefied Natural Gas (LNG) prices Japan remains the largest importer of LNG although China is fast becoming a rival due to its environmentally friendly energy policies. Majority of LNG import prices in Japan are linked to a crude oil average known as the Japanese Crude Cocktail (JCC) - a basket of crude oil prices. Due to the lack of adequate pricing mechanisms in the past and crude oil being a well-established market globally, crude oil was used as a benchmark to price LNG in Japan. This has been maintained over the past decade, however, there is a growing market sentiment for alternative arrangements given the grave volatility associated with oil prices. The natural gas market is globally segmented. Differing in structure and pricing conventions e.g. in the Atlantic covering North America and Europe and in Asia-Pacific covering LNG producers including Papua New Guinea and Australia. The current pricing of Papua New Guinea’s LNG exports is based on norms observed in the Asian LNG market and involves long term contracts linked to the price of oil. This differs from the developed spot market pricing of natural gas in North America and elsewhere in Europe where gas is priced in hubs. The hubs is where the interaction of multiple sources of supply and demand of natural gas are facilitated whereas the Asian market is based on long term (15-20 years) purchase agreements between the buyers and producers. These agreements are largely limited to buyers and producers only. The link between LNG and crude oil prices in the Asian contract markets is that the contracts are linked to an average of Japanese crude oil import prices known as the Japan Crude Cocktail (JCC) price where this price is highly correlated with the lagged price of Brent Oil prices. According to studies, the lag is around five months. So the contract LNG prices observed today are from the impact of changes in oil prices approximately five months earlier while the impact of the current movements in crude oil prices will likely drive up prices in the months ahead. In its most general form, the formula linking the price of LNG to the Asian contract prices is approximated by the following;
LNG Price = m x OIL + B Where; LNG Price is the long term contract price of Asian LNG, m is the slope, determines the sensitivity of LNG prices to changes in the oil price benchmark, OIL is the crude oil prices (JCC) often measured as a lagged average; and B is a constant e.g. transportation costs etc.
Given this relationship, LNG prices in the Asian markets are based on long term contracts and are correlated to
the lagged impacts of crude oil prices. In the current environment, we can be assured that LNG prices will continue
to increase as long as the oil price remains high and vice versa if otherwise.
Copper Copper prices have also been dictated by changes to supply and demand over the course of the year. Supply-side factors included the on-going wage negotiations at Escondida, the world’s biggest copper mine, while on the demand side, China’s appetite for infrastructure development continued to be the barometer of demand. However, the ebbs and flows of the US Dollar and especially, the impact of the US-China trade war had a noticeable impact on prices in the second half of the year. At the start of the year copper prices traded around US$7,000.0 per tonne. From mid-year copper prices declined to a low of US$5,843.0 per tonne in August and this was largely driven by a strengthening US Dollar and market sentiments on the effects of the US-China trade war.

2019 National Budget, Volume 1
21
Despite the eminent threats of a trade war, copper prices rebounded toward the end of September due largely to firm global demand from top consumers complementing the resilience of China. This steadied the market with prices ending the month of October at slightly above US$6,000.0 per tonne. In the year-to-October, copper prices averaged around US$6,596.0 per tonne, 7.0 per cent higher than 2017 levels. Looking ahead and before the year ends, copper prices will continue to be affected by the US-China trade wars, however, with the Chinese demand remaining resilient in the face of the intensifying tensions, and long term projected supply challenges, copper demand is likely to be resilient as well. Despite this, the downward revisions to global growth is expected to dampen sentiment. Overall, balancing what is expected to unfold with the uncertainties over the remaining weeks of the year, copper prices are assumed to average around US$6,476.0 per tonne in 2018. Chart 7: Copper Price Chart 8: Copper Price against Stock
Source: London Metal Exchange Source: London Metal Exchange
Looking ahead into 2019, while trade tension flare ups are expected to affect prices periodically, fundamental drivers, including demand from China, the strength of the US economy and medium-term supply challenges from major mines, including Escondida are expected to influence the price path over 2019. Notwithstanding the negative effects of the stronger US Dollar, global demand is expected to remain upbeat in 2019 driven by China as it continues to roll-out its infrastructure program. On the supply side, risks relating to strikes and natural phenomena remain and pose a threat to supply. Balancing these factors, the copper price assumption underpinning the 2019 Budget assumes an average copper price of US$6,200.0 per tonne in 2019. Gold Gold prices have been affected by three key developments in 2018 – the strength of the US dollar, interest rate hikes from the US Federal Reserve Bank and global tensions relating to trade. At the start of the year, gold prices increased from US$1,291.0 per ounce at the end of December 2017 to average around US$1,329.0 per ounce in the first quarter 2018. This increase was driven by rising geo-political tensions and the effect of trade war rhetoric between the US and its trading partners. This was also supported by a relatively weaker US Dollar at the start of the year. This continued into the second quarter where prices peaked at US$1,351.0 per ounce in April 2018.

2019 National Budget, Volume 1
22
Since then gold prices have trended lower reaching around US$1,215.0 per ounce at the end of October 2018, after reaching a low point for the year of US$1,178.4 per ounce in mid-August which was largely driven by the US Dollar rallying to its highest levels over the past year and trade war concerns between the US and China which did little to trigger gold’s safe haven appeal. Instead, the intensifying trade wars, favoured the US economy. Volatility in world equity markets in October has provided some support to the gold price. In the year to October 2018, gold prices have averaged around US$1,275.0 per ounce, 1.4 per cent higher than 2017 levels. With the US Federal Reserve expecting one more rate hike in December and expectations of further trade war flare ups and looming sanctions, gold demand is expected to weaken in the final months of 2018, dimming the prospect of any strong price increases, despite seasonal demand spikes especially from the Indian Diwali festival at the end of the year. Based on these developments, gold price is assumed to average around US$1,261.0 per ounce in 2018. Chart 9: Gold Price
Looking ahead into 2019, the announcement by the US Federal Reserve Bank at its September meeting, that it expects to make a further three (3) interest rate hikes in 2019. This is likely to result in gold demand remaining downbeat but, with the threat of unrest, geo-political tensions and in an environment where international relations have been tested, gold’s safe haven appeal could reappear in 2019. Balancing these developments, the gold price assumption underpinning the 2019 Budget is for gold to average around US$1,218.0 per ounce in 2019. 2.1.5 Agriculture Commodities Prices for PNG’s key agricultural exports including coffee, palm oil and copra oil have all displayed a declining trend over the course of the year. This has been due largely to global supply conditions improving which have restored stocks during the year. However, cocoa prices, while increasing at the start then falling after mid-year, still remain slightly above 2017 levels. Coffee The international coffee market has remained well supplied in 2018 resulting in coffee prices displaying a downward trend during the year. Prices declined in the first half of 2018 reflecting weaker-than-expected demand for exports at the beginning of the 2017-18 season. There appears to be an increase in supply over the past coffee year (2017/18) and that is expected to continue for a third conservative season in the coming year. Most of the coffee producing countries are expected to harvest bumper crops in the 2018/19 production cycle.
Source: IMF and Bank of England

2019 National Budget, Volume 1
23
On the demand side, world coffee consumption has steadily grown in the 2017/18 coffee year and this trend is expected to be maintained in the 2018/2019 coffee year. With demand steadily growing and production expected to be more than adequate in the current coffee year, coffee prices in 2018 are expected to trade a little lower than the 2017 levels. Furthermore, if favourable weather conditions continue for the coffee growing countries, markets should remain well supplied, with the low prices of 2018 persisting into 2019. Cocoa Cocoa price movements continued to reflect fluctuations in supply and demand in the cocoa market. Cocoa prices drifted higher during the first half of 2018 driven by concerns over dry and wet weather conditions in West Africa in the first quarter. Cocoa prices retreated in the later part of the second quarter and over the third-quarter of 2018, driven by speculation that global supply continued to outweigh demand during the cocoa season. The same pressures are expected to continue into the 2018-19 cocoa season which began in October and where early signs of favourable weather in major cocoa growing countries has continued to drive this adverse price sentiment. However, there are upside risks as recent rainfall across the Cote d’Ivoire cocoa growing regions could impact the health of the October-March main crop. Too much rainfall would trigger black pod disease, thereby, preventing the first cocoa beans from fully drying. With markets well supplied in 2018, cocoa prices are expected to remain low in 2018 and this trend is expected to be maintained in 2019, albeit some upward price pressure could result from unfavourable weather conditions. Palm Oil Palm oil prices continue to be influenced by developments in Southeast Asia in terms of supply, and by the demand growth in advanced and emerging markets. Prices increased at the start of the year reflecting higher crude oil prices which prompted an increase in demand for alternative fuels including biodiesel in Indonesia. The increase in prices was also supported by a fall in supply of rival seeds, such as soybeans caused by bad weather. From the beginning of the second quarter to September 2018, prices declined by 17.0 per cent driven by an increase in supply from top producers including Indonesia and Malaysia. This is expected to continue for the remainder of 2018 driven by favourable weather conditions in the top two oil palm growing countries and so the market is expected to remain in surplus in 2018 and into 2019 while in contrast, demand remains steady aided by supply disruptions to competing oils including soya beans. With the market well supplied and demand steady, prices are expected to remain around 2018 levels in 2019 which is lower than average levels in 2017. Copra Oil Copra oil prices have been on a decline since the start of 2018 with the market appearing to be in surplus with major producers lifting output after the adverse weather (typhoons) of the previous year. Increasing coconut oil production against lower demand has resulted in a decline in copra oil prices and looking ahead, output is expected to increase with higher export volumes from major producing countries including the Philippines and Indonesia.

2019 National Budget, Volume 1
24
With the market in surplus and demand softer, coconut oil prices are expected to remain low in 2018 and 2019.
Chart 10: Price Index of Palm Oil & Coffee Chart 11: Price Index of Copra & Cocoa
Source: International Monetary Fund (IMF) and Reuters
Over the year to October, coffee prices averaged around US$3,096.0 per tonne, cocoa prices averaged US$2,312.0 per tonne, coconut oil prices averaged US$1,049.0 per tonne and palm oil prices averaged US$587.0 per tonne. Generally, all of PNG’s key agricultural export prices are expected to remain low in 2019. 2.2 EXCHANGE RATE DEVELOPMENTS
In 2018, the PNG Kina exchange rate has generally stabilised after the significant falls in recent years. From early 2018, PNG’s Trade Weighted Index5 (TWI) started to reverse a downward trend observed since mid-2013. While it is clear that the Kina has depreciated against the US dollar in nominal terms, on a trade weighted basis, it has appreciated against major trading partner currencies, especially the Australian dollar, which makes up more than half of the TWI basket. This indicates that the main driver of currency movements around the world has been the appreciating US dollar reflecting the strength of the US economy and rising US interest rate differentials with the rest of the world. Between end 2017 and October 2018 the Kina depreciated by 4.6 per cent against the US dollar, but has appreciated by 3.5 per cent against the Australian dollar.
5 The Trade Weighted Index (TWI) measures the value of the Kina against a basket of currencies of PNG’s major trading partners.

2019 National Budget, Volume 1
25
Chart 12:Trade Weighted Index Chart 13:Exchange Rate Developments
Source: Bank of Papua New Guinea
Between end 2017 and October 2018, the Kina also appreciated against the New Zealand Dollar (+2.5 per cent) and the Chinese Renminbi (+0.8 per cent), however, depreciated against the Japanese Yen (-4.0 per cent), the Hong Kong Dollar (-3.7 per cent), the Malaysian Ringgit (-2.1 per cent), the Singaporean Dollar (-1.6 per cent) and the Euro (-1.0 per cent). The 2019 Budget has assumed that currencies remain around end October 2018 levels. 2.3 DOMESTIC ECONOMIC DEVELOPMENTS AND OUTLOOK
2.3.1 Summary of Developments and Outlook The global economy is enduring new challenges, especially with international relations becoming more delicate in 2018. This has affected commodity prices with each episode having quite opposite effects on PNG’s key mineral exports including oil, gas, copper and gold. Trends observed so far in the year mirror this with oil trending higher in the year while gold and copper remaining volatile. With extractive projects still at the forefront of PNG’s development aspirations, such cyclicality will continue to affect GDP growth and Government revenues. In 2018, the agriculture, forestry and fishery sector is expected to expand by 3.3 per cent in real terms driven by increased cocoa, palm oil and steady coffee output and this is expected to be offset by the lower output of copra oil due to lower prices. In contrast, oil and gas sector production is expected to contract by 9.4 per cent predominately due to the negative impact of the earthquake in February 2018. The mining and quarrying sector was also adversely affected by the quake and is now expected to only expand by 0.2 per cent in 2018. The non-resources sector is expected to be bolstered by the delivery of APEC 2018. With preparations gearing up for the summit in November, associated Government and participant spending is expected to lift incomes and purchases of goods and services, providing a boost to business activities in the final quarter of the year. In 2018, the economy is expected to grow at 0.3 per cent, lower than the 1.0 per cent projected at MYEFO and the 2.4 per cent projected at the time of the 2018 Budget. This is due largely

2019 National Budget, Volume 1
26
to the negative impact of the earthquake which impacted the extractive industry in February. Damages sustained by important project infrastructure including the Hides Gas Condensation Plant (HGCP), the oil processing facilities and power supply infrastructure at Porgera proved to be costly in monetary terms, however, more so in terms of the losses of gas, oil and gold production. The 7 week downtime in March and April meant the economy lost a fair amount in terms of GDP. Despite the quick re-start of production soon after and at rates above pre-quake levels, the impact was deeper than expected resulting in the downward revision to real growth for 2018. The domestic economy also continued to be adversely affected by the shortage of foreign exchange which has impacted non-APEC spending and investment. Over the medium-term (2019-23), the economy is expected to grow at an average annual compound rate of 5.0 per cent buoyed by the incorporation of early works and construction phases of the new mining and petroleum projects into the baseline. Much of the impact from the planning and construction phases will flow through the non-mining economy as direct and indirect benefits in the form of additional jobs, increased incomes and the multiplier effect of this rippling through the domestic economy. In 2018, the Government has also delivered on its commitment to secure budget support funding from international donors and institutions. The Government was able to successfully negotiate the drawdown of the final tranche of the US$190.0 million Credit Suisse loan and the US$100.0 million in ADB budget support funding in mid-2018, and the US$150.0 million from the World Bank which is expected to be drawn down in December 2018. The Government was successful in obtaining its first sovereign bond issued in October 2018 with proceeds amounting to US$500.0 million with the result overwhelmingly positive with the Government successfully pricing the inaugural 10 year bond offering at a yield of 8.375 per cent. This is a rare achievement after previous failed attempts of the past and a big testament to investors’ confidence in the Government’s fiscal and financial management and the Government is currently in discussions with other bilateral external partners for a further budget support loan of US$300.0 million in early 2019. Importantly, the proceeds from these external sources will be used to fully fund the financing requirements of the 2018 and 2019 operational and development budgets, and redeem the necessary high cost and illiquid domestic Government securities to fund the extinguishment of the foreign exchange imbalance. This will provide much needed relief to businesses as we move into 2019 and allow the domestic economy to reap the full benefits of the optimism generated by APEC. 2.3.2 Domestic Economic Activity The PNG economy is estimated to expand by 0.3 per cent in 2018. This is lower than the 1.0 per cent estimated at the Mid-Year Economic and Fiscal Outlook (MYEFO) and the 2.4 per cent projected in the 2018 Budget. This is mostly driven by the negative impact of the earthquake on production in the oil and gas and the mining and quarrying sectors which more than offset the increases in mining output outside the affected areas and the increased output in the non-mining sectors, especially in agriculture, forestry and fishery and the uplift anticipated at the end of the year associated with increased APEC activities.

2019 National Budget, Volume 1
27
Chart 14: Real Economic Growth (2008-2022)
Source: Department of Treasury
As discussed in the 2018 MYEFO, the 7 week shutdown of key oil and gas and mining operations including the Hides Gas Condensation Plant (HGCP), Kutubu Oil Processing Facilities and the Porgera mine translated into significant losses in gas, oil and gold production. While production was restored earlier than anticipated, the increased rates of production observed in the second half of the year are unlikely to see the projects fully recouping the losses sustained in March/April 2018 and as a result, the oil and gas sector is estimated to contract by 9.4 per cent in 2018, much higher than the 2018 Budget estimated contraction of 1.6 per cent. Box 2: Update on LNG production and 2015 National Accounts
LNG Production Rates Update: Estimates of Gas and Condensate production in 2018 were significantly affected by the February 26, 2018 Earthquake. Damages sustained by important project infrastructure including the Hides Gas Condensation Plant (HGCP) triggered a downward revision to production levels. At MYEFO, according to the operator, gas production subsequently ramped up to around 8.7 MTA, well beyond nameplate capacity. This translated into an overall real GDP growth forecast of 1.0 per cent for 2018. However, gas production for the second half of 2018 has now been revised modestly lower to a rate of 8.2 MTA, still above nameplate capacity. This was the latest data provided to Treasury by the operator in September. With a full year’s production expected in 2019, the oil and gas sector is expected to expand by over 6.0 per cent in 2019.
National Accounts Update: The National Statistical Office (NSO) is the agency responsible for the collection and compilation of statistics including economic data and the compilation of PNG’s National Accounts. The office is currently in the midst of a reform period (2015-2019) with assistance from the Australian Bureau of Statistics (ABS) providing the Technical Assistance following NEC Dec 162/2014 for the overhaul of NSO. Several milestones have been achieved from this reform program, including
Gas and condensate production 2018
LNG (MTA) Condensate (MB) Growth
Mid-Year Economic and Fiscal Outlook Report (MYEFO) 8.7 11 1.0%
2019 National Budget 8.2 11 0.3%
Notes:
Million Tonnes per Annum = MTA
Million Barrels = MB

2019 National Budget, Volume 1
28
the timely release and update of the National Accounts 2007-2014 in 2017 which updated the outcomes of GDP for that period which had remained outdated for more than a decade. While this demonstrated much of the progress emanating from the reform activities, more needs to be done before NSO can fully function on its own. In this regard, Treasury and the BPNG have been continuously supportive of the reform process by providing timely assistance in terms of data validation based on economic data provided by NSO through constant collaborations since the start of the reform process. In 2018, NSO, Department of Treasury and BPNG, continued this process during the preparation of the 2015 National Accounts. During this stage, Treasury and BPNG observed a major change or shift in the methodology of compiling the national accounts. This included the use of a Composite Price Index as the new deflator replacing the Consumer Price Index (CPI). This caused a significant variation in the 2015 National Accounts prepared by the NSO compared with the official estimates produced by the Treasury (see below):
Because the change in methodology was something new and since it caused some anomalies in the accounts, the Treasury and BPNG advised NSO to refrain from publishing the 2015 National Accounts until it was comprehensively understood and all associated anomalies from it were reconciled. Unfortunately, NSO proceeded to publish the 2015 National Accounts during the year without addressing the outstanding issues. In view of this, Treasury and the BPNG, including the NSO, established a working committee in September to evaluate the 2015 National Accounts and address all the anomalies before releasing the final accounts again. This work is in progress and will also assist to establish the foundations for the publication of the 2016 National Accounts and the forward years’ national accounts projections. In the meantime, all stakeholders including donors are urged to use official estimates of the National Accounts produced by Treasury especially for the years 2015 to the current year and until the new 2015 National Accounts are released.
In contrast, despite the impact of earthquake, the mining and quarrying sector is estimated to expand by 0.2 per cent in 2018 which is better than -0.1 per cent projected at MYEFO, although lower than the 1.4 per cent projected in the 2018 Budget due largely to the earthquake. The improvement since MYEFO is due to increased gold production from mines outside of the earthquake impact areas especially, from Lihir and Simberi. Output from Lihir has been on the rise over the past three years driven by better gold recoveries and better throughput rates (tonnes per operating hour) with improved technologies while, at Simberi, production has been driven by higher grade ores recovered in July and August that have lifted production since the 2018 MYEFO report. The agriculture, forestry and fishery sector is estimated to expand by 3.3 per cent in 2018, higher than the 3.1 per cent projected at both the MYEFO and in the 2018 Budget. Since MYEFO, this has been driven by increased cocoa and palm oil production, supported by a steady coffee production which more than offset the decline in copra oil output during the year. Higher cocoa prices fetched on the world market in 2018, coupled with the Cocoa Board’s remote area cocoa freight subsidy program, is anticipated to increase cocoa production by around 19.0 per cent this year. Over the year to date, the freight subsidy program is envisaged to have mobilised an additional 31,313 bags of cocoa, equivalent to around 500.0 tonnes of additional cocoa. Palm oil and coffee production have also been robust despite the price declines observed during the year. However, copra oil production has declined due to the fall in world prices for coconut oil.
NSO Treasury
Composite Price Index Consumer Price Index Difference
Kina Million
Gross Domestic Product (GDP) 57136.0 62157.5 -5021.5

2019 National Budget, Volume 1
29
On a more positive note, the anticipated lift in business activity associated with the delivery of APEC 2018 is expected to boost business activities in the non-mining sectors before the year ends. More specifically, indirect benefits of increased Government and participant spending on goods and services is expected to lift incomes which is expected to have a multiplier effect on the broader economy. However, from Treasury’s Business Liaison discussions conducted in September, revisions have been made to reflect the balancing of APEC expenditures with the negative impact of the continuing foreign exchange imbalance and persistent fragilities in the weaker parts of the economy. Revision in real growth to these sectors comprise:
▪ manufacturing sector growth of 3.0 per cent in 2018, revised up from 2.0 per cent at MYEFO, reflecting the positive impact of the implementation of the Government’s protectionist tariff policy on imported food and beverage items. This has provided confidence to local food and beverage manufacturers thus increasing their output and sales during the year;
▪ professional and scientific sector growth of 1.4 per cent in 2018, revised up from 1.0 per cent at MYEFO reflecting some spill-over of increased spending associated with APEC; and
▪ public administration and defence, education and health and social work activities each with a growth of 4.0 per cent in 2018, revised up from 3.0 per cent at MYEFO to reflect the expected 3.0 per cent increase in public servant nominal wages according to the new Pay Awards for Public Servants 2017-2019.
2.4 2019 ECONOMIC OUTLOOK
In 2019, the PNG economy is expected to rebound and expand by 4.0 per cent in real terms driven by the rebound in output in the oil and gas and mining sectors and supported by the increased spending anticipated from some early work’s activities of the new mining and petroleum projects6. The oil and gas sector is expected to rebound and expand by 6.3 per cent in 2019 driven by the return to full-year gas production. Production rates are anticipated to reach greater levels similar to those observed in 2017, thereby, bolstering growth. The increased gas production is expected to outweigh the continued natural decline associated with the crude oil reserves. The mining and quarrying sector is expected to expand by 6.0 per cent in 2019, a faster increase from 2018 due to increased gold output from key mines due to improved operational efficiencies and improved technologies. Supporting this is the expected rebound to normal production from mines affected by the earthquake in 2018. Activity in the non-mining sectors is expected to lift during the year as spending from the new extractive projects impacts the economy. The direct benefits of this are anticipated to spur the construction, transport and storage, and the manufacturing sectors, while the indirect benefits will flow into the other sectors. Much of the direct impact involves the mobilisation of resources including labour, vehicles/machinery and food to support the preparatory construction of plant infrastructure, camp accommodations, access roads, bridges etc. However, the indirect impact is expected
6 Including Wafi Golpu, PNG LNG Train 3 and Papua LNG and P'nyang.

2019 National Budget, Volume 1
30
to flow through from the multiplier effect of money spent in the local economy from various income recipients which is expected to be spread across the broader service delivery sectors of the non-mining economy maintaining its robust growth in 2019. Chart 15: Contribution to Growth by Sectors, 2018 and 2019
Source: Department of Treasury
The other non-mining sectors expected to indirectly benefit from the investment expenditures of the new mining and petroleum projects include electricity gas and air-conditioning, information and communication, wholesale and retail, accommodation and food services, administrative and support services, financial and insurance activities, and real estate activities. In particular, in real terms in 2019:
▪ the electricity, gas and air-conditioning sector is expected to expand by 5.0 per cent in 2019 driven by the additional power demands of the petroleum projects;
▪ the information and communication sector is expected to expand by 3.9 per cent in 2019 driven by additional demand for communication services from the project contractors;
▪ the wholesale and retail trade sector is expected to expand by 3.8 per cent in 2019 as recipients of incomes directly and indirectly from the new projects add to the increase purchases of goods and services;
▪ the accommodation and food services sector is expected to expand by 2.8 per cent in 2019 as hotel apartments and food catering companies meet the additional accommodation and nutrition needs of the project participants;
▪ the administrative and support services sector is expected to expand by 2.8 per cent in 2019 driven by the increased demand for security at the new project sites;
▪ the financial and insurance activities sector is expected to expand by 2.6 per cent in 2019 driven by the demand on financial institutions to process the additional banking needs of persons contracted by the new projects; and

2019 National Budget, Volume 1
31
▪ the real estate sector is expected to expand by 1.4 per cent in 2019 driven by the new
demand for top end accommodation for project contractors. The traditional driver of the economy, including the Agriculture, Forestry and Fishery sector, is also expected to feature strongly with the sector expected to expand by 2.8 per cent in 2019. This is slightly lower than the previous year’s growth due largely to the off-year for coffee growing during the year. Cocoa and palm oil production are expected to remain strong supporting activity in 2019. Medium Term Outlook (2020-2023) Over the medium-term, the PNG economy is expected to grow at an average compound rate of 5.0 per cent which is to be driven by the non-mining sector of the economy, as the early works activities of 2019 ramp up into full construction. The agriculture, forestry and fishery sector is also expected to support this strong growth with the continued implementation of key Government programs including the Cocoa Nursery Program and the remote areas Freight Subsidy Program implemented by the cocoa and coffee commodity boards. The early works program of the new mining and petroleum projects are anticipated to ramp up starting 2020 with most activities peaking in 2022. In line with this, the non-mining economy is expected to grow faster than the mining economy, where an average real annual compound growth rate of 7.2 per cent is projected. There will be more job opportunities created for locals, and increased spending on the movement of machinery, cargo and food. The continued roll-out of the cocoa nursery project and the freight subsidy program is expected to continue to bolster farmer interest, particularly in the cocoa industry. Distribution of new planting materials, especially, hybrid clones by the Cocoa Board is expected to improve cocoa quality, while the subsidy on freight is expected to haul in additional cocoa tonnage from the remote areas across the country and a similar outcome is expected in the coffee industry, however, addressing legacy issues there is key to unlocking this industry’s potential. Other agricultural commodities, including copra and copra oil remain sensitive to world prices. With global supplies steadily recovering, prices have also been on a steady decline. This is a predicament for farmers in PNG as how much they fetch on the global market continues to influence their production decisions. The Government understands this and in 2019 is establishing the policy frameworks with the relevant authorities to address ameliorate some of these issues in the sector over the medium-term. The mining and quarrying sector is expected to contract by 0.4 per cent on average over the medium-term, driven by the varying mine plans of mature mines and especially of the smaller ones approaching closure in 2022 and 2023. Despite this, solid gold output from Lihir is expected to support growth, as the mine looks to maintain its output at a million ounce mark over the medium term. Mining output will be boosted once production commences at the newly constructed mines. The oil and gas sector is expected to contract on average by 1.0 per cent over the medium-term due largely to the slight decline in condensate production in 2020. Aside from this, gas production is expected to plateau at record rates of production, which should outweigh the natural decline in oil production anticipated over the medium term.

2019 National Budget, Volume 1
32
2.5 LABOUR MARKET
Total employment numbers appears to have shown signs of a gradual recovery in 2018. In the first half of the year, employment in the formal private sector was driven by an increase in employment levels in the mining sector, while non-mining sector employment was adversely impacted by the February earthquake. According to the BPNG’s latest employment index, total employment grew by 1.6 per cent (see Chart 16) through-the-year to the June quarter of 2018 driven by increases in mining sector employment which grew by 4.4 per cent over the same period. The growth in mining sector employment reflects recruitment of graduates and general staff by a major petroleum company, and casual workers by a mining company. The earthquake in February 2018 did not impact employment levels at the affected mining and petroleum operations with all staff maintained throughout the production stoppages, but it appeared to have had a significant negative impact on employment levels in the non-mining sector over the first half of 2018.
Chart 16: Employment Index Chart 17:Total Employment Growth
Source: Department of Treasury and Bank of PNG
Employment in the non-mining sector declined by 3.2 per cent over the same period (see Chart 18). This has been driven by a scaling down of employment in the private sector as firms managed costs in lieu of the persisting economic challenges, including the impact of the earthquake and displaced sales by donor imports, the foreign exchange imbalance, depreciating kina and fiscal constraints again, in part, due to the redirection of funding to the earthquake affected areas.
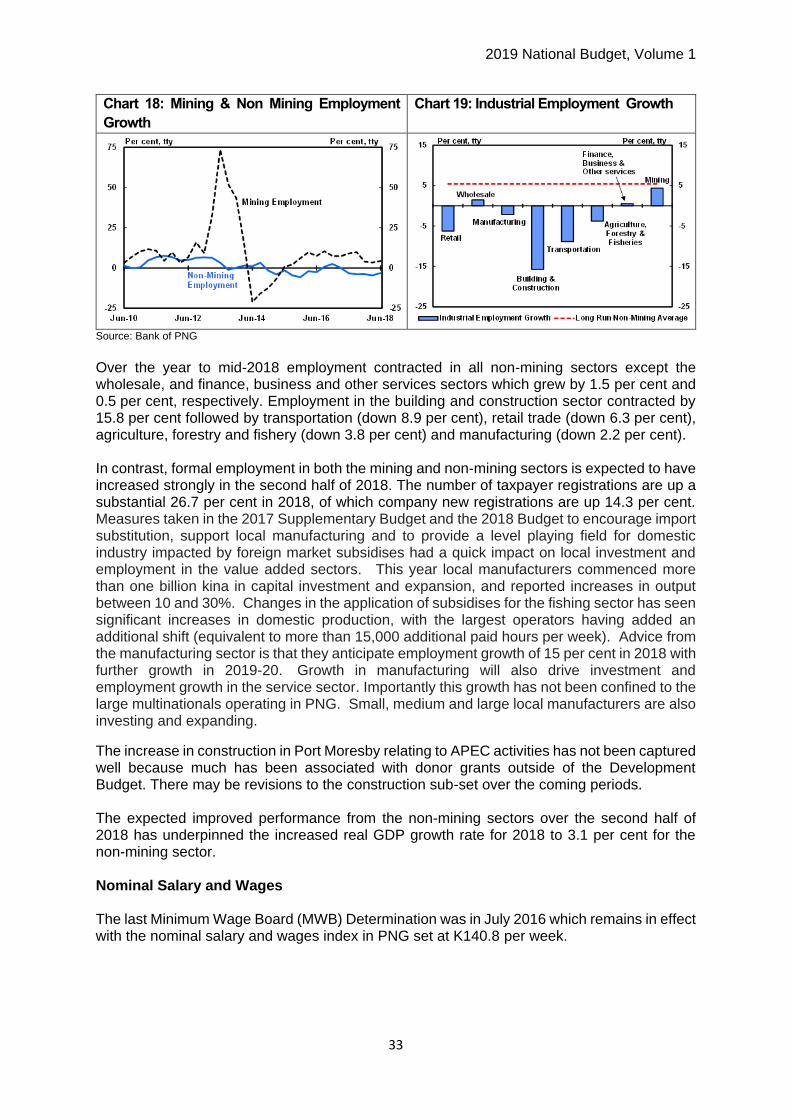
2019 National Budget, Volume 1
33
Chart 18: Mining & Non Mining Employment
Growth
Chart 19: Industrial Employment Growth
Source: Bank of PNG
Over the year to mid-2018 employment contracted in all non-mining sectors except the wholesale, and finance, business and other services sectors which grew by 1.5 per cent and 0.5 per cent, respectively. Employment in the building and construction sector contracted by 15.8 per cent followed by transportation (down 8.9 per cent), retail trade (down 6.3 per cent), agriculture, forestry and fishery (down 3.8 per cent) and manufacturing (down 2.2 per cent). In contrast, formal employment in both the mining and non-mining sectors is expected to have increased strongly in the second half of 2018. The number of taxpayer registrations are up a substantial 26.7 per cent in 2018, of which company new registrations are up 14.3 per cent. Measures taken in the 2017 Supplementary Budget and the 2018 Budget to encourage import substitution, support local manufacturing and to provide a level playing field for domestic industry impacted by foreign market subsidises had a quick impact on local investment and employment in the value added sectors. This year local manufacturers commenced more than one billion kina in capital investment and expansion, and reported increases in output between 10 and 30%. Changes in the application of subsidises for the fishing sector has seen significant increases in domestic production, with the largest operators having added an additional shift (equivalent to more than 15,000 additional paid hours per week). Advice from the manufacturing sector is that they anticipate employment growth of 15 per cent in 2018 with further growth in 2019-20. Growth in manufacturing will also drive investment and employment growth in the service sector. Importantly this growth has not been confined to the large multinationals operating in PNG. Small, medium and large local manufacturers are also investing and expanding.
The increase in construction in Port Moresby relating to APEC activities has not been captured well because much has been associated with donor grants outside of the Development Budget. There may be revisions to the construction sub-set over the coming periods. The expected improved performance from the non-mining sectors over the second half of 2018 has underpinned the increased real GDP growth rate for 2018 to 3.1 per cent for the non-mining sector. Nominal Salary and Wages The last Minimum Wage Board (MWB) Determination was in July 2016 which remains in effect with the nominal salary and wages index in PNG set at K140.8 per week.

2019 National Budget, Volume 1
34
Chart 20: Wages Index
Source: Department of Treasury, Bank of PNG and National Statistical Office
The MWB Determination in July 2016 was the third and final phase of an increase to the minimum wage7 hourly rate with the rate increasing to K3.50 per hour from K3.36 per hour in July 2015, and K3.20 per hour in July 2014. This increase was to accommodate inflationary pressures on minimum wage earners’ income since the last determination. According to the Department of Labour and Industrial Relations, the new rate of K3.50 per hour (or K140.80 per week) will remain in operation until superseded by a new Determination. On a real wage basis, minimum wages declined by 5.4 per cent through-the-year to June quarter 2018 driven by inflation. 2.6 MONETARY DEVELOPMENTS
The Central Bank continued its neutral monetary policy stance by maintaining the Kina Facility Rate (KFR)8 at 6.25 per cent and according to the Bank’s 2018 September Monetary Policy Statement, the money supply is projected to increase by 5.0 per cent in 2018 due to strong inflows from Net Foreign Assets (NFA) (up 30.9 per cent) and to a lesser extent credit to the private sector which is up 7.5 per cent. The significant increase in NFA reflects higher inflows
8 In the 2016 March Monetary Policy Statement (MPS), the Bank made an announcement to have an alternative policy mechanism
to address the weak transmission of the Kina Facility Rate (KFR) to market interest rates. The mechanism is still being assessed
in consultation with stakeholders, both domestic and external. The aim is to have a mechanism that will be more effective in
ensuring that the policy signalling rate transmits to market interest rates.

2019 National Budget, Volume 1
35
of export earnings due to improvements in commodity prices and production of key export commodities, as well as inflows from the Government’s external financing. Meanwhile, the Bank projects net claims by Government to contract by 28.4 per cent, reflecting the shift in Government’s debt financing strategy from domestic to external sources. In the first half of 2018, the money supply declined by 1.3 per cent to an average K22, 131.0 million from an average of K22, 431.1 million over the same period last year as net domestic borrowing by the Government slowed down by 6.0 per cent. Net earnings from foreign assets also contracted by 1.6 per cent to reflect some delay in external financing in the first half of the year. The successful drawdown of the Sovereign Bond among others is expected to lift the inflow from NFA. Meanwhile, private sector borrowing remained positive, with an increase of 3.1 per cent to support economic activity. Chart 21: Money Supply (Annual, Kina Million)
Source: Bank of PNG
In 2019, net inflows from foreign assets is projected to increase by 10.8 per cent, while net domestic borrowing by the Government is projected to contract by a further 25.0 per cent as the Government maintains its domestic debt retirement strategy. Private sector borrowing is projected to lift by another 6.5 per cent to support economic activity and the money supply is projected to increase by 6.4 per cent while the monetary base is projected to increase by 4.1 per cent reflecting these trends. 2.7 CONSUMER PRICE INDEX
2018 Inflation Update The headline inflation rate increased by 1.3 per cent in the June quarter 2018 compared to a 1.0 per cent increase in the March quarter (see Chart 22). In through-the-year terms, inflation increased by 4.5 per cent, the same as in the March quarter. Over the past year, headline inflation has been on a steady decline and this is due to sharp falls in seasonal and price control items, including fruit and vegetables (down 14.0 per cent) and fares (down 13.0 per cent) over the same period. The increase in the consumer price index during the quarter was largely driven by increases in communication services (up 3.7 per cent), clothing and footwear (up 3.0 per cent),

2019 National Budget, Volume 1
36
restaurants and hotels (up 3.0 per cent), transport (up 2.0 per cent) and health (also up 2.0 per cent). The underlying inflation rate increased by 1.9 per cent in the June quarter, compared to 1.7 per cent in the March quarter to be 6.5 per cent higher in through-the-year terms (see Chart 23). The increase in underlying inflation this quarter marks the fifth consecutive quarter of the rise in core inflation which is due largely to the lagged impacts of the depreciation of the Kina and high oil prices steadily filtering through into the domestic economy over the past 12 months. Chart 22: Headline & Underlying CPI- Quarterly Chart 23:Headline & Underlying CPI- Through-
the-year
Source: National Statistics Office (NSO)
Tradable and Non-Tradable Prices of imported (or tradeable) goods continued to rise, increasing by 9.2 per cent through the year to the June quarter 2018 compared to a 2.4 per cent increase in the corresponding quarter last year (see Chart 24). This is a sharp increase and reflects the rising business costs associated with the depreciating Kina, high oil prices and the continued shortage of foreign exchange over the past year. In particular, and in assessing developments of these factors over the past year, the following factors have been observed:
• The Kina has depreciated by 4.6 per cent against the US dollar, however, has appreciated by 3.5 per cent against the Australian dollar over the past year. Despite the appreciation against the Australian dollar, businesses that trade in the US dollar will have been faced with higher import bills and this would have been passed on as higher prices over the course of the year;
• Oil prices have risen from around US$45.0 per barrel in June 2017 to around US$65.0 per barrel in the first half of this year. Given the import parity pricing formulae, this is expected to have translated into higher transportation costs which have been passed on to consumers in the form of higher fuel prices; and
• According to Treasury’s Business Liaison Program conducted in September 2018, most businesses in Port Moresby, while indicating some improvements in the flow of

2019 National Budget, Volume 1
37
foreign exchange, also acknowledged that delays in acquiring foreign exchange still persist which continue to increase the cost of sales to date.
In contrast and offsetting the higher price pressures from imports, non-tradeable goods’ (i.e. domestically generated) prices have moderated considerably over the past year, rising only by 0.3 per cent in the June quarter 2018 to be only 1.9 per cent up through-the-year, compared to a quarterly growth rate of 1.5 per cent and a through-the-year growth rate of 7.6 per cent in the corresponding quarter last year. This is due largely to the subdued state of the domestic economy over this period and weak income growth. Chart 24:Tradeable vs Non-Tradeable inflation -
Quarterly
Chart 25: Tradeable vs Non-Tradeable
inflation – Through-the-year
Inflation Outlook Inflation in 2018 has been revised down to 5.6 per cent, lower than the 5.9 per cent as projected in the MYEFO and the 6.9 per cent projected in the 2018 Budget with this downward revision due largely to the lower quarterly outcomes of the consumer price index reported by the NSO and the lower imported inflation rates on goods and services from Australia – our major trading partner. This more than offsets the upside pressures especially, from the depreciating Kina against the US dollar, and rising oil prices and import tariffs on certain food and beverage imports announced in the 2018 Budget. Quarterly outcomes in the CPI reported in March and June this year have been lower than Treasury’s initial expectations. The lower index numbers for both quarters accounted for the bulk of the downward revision to the 2018 inflation forecast. In spite of weaker price pressures over the first half of 2018, the delivery of the APEC Leaders’ Summit in November remains a catalyst that is expected to lift economic activity and prices before the year ends. Treasury’s inflation forecasts capture some of this through the increased level of Government and participant spending to the host the Summit. Service providers including security guards, mobile phone and internet providers, transport, and accommodation and food suppliers will likely receive increased orders for their services during this time and is likely to result in additional jobs and increased incomes flowing to PNG residents. As a result, the new demand created from APEC spending should see prices lifted in the final quarter. Inflation, as such, is projected to reach 5.6 per cent by the end of 2018.

2019 National Budget, Volume 1
38
Chart 26: Inflation outcome and projection 2005-2023
Source: National Statistical Office (NSO)/Department of Treasury
2019 Inflation Outlook In 2019, inflation is projected to ease to around 5.4 per cent as the economy stabilises after the APEC lift in 2018 and greater stability in the Kina and the extinguishment of the excess demand for foreign exchange will assist in the easing of price pressures in 2019, although the higher economic growth rates will ameliorate some of this downward pressure. Inflation is projected to rebound to 5.5 per cent in 2020 as the early works of new mining and petroleum projects commenced in 2019 start to accelerate. Increased mobilisation of resources including labour is expected to boost incomes and spending, thereby increasing prices in 2020. Over the medium-term, inflation is expected to average around 4.6 per cent reflecting the co-ordinated fiscal and monetary policy settings, as the Government continues to preserve macro-economic stability going forward. 2.8 BALANCE OF PAYMENTS AND INTERNATIONAL RESERVES
2018 Update The current account recorded a surplus of K9,300.0 million in the first half of 2018, driven by a positive trade balance of K8,581.0 million reflecting the higher mineral prices observed during the year which more than offset the mining production losses from the earthquake earlier in the year. On the import side, the continued low levels of domestic activity, coupled with the prolonged foreign exchange shortages continued to contain business activity resulting in lower import activity in the first half of the year. Despite this, the higher mineral resource prices, especially, for oil and gas, the ramping up of oil, gas and gold production subsequent to the earthquake, and non-earthquake affected mining output (especially for gold), together with higher cocoa production all are expected to translate into an expected trade surplus of K21,472.9 million and a current account surplus of K22,003.8 million by the end of 2018. The income account recorded a deficit of K392.0 million in the first six (6) months of the year, down 47.0 per cent from the corresponding period of 2017 with this narrowing of the deficit

2019 National Budget, Volume 1
39
being due to lower income and dividend payments to non-residents due to the foreign exchange restrictions, offsetting higher interest payments in the first six (6) months of the year and this is expected to continue in the second half of the year with the income account expected to record a deficit of K847.2 million by the end of the year. The transfer account recorded a surplus of K1,111.0 million in the first six (6) months of the year which is 193.0 per cent higher than the corresponding period in 2017 and is due largely to the big inflows in gifts and grants and a one-off increase in licensing fees paid in to a number of resident companies in the first quarter following the closure of their foreign currency accounts. This was also supported by lower payments of tax, family maintenance and licensing fees to non-residents in the first six (6) months. With increased gift and grant inflows expected to be more than total outflows in the second half of the year, this account is expected to record a surplus of K1,378.1 million by end of the year. The capital and financial account recorded a deficit of K9,196.1 million in the first half of the year, 6.0 per cent higher than the corresponding period of 2017 which reflects a strong increase in other financial capital outflows which was enough to offset a sharp decline in portfolio investment during the period. Overall, this account is expected to record a deficit of K22,003.8 million in 2018 offsetting the current account surplus.
Chart 27: Balance of Payment (BOP)
Source: Bank of BPNG
2019 BOP Outlook In 2019, the current account surplus is expected to be K21,062.5 million (23.8 per cent of GDP), a 4.3 per cent decrease from the 2018 estimate. Treasury has conservatively incorporated the start of early works for a number of new extractive projects into its baseline and, therefore, the import component of their capital expenditure programs is anticipated to increase imports of goods and services in 2019, as these projects start to ship in equipment, machinery and labour for the operations. This development is expected to take effect mid-way through the year, however, is anticipated to be masked by the impact of an increase in exports especially of higher gas and gold
-10000
-5000
0
5000
10000
15000
20000
25000
-10000
-5000
0
5000
10000
15000
20000
25000
2009 2011 2013 2015 2017 2019 2021 2023
Trade Balance
Current Account Balance
Income Balance
K' million K' million

2019 National Budget, Volume 1
40
production. As such, the trade balance is expected to only decline by 4.3 per cent to K20,550.2 million in 2019. As the inflows for the commencement of new projects accelerate, the adverse impact on the trade account while not yet significant in 2019, will be offset by external funding inflows through the capital account of the resource developments. Medium Term Outlook (2020-2023) The current account surplus is expected to sharply decline over the medium-term moving into a deficit position by 2022 which is largely underpinned by the capital works program of the new projects as they ramp up construction activities in 2020 before peaking in 2022 and 2023. This is expected to more than double the size of the goods and services import bill from 2018 levels, thereby, seeing the trade balance shrink to a deficit of K8,933.4 million and the current account to a deficit of K8,628.3 million by 2023 from surpluses of K21,472.9 million and K22,003.8 million respectively in 2018. Inflows through the capital account, however, will more than offset the trade and current account deficits, leaving the overall balance of payments in healthy surplus. The current account is expected, however, to move back into a surplus position once the construction of the new mines is complete and production and exports commence. Chart 28: International Reserves
Source: Bank of PNG
International reserves totalled US$1,735.6 million at the end of 2017, 5.5 months of total import cover and this is expected to increase to US$2,476.7 million by the end of 2018, sufficient for 7.7 months of total import cover and 13.8 months of non-mineral import cover. The increase expected in total reserves is due to increases in Mining and Petroleum Tax (MPT) collections throughout the year, dividend inflows from state shares in mining and petroleum projects, and royalty and development levies from the PNG LNG project. In addition, the external financing of the budget deficit from the sovereign bond, together with concessional, commercial and other sources will also increase foreign exchange reserves before the year ends. Foreign exchange reserve levels are projected by the BPNG to increase modestly by 4.6 per cent by the end of 2019, maintaining total import cover of 7.7 months.

2019 National Budget, Volume 1
41
2.9 RISKS TO MACROECONOMIC STABILITY
The 2019 Budget has been framed on the assumption of solid growth from the oil and gas sector supported by the mining and quarrying and agriculture sectors, improvements in the non-resource sector, higher levels of Government domestic spending and an increase in production of key mineral and petroleum export commodities. Despite these supporting factors, there are risks to the 2019 economic and fiscal outlook. Regarding the broader economy, there are a number of risks: Macroeconomic Risks:
• Trade Tensions - Uncertainty in global trade relations between the US and China continues to pose volatility risk that could impact adversely on commodity prices and our exports in the agriculture, fishery and forestry sector and mining and quarrying and oil/gas sectors. In the latest October 2018 WEO, the US has planned to impose a 25.0 per cent tariff on all Chinese imports with the imposition of the tariff potentially affecting many countries that trade with China and PNG being no exception.
• Global Growth/Commodity Prices - Global growth has an important bearing on commodity prices and should global demand strengthen, demand for commodities from developed and emerging market economies including China and India and the US could trigger a rally in prices. In contrast, should these economies not meet growth expectations, prices could decline in 2019 and these swings in commodity prices translate into fluctuations in revenues for the Government, private sector demand and budget financing limits. Anticipated lower global demand and falling commodity prices would also impact the exchange rate with both business confidence and inflation being adversely impacted. This Budget is based on prudent assumptions for world growth and commodity prices but the Government maintains a commitment to alter the budget parameters should these risks materialise.
• Continued imbalance in the supply and demand of foreign exchange - This imbalance could continue if the Government maintains spending without accessing sufficient levels of external financing and if balance of payments net inflows fail to materialise. Should this continue to worsen in 2019, there is a risk that economic growth projections will not be achieved, impacting income and employment levels and service delivery.
• Delayed large investment projects - Slower than expected implementation of large extractive investment projects will also adversely impact overall economic growth and anticipated revenue growth. The current growth projections of the domestic economy also incorporate the early works on some of the major mining and petroleum resource projects. Delays to these projects will adversely impact GDP growth;
• Adverse weather conditions - Recent experience of the drought in 2015, which affected Ok Tedi production levels and growing conditions of certain cash crops including cocoa, coffee and palm oil, highlights the need to take account of natural disasters in risk planning. While many risks are beyond our control, it is important the Government, commodity boards and resource companies incorporate mitigation strategies into their plans to ameliorate the negative impacts of weather related shocks.

2019 National Budget, Volume 1
42
Further, the recent 2018 earthquake which impacted the PNG LNG project, the Kutubu oil fields as well as key mines like Porgera, adversely impacted their operations and again risk management strategies need to be employed.
• Coffee Berry Borer (CBB) - The Government is mindful of the devastation of CBB on the coffee industry, the economy and the lives of rural people and so the 2019 Budget supports the CIC with an increase in funding to address the CBB. This should assist CIC in restricting the spread of the pest and limiting its negative impact. However, any outbreak or reduction in funding to cope with agricultural pests poses risks to the outlook.
Fiscal Risks:
• Failure of Statutory Agencies to pass through the collection of fees and charges in line with the Government’s 25 Point Plan for a 90/10 ratio and failure of State Owned Enterprises to pay the appropriate levels of dividends to CRF. Non-payment of collections and dividends has had a significant negative impact on past budgets translating into key priorities not being implemented, services not being provided and placing the budget under stress. Given the continued tight economic conditions, the Government will be monitoring agencies and SOEs to ensure strict compliance with stated directives.
• Unbudgeted Expenditures/Commitments. The Government encourages all Departments, SOEs, Provincial Governments and Ministers to live within their means as any unbudgeted expenditures undertaken in 2019 will have fiscal implications and the credibility of the Government’s MTFS will be placed in jeopardy. In particular, Personnel Emolument (PE) overruns continue to remain a major issue with fiscal implications and the Government has put in place further controls over PE overruns in the 2019 Budget and failure to adhere to these restrictions will undermine the Budget forcing likely reductions in the capital budget.
Financing Risks:
• Debt Guarantees. Exposure through debt guarantees and contingent liabilities is a concern in determining the net worth of the State, thus has implications on the statutory debt ratio ceiling in the FRA and PNG’s credit ratings;
• Whilst the Government has been successful in rebalancing its debt portfolio much more toward longer term external debt with large planned shorter term domestic debt redemptions, the resulting higher foreign exchange risk needs to be managed; and
• With access to more external debt for budget financing, careful fiscal management will be required to ensure overall debt levels remain sustainable and maintained on the programmed downward debt to GDP trend. In this respect, NSO’s proposed revisions to the GDP data for 2015 and 2016 will impact nominal GDP levels, lowering the base for ratios that use nominal GDP, which is particularly important for prescribed debt/GDP ratios as in the FRA.
With all these risks (excluding the weather related ones) being finally balanced at this point, escalation of any one of them could have serious implications for the 2019 Budget and MTFS targets. The Government remains mindful of such risks and will closely monitor developments. It will continue to aggressively implement its medium term fiscal, revenue and debt strategies included in the 2019 Budget with mitigation strategies employed should any significant risks materialise.

2019 National Budget, Volume 1
43
CHAPTER 3: FISCAL STRATEGY AND OUTLOOK 3.1 FISCAL BACKGROUND - 2018 BUDGET UPDATE
The 2018 Budget was the first Budget in the new Medium Term Fiscal Strategy (MTFS) 2018-22 which was formulated against a very difficult set of fiscal and financing constraints at the time. Economic growth had declined since 2014 following the end of the construction phase of the PNG LNG project. In 2015, the economy was hit by the El Nino drought. In late 2015 and in 2016, the fall in commodity prices impacted adversely on PNG’s export earnings with a resultant decline in Government revenue. These adverse impacts, coupled with a continuing foreign exchange imbalance over 2017 had a negative impact on Government revenues and GDP growth and resulted in large unexpected budget deficits and higher debt and debt service levels. Though the Government pursued a strict fiscal consolidation path, enacting restrictive supplementary budgets, a number of expenditure categories expanded that were of a rigid nature, such as personnel emoluments9, rentals, utilities and education and health subsidies. Much of the burden of fiscal consolidation fell on reductions to Capital Budget expenditures, as well as an accumulation of arrears. Following the 2017 Supplementary Budget and the Government’s 25PP, a number of policies were established that accelerated fiscal adjustment, although some of the adjustment reflected the challenges in obtaining domestic finance. The withdrawal of operational warrants and a reduction in SIPs also underpinned expenditure consolidation efforts. Overall, the 2017 Final Budget Outcome (FBO) report showed a fiscal deficit at K1.7 billion or 2.3 per cent of GDP compared with the 2017 Supplementary Budget target of 2.5 per cent of GDP. The lower deficit resulted in a reduction in the debt to GDP ratio to 31.9 per cent. Despite the decline in the deficit, certain expenditures such as personal emoluments came in above budget but were offset by higher tax revenues from GST and personal income tax. Government budgets in recent times have been financed through recourse to the domestic debt market. This market became quite illiquid by the end of 2017 with the Government fiscal tightening and with net balance of payments inflows being accumulated in offshore accounts. Banks had reached prudential limits to the additional take-up of Government securities and, what liquidity was available in the market was tied up with the foreign exchange imbalance. With banks unable to fund the Government’s fiscal deficit in 2017, the budget was tightened. The delay in the release of the programmed final tranche of the Credit Suisse loan also added to financing constraints. The challenges for fiscal policy were clearly apparent, and the impact of both the budget constraints and the foreign exchange imbalance adversely affected private sector growth. The Treasury Business Liaison Program clearly showed the impact on private sector activity and domestic demand. To confront these dire fiscal and financing challenges, the Government made strong fiscal and financing commitments in 2018 which were incorporated in the Medium Term Fiscal Strategy (MTFS) 2018-22, the foundation of the 2018 Budget. Fiscal discipline was to be maintained such that fiscal deficits would decline as a proportion of GDP over the term of the plan, resulting in the debt to GDP ratio declining to 30.0 per cent by 2022. This was to be achieved by reversing the previous years’ declining revenue to GDP trend through adoption of PNG’s first comprehensive Medium Term Revenue Strategy (MTRS) 2018-22 and through engineering a declining expenditure to GDP trend. Importantly, within this declining expenditure trend, there was to be a compositional shift between rising operational spending and towards more development spending and at a decentralised level. And to solve the
9 compensation of employees

2019 National Budget, Volume 1
44
intractable financing and exchange rate constraints, a coherent and well-designed Medium Term Debt Strategy (MTdS) 2018-22 was formulated that would seek to fund the fiscal deficits and fix the exchange rate imbalance through a significant shift in the mix of financing toward external loans. And this was to be achieved without adding significant debt service costs to the fiscal program. Overall, in 2018, substantial progress was made in achieving the ambitious goals and targets presented in the three medium term plans covering fiscal, revenue and debt strategies. This was quite remarkable given the devastating earthquake that struck PNG in February 2018 and the need for PNG to focus on the recovery efforts from such a serious natural disaster, while at the same time mobilising activities to undertake the daunting task of preparing for an inaugural sovereign bond issuance program and at the same time undertaking the massive preparations for the substantial APEC Summit. The 2018 Budget projected GDP growth of 2.4 per cent for 2018. This was revised down to 1.0 per cent in the 2018 MYEFO report following the devastating 7.5 magnitude earthquake in February 2018. Apart from the huge human costs, this affected production in the main resource projects, namely the PNG LNG project, the oil projects in Kutubu and the Porgera. The speedy resumption of resource project production at pre-earthquake output levels underpinned the 1.0 per cent real GDP forecast growth rate, which had been revised down earlier by a much greater amount. In the 2018 MYEFO report, Total Revenue and Grants was projected to be K213.2 million higher than the 2018 Budget estimates, predominately due to an increase in the estimated collection of mining and petroleum taxes. Total Expenditure and Net Lending was also projected to be K213.2 million higher than the 2018 Budget estimates, thereby maintaining the budget deficit at K1, 987.2 million. The higher expenditures were predominately due to an estimated above budget increase in Personnel Emoluments (Compensation of Employees) and a number of measures were canvassed to halt the expansion in this category. The 2018 MYEFO report estimated that total public debt would reach K25,545.5 million, or 31.2 per cent of GDP by end-2018 compared to 32.2 per cent projected in the 2018 Budget. The decline in the Debt to GDP ratio is attributed to the upward revision in nominal GDP projections for 2017 and 2018. At these rates, debt levels were clearly within the 30-35.0 per cent band as prescribed in the FRA and were trending lower, also consistent with the 30.0 per cent FRA target by 2022. While the Government maintains its commitment to delivering major expenditure commitments in terms of the MTDP Enablers and key Government priorities, the immediate challenge for the Government, as highlighted in the MYEFO report, is to maintain fiscal discipline throughout the second half of 2018 and fully implement the stated remedial actions in order to be in compliant with the fiscal parameters as per the MTFS and the PNG Fiscal Responsibility Act 2006.
Despite the lift in revenue, as per the MYEFO projection, there was a clear need for immediate intervention with corrective measures to contain the rising expenditure trends in a number of categories such as Personnel Emoluments (PE), Interest Costs, Utility Costs and Nambawan Super Exit Payments. These expenditures tend to be of a rigid nature and tied to contractual or statutory obligations, such as the intake agreements for teachers, the disciplinary forces and health workers. Consequently, policy interventions have taken longer than expected to impact these trends and the costs have been higher than projected in all recent budgets. The fulfilment of the Government priority spending in such situations comes at the cost of substantial warrant restrictions predominately on capital projects and, at times, the reform agenda is compromised. The difficulties often spill over into an accumulation of arrears, which has adverse effects on the private sector and SOEs.
2019 National Budget, Volume 1
45
Despite elevated fiscal risks from these expenditure challenges, coupled with higher country risk from the devastating earthquake, the domestic financing challenges, the foreign exchange imbalances and the need to fund and stage APEC – all of which led to a credit rating downgrade on PNG’s outlook – the Government overcame these obstacles and achieved unprecedented success in 2018 in achieving its ambitious financing agenda. The set of financing milestones, not seen before in PNG, comprised:
• Firstly, the final tranche of the Credit Suisse loan facility loan (US$190.0 million) was negotiated and disbursed in mid-2018;
• Secondly, the US$300.0 million ADB Budget Support Loan was successfully negotiated, of which the first tranche of US$100.0 million was disbursed in the September quarter 2018;
• Thirdly, the US$300.0 million World Bank Budget Support Loan was successfully negotiated, of which the programmed first tranche of US$100.0 million was increased to US$150.0 million in support of the earthquake remediation costs. The loan was approved by the Bank’s Board in November 2018 and is due to be disbursed prior to year-end 2018. This is the first budget support loan to have been negotiated with the World Bank in over 18 years. The renewed partnership with both the ADB and the World Bank is a clear testament to the Government’s prudent fiscal program as incorporated in its medium-term strategies and its diligence in staying the course on fiscal prudence; and
• Finally, PNG’s inaugural sovereign bond issuance of US$500.0 million in early October 2018 at 8.375 per cent was extremely successful and hailed by international financial commentators. It was the culmination of nine (9) month’s work and was against the background of rising US interest rates and a significant increase in emerging market uncertainty and rising yields. The offers of over US$3.0 billion for the long term (10 year) notes for a first time issuer, such as PNG, again is surely a testament to the Government’s management of its economic, fiscal and financial program.
The success of this external debt raising program in raising US$940.0 million in 2018 has allowed the financing mix to be favourably altered in 2018. This now allows a substantial domestic debt redemption program to be initiated in late 2018 that will underpin both the full funding of the 2018 deficit, as well as major inroads into extinguishing the foreign exchange imbalance by providing the market with liquidity and the foreign exchange reserves to back it up. Despite the extent of this external debt raising program, maintenance of firm fiscal conditions throughout 2018 and a diligent and meticulous approach to APEC spending, plus a substantial domestic debt redemption program, will see the 2018 fiscal deficit come in below budget by nearly K100.0 million or 2.3 per cent of GDP and the estimated debt to GDP ratio at end 2018 fall to 30.8 per cent which is significantly lower than the ratio projected in the 2018 Budget of 32.2 per cent – and well within the FRA prescribed band of 30-35.0 per cent and clearly trending lower towards the FRA target of 30.0 per cent by 2022. Importantly, with the balance in the Bond Trust Account being an estimated K800.0 million at end-2018, this will provide a solid financing base to execute the 2019 Budget program without the need to resort to warrant restrictions early in the year. This will be the first year for a number of years that the budget has been financed from the commencement of the fiscal year. Other achievements in 2018 included the mobilisation of non-tax revenue through the enactment of the Public Monies Management Regularisation (PMMR) Act 2017 which resulted in the transfer of significant funds to the Consolidated Revenue Fund to support the Government’s budget. These monies had previously been held in various trust accounts of

2019 National Budget, Volume 1
46
Government departments and statutory authorities. The O’Neill-Abel Government’s important achievement in reversing the previous adverse revenue trends was critical in mobilising additional revenue through the commencement of the MTRS 2018-22. Increased revenues have been achieved, both in terms of mobilising higher taxation collections through increased compliance and enforcement activities by the Internal Revenue Commission (IRC) and the PNG Customs Service (PNGCS), and higher non-tax revenues through both the PMRR reform and enforcement of dividend policies. As a result of implementing the MTRS, additional revenue of K558.0 million was collected and remitted to the CRF as at end October 2018. This comprised of K355.0 million from the PMRR exercise and K203.0 million from the compliance and enforcement activities of IRC. Some of the revenue reform initiatives that are being implemented will have medium term revenue effects that will underpin the MTRS targets over the course of the strategy. Consistent with reforms encapsulated in its 25PP, the Government has continued in 2018 to launch new projects in health, transport, telecommunications and energy sectors of the economy that will underpin higher economic growth and improved social conditions for our people. Equally important have been the implementation of further reforms in public financial management, particularly in procurement practices, that will ensure greater accountability and transparency. The preparations for the 2018 APEC Leader’s Summit have provided some impetus for further growth with a number of key infrastructure projects being initiated such as the submarine fibre-optic cable, the Port Moresby Sewerage project, the upgrading of the Port Moresby road network, the construction and expansion of hotel accommodation and conference facilities, and the expansion of the Port Moresby International Airport. While a number of challenges from 2018 remain to be addressed, such as the expanding PE budget, these have been overwhelmingly offset by the marked achievements in 2018 relating to the timely and effective recovery efforts from the earthquake, the higher revenue generation and revenue policy reforms, vastly improved debt management and financing milestones, reductions in the foreign exchange imbalance and the successful staging of the APEC Summit. With expectations of further positive announcements at the upcoming APEC Summit, PNG will begin 2019 on a very sound fiscal basis, with all the reform programs enshrined in the medium term plans on track and gathering pace and, for the first time in many years, with the financing in place to allow the efficient execution of the 2019 Budget from day one. 3.2 2018 SUPPLEMENTARY BUDGET
The 2018 MYEFO Report showed a modest deterioration in fiscal conditions with personnel emolument expenditures (PE) showing the continuation of the previous adverse trend. This was offset by expectations of higher MPT collections. It was noted that the final tranche of the Credit Suisse loan, which was programmed for late 2017, had been received. A number of directives were issued to remedy the adverse expenditure trends. Following the September outturn report, it is estimated that an additional (above budget) K671.0 million in revenue is likely to be collected by end 2018. The increase is predominately due to a lift in MPT to K725.0 million against the original budget projection of K179.0 million. Kumul Petroleum Holding Limited (KPHL) dividend payments are also expected to increase by K400 0million to K700.0 million against the K300.0 million projected for 2018. Personal Income Tax collections have come in marginally lower than expected in the 2018 Budget due to subdued domestic economic conditions, although more recent data suggests that this tax could achieve its budget target. In contrast, Corporate Income Tax and

2019 National Budget, Volume 1
47
GST receipts are running marginally above budget. Export Tax is expected to be significantly higher than budget reflecting the changed tax arrangements and higher export prices. However, the 2018 September Outturn report is projecting 2018 Budget expenditures to blowout by K889.0 million, largely from PE of up to K944.0 million. This includes the payment of the NSL exit payment arrears in September 2018 which were only partly appropriated. The expenditure increase is being offset by a reduction in warrants for goods and services and capital expenditures. Table 2: 2018 Supplementary Budget
Source: Department of Treasury
To maintain the 2018 Budget deficit on a declining trend, measures have been effected to limit the PE blowout to no more than K400.0 million, such as switching off off-line payments from the Alesco payroll system, cessation of unessential overtime payments, etc. Savings of K277.0 million have been identified from the Government of PNG capital expenditure. With these savings measures in place and with the additional revenues projected of K671 million, it is estimated that the budget deficit will decline slightly to K1,897.2 million or 2.3 per cent of GDP. Nevertheless, a Supplementary Budget will still need to be submitted to cater for the over expenditures in these particular categories.(The Supplementary Budget Bill is provided in the
attached documents).
Personnel Emoluments K400.0 million Provisions for Works, Medicine, Utilities, Rental and Other Arrears: K310.0 million Superannuation Exit Arrears: K146.1 million Debt Service (Interest Cost): K72.0 million TFF (Commodity Component) K20.0 million
Total K948.1 million
The total expenditure increase of K948.1 million will be funded by the projected revenue increase of K671.1 million and the expenditure savings of K277.0 million from the reallocation of capital from the PIP Budget, thereby maintaining the 2018 Budget deficit fiscal anchor. 2018 Financing and Debt The amount required to complete the 2018 estimated net financing requirement is equivalent to the budget deficit which is expected to be marginally under target at K1,897.2 million. However the financing mix has been altered significantly due to:
• the receipt of the final tranche (USD190.0 million) of the Credit Suisse Loan in 2018 having been previously programmed for release in late 2017;
• the receipt of the full USD500.0 million sovereign bond proceeds in October 2018 where only USD200.0 million was programmed in the 2018 Budget;
Details 2018
Budget
2018 Supplementary
Budget
Adjustment required
Total Revenue and Grants 12,731 13,400.3 671
Total Expenditure and Net Lending* 14,718 15,297.5 579
Net Lending (+)/Net Borrowing (-) -1,987 -1,897.2
% of GDP -2.5% -2.3%
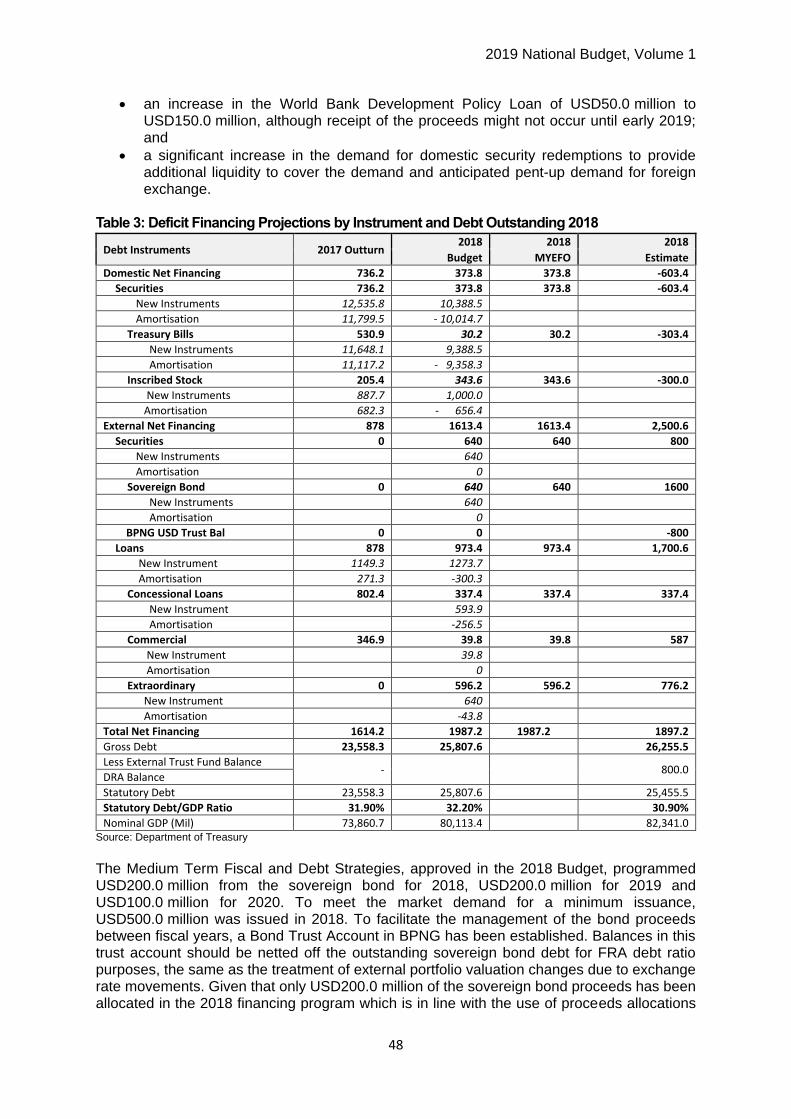
2019 National Budget, Volume 1
48
• an increase in the World Bank Development Policy Loan of USD50.0 million to USD150.0 million, although receipt of the proceeds might not occur until early 2019; and
• a significant increase in the demand for domestic security redemptions to provide additional liquidity to cover the demand and anticipated pent-up demand for foreign exchange.
Table 3: Deficit Financing Projections by Instrument and Debt Outstanding 2018
Debt Instruments 2017 Outturn 2018 2018 2018
Budget MYEFO Estimate
Domestic Net Financing 736.2 373.8 373.8 -603.4
Securities 736.2 373.8 373.8 -603.4
New Instruments 12,535.8 10,388.5
Amortisation 11,799.5 - 10,014.7
Treasury Bills 530.9 30.2 30.2 -303.4
New Instruments 11,648.1 9,388.5
Amortisation 11,117.2 - 9,358.3
Inscribed Stock 205.4 343.6 343.6 -300.0
New Instruments 887.7 1,000.0
Amortisation 682.3 - 656.4
External Net Financing 878 1613.4 1613.4 2,500.6
Securities 0 640 640 800
New Instruments 640
Amortisation 0
Sovereign Bond 0 640 640 1600
New Instruments 640
Amortisation 0
BPNG USD Trust Bal 0 0 -800
Loans 878 973.4 973.4 1,700.6
New Instrument 1149.3 1273.7
Amortisation 271.3 -300.3
Concessional Loans 802.4 337.4 337.4 337.4
New Instrument 593.9
Amortisation -256.5
Commercial 346.9 39.8 39.8 587
New Instrument 39.8
Amortisation 0
Extraordinary 0 596.2 596.2 776.2
New Instrument 640
Amortisation -43.8
Total Net Financing 1614.2 1987.2 1987.2 1897.2
Gross Debt 23,558.3 25,807.6 26,255.5
Less External Trust Fund Balance - 800.0
DRA Balance
Statutory Debt 23,558.3 25,807.6 25,455.5
Statutory Debt/GDP Ratio 31.90% 32.20% 30.90%
Nominal GDP (Mil) 73,860.7 80,113.4 82,341.0 Source: Department of Treasury
The Medium Term Fiscal and Debt Strategies, approved in the 2018 Budget, programmed USD200.0 million from the sovereign bond for 2018, USD200.0 million for 2019 and USD100.0 million for 2020. To meet the market demand for a minimum issuance, USD500.0 million was issued in 2018. To facilitate the management of the bond proceeds between fiscal years, a Bond Trust Account in BPNG has been established. Balances in this trust account should be netted off the outstanding sovereign bond debt for FRA debt ratio purposes, the same as the treatment of external portfolio valuation changes due to exchange rate movements. Given that only USD200.0 million of the sovereign bond proceeds has been allocated in the 2018 financing program which is in line with the use of proceeds allocations

2019 National Budget, Volume 1
49
in the Bond Purchase Agreement, the additional USD300.0 million will need to be rolled into subsequent fiscal years and not used for fiscal financing in 2018, but could be used for domestic debt redemptions or debt reconstruction. In terms of the financing mix for the expected financing requirement of K1,897.2 million for 2018, net external financing has increased from the budgeted K1,613.4 million to K2,500.6 million, thereby allowing net domestic debt redemptions of K603.4 million compared to the budgeted net new issuance of K373.8 million. Domestic banks are seeking a larger redemption amount to fund the liquidity required to meet some of the excess demand for foreign currency and the PMMR transfers, and the BPNG is seeking redemptions to meet its no lending to Government statutory obligations. K543.9 million in inscribed stock will mature on 16th November 2018, and K419.9 million in Treasury Bills will mature on 28th December 2018 and the redemption amounts are expected to be significant. Consequently an additional K160.0 million is recommended to be drawn from the external trust account to fund these anticipated debt redemptions, taking the net redemption amount to K603.4 million for 2018. If an equivalent injection of foreign currency can be made into the system by the BPNG, then system liquidity should be unaffected. With the fiscal deficit being maintained under the budgeted amount of K1,897.2 million and with the Bond Trust account balance being offset against total debt outstanding, the statutory debt level will increase by the fiscal deficit amount, taking the statutory debt level to K25,455.5 million, or 30.9 per cent of GDP which maintains the declining trend as targeted under the Fiscal Responsibility Act (FRA) 2006. 3.3 THE 2019 BUDGET STRATEGY
The 2019 Budget will build on the exceptional achievements in 2018. In this respect, it will continue to be guided by the Vision 2050, PNG Development Strategic Plan (DSP) (2010-2030), the Medium Term Development Plan (MTDP) III, the National Strategy for Responsible Sustainable Development (StaRS 2017), and the Fiscal Responsibility Act 2006 (FRA) as amended in 2017. The 2019 Budget marks the second year of the Medium Term Fiscal Strategy (MTFS) 2018-22 which incorporates the more detailed Medium Term Debt Strategy (MTdS) 2018-22 and Medium Term Revenue Strategy (MTRS) 2018-22. The 2019 Budget is framed against a still supportive world economic environment, although risks to international economic growth are rising reflected in rising US interest rates, trade tensions and greater commodity price volatility. Domestic economic conditions are still recovering from past difficulties, including the foreign currency imbalance, constraints on domestic public expenditure and the accumulation of significant payment arrears. However, the outlook has improved as the Government makes significant inroads into its domestic fiscal and financing challenges, as a number of large resource projects move forward, and in light of the optimism that has been created from the anticipated successful APEC Summit. In the 2019 Budget, the Government will continue to place emphasis on lifting revenue collections through a further substantial increase in compliance efforts, coupled with new revenue measures. The 2019 Budget will mark the second year of implementing the MTRS 2018-22 and the revenue targets remain on track as the tax base is broadened with implementation of a number of specific tax reforms articulated in the 2019 revenue plan. As a result of the PMMR Act, more public funds public entity trust accounts will be swept into the Consolidated Revenue Fund (CRF) in the 2019 Budget. These are revenues transferred from unused balances in the trust accounts of the Government departments and statutory authorities under the 90/10 pass-through of collections from agencies to the CRF. Once these trust balances have been removed, then revenue collections will be captured more fully under

2019 National Budget, Volume 1
50
agency fees and charges categories, and expenditure approved/allocated more efficiently to these agencies and in line with the Government priorities. Consequently, this non-tax revenue reform will improve the performance and accountability of all revenue generating agencies. Total Revenue and Grants for the 2019 Budget is projected at K14,266.8 million. This is an increase of K1,536.1 million or 12.1 per cent compared to the 2018 Budget and K866.5 million or 6.5 per cent on the estimated 2018 outturn. Additional revenues in the 2019 Budget will be used to fund the Government’s priority infrastructure and social program, but importantly a proportion will go to reduce arrears, complete on-going projects and fund expenditure saving initiatives and revenue raising reforms so that the increases are not locked in and detract from fiscal space in the medium term. In terms of the MTFS target of maintaining Total Revenue (excluding grants) to above 14.0 per cent, this is programmed in the 2019 Budget to reach 15.0 per cent which is well above the target. The revenue projections over the medium-term show that the revenues will remain above this 14.0 per cent target out to 2023. Table 4: 2019 Budget and Medium Term Revenue Projections (Kina, Million)
2018 Revised
2019 Budget
2020 2021 2022 2023
Revenue and Grants 13,400.3 14,266.8 14,630.8 15,236.1 16,846.6 18,516.4
% of GDP 16.3% 16.1% 15.3% 14.8% 14.8% 14.8%
Taxes 9,956.5 10,784.5 11,467.5 12,091.8 13,647.9 15,316.6
% of GDP 12.1% 12.2% 12.0% 11.7% 12.0% 12.2%
Taxes on income, profits and capital gains
5,691.9 6,247.1 6,600.5 7,153.1 8,105.4 9,094.9
Taxes on payroll and workforce
10.0 0.0 0.0 0.0 0.0 0.0
Taxes on goods and services 3,542.3 3,773.9 4,065.5 4,097.7 4,663.9 5,301.7
Taxes on international trade and transactions
712.3 763.4 801.6 841.0 878.7 920.0
Other revenue 2,419.2 2,539.2 2,231.2 2,212.3 2,266.6 2,267.8
% of GDP 2.9% 2.9% 2.3% 2.1% 2.0% 1.8%
Donor Grants 1,024.6 943.1 932.1 932.1 932.1 932.1
% of GDP 1.2% 1.1% 1.0% 0.9% 0.8% 0.7% Source: Department of Treasury
In terms of expenditure policy, there is a clear recognition by the Government that a number of operational spending categories need to be brought under stricter controls but that, because of the contractual/statutory nature of many of these expenditures, it will take time to achieve the required adjustment without forcing major adverse social consequences on the civil service and the private sector. The Government further understands that, given the current subdued domestic economic conditions, there needs to be a concurrent lift in public investment, particularly in the outside provinces, that will stimulate economic activity, while at the same time funding the Government’s priority programs in the health, law and order and education sectors. The Government's investment in APEC is part of this strategy to get some momentum behind the economic growth trajectory. External financing of the Budget strategy will also be critical, given recognition of the limits on the domestic financial system and the ongoing impact of the foreign exchange imbalance. Given this strategy, the 2019 Budget Expenditure envelope is set at K16,133.5 million, an increase of K1,415.7 million or 9.6 per cent from the 2018 Budget estimate and K836.0 million or 5.5 per cent from the estimated 2018 outturns. In terms of key expenditure items, the Government will focus on adequately funding its key programs covering Tuition Fee Free (TFF) Education Subsidy, Free Primary Health Care, Infrastructure Projects, Agriculture and Small to Medium Enterprises (SME).

2019 National Budget, Volume 1
51
Given the intractable nature of the public payroll expenditures, the 2019 Budget will undertake the necessary detailed audit to comprehend the problems, then will implement the required policies and strict controls to contain personal emolument expenditure within budget ceilings. With the capital budget expected to be implemented in full in 2019, further reforms will be introduced to ensure capital expenditure is well targeted and accountable. To improve expenditure productivity, the 2019 Budget will again by necessity focus initially on areas that have exceeded expenditure appropriations in the past. This is to ensure that budget funding for the important capital budget is not deviated to support uncontrolled operational funding that may have uncertain or dubious productivity benefits. In this respect, the Government has elevated its determination to contain PE expenditure to within the 3.3 per cent growth rate appropriated in 2019. Further, the successful financing strategy in 2018 will continue in 2019, but now also be directed at containing interest costs. The Nambawan Super exit payment arrears were addressed in 2018 and the 2019 Budget will now make an adequate provision for the ongoing monthly exit payment obligations. The increase in one-off revenue measures in the 2019 Budget will be used to significantly reduce the outstanding arrears, allowing the 2019 Budget to be executed without dealing with a substantial prior year fiscal overhang. In this respect, the Government has approved a firm close-of-accounts policy for end 2018. Importantly, in the 2019 Budget, the O’Neill-Abel Government has re-orientated the composition of expenditures substantially by reprioritising and reallocating spending from lower priority expenditures to higher priority expenditures that will enhance overall economic growth, at the same time achieve the overall strategic development goals of the Government. Total Capital Budget for 2019 is K5,497.1 million. Table 5 shows the breakup of the Capital Expenditure components. Table 5: 2019 Capital Expenditure Budget (Kina, Million)
Capital Expenditure
GoPNG PIP 2,563.0
Service Improvement Programs 1,174.0
Loans Drawdowns 817.0
Project Support Grants 943.1
Total 5,497.1 Source: Department of Treasury
Capital Budget allocation by sector is shown in Table 6 below. The Administration sector is allocated the highest, 38.5 per cent of the capital budget, driven mainly by the reallocation of Service Improvement Program (DSIP and PSIP) of K1,080.0 million10, followed by the Transport Sector, 18.1 per cent, Utilities sector, 10.6 per cent, and the Economic Sector, 9.8 per cent. Table 6: 2019 Capital Budget Expenditure by Sectors (Kina, million)
Sector 2019 Capital
Budget As % of Total Capital
Budget
Provinces 101.3 1.8%
Administration 2,117.0 38.5%
Transport 995.6 18.1%
Economic 539.4 9.8%
Health 455.6 8.3%
10 Previously allocated under the Provinces Sector. WSIP and DSG are still captured in the Provinces Sector.
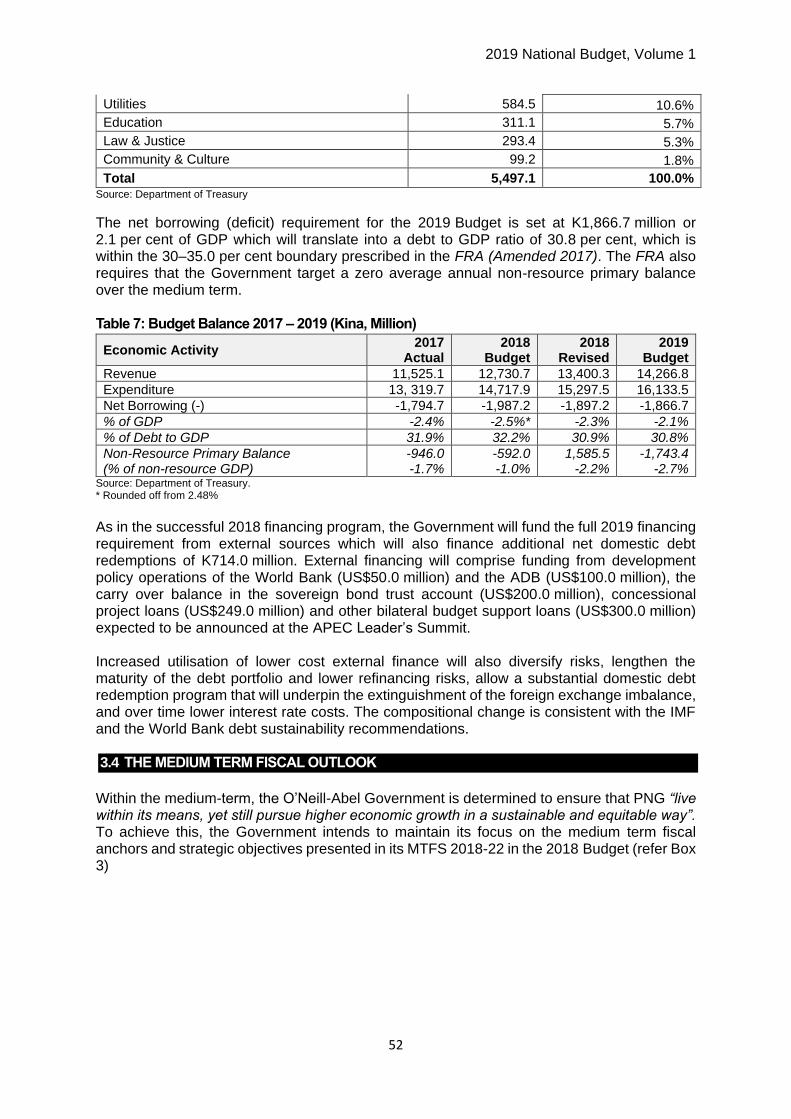
2019 National Budget, Volume 1
52
Utilities 584.5 10.6%
Education 311.1 5.7%
Law & Justice 293.4 5.3%
Community & Culture 99.2 1.8%
Total 5,497.1 100.0% Source: Department of Treasury
The net borrowing (deficit) requirement for the 2019 Budget is set at K1,866.7 million or 2.1 per cent of GDP which will translate into a debt to GDP ratio of 30.8 per cent, which is within the 30–35.0 per cent boundary prescribed in the FRA (Amended 2017). The FRA also requires that the Government target a zero average annual non-resource primary balance over the medium term. Table 7: Budget Balance 2017 – 2019 (Kina, Million)
Economic Activity 2017
Actual 2018
Budget 2018
Revised 2019
Budget
Revenue 11,525.1 12,730.7 13,400.3 14,266.8
Expenditure 13, 319.7 14,717.9 15,297.5 16,133.5
Net Borrowing (-) -1,794.7 -1,987.2 -1,897.2 -1,866.7
% of GDP -2.4% -2.5%* -2.3% -2.1%
% of Debt to GDP 31.9% 32.2% 30.9% 30.8%
Non-Resource Primary Balance (% of non-resource GDP)
-946.0 -1.7%
-592.0 -1.0%
1,585.5 -2.2%
-1,743.4 -2.7%
Source: Department of Treasury. * Rounded off from 2.48%
As in the successful 2018 financing program, the Government will fund the full 2019 financing requirement from external sources which will also finance additional net domestic debt redemptions of K714.0 million. External financing will comprise funding from development policy operations of the World Bank (US$50.0 million) and the ADB (US$100.0 million), the carry over balance in the sovereign bond trust account (US$200.0 million), concessional project loans (US$249.0 million) and other bilateral budget support loans (US$300.0 million) expected to be announced at the APEC Leader’s Summit. Increased utilisation of lower cost external finance will also diversify risks, lengthen the maturity of the debt portfolio and lower refinancing risks, allow a substantial domestic debt redemption program that will underpin the extinguishment of the foreign exchange imbalance, and over time lower interest rate costs. The compositional change is consistent with the IMF and the World Bank debt sustainability recommendations. 3.4 THE MEDIUM TERM FISCAL OUTLOOK
Within the medium-term, the O’Neill-Abel Government is determined to ensure that PNG “live within its means, yet still pursue higher economic growth in a sustainable and equitable way”. To achieve this, the Government intends to maintain its focus on the medium term fiscal anchors and strategic objectives presented in its MTFS 2018-22 in the 2018 Budget (refer Box 3)

2019 National Budget, Volume 1
53
Box 3: Medium Term Fiscal Strategy- Fiscal Anchors and Strategic Objectives
MTFS 2018-22 - FISCAL ANCHORS STRATEGIC OBJECTIVES
Revenue Grow the revenue (excluding grants) base to 14.0 per cent of GDP - Revenue as a percentage of GDP has declined from 20 per cent in 2012-14 to below 13.0 per cent in 2017 which is low by international standards and comparable countries to PNG but the downward trend needs to be stabilised first and then sustained onto a higher trajectory. Broaden the revenue base of the economy by investing in the more inclusive elements of the economy such as agriculture, manufacturing, tourism, small to medium enterprises and law & order where the bulk of the population in engaged. The implementation of the SWF deposit rule – requiring that 50.0 per cent of all mining and petroleum taxes are deposited in the SWF. These rules will ensure a reduction in the impact of resource volatility on the Budget over time.
Medium Term Revenue Strategy 2018-22 Halt the declining revenue to GDP trend and increase revenues (excluding grants) in terms of GDP to reach 14 per cent by 2022. Implement clear policies that support national development goals and encourage investment Broad based taxes that ensure everyone makes a fair contribution to the nation. Clear laws that define the rights and obligations of taxpayers and administrators. Fair and efficient administration that provides high quality services to taxpayers.
Expenditure Allocation to Key Enablers targeted to 2/3 of (primary) expenditure – i.e. excluding debt service. This rule will help ensure that the country’s resources are used to address some of the critical development challenges. Personnel costs should be reduced to less than 40.0 per cent of total non-resource non-grant revenue and should not increase by more than 5.0 per cent yearly (arrears repayment excluded). Expenditure as per the SWF rule - which stipulates that withdrawals during each fiscal year from the Stabilization Fund shall be made through the National Budget, and shall not exceed the five year long-term moving average of mineral and petroleum receipts as a share of non-mineral and non-petroleum receipts. Capital expenditures should increase and be maintained between 5.0and 6.0 per cent of GDP over the 2018-22 period.
Medium Term Expenditure Strategy 2018-22 Reduce total expenditure to GDP ratio from 18 per cent in 2018 to 16.0 per cent by 2022 to reduce the budget deficit and debt to 30.0 per cent of GDP. Reallocate the expenditure mix from compensation of employees and goods and services towards a higher level of capital expenditures and support for priority enablers and manage the Budget to prevent the accumulation of arrears and fiscal overhangs. Clear policies that support national development goals and encourage investment. Ensure human development through policies conducive to infrastructure building, prosperity, business and job creation as well as commitment to universal quality health care and education Efficient and effective delivery of goods and services to all citizens as well as creating opportunities within a sustainable fiscal framework
Deficit and Debt Target a zero average annual non-resource primary balance over the medium term (to 2025). Over the period and under the different scenarios, significant resources are not expected to flow into the SWF; however, with this rule, Government will ensure that its expenditure pattern is delinked from the resource sector which reduces the expenditure volatility. To give the Government flexibility through protracted economic cycles, the Fiscal Responsibility Act was amended from having the single line 30.0 per cent debt to GDP ceiling to a range of 30-35.0 per cent of GDP for 2018 and beyond. As an offset, however, the Government has also amended the FRA to compel the
Medium Term Debt Strategy 2018-22 Maintain debt at sustainable levels and within FRA targets and maintain financial risk at prudent levels. Develop and efficiently manage the domestic debt market involving the broadening and deepening of the market in domestic securities. Develop and manage the offshore commercial market, including the inaugural sovereign bond issuance. Engineer a portfolio shift from domestic debt securities to foreign currency debt with a foreign debt to total debt target of at least 35.0 per cent by 2022 while domestic debt will decline to a target of at least 65.0 per cent.

2019 National Budget, Volume 1
54
Government in its medium-term debt strategy to target the lower 30.0 per cent boundary.
Within the domestic debt target, Treasury Bills and Treasury Bonds as a share of total domestic debt will be split at 50.0 per cent each.
Source: 2018 Budget Documents, Volume I, Economic and Development Policies, Independent State of PNG
With respect to the medium term fiscal anchors and strategic objectives, the Government in 2019 intends the following:
• Maintain the revenue (excluding grants) to GDP trend in 2019 to above the programmed 14.0 per cent. While the 2019 Budget expects this ratio to be 15.0 per cent of GDP, this is appropriate as there are a number of revenue inflows that are unlikely to be sustained in full past 2019. The Government, in its MTRS continues to broaden its revenue base and a number of tax policies and changes will be implemented over the period of the plan to achieve the targeted outcomes. The Large Taxpayers Office (LTO) has been established and Tax Administration Act is being implemented. The allocations to the SWF are only notionally occurring at this stage and will be undertaken formally once the SWF is fully operational; and
• The expenditure to GDP ratio is expected to increase to 18.1 per cent in 2019 which is lower than the estimated ratio of 18.6 per cent for 2018.The higher expenditure ratio reflects the increased spending on a number of the rigid expenditure categories, such as PE and Interest Costs where the programmed reforms have been slow to materialise because of structural/contractual rigidities. The higher ratio has been able to be accommodated by the higher than programmed revenues. However, if revenues fall back to trend rates, expenditure trends will need to be lowered. Nevertheless, the PE budget remains a concern and there are measures announced in the 2019 Budget that will need to be implemented. The 2019 amended fiscal program shows the expenditure trend tracking back to the 16.0 per cent target by 2020 and below 16.0 per cent in 2023. The financial management reform program continues to make solid progress in these terms. Furthermore, the 2019 Budget will facilitate a shift in the composition of expenditure more towards development/capital spending and especially in the outside provinces.
The financing program was able to achieve most of its 2018 objectives. Debt levels remained well within the FRA debt to GDP prescribed band and the overall debt ratio appears to be on a clear downward path toward the 30.0 per cent target. A portfolio shift from domestic debt to external debt was achieved, although quite late in the fiscal year. Interest costs were generally contained. The sovereign bond market was opened to PNG. A substantial debt retirement program was initiated and there were commensurate inroads into the foreign exchange imbalance. Financial risk was well managed. However, the development of the domestic debt market wherein the portfolio was meant to be restructured to an even Treasury Bills – Treasury Bonds split to lengthen duration and lessen rollover risk. The development of the domestic bond market had to be delayed because of the burgeoning foreign exchange imbalance and the demand for redemptions of Government securities, together with subdued domestic demand growth. From 2019, it is anticipated that these issues will be addressed and that the Government security market reform program can be reignited. Importantly, the 2019 Budget envelope will support Government’s efforts to clear arrears, finance reform programs as well as lift capital spending from the lower levels of 2017-18 and then to maintain capital spending at higher levels over the medium term. This will mean undertaking the difficult task of reprioritising and reallocating limited public spending to higher

2019 National Budget, Volume 1
55
value priorities that will enhance overall economic growth and still achieve the development goals of the Government. Table 6 shows net borrowing of 2.1 per cent of GDP in 2019 and then a gradual reduction over the medium-term to 0.8 per cent of GDP. This drives a reduction in the debt to GDP ratio to 30.0 per cent by 2020 and to below 30.0 per cent between 2021 and 2023 in compliance with the FRA target and clears a path towards achieving a zero average annual non-resource primary balance over the medium term. Table 8: Budget Balance 2018–2023 (% of GDP)
2018
Revised 2019
Budget 2020 2021 2022 2023
Revenue and Grants 13,400.3 14,266.8 14,630.8 15,236.1 16,846.6 18,516.4
Expenditure and Net Lending
15,297.5 16,133.5 16,190.0 16,625.7 17,986.8 19,516.9
Net Lending (+) / Net Borrowing (-)
-1,897.2 -1,866.7 -1,559.2 -1389.6 -1,140.2 -1,000.5
Net Lending (+)/ Net Borrowing as % of GDP
-2.3% -2.1% -1.6% -1.3% -1.0% -0.8%
Non-Resource Primary Balance
-1,585.5 -1,743.4 -671.8 -433.6 -105.8 94.8
Non-Resource Primary Balance as % of non-resource GDP
-2.2% -2.7% -1.0% -0.6% -0.1% 0.1%
Implied Debt to GDP (%) 30.9% 30.8% 30.3% 29.4% 27.5% 25.9%
Source: Department of Treasury. Note: Net Borrowing/Net Lending under GFS 2014 differs from the deficit/surplus reported under GFS 1986. See Appendix 3 for an outline of these changes and a detailed set of fiscal tables.
The decline in the net borrowing requirement over the medium term will be achieved through implementation of the revenue policies outlined in detail in the MTRS and in Chapter 5 of this Volume and through the Government ensuring the proportionate reduction in the rigid recurrent expenditure categories such as compensation of employees, debt interest and arrears and the effective targeting of productive public investments. This implies the implementation of a number of measures aiming at modernising the public financial management system, reinforcing the performance monitoring and evaluation function, and ensuring efficiency in the use of public funds. Over the medium-term, the challenge is to achieve this consolidation while, at the same time, reversing the proportionate decline in capital expenditures and fully funding the Government’s decentralisation objectives embodied in the provincial and district services improvement programs. This approach will be guided by the MTFS and the MTDP III.

2019 National Budget, Volume 1
56
Chart 29:Net Borrowing (-) / Net Lending (+) as a percentage of GDP over the Medium Term
Source: Department of Treasury
The total debt to GDP ratio will also improve from an estimated 30.9 per cent in 2018 to below 30.0 per cent by 2022/23 in compliance with the amended FRA. The non-resource primary balance will be on a declining path such that the average annual balance should reach zero over the medium-term (ending in 2022) which will ensure that if resource revenues pick up over the medium-term, increased funds will accumulate in the Sovereign Wealth Fund (SWF). Chart 30:Medium Term Fiscal Outlook
Source: Department of Treasury
3.5 MEDIUM TERM FISCAL STRATEGY 2018-2022
The following tables are detailed summaries of the medium-term revenue, expenditure and debt strategies, which are part of the overall MTFS.
-2.4%-2.3% -2.1%
-1.6%-1.3%
-1.0%-0.8%
20172018
Revised 2019 2020 2021 2022 2023
-5.0%
-4.5%
-4.0%
-3.5%
-3.0%
-2.5%
-2.0%
-1.5%
-1.0%
-0.5%
0.0%
-2000
-1800
-1600
-1400
-1200
-1000
-800
-600
-400
-200
0
% o
f G
DP
Kin
a, m
illio
ns
Net Lending (+)/ Net borrowing (-) Net lending (+)/ Net Borrowing (-) as % of GDP
30.9% 30.8% 30.3%29.4%
27.5%
25.9%
-10.0%
-5.0%
0.0%
5.0%
10.0%
15.0%
20.0%
25.0%
30.0%
35.0%
-4,000.0
-2,000.0
-
2,000.0
4,000.0
6,000.0
8,000.0
10,000.0
12,000.0
14,000.0
16,000.0
18,000.0
2018 Revised 2019 2020 2021 2022 2023
Per
cen
tage
of
GD
P
Kin
a, m
illio
ns
Total Revenue and Grants Total Expenditure and Net Lending
Deficit (-)/ Surplus (+) Debt as % of GDP

2019 National Budget, Volume 1
57
Table 9: Key Reforms included in the Medium-Term Revenue Strategy 2018-2022
PNG’s Medium-Term Revenue Strategy 2018-2022
Strategic Objectives
• Halt the declining revenue to GDP trend and increase revenues (excluding grants) in terms of GDP to reach 14.0 per cent by 2022;
• Clear policies that support national development goals and encourage investment;
• Broad based taxes that ensure everyone makes a fair contribution to the nation;
• Clear laws that define the rights and obligations of taxpayers and administrators; and
• Fair and efficient administration that provides high quality services to taxpayers.
Policy Reform Legal Reform Administration Reform IRC and Customs
1. Personal Income Tax
• Rebalance the tax composition from income to
consumption by relieving the tax burden on labor
income.
2. Goods and Services Tax
• Broaden the GST tax base by limiting the
extensive use of zero rating; and
• Review an increase in the GST rate depending on
the revenue needs and implementation of
alternative taxes.
3. Excise
• Review rates for alcohol, tobacco and gaming;
• Review excisable products; and
• Review introduction of excise on Cellular airtime.
4. Export Duty
• Examine unprocessed products e.g. fish, saw logs,
oil palm.
5. Import Duties
• Suspend the last phase of Tariff Reduction
Program (TRP) to allow a review into the TRP; and
• Increase tariff rates to assist adjustment in the
manufacturing sector.
6. Tax Exemptions and Incentives
Update and consolidate existing
Acts
• Simplify legislation and separate taxing measures from administration measures;
• Locate all administration laws/regulations within a tax Administration Procedures Act;
• Customs legislation modernisation; and
• Simplify Income Tax Act and other legislation.
International agreements/treaties
• Review to ensure economic value; and
• Ensure technological capability to comply exists before committing to new arrangements.
Asset Registers
• Establish definitive registers with respect to real property, shares, and Government entitlements such as licenses.
Bank Secrecy
1. IRC will achieve high levels of voluntary compliance
• IRC’s core delivery functions are effective and efficient to administer taxes and collect revenue;
• Modernise IRC’s policy and legislation to reflect IRC’s risk based strategy and business processes; and
• Improve Compliance and Broaden Tax Base. 2. IRC’s organisation structure is aligned to its strategy
• A Large Taxpayer Office is established and fully functional as a Division;
• Case Selection and Intelligence Division is fully functional;
• A strong headquarters function is developed and implemented;
• Regional and provincial Tax Centres are established across the country to decentralise tax administration services;
• A Taxpayer Services capability is established and fully functional; and
• A Compliance Audit capability is established and fully functional as a Division.
3. IRC's processes, systems and structure are aligned
to effectively manage compliance risk
• IRC’s operating system meets its current and future needs;
• Self-assessment is fully operational; and
• IRC has streamlined collection systems and procedures. 4. IRC is adequately resourced and effectively leads,
manages and governs those resources

2019 National Budget, Volume 1
58
• Review existing incentives and exemptions and
prepare tax expenditure Budgets; and
• Adjust arrangements based on economic value.
7. Corporate Income Tax
• Reduce corporate income tax offset by scaled
back tax incentives and accelerated depreciation
provisions for resource sectors;
• Simplify administration of corporate income tax;
and
• Review the superannuation taxation regime.
8. Resource Contracts Fiscal Stabilisation Act;
• Limit the scope of taxes for stabilisation to major
tax heads.
9. Small business regime
• Design a simplified system for tax calculation and
payment.
10. Fill the tax gaps and Expand the tax base
• Review the introduction of a bank levy;
• Introduce CGT on real property including mining
and petroleum licenses;
• Develop a broad policy and procedures for fees
and charges and review non-tax fees and charges;
and
• Review resource revenue regime.
11. Non-Tax Revenue
• Transfer 90.0 per cent of all public moneys to
Consolidated Revenue Fund and 10.0 per cent to
support operations of collecting agencies subject
to legislative design
• Continue the review all Public Bodies Trust
Accounts consistent with the revised Public
Finance Management Act
• Review all public funds utilized by SOEs
• Ensure ready access to bank information by tax administration.
• IRC has in place a robust management and governance process;
• IRC’s Budget, Assets and Facilities are efficiently, effectively and accountably managed and administered;
• A Taxpayer Charter is developed; and
• Effective relationships are established with IRC’s key stakeholders.
5. IRC's management and staff have the needed
knowledge, skills, attitude and integrity
• Develop management and leadership training for managers and supervisors at all levels;
• Provide specialist training in areas as needed e.g. LTO, Audit;
• Managers and staff meet the standards of integrity and behavior expected of an employee of the IRC; and
• IRC’s Productivity is enhanced through Internal Audit and Anti-Corruption Activities.
6. Strengthening Customs Clearance Processes
• Customs Declarations: Manifest control and verification
of customs valuation;
• Post clearance Audit (PCA);
7. Strengthening Cross boarder Mechanisms to address
illicit trade;
8. Strengthening supporting mechanisms such as the
ASYCUDA, increased resources and capacity in the
Audit and cargo clearance section and extend Container
Examination facility to other port such as the Lae Port;
and
9. Strengthen governance, accountability, transparency and
use of public funds through Finance and Treasury.

2019 National Budget, Volume 1
59
• Review all existing non-tax fees and charges
Political Support External Resources
• Provide strong reform governance and management;
• Ensure Government-led effort including all agencies; and
• Consult widely to generate community support.
• Identify capacity needs for reform development and implementation;
• Identify available external support from donor partners to provide extra capacity; and
• Formalise agreement with donors on MTRS support.

2019 National Budget, Volume 1
60
Table 10:Key Measures included in the Medium Term Expenditure Strategy
11 Compensation of Employees in GFS 2014 reporting framework.
Medium-Term Expenditure Strategy 2018-2022
Strategic Objectives
• Reduce total expenditure to GDP ratio from 18.0 per cent in 2018 to 16.0 per cent by 2022 to reduce the Budget deficit and debt to 30.0 per cent of GDP;
• Reallocate the expenditure mix from compensation of employees and goods and services towards a higher level of capital expenditures and support for priority enablers and manage the Budget to prevent the accumulation of arrears and fiscal overhangs;
• Clear policies that support national development goals and encourage investment
• Ensure human development through policies conducive to infrastructure building, prosperity, business and job creation as well as commitment to universal quality health care and education; and
• Efficient and effective delivery of goods and services to all citizens as well as creating opportunities within a sustainable fiscal framework.
Compensation of Employees (PE) Goods and Services Capital Investment
Short and Immediate measures:
• Implementation of the NEC Decision 71/2017 to bring PE11 under control.
Integration of systems
• Ensure that all civil servants are registered and paid through ALESCO.
• Phase out any parallel systems Preparation of realistic Budget
Votes
• Setting realistic PE votes to reduce Budget “blow -out”; and
• Use hard ceiling to ensure discipline among agencies.
Enforcing Budgetary Control
• Put an end to ex-post warranting; and
• All departments unattached existing staff, recruit new staff, overtime allowances etc. will not exceed the given ceiling.
Linking PE to affordability
• NEC with the advice of the Treasury will decide on yearly PE increase; and
• PE cost will not exceed 40.0 per cent of Non-resource non-grant revenue to ensure long term sustainability.
Procurement reforms
• Review and present the national procurement bill to Parliament and ensure its quick implementation.
Asset policy
• Implementation of policy in line GFS (2014); and
• The system recording all assets will be managed through IFMS.
Centralised utilities payment
• Payment of utilities will be centralised and channelled through DOF and DOT to avoid arrears and reduce leakages.
Vetting of Capital Project
• The vetting process for capital project will be strengthened – with more stringent requirement in terms of financial and economic returns; and
• Set up an interdepartmental committee, chaired by Planning, including the Department of Treasury and other relevant departments and agencies to appraise and oversee the technical and financial accountability of significant new projects.
Prioritization of Ongoing Projects
• Given the limited fiscal space in the medium term, DNPM will evaluate the existing portfolio of ongoing projects and priorities them over the medium term.
Donors Funded Projects
• Drawdowns on a number of concessional loans to implement high return projects, in line with the Debt Management Strategy.
Monitoring and evaluation
• Ensuring that all capital projects including SIPs are adequately monitored.
Political Support Cross cutting reforms
• Provide strong reform governance and management;
• Ensure Government-led effort including all agencies;
• Consult widely to generate community support; and
• Implementation of different existing acts.
• Roll out of IFMS and implementation of GFS (2014) report standards;
• Identify available external support from donor partners to provide extra capacity – procurement reforms, payroll; and
• Monitor and manage Arrears.

2019 National Budget, Volume 1
61
Table 11:Key Measures included in the Medium Term Debt Strategy
Medium-Term Debt Strategy 2018-2022
Strategic Objectives
• Raise the required amount of Budget financing and manage the debt portfolio to achieve prudent risk and cost minimisation objectives, and develop and maintain an efficient market for Government securities and diversification of funding sources;
• Maintaining debt at sustainable levels. The FRA target band of debt to GDP of 30-35.0 per cent and the 30.0 per cent target by 2022 will constrain debt to sustainable levels;
• Engineer a portfolio shift from domestic debt securities to foreign currency debt with a foreign debt to total debt target of at least 35.0 per cent by 2022;
• Within the domestic debt target, Treasury Bills and Treasury Bonds as a share of total domestic debt will be split at 50.0 per cent each to give an improved alignment with current investor preferences and market demand; and
• Expanding the existing highly concentrated investor base and promoting a more liquid and efficient secondary market.
Maintaining debt at sustainable levels and managing risk
Developing the domestic debt market
Sound fiscal policy:
• Implementation of the MTFS and ensuring fiscal consolidation over the medium term; and
• Close coordination between monetary and fiscal institutions to manage debt
Managing debt
• The issuance of World Bank/ADB highly concessionary external Budget support debt and through the issuance of a USD bond program, together with the normal net inflows of donor project loans;
• Formalising the dedicated debt account use to repay debt service;
• smoothing out the maturity and repayment profile of the domestic debt service schedule, within the projected financing envelopes, through debt switches and buybacks and establishing a reduced number of more liquid benchmark issues; and
• To facilitate this measure, the Loans Securities Act 1960 and the T-Bills Act 1974 will need to be amended to clearly state the authority for Treasury to actively manage Government debt.
Managing risks:
• lengthening the duration of the domestic portfolio to reduce refinancing risk through the development of the domestic bond market and target compositional changes between shorter term treasury bills and longer term treasury bonds; and
• documenting and monitoring debts of state-owned enterprises and contingent liabilities and providing advice on management and exposure levels.
Addressing a number of preconditions for the development of the domestic bond market including:
• improving the efficiency of the primary market (the current manual and cumbersome processes will need to be changed to attract non-resident investors and encourage secondary trading);
• promoting money market and interbank transactions through repurchase agreements; developing automated clearing, settlement and custody facilities; establishing a bond market code of conduct with effective oversight by BPNG; promoting the establishment of pools of liquidity to allow small investors access to the market;
• improved coordination between monetary, fiscal and regulatory authorities and market participants; and
• developing and maintaining a centralised source for bond market information and data.
Broaden investment base:
• rectifying the current foreign exchange imbalance and restrictions on access to foreign currency at redemption or repurchase; and
• implementing access and disposal arrangements through improved market infrastructure for automated clearing, settlement and depository functions, and facilitating secondary market liquidity.

2019 National Budget, Volume 1
62
Source: Department of Treasury
Political Support Cross cutting reforms
• Provide strong reform governance and management as well as fiscal discipline and fiscal and monitoring coordination;
• Ensure Government-led effort including all agencies; and
• Implementation of different existing acts.
• Identify available external support from donor partners to provide extra capacity – developing the domestic market.

2019 National Budget, Volume 1
63
CHAPTER 4: REVENUE 4.1 2018 AND 2019 REVENUE DEVELOPMENTS AND OUTLOOK
In the 2018 MYEFO, Total Revenue and Grants projections for 2018 were revised up by K213.1 million, compared to the 2018 Budget estimates with the improvements reflecting higher than expected Mining and Petroleum Taxes (MPT) driven by the increase in international commodity prices, and higher Goods and Services Tax (GST) reflecting enhanced IRC compliance activities and reduced GST refunds due to GST offsets against other tax heads. Importantly, underlying tax and non-tax collection trends continued to improve in line with the new Medium Term Revenue Strategy (MTRS) operationalised in the 2018 Budget. Following the September 2018 outturn report, it is now estimated that an additional (above budget) K669.6 million in revenue is likely to be collected by end 2018 with this increase is predominately due to a lift in MPT to K725.0 million against the original budget projection of K179.1 million. Dividend payments from Kumul Petroleum Holding Limited (KPHL) are also expected to increase by K400.0 million to K700.0 million against the K300.0 million projected in the 2018 Budget. Personal income tax collections appear to be lower than the 2018 Budget due to subdued domestic economic conditions, although very recent data suggests that the budget target may be reached by end 2018. In contrast, corporate tax and GST receipts are running marginally above budget. Export tax is expected to be significantly higher than budget reflecting the changed tax arrangements and higher export prices. The IRC and Custom’s reform measures and tax changes, and the non-tax measures as presented in the 2018 Budget have generally tracked the programmed targets outlined in the MTRS 2018-22. This improved performance is in marked contrast to the revenue performance in recent prior years. Progress on these measures, together with the improved tax collections in 2018 provide a solid base on which the 2019 Budget projections have been compiled. In this respect, the Government remains firmly committed to progressing its MTRS in its second year of implementation. Total Revenue and Grants in 2019 is projected to increase to K14,266.8 million, a 6.5 per cent increase on the estimated outturns for 2018. This comprises K10,784.5 million in Tax Revenue, K2,539.2 million in Other Revenue (mainly dividends and fees & charges.) and K943.1 million in Donor Grants. Of the Other Revenue, efforts through the Public Money Management Regularisation (PMMR) Act are expected to generate K750.6 million as Transfers from Statutory bodies. Revenues in 2019 will be supported by the anticipated improvement in the domestic growth outlook, maintenance of reasonably high commodity prices particularly for oil and gas and continued efforts to improve revenue collections through the MTRS. Table 12: Total Revenue and Grants (Kina, Million)
2017
Actuals 2018
Budget 2018
Revised 2019
Budget Variation
Tax Revenue 9,141.4 9,639.4 9,956.5 10,784.5 1,145.1 Per cent of GDP 12.1% 11.7% 12.1% 12.2% 0.0%
Grant 1,439.9 1,024.6 1,024.6 943.1 -81.5 Per cent of GDP 1.9% 1.2% 1.2% 1.1% 0.0%

2019 National Budget, Volume 1
64
Other Revenue 943.8 2,066.7 2,419.2 2,539.2 472.5 Per cent of GDP 1.2% 2.5% 2.9% 2.9% 0.0%
Total Revenue & Grant 11,525.1 12,730.7 13,400.3 14,266.8 1,536.1 Per cent of GDP 15.2% 15.5% 16.3% 16.1% 0.6%
Source: Department of Treasury
4.2 TAX REVENUE
4.2.1 Taxes on Income and Profits Taxes on Income and Profits are projected at K6,247.1 million in 2019, comprising mainly of K2,949.5 million in Personal Income Taxes, K2,556.3 million in Corporate Income Tax, K428.1 million12 in Mining & Petroleum Tax, K149.2 million in Dividend Withholding Tax, K116.0 million in Interest Withholding Tax and K47.8 million in Royalties & Management Tax (see Table13). In 2018, Personal Income Tax (PIT) was tracking slightly below 2017 levels with 69.0 per cent of the budget projection collected up to end September with this poorer performance being partly due to subdued employment particularly in key PIT sectors as businesses embarked on cost cutting measures, while administratively two issues affected the performance of this tax: firstly the K200.0 million additional revenue from compliance activities did not materialise as expected in the 2018 Budget; and secondly, this tax was allowed to be offset against GST refund credits of which a total of K116.0 million (see Box 4) in PIT liabilities was used for this purpose up to end September 2018. With this trend expected to continue in the remaining months of 2018, PIT projections have been revised down to K3, 050.5 million. In 2019, the administration of credit offsets against PIT liabilities will be halted to accommodate policy measures to increase the First Tier Tax Free Thresholds from K10,000 to K12,500 and Second Tier Threshold from K18,000 to K20,000 to support low to lower-middle income earners. This will result in revenue forgone of K162.0 million, resulting in the overall PIT projection declining by K101.0 million. Table 13:Taxes on Income and Profits
2017
Actuals 2018
Budget 2018
Revised 2019
Budget Variation
Taxes on Income, Profits and Capital Gains
5,317.4 5,564.9 5,691.9 6,247.1 555.3
Personal Income Tax 3,093.8 3,250.2 3,050.5 2,949.5 -101.0
Company Tax 1,794.1 1,971.5 1,991.5 2,556.3 564.8
Mining and Petroleum Taxes* 113.6 89.5 362.5 428.1 65.6
Royalties & Management Tax 42.7 31.9 43.9 47.8 3.9
Dividend Withholding Tax 181.7 137.4 136.9 149.2 12.3
Interest Withholding Tax 91.4 84.2 106.4 116.0 9.6
Tax Related Court Fines 0.0 0.0 0.0 0.0 0.0
Sundry IRC Taxes & Income 0.0 0.2 0.2 0.2 0.0 Source: Department of Treasury *The K362.5m for 2018 and K428.1m for 2019 are 50% of total MPT estimate for 2018 and 2019 respectively. The other 50% is classified under Other Revenue as SWF receipts.
Revenue from Company Income Tax (CIT) has performed quite strongly in 2018 up to end September, with collections above the corresponding period in 2017 by K148.6 million. Against the 2018 Budget, about 69.0 per cent was collected up to end September, of which the bulk of collections are from businesses engaged in the petroleum sector. Cost cutting
12 50% of total MPT projection of K856m

2019 National Budget, Volume 1
65
measures, combined with the increase in petroleum prices, have supported revenue from this tax and cushioned the adverse effects of GST credit offsets totalling K126.0 million (see Box 4) against CIT liabilities and weak realisation of K200.0 million in expected additional compliance revenues. Due to the reasonably expected high oil and gas prices to the end of 2018, the higher MYEFO projection of K1,991.5 million should be achieved. In 2019, administrative measures to improve revenues from compliance will be accelerated with the IRC projected to collect an additional K200.0 million in CIT through the recently established Large Tax Payers Office (LTO) which will boost taxpayer services and taxpayer compliance initiatives towards the end of 2019 and over the medium-term. On the policy side, the abolishment of double deduction for the Training Levy will generate K151.0 million in 2019. The overall CIT tax base will continue to be supported by the expected higher growth rate in the economy in 2019. Mining and Petroleum Tax (MPT) receipts have performed strongly in 2018 as a result of this tax benefiting from the combined impact of the increase in global commodity prices and the Government’s policy initiatives to revamp the Additional Profit Tax (APT) introduced in the 2017 Budget. By end September 2018, a total of K548.4 million was collected against the 2018 Budget total projection of K179.1 million and therefore the overall revenue projection for this tax has been revised up to K725.0 million. In 2019, MPT collections are projected to increase to K856.2 million on the back of the recovery in production levels, stable oil and gas price projections and the continued implementation of the APT. Meanwhile, key resource companies continue to claim Infrastructure Tax Credits (ITC), as well as exemptions and accelerated depreciation allowances. The LTO will review compliance of large mineral resource companies, and the number of concessions will be reviewed as part of the MTRS reforms. Dividend Withholding Tax revenue in 2018 has been performing below 2017 levels and, by end September, 60.0 per cent of the budget projection has been collected with this weak collection possibly being attributed to reinvestment of earnings as firms took advantage of the lift in commodity prices to reinvest and it may also have been affected by the challenges in repatriating dividends given foreign exchange constraints. Consequently, the overall revenue projection for this tax has been revised down slightly to K136.9 million for 2018. In 2019, it is projected to increase to K149.2 million due to the expected lift in economic activity, as well as carry-on payments from 2018 due to the difference in financial year for most of the businesses and the relaxation in foreign exchange constraints. Interest Withholding Tax revenue has been performing strongly in 2018, with 89.0 per cent collected against the 2018 Budget projection at end September which is mainly attributed to the implementation of the tax policy to uplift exemptions from Interest Withholding Tax for foreign lenders lending to resource companies. This policy combined with the lift in economic growth will continue to support revenues from this tax in 2019. Revenues from Royalties and Management Tax have exceeded the 2018 Budget projection, and are expected to continue increase to K47.8 million in 2019.
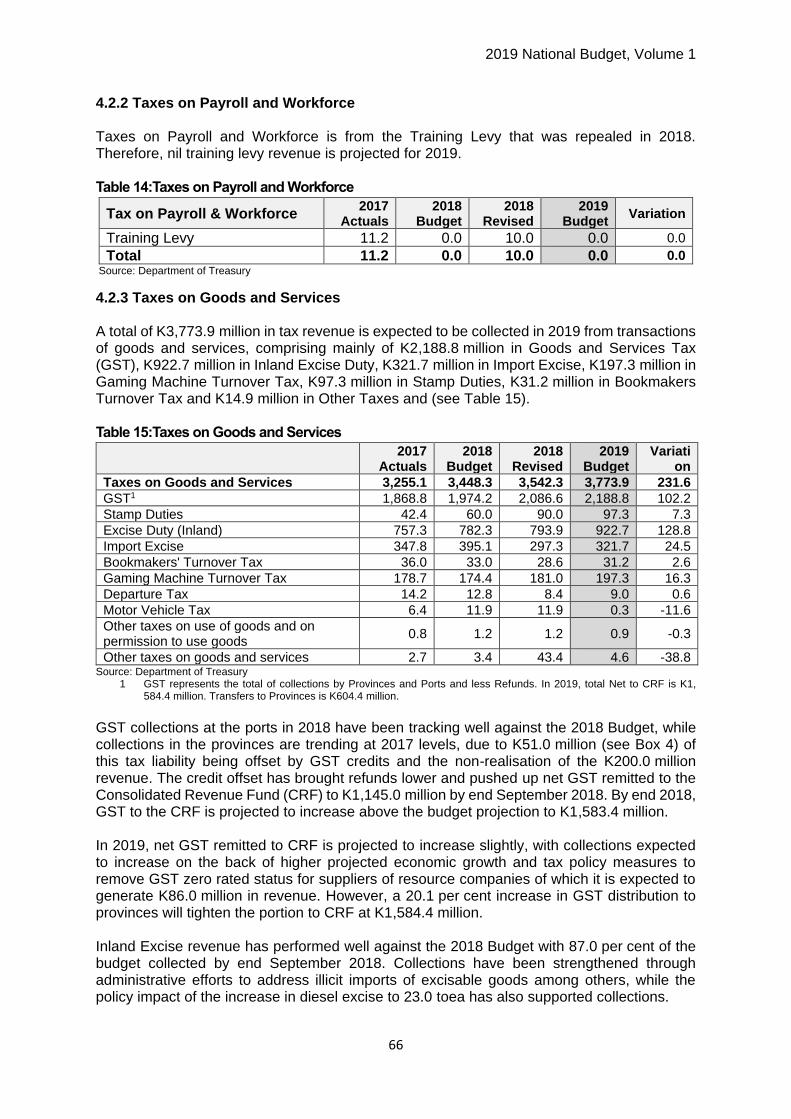
2019 National Budget, Volume 1
66
4.2.2 Taxes on Payroll and Workforce Taxes on Payroll and Workforce is from the Training Levy that was repealed in 2018. Therefore, nil training levy revenue is projected for 2019. Table 14:Taxes on Payroll and Workforce
Tax on Payroll & Workforce 2017
Actuals 2018
Budget 2018
Revised 2019
Budget Variation
Training Levy 11.2 0.0 10.0 0.0 0.0
Total 11.2 0.0 10.0 0.0 0.0 Source: Department of Treasury
4.2.3 Taxes on Goods and Services A total of K3,773.9 million in tax revenue is expected to be collected in 2019 from transactions of goods and services, comprising mainly of K2,188.8 million in Goods and Services Tax (GST), K922.7 million in Inland Excise Duty, K321.7 million in Import Excise, K197.3 million in Gaming Machine Turnover Tax, K97.3 million in Stamp Duties, K31.2 million in Bookmakers Turnover Tax and K14.9 million in Other Taxes and (see Table 15). Table 15:Taxes on Goods and Services
2017
Actuals 2018
Budget 2018
Revised 2019
Budget Variati
on
Taxes on Goods and Services 3,255.1 3,448.3 3,542.3 3,773.9 231.6
GST1 1,868.8 1,974.2 2,086.6 2,188.8 102.2
Stamp Duties 42.4 60.0 90.0 97.3 7.3
Excise Duty (Inland) 757.3 782.3 793.9 922.7 128.8
Import Excise 347.8 395.1 297.3 321.7 24.5
Bookmakers' Turnover Tax 36.0 33.0 28.6 31.2 2.6
Gaming Machine Turnover Tax 178.7 174.4 181.0 197.3 16.3
Departure Tax 14.2 12.8 8.4 9.0 0.6
Motor Vehicle Tax 6.4 11.9 11.9 0.3 -11.6
Other taxes on use of goods and on permission to use goods
0.8 1.2 1.2 0.9 -0.3
Other taxes on goods and services 2.7 3.4 43.4 4.6 -38.8 Source: Department of Treasury
1 GST represents the total of collections by Provinces and Ports and less Refunds. In 2019, total Net to CRF is K1, 584.4 million. Transfers to Provinces is K604.4 million.
GST collections at the ports in 2018 have been tracking well against the 2018 Budget, while collections in the provinces are trending at 2017 levels, due to K51.0 million (see Box 4) of this tax liability being offset by GST credits and the non-realisation of the K200.0 million revenue. The credit offset has brought refunds lower and pushed up net GST remitted to the Consolidated Revenue Fund (CRF) to K1,145.0 million by end September 2018. By end 2018, GST to the CRF is projected to increase above the budget projection to K1,583.4 million. In 2019, net GST remitted to CRF is projected to increase slightly, with collections expected to increase on the back of higher projected economic growth and tax policy measures to remove GST zero rated status for suppliers of resource companies of which it is expected to generate K86.0 million in revenue. However, a 20.1 per cent increase in GST distribution to provinces will tighten the portion to CRF at K1,584.4 million. Inland Excise revenue has performed well against the 2018 Budget with 87.0 per cent of the budget collected by end September 2018. Collections have been strengthened through administrative efforts to address illicit imports of excisable goods among others, while the policy impact of the increase in diesel excise to 23.0 toea has also supported collections.

2019 National Budget, Volume 1
67
In 2019, Inland Excise revenue is projected to increase to K922.7 million as consumption of excisable items is expected to be driven by growth in the economy and policy measures while administrative efforts will continue to improve compliance. On the policy side, the freeze on alcohol excise increases and the application of the 2.5 per cent excise reduction on tobacco and second tier changes are expected to generate an additional K70.0 million while an indirect impact is expected from the increase in consumption from low to middle income earners in light of the increase in disposable income from PIT relief. Revenues from Import Excise was trending below 2017 levels and significantly below 2018 Budget projections, with only 53.0 per cent being collected up to end-September 2018. In particular, collections were low for petroleum oil products, motor spirits (gasoline) and vehicles for transport of 10 people or more. The increase in diesel excise on imports may have led to some switching in market share of the local producer and away from imports. Based on this trend, the 2019 Budget projection of Import Excise revenue is at K321.7 million, up modestly on the lower estimated 2018 outturns and reflecting the higher expected growth in the economy. Revenue from Gaming Machine Tax has been tracking well above 2017 levels by 19.0 per cent, while against the Budget projection, 87.0 per cent has been collected up to end September. Revenue from this tax has continued to benefit from the tax policy measure to increase the Government’s share from 46.0 per cent to 55.0 per cent and in 2019, this tax policy will continue to directly support revenue from this tax, while the increase in disposable income through PIT relief will also support this tax indirectly. Other small tax revenues such as Stamp Duty have exceeded the 2018 Budget projection. The exception is Bookmakers Turnover Tax which is trending weaker against the 2018 Budget, but above the 2017 outturns by 9.0 per cent. In 2019, revenues from this tax category is projected to increase in line with the growth in the economy. 4.2.4 Taxes on International Trade and Transactions A total of K763.4 million in revenue is projected to be collected in 2019 from Taxes on International Trade and Transactions, comprising K405.4 million in Export Duty and K358.1 million in Import Duty. Revenues from Import Duties have performed above 2017 levels and against the 2018 Budget projection of which 79.0 per cent has been collected up to end September and consequently, the overall projection for 2018 has been revised to K321.7 million, an increase of K25.7 million against the 2018 Budget projection. In contrast, to higher import duties, import volumes have remained subdued for most import categories in the first half of 2018 reflecting both weak demand and the foreign exchange restrictions. The positive trend in revenues from this tax can be attributed to the implementation of the tariff policy measures in 2018 and the efforts to improve compliance by Customs through the establishment of the Container Examination Facility (CEF) and wireless transaction among others. In 2019, the lift in economic growth combined with continued implementation of the tariff policy rates and compliance efforts will continue to boost revenues from this tax. As part of compliance efforts, a second CEF will be established in Lae in late 2019 to be operational in the following year which should further boost compliance over the medium term.

2019 National Budget, Volume 1
68
Table 16:Taxes on International Trade and Transactions
2017
Actuals 2018
Budget 2018
Revised 2019
Budget Variation
Taxes on International Trade & Transactions
557.7 626.1 712.3 763.4 51.1
Import Duty 246.4 296.1 321.7 358.1 36.3
Other Import Taxes 14.0 0.0 0.0 0.0 0.0
Export Tax 297.3 330.0 390.6 405.4 14.8 Source: Department of Treasury
Revenue from Export Duty has performed well above 2017 levels by K93.2 million, while against the 2018 Budget, 87.0 per cent has been collected up to end September. For 2018, the overall projection has been revised to K390.6 million, an increase of K60.5 million on the budget projection with the strong performance of this tax revenue due to the combined effect of high log export volumes in response to the increase in log prices and the application of the progressive duty rate on log exports as part of the 2018 Budget tax measures. In 2019, three (3) key factors will support log export revenues: firstly, the anticipated continuation of the current trend in log prices; secondly, a full-year of compliance to the new duty rates by log exporters; and thirdly, policy measures to introduce an export tax on Sea Cucumbers which is expected to yield an additional revenue of K10.0 million. 4.3 OTHER REVENUE
Expected receipts from the Other Revenue category have been revised up to K2,419.2 million for 2018 against the 2018 Budget projection of K2, 066.7 million. This higher expected amount is due to an increase of K400.0 million in the dividend projection from Kumul Petroleum Holding Limited (KPHL) reflecting the higher dividend payment to KPHL from Exxon due in December 2018. The projected K525.0 million from PMMR transfers will materialise as expected. In contrast, however, revenue from fees and charges has been revised down due to actual weaker than expected collections up to the end of September 2018. In 2019, the Other Revenue category is projected to increase by 5.0 per cent to K2,539.2 million comprising mainly of K1,205.0 million in Dividends, K750.6 million in Statutory Transfers and K154.8 million in Fees and Charges. The balance of K428.1 million is from SWF receipts now under transfers not elsewhere classified13. Revenues from statutory transfers and departmental fees and charges will be driven mainly by the PMMR efforts. Table 17:Other Revenue (Kina, Million)
13 SWF presentation is indicative only
2017
Actuals 2018
Budget 2018
Revised 2019
Budget Variation
OTHER REVENUE 943.8 2,066.7 2,419.2 2,539.2 119.9
Property Income 860.9 1,321.9 1,450.6 1,260.8 -189.7
Interest 0.0 0.7 0.7 0.7 0.0
Dividends 841.6 1250.0 1,430.0 1,205.0 225.0
Mining Petroleum and Gas Dividends 562.3 500.0 900.0 1,000.0 100.0
Dividends from Statutory Authorities 279.3 625.0 500.0 100.0 -400.0
Dividends from State Owned Enterprises 0.0 125.0 30.0 105.0 75.0
Withdrawals from income of quasi-corporations 0.0 40.0 0.0 - 0.0
Rent 19.3 31.2 19.9 55.2 35.3
Sales of goods and services 62.8 112.5 63.3 124.2 60.9

2019 National Budget, Volume 1
69
Source: Department of Treasury
Of the total dividend, K800.0 million is expected from the KPHL based on the Budget assumption of 2018 gas prices in 2019, K200.0 million from the Ok Tedi mine, K100.0 million from the Bank of Papua New Guinea, K80.0 million from Kumul Consolidated Holdings (KCHL) and K25.0 million from the Motor Vehicle Insurance Limited (MVIL). The Government expects its current SOE dividend policy to be enforced and the funds repatriated to the CRF. The Statutory Transfers include K500.0 million from National Fisheries Authority (NFA), K79.6 million from the Immigration & Citizenship Services Authority, K36.5 million from the National Maritime & Safety Authority (NMSA), K36.0 million from the Mineral Resource Authority (MRA), K2.9 million from the National Agriculture Quarantine and Inspection Authority (NAQIA) and K79.7 million from other statutory bodies. Revenues from departmental fees and charges have been very weak over the past years. In 2018 Budget, a total of K174.6 million was projected, however, only 44.0 per cent of the
projection was collected up to end September due mainly to low collections from key contributors such as land rentals. In 2019, a total of K156.0 million is projected for departmental fees and charges of which K58.0 million is expected from Department of Labour and Industry, K52.0 million from Department of Lands and K46.0 million from other departments. In order for the Department of Lands and Physical Planning to undertake reforms to improve collections from land rentals, K4.5 million is allocated in the 2019 Budget. The reform to increase revenue from land rentals is part of the broader MTRS. Department of Treasury will work closely with the Department of Lands and Physical Planning to ensure that the reform is funded and revenues collected accordingly. 4.4 GRANTS
Total Donor Grants have been tracking well in 2018 against the 2018 Budget projection of K1,024.6 million and it is expected that the full budgeted amount will be dispersed by the end of 2018. A total of K126.6 million was received as grant in kind from development partners for support to APEC. There were also additional support for military exercises, trainings and capacity buildings to beef up security. In 2019, it is projected at K943.1 million, with bulk of the receipts being from DFAT. Contribution from international organisations such as UN and EU are projected to be lower than 2018, as most of the EU projects and programmes have been completed14. Donor Grants are subject to movements in the exchange rate and policies of donors (see Table 18).
Administrative fees 22.9 46.6 27.5 63.0 35.5
Incidental sales by nonmarket establishments 39.9 65.8 35.8 61.2 25.4
Fines, penalties, and forfeits 1.6 1.0 1.0 0.8 -0.2
Transfers not elsewhere classified 18.5 631.4 904.3 1,153.3 249.0

2019 National Budget, Volume 1
70
Table 18:Donor Grant (Kina, Million)
2017 Actuals
2018 Budget
2018 Revised
2019 Budget
Variation
Total 1,439.9 1,024.6 1,024.6 943.1 -81.5
From Foreign Governments 1,281.9 752.8 752.8 775.8 23.0
Current 1,025.5 602.2 602.2 620.4 18.2
Cash 0.0 0.0 0.0 0.0 -
In-Kind 1,025.5 602.2 602.2 620.4 18.2
Capital 256.4 150.6 150.6 155.1 4.5
Cash 0.0 0.0 0.0 0.0 0.0
In-Kind 256.4 150.6 150.6 155.1 4.5
From International Organizations 158.0 271.8 271.8 167.6 -104.2
Current 126.4 217.4 217.4 134.1 -83.3
Cash 0.0 0.0 0.0 0.0 0.0
In-Kind 126.4 217.4 217.4 134.1 -83.3
Capital 31.6 54.4 54.4 33.5 -20.9
Cash 0.0 0.0 0.0 0.0 0.0
In-Kind 31.6 54.4 54.4 33.5 -20.9
Source: Department of Treasury

2019 National Budget, Volume 1
71
Box 4: Credit Offset
4.5 MEDIUM TERM REVENUE OUTLOOK
REVENUE AND GRANTS The implementation of the MTRS 2018-22 aimed at broadening and deepening the tax base with a greater compliance focus by tax and non-tax agencies, together with the projected construction of the Wafi-Golpu project, construction of a second LNG project and expansion of the existing LNG project, will boost revenues over the medium-term from K14,266.8 million in 2019 to a level around K18,516.4 million by 2023. This is a 6.7 per cent annual compound growth rate which is higher than earlier years and reflects the work the Government is doing to improve tax collections, tax policy and the tax base.
Credit offsets are account transactions where a tax payer, having multiple accounts with different credit and debit positions can offset his/her tax liability to the IRC with an account credit (defined as a liability that IRC owes to the taxpayer. The table below shows credit offsets for 2018 up to end September 2018.
Reasons why a taxpayer may have a tax liability in an account:
✓ Normal tax due periodically raises an account debt liability.
✓ Past tax debt unpaid to IRC.
✓ Re-assessment issues to the taxpayer as a result of an audit.
✓ Account error corrections.
Reasons why a taxpayer may have a credit sitting in the account (i.e. IRC would owe the taxpayer)
✓ GST input credits - This is by far the largest source of credits in the system and generally results from
taxpayers that are GST zero-rated (usually exporters and suppliers to exporters) claiming back GST paid
on inputs.
✓ Mistakenly paying a higher tax to IRC than what was due (sometimes due to transaction errors).
✓ Reassessment that reduced a past liability of the tax payer (this almost never happens).
✓ Company tax for a year overpaid in provisional taxes covered as credit upon filing for wash-up payments.
As per the definition of credits, a taxpayer may pay his current liability through a past credit sitting in the system. For instance, a SWT liability that gets raised in September of 2018 gets paid by the tax payer through a GST input credit from April 2018. When a taxpayer identifies that he has a credit, he is allowed to recover the credit in two ways - either ask for a refund cheque or ask for a credit offset which means that the IRC has to forgo receipt of the tax in cash in the current period. Credit offsets continue to be scrutinised by IRC and carefully vetted before the credits are offset.
YTD 2018
Cash
YTD 2018
Credit
Total Tax
Liability
Total 6236 347 6584
Personal Income Tax 2243 116 2360
Company tax 1358 126 1483
DWT 82 1 83
Mining and Petroleum Taxes 548 1 549
Interest withholding tax 74 1 75
Other Direct 148 1 149
Gaming Tax 151 0 151
GST 1632 101 1734

2019 National Budget, Volume 1
72
The projected level, excluding grants, in 2023 will reach 14.1 per cent of nominal GDP, in line with the maintenance of the 14.0 per cent target in the MTRS. The lower revenue growth rate compared with nominal GDP rates reflects the lags between revenue collections and resource project growth rates given the tax concession arrangements in fiscal agreements. Tax Revenue is projected to increase from K11,212.6 million to K15,612.4 million by 2023, with higher expected growth in receipts from the establishment of the Large Taxpayer Office (LTO) and second CEF by PNG Customs, the new tax regime for SMEs, and improved compliance across the board. Tax collections should be underpinned by the expected higher growth rates in the resource and non-resource sectors over the medium term. Other Revenue is projected to stabilize slightly below K2.0 billion and will be supported by the implementation of the Public Money Management Regularisation (PMMR) Act 2017 which will see 100.0 per cent of fees and charges collected and remitted to the WPA by 2020, while the enforcement of the dividend policy will lift payments to the State over the medium-term. The establishment of a Revenue Unit in Treasury in 2019 will facilitate the improvement in policies and collections. Other Revenue includes projections of SWF receipts, however, since the Fund is yet to be operationalised, the figures are indicative only. The projections account for 50.0 per cent of mineral and petroleum tax channelled to the SWF Stabilisation Fund (but will still be available for Government expenditure in accordance with the drawdown thresholds) while the other 50.0 per cent flows directly to the CRF to finance Government expenditure. In the interim, all mineral and petroleum dividends are directed to the National Budget until the SWF arrangements are in place that cover the dividends and other proceeds stipulated in the SWF Organic Law. Details of the projected flows out to 2023 are provided in the Appendix – See Fiscal Table 16. Chart 31: Annual Revenue Inflows PNG LNG Project – Projections 2014-204015
Source: Department of Treasury
15 Data is based on 2018 average prices. In estimated total revenues, the dividend estimate is the full amount estimated to flow
to KPHL prior to the transfer to the public revenue account. The revenue figures for 2014 to 2017 are estimates based on updated
prices and volumes and not actuals. The data has been produced from internal models of the Government. Production volume
and price assumptions are based on recent updates (as published in this volume) for 2018 to 2023. For 2024 onwards, a five-
year moving average price is used. PNG has yet to be able to fully benefit in terms of foreign exchange inflows as (i) most of the
revenue from the PNG LNG Project has been held in offshore accounts for the servicing of project finance debt, (ii) the
Government’s tax receipts in the near term remain reduced due to amortization of the PNG LNG Project’s loans, which is expected
to end in 2025 and (iii) high (accelerated) depreciation expenses, which are expected to fall off substantially after 2025. Between
2014 and 2040, on the assumptions outlined in the notes to the graph above, it is estimated that the Government will receive
approximately US$10.9 billion in revenue receipts. This excludes any revenue received by the Government from the other joint
venture partners from the flow-through of dividends from the project. Total revenue inflows to the national budget are estimated
to be US$9.0 billion between 2014 and 2040. There is no public debt tied to the project, and all revenue is expected to flow

2019 National Budget, Volume 1
73
Chart 32:Medium Term Revenue (2017-2023), Kina Million
Source: Department of Treasury
Donor Grants are provided at the discretion of donors in accordance with their internal budget policies and depend on the successful delivery of outcomes from existing projects, as well as exchange rate fluctuations. To be conservative, the current donor grants’ projection for the medium term is expected to remain relatively constant in nominal terms at below K1.0 billion.
through into the public account or through government entities such as KPHL or the PNG SWF (once established) that will assist
in servicing public debt. In 2016 and 2017, the tax revenue contribution from the PNG LNG Project was below K100 million;
however, dividends passed through to the Government from KPHL were K300 million over the same period. The Government
expects receipts from the PNG LNG Project to increase beginning in 2021 and accelerate significantly from 2025 onwards.
0
2000
4000
6000
8000
10000
12000
14000
16000
18000
20000
2017 2018 2019 2020 2021 2022 2023
TAX REVENUE GRANT OTHER REVENUE
Kina Million

2019 National Budget, Volume 1
74
CHAPTER 5: TAX AND NON-TAX MEASURES AND DEVELOPMENTS 5.1 OVERVIEW
The Government endorsed the new Medium Term Fiscal Strategy (MTFS) and PNG’s first Medium Term Revenue Strategy 2018-2022 (MTRS) as part of the 2018 Budget consistent with the Government’s Alotau Accord II and the 25 Points Plan (25PP). The MTRS sets out the legislative, administrative and policy reforms that aim to strengthen and broaden the revenue base to fund the Government’s development aspirations outlined in the MTFS, Medium Term Development Plan (MTDP) III, National Strategy for Responsible Sustainable Development (STaRS) and Vision 2050. In 2018 solid progress was made on implementing the first phase of the MTRS with most of the programmed measures on track including the establishment of the MTRS Steering Committee, the launching of the Large Taxpayers Office (LTO), introduction of the Tax Administration Act and a number of reforms by PNG Customs Service. Most of the tax revenue targets were met, with a substantial increase in Mining and Petroleum Tax, although personal income tax collections continue to be adversely impacted by the subdued state of the domestic economy. Non-tax revenues improved significantly with the management of the Public Money Management Regularisation (PMMR) Act 2017 and higher expected dividends from KPHL. The solid progress in implementing the MTRS in 2018 has established a robust platform for the continued implementation of the programmed revenue strategies in 2019. The 2019 measures aim to raise additional revenue in an equitable way and thereby support continued investment in key Medium Term Development Plan (MTDP) enablers such as in education, health, infrastructure, and law & order and to ensure sustained delivery of basic goods and services in 2019 and over the medium term. The measures also underpin the Government’s efforts towards fiscal consolidation as programmed in the MTFS and, at the same time, protect and strengthen its revenue streams to increase revenue levels above 14.0 per cent of GDP by 2022, broaden and deepen the tax base in an efficient way to enable the achievement of revenue levels above the targeted 14.0 per cent of GDP by 2022. The major revenue policy measures in this 2019 Budget include:
i. strengthening revenue administration agencies;
ii. removing GST zero rated status for suppliers of resource companies to address fraud;
iii. reforming the excise regime to support domestic manufacturers by suspending excise indexation for alcohol for one year, reducing the excise indexation rate from 10.0 per cent per annum to 5.0 per cent for alcohol and tobacco and removing certain luxury goods in the excise schedule which may no longer be considered luxury in this age;
iv. introducing a K15 per kilogram export tax on Sea Cucumber (beche-de-mer);
v. continued relief for domestic manufacturers from import competition; and
vi. tax relief for low to lower-middle income earners.

2019 National Budget, Volume 1
75
Other policy amendments introduced in the 2019 Budget are:
i. reducing the generous carry forward loss period in line with the record keeping period;
ii. revising the quorum requirement for the research and development expenses’ approval committee;
iii. introducing a soliciting offence against IRC officers who are involved in bribery;
iv. amending the lodgement date of non-resident insurers’ returns to bring forward revenue remittance to IRC and ease administration for taxpayers;
v. introducing amendments to facilitate PNG’s membership of global forums and signing of the multilateral instruments on Base Erosion and Profit Shifting (BEPS) as well as strengthening the secrecy provision for information shared by our treaty partners; and
vi. consolidating the tax payment dates to 7th and 21st of every month to simplify administration.
Further, the Government will introduce a number of minor technical amendments to clarify the law and correct typographical errors to streamline tax administration. Importantly the 2019 Budget announces several revenue policy development areas largely consistent with the MTRS. Those policies will be workshopped in 2019 to gauge views from key stakeholders that will enable the firming up of policies that can be considered for implementation in 2020 and beyond. 5.2 MTRS GOALS AND PROGRESSIVE UPDATE
The MTRS is a key foundation pillar that underpins PNG’s Vision to reach the top 50 countries in the United Nations Human Development Index (HDI). Mobilizing sufficient and sustainable revenue flows is indispensable for PNG to fund its development goals in order to reduce levels of poverty and fulfil Vision 2050. The MTRS treats the policy, administrative and legislative components of a tax system in a holistic and interactive way and therefore, the taxation policy reforms introduced in the 2018 Budget were implemented and are tracking as expected. These measures included clarification of the eligibility for primary production incentives, taxation of prescribed contracts for foreign contractor’s withholding tax, and removal of the training levy and double deduction for training. Administrative reforms were commenced with the launching of the Large Tax Payers Office (LTO) in September 2018. Others included rolling out EFTPOS machines for tax payments, signing of an MOU with provincial governments to assist in tax collections and more efforts being geared up for taxpayer services and awareness. In terms of non-tax revenue, the Public Money Management Regularization (PMMR) Act 2017 (PMMR) was well implemented and it is on track to achieve the expected revenue outcome. The implementation of PMMR Act ceased most trust accounts that were not following due process and purpose; 90.0 per cent of revenue collected by each entity were transferred to mirror account with around K20.0 million directed to the Consolidated Revenue Fund (CRF) each week. The mirror account is also used to facilitate ongoing operations of affected state authorities. The PMMR Act has a sunset clause (section 14) which requires all Public and Statutory bodies to remit all their non-tax revenue to CRF from 2020 onwards as the 90/10 revenue sharing arrangement ceases end of 2019. This would also mean that

2019 National Budget, Volume 1
76
funding for all Statutory and Public Bodies would be 100.0 per cent sourced from the national budget from the year 2020 onwards. In 2019, work will be progressed to ensure all statutory authorities are covered through the budget process for 2020. There was also significant progress made on the APEC tax agenda, particularly relating to international tax issues. Papua New Guinea used its APEC host year to help foster international tax cooperation and transparency, in particular, implementation of the OECD/G20 BEPS minimum standards and other relevant actions through the BEPS Inclusive Framework. In July 2018, PNG hosted a technical seminar where PNG and other APEC economies shared experiences and challenges in implementing the BEPS minimum standards and the internationally agreed standards on transparency and exchange of information. The seminar enabled PNG to broaden its network with APEC economy tax policymakers and administrators to tap into technical assistance. This has built a strong platform for advancing the implementation of its commitments under the BEPS Inclusive Framework, with further work planned over the coming years. PNG Customs Service also undertook a number of reforms. These included strengthening the cross border mechanism, improving customs clearance and risk assessment of cargo, new scanning technologies in the air cargo stream, and development of the Service Plan 2018-2022 to improve border protection, trade facilitation and revenue administration. The Tax Administration Act (TAA) was introduced in the 2018 Budget which sets out clear procedures for main tax heads, administrative rules and tax payer obligations and rights. The TAA is expected to improve tax administration and compliance, and, therefore, increase revenue generation. A TAA working group has been established in IRC to ensure proper awareness is made and IRC systems will be upgraded before implementation in 2019. Some of the provisions of the TAA will be made effective through amendments in the Income Tax Act (ITA).

2019 National Budget, Volume 1
77
The implementation of the MTRS is supported by the MTRS implementation Steering Committee and this Committee will continue to ensure the reforms programmed for 2019 are delivered effectively. The MTRS will continue to support the development of sustainable revenue generation through an effective and equitable tax system that also underpins robust investment levels and higher economic growth rates. 5.3 MAJOR TAX POLICY MEASURES
5.3.1 Strengthening Revenue Administrating Agencies
Improving revenue policy and instituting effectiveness of revenue administration in a coordinated manner will trigger significantly higher revenue collection on a sustainable basis. Diagnostic reviews of tax administration agencies by Deloitte and PWC have highlighted significant institutional and capacity issues within the revenue administration agencies and therefore it is important that revenue administration agencies are strengthened with the adoption of the principles of effective tax administration. The implementation of the MTRS is aimed at strengthening revenue raising agencies to ensure increased awareness, compliance and enforcement. Key reforms that IRC will undertake in 2019 include:
(i) establishing a Program Management Office (PMO) for effective implementation of MTRS programs;
The MTRS goals and objectives are to:
• halt the current declining revenue to GDP trend and lift levels significantly in 2019 to fund
both the budget and any adjustment costs, then sustain higher revenue (excluding grants)
to GDP trends to above 14.0 per cent out to 2022;
• increase compliance substantially, both through greater enforcement, particularly with
respect to large tax payers, and increase the use of the Tax Administration Diagnostic
Assessment Tool, but also through encouraging a culture of voluntary compliance to
reinforce revenue collections at lower administration costs;
• broaden the revenue base by introducing measures to fill the tax gaps and rationalise tax
incentives, and lessen the tax burden on the current narrow range of personal income tax
payers but with equitable outcomes paramount;
• make corporate tax schedules more competitive but do so through the removal of a myriad
of concessions, tax exemptions and special arrangements;
• lift non-tax revenue collections substantially by amending the respective legislation of public
bodies to improve the pass-through of collections and dividends into the Consolidated
Revenue Fund (CRF), transfer unutilised trust fund balances to the CRF, and enhance the
performance of State bodies to sustain higher collections and dividends;
• progressively increase the Budget for revenue agencies, but target increased
appropriations to clearly defined revenue generating areas and outcomes;
• strengthen revenue policy, the legislative framework and administration components of the
revenue system for a more effective, simpler and efficient tax system; and
• respond to the need of an expanding market economy, the increasing number of taxpayers
and sophistication of business, as well as facilitate management in providing an effective
tax paying service.

2019 National Budget, Volume 1
78
(ii) operationalising the LTO over the next 2 years with a view to balance some short term capacity and a strong longer term foundation;
(iii) procuring a new Integrated Tax Administration System (ITAS) which will replace the current IT system;
(iv) establishing a designated Taxpayer Services Unit which will be responsible for developing educational material and approaches to improve compliance with the tax laws;
(v) developing a broader Compliance Improvement Plan to address specific risks to revenue collections and improve compliance generally;
(vi) developing KPIs and continuous monitoring and evaluation to help IRC manage and improve the way in which IRC operates its business;
(vii) reviewing HR policies and procedures around recruitment, retention, performance management, training etc. to maximise the potential of all staff in IRC and to align HR management with that of a more modern tax administration.
Further, some of the key reform activities that PNG Customs Service will undertake in 2019 include:
i) strengthening cross border mechanisms to detect smuggling, contraband, illicit goods, evasion of duties, bribery and undervaluation;
ii) strengthening Post Clearance Audit (PCA) through training to increase PCA activities;
iii) strengthening support mechanisms such as rolling out of ASYCUDA world to provide an integrated tool for risk assessment of cargo;
iv) improving customs clearance and risk assessment of cargo;
v) improving scanning technologies on sea and air ports to detect contraband products and under declared products;
vi) reviewing Customs legislation relating to the importation or exportation of illicit goods (including undeclared or falsely declared shipments); and
vii) Implementing Customs Service Plan 2018-2022 which is focused on delivering strong border protection and effective trade facilitation to increase compliance and enhance revenue collections.
The Government appreciates and recognises the important role revenue administration play in the collection of revenue and therefore will continue to support them with appropriate resources to implement the aforementioned activities. The increase in resources is expected to bring increased revenue in 2019.
5.3.2 Removal of GST zero rating for supplies to resource companies
GST zero rated status for suppliers of resource companies has meant that suppliers to resource industries are GST zero rated but the suppliers will claim credits/refunds from IRC for the input GST paid on these same supplies. The same suppliers supplying at a GST zero rate to resource companies, can also supply to non-resource companies at the 10.0 per cent GST rate. This in itself is presenting administrative complexity for both the taxpayers (suppliers) and IRC.

2019 National Budget, Volume 1
79
This arrangement can disadvantage IRC if the supplier chooses to misreport the composition of goods supplied at the zero rate and goods supplied at the 10.0 per cent rate, therein lifting the refund amount claimed for input credits. Therefore, there is a high possibility of abuse of GST zero rated status of suppliers to resource companies. The 2019 Budget will remove the GST zero rated status for suppliers to resources companies to address fraud and to improve tax administration. This should not impact resource companies as they will then be able to claim a refund of GST paid. Resource companies may raise concerns around slow GST refund processes but issue is now managed through tax offsets and the GST deferral scheme for directly imported goods and services. Also the increased focus on large tax payers through the LTO is expected to manage the refund process better in the future. This measure is expected to save an expected revenue leakage of around K86.0 million in 2019, and lift revenues by a similar amount in going forward. This measure will require amendments to the GST Act and it will be effective from 1st January 2019.
5.3.3 Reform excise regime: suspend and reduce excise indexation for alcohol and tobacco; introduce a second tier for tobacco and remove excise rates of certain luxury goods
The 2019 Budget will amend the Excise Tariff Act 1956 to:
• suspend the excise indexation rate for alcohol for 18 months commencing 1st December 2018 and ending 1st June 2020, and, thereafter, reduce the excise indexation rate from 5.0 per cent to 2.5 per cent every six (6) months;
• suspend excise indexation rate for tobacco commencing 1st December 2018 and ending 1st June 2019 and, thereafter, reduce the excise indexation rate from 5.0 per cent to 2.5 per cent every six (6) months;
• create a second tier for tobacco without indexation for one year; and
• remove excise rates on certain luxury goods.
i. Suspend and reduce excise indexation rate Since 2012, the excise rates for tobacco and alcohol have increased by 39.8 per cent and 21.5 per cent respectively. The increased rate was to minimise health and social issues associated with consumption of tobacco and alcohol and to maintain the real value of excise rates over time. In 2017, excise revenue peaked for alcohol and tobacco at K313.4 million and K432.4 million respectively. The increased tobacco excise revenue was due to the industry absorbing the excise rate increases and not passing it on to the consumers. This budget suspends the 5.0 per cent six (6) monthly excise indexation rate for alcohol for 18 months commencing 1st December 2018 and ending 1st June 2020 and, thereafter, reduce the excise indexation rate from 5.0 per cent to 2.5 per cent every six (6) months. This budget also suspend the six (6) monthly excise indexation rate for Tobacco commencing 1st December 2018 and ending 1st June 2019 and, thereafter, reduce the excise indexation rate

2019 National Budget, Volume 1
80
from 5.0 per cent to 2.5 per cent every six (6) months . This measure is intended to minimise the impact of the indexation policy on the alcohol and tobacco excise base rates and will raise an additional revenue of K20.0 million, mostly coming from the tobacco industry.
ii. Introduce a second tier for tobacco The 2019 Budget also introduces a second tier excise for tobacco with no indexation to combat against the increasing illicit tobacco trade. This freezing of the rate is only applicable to locally manufactured tobacco products which will assist the local industry. This tier is expected to create an incentive to shift consumers at the margin from the illicit untaxed tobacco market segment into the taxed segment. This measure is expected to recoup some lost revenue and even the playing field somewhat by improving local industry competitiveness against cheap illicit tobacco products. The local manufacturers must first sell the main tier before qualifying for the second tier and this criteria will be a mandatory licensing requirement enforced by PNG Customs Service on all local manufacturers. This measure is expected to raise K50.0 million in 2019. These two reforms together are expected to raise K70.0 million and they will be effective 1st December 2018. iii. Remove excise rates of certain luxury goods
There are five broad categories of excised goods: Tobacco, Alcohol, Petroleum, Vehicles, and 'Other' goods (a combination of goods deemed to be luxury items such as jewellery, televisions, cameras etc. and other 'harmful' goods such as firearms and goods associated with gambling). Traditionally, excise was used to raise revenue with the tax levied on high volume, relatively price inelastic goods for which there were few substitutes but today, excise policy is largely driven by the correction of negative externalities. The most common form of goods subject to excise are tobacco, alcohol, motor vehicles and petroleum products. Many excised items are basic household needs and can no longer be classified as luxury goods in the literal sense. For example, TVs, play box and microwaves have become basic needs in most homes. This Budget removes several luxury goods under the “other goods” category, except for fire arms, ammunition, gaming machines, jewellery and high-end automobiles which will continue to be subject to excise policy. This will simplify administration of the excise regime and free-up Customs-constrained resources to deal with key excisable items. This measure is expected to reduce Government revenue by K2.0 million in 2019 and is expected to be effective from 1st January 2019. The reforms of the excise regime are expected to raise net revenue of K68.0 million.
5.3.4 Introduce export tax on Sea Cucumber (Beche-de-mer) Beche-de-mer, commonly known as sea cucumber, has been fished increasingly over the years for commercial purposes. In 2004, PNG was reported as the third largest producer of sea cucumbers supplying to China, Hong Kong and other Asian markets (Kinch et al., 2008).

2019 National Budget, Volume 1
81
Historical data indicates that the volume of Beche-de-mer exports have increased significantly since 1986 to around 100.0 tonnes. Between 2000 and 2009, annual production averaged 556.0 tonnes per annum with an average value of K30.0 million per year. The National Fisheries Authority (NFA) reported that since 2000, the catch effort has generally been increasing with a historical high of 679 tonnes with a catch value of over K37.0 million in 2006. The NFA is responsible for conservation, management, development and sustainable use of PNG’s fisheries under the Fisheries Management Act 1998 and has gazetted the National Bêche-de-mer Management Plan in 2001 for the regulation and management of the sea cucumber fishery to minimise the impact on the marine and coastal environment whilst maintain economic value. The Government will introduce an export tax of K15.0 per kg on sea cucumber in the 2019 Budget to capture resource rent on this endangered fish resource. This will assist NFA’s efforts to curb overharvesting and ensure sustainable sea cucumber fishing. This measure is expected to increase Government revenue by K10.0 million and will be effective 1st January 2019.
5.3.5 Continued relief to domestic manufacturers from unfair import competition
In the 2018 Budget, the Customs Tariff Act (CTA) 1990, was amended to provide relief to local pioneer infant industries and local manufacturers from lower cost imported goods by increasing import duties on certain imported items. The amendment was also intended to reflect the Government’s decision to suspend the Tariff Reduction Program (TRP) from continuing further in 2018 and to include tariff items that were missed during the updating of the Customs Harmonized System (HS) 2012 to HS 2017 in the 2017 National Budget.
Most of the tariff items affected by the 2018 Budget Customs tariff reform were omitted unintentionally. Therefore, the amendments correct these omissions and will be effective and back dated to 1st January, 2018.
Further amendments are to be introduced as part of the 2019 Budget to support local businesses and these comprise:
• increasing import duties on similar goods manufactured locally such as wooden furniture, shopping bags, and others to assist local manufacturers;
• Splitting the flour tariff item (1101.00.1 and 1101.00.9) into retail and bulk. The retail duty rate will attract 25.0 per cent while the import of bulk flour will be free of import duty;
• addressing some discrepancies in the tariff code, description and rates for certain tariff items; and
• Creating a new heading for telecommunication cards (Flex cards) under chapter 49 as 4911.99.30.
These amendments are expected to raise K10.0 million and will be effective from 1st January, 2019.

2019 National Budget, Volume 1
82
5.3.6 Moderate tax relief for low to lower-middle income earners Personal Income Tax (PIT) is an important source of tax revenue for PNG, and accounts for about 30.0 per cent of tax revenue and a quarter of the country’s total revenue collections. Revenue from PIT in PNG is currently estimated at about 4.1 per cent of GDP which is quite high when compared with most developing countries in the Asia Pacific Region who generally have a PIT ratio of around 1-3.0 per cent of GDP. High PIT limits the incentives for more people to work in the formal sector. It reduces their hours of work, encourages brain drain, deters businesses from expanding investments, increases informal activities and encourages tax planning and tax evasion. While there is significant need to provide relief to our formal sector income earners, the cost of such relief also presents a challenge. To strike a balance, this budget introduces a modest reduction to PIT. This PIT relief package includes:
i) An increase in the tax free threshold to K12,500; and ii) An increase in the 22.0 per cent marginal rate threshold to K20, 000 from K18,000.
This relief is intended to address bracket creep which occurs when workers are pushed into higher tax brackets due to inflationary pressures on wages without corresponding increases in income thresholds leading to potential reductions in real wages. The relief measures will also increase working incentives for low to lower-middle income earners. Those earning up to K20,000 will benefit from the lower PIT with the maximum benefit being K710.0 per annum or have a tax savings of K30.0 per fortnight (refer table 19). Table 19: PIT Reforms, Revenue Impact and Benefits to Tax Payer in 2019
Current rates and thresholds Proposed rates and thresholds
Taxable income Marginal tax rate
Taxable income Marginal tax rate
Cumulative benefit to taxpayer of change
Benefit to taxpayer of each rate/threshold change
1 - 10,000 0 1 – 12,500 0 +K550 +K550
10,001 -18,000 22 12,501-20,000 20 +K710 +K160
18,001 - 33,000 30 22,001 - 33,000 30
33,001 - 70,000 35 33,001 - 70,000 35
70,001 - 250,000 40 70,001 - 250,000 40
250,000+ 42 250,000+ 42 Source: Department of Treasury
iii) Removal of Education Rebate
This will assist simplify administration and to partially offset the cost of the reduction in PIT revenue. This concession is normally accessed by parents sending kids to private schools. The education expenses rebate provides a rebate of 25.0 per cent of a dependant’s school or university fees up to K750.0 per year. According to IRC not many claim the education rebate. Removing this rebate will also simplify administration. The removal of the education rebate is expected to save K0.5 million. This measure is expected to come into effect from 1st January 2019. In summary, the moderate relief to low and lower-middle income earners will cost the Government K162.1 million in 2019 but this cost will be offset from the revenue savings done

2019 National Budget, Volume 1
83
from the removal of double deduction for training in the 2018 Budget and the other revenue measures in the 2019 Budget. 5.4 MINOR TAX POLICY MEASURES
5.4.1 Reducing the generous carry forward loss period in line with the record keeping
period
The tax laws allow taxpayers to carry forward losses as a deduction in the future and such losses were originally allowed to be carried forward for seven (7) years consistent with the period for which taxpayer’s are legally obligated to keep records of their tax affairs. In 2001, the carry forward loss period for resource companies and primary producers was increased to 20 years to encourage investment in the resource and agricultural sectors however in 2003, further amendments were made to allow losses to be carried forward indefinitely for the resource and agricultural sectors and 20 years for all other taxpayers. This loss carry forward period is overly generous and raises concerns over whether tax payers could be in business when not making a profit for over 20 years. The 2019 Budget reduces the loss carry forward period back to 20 years for the resource and primary productions sector and seven (7) years for all other tax payers. The 20 years loss carry forward period for resource companies is consistent with the carry forward rule relating to the Allowable Exploration Expenditure (AEE) deduction under Section 155A of the Income Tax Act (ITA). Under the AEE carry forward rule, a taxpayer is entitled to claim AEE as far back as 20 years from the time the development licence was issued to the taxpayer. Also the seven (7) year loss carry forward for all other tax payers is consistent with the taxpayers’ record keeping period of their tax affairs. This measure is expected to be effective from 1st January 2019.
5.4.2 Empower Commissioner General (CG) to hold quorum to deliberate on simple
Research and Development (R&D) expenses
The R&D investment allowance incentive was first introduced in 2003 as part of the green revolution initiative and allowed a 150.0 per cent tax deduction in relation to eligible expenditure approved by the R&D Committee. The incentive was revoked in 2014 but the standard R&D deduction is allowed. The assessment of these claims depends on the R&D Committee which under the current law comprises of two persons who have expertise in research and development, the Commissioner General (CG) of the IRC, or his/her delegate, who shall be the Chair of meetings, and two (2) persons who are involved in, or have expertise in financial or business administration. It was established to deliberate on the R&D expenditure claims. In light of the huge backlog of R&D expenditure claims yet to be assessed, this budget introduces a measure to empower the CG to form the quorum to determine the claims. The CG will bring in industry experts as the need arises. This measure will require amendments to the Income Tax Regulation 1959 and is expected to be effective from 1st January 2019.

2019 National Budget, Volume 1
84
5.4.3 Introduction of a soliciting offence against IRC officers
The bribery offence introduced in the 2018 Budget allows for prosecution of taxpayers and other external offenders. However, where an IRC staff member has solicited a bribe or has colluded with a taxpayer in a fraudulent manner concerning tax revenue, this officer is terminated and referred to police for prosecution under the criminal code. The prosecution process have been very slow and does not assist with the IRC’s tax compliance and anti-corruption message. The IRC has been strictly implementing the fraud-related measures consistent with its zero-tolerance policy on fraud and corruption. This resulted in a high number of staff being terminated in recent times and this is expected to continue until high standards are achieved. There are a lot of fraudulent activities involving IRC staff members and it is important IRC deal with these cases on a timely basis. The prosecution will act as a deterrent measure to IRC staff as well as the taxpaying public. The Government recognises the unique revenue collection role of the IRC and the ensuing need for more stringent standards and penalties for the organisation when it comes to corruption and fraud matters involving IRC staff. This budget introduces an amendment in the ITA, relating to elements of solicitation and collusion by IRC staff. It will be a summary offence against staff involved in tax related fraud associated with their duties. The offence is already in the Tax Administration Act (yet to be enforced) but given the increased incidence of fraud related matters involving IRC staff, there is an urgent need to bring the offence into force sooner. This measure is expected to be effective from 1st January 2019.
5.4.4 Bring forward non-resident insurers tax
Tax Returns for Non-Resident Insurer’s Taxes are due annually. In practice, this is lodged with the Corporate Tax Returns annually but the 2019 Budget will change the practice so that the returns will now be lodged monthly. The implication is that revenue from current year payments of insurance premiums to offshore insurers will be collected in the current year (except taxes paid on December premium payments will be collected in January of next year). This measure will have a one-off positive impact on revenue because 2018 tax will be paid in 2019 plus the 2019 tax also coming in 2019. The date for lodgement will be the 21st of the following month. This is consistent with the withholding tax regime for many withholding taxes in PNG. This measure is expected to be effective from 1st January 2019.
5.4.5 Facilitate PNG’s membership to global forum and multilateral instruments on Base
Erosion and Profit Shifting (BEPS)
PNG’s obligations relating to the Exchange of Tax Information (EOI) with other tax authorities for the purposes of combating cross-border tax fraud, base erosion and profit shifting, is hampered by the shortcomings in our secrecy provisions.
2019 National Budget, Volume 1
85
The ITA allows the CG to share taxpayer information with other State agencies or officers prescribed in the law. This refers to information that has come to the knowledge of the CG in the course of exercising his powers under the revenue law. However, information obtained under any tax treaty from the EOI cannot automatically be shared domestically with the standards requiring that PNG has a legal framework that protects confidential taxpayer information obtained from other jurisdictions to be used for taxation purposes only and will not be used for any other purpose. This budget introduces measures to strengthen secrecy provisions for information obtained from foreign treaty partners. The second aspect of the measure is a technical legal requirement. The Government has already provided the endorsement for PNG to sign up to the MLI and the signing should take place later this year or early 2019. As required under s.117 of the Constitution, once a treaty is signed, one of the requirements to making it binding and to have the force of law in PNG, is to have recognition by the relevant domestic law.
This requires an amendment to the Income Tax (International Agreements) Act that will reference the treaties. This measure is not expected to impact revenue and it will be effective 1st January 2019.
5.4.6 Consolidate tax payment dates
Payment and Lodgement dates for withholding taxes and other taxes differ as follows:
• all withholding taxes are due on the 21st day of the subsequent month;
• business income payment tax is due on the 15th day of subsequent month;
• salary and wages tax deducted and collected from employee salaries is due on the 7th day of the subsequent month; and
• goods and services tax – collections from the current month is due before the 21st day of the subsequent month.
The 2019 Budget consolidates dates for lodgement and payment into the 7th and 21st to simplify administration for both tax payers and IRC. This means that the business income payment tax will now be paid on the 21st of the subsequent month instead of the 15th day of the subsequent month.
This measure is expected to be effective 1st January 2019.
5.4.7 Remove provision on dividend withholding (DWT) tax credit for individuals
This is a consequential change to the DWT reforms done in the 2017 Budget that was overlooked. Section 219A relates to credits in respect of DWT deductions made from dividend income received by individuals by providing that in calculating the overall assessable income of an individual, where dividend income is included, a credit is to be given to the individual on the DWT component that was paid. This was relevant where DWT was not a final tax, and a credit had to be given for the DWT component that was already paid. However, in the 2017 Budget reforms to the DWT regime, the Government simplified the process by removing the need for companies and other payees of dividend income to pass

2019 National Budget, Volume 1
86
the accounting of DWT through its books down to the final recipient. This was done by making DWT a final tax. Therefore, currently, individuals in receipt of dividend income will have had the DWT deducted and remitted to the IRC immediately and there would be no inclusion of the DWT component in the overall assessable income calculation of the individual. As a final tax, no credit situation can arise. Section 219A therefore has no practical application currently and consequently the 2019 Budget will repeal this provision.
5.5 TECHNICAL AND HOUSE KEEPING AMENDMENTS
The following amendments will correct typographical errors and out-dated referencing to clarify the law for ease of administration:
5.5.1 Proper numbering of section 155E of the ITA; There is duplication of Subsection (7) in Section 155E of the ITA. This amendment corrects Subsection 7 and renumbers it as Subsection 7A.
5.5.2 Foreign Contractor Withholding Tax (FCWT) Any income that is derived by a foreign contractor under a prescribed contract is subject to FCWT which is a final tax. The IRC has the power to recover any non-payment of FCWT against the PNG resident who had engaged the foreign contractor.
The 2019 Budget introduces two specific technical amendments to correct the language used in Section 196F of the ITA. First, amend Section 196F (1) by deleting the words “and Paid” after the word “payable” where first occurring.
The other technical amendment is required in Section 196F (2) as it appears the reference to “assessable income” should be a reference to “taxable income”. Therefore, this budget amends Section 196F (2) by deleting the word “assessable” and replacing with “taxable”.
5.5.3 Correct drafting error relating to the country by country reporting threshold
This budget amendment corrects the drafting error in the February 2017 Parliament sitting where the country by country threshold of “K203.0 billion” will be replaced with a “K2.3 billion” amount.
5.5.4 Fix incorrect references in Section 91 of the GST Act Sections 91(2) and (3) currently have typographic errors that need correction. Subsection 2 provides that no refund can be made after eight (8) years. Subsection (3) provides for the exceptions to that eight (8) year time limit.
This amendment corrects:
• Subsection (2) to read “Subject to subsection (3)” and
• Subsection(3) to read “subsection (2)”

2019 National Budget, Volume 1
87
The 2019 Budget corrects the typographical errors to provide clarity in the reading of GST refund limit.
5.6 ANNOUNCEMENTS OF POLICY DEVELOPMENT AREA IN 2019
As a part of the continuation of the MTRS in 2019, the Government will also initiate the investigation of several reforms that require public consultations and awareness before implementation in the years 2020 and going forward. These policy development areas are announced in the 2019 Budget to encourage discussion to develop a well-informed reform program. Presented below is an overview of the draft policy agenda.
5.6.1 Small Medium Enterprise (SME) Taxation Regime
The current PNG tax system applies to both SME and large enterprises. It does not have a separate simplified tax regime applicable to SMEs. The current tax laws are too complex for SMEs to comply with because of stringent requirements such as, calculation of tax liability, compilation of tax audits, and keeping of accurate records. These are more suited to large enterprises who can afford the utilisation of tax agents. Introducing a separate and simplified tax regime for SMEs is important as it brings more taxpayers into the tax net and will gradually graduate them into the large tax regime. This reform is consistent with the MTRS. A SME Taxation Policy and legislation have been developed. The Box below shows features of the proposed simplified SME Tax Regime.
These features are covered in a draft working SME taxation policy paper which will be used for consultation prior to firming up the policy position. It will allow IRC time to upgrade the administration system in 2019 in preparation for implementation in 2020. This policy development is announced to prepare the public for consultations prior to implementation in 2020.
5.6.2 Introduction of capital gains tax
Capital gains is another form of income, but in PNG most capital gains are untaxed. Many other countries tax capital gains in some form, either with an explicit capital gains tax or by treating capital gains as inherently part of ordinary income.
1. Businesses with annual turnover of less than K250, 000 are considered small businesses. 2. The simplified accounting rule for small businesses will have the following rules.
▪ Income will be taxed in the year it is received and costs are deducted when paid by the business on a cash basis.
▪ The entire cost of long lived assets − which is normally written-off (‘depreciated’) over time – is deducted when the assets are bought at the rate of 100.0 per cent with a limit of K5,000 on the asset values
▪ Purchases of trading stock are deducted in the year received. SME’s are not required to value each item of trading stock on hand at the end of the income year, or account for any change in the value of trading stock on hand.
▪ Limiting time for retaining records to two (2) years for small businesses. This will reduce record keeping, compliance cost and improve tax administration.
3. Combine Payment of GST and Salary and Wages Tax and increase payment periods to three months (quarterly).

2019 National Budget, Volume 1
88
Individuals and businesses make capital gains whenever they sell assets for more than they paid for them. These assets may include property (houses or buildings), financial assets (shares, etc.), mining and petroleum tenements, or intangible assets (trademark or goodwill). Not taxing capital gains gives rise to tax planning and can also distort investment decisions. Tax planners can convert taxable income into untaxed capital gains. For example, shareholders may decide not to pay dividends (which are taxable) and retain the profits to increase the value of their shares. Once these shares are sold, the shareholders receive capital gains (which are currently not taxable). Further, exploration/prospecting licence holders deliberately hold onto the licenses without undertaking genuine exploration with the intention of reselling the licences at a higher price. If capital gains were to be taxed, investments would be driven by economic priorities − not tax avoidance, thereby allowing capital markets to allocate investment to the most productive use by providing a more neutral tax treatment of different forms of investment. Treasury’s working draft on Capital Gains policy and legislation will be workshopped for full awareness to firm up the policy prior to implementation. It is also important to allow IRC time to upgrade administrative systems in 2019. This policy development is announced in the 2019 Budget to receive stakeholder feedback.
5.6.3 Excise on sugar sweetened beverages (SSB)
Sugar Sweetened Beverages (SSBs) refer to non-alcoholic beverages of any constitution (liquid, powder, or concentrates) that are pre-packed and sealed and contain sugar added by the manufacturers. Soft drinks, typically contain sugar, high-fructose corn syrup, fruit juice, sugar substitutes, or some combination of these as sweeteners. Soft drinks may also contain caffeine, colourings, preservatives, and other ingredients. SSB consumption is positively linked with growing rates of obesity and diabetes in many parts of the world. The imposition of an excise tax on SSBs is timely and justifiable on the grounds that it is aimed at reducing excessive consumption of SSBs, which leads to health issues such as obesity, diabetes and dental caries. This policy measure has health benefits, and will contribute to funding health-related programs of the Government. This policy announcement is provided to gain consumer and industry feedback in 2019 for implementation in 2020.
5.6.4 Minimum tax
There is no requirement for a minimum amount of tax payable by a person who has made an operating loss in a financial year. The proposal is to ensure that if a company makes a loss, it must still pay some form of tax to the Government. The proposal has two elements:
(i) If a taxpayer makes a profit – this profit will be reduced by any allowable deductions, rebates, and tax credits. No minimum tax rules will apply; and
(ii) If a taxpayer makes an operational loss – it must pay a minimum amount of tax based on a percentage of its revenue for the financial year.

2019 National Budget, Volume 1
89
The current law allows companies to declare losses, and carry forward those losses to offset future profits for purposes of taxation. There are companies that have been declaring losses over many years, and still operate in PNG raising concerns around transfer pricing, but the IRC has limited technical capacity to carry out transfer pricing audits. The proposal will be a temporary solution to at least gain some revenue from companies that have been declaring losses, but are still in business in the country. This announcement is to seek feedback and to conduct consultations in 2019 for consideration of its introduction in 2020 or beyond.
5.6.5 Review and simplification of depreciation schedules
A number of assets listed in the ITA schedule are out-dated leaving a number of new assets not being listed in the schedule. Companies currently self-declare assets, their useful life and method of depreciation by using the schedule as a reference/benchmark. The company tax return makes it mandatory for companies to file details of assets and deduction according to the prescribed schedule. Secondly, a number of income tax jurisdictions may allow for additional deductions on depreciation. These can take several forms and deductions can be above the businesses’ cost on depreciable assets - usually to incentivise investment in assets. The Government recognises the need to revise and simplify the depreciation schedule as a tool to encourage or restrain investment in various sectors of the economy. A review of the depreciation schedule will be done in 2019 by IRC, in consultation with industry, for implementation in 2020.
5.6.6 Investigate tax on mobile telecommunication sector
The 2019 Budget seeks to investigate the introduction of a turnover tax on mobile telecommunication companies. The aim here will not be to discourage the use of voice and text however, since mobile telephony has become an important part of the consumption basket there is an opportunity for this sector to make a further contribution to funding the country’s development aspirations.
The imposition of a telecommunication tax is a common phenomena and countries such Kenya, Tanzania, Rwanda, Gabon, and Uganda (among many others) have such a tax. Most of these countries impose the tax on cellular airtime in addition to VAT (GST).
The telecommunication tax on telecommunication companies is based on two underlying reasons:
• Above normal profits to the operators because of limited spectrum – The limited competition in the mobile telecommunication sector facilitates implicit or explicit collusion among service providers leading to higher service prices than that in a fully competitive market. Hence, allow these few operators to make supernormal profits.
• Complex pricing schemes by the operating companies that make the tax base difficult to define – the Internal Revenue Commission (IRC) has faced enormous challenges in assessing and auditing the mobile telecommunications carriers. The

2019 National Budget, Volume 1
90
difficulty of policing complex pricing formulas used by these companies has meant that the assessment of tax returns are delayed resulting in under collection of tax revenue.
To partially offset the increased tax collected from the introduction of this new revenue measure, the 30.0 per cent excise on play boxes is removed considering its basic and widespread use. This measure has the potential to raise revenue because of its inelastic nature as exhibited by countries that have adopted this reform.

2019 National Budget, Volume 1
91
CHAPTER 6: EXPENDITURE 6.1 OVERVIEW
The 2019 Budget, alike the previous budgets is policy driven where expenditure allocation is guided by the MTFS 2018-22 and the Medium Term Development Plan (MTDP) III 2018-22. Both these strategies, capture strategies outlined in, Alotau Accord II and the 25PP and are being complemented by sectoral policies and reforms. Expenditure in the 2019 Budget captures the GST and Bookmakers Turnover Tax (BTT) transfers to Provinces, which is consistent with the Government Finance Statistics (GFS) 2014 reporting framework. The GFS 2014 reporting framework is a long term project that will change the reporting format, budgeting and a whole of other financial components of how we report, present and implement the budget. The 2019 Budget also reflects a unified budget of both the capital and the operational components. While the global economic environment has improved, growth in the domestic market has remained slow. In ensuring that the maximum development outcome is achieved within the limited fiscal envelop, the 2019 Budget will focus on two strategies, allocative efficiency and expenditure efficiency. This is consistent with the expenditure strategy of the current MTFS (2018-2022) which promotes greater efficiency in public spending. In achieving allocative efficiency in the 2019 Budget, the government will focus on funding the MTDP III priorities and its key enablers through these strategies;
• reprioritising and reallocating public spending towards more productive programs and projects that will promote inclusive economic growth;
• ensuring government social priorities and key enablers are funded adequately ;and • adequately fund the operational budget to support the implementation of the capital
budget. Expenditure efficiency will be realised through the implementation of public sector reforms initiated by the government of which some are being implemented .These include:
• centralising of utility Bills; • addressing issues relating to public servants personnel emoluments expenditure and
the payroll system–Organisational Personnel Emoluments Audit Committee(OSPEAC);
• amalgamation of agencies- Public Sector Reform Organisation Team (PSORT); • budget reforms; • decentralisation of government-Allocating more resources towards the implementation
of policies especially in the district and rural areas; and • building and strengthening of the monitoring and evaluation system at all levels of
government through the Policy Monitoring and Evaluation Framework.
Total expenditure in 2019 is estimated to be K16,133.5 million, of which, K14,373.5 million is GoPNG funded and the remaining K1,760.0 million is donor funded (K816.9 million in concessional loans and K943.1 million in donor support grants). The total expenditure is higher by K1,415.6 million or 9.6 per cent from the 2018 Budget. Given the expenditure ceiling with revenue of K14,266.8 million, this will result in net borrowing of K1,866.7 million or 2.1 per cent of GDP.

2019 National Budget, Volume 1
92
The total 2019 Budget is comprised of K10,636.4 million for operational expenditure and K5,497.1 million for capital investment expenditure. Both the Operational and Capital Budgets have been increased by 5.6 per cent and 18.4 per cent respectively. The increase in the operational budget is driven by the increase in the compensation of employees16 budget by K385.3 million or 9.3 percent from its 2018 Budget. The compensation of employees (PE) Budget takes up the largest portion with K4,522.6 million or 42.5 per cent of the total Operational Budget and makes up 28.0 per cent of the total budget .The compensation of employees budget has been increased to sufficiently cater for anticipated increases, in particular the industrial awards such as the 3.0 per cent salary increase which will then prevent overruns. Expenditure overruns in the compensation of employees budget continue to occur annually and has been on an increasing trend. Therefore, in 2019 the government will control the overruns by linking the IFMS and Alesco payroll system to ensure salary expenditures are kept within the monthly warrant ceilings. The issue of under budgeting will be addressed by obtaining an accurate compensation of employees budget through the work of OSPEAC. More emphasis will be on matching the cost of new intakes from the disciplinary forces and teacher’s college’s with their departmental PE budgets. The Goods and Services (GS) Budget has been slightly reduced from K3,059.9 million to K3,030.6 million, a 1.0 per cent fall. The significant increase in the capital budget reinforces the government’s intention of effectively implementing the MTDP III in 2019 and set a good foundation for the delivery of capital investments in the next three years. The 2019 capital budget focuses on investing in high impact projects to broaden the base for internal revenue generation in a sustainable manner, support inclusive economic growth and continue to adequately fund the key enablers of the MTDP III. Table 20: 2019 Aggregate Expenditure
Budget Component 2018 Budget 2019 Budget
Operational 10,074.0 10,636.4
Compensation of Employees* 4,137.3 4,522.6
Goods & Services 3,059.9 3,030.6
Function Grants 500.2 490.3
Debt (Interest Repayment) 1,864.7 1,979.4
GST & Book makers 511.9 613.6
Capital 4,643.9 5,497.1.1
PIP 1,851.0 2,563.0
SIP 1,174.4 1,174.4
Loan Drawdowns 593.9 816.9
Donor Grants 1,024.6 943.1
Total Expenditure 14,717.9 16,133.5 Source: Department of Treasury *Formerly referred to as Personnel Emoluments under 1986 GFS framework.
16 Consistent with the GFS 2014 reform, PE is now referred to as ‘compensation of employees’.

2019 National Budget, Volume 1
93
Table 21 shows the detailed expenditure by sectors. Table 21: 2019 Expenditure by Sector (Kina, Million)
Sector Operational Capital Total As % of Total Budget
Administration 2,042.4 **2,022.6 4,065.0 25.2%
Community & Culture 43.1 99.2 142.3 0.9%
Debt Services 1,979.1 0.0 1,979.1 12.3%
Economic 202.7 539.4 742.1 4.6%
Education 1,067.1 311.1 1,378.2 8.5%
Health 1,097.5 455.6 1,553.1 9.6%
Law & Justice 1,004.7 293.4 1,298.1 8.0%
Provinces 2,877.3 195.7 3,073.0 19.0%
Transport 291.8 995.6 1,287.4 8.0%
Utilities 30.7 584.5 615.2 3.8%
Total 10,636.4 5,497.1 16,133.5 100.0% Source: Department of Treasury *Includes GST and BTT transfers to provinces. **Includes PSIP and DSIP funding.
Expenditure efficiency strategies will also be supported by the implementation of Non-Financial Sectors (NFIs). The NFIs are outlined in Section 6.5. 6.2 DONOR FUNDING FROM DEVELOPMENT PARTNERS
6.2.1 Relationship between Government of PNG and Development Partner Expenditure
The Development Partners (DPs) in Papua New Guinea have played a vital role in PNG’s development endeavour since independence in 1975 and will continue to do so through different development cooperation arrangements and mechanisms. The DP support is provided through Grant Aid, Loans and Technical Funds as part of the overall Overseas Development Assistance (ODA). Their support has been a significant source of revenue for the capital investment budget during the early post-independence years till the mid-2000s when the trend began to change with increased government capital into its investment programs. Given the challenges in coordinating and implementing DPs support in PNG as well as responding to the global efforts to ensure development aid is delivered with ultimate aim to improve the livelihoods of the people, the GoPNG formulated the 2015 PNG Development Cooperation Policy (DCP) indicating the strong leadership on its part in coordinating and implementing development cooperation. With the new Medium Term Development Plan III (MTDP III) 2018-22 to guide our investment plans and budgets, the GoPNG revised its development cooperation policy to lead and ensure better engagements in strategic and coordinated partnerships as well as enhancing strategic economic partnership. The PNGDCP 2018-22 will serve as a resource mobilizer and financing tool for the MTDP III in the O’Neill/Abel Government in the next four years. All DPs are encouraged and expected to observe the principles and objectives of the PNGDCP 2018-22 to ensure their funding support is guided towards the MTDP III. The O’Neill/Abel government’s priority actions still remains as per the Alotau Accord II with a focus on growing the economy. In 2019, Development Partner assistance (Grant Aid, Technical support and Concessional Loans) amounts to K1,760.1 million or 32.0 per cent of total capital expenditure of K5,497.1 million. The Development Partner grants and loans continue to provide key support

2019 National Budget, Volume 1
94
to transport infrastructure, health, education, law and justice, capacity building in GoPNG agencies, climate change and environmental support, enabling economic growth and addressing cross-cutting issues. With a population of eight (8) million people and a growth rate of 3.1 per cent which is higher than the current economic growth rates since its sharp decline in 2016, the Capital Investment Budget remains critical to grow the economy. The introduction of the Economic Stimulus Package in the 2018 Capital Investment Budget is aimed at resuscitating the Agriculture, Fisheries and Forestry Sectors to increase growth. The GoPNG will be seeking DPs support through new strategic and coordinated partnerships to finance large scale projects in the MTDP III. The total grant aid and technical support from Development Partners in 2019 stands at K943.1 million representing 17.2 per cent of the total capital expenditure. The Government of Australia through Department of Foreign Affairs and Trade (DFAT) provides the largest share of grant aid and technical support – K711.4 million. The other DPs that also provides grants are the European Union (EU), United Nations Systems (UNS), Japan International Cooperation Agency (JICA), People’s Republic of China (PRC), New Zealand AID (NZAID) and USAID through their regional support. The DPs also work in partnership with the GoPNG to fund development projects like the Productive Partnership in Agriculture (PPAP) where World Bank (WB), International Fund for Agriculture Development (IFAD), EU and GoPNG as the financiers and implemented by WB. A similar case is also undertaken by WB, EU, UNICEF and GoPNG to fund and continue the implementation of WaSH Programme in 2019. The UNS is providing its support through the United Nations Development Assistance Framework (UNDAF) 2018-22 beginning in 2018. Their key area of focus is to support GoPNG with the work on Sustainable Development (SDGs) and eventual achievements of the SDG targets come 2030. The total concessional loans from Development Partners in 2019 amounts to K816.9 million or 15.0 per cent of total expenditure. Peoples Republic of China through the Chinese Exim Bank provides the largest share of concessional loans amounting to K298.0 million exceeding ADB’s K277.0 million. China’s major investments in 2019 are in Utilities K268.0 million, Transport and Health sector on K40.0 million each and K25.0 million on Economic sector. Other DPs providing development support through concessional loan financing include the JICA K114.0 million, the WB K90.0 million, European Investment Bank (EIB) is expected to drawdown in 2019, however, figures were not available during the passing of the 2019 Budget, Ceska/Erste K23.0 million and IFAD K14.5 million. While the GoPNG acknowledges the DPs’ support and the good working relationship that has been built over the years, there is more room for improvement in certain areas in coordinating, managing, delivering and reporting on aid projects. The issues continued to be faced by both GoPNG and DPs, include slow drawing down of loans, lack of GoPNG counterpart, land acquiring issues, DPs going directly to GoPNG agencies and provinces, most DPs not able to provide realistic financial projections for their projects, and the DPs yet to fully comply with Government Finance Statistics (GFS) 2014 reporting standard. With the PNGDCP 2018-22, the GoPNG looks forward to strengthen its partnership modalities with its partners. Despite these challenges, the GoPNG is committed in providing the leadership required to effectively delivering development interventions with the support of its DPs. The introduction of Public Expenditure & Financial Accountability (PEFA) assessment, the formulation of the PEFA Roadmap and the subsequent PEFA Assessment Report have progressed the process of having a strengthened Government system supported by are strategic MTDP III and PNG DCP 2018-2022 should give that confidence to its Development Partners that the Government is serious in ensuring services are delivered.

2019 National Budget, Volume 1
95
An overview of funding from PNG’s Development Partners and the related Government counterpart are shown below: Table 22: 2019 Loans, Grants and Government Counterpart funding (Kina, Million)
Development Partner Grants Loans GoPNG
Counterpart Funding
Total
DFAT 711.4 0.0 8.0 719.4
European Union 78.9 0.0 2.0 80.9
United Nations 74.7 0.0 0.0 74.7
New Zealand 25.0 0.0 0.0 25.0
China 0.5 298.0 57.0 355.5
Asian Development Bank 14.0 277.0 59.5 350.5
World Bank 0.0 90.4 21.0 111.4
JICA 38.7 114.0 25.0 177.7
Ceska/Erste 0.0 23.0 0.0 23.0
EIB 0.0 0.0 5.0 5.0
Indian EXIM 0.0 0.0 10.0 10.0
IFAD 0.0 14.5 1.0 15.5
Totals 943.1 816.9 188.5 1,948.5 Source: Department of National Planning and Monitoring
6.3 BUDGET REFORMS
In ensuring effective allocation of public funds to achieve desired tangible outcomes, the government has introduced and continues to implement measures since 2012. These measures are to improve the budgeting process through;
a. Government Finance Statistics b. Integrated Budget;
c. Multi-year budgeting process;
d. Sector led-budgeting; and e. Performance based budgeting.
The 2019 Budget marks the complete transition in adopting the updated version of Government Finance Statistics (GFS) framework – GFS 2014. This framework was initially adopted in the Volume 1 of the 2016 Budget documents and thereafter rolled out into other budgetary policy documents such as reporting the Mid-Year Economic and Fiscal Outturn (MYEFO) and Final Budget Outturn. This updated framework was finally rolled out in Volume 2 of the 2018 Budget documents thus making it GFS expenditure compliant. Volume 2 of the 2019 Budget is produced in both frameworks, namely, the 1986 GFS and 2014 GFS thus demonstrating the completion of the transition process. Therefore, the 2020 and future budgets will be produced by applying the 2014 version of the framework as stipulated in the Government Finance Statistics Manual (GFSM). The GFSM is an internationally recognized statistical reporting framework introduced by the International Monetary Fund (IMF), aimed at helping IMF-member countries around the world strengthen their capacity to formulate fiscal policy and monitor fiscal developments. This reform is to improve the compilation and presentation of the government’s fiscal statistics to enable policy makers and the government to better analyse the government’s fiscal operations and its effect on the overall economy.

2019 National Budget, Volume 1
96
The updated version of the GFSM framework supports the balance sheet approach to analysing the economic and financial position of a country by bringing together stocks and flows in a transparent and consistent manner. This analytical framework offers greater consistency in fiscal reporting and policy analysis across IMF-member countries as it provides a systematic basis for reporting and analysing government finances. The Government Finance Statistics framework is a specialised macroeconomic statistical framework designed to support more detailed fiscal analysis of developments in the financial operation and financial position of government. Such level of analysis allows an assessment of the liquidity and sustainability of the finances of the general government sector or the public sector in a consistent and systematic manner. The GFS framework can be used to analyse the operations of a specific level of government, transactions between levels of government, and the public sector. The Government will fully roll out the GFS framework to the public sector including public corporations and general government. It will also be rolled out to the Provincial Governments and Local Level Governments. By the time the GFS framework is fully rolled out in terms of coverage, whole-of-government stocks and flows of its assets and liabilities will be reported showing the opening balance, transactions and closing balance. In this way, the GFS framework features a balance sheet approach that is capable of determining the net worth of Papua New Guinea. The sector-led budgeting has been introduced to agencies in 2018 in preparation for 2019 Budget. The sector-budgeting approach is a strategic approach in ensuring that agencies align their programs and activities to complement each other and achieve maximum outcomes. Sector budgeting also helps to reduce duplication of funding. The Multi-year budgeting process will enable the government to set baseline expenditure estimates for ongoing policies and programs. It will provide rolling forward estimates that form the baseline for the following budget. As there is a base, future budget ceilings will be set on new expenditures only, covering both capital and operational components. The Government is currently negotiating with its development partners to seek technical assistance in establishing the Multi-year Budgeting Process. The measures are continuously refined to improve the integrity and efficiency of the budget process to fulfil the Government’s policy objectives. The IFMS is being configured to ensure that the development of current budget reforms are incorporated into the system. 6.4 SECTOR EXPENDITURE
6.4.1 Administration Sector An efficient and effective administration of the public service is critical for the delivery of quality goods and services. The administration sector comprises of twenty-six (26) line agencies including two (2) principal revenue-generating agencies – Internal Revenue Commission (IRC) and PNG Customs and the five (5) central agencies within it. The Administration sector’s objective is to ensure that performance and management at all government levels is of high standard, creating enabling mechanisms for efficient coordination of implementation, monitoring and evaluation of government policies.

2019 National Budget, Volume 1
97
However, lack of; clear demarcation of roles and responsibilities, coordination, and enforcement of legal and policy compliance, has resulted in ineffective service delivery over time. This has prompted the government to reinforce structural reforms and strengthen the existing service delivery processes and systems to empower sustainable economic growth. This will be supported through the implementation of some of the key legislations and policies such as; the Public Service Management (PSM) Act 2014, District Development Authority Act 2014, Public Finance Management Act 2016 (reviewed), Public Money Management Regularization Act 2017, GoPNG-Civil Society Organisation Partnership Policy 2018, Policy Monitoring and Evaluation Framework, and PNG Strategy for Development and Statistics 2018. Amalgamation of agencies is one of the many initiatives the government is implementing to improve the productivity of public service in PNG. This will help in achieving the government’s aim of rightsizing the public service and providing service delivery in a more coordinated manner, and at the most cost efficient way. As part of the reforms to strengthen the service delivery system and process at the sub-national level, the government has transferred national functions to certain provinces based on the “principle of performance-based power sharing”. This has started with three provinces - Enga, New Ireland and East New Britain Provinces. In going forward, the government is committed to develop an effective and efficient public service at the national and sub-national levels. This intervention will be achieved through programmes/projects such as; Financial Management Information Project (K15.0 million), Container Examination Facility (K10.0 million), Replacement of Ageing Tax Collection System (K4.0 million), National Affordable Land and Housing Program (K20.0 million), and K20.0 million for National EID Card Project. Support from development partners will be targeted at enhancing capacity development and institutional strengthening at both the national and sub-national levels. Total expenditure for the Sector in 2019 is K4,065.0 million or 25.2 per cent of the total budget. This is an increase of K1,023.1 million or 33.6 per cent from its 2018 Budget. The very large increase in the sector’s budget represents the movement of Service Improvement Program (SIP), funding from the capital budget of the Provinces’ sector to the capital component of the administration sector. The SIPS, specifically DSIP and PSIP, will be reflected under the Department of Implementation and Rural Development (DIRD) rather than, individual Provinces, in improving its administrative and monitoring efficiency. The National Executive Council (NEC), in its Decision No.240/2018, directed the Department of Treasury to frame the Service Improvement Program (SIP) Budget by allocating 30.0 per cent to infrastructure, 20.0 per cent to Education, 20.0 per cent to Health, 10.0 per cent to Law & Order, 10.0 per cent to Economic, 10.0 per cent to Administration sectors .These fixed commitments are complimented by other capital projects approved by the government. Total expenditure for the sector consists of K2,042.4 million in operation which is inclusive of miscellaneous funding worth K1,320.9 million and K2,022.6 million in capital expenditure, inclusive of PSIP and DSIP (K1,080.0 million). Of the total budget for operational expenditure, K479.0 million is assigned for compensation of employees and K242.4 million is for goods and services.

2019 National Budget, Volume 1
98
For accountability and transparency purposes, big ticket items are captured under the Treasury and Finance Miscellaneous Budget (Division 207). The allocation for the miscellaneous expenditures in 2019, makes up 8.9 per cent of the total budget. Miscellaneous budget captured large expenditure items such as, State’s Superannuation Obligations (K170.5 million), Nambawan Supa Exit Payment (K151.5 million), Arrears (K138.5 million) and Multi-Departmental Office Accommodation (K226.5 million). 6.4.2 Community and Culture Sector Investing in the integral development and protection of individuals, families and communities is of equal importance as growing and developing the economy as people are the most important resource in any economy. The Community and Culture Sector plays its part in the integral development of individuals, families and communities through the Department for Community Development as the lead agency, the National Youth Development Authority, Office of Censorship, PNG Sports Foundation, National Cultural Commission, National Museum and Art Gallery, National Volunteer Services, Office of Urbanisation, National Office of Child and Family Services, and National Council of Women. The Sector is a determinant of economic growth and is essential to the development agenda as it cross cuts all priority sectors of Government in the previous MTDPs and the current MTDP III. The sector has made some significant progress in achieving targets and improving indicators over the recent years. Such achievements include improvement in sport facilities and effective partnership between churches and the Government to deliver basic health and education services. The key challenges are gender based violence in various forms, for example, sorcery, violence against children, persons with disabilities, and the elderlies and women. Moreover, lack of leadership, coordination and financial constraints continues to impede the sector’s performance. The major policies, strategies and legislations that will drive this sector in the medium-term includes the National Policy on Professional Volunteerism, National Youth Employment Policy National Women and Gender Equality Policy, National Disability Policy, Small to Medium Enterprise Policy, Family Protection Act 2014, Lukautim Pikinini (Child Protection) Act 2015, National Disability Policy, and Informal Economic Policy. In going forward, the sector will continue to enhance infrastructure and physical skills in various sporting codes to meet international standards; leveraging community participation and empowerment; enhance genuine partnership between Christian Churches and GoPNG to deliver basic health and education services; create a system that censors the information received by the population; and empower youth participation in socio-economic development giving prominence to technical training and SME skills. These priorities will be implemented through programs such as the Church State Partnership Program (K14.0 million); National Youth Development Program (K10.0 million); Gender Equity/Based Violence (K12.1 million); Censorship Information Management System (K2.9 million); and High Performance International Sport PNG (K5.0 million) In 2019, the Community and Culture Sector receives K142.2 million which makes up 0.9 per cent of the total budget and is an increase of 39.0 per cent from its 2018 Budget. This sector’s budget consist of K43.1 million in operations and K 99.2 million in capital. Of the total budget for operational expenditure, K30.2 million is assigned for PE and K12.9 million is for goods and services.

2019 National Budget, Volume 1
99
6.4.3 Economic Sector The MTDP III emphasizes the government’s plan to grow the economy significantly in the next five years with the goal of generating higher internal revenue on a sustained basis to meet the demands of the country’s growing population. The Economic Sector plays the important role in ensuring that the county’s resources are strategically used to our advantage so that the maximum benefits is realised in terms of revenue generation and wealth creation. This will enable the pathway for PNG to achieve its aim of becoming a middle income country by 2030, which is ambitious yet achievable if all actors in the economy act responsibly. The Economic Sector as a whole comprises of two main sub-sectors; the renewable and non-renewable sectors. The renewable sector includes; Agriculture, Forestry, Fisheries, Tourism, Trade and Investments, Manufacturing and the SMEs, Land Development and Financial Inclusion. The non-renewable sector comprises the Mining and Petroleum or the extractive industries sector. The Sector represents on average about 3.4 per cent of the total GoPNG National Budget and has been on a constant trend over the last five (5) years. Over the past years, the sector’s focus was to strategically develop PNG’s abundant natural resources which is intended to improve the livelihood of the people. This has not been easily faced with adverse effects of unfavourable fluctuation of commodity prices, increase in resource depletion rate and new emerging challenges such as climate change, bio-security threats and technology revolutions. In responding to these challenges, the Government introduced a paradigm shift in the development agenda where by, the sector’s strategies were re-scoped to incorporate the elements of inclusive, responsible and sustainable growth. This laid the foundation for deliberate investment in PNG’s Strategic Assets - Forests and biodiversity; Tuna and marine resources; Fresh and pristine river system; Unique cultural and eco-tourism; Mineral and petroleum resources; Rich organic agriculture; and livestock grazing. The MTDP III aims to build the next layer of economic growth by focusing on increasing the economic base of the country with investments towards the development of its strategic assets and its enabling sectors. Increasing exports and reducing imports of goods that can be produced locally such as rice, fruits, vegetables and animal dairy products. These are some of the potentials that once developed, will increase the national output, increase employment, broaden the tax base and ultimately improve living standards. The Government is seriously looking at increasing national revenue within the medium term which this plan sets the structures to grow a sustainable revenue base through sector intervention programs and policies17. The policies are implemented through key programs such as; the cash crop rehabilitation and defence against bio-security threats; downstream processing; horticulture industry; credit facilities for SMEs; infrastructures development; State Equity; Tourism development; Land reform; sustainable mining and petroleum development and climate resilience.
17 The National Trade Policy, Small Medium Enterprise Policy, Informal Economic Policy, Public Private Partnership Policy and
others.

2019 National Budget, Volume 1
100
The Economic Sector is allocated K742.0 million, which is 4.6 per cent of the total budget. This consist of K202.7 million for operational and K539.4 million for capital expenditures. Of the total operational budget, K144.0 million is compensation of employees and K58.6 million is goods and services. The sector’s budget has increased by 11.4 per cent from the 2018 Budget. This reflects the government’s commitment towards the growth of the Economic Sector. The increased funding is mainly towards ongoing activities with more emphasis on SME’s, support of small holders’ and growers’ access to markets and participation, tourism development and onshore processing.
6.4.3.1 Renewable sector Investment into the development of natural renewable resources such as agriculture, forestry, fisheries and clean energy will ensure that sustainable economic growth is realised and the country’s long term prosperity is secured. The agriculture sector has the potential to increase the quantity of agricultural produce as stated in the MTDP III. The focus now is to: (i) rehabilitate run-down plantations to boost export volumes; (ii) establish strong governance and administration system; (iii) develop a biosecurity strategy; and (iv) identify ways-forward to addressing major impediments to the growth of the sector. The sector will also focus on diversifying PNG’s agricultural export-base with specific emphasis on building the capacity of the sector and being prepared and resilient to any pest and disease mitigation strategies. Forestry in PNG is dominated by large-scale round log exports of which 10.0 per cent are from the plantations and 25.0 per cent from land conversion projects mainly for cash crop commodities. Forest plantations development has also somewhat effectively ceased and there is greater need to revive this industry with a strategy for reforestation. The management of forests in the medium term is therefore crucial to be on a sustainable basis with greater emphasis on implementing reafforestation activities. The goal of the fisheries sector as stipulated in the MTDP III is to maximize economic returns through sustainable management and development of the fisheries resources to foster wealth creation, poverty alleviation and food security. The focus for the fisheries sector will be to increase exports and maximize economic returns through combating illegal and unregulated fishing activities within the Exclusive Economic Zone (EEZ). Energy is a key enabler for economic growth and more importantly is the development and use of renewable, clean and affordable energy. Increased investment in the clean and sustainable energy such as hydro, solar, wind, bio-mass and geothermal power generation will reduce the dependency on diesel power generation and reach the PNGDSP 2030 target of providing 70.0 per cent electricity access rates to consumers. In the 2019 Budget, the Government has maintained its support for the renewable resource sector by allocating a significant amount of funds to new and ongoing activities such as New State Land Acquisition Program (K20.0 million), SMEs Funding for Agriculture and Non-Agriculture Activities (K70.0 million) Strategic Defence Against Coffee Berry Borer (K10.0 million), Regional Cocoa Nurseries Program (K10.0 million) and K22.0 million for Productive Partnership in Agriculture Program (PPAP).
6.4.3.2 Non-Renewable Sector
PNG currently has five oil fields and eight gas fields in the petroleum sector. The sector has significantly contributed to the growth of PNG economy by bringing in socio-economic benefits.

2019 National Budget, Volume 1
101
However, the challenge for PNG is to maximise the benefits for economic growth and ensure that this translates into tangible developments. The mining industry has also been a key economic driver contributing to the overall development of this country. Whilst, the focus of the mining sector is to grow the economy in the medium term, the industry has been faced with social-economic and environmental challenges over the years. These challenges can however, be managed through stringent regulatory and policy framework in placed for cost effectiveness and efficiency, environmental protection and sustainability and to ensure landowner and other stakeholders benefit. This will be supported through activities such as Petroleum Agreement Reviews and Clan Vetting (K5.0 million) and (K2.0 million) for Review of Mining Legislation and Polices (Mining Safety Act)
6.4.3.3 Trade and Investment The goal of Trade and Investment as spelt out in the MTDP III is to maximize trade and investment by increasing exports, reducing imports on substitute goods and increase Foreign Direct Investment (FDI) to generate wealth and increase national economic growth. The National Trade Policy 2017-2030 through measures such as: the reintroduction of trade defence legislation; the protection of the local manufacturing industry against unfair trade practices; the development of a clear policy stance on parallel imports to support growth and development of the domestic industry; the development of national standards and technical regulations for locally manufactured products; and support for the “buy PNG Made” initiative will help to achieve the goal of Trade and Investment in PNG. The National Trade Policy also provides a policy framework for trade agreements and trade negotiations to identify sectors with comparative advantage, and for opening up market access in sectors that can have an impact on the economy and job creation. The development of PNG’s manufacturing sector has the potential to boost the economy with an increasing range of products manufactured in PNG and harness investment opportunities for downstream processing. The manufacturing sector is supported by funding allocated in the 2019 Budget for the Industrial Centres Development Program (K10.0 million) and the Pacific Marine Industrial Park (K30.0 million). Small business activities will be supported through funds allocated Department of Commerce and Trade to facilitate the SME Access Risk Financing Facility (K4.4 million) and the National Development Bank (NDB) to facilitate SME Funding (Agriculture and Non Agriculture).The increased funding to SMEs is purposely to build their capacity in terms of having access to finance and providing an enabling environment for SMEs to grow and be competitive. The Tourism Sector has high potential for growth given the diverse and unique cultures in the country. Investments are needed in marketing the destinations, product development, support of key enabling infrastructures, and development of human resources to service the industry and the strengthening of institutions and industry partnerships. Efforts to promote tourism and hospitality will be supported through the implementation of Tourism Sustainable Development Project (K20.0 million) by the Tourism Promotion Authority (TPA) as well as other funded activities. 6.4.4 Education Sector An educated population is essential to Papua New Guinea’s social and economic prosperity. This means that more people will become knowledgeable about issues around them and more
2019 National Budget, Volume 1
102
people are able to be engaged in the formal sector which will further increase their living standards as well as increasing the number of taxpayers in the country. The Education Sector plays the pivotal role in educating Papua New Guineans through the delivery of primary, secondary, Technical Vocational Educational Training (TVET) and tertiary education. These are facilitated through the National Department of Education, Department of Higher Education Research Science and Technology, colleges and universities. The progress of the Education Sector is guided by the Vision 2050, StaRS, MTDPs, Alotau Accord II18 and sector strategies such as National Education Plan (NEP) 2015-2019; the Universal Basic Education Plan (UBE) 2010-2019 and Higher and Technical Strategic Implementation Plan 2017-2038. The sector’s on-going investments includes: community education initiatives; nursing education and training; teacher’s, technical and business colleges; establishment of Polytechnic and national universities and the transition from the Outcome-based education to Standard-based Education. This has contributed to significant progress in achieving the student enrolment and improving access to education over the years. However, quality of education is the issue that needs to be addressed at all levels from basic elementary, primary, secondary and tertiary education. Such issues include high student teacher ratio, lack of standard infrastructure, lack of competent teachers, and resource materials. The focus of the MTDP III is to improve quality and continue to improve access and affordability at all levels of the education system. The Government will continue to fund the Tuition Fee Free (TFF) program and also focus on increasing number of qualified trained teachers, improving the National Education Curriculum19, improving access to higher learning institutions and alternate pathways (TVET and FODE), raising minimum qualification of teachers20 and increasing schools of excellence. The government will also continue to invest in infrastructure to accommodate the increasing number of students. Such programs include; Human Resource Development Phase II (K33.3 million), Secondary Schools Infrastructure Rehabilitation (K20.0 million), Western Pacific University (K30.0 million) and K20.0 million for Post Technical Educational Program (Gumine, Enga, Kokopo, Vanimo Polytechnic Institutions). Other cross-cutting priority areas include gender parity and inclusive education; improved awareness and skills in sustainable development outcomes; functional literacy in early years; and specialized learning infrastructure. A total of K1,378.2 million has been allocated to the Education Sector in 2019 which is 8.5 per cent of the total budget. The Education Sector has been increased by 6.6 per cent from the 2018 Budget. From the total, K1,067.1 million is operational and K311.1 million is capital expenditure. The aggregate operational expenditure consists of K284.5 million for compensation of employees and K782.6 million for good and services. The Tuition Fee Free (TFF) policy is maintained while its finding has been increased from K602.0 million to K617.0 million. The additional increase of K15.0 million is to cater for the commodity component.
18 Alotau Accord II No. 56 – Build more classrooms. Increase quality training for teachers. Focus on quality education through
curriculum reviews and development. 19 Focusing on STEM (Science, Technology, Engineering and Mathematics) 20 Raising the minimum qualification of for teachers from diploma to degree in primary and degree to a higher level of qualification
in secondary schools respectively
2019 National Budget, Volume 1
103
6.4.5 Health Sector Health is central to human happiness and well-being. It also makes an important contribution to economic progress, as healthy populations live longer, are wiser and productive. Delivery of health services in the country is administered by the National Department of Health as the lead agency. The Health Sector’s implementation is executed through the Provincial Health Authorities (PHAs) and Hospital Management Services (HMS) in respective provinces. The sector aims to provide an efficient and effective health system that delivers an internationally acceptable standard of health services, accessible by the people throughout the country. This is guided by the country’s national development plans21, the National Health Plan 2010-2020, and other relevant sector policies and plans. The sector has made significant progress over the recent years in achieving targets and improving indicators. The Health sector has made gains in the outcomes on primary and preventative health care, and bringing specialized health services close to the people. However, delivering an efficient, equitable and quality health services accessible to all, is a persistent challenge. Health is a key determinant of economic growth and is a priority for the government over the medium term. The Government through the MTDP III is focusing on the implementation of Free Primary Health Care and Subsidised Specialist Services. This includes expansion of health workforce, procurement and management of medical supplies and equipment; human resource strengthening22; and the implementation of provincial health authorities; promotion of clean environment through good Water, Sanitation and Hygiene approaches; promotion of Nutrition Initiatives and importance of the critical 1,000 days; and Strengthened Partnership and effective health services and system23. The rural and urban health infrastructures24 transformation interventions is to prevent further deterioration of health infrastructures and transform our Health Delivery System to an acceptable level to meet the National Health Minimum Service Standards. Key indicators of reducing child and maternal mortality; improving measures against preventable diseases; improving nutritional diets for children and strengthening the national fight against TB; malaria; measles, and HIV/AIDS will be a continued focus for the government in 2019 and onwards. Donor funded projects targeting HIV, TB, immunisation, malaria and other emerging threats such as polio prevention will be continued. A total of K1,553.1 million has been allocated to the Health Sector for 2019 Budget which is 9.6 per cent of the total budget. The Health Sector has been increased by 3.1 per cent from the 2018 Budget. K1,097.5 million covers the operational and K455.6 million for the capital expenditure budget. Of the total budget for operational expenditure, K615.5 million is assigned for compensation of employees and K482.0 million is for goods and services. Under goods and services, K249.8 million is allocated for medical supplies procurement and distribution processes.
21 PNG Vision 2050, PNG Development Strategic Plan 2010-2030, National Strategy for Responsible Sustainable Development,
Medium Term Development Plans
22 Human resources will be strengthened through the Health Workforce Enhancement Plan 23 Improve health service delivery mechanisms and health systems through Facility based budgeting and increased skilled medical
practitioners 24 Regional hospitals , provincial hospitals, district Hospitals, rural health centers, community health posts, staff housing and training
institutions, medical equipment and drugs, area medical stores.

2019 National Budget, Volume 1
104
6.4.6 Law and Justice Sector Law and order is a critical enabler for social, economic and political development. The law and justice sector is responsible in ensuring for a just, safe secured and stable environment for all citizens, visitors and business to conduct their affairs freely. The sector comprises of thirteen (13) agencies with lead agencies including, Department of Justice and Anthony General, Royal PNG Constabulary, Department of Defence, National Judiciary Services and Correctional Institute Services. The sector strives to reduce and prevent crime, corrupt practices and promote good governance across all other sectors. Law and Order issues continue to be an obstacle towards growing the economy both domestically and internationally in terms of securing more foreign investments and promoting tourism. This has demanded the government to ensure the maintenance of peace and order in communities as well as providing a conducive environment for business to grow. The Law and justice sector is amongst the key priority sectors of the government and a key enabler of the MTDP III. Over the recent years the Sector has been given prominence and has seen vast improvements .New developments in the sector include the Expansion of the National Judiciary Services with introduction of new Electronic Case Management Systems (ECMS) culminating with the construction of the new state of the art Waigani National Court Complex (K100.0 million). Other ongoing developments include the increase in the growth for the disciplinary forces, legislation reviews of the 150 existing legislations including the Electoral Law Review, increase in the number of court circuits to reduce the backlog of cases and provision of justice through the services of the Village Court Officials (VCO) and Land Mediators (LM) at the village levels. In terms of assistance from development partners, the sector will continue to benefit from the Justice Services and Stability for Development (JSS4D) with a funding of K57.4 million. The program supports the sector agencies to enhance their capacity to support communities to achieve a just, safe and secure society for all. Besides the JSS4D, the Royal Papua New Guinea Constabulary (RPNGC) is also being supported by the Australian Federal Police under a separate policing arrangement (Australia – PNG Policing Program/ PNG-APP). The focus for the sector’s expenditure are now more result oriented and streamlined. In 2019, a total of K1,298.1 million in aggregate is earmarked for the Sector, comprising K1,004.7 million in operational budget, K293.4 million in capital budget. The sector’s budget has increased by 22.1 per cent from its 2018 Budget, reflecting the Government’s commitment to support the key enablers for economic growth. The Operational budget consist of K690.8 million for compensation of employees and K313.9 million for good and services.
6.4.7 Provincial Sector
PNG’s economic growth and development will only reach its full potential when resources are focused on developing and growing provinces and not only on the major cities and towns. Provincial administrations play the important role in ensuring that economic growth and development trickles down to the very remote districts and community levels. They are responsible in implementing government policies at the districts and community level so that service is delivered to where the majority of the population lives. The Provincial Sector refers to the two lower levels of government. These comprise of 328 Local Level Government Administrations (LLGs), 89 Districts (DDAs), 20 Provincial

2019 National Budget, Volume 1
105
Government Administrations, Autonomous Bougainville Government and the National Capital District Commission. Service delivery in the provinces is usually coordinated through the cascading provincial development plans that takes queue from the sector plans and medium term development plans which is further integrated into the district development plans for implementation. However, over the years, funding has not been effectively spent according to the integrated plans. As such, the service delivery plans are not effectively implemented to reflect the outcomes of the national targets. The MTDP III unanimously reflects key investments at a provincial level to ensure that the national priorities are realised. The National Service Delivery Framework (NSDF) redefines the functional responsibility of each tier of the government to enable effective service delivery. This further guides strategic development planning and resourcing and addresses the issue in duplication of funds and demarcation of responsibilities of each tier of the government. The investments of the Service Improvement Programmes (SIPs) should be complemented by the integrated provincial and district development plans. The Development Partners support to the sub-national level is coordinated through the national coordination mechanisms as indicated in the Development Cooperation Policy 2018-2022. This is to ensure that resources are strategically mobilised to invest in government priorities. The MTDP III aims to improve the quality of service delivery right down to the rural and remote areas of the country. In order to achieve the MTDP III Goal of delivering quality services, there needs to be essential infrastructures such as District Offices, Township, housing with public utilities which includes water, electricity and communication properly established. These will be facilitated through key program such as the District Township Development and will complement the Service Improvement Program through the Kina for Kina arrangement. The total budget for the provincial sector in 2019 is K3,073.0 million which is 19.0 per cent of the total budget. This is comprised of K2,877.3 million25 in operational and K195.7 million in capital expenditures. Funding for SIPs (PSIP and DSIP) worth K1,080.0 million has been reallocated under DIRD’s budget (Administration Sector), therefore province’s capital budget has been reduced. Funding for DSG and WSIP are maintained in the Provincial Sector. The operational consists of K1,736.0 million in compensation of employees (salaries & Leaves fares) and K527.8 million in goods and services grants (Functional Grants). Health Function Grants are allocated under the Provincial Health Authority (PHA) for provinces with PHAs while other provinces continue to receive the grants under the provincial administration. Teachers’ salaries and leave fares consume more than 70.0 per cent of the personnel emoluments expenditure. However, provincial sector continues to incur personnel emolument expenditure overrun every year due to insufficient budget allocations as a result of lack of provision of data by the Provincial Administrations. Therefore, in the succeeding budget year, personnel emoluments budget is increased by K183.9 million to sufficiently finance the expenditure gap. The capital budget is mainly comprised of the governments fixed commitments such as the Ward Support Improvement Program (WSIP) and the Special Support Grants (SSG) for provinces that host mining, gas and petroleum resources.
25 Inclusive of GST and BTT transfers to Provinces- K613.6m

2019 National Budget, Volume 1
106
In 2019, the country will witness a new era in its development whereby Referendum will be conducted to determine ABG independence. In preparation for the referendum, the co-chairs of the Joint Supervisory Body (JSB) on Bougainville referendum agreed to the funding arrangement for the 2019 referendum. The JSB agreed that a trust account be established for the purpose and that both PNG and ABG Electoral Commissioners are to be signatories to the account. Funding allocated through budget appropriations for referendum preparations will be managed from this trust account in accordance with the Bougainville Referendum Committee (BRC). In 2019, the government has allocated K20.0 million for the Referendum preparation and conduct. The Provincial sector has experienced increased resource distribution especially with the Services Improvement Programs and many other areas in this term of Government and therefore, proper mechanism must be established to assist and manage these resources so that services are delivered to the people effectively. 6.4.8 Transport Sector The current Government aims to establish a resilient and environmentally compatible transportation network that links all of PNG and provide access to flow of goods and other services. The transport sector plays a significant role in providing the enabling environment for socio-economic development. The sector consists of nine(9) agencies which plays two distinct roles - the Department of Transport provides the lead role in policy coordination while Department of Works (DoW) and other sister agencies are responsible for implementation, regulation and policy compliance. The national transport network is comprised of 8,740 km national roads, 16 national ports and 22 national airports as well as small wharves, jetties, airstrips and feeder roads. Ideally, PNG needs an efficient transport system with financially sustainable infrastructure of which the transport service (PMVs, aircrafts, ships, boats, etc.) is affordable and operating under a well-regulated framework with effective safety and security standards. Over the last ten (10) years, the Government has invested tremendously to improve the transport network in response to the growing demand for accessibility. However, high cost of maintenance and sustainability remains a major challenge for the sector. This threatens economic development and limits access to markets and social services for majority of the population, resulting in high costs for business activities. In response the sector has gone through some major development changes over the first and second MTDP periods including the development of the National Transport Strategy (NTS) 2010-2030 to address prevailing transportation challenges and issues. In the medium term, the government aims to continue improving transport infrastructure and implement standards for land, maritime and air to unlock economic potential areas and enable effective service delivery. This is supported through the implementation of the National Transport Strategy (NTS) 2014-2030. In 2019, the sector will focus on the following priorities such as; the National Highway Rehabilitation Program (K20.0 million); National Bridge Program (K10.0 million), Missing link Road Program (K17.0 million); Nadzab Airport Terminal Redevelopment Program (K75.0 million); New International Wharves in Wewak, Vanimo, Manus and Kikori (K8.0 million); Civil Aviation Development Investment Program (K90.0 million); and, Rehabilitation and Maintenance of Rural Airstrips (K10.0 million). A number of these major construction projects will be supported by the development partners through concessional loans.

2019 National Budget, Volume 1
107
The Transport Sector has been allocated K1,287.4 million, making up 8.0 per cent of the total budget. The sector’s budget is increased significantly by 37.4 per cent from its 2018 Budget. The allocation consists of K291.8 million for the operational and K995.6 million for capital expenditures. Of the total operational cost, K85.0 million will be for compensation of employees and K206.4 million is for Goods and Services. 6.4.9 Utilities Sector The Utilities Sector with the support of State Owned Enterprises (SOEs) provide the enabling environment for inclusive economic growth and improve the livelihood and necessities in the country. The sector comprises of 5 agencies responsible for Energy, Water & Sanitation, housing and Information Communication Technology. Investment in the sector improves and increases accessibility to; clean safe drinking water; information and internet services and clean and reliable energy sources. This contributes to improved health outcomes and living standards. However, the level of investments in the past has been low, mismatching the increased level of demand in rural and urban areas, high population growth and growing towns and cities. Urban migration is the highest in the region and places huge need to improve existing infrastructure in urban centres throughout the nation. Majority of our rural population do not have access to basic services due to high cost of delivering services. Also the challenges placed on institutions, SOE on their capacity to promote, regulate and administer development and implementation of utility sector policies. The MTDP III focuses on the quality, resilient and affordable utilities infrastructure to enable economic growth. Electricity generation and supply to households and industrial use will be expanded with increased power generation including renewable energy and establishment of main grid throughout the country through ongoing programs such as Rural Electrification Program K30.0 million. Utilization of modern technology in ICT is expected to improve dramatically with the submarine cable between Sydney, Australia and Port Moresby. The expansion of domestic cables networks; both terrestrial and submarine linking provincial centres in PNG will reduce internet cost by at least 20.0 per cent. The sector’s priority for housing will focus on reviewing the National Housing Policy in ensuring that housing is made accessible and affordable over the medium term. Increased access to clean safe drinking water, sanitation and hygiene will be pursued through the implementation of the WaSH Policy. This will contribute to positive health outcomes at the sub-national level especially in the rural areas that are without access to basic WaSH services. In total, the Sector is allocated K615.1 million which is 3.8 per cent of the total budget and has been increased by 93.3 per cent from its 2018 Budget. The allocation consists of K30.7 million for the operational and K584.5 million for capital expenditures. Of the total operational cost, K26.0 million will be for compensation of employees and K4.6 million is for Goods and Services. The Government increased investment in the capital component will focus on its commitment to implement major ongoing programs which accounts for K522.5 million and K98.0 million on the new critical programs to enable economic growth.

2019 National Budget, Volume 1
108
6.5 NON-FINANCIAL INSTRUCTIONS
In deliberating the 2019 budget, the Strategic Budget Committee (SBC) identified areas where improvements could be made to promote efficiency in the whole of the public sector. Department of Treasury was directed to issue NFIs in the 2019 Budget (Volume 1) for agencies to implement accordingly. All government funded agencies are expected to report on the implementation status of their respective NFI’s in April 2019 as part of the Quarterly Budget review process conducted under the Public finance (Management) Act 1995. The NFI’s are Generic which applies to all agencies and Specific NFIs for individual agencies. Generic
1. All agencies, particularly those receiving funds from the National Budget are to; a. Provide detailed quarterly reports to Department of Treasury and National Planning
and Monitoring, b. Attend second quarter budget review meetings, c. Attend the Staffing and Establishment review meetings conducted by Department
of Personnel Management, d. Establish Project Steering Committee (PSC) for all projects funded under the
capital budget and have quarterly meetings, and e. Migrate from standalone payroll system to Alesco. f. “Department of Finance, Treasury and Personnel Management to work together
to link Alesco to IFMS. This is to ensure that salary runs are kept within the monthly warrant ceiling.”
2. All statutory bodies are required to: a. Pay their employee superannuation and Personnel Income Tax component on time
to Nambawan Super and Internal Revenue Commission, b. Work closely with Department of Treasury to address any outstanding Nambawan
Super and Personnel Income Tax in the first quarter of 2019.
3. Disciplinary Forces (Police, CIS, and Defense) are to install power and water meters to individual institutional houses in order to manage excessive arrears in utility bills.
4. All loan financing requests from agencies including multilateral, bilateral or any other financial institutions are to be channeled through Department of Treasury.
Specific PNG Sports Foundation- To have a revenue strategy plan for implementation in 2019. Department of Education- To provide a report on the implementation and implications of the Tuition Fee Free (TFF) policy. Department of Health-To have a drug management system that creates a data base for drug procurement, management and monitoring. National Housing Commission- To provide updated reports on rental remittance to Department of Treasury on Quarterly basis and have a proper record keeping on managing National Housing Commission assets and properties.

2019 National Budget, Volume 1
109
Lands and Physical planning- provide reports on outstanding land rentals to Department of Treasury after proper verification. Independent Consumer Competition Commission- Audit the items sold in shops to reduce low quality and counterfeit items. National Development Bank- To provide regular information paper to Cabinet on the progress of the Banks activities in terms of banking products. National Broadcasting Commission- to have a revenue strategy plan. Provide quarterly updates on the revenue collection and to have a proper organization structure. Department of Finance-
• have regular IFMS board meetings to ensure relevant departments have a Training Needs Analysis survey to establish the current skills level and the required level of skills to use IFMS.
• an immediate review involving Department of National Planning and Monitoring on the process of releasing funds for project implementation.
National Forest Authority- provide reports on monitoring strategies for deforestation and reforestation to Departments of National Planning & Monitoring and Treasury. Department of Provincial Affairs- to inform Department of Treasury on the number of Ward councilors and the cost. To further discuss on the issues surrounding ward councilors. Department of National Planning and Monitoring- have an audience with Provinces that receive Special Support Grants (SSG’s), Mineral Resources Authority and Department of Provincial Affairs to identify matters relating to over payments of SSGs. Outcomes of 2018 NFIs In 2018, few NFIs have been successfully archived by the government, others are in progress while some have not been initiated. Tabled below is a status update on the 2018 NFIs.
Generic Table 23: Generic NFIs
Non-Financial Instructions Status
Revenue generating agencies to provide regular updates on their revenue collections, retaining 10.0 per cent of the revenues and remitting 90.0 per cent to CRF.
Achieved.
Agencies with standalone payroll system to be migrated on the Alesco. DPM to take lead in consultation with Treasury.
In progress.
Finance to roll out IFMS to all provinces in 2019. In progress.
Department of National Planning and Monitoring (DNPM) to oversee effective implementation of Monitoring and Evaluation of Projects by implementing agencies.
Achieved.
Planning and Monitoring to enforce improvement in scoping of projects by agencies.
In progress
As per the General Orders, agencies are to do away with casuals by re-categorizing the positions.
In progress

2019 National Budget, Volume 1
110
Specific Table 24: Specific NFIs
Agency Non-Financial Instructions Status
Department of Labor and Industrial Relations (DLIR)
Treasury and DPM to work closely with DLIR to conduct a review on the Independence Fellowship Scheme and advise whether to move the program to an agency that provides similar function. A status report to be provided in the 2018 second quarter budget review.
Achieved.
Registrar of Political Parties
Review the statutory payment in the OLIPAC. A report to be provided in the 2018 second quarter budget review.
In progress.
Department of Defence
To work with Central Agencies on a retirement plan for their retired employees. A status report to be provided in the 2018 first quarter budget review.
Achieved.
Department of Health
To conduct an audit on procurement of Medical supplies and distribution and conduct baseline study on the community, district and provincial hospital. A status report to be provided in the 2018 first quarter budget review.
Achieved.
National Volunteer Services
To engage with the key central agencies (Treasury, DPM, Planning and Finance) and develop further on their activities
In progress.
Central Agencies
To ensure that Provinces receive their grants on monthly basis.
Achieved.
Registrar of Political Parties
Review the statutory payment in the OLIPAC. A report to be provided in the 2018 second quarter budget review.
No work in progress.
Department of Defence
To work with Central Agencies on a retirement plan for their retired employees. A status report to be provided in the 2018 first quarter budget review.
No work in progress.
Department of Lands and Physical Planning
o To revive the Land Taskforce to monitor land issues. The committee to engage an IT firm for IT assistance. Also, that the Departmental Head be held accountable for the following activities: 1. Land acquisition 2. Land Compensation claims 3. Ongoing land acquisition claims.
o Re-establish revenue raising initiatives (Land Rentals). Provide a report on the status in the 2018 first quarter budget review.
No work in progress.
Department of Provincial and Local Level Government
To coordinate a program on building of Provincial Headquarters. A status report to be provided in the 2018 first quarter budget review to Department of National Planning and Monitoring.
No work in progress.
National Volunteer Services
To engage with the key central agencies (Treasury, DPM, Planning and Finance) and develop further on their activities.
No work in progress.
Amalgamation- the amalgamation exercise is being carried out by the Public Sector Organizational Reform Team (PSORT) chaired by the Secretary of Department of Personnel Management. Work is in progress by PSORT for all agencies considered for amalgamation.

2019 National Budget, Volume 1
111
Table 25: Update on Amalgamating Agencies
Agency Merged into Status
Coastal Fisheries Development Agency
National fisheries Authority In progress
National Economic Fiscal Commission
Department of Treasury In progress
National Aids Council Secretariat
Department of Health In progress
National Coordination of Bougainville affairs
PM & NEC In progress
Integrated Financial Management system
Finance and ICT In progress
National Tripartite Consultative Council
Department of Labor and Industrial Relations.
In progress
National Narcotics Bureau Department of Justice and Attorney General (DJAG)
In progress
Office of Urbanization Department of Lands In progress
Border development Authority Department of National Planning and Monitoring, Treasury and Department of Provincial and Local Level Government Affairs (DPLGA)
In progress
Department of Public Enterprise
Department of Treasury In progress
PNG Research Science and Technology Secretariat
Department of Higher Education Science and Technology
In progress
Konebada Petroleum Park Authority
Abolish the agency, Policy to be under Treasury and management under Kummel Petroleum
In progress
6.6 TRUST ACCOUNTS
This section provides a summary of balances for Budget Funded Trust Accounts (Trust Accounts) as at 30th September 2018. These trust accounts contain funds appropriated through Additional Priority Expenditure (APE) and the Annual Budget. The purpose of holding funds in trust accounts is to spread public investment spending overtime to manage inflationary and demand pressures in the economy and to provide time for implementing agencies to properly design implementation strategies. Reforms in Trust Accounts Over the recent years there have been reforms in the management and operation of Government Trust Accounts. Following are the trust accounts reforms;
1. CLOSING OF TRUST ACCOUNTS Major data cleansing was carried out on all accounts, both the Budget Funded Trust Accounts and Others. Approximately 115 trust accounts were listed for revocation which is still pending the decision of the PMMR Team for closure.
2. EXPIRED TRUST ACCOUNTS All expired trust accounts were closed in 31.12.2017 with restrictions placed on all trust accounts at the bank. Agencies that have funds tied to any projects were given discretions

2019 National Budget, Volume 1
112
based on justification provided to substantiate their claims to the Secretary for Finance to be deliberated by the Agency and the PMMR team.
3. NEW PROCES OF ESTABLISHING TRUST ACCOUNTS The Department of Finance has achieved much in the past three years. These include legal reforms (PFMA and PMMR) and the increase use of technology to support effective public financial management. As such all trust accounts are expected to be on Integrated Financial Management System (IFMS) by the end of 2020. The reformed processes of establishing new Trust Accounts include: Establishment of Trust Accounts done in close consultation with state solicitor; All trust accounts are gazetted, and copies of gazettal notice is given to the banks with conditions applied to each account.
4. COURT BAIL REFUNDS A new business process is implemented for cashless payment for court bail refunds throughout the country. All payment will be made through EFTPOS or Direct Transfer to the accounts. This is currently work in progress and is piloted in East New Britain Province (ENBP) with the intention to roll out to other provinces in future.
Since 2005, up to and including the 2018 Budget, a total of K12,372.0 million has been paid into trust accounts for implementation of priority expenditure programs. The Trust Accounts have largely been funded from additional mineral revenue in supplementary budgets prior to 2018 and from annual budgets. Table 26 shows a summary of the movement of funds in and out of Budget Funded Trust Accounts from 2005 up to 30th September 2018. Table 26: Summary of Trust Accounts Movements: 2005 – 30th September 2018 (Kina, Million)
Year Deposits from
Additional Priority Expenditure
Deposits from Annual Budgets
& Interest
Spending from Trust Accounts
Net Savings (Deposits
less Spending)
2005 400.0 0.0 0.0 400.0
2006 568.4 0.0 0.0 568.4
2007 1,283.0 0.0 76.0 1,207.0
2008 1,501.4 36.5 480.5 1,057.4
2009 0.0 627.2 2,365.9 -1,738.7
2010 0.0 887.2 818.3 68.9
2011 628.5 598.2 1,426.3 -199.6
2012 398.0 428.0 1,095.0 -269.0
2013 285.8 450.0 537.1 198.7
2014 0.0 209.2 244.8 -35.6
2015 0.0 1,019.5 1,345.5 -326.0
2016 0.0 456.0 0.0 456.0
2017 420.0 802.0 826.3 395.7
2018 0.0 701.7 631.9 69.8
Total 5,485.1 6,215.5 9,847.6 1,853.0 Source: Dept. of Finance and Dept. of Treasury
*Deposits reported against year appropriated, spending reported by calendar year.
6.7 APPROPRIATION FOR TRUST ACCOUNTS: 2017 – 2018
A total of K1,092.0 million was appropriated for the main 2018 Programs to be administered under Trust Accounts in the 2018 Budget. The information below relates to the Trust appropriations for the 2018 government priority programs in the 2018 Budget. The actual amounts paid into 2018

2019 National Budget, Volume 1
113
budget funded government programs are reported against their trust appropriations as presented in the table below, the difference being Appropriations Yet to Be Released, which would be paid when funds become available later in 2018. Also note that funds actually expended out from the appropriations received has been reported. Hence, the difference between appropriation paid into trust and the Actuals expended from trust is still remaining and would be expended when need arises. The main 2018 programs that are administered through Trust Accounts are Tuition Fee Free Education Policy, 2017 National Elections and 2018 APEC. Hence the total amount on Trust Administered in 2018 is K701.7 million as shown in Table 27 below. Some of the major areas of funding from trust accounts include, PNG LNG Additional Equity, LNG Infrastructure Development Grants, LNG High Impact and Restoration and Development Grant for ABG.
Table 27: Appropriation of 2018 Programs Administered Through Trust (Kina, Millions)
Programs Appropriation Appropriation (Paid into
Trust)
Actuals (Expended from Trust)
Approp. Yet to Be
Released
Tuition Fee Free Education
602.0
505.0
461.3
97.00
2017 National Elections 110.0 20.1 3.9 89.91
2018 APEC 380.0 176.6 166.7 203.36
Total 1,092.0 701.7 631.9 390.27 Source: Department of Treasury and Department of Finance Note: The quality and effectiveness of spending from trust accounts is unclear as there is lack of detail expenditure reports from implementing agencies. Also, information on trust movements for 2018 reflects January up to September 2018 in Table 25. More updated information on the trust movements in 2018 will be provided in the 2018 Final Budget Outcome (FBO) Report.
6.8 TRUST ACCOUNT FUND MOVEMENTS IN 2018
Part of the full movements of funds have being reported in the Mid-Year Economic and Fiscal Outlook (MYEFO) report to 30th June 2018. And a more detailed report of trust accounts including debit and credit for 2018 will be provided in the 2018 FBO report at the end of the year. Also note that the 2018 APEC trust account funds and the 2017 National Election funds were not included in the MYEFO report however, are now been reported below. The opening balance of Budget Funded Trust Accounts from 1st January 2018 totalled K144.3 million and closing balance as at 30th September 2018 totalled K547.2 million. Table 28 shows the movements of funds from the Budget Funded Trust Account balances from 1st January up to 30th September 2018. Table 28: Movement of funds in Trust Accounts 1st January 2018 to 30th September 2018
(Amounts in Kina)
Trust Code
Trust Name Balance 1-Jan- 2018
Receipts Year to Date
Payments Year to Date
Balance as at 30-Sept-18
486 Outstanding Special Support Grants (Pre-2005)
50,000 0 0 50,000
519 Gov’t Funding of Rehab of Higher Ed. Sector
10,360,548 8,179 1,393,405 8,975,322
524 Lae City Roads Rehabilitation Trust- Subsidiary
2,138,725 4,184 123 2,142,786
524 Central City Redevelopment 26,787,917 30,145 60 26,818,001
526 Gov’t Funding of Resettlement of Volcano
0 0 0 0
528 Hosp. & Health Care Centre Rehab. Trust - POMGH Sub 2
252,377 787 420 252,744

2019 National Budget, Volume 1
114
Trust Code
Trust Name Balance 1-Jan- 2018
Receipts Year to Date
Payments Year to Date
Balance as at 30-Sept-18
562 Highlands Highway Rehabilitation T/A Subsidiary
47,399 378 392 47,382
582 Madang Marine Park Development T/A Subsidiary
2,374,497 5,338 2,378,519 1,316
591 Transport Sector-Central City Redevelopment
26,807,896 10,136 30 26,818,002
624 Infrastructure Development Grant (UBSA) Trust Account
49,115,200 0 0 49,115,200
624 Infrastructure Development (UBSA) Account Subsidiary
1,390,647 1,561 243 1,391,965
626 Coastal Vessels Account 140,000 0 0 140,000
648 PNG High Impact Infrastructure Projects
16,908 0 0 16,908
648 PNG High Impact Infrastructure Projects Subsidiary
683,012 726 82 683,656
659 Port Moresby Roads 49,648 0 0 49,648
659 Port Moresby Roads Subsidiary
322,433 0 36 322,397
666 Mining Legal Costs T/A Subsidiary
106,323 0 11 106,312
677 MOA Outstanding Liabilities Trust A/C Subsidiary
27,112 0 12 27,100
686 Kokopau to Arawa Rd Upgrading and Bitumen Sealing T/A
35,093 0 0 35,093
690 Aiyura National High School (Renovation and Upgrading) T/A Subsidiary
122 0 0 122
695 Trans East-West New Britain Highway T/A
72,371 0 0 72,371
713 Tuition Fee Free Education T/A
12,470,290 505,000,000 461,316,146 56,154,144
713 Tuition Fee Free Education Trust - Subsidiary
4,881,687 311,671,162 312,393,917 4,158,932
717 2015 South Pacific Games Trust Account Subsidiary
74,386 2 155 74,233
723 PNG LNG Development Cost T/A
5,600.0 0 0 5,600.0
723 PNG LNG Development Cost Subsidiary
0 0 0 0
729 PNG LNG Additional Equity 699,344 0 0 699,344
737 PNG Fire Service Infrastructure Program (PIP) T/A
321,941 0 299,580 22,361
747 LNG Pipeline Infrastructure Development Grant (IDG) T/A
11,718 0 46 11,672
754 Public Service Audit Program T/A
522,358 358 27,495 495,221
757 Restoration and Development Grant T/A
4,020,524 30,500,000 22,100,000 12,420,524
757 Restoration and Development Grant Subsidiary
3,219 0 36 3,183
761 HELA Transitional Authority Infrastructure Development
98,466 0 36 98,430
772 Trade Skills Scholarships 227,207 13 127 227,093
861 Sports Infrastructure Trust Account
111,956 0 0 111,956
870 2017 National General Election Finance Procurement
65,754.00 20,092,400 3,784,100 16,374,054
887 Asia Pacific Economic Countries-Authority
0 146,636,469 144,953,648 1,682,821

2019 National Budget, Volume 1
115
Trust Code
Trust Name Balance 1-Jan- 2018
Receipts Year to Date
Payments Year to Date
Balance as at 30-Sept-18
888 Asia Pacific Economic Countries-Security
0 30,004,000 21,779,630 8,224,370
895 Health Services Sector Development Trust –
0 330,033,003 0 330,033,003
Total 144,292,678 1,373,998,841 970,428,240 547,233,280
Source: Department of Finance
Following is a summary of expenditure for Budget Funded Trust Accounts for the period 1st January – 30th September 2018 where more than K5.0 million was expended. Extract was taken from the table 26 which shows the movements in these Budget Funded Trust Accounts for the period 1st January – 30th September 2018.
• A total of K773,710,063 was spent from the Tuition Fee Free Education trust account for the Free Education Policy around the country.
• K166,733,278 was expended for the 2018 Asia Pacific Economic Countries (APEC) summit and other APEC Authority preparations.
• K22,100,000 was spent from the ABG Restoration and Development Grant Trust during this period in relation to impact projects associated with the ABG Restoration and Development program in the Autonomous Region of Bougainville.
One of the government priority expenditure in 2018 and going forward until 2022 is the 2018 Earthquake disaster recovery and restoration works for the three provinces (HELA, Southern Highlands and Western province) devastated by the 7.5 magnitude earthquake in March 2018. The trust account used to administer earthquake disaster recovery and restoration efforts is called the 2018 Earthquake Disaster Restoration Trust Account. This trust account is reported separately from other trust accounts because it contains funds contributed by Government, various corporate organizations and able-willing public citizens. Hence, budgeted receipts and expended funds could not be clearly distinguished. However, the table 29 shows the receipts into and payments out of the Earthquake account. Table 29: Receipts into and payments out of the 2018 Earthquake Disaster Restoration Trust
Account (March 2018 – 30th September 2018)
Trust Account Debits (Receipts into Trust)
Credit (payments from Trust
Trust Balance
2018 Earthquake Disaster Restoration Trust Account
95,335,293.49 75,932515 19,402,778
Source: Department of Finance
2019 National Budget, Volume 1
116
CHAPTER 7: TAX EXPENDITURE
7.1 OVERVIEW
The 2019 Budget marks the second year of reporting tax expenditure as part of the Government’s effort to strenghten governance and promote transparency consistent with the Fiscal Responsibilities Act 2006 and the MTRS 2018 – 22. In the 2018 Budget, the tax expenditure report covered incentives provided under the Goods and Services Tax (GST) and the Infrastructure Tax Credit. In 2019, reviews will be undertaken on a number of tax incentives existing in the tax legislation. The 2019 Budget coverage of the Tax Expenditure Statement (TES) has been extended to capture additional tax incentives provided in the Income Tax Act, 1959, Goods and Services Act, 2003, Customs Tariff Act, 1990 and Excise Tariff Act, 1956. The data presented below are statistics as reported by the tax payer when lodging tax returns and, as such, may be inaccurate. In most cases, the reported numbers refer to the quantum of incentives that are applicable rather than the actual revenue foregone to the Government. The actual evaluation of revenue foregone to the Government also needs to take account of the revenue and other economic benefits created by these incentives to assess whether the incentives have provided net benefits to PNG. This will form the basis of any policy review of the incentive regime. Also, when reviewing aspects of the general taxation system, account needs to be taken of whether assessments of revenue foregone alone are appropriate, given that the incentives apply to all taxpayer categories as part of the taxation system design which may be standard around the world for both social reasons and competitiveness. For example, in GST, the zero rating of exporters is a standard design of GST regimes around the world and, as such, would normally not be considered as lost revenue. Similarly, the progressive income tax system that favours lower income taxpayers does not measure the lower tax bands compared to the higher bands generally as revenue forgone to government. Of greater interest, however, will be to review specific concessions to individual entities or interest groups, and the trends in concessional amounts as the basis then for reviewing outcomes such that assessments can be made of net benefits or costs. Tax expenditure reporting provides initial data to commence this review process and, as such, should not be used in isolation of the review process. Nevertheless, initial measurement of these taxation elements does provide some transparency which assists improved policy design. Importantly, the calculation of actual revenue foregone from these tax incentives requires computerised analytical tools and an exercise of this magnitude is time consuming and data intensive. Therefore, in the modelling exercise, tax expenditure statements will be phased, taking a few incentives at a time. Each subsequent issue of the TES will also revisit the models previously undertaken and try and improve the accuracy of the estimates.
7.2 TAX EXPENDITURE STATEMENTS (TES)
There are a number of tax incentives provided by the Government to tax payers in order to achieve a particular public policy objective. Tax incentives are provided through the tax system to attract and retain investments in the domestic economy. Such incentives can potentially result in revenue foregone to Government. This potential revenue foregone is deemed as tax expenditure.

2019 National Budget, Volume 1
117
Generally, tax expenditures may be defined as redirected government spending through the tax system such as tax holidays, additional deductions, tax credits and reduced tax rates, generally in pursuit of government policy. Further, there are incentives provided in the tax system which do not result in direct revenue foregone. The accelerated depreciation allowances allow tax payers to write off depreciation costs at a faster rate than is normally allowable under the normal depreciation regime. In this case, tax payers deduct higher amounts from their assessable income in the starting years of the investment thereby incentivising the tax payer to delay the tax payment to the Government. It is difficult to quantify such tax incentives because of the time value of money aspect. Therefore, values are not estimated in the Tax Expenditure Statement (TES). However, some tax expenditures erode the tax base permanently, particularly when the provision of tax expenditures in the tax legislation does not achieve the intended positive policy outcomes where net benefits can be achieved. In order to ascertain whether those tax expenditures achieve the stated objectives, it is important to initially document those tax expenditures. The reporting of the TES now is a first step towards the process of determining if the policy objectives are achieved and if there are net benefits to PNG. Further work will be done in 2019 to see if these tax expenditures have achieved their respective policy outcome. The TES reporting will then also assist the review into the tax incentives in 2019 which will involve quantitative and qualitative analyis to quantify the benefits generated from tax incentives. The tax expenditure reported here covers 2015 to 2017 as there is insufficient information for past years for most tax incentives. The total tax expenditure estimated below accrues from the specific tax arrangements outlined below.
7.3 TAX INCENTIVES IN THE INCOME TAX ACT 1959
1) Double Deduction – Staff Training
Wages to staff that are registered as apprentices with the National Apprenticeship and Trade Testing Board, staff attending full time professional training courses at a Government Training Institute or a prescribed teritiary place of education, and staff engaged wholly and exclusively in educational activities that are not related to the business of the tax payer – are allowed twice the expenditure amount as a deduction, but only to the extent that the tax savings from such additional deductions is up to 75.0 per cent of the expenditure and not more. This is done to incentivise private expenditure on upskilling the labour force in PNG. This incenitve was repealed on 1 Janaury 2018.
Tax Expenditure (K' Million) 2015 2016 2017
Estimate 140.0 165.0 162.0
Legislative Reference: Section 72(A) of ITA 1959 Source: Internal Revenue Commission
2) Amortization – Exploration expenditure Petroleum and gas companies can elect at the end of each year of income to bring in exploration expenditure incurred outside of the project operation during that same year of income and claim this expenditure as a deduction against the project income. The amount allowed as a tax deduction should not exceed the lesser of 25.0 per cent of the un-deducted pool balance.

2019 National Budget, Volume 1
118
Tax Expenditure (K'Million) 2015 2016 2017
Estimate 279.0 7.2 0.0
Legislative Reference: Section 155N of the ITA Source: Internal Revenue Commission
3) Infrustructure Tax Credit Scheme (ITC) Under the ITC scheme, mining, petroleum or gas operators and taxpayers engaged in primary production and the tourism industry are allowed to offset expenditure on approved infrastructure development projects against their tax liabliities, and credits can be claimed as the lesser of the expenditure made for taxpayers enaged in mining, petroleum or gas operations.
Tax Expenditure (K' Million) 2015 2016 2017
Estimate 112.3 50 89
Legislative Reference: Section 219 of the Income Tax Act 1959 Source: Internal Revenue Commission
4) Additional Depreciation – Primary Production Capital expenditure incurred by a tax payer on acquiring the following types of new plant or equipment is provided with a 100.0 per cent deduction: (a) property used directly for agriculture production; (b) property used for fishing by residents engaged in commercial fishing; (c) boats or ships and ancillary equipment used as dive boats by an accredited scuba diving/snorkeling operator. Note that the additional depreciation does not extend to all primary production activities, namely logging and forestry for commerical purposes.
Tax Expenditure (K' Million)
2015 2016 2017
Estimate 100.0 55.0 60.0
Legislative Reference: Section 73(9) of the Income Tax Act of 1959 Source: Internal Revenue Commission
5) Additional Depreciation – Non-oil fired plant (converted) This deduction allows for a 30.0 per cent additional depreciation rate in the initial year when the cost of capital was incurred, when an oil-fired plant or equipment is replaced by a non-oil fired plant or equipment to incentivise fuel conservation and sustainable production.
Tax Expenditure (K' Million)
2015 2016 2017
Estimate 80.0 83.0 50.0
Legislative Reference: Section 73(5) of the Income Tax Act of 1959 Source: Internal Revenue Commission
6) Interest Withholding Tax Exemption This incentive allows certain interest-earning entities and assets to be exempted from interest withholding tax at the rate of 15.0 per cent. This includes interest earned on long-term bonds, BPNG authorised foreign currency deposits and the participants and lenders to the PNG LNG project.

2019 National Budget, Volume 1
119
Tax Expenditure (K' Million)
2015 2016 2017
Estimate 60 90 60
Legislative Reference: Section 35 of ITA 1959 Source: Internal Revenue Commission
7) Export sales
This incentive offers an exemption on income from the sale of qualified export goods prescribed under the Income Tax Regulation (Regulation 10A).
Tax Expenditure (K' Million) 2015 2016 2017
Estimate 135 61 13
Legislative Reference: Section 45B of ITA 1959 Source: Internal Revenue Commission
8) Income Tax Incentive for Fishing Operations
Fishing operations have an incentive whereby income tax/salary and wages tax for employees of non-residential companies carrying out fishing operations are exempt. This applies only to fishing operations under an Agreement with the State.
Tax Expenditure (K' Million)
2015 2016 2017
Estimate 37 37 41
Legislative Reference: Section 35 of ITA 1959 Source: Internal Revenue Commission
9) Additional Depreciation – Industrial Development This incentive allows for a depreciation deduction. When a taxpayer adds an industrial plant in Papua New Guinea that has not been previously used in the country, then the taxpayer may elect in any year to increase the amount of depreciation deductions by the lesser of the amount of the taxpayer's income remaining after all other deductions, or the remaining depreciable value of the plant.
Tax Expenditure (K' Million)
2015 2016 2017
Estimate 40.0 60.0 12.0
Legislative Reference: Section 73(7) of the Income Tax Act of 1959 Source: Internal Revenue Commission
10) Dividend Withholding Tax
Petroleum and gas companies were exempted from the payment of dividend withholding tax on dividend payments to their shareholders, whereas mining companies pay a dividend withholding concessional tax rate of 10.0 per cent on dividend payments to their shareholders instead of the regular regime of 17.0 per cent. However, this exemption was repealed in 2017 and a rate of 15.0 per cent now applies across all sectors of the economy.
Tax Expenditure (K'Million)
2015 2016 2017
Estimate 41 32 35
Legislative Reference: Section 42(3) of ITA 1959 Source: Internal Revenue Commission

2019 National Budget, Volume 1
120
11) Amortization – Allowable capital expenditure This is an additional deduction provided to PNG LNG Project participants. If the project has not reached an R-factor of between 1.91 and 2.36 at the end of year 10 of production, additional deductions of between 10.0 per cent and 50.0 per cent of original capital expenditures can be allowed.
Tax Expenditure (K'Million)
2015 2016 2017
Estimate 82.0 3.0 0.0
Legislative Reference: Section 158J of Income Tax Act of 1959 Source: Internal Revenue Commission
12) Research and development expenditure A taxpayer is allowed a 150.0 per cent deduction on expenditure incurred on scientific research and development (R&D) to encourage scientific research and development as part of the green revolution policy in 2003. This incentive was repealed in 2014 but the outstanding R&D expenditure claims are yet to be assessed. Most the oustanding R&D expenditure will be deliberated by the Commissioner General commencing 2019.
Tax Expenditure (K'Million)
2015 2016 2017
Estimate 23.0 29.0 24.0
Legislative Reference: Section 95(1) of Income Tax Act of 1959 Source: Internal Revenue Commission
13) Rural development incentive Section 45I of ITA provides an income tax exemption on the net income of new businesses set up in specifically designated under-developed areas that are not dependent on the exploitation of natural resources. Income earned by “rural development industries” (as defined under the ITA) is exempt from income tax for ten (10) years after the year the business commences operation. Losses arising from the exempt activities may be deducted against taxable income from other activities. The scheme is only available to new businesses in the specific rural districts listed in the Regulations.
Tax Expenditure (K' Million)
2015 2016 2017
Estimate 0 22 25
Legislative Reference: Section 45I of ITA 1959 Source: Internal Revenue Commission
14) Additional Depreciation – General Section 72(B) of the ITA provides a specific deduction that allows eligible businesses to choose a method of depreciation for new assets acquired – either straight line or depreciating value – and then additionally deduct 20.0 per cent of the cost price of the asset in the initial year of the employment of the asset. In the case of the tourism industry, 55.0 per cent may be additionally deducted. This reduces the taxable income in the first year of capital investment, to allow the investor to recuperate their investment quickly. The Government forgoes revenue in the first year of the new asset for tax paid at a later date.

2019 National Budget, Volume 1
121
Tax Expenditure (K'Million)
2015 2016 2017
Estimate 21.0 7.0 8.0
Legislative Reference: Section 72(B) of Income Tax Act of 1959
Source: Internal Revenue Commission
15) Gifts Section 69 of the ITA describes a series of expenditures or donations to charitable organizations and other social causes to be allowed either as a direct deduction or in some cases a double deduction from the assessable income of a tax payer. Some of the these events include gifts to political parties, sporting bodies, South Pacific Games 1991 (repealed), foundations for law, order and justice, charitable bodies, national day celebrations, law and order, Pacific Games 2015, relief aid for natural disasters and national day celebrations.
Tax Expenditure (K'Million)
2015 2016 2017
Estimate 16.0 0.8 0.3
Legislative Reference: Section 69 of ITA 1959 Source: Internal Revenue Commission
16) Primary production development expenditure A 100.0 per cent deduction under Section 97A of the ITA for expenditure by a resident taxpayer engaged in primary production (definition of primary production provided in the regulations). Tax deductions available to agricultural companies for expenditure on agricultural development under this section and for depreciation of agricultural plant and equipment can be passed through directly to shareholders for deduction at shareholders’ marginal tax rates.
Tax Expenditure (K' Million)
2015 2016 2017
Estimate 15.0 1.5 0.0
Legislative Reference: Section 97A of Income Tax Act 1959 Source: Internal Revenue Commission
17) Remote banking services
The cost of providing extended and new banking facilities or services in areas not adequately supplied with bank services as income tax paid which can be offset against income tax liability for the year the cost was incurred. Any excess can be carried forward to be offset against the succeeding years tax liability. This incentive expired in 2016.
Tax Expenditure (K ‘Million)
2015 2016 2017
Estimate 6 10 0.0
Legislative Reference: Section 219D of the ITA Source: Internal Revenue Commission
18) Additional Depreciation – Non-oil fired plant (acquired) This deduction allows for a 30.0 per cent additional depreciation in the initial year when the cost of capital was incurred, when a non-oil fired plant or equipment is acquired (purchased) for production.

2019 National Budget, Volume 1
122
Tax Expenditure (K'Million)
2015 2016 2017
Estimate 6.0 5.0 3.0
Legislative Reference: Section 73(6) of the Income Tax Act of 1959 Source: Internal Revenue Commission
19) Educational expenses (individuals only) Section 70A of the ITA, provides an allowable deduction from income tax for the amount of net education expenses incurred by a resident taxpayer in connection with the education of a dependant child.
Tax Expenditure (K'Million)
2015 2016 2017
Estimate 1.0 2.0 0.6
Legislative Reference: Section 70A of ITA 1959 Source: Internal Revenue Commission
20) Primary production 150.0 per cent extension services A 150.0 per cent deduction for expenditure on agricultural extension services undertaken under an approved plan. Extension services must be undertaken under a plan approved by a committee chaired by the Department of Agriculture and Livestock.
Tax Expenditure (K'Million)
2015 2016 2017
Estimate 0.5 0.4 0.0
Legislative Reference: Section 97B(1) of the ITA Source: Internal Revenue Commission
21) Amortization – Exploration expenditure (Mining)
Mining companies can elect at the end of each year of income to bring in exploration expenditure incurred outside of the project operation during that same year of income, and claim this expenditure as a deduction against the project income. The amount allowed as a tax deduction should not exceed the lesser of 25.0 per cent of the undeducted pool balance or such amount that would reduce income tax payable by 10.0 per cent.
Tax Expenditure (K 'Million)
2015 2016 2017
Estimate 0.8 0.0 0.0
Legislative Reference: Section 156D of Income Tax Act of 1959 Source: Internal Revenue Commission
22) Double deduction – Export market development and Tourism
Section 72(C) of the ITA provides that, subject to the Commissioner General’s determination, an expenditure incurred by a tax payer on export market development or for the development of tourism (i.e. general expenditure incurred in the production/manufacturing of goods and services for export or a general expenditure incurred towards promoting tourism) is allowed twice the amount of expenditure as a deduction but only to the extent that the tax savings from such additional deductions is up to 75.0 per cent of the expenditure and not more. This is done to incentivise manufacturing of products for the export market. Qualifying expenditure includes overseas publicity and advertising, market research, tender preparation, samples, trade fair expenses, overseas sales office expenses and certain travel costs.

2019 National Budget, Volume 1
123
Tax Expenditure (K'Million) 2015 2016 2017
Estimate 0.5 0.1 0.1
Legislative Reference: Section 72(C) of ITA 1959 Source: Internal Revenue Commission
7.4 GOODS AND SERVICE TAX (GST) ACT 2003
1) Zero Rating of GST
Suppliers under the GST structure may be eligible to get refunds on certain amounts of the GST payment depending on the type of sale and purchase made. There are two kinds of GST incentives in the GST law. The first incentive is to zero rate sales (i.e. sales of goods that are charged GST at zero per cent of the sale price but claim credits for GST paid on the inputs); and the other incentive is to exempt sales from GST (whereby no GST is charged for the provision of goods or services and no GST credit claimed for the GST paid on the inputs). The following categories of sales fall under the zero rating regime in PNG: exported goods and services; perishable goods bought for consumption outside of PNG; supply of prescription medical equipment, prescription drugs and lenses; supply of goods and services to a mining, petroleum or gas company (exception: cars); and supply of unprocessed crude oil. In addition, a small category of sales are exempt from applying GST and these are: supply of financial services; supply of educational services; supply of medical services; and supply of housing or a motor vehicle to an employee as part of an employment contract.
Tax Expenditure (K' Million)
2015 2016 2017
Estimate 2,099.8 2,183.9 1,657.0 GST exempt sales (output debit 417.5 547.4 405.9 GST zero rated sales 1,643.9 1,596.7 1,219.9 Deferred import liabilities - 1.98 0.6 GST exempt sales (input Credit) 38.5 37.9 30.6
Legislative Reference: Division 6, section 19 of the Goods and Services Act 2003
Source: Internal Revenue Commission
7.5 TAX INCENTIVES ADMINISTERED BY THE CUSTOMS TARIFF ACT 1990
1) Import GST Exemption
Import Goods and Services Tax exemptions are prescribed under section 7 of the Goods and Servcies Act 2003 and these are as follows: imports of goods where a supply of the goods would be exempted under section 25 or zero rated under section 19 or 21; the duty free allowance for passsengers and their accompanied baggage under Customs (Personal Effects) Regulation 1995; import of goods which have been declared exempt from Goods and Services Tax 2003 by virtue of the provisions of section 25(8); imports of goods by a diplomatic mission for the official use of the mission; and imports of goods by a diplomatic agent defined in Article 1 of the Vienna Convention on Diplomatic Relations.
Tax Expenditure (K'Million)
2015 2016 2017
Estimate 376 371 488
Legislative Reference: Division 1, Section 7 of the Goods and Service Tax 2003 Source: Internal Revenue Commission

2019 National Budget, Volume 1
124
2) Import Excise Exemption The Head of State, acting on advice of the National Executive Council under section 3 of the Excise Tariff Act 1956, may, by notice in the National Gazette exempt from excise tariff goods or substitute a reduced rate of duty in respect of any excisable goods.
Tax Expenditure (K ‘Million)
2015 2016 2017
Estimate 11 27 40.0
Legislative Reference: Section 3 of the Excise Tariff Act 1956 Source: Internal Revenue Commission
3) Import Duty Exemption The Head of State, acting on advice from the National Executive Council under section 9 of the Customs Tariff Act 1990, may, by notice in the National Gazette exempt from customs tariff goods or substitute a reduced rate of duty in respect of any imported goods.
Tax Expenditure (K'Million)
2015 2016 2017
Estimate 22 24 21
Legislative Reference: Part IV, section 9 of the Customs Tariff Act 1990
Source: Internal Revenue Commission
7.6 PNG LNG TAX EXPENDITURE ESTIMATES
This section briefly summarizes the tax expenditures provided to the PNG LNG project and the estimated revenue forgone.
1) Dividend witholding tax exemption The project and consequently its partners are exempt from paying dividend witholding tax. As a result, the project partners have not recorded any DWT returns which makes it hard to estimate dividends paid out from the project. Assuming that the entire amount of income from the ring-fenced project is declared as dividends to share holders of the project, it is still difficult to estimate the quantum of dividends paid out in a year since that depends on accounting profit and dividend paying schedules of individual companies. While the operating profit or tax accounting profit might be used as a base for estimating the total quantum of dividends, the actual dividend payout depends on the company’s decision on retained earnings and re-investment which is not possible to estimate. As such the number of assumptions it would require to estimate the dividend witholding tax revenue foregone would outweigh the accuracy of the result.
2) Allowable Capital Expenditure (ACE) and Allowable Exploration Expenditure (AEE)
The ACE and AEE provisions of the PNG LNG agreement do not qualify as an exemption as these pooling methods of capital deductions would be available under a normal income tax regime.

2019 National Budget, Volume 1
125
In the normal income tax regime, deductions for capital incentives are allowed through a prescribed schedule of depreciation rates and effective life. In the interest of administrative ease – the resource companies in general are allowed to pool their capital expenditure as one and deduct through either a straight line or declining balance method. The total quantum of depreciation remains the same over the life of the project, whether it was depreciated through the ACE/AEE method or the normal method of depreciation. There are, however, revenue implications with regards to timing of these deductions, which could represent a cost of the state. In practice these are extremely difficult to quantify even in elaborate and complex expenditure statements and, as such, will not be evaluated for the time being.
3) Additional Capital Expenditure As per the contract agreement, the additional capital expenditure incentive allows project companies to include any captial expenditure made in relation to purchase, charter, lease or hire, of any ship or aircraft to be included in the ACE which would not otherwise be an expense deductible. However, the returns do not separately bifurcate ACE into the additional ACE and a reasonable assumption towards a share of deductions going towards additional capital expenditure is unavailable.
4) Interest witholding tax The contract exempts companies of the project from paying interest witholding tax. To estimate revenue foregone, the interest withholding tax is estimated at 15% of total interest payments (to resident and non-resident lenders). The additional cost of interest witholding tax is assumed as borrowing expense and added to operating costs. This will reduce the taxable income and correspondingly the corporate income tax calculation. The revenue foregone is the net result of the interest witholding tax and reduction in corporate income tax.
5) Thin capitalization The thin capitalization incentive allows a higher ceiling of interest deductions than would otherwise be allowed under the normal regime. As per the ITA section 68AH (normal regime) interest deductions are allowed up to a maximum equity to debt ratio of 1:2. For resource companies and PNG LNG participants, the interest deductions are allowed up to a maximum of a 1:3 ratio. In order to estimate the revenue foregone from extending the thin capitalization incentive, we assume that the equity to debt ratio is 1:326 and then calculate the interest expense ceiling in the event that section 68AH applied.
𝑖 −𝑖. 2𝐸
𝐷= 𝑖 −
2𝑖
3=𝑖
3
Where, i is the interest expense declared E is the project equity D is the project debt
6) 2% premium for FSC The income tax law in PNG provides for a 2% premium to be charged to companies if they wish to sign a fiscal stability agreement with the state. In the case of PNG LNG, this was
26 E to D ratio of greater than 1:2 means no excess interest deductions. E to D ration between 1:2 and 1:3 means

2019 National Budget, Volume 1
126
waived off. The calculation of the revenue foregone is simply the difference between the calculation of the corporate income tax rate at 30% and at 32%.
7) Additional Profits Tax The incentives provided under the additional profits tax regime cannot be estimated from the available data. The mandatory income tax returns do not require the tax payer to file details of the net cash flow which goes into the calcuation of the additional profits tax. Additional profits tax has not been paid to date.
8) Special tax credit scheme The special tax credit scheme refers to the infrastructure tax credit scheme which will be dealt with as a separate section within the TES.
9) Additional Deductions for exploration expenditures section 155N Section 155N of the Income Tax Act allows the tax payer to bring in exploration expenditure from outisde the ring fence of the project. This allows the tax payer to write off capital expenditure from related entities against the assessable income of the project allowing them to reduce tax liabilities. Revenue foregone is estimated by re-adding section 155N deductions to the non-deductible items to calculate taxable income.
10) Gross up factor The gross up factor is the factor used to uplift revenue foregone estimates to factor in undeclared income either as a result of non-compliance or as a result of an error correction in income esimates. The annual total income of each tax payer is calculated along with total incomes for 2015-2017 The average share of income (out of total income filed for three years) for each year for each of the fully compliant participants is calculated and used as a benchmark to attribute revenue. The total sales for each of the non-compliant tax payers is calculated from the share of income declared. The annual incomes for each of the non-compliant tax payers is recalculated The total estimated revenue foregone as a result of the modelling exercise is summarised in the table below: Tax Expenditure (K ‘Million) 2015 2016 2017
Estimate 449.1 277.0 504.3
2% FSA premium 21.2 0.5 20
155N deduction 14.8 0.8 9.6
IWT exemption 259.9 166.8 304.6
Thin capital. Exemption 153.2 108.9 170.1 Source: Internal Revenue Commission

2019 National Budget, Volume 1
127
7.7 CHALLENGES AND WAY FORWARD
There are a number of challenges in reporting TES. The biggest challenge is the avialability and quality of data. The data presented above does not fully represent the Government’s expenditure through tax incenitves as the numbers reflect tax payer filling which suffers from gross inacuracies as a result of human errors and omissions. However, it can be noted that the amount of tax expenditure is significant. Further, tax incentives are recognized as a policy tool to improve competitiveness in the market and target certain development policy goals . Measurement of tax foregone must be balanced with measurement of the benefits of the current tax incentives to determine the net outcome, whether positive or negative. Presenting both the benefits of the policy outcome and tax expenditure will demonstrate the effectiveness of tax incentives. In 2019, more work willl be done to improve data accuracy. The Government will continue to this work by:
i. Undertaking some cost benefit analysis (quantitative) to quantify the benefits generated from the tax incentives provided. Analysis will be made to see if there are any correlations between the incentives provided and benefits realized.
ii. Undertake the review of tax incentives (qualitative analysis) to benchmark the tax incentive regime in PNG against international practices. The quantitative and qualitative analysis will complete the PNG’s tax incentive review in 2019 with recommendations proposed for implementation in 2020 and going forward.

2019 National Budget, Volume 1
128
CHAPTER 8: FINANCING AND DEBT MANAGEMENT STRATEGY
8.1 FINANCING BACKGROUND TO THE 2018 BUDGET
The 2018 Budget was the first Budget in the new MTdS 2018-22 and it was formulated against the prevailing difficult financing environment. Previous budgets were financed through recourse to the domestic debt market. However, this market became quite illiquid by the end of 2017 with Government fiscal tightening and with net balance of payments inflows being accumulated in offshore accounts by large resource companies in line with respective fiscal agreements. Moreover, banks had reached prudential limits to the additional take-up of Government securities. Liquidity available in the market tended to be held in very short-term central bank bills or in banks’ exchange settlement accounts awaiting repatriation offshore when foreign currency was made available by BPNG, resulting in liquidity being tied up with the foreign exchange imbalance. With banks unable to fund the Government’s fiscal deficit in 2017, the budget was tightened with most of the reductions falling on the capital budget and, in the operational budget, through the accumulation of arrears. In the process, the BPNG also was exposed to Government lending. The challenges for fiscal policy were clearly apparent, and the impact of both the budget constraints and the foreign exchange imbalance adversely affected private sector growth as reported during Treasury Business Liaison Survey. To overcome these issues, the Government made strong commitments in 2018 to maintain fiscal discipline such that fiscal deficits would decline as a proportion of GDP over the term as planned. This would result in the debt to GDP ratio declining to 30.0 per cent by 2022. This would then allow for a coherent and well-designed MTdS to be formulated that would seek to fund the fiscal deficits over the horizon of the plan. At the same time, mitigate the financing risks that had been built up and provide a solution to the foreign exchange imbalance problem. All of these were to be achieved without adding significant debt service costs to the fiscal program. To meet these goals, the MTdS sought to engineer a major portfolio shift from the illiquid domestic debt securities to more liquid and longer term foreign currency debt, namely through the issuance of a sovereign bond (for volume and liquidity) and ADB/World Bank budget support loans (for volume at lower costs). It was also the goal of the program to restructure the domestic debt portfolio to lengthen its average maturity profile, thereby reducing financing risk. However, this goal will need to be delayed until the foreign exchange imbalance issue is solved and the current demand for debt redemptions has stabilised. Overall, in 2018, substantial progress was made in achieving the ambitious targets in the MTdS. This is quite remarkable given the devastating earthquake that struck PNG in February 2018. Despite this challenge, PNG not only had to lift itself back up, but also had to mobilise the administration and resources to undertake a successful inaugural sovereign bond issuance and to stage the world-class APEC Leaders’ Summit – which has been successfully achieved on time and on budget. The financing milestones achieved in 2018 included:
2019 National Budget, Volume 1
129
i. The successful negotiation and drawdown of the final tranche of the Credit Suisse
facility loan (US$190.0 million) which had been delayed from 2017, and further following the earthquake in early 2018;
ii. The successful negotiation of the US$300.0 million ADB Budget Support Loan over three years, of which the first tranche of US$100.0 million was disbursed in the September quarter 2018;
iii. The successful negotiation of the US$300.0 million World Bank Budget Support Loan, of which the programmed first tranche of US$100.0 million was increased to US$150.0 million in support of the earthquake remediation costs. The loan was approved by the Bank’s Board in November 2018 and is due to be disbursed prior to year-end 2018. This is the first budget support loan to have been negotiated with the World Bank in 18 years. The renewed partnership with both the ADB and the World Bank is a testament to the Government’s prudent fiscal program as incorporated in its Medium Term Fiscal, Revenue and Debt Strategies approved with the 2018 Budget; and
iv. The extremely successful sovereign bond issuance of US$500.0 million in early October 2018 at 8.375 per cent, which was against the background of rising US interest rates and a significant increase in emerging market uncertainty and rising yields. The bond was hailed as a great success by domestic and offshore financial commentators. The offers of well over US$3.0 billion for long term (10 year) notes for a first time issuer, such as PNG, again is a testament to the Government’s economic, fiscal and financial program.
The success of this external debt program in raising US$940.0 million in 2018 has allowed the financing mix to be favourably altered in 2018 and a substantial domestic debt redemption program to be initiated in late 2018. This domestic debt retirement program will underpin both the full funding of the 2018 net borrowing, as well as, major inroads into extinguishing the foreign exchange imbalance by providing the market with liquidity and the foreign exchange reserves to back it up. The altered financing mix for 2018 is shown in Table 26. Specifically, whereas the 2018 Budget financing program envisaged new net issuance of domestic securities of K373.8 million (Treasury Bills K30.2 million and Treasury Bond K343.6 million), the final financing mix is likely to involve net redemptions in domestic securities of K603.4 million (Treasury Bills – K303.4 million and Treasury Bond –K300.0 million). There are large maturities of both Treasury Bond occurring in November 2018 and Treasury Bills in December 2018. Financial institutions have indicated their intentions to redeem significant stock and the debt retirement plan will facilitate these demands. These domestic net debt redemptions and the estimated fiscal deficit financing requirement of K1,897.2 million for 2018 will be funded from the net external receipts of K2,500.6 million. Importantly, only half of the sovereign bond receipts will be utilised in 2018, with the other half carried forward in the Bond Trust Account in BPNG to fund the 2019 fiscal deficit and 2019 domestic debt retirement plan. In terms of the calculation of debt outstanding for statutory (FRA) debt to GDP purposes, the carried-forward Bond Trust Account cash balance has been netted off the debt outstanding amount. The resulting estimated debt to GDP ratio at end 2018 is 30.9 per cent which is significantly lower than the ratio projected in the 2018 Budget of 32.2 per cent.

2019 National Budget, Volume 1
130
The reduction reflects the modestly lower estimated fiscal deficit outturn for 2018 and the upward revision to nominal GDP. At 30.9 per cent (or 31.9 per cent if the Bond Trust Account balance is omitted from the calculation), debt levels are well within the FRA prescribed band of 30-35.0 per cent and are clearly meeting the FRA target which requires the ratio to trend towards 30.0 per cent by 2022. In terms of the composition of the debt portfolio, the success of the external debt raising program has meant that the MTdS target of a 35/65 split between external and domestic debt by 2022 has been reached in one year – 2018. At the end of 2018, it is estimated that the split between external and domestic debt will be 34.9/65.1 compared with a split of 27.1/72.9 at end-2017. While the targeted 2022 split of 50/50 between Treasury Bills and Treasury Bond has not, as yet, been reached in 2018, the deterioration has been halted. At the same time, the long-term nature of most of the new external borrowings and the redemptions of shorter term Treasury Bills have meant that the average length to maturity of the portfolio has increased, therein reducing refinancing risk somewhat. Table 30: Deficit Financing Projections by Instrument and Debt Outstanding 2017-18
Debt Instruments 2017 Outturn 2018 Budget 2018 Estimate
Domestic Net Financing 736.2 373.8 -603.4
Treasury Bills 530.9 30.2 -303.4
Treasury Bond 205.4 343.6 -300.0
External Net Financing* 878 1613.4 2,500.6
Sovereign Bond 0 640 1600.0
Less Bond Trust Bal 0 0 -800.0
Concessional Loans 802.4 337.4 337.4
New Instrument
593.9 594.0
Amortisation
-256.5 -257.0
Commercial 346.9 39.8 587.0
New Instrument
39.8 587.0
Amortisation
0 0
Extraordinary 0 596.2 776.2
ADB DPO 0 320.0 320.0
World Bank DPO 0 320.0 500.0
Amortisation 0 -43.8 -44.0
Total Net Financing 1,614.2 1,987.2 1,897.2
Gross Debt** 23,558.3 25,545.5 25,455.5 Source: Department of Treasury. * External Net Financing only includes the bond financing amount transferred from the Bond Trust Account ** Gross debt amount nets off the balance in the BPNG USD Bond Trust Account at year end
Importantly, with the balance in the Bond Trust Account being an estimated K800.0 million at end-2018, this will provide a solid financing base to execute the 2019 Budget program without the need to resort to warrant restrictions. This will be the first time in a number of years that the budget has been financed from the commencement of the fiscal year.
8.2 FINANCING REQUIREMENTS 2018 BUDGET AND 2019-22 PERIOD
The Government’s Medium Term Fiscal and Debt Strategies 2018-22 state clearly that funding of the 2018-22 fiscal financing program is to be predominately through a shift in the financing mix toward external borrowings and away from domestic borrowing. The shift undertaken in 2018 was successful in terms of funding the deficit and restructuring the debt portfolio in line with the MTdS portfolio targets, although much of the funding came late in 2018. This resulted
2019 National Budget, Volume 1
131
in difficulties being experienced through 2018 in terms of warrant restrictions and efficient budget execution. This change in strategy in 2018 came about as a result of the difficulty in obtaining domestic financing in recent years which has stifled budget implementation, particularly over the first half of the fiscal year. Our domestic market, which consists predominantly of the four commercial banks and two superfunds and the two main foreign banks, continue to have internal limits on lending to the Government. In addition, the PMMR transfers, in part, contribute to the illiquidity on the main local bank. All banks are now moving towards redeeming their holdings of government securities to obtain the necessary liquidity to fund the excess demand for foreign currency. The Central Bank is also targeting redemptions of securities to remain in compliance with its statutory end-year ‘no lending to Government’ requirements in the BPNG Act. These trends are expected to continue over the first half of 2019 until the foreign exchange imbalance is extinguished. Furthermore, the subdued nature of the domestic economy in recent years is limiting domestic investment opportunities, encouraging the private sector and super funds to repatriate funds offshore. Firmer fiscal policies and the build-up in arrears are also reducing domestic liquidity in the system. For the Government, this means that recourse to the domestic financial system for funding the budget has been halted and, while the foreign exchange imbalance remains, further redemptions can be expected in 2019. Large maturities of domestic stock occur over the first five (5) months of 2019, meaning that external financing is the primary option in 2019 to fund both the deficit and the demand for net redemptions of domestic securities. Consequently, the domestic debt retirement program, initiated in late 2018, is estimated to be only around 45-50.0 per cent completed and this program needs to continue to supply the necessary liquidity and foreign exchange to extinguish the foreign exchange imbalance that has inhibited private sector growth in 2017-18. In this respect, it is estimated that a further K629.0 million in domestic debt redemptions over the first half of 2019 will be required to complete this task. To finance this level of net domestic debt redemptions and fund the programmed 2019 Budget deficit of K1,866.7 million, it is estimated that net external borrowing will need to be K2,496.1 million in 2019. This is K2,931.9 million in gross new borrowing less K435.8 million in amortisation amounts. The 2019 programmed loans comprise:
i. Drawings from the Sovereign Bond Trust Account US$200.0 million (K640.0 million); ii. ADB Budget Support Tranche 2 US$100.0 million (K320.0 million); iii. World Bank Budget Support Tranche 2 US$50.0 million (K155.0 million); iv. New concessional project loans of US$250.0 million (K817.0 million); v. Offset by external amortisation of US$133.0 million (K436.0 million).
These external loans are insufficient to meet the programmed financing requirement resulting in an external financing gap of around K1.0 billion. This will need to be met in the first half of 2019 if the debt management program goals for 2019 are to be achieved. These critical goals are to use sufficient cost-effective external financing to fund the 2019 deficit, contain the overall interest cost burden, and redeem the necessary amount of domestic Government securities to extinguish the burgeoning foreign exchange imbalance.

2019 National Budget, Volume 1
132
To fill this financing gap in the first half of 2019, the Government is already in advanced negotiations with a Commercial Bank offering a US$300.0 million loan (PGK1,000.0 million) at much better rates than accessed before which is likely to be available early in 2019. The loan is a 10-year amortising term loan, with semi-annual coupons, with a 3-year grace period and at an annual interest rate between 6-7.0 per cent and the use of proceeds is targeted at infrastructure and resource projects in the 2019 Capital Budget. In this regard, apart from the concessional project financing, all the proposed borrowings in 2019 are for budget financing. Budget financing is preferred to project financing as it provides flexibility in the use of funds and allows the Government to determine its priority expenditure for the year and to expend this accordingly. The successful sovereign bond issuance program provided a benchmark for longer term external commercial debt and the 8.375 per cent rate on a 10-year security can be compared with the over 12.0 per cent rate for a similar term domestic inscribed stock. Of course there is exchange rate risk to contend with, although further significant falls in the PNG Kina are not expected over the medium term, given the pending resource investments on the horizon. Therefore, the revised 2019 debt management strategy should result in interest cost savings, and the liquidity available in external markets should ensure that future budgets are able to be executed as programmed from early in the fiscal year. The lengthening of the debt portfolio through these longer external issuances, including the longer term ADB and World Bank budget support loans, also means that refinancing risk is reduced. Table 31 below shows the composition of financing by instrument for the 2019 Budget and over the projection horizon to 2023. Table 31:Deficit Financing Projections by Instrument 2018-2023 ( Kina, Million)
Debt Instruments 2018 Revised 2019 Budget 2020 2021 2022 2023
Domestic Net Financing -603.4 -629.4 18.5 213.0 -12.6 1056.5 Securities -603.4 -629.4 18.5 213.0 -12.6 1056.5 Treasury Bills -303.4 -329.4 0 100 -12.4 538.4 Inscribed Stock -300 -300 18.5 112.7 0 517.7
External Net Financing 2,500.60 2,496.1 1,540.8
0 1,176.6
0 1,152.80 -56.0
Sovereign Bond 800 640 820 550 390 0 New Issues 1,600 1,600 0 0 0 BPNG USD Trust Bal 800 160 940.00 390 0 0 Concessional Loans 337.4 464.8 883.7 1461.6 818.3 37.2
New Instrument 594 816.9 1,255.2
0 1,890.0
0 1,380.50 717.80
Amortisation -257 -352.1 -371.5 -428.4 -562.2 -680.6 Commercial 587 -36.3 -784.2 -803.5 -15 -57.5 New Instrument 587 0 82.9 84.9 42.5 0 Amortisation 0 -36.3 -867.1 -888.4 -57.5 -57.5 Extraordinary 776.2 1428 621.3 -31.5 -40.5 -35.7 New Instrument 820 1,475.40 655.7 0 0 0 World Bank DPO
500 155.00 328 0 0 0
ADB DPO 320 320.00 328 0 0 0 Other Ext Financing
0 1,000.00 0 0 0 0
Amortisation -44 -47.4 -34.4 -31.5 -40.5 -35.7
Total Net Financing 1,897.2 1,866.7 1,559.2 1,389.6 1,140.4 1,000.5
Source: Department of Treasury
The financing requirement for 2019 will result in total Government debt reaching K27,322.2 million by end 2019, equivalent to 30.8 per cent of GDP, well within the prescribed FRA target range of 30-35.0 per cent of GDP. This shows a clear trend toward the prescribed

2019 National Budget, Volume 1
133
30.0 per cent of GDP by 2022. By end-2019 the composition of total debt is projected to comprise of:
• external debt amounting to 12.8 per cent of GDP predominantly loans from multilateral, bilateral and commercial creditors.
• multilateral debt will account for 56.9 per cent of total external public debt. The largest multilateral creditor is the ADB (79.3 per cent), followed by the World Bank (16.8 per cent).
• bilateral debt will account for 21.9 per cent of the external public debt stock. The largest bilateral creditor is China (85.8 per cent), followed by Japan (13.5 per cent); and
• domestic debt amounting to 18.0 per cent of GDP comprising of predominantly marketable securities with 31.3 per cent of total debt being in T-bills with maturities of 91, 182, 274 and 364 days and 27.0 per cent of total debt in medium to longer-term Treasury Bonds.
For 2018 PNG’s total interest cost on Government debt is low in relation to GDP, but quite high in relation to total revenue (excluding grants), where it is double the average of low-middle income countries. However, it is expected to stabilise over the medium term given the portfolio shifts and the increase in revenue. Annual interest payments in 2018 are estimated to be 2.4 per cent of GDP, with interest payments on external debt accounting for 0.5 per cent and interest payment on domestic debt 1.8 per cent of GDP. At the end of 2018, the estimated average interest rate on the total debt portfolio was 7.3 per cent with external being 1.5 percentage points and domestic 5.8 percentage points. Table 32: Debt stock as a share of GDP 2018-2022 (Kina, Million)
2018 2019 2020 2021 2022 2023
Gross Government Debt 25,455.5 27,322.2 28,881.4 30,271.0 31,411.2 32,411.7
Debt to GDP % 30.9% 30.8% 30.3% 29.4% 27.5% 25.9%
Domestic 16,569.7 15,940.3 15,958.8 16,171.5 16,158.9 17,215.0
% of GDP 20.1% 18.0% 16.7% 15.7% 14.2% 13.8%
External 8,885.7 11,381.8 12,922.6 14,099.2 15,252.0 15,196.0
% of GDP 10.8% 12.8% 13.5% 13.7% 13.4% 12.2% Source: Department of Treasury
8.3 MEDIUM TERM DEBT STRATEGY (MTdS)
The MTdS laid down the plan to achieve the desired funding for the Government’s Budgets over the 2018-22 period and in managing the Government’s debt portfolio. The overall objective of the MTdS is to:
“raise the required amount of Budget financing and manage the debt portfolio to achieve prudent risk and cost minimisation objectives, and develop and maintain an efficient market for Government securities and diversification of funding sources.”
The MTdS operationalises this objective in order to achieve the desired composition of the Government’s debt portfolio, which captures the Government’s strategy with regard to the cost-risk trade-offs. The major strategies to support the debt management objective comprised:
2019 National Budget, Volume 1
134
• maintaining debt at sustainable levels. The FRA target band of debt to GDP of 30-35.0 per cent and the 30.0 per cent target by 2022 will constrain debt to sustainable levels. Although the band only applies to central Government debt at book value and does not include valuation changes as a result of interest rate and exchange rate changes, SOE borrowings (explicit or implicit contingent liabilities) should also be noted because of the inherent fiscal and financial risks;
• maintaining financial risk at prudent levels. The reduction in the domestic debt target relative to foreign debt is a trade-off between domestic liquidity and interest rate risk against foreign liquidity and exchange risk, and the lengthening of the average time to maturity is a trade-off between cost and refinancing risk;
• developing and efficiently managing the domestic debt market involves broadening and deepening the market in domestic securities and improving the market infrastructure; and
• developing and managing the offshore commercial market, including the inaugural sovereign bond issuance that will diversify funding sources, provide an alternative market based financing instrument. This eases domestic liquidity and foreign exchange constraints and provide PNG a sovereign reference price. This allows international investors to take a position in PNG which also facilitate non-resident purchases of domestic bonds through a market based assessment of interest differentials.
The MTdS is guided by the legal framework governing Government borrowing including the authority to borrow and to issue new debt, invest and undertake transactions on the Government’s behalf. Key legislation governing securities and domestic debt include the Loans and Securities Act 1973, the Treasury Bills Act 1974 and the Central Bank Act 2000. Legislation relating to foreign loans include the Loans (Overseas Borrowings) Act 1973, Loans (Overseas Borrowings) (No. 2) Act 1976 and Loans and Assistance (International Agencies) Act 1971. Legislation relating to the authority to borrow is outlined in the Public Finances (Management) Act 1995. For fiscal consideration purposes, limits set on debt are prescribed in the FRA 2006. The legal framework puts the emphasis on greater accountability and outlines the desired reporting and audit requirements. The MTdS was formulated against the revenue and expenditure assumptions presented in the MTFS which targets further fiscal consolidation. As the MTFS is amended or as financial conditions and developments change, the MTdS will need to be updated and so, given the continuing constraints and risks in raising significantly more financing from the domestic market and the ongoing foreign exchange imbalance and associated domestic debt redemption program, the MTRS operational targets will continue to be relevant, but will now require some amendments.
8.4 OPERATIONAL STRATEGIES 2019-2022/23
The 2019 amended operational strategies and targets now comprise:
i. continue to engineer a portfolio shift from domestic debt securities to foreign currency debt with a foreign debt to total debt target increased from 35.0 per cent

2019 National Budget, Volume 1
135
to 45-50.0 per cent, with domestic debt also being reduced to 50-55.0 per cent by 2023.
This will be achieved through the issuance of the additional programmed tranches from the World Bank/ADB development policy loans, additional bilateral external loans and further issuance of PNG sovereign bonds, as well as the continuing issuance by bilateral and other multilateral partners of concessionary project loans;
ii. within the domestic debt target, the MTdS target split of 50/50 between Treasury Bills and Treasury Bonds as a share of total domestic debt will be maintained in the updated MTdS and this will be consistent with the goals of minimising the cost of debt and the Government’s tolerance for financial risk.
To achieve this rebalancing, the market in domestic bonds, including access to the market by non-residents, will need to be developed significantly in 2019 where a number of prerequisites will need to be addressed.
The change in the portfolio mix will also mean significant foreign exchange inflows, some of which will be used to clear the foreign exchange imbalance. The crowding out impact on private sector credit will also be reduced, lending support to private sector credit growth in this important area.
8.5 MANAGING PORTFOLIO RISK 2019-23
In implementing the amended financing strategy in the 2019 Budget, the Government will be managing a number of risks including exchange rate risk, liquidity risk, interest rate risk, refinancing risk and others. These risks will be mitigated through:
i. managing the currency composition of external debt, especially as it increases as a proportion of debt, to ensure the composition is aligned with export receipts and foreign exchange reserves;
ii. establishing a dedicated Sovereign Bond Trust Account in the BPNG to facilitate approved fiscal financing and debt management both through-the-year and across years. This will facilitate the attainment of external loans more aligned to market demand and opportunities, rather than volatile budget imperatives;
iii. smoothing out the maturity and repayment profile of the domestic debt service
schedule, within the projected financing envelopes, through debt switches and buybacks and establishing a reduced number of more liquid benchmark issues. To facilitate this measure, the Loans Securities Act 1960 and the Treasury Bills Act 1974 will need to be amended to clearly state the authority for the Department of Treasury to actively manage Government debt. Further, the domestic Debt Repayment Account (DRA) will be redefined as a dedicated trust account for this purpose with balances, if required, restricted to debt management and not through-the-year budget needs in excess of appropriations;
iv. in line with the 2018 operational guidelines, the duration of the domestic portfolio will be lengthened in 2019 to reduce refinancing risk through the development of the domestic bond market and targeting compositional changes between shorter term treasury bills and longer-term treasury bonds. However, the domestic securities market will need to be stabilised first, with the implementation of the debt retirement plan and commensurate BPNG intervention
2019 National Budget, Volume 1
136
into the foreign exchange market to extinguish the foreign exchange imbalance. This is to be undertaken as a prerequisite to domestic security market reform. Department of Treasury and BPNG are required to formulate an agreed coordination strategy for implementation, particularly between late 2018 and mid-2019;
v. addressing a number of preconditions for the development of the domestic bond market including: improving the efficiency of the primary market; promoting money market and interbank transactions through repurchase agreements; developing automated clearing, settlement and custody facilities; establishing a bond market code of conduct with effective oversight by BPNG; promoting the establishment of pools of liquidity to allow small investors access to the market; improved coordination between monetary, fiscal and regulatory authorities and market participants; and developing and maintaining a centralised source for bond market information and data.27These preconditions will underpin the goals of expanding the existing highly concentrated investor base and promoting a more liquid and efficient secondary market;
vi. addressing the concerns by non-residents that seek to invest in domestic securities, namely through rectifying the current foreign exchange imbalance and restrictions on access to foreign currency at redemption or repurchase, implementing access and disposal arrangements through improved market infrastructure for automated clearing, settlement and depository functions, and facilitating secondary market liquidity;
vii. documenting and monitoring debts of state-owned enterprises and contingent
liabilities and providing advice on management and exposure levels, with the more significant being the domestic commercial loans taken out by KCH to finance the Motukea Port relocation, Eda Kopa Solwara 1 Project and the NCD Roads Project. Records relating to these liabilities are available in Statement I of the annual Public Accounts Statement; and
viii. publishing a more detailed and timely debt management and borrowing plan in early 2019.
Overall, the amended debt management strategy for 2019 and over the medium term should result in interest cost savings, and the liquidity available in external markets should ensure that future budgets are able to be executed as programmed from early in the fiscal year. The lengthening of the debt portfolio through these longer term external issuances, also means that refinancing risk is reduced. The domestic debt market should be able to be stabilised over 2019 through implementation of the domestic debt retirement plan, thereby resolving the foreign exchange imbalance and then allowing the orderly development of the domestic bond market. To implement these more complex debt management arrangements in 2019 and over the medium term, a feasibility report will be undertaken on expanding the role into a dedicated Debt Management Office within Department of Treasury to be able to better interact with investors, particularly with communicating up-to-date information, and have greater discretion to manage the portfolio efficiently. The potential savings in debt service costs are significant and, with access to more lower-cost liquid markets, both domestically and abroad, the impact on budget execution would be significantly enhanced.
27 Refer to World Bank, Review of the PNG Government Bond and Capital Market Development, August 2015

2019 National Budget, Volume 1
137
CHAPTER 9: NATIONAL REFORM AGENDA
9.1 OVERVIEW
In 2019, the Government will continue to implement enabling reforms to ensure macroeconomic stability and sustainable economic growth which are crucial in achieving its development goals and aspirations as outlined in its development policies and strategies, including Vision 2050, the Alotau Accord II, 25PP and the MTDP III. A number of public finance management reforms will continue in 2019 to strengthen and promote governance, in particular, the transparent and effective management of public monies in the delivery of public goods and services under the broader theme of enhancing Public Expenditure and Financial Accountability (PEFA). In 2018, the Government commissioned two interdepartmental working groups comprising senior public officials from: (i) the Public Sector Reform Working Group (PSRWG); and (ii) the OSPEAC to oversee the implementation of a number of public sector reforms. In addition to the public sector administrative reforms, there were a set of medium term fiscal strategies approved in 2018. These strategies comprise the MTFS, MTRS and MTdS. In 2019, the MTFS strategies and targets will be maintained to achieve a medium-term stable revenue (excluding grants) to GDP ratio of 14.0 per cent, reduce the fiscal expenditure to GDP ratio to 16.0 per cent, reduce the fiscal deficit to GDP ratio to 0.8 per cent by 2023 and reduce the debt to GDP ratio to 30.0 per cent by 2022. The 2019 Budget framework is consistent with the medium term framework established in the MTFS. The MTRS outlined a set of comprehensive reforms aimed at broadening the tax base and rationalising tax concessions with a view to increasing revenues in a more equitable and efficient manner. Additional tax reform measures have been announced and are detailed in Chapter 5 of this volume. The Government will continue to improve its debt management as outlined in the MTdS which will assist the Government to meet its debt payment obligations, finance its deficit more efficiently, provide the required liquidity to extinguish the burgeoning foreign exchange imbalance, increase its public investment and provide greater scope for private sector credit and the development of the domestic financial sector. The medium-term strategies will support and guide the national reform agenda that will provide a conducive environment for private sector growth and development. Importantly, the Government has provided increased funding in the 2018 Supplementary Budget and the 2019 Budget for the payment of outstanding arrears. The Government will continue to partner with key stakeholders in removing barriers to doing business and investment in PNG in order to promote greater private sector participation. Central to this set of reforms are the recommendations captured in the Consumer and Competition Framework Review and the Financial Services Sector Review which have been endorsed by the Government and will be implemented in 2019. The hosting of APEC meetings in 2018 has been a significant focus of the Government. More importantly, it is an opportunity for the Government to utilise the collective expertise of the APEC economies to further PNG’s domestic reform efforts through improved trade relations in the APEC region and also to encourage longer-term sustainable investment and development in PNG.
2019 National Budget, Volume 1
138
9.2 PUBLIC SECTOR REFORM
The Government will build on past reforms by continuing to drive existing reform initiatives and look for further reform opportunities to improve the efficiency and effectiveness of the public service and create an environment that is conducive for private sector investment and growth. The Government’s Vision 2050 strategy envisages further devolution of responsibilities from
the National Government to the Provinces. In parallel, the MTDP III aims to secure the future through inclusive sustainable economic growth. This will ensure improved targeting of resources to priorities to enhance the lives of our people. In this respect, the 2019 Budget focuses on establishing a number of key reforms that are consistent with these high-level policy objectives and targets. In 2019, the Government will refocus its attention on accomplishing new service delivery standards by trimming excessive spending and resource wastage, and redirecting funds to key priority impact projects at all levels of Government in the areas of Health, Education, Infrastructure and Law & Order. 9.2.1 Equitable Resource Allocations to Provincial Governments The intergovernmental financing system focuses on ensuring that the total revenue of the provinces and the costs of delivering a minimum set of basic services are taken into consideration when determining the grants for the Provincial and Local Level Governments. Under this system, the Intergovernmental Relations (Functions and Funding) Act 2009 sets out the revenue sharing formula among National, Provincial and Local-level Governments. The amount that is allocated to the sub-national levels of the Government annually is referred to as the Equalisation Amount. This mainly becomes the pool of funding for the Functional Grants and is the minimum level of funding that the Provincial and Local Level Governments can expect to receive. The Equalisation Amount is contingent on a set proportion of Tax Revenue, excluding variable mining and petroleum taxes, and which is referred to as Net National Revenue available to the National Government each year. This is to provide greater certainty for provincial and local-level governments, provided that it is a revenue sharing arrangement and the calculation of the equalisation amount will be responsive to the revenues received by the National Government. The legislation indicates that the current equalisation amount is 6.6 per cent of Net National Revenues (NNR). The NNR amount is the total tax revenue received by the National Government excluding mining and petroleum tax revenue. The NNR calculations for the 2019 Grant distributions further exclude GST and Bookmakers Tax transfers to provinces, since these were already assessed as part of provinces fiscal capacities. This process involved subtracting K463.2 million (sum of both GST & Bookmakers Tax) from K9,141.4 million28. For the 2019 Fiscal year, the Equalisation Amount has increased by K15.4 million, a slight increase from K547.3 million in 2018 to K562.7 million. The increase is essentially due to the improved total tax revenue collections in 2017 compared to 2016. The following table shows how the NNR amount for 2019 was calculated (Kina, Million).
28 Tax Revenue – 2017 FBO report.

2019 National Budget, Volume 1
139
Act Definition Final Budget Outcome
equivalents 2016 2017 Difference
General tax revenue* Tax revenue 8,421.6 8,678.2 256.6
MINUS (-)
Mining and petroleum tax revenue
Mining and petroleum taxes
92.0 113.6 21.6
EQUALS (=)
2018 Budget 2019 Budget
Net National Revenue Amount 8,329.6 8,564.6 235.0
Multiplied by (*) 6.57%
Equalization Amount 547.3 562.7 15.4 Source: National Economic and Fiscal Commission (NEFC) *excludes GST and BTT transfers to Provinces.
The minimum funding level for the equalisation amount in 2019 is calculated according to the following formula (Kina million):
Net National Revenue (2019) (X) 6.57% = NEFC estimate of 2019 equalisation amount
(K8,564,6) (x) 6.57% = (K562,7)
9.2.2 Mergers of National Departments and Agencies
A recently endorsed NEC Decision No.15/2018 reaffirms a range of earlier cabinet decisions regarding the amalgamations and abolishment of various organisations. This NEC decision is currently being implemented by the newly established Public Sector Reform Organisational Team (PSORT). This team is comprised of departmental heads of Prime Minister & NEC, Personnel Management, Finance, Treasury and Justice and Attorney General. This Group will be re-tasked as an ongoing strategic committee overseeing the actual amalgamation work carried out by OSPEAC. OSPEAC will then report to PSORT. Both groups/committees will be resourced sufficiently from existing departmental resources to effectively carry out its assigned duties, including the amalgamation exercise. The amalgamation of agencies is an important expenditure efficiency measure to improve the productivity of the public service. This policy will help in achieving the Government’s aim of rightsizing the public service and providing service delivery in a more coordinated and cost efficient manner. The proposed mergers for 2019 are as follows: Table 33: Merging Agencies
Agency Merged into
Coastal Fisheries Development Agency National Fisheries Authority
National Economic Fiscal Commission Department of Treasury
National Aids Council Secretariat Department of Health
National Coordination of Bougainville Affairs
PM & NEC
Integrated Financial Management System (IFMS)
Finance and ICT
National Tripartite Consultative Council Department of Labor and Industrial Relations.
National Narcotics Bureau Department of Justice and Attorney General (DJAG)
Office of Urbanization Department of Lands
Border Development Authority Department of National Planning and Monitoring, Treasury and Department of Provincial and Local Level Government Affairs (DPLGA)
Department of Public Enterprise Department of Treasury

2019 National Budget, Volume 1
140
Agency Merged into
PNG Research Science and Technology Secretariat
Department of Higher Education Science and Technology
Konebada Petroleum Park Authority Abolish the agency, Policy to be under Treasury and management under Kumul Petroleum
Source: Department of Treasury
9.2.3 Budget Reforms The Government will continue to undertake reforms to improve budgeting processes to enhance its effectiveness and efficiency in order to contain wastage and derive value for money given constrained financial resources against substantial needs for development spending and improved service delivery. Significant progress has been made in recent years, including implementation of the “Two Stage Budget process” which allows for rationalisation of high cost public service proposals early in the budget process. The Government will further strengthen the integration of the former development and recurrent budgets to prevent funding duplication and ensure expenditures from both components of the budget are aligned by establishing an inter-departmental committee. The committee, to be co-chaired by the Department of National Planning and Monitoring (DNPM) and Department of Treasury (DoT), will comprise relevant state departments and agencies to appraise and oversee the technical, financial and accountability aspects of new projects. The Government will continue to introduce reforms with the aim of improving the efficiency in allocation of public funds and, at the same time, improving the integrity and efficiency of the budget process and reporting arrangements. 9.2.4 Management of Manpower and Personnel Emolument Ceilings The Government has taken measures to reduce the increasing cost of PE to ensure the cost savings can be redirected to other priority areas. An equally important outcome will be to have a public service that is responsive to service delivery and development needs. The Government will continue to support measures to establish mechanisms to control costs and institute efficiencies with agencies in performing their roles and functions. A key initiative which the OSPEAC has undertaken since 2016 and which will continue in 2019 is to establish an accurate PE budget. A number of issues will be addressed in 2019. In this respect, agencies have not provided Treasury with correct manpower data as the Department of Personnel Management does not have a master file, making it difficult to assess staff on strength. The Alesco system generates manpower data but this varies from fortnight to fortnight. Approval of new agency structures and entering these new structures into the Alesco system without reference to budget ceilings has added to the lift in payroll costs. There are also inconsistencies in staffing data between agencies and DPM over established structures, staff on strength and funded vacancies, and these inconsistencies are not monitored on a fortnightly basis. The growth in off-line payments remains a concern. Importantly, the ALESCO payroll system currently does not have the capability to load annual approved budgets for target checking against the annual appropriations by specific agencies. The Payroll is processed in isolation to IFMS and reports are sent to the Department of

2019 National Budget, Volume 1
141
Finance for final review and processing. There are no funds checking against the Warrants/CFC which opens up the expenditure ceilings until the point when payroll is journalised into IFMS late in the process. Payroll Journals are completed after the payroll payments are completed and there are no CFC’s in IFMS for any further validations or trigger points for the over expenditure and monitoring against the allocated budget Overall, during the last 4 years there has been an escalating trend in a number of agencies exceeding their PE ceilings by significant margins. These over-budgeted expenditures have occurred in all years between 2013 and 2018. The OSPEAC implemented a number of measures in 2018 including the commencement of work by DPM on systems control to improve manpower data, PE reports, recording of unattached officers and offline payments. Also measures were commenced to improve regulation and monitoring of the misuse of domestic market allowances, payments based on the wrong grades, disclosure of ghost workers, poor leave recording, incorrect higher duties allowances, persistent use of PGAS system for labour costs, use of short term contracts outside of funded positions, and use of double payments. A HR Managers Forum and a Staffing and Establishment Review Workshop were conducted in May 2018, the focus of which was on cost control in a devolved environment and the identification of key oversight functions. With the teachers making up about 50.0 per cent of the public sector workforce and with the Teachers Payroll being particularly problematic in terms of over-budget expenditure, OSPEAC established a working relationship with the Teachers Service Commission and a number of workshops were organised focused on PE budgets and control aspects. Nevertheless, the teacher’s payroll is expected once again to overshoot in 2018.In an attempt to control the excess payroll costs in late 2018, the Government has directed the cessation of off-line payments from the ALESCO payroll system and overtime payments. NSL exit payments will also be paid in full through the proposed Supplementary Budget appropriations. Efforts to rationale and decelerate payroll growth rates will be increased in 2019. An independent payroll audit was sanctioned in 2018 and its findings will shape the work plan of OSPEAC in 2019. In the meantime, a payroll management plan has been developed and will be implemented starting 2019. In this respect, processing of payroll expenditure will now be similar to Goods and Services by using the Budget Execution Process currently available in the IFMS for effective monitoring and target checking. This will force agencies to manage their Payroll Budget within the approved allocation before the payroll is sent to the Bank. The following process will now need to be followed:
• Treasury issues Quarterly warrants for the Payroll Allocation;
• Payroll is processed in Alesco and reports are submitted to DoF;
• DoF, after their checks and amendments, informs agencies on the total Payroll for the fortnight;
• Agencies issue CFC for their budgeted payroll against the Warrant. At this point Agencies may request a detailed payroll report if the amount may have exceeded their budget. This will give the agencies an opportunity to review their head count and payroll details and submit back to DoF for changes within the payroll system;
• Agencies may have to reconsider reallocating funds from other activities within the agencies to fund the additional sum if not budgeted;
• Payment authority is than processed in IFMS against the specific Agency Actuals Ledger updated; and
• DoF processes the Payroll against WPA.
2019 National Budget, Volume 1
142
In summary, the above revised business process will allow Agencies to authorise the payroll expenditure within their allocated budget or will be sacrificing funds from other activities within their departments. This will be rolled out progressively with an awareness program informing all agencies of the proposed change in the beginning of the year. The progressing of this reform is to be overseen and steered by the OSPEAC technical team. OSPEAC will report to OSPEAC Proper on a monthly basis. The OSPEAC will continue to work towards formulating accurate PE Budgets with the aim of avoiding the persistently large over runs, through:
• Collection of accurate manpower data and costs for all agencies through the staffing and establishment reviews and PE budget formulation meetings;
• Carrying out retirement exercises in the whole of public services; and
• Putting in place permanent system controls in the Government’s payroll system. The retirement exercise will also continue into 2019 in the whole of public service. As part of this work, K8.0 million has been allocated in the 2019 Budget for the OSPEAC. 9.2.5 Industrial Pay Fixation Agreement In 2016, the review of the Public Service Pay Fixation Agreement (PSPFA) 2017-2019 was implemented to supersede the old Public Service Pay Fixation Agreement 2014-2016. The State and the Public Service Employees Association signed an agreement for a 3.0 per cent annual pay increase for Public servants from 2017 to 2019. The increase was in light of the major events that have unfolded over the recent past years with increased economic activities and the associated high cost of living in the country. However, given the downturn in the economy and financial constraints faced by the Government, the pay rise was not implemented in 2017, but has started to be implemented in 2018 taking into consideration the outstanding for 2017. The increase, including back pay since 2017, has been paid out to teachers first and will subsequently be rolled out to uniformed personnel, then law and order, health workers and other public servants. Over K100.0 million has been expended to date in 2018. The remainder of the 2017 and 2018 back payment is anticipated to be introduced as 2019 progresses. Starting in 2019, and over the medium term, the Government will ensure that public servant pay increases reflect affordability and the extent of rationalisation savings in this area. Under the MTFS 2018-22, a fiscal anchor for annual PE expenditures has been set at a maximum of 40.0 per cent of non-resource, non-grant, revenue, and PE costs should not expand at more than 5.0 per cent annually. As such public sector pay increases above this rate will have to be offset with reductions to positions or removal of ghost workers or other PE rationalisation. 9.2.6 Decentralisation of Government Since 2009, the National Government has undertaken significant reforms on Decentralisation. The main objective of the reforms was to achieve improved service delivery and development outcomes. These reforms included the District Development Authority (DDA) Act 2014, Service Improvement Program (SIP) funding, Provincial Health Authority (PHA) rollouts, Proposals for autonomy, the Organic Law Review and the Service Delivery Partnership Agreements. The Government is currently reviewing the Organic Law on Provincial and Local level Government to harmonise the reforms on decentralisation which will ultimately contribute to

2019 National Budget, Volume 1
143
the delivery of cost-effective tangible services at the community level. The objective is to shift the focus from allocating substantial resources into improved policy making at the different administrative levels of government, the implementation of policies, and delivery of tangible services at the district and community levels. 9.2.7 Superannuation Reforms As an employer of Public Servants, the State is required under Section 76 of the Superannuation General Provision Act 2000 to make a mandatory employer’s superannuation contribution of 8.4 per cent of the base salary of each employee to an Authorised Superannuation Fund (ASF). Employees of the State are also required under the Act to contribute 6.0 per cent of their base salary to an ASF as the employee’s contribution. The Nambawan Super Limited (NSL) and the Defence Force Retirement Benefit (DFRB) Fund are the two (2) Authorised Superannuation Funds (ASF) in which the Government provides its employer’s and employee’s contribution on a fortnightly basis. By the end of 2018, the Government will have fully settled the exit liability owed to NSL for those members who have exited between 2016 and 2018. While the settlement of this past liability will effectively reduce pressure on the 2019 Budget and beyond, the Government will still be required to pay around K10.0 million a month in ongoing exit payments as the affected members retire. Alternatively, the Government could consider meeting this unfunded liability and, once the exact quantum of this liability is determined, the Government will explore options on how best it can be addressed. The outstanding Superannuation (General Provisions) (Amendment) Act 2013 was recently gazetted on 24th August 2018 by the Governor General for implementation as part of the superannuation reforms. This amended legislation incorporates most of the proposed amendments relating to the Report of the Treasury/BPNG Working Group on Outstanding Superannuation Taskforce Issues of 2010. Some of the key reforms include making an additional provision in the Act that enables the self-employed and the informal sector employees to voluntarily contribute to superannuation, non-mandatory but voluntary superannuation coverage for non-citizens, allowing for multiple fund managers including offshore managers of ASFs and further strengthening the role of the Trustee in investment decisions. In order to recognise the long service of employees and to encourage fair taxation on some low income earners, the Government also implemented steps in the 2018 Budget to align the tax treatment of Employment Termination Payment for long service employees with that of superannuation payouts at a 2.0 per cent concessional rate which will continue into 2019. The taxation treatment for superannuation in PNG is now more reasonable and equitable. The Defence Force Retirement Benefit (DFRB) Fund currently has two separate Funds operating concurrently as a result of the legislative amendments made to the DFRB Fund Act in 2015. These are the existing Defined Benefit (Pension) Scheme and the recently established Accumulation Scheme which has a similar superannuation arrangement as that of NSL. In 2019, the Government will create a separate line item under Vote 207 to distinctively cater for exit payment for members of the DFRB Fund. All officers of the Defence Force who were recruited after 1st July 2016 are automatically admitted into the new Accumulation Scheme. The Pension Scheme will be eliminated once the remaining members of the Pension scheme have exited the Fund and the Defence Force.

2019 National Budget, Volume 1
144
The Government remains committed in its superannuation obligation towards members of the DFRB Fund.
9.3 A COMPETITIVE AND DYNAMIC PRIVATE SECTOR
The Government acknowledges that a competitive, vibrant and diverse private sector is an important driver of economic growth and remains as a priority area in its development agenda. As such, a formalised policy framework needs to be established such that fair and effective competition is encouraged and adhered to by all markets across all relevant sectors. This will improve economic efficiency and inclusive economic growth as well as consumer welfare. To meet these goals, the Government remains committed to its earlier announcement, in that it will continue to:
• encourage efficiencies in the SOEs and increase the nature and level of competition within markets where SOEs operate, particularly in the telecommunications, electricity and transport sectors such as shipping and aviation;
• ensure a strong regulatory enforcement of the competition and consumer law so that markets operate competitively with ethical trading, whilst safeguarding small businesses and consumers against unfair treatment and abuse;
• improve the productivity of sectors particularly important to the rural and remote areas of PNG such as tourism and agriculture;
• reduce the cost of doing business by removing regulatory impediments to private sector growth and facilitating the development of SMEs; and
• encourage the operation and transition of participants in the informal economy to the formal economy.
As such, the Government remains committed to developing the environments that are conducive to private sector development and in the spirit of competition. In support of these objectives, the following priority reform activities will continue in 2019.
9.3.1 Consumer & Competition Framework Review
In order for the Government to develop the environment that is conducive to private sector development, through encouraging innovation, productivity, inclusive growth and supporting competitive markets, a comprehensive review of PNG’s economic competition regime or framework was commenced in 2014. A final report, including recommendations, was endorsed by the Government in August 2018. The 192 recommendations are grouped into prioritised reform agendas forming five work-streams that will be driven by different technical working teams, who will implement the reform programs over the next few years. The Technical working teams will consist of high level nominees from relevant Government agencies. The prioritised reform work streams include:
ix. PNG’s National Competition Policy Development; x. Legislative and Legal Changes/Amendments; xi. Regulator Operational Changes/Improvements; xii. Regulator Capacity Development and Coordination; and xiii. Government Policy Coordination.
The implementation stage has now started with the first being the formulation of the National Competition Policy Statement, which started in the third quarter of 2018. This is being supported through technical assistance from the ADB through its Public Private Sector Development Initiative (PPSDI) program. Consultations on the draft policy were held on a one-

2019 National Budget, Volume 1
145
to-one basis as well as publicly with relevant stakeholders across PNG. A final draft is expected by end 2018 which will then be submitted to NEC for final approval. Implementation of activities under other work streams will be coordinated by a Secretariat established within the Department of Treasury.
9.3.2 Competition Regulation and Consumer Protection Operations
The Independent Consumer and Competition Commission (ICCC) is responsible for economic competition regulation and is also the consumer watchdog. It will continue to implement its strategies to promote and foster competition, remedy failures in market structures, and take steps to protect the safety and interest of consumers and businesses consistent with the ICCC Act 2002. Where there is limited competition in certain industries and markets that provide significant goods and services vital to consumers and business, the ICCC will continue to provide price regulation oversight and assess opportunities to introduce some form of regulation, if required. This includes enforcement of current regulatory oversight concerning the supply of electricity, water and sewerage, compulsory third-party motor vehicle insurance, postal services and port services, and for specific regulated products like rice, sugar, flour and refined petroleum products. Any form of additional regulation will be assessed carefully to weigh the benefits and effects of these on business and consumers. In 2018, Parliament made an amendment to the ICCC Act 2002 making business merger and acquisition notices to the ICCC compulsory. This development will significantly strengthen the role of the ICCC and consequently influence the compliance culture of businesses in 2019. Some existing regulatory contracts are due for review and work will continue into 2019. These include:
▪ The review into the current regulatory pricing arrangement and period of the sugar industry. The outcome of the review will inform the Government’s decision on whether PNG should continue with the current or a new regulatory arrangement and a new regulatory period. This review will go into the first quarter of 2019; and
▪ For PNG Power, the review of the current price path, minimum service standards, penalty mechanisms and reporting requirements under the current regulatory contracts. This review has been pursued concurrently with two separate and independent assessments. The first involved an independent assessment of the entire technical operations of PPL’s electricity network. This assessment comprised a study to establish the current state and reliability of the network to ensure efficient electricity service delivery. The second involved a competition assessment of the electricity industry to determine the potential for competition at different segments of the industry, from power generation to retail. Once the review of the regulatory contract and the reports of the two independent assessments are completed, new regulatory arrangements will be established for PNG Power Limited and the electricity industry for the next regulatory period commencing from 2019.
In addition, in 2019, a number of existing regulatory contracts and regulatory arrangements will be due for periodic reviews. These are:
▪ For specific declared goods and services that include petroleum products (diesel, petrol, kerosene/jet A1), PMV and taxi fares, and water & sewerage services; and

2019 National Budget, Volume 1
146
▪ A comprehensive review into the existing PNG Ports Regulatory Contract in 2019. In addition to this ports’ industry work, the ICCC will undertake two separate reviews, one into the Harbours Act and the other into the pilotage sector. Once these are completed, the ICCC will put in place new regulatory arrangements for PNG Ports and the ports industry participants for the next regulatory period commencing 2020.
9.3.3 Transport Sector Efficiency
Transportation is critical for movement of people and for provision of goods and services. Transportation costs are important and input into the final price of goods and services. High prices for transportation services in PNG have been a concern for some time. In the coming years, the Government will seek technical assistance from PNG’s development partners to undertake a diagnostic assessment into the sector especially for the aviation and shipping industries. These assessments will be to identify business impediments in the industries caused by uncoordinated regulation and barriers to competition. The outcome of the assessment will be used as the basis to formulate a strategy to address policy gaps and regulatory impediments to boost more competition in the industries and, hence, reduce prices in the sector.
9.3.4 Information and Communications Technology (ICT) Industry
The National Information and Communications Technology Authority (NICTA) is the Government agency responsible for the technical regulation of the information and communication technology (ICT) industry in PNG as specified under the National Information and Communication Technology Act 2009. NICTA will continue to conduct public inquiries examining impediments to access and affordability of ICT and investigate misuse for the purpose of providing recommendations to Government. The following programs are being pursued and will continue into 2019:
▪ Laying of New International Submarine Cables: the new high speed submarine cable from Sydney to Port Moresby that is currently being developed will be expected to provide the country’s high speed Internet needs for the next 25 years;
▪ PNG Internet Exchange Point (PNGIXP) and Spectrum Monitoring System: In line with security preparations for PNG hosting APEC in 2018, the Government through NICTA is also currently facilitating establishment of the PNG (Computer Incident Response Team) CIRT. The primary objective of establishing the facility is to ensure security of PNG cyber space (or internet space) at a technical level where most cyber threats and attacks occur. The system is essential and is part of NICTA’s obligation towards the Government’s commitment to hosting APEC 2018;
▪ Program 1: Mobile Broadband Network Upgrade and Expansion: The upgrade and expansion of the mobile broadband program will extend the coverage of advanced broadband wireless mobile communications services (at least 3G/HSPA+, 4G/LTE, or other advanced systems. The goal is to deliver reliable, high quality access to Internet and “smart” mobile applications and capabilities to as many PNG citizens as possible, where access to such services is not adequately available, and where existing licensed operators are unwilling or unable to expand their networks due to commercial or other constraints. There are two types of Projects included in this Program: (1) New BTS sites in areas currently with no mobile service; and (2) Upgrades to existing 2G BTS sites;

2019 National Budget, Volume 1
147
▪ Program 2: Community Information Centres and Institutional Broadband Networks: The program will help deliver high-speed, full-service fixed broadband Internet connections to selected communities, with services and capacity widely available to public institutions as well as local businesses and households, on an affordable basis throughout each designated local service area. To achieve these outcomes, the Community Broadband Program will support comprehensive implementation projects in a limited number of designated locations, which will consist of three integrated components: (1) Broadband Network Access and Service; (2) Institutional Connectivity and (3) Community ICT Centers (CICs);
▪ Program 3: ICT Platform for Future Growth: This program focuses on the demand
side of ICT development objectives, to ensure that citizens and communities are able to gain the most benefits from the installation and availability of advanced broadband ICT networks and services. Different groups of users will find value in different types of ICT applications, functions, devices, and services, but there will be, in all cases, a wide scope of potential uses for individuals, families, small businesses, and others to improve their livelihood through the use of advanced ICTs. There are two main components to this program, which can be implemented through independent UAS Projects or in combination with other Fund Programs: ICT Applications and Content and Digital Literacy projects;
▪ Program 4: Expansion of Broadcasting Network Coverage: This program addresses the objective of extending coverage of radio and television broadcasting to all citizens and communities in PNG. The UAS Board and NICTA aim to support growth of the broadcasting sector through targeted use of UAS Fund resources to close gaps and assist low income consumers where the broadcasting market may not reach. This activity would focus on support for infrastructure expansion, primarily through enhancement or installation of broadcast antennae on existing or new towers, in close coordination with the rollout of mobile telecommunications infrastructure under Program 1, as well as potential assistance for low-income households with the costs of the digital broadcasting transition, via discounts on set-top boxes. This program could be implemented through projects extending coverage for: Radio Broadcasting and Television Broadcasting; and
In 2019, a market study will be undertaken into the Internet broadband services and government procurement processes to identify, amongst other things, the level of competition, quality of service and factors affecting supply and price in the markets.
9.3.5 The Informal Sector and Small-Medium Enterprises (SMEs)
The endorsement of the SME Policy in 2016, the SME Master Plan 2016–2030 (Policy Reform) and the establishment of the SME Corporation replacing the Small Business Development Corporation (Institutional Reform) was a significant milestone. SMEC, as the lead agency, has planned to address the seven SME development constraints identified in the SME Policy. These constraints include:
• access to credit/finance;
• capacity building;
• access to market and market information;
• access to business and commercial land;
• access to business and physical infrastructure;
• access to ICT infrastructure and application of technology; and
• conducive legal, regulatory and policies to build an enabling business environment.
2019 National Budget, Volume 1
148
To support the SME policy implementation, certain enabling legislations are required. In 2019, the Government in partnership with our development partners will undertake a review of the legal and regulatory framework of the SME framework in the country with a view to creating an environment that can stimulate SME development and growth. This will also encourage the informal sector businesses to transit into the formal economy, thus registering as SMEs. The SMEC is also implementing its transition from the old SBDC to SMEC and building its institutional capacity to implement the SME policy requirements.
9.3.6 Financial Services Sector Review
The above review has also been completed as of August 2017. In mid-2018, NEC endorsed the “Financial Sector Development Strategy (FSDS)” for implementation in 2019. The FSDS contains a prioritised list of reform recommendations, including:
• the architecture of PNG’s financial sector regulatory and supervisory arrangements;
• development of PNG’s Government bond and capital markets;
• development of the national payment system; and
• expanding financial inclusion in PNG. The review team has also proceeded to formulate the “National Financial Inclusion Policy (NFIP)” as one of the recommendations of the Financial Sector Review. NEC has recently endorsed the NFIP for implementation from 2018 and over the next few years. Full implementation of the other approved recommendations has begun and will continue in 2019.
9.3.7 Microfinance Expansion Program
The Microfinance Expansion Project (MEP) is an important government initiative started in 2012 and is still ongoing. The Project is co-financed by the Asian Development Bank, the Government of Australia and the Government of PNG (GoPNG). The BPNG is the executing agency of this project. The project aims to promote financial inclusion through the extension of micro finance and financial literacy services to Papua New Guineans largely targeting the rural population. The project has successfully delivered almost 90.0 per cent of all of its five targeted project outputs and is expected to wind-up in 2019. Activities in 2018 were restrained due to non-availability of budget funding (Government’s share of contribution). However, funding has been secured for 2019 to complete the remaining few activities of the project before it transitions into the Centre for Excellence in Financial Inclusion (CEFI), which has been established to administer the ongoing programs after the cessation of the MEP.
9.3.8 Housing
The Government had undertaken several initiatives and projects under the National Land and Affordable Housing Program as an immediate measure to provide affordable housing to public servants. One such project is the Gerehu Stage 3B and Duran Farm Housing Project which is progressing and the Government will continue to make further progress in 2019 with the aim of making properties more affordable to ordinary Papua New Guineans.

2019 National Budget, Volume 1
149
In addition, the Government, through the ICCC, will undertake a review into the Housing and Real Estate Industry with its findings expected to contribute to the national housing policy that is currently being undertaken by the National Housing Corporation (NHC). The National Housing Policy will provide an overarching framework for affordable housing development in the country.
9.3.9 Land Reform Program
Access to secured land in PNG is one of the key drivers of private sector growth and remains a focus of the Government. Considerable work has been done under the National Land Reform Program (NLRP) to ensure better land administration, better land dispute settlement and establishment of processes to facilitate the registration of customary land for commercial use. One notable achievement was the enactment of amendments to legislation that enabled the registration of customary land, thereby facilitating migration into the formal market system. Despite some notable achievements, there was a loss of implementation momentum of the program over the last five (5) years. In 2018, some corrective measures were taken to strengthen the program and the reallocation of funding for this program in 2019 will facilitate the continuation of reform activities. Going forward, the Government plans to hold a second land summit in 2019 where it is envisaged that a review of the existing land reform program will be undertaken, along with the development of new or strengthened existing priorities and strategies for implementation over the next decade.
9.4 ASIA PACIFIC ECONOMIC COOPERATION (APEC)
The hosting of APEC meetings in 2018 has been a significant focus of the Government. More importantly, it has been an opportunity for the Government to utilise the collective expertise of APEC economies to further strengthened PNG’s domestic reform efforts through improved trade relations in the APEC region and to also encourage longer-term sustainable investment and development in PNG. The APEC discussions have focused on progressing and supporting APEC's 'Three Pillars’: Trade and Investment Liberalisation; Business Facilitation; and Economic and Technical Cooperation.
9.4.1 APEC 2018 and Beyond
In 2018, PNG played host to a significant number of APEC events. As the tradition of APEC hosts, the chairing role of the APEC Economic Leaders' Meeting (AELM), selected Sectoral Ministerial Meetings, Senior Officials’ Meetings (SOM) and other related mandatory meetings have been undertaken by PNG.
9.4.2 APEC Structural Reform Agenda
Progress has also been made on key economic reforms in 2017 and 2018 including an update of PNG’s Renewed APEC Agenda on Structural Reform (RAASR) Individual Action Plans (IAP) which was launched in 2016 as a focus of the APEC Economic Committee (EC) from 2016 through to 2020. A mid-term review was conducted in PNG’s host year during the ‘High Level Structural Reform Official’s Meeting’ in August 2018 where economies discussed emerging themes in structural reform (under inclusivity, connectivity and digitalisation), progress and implementation of IAPs under RAASR, international law, the telecommunications sector, and the way forward. PNG will continue progressing its RAASR IAP.

2019 National Budget, Volume 1
150
9.4.3 APEC Finance Ministers’ Process
The APEC Finance Ministers’ Process (FMP) was another important group of events that PNG hosted in 2018. The APEC FMP serves as a forum for APEC member economies to address regional macroeconomic and financial issues, as well as domestic and regional financial policy priorities. In 2019, the Government will continue to progress some of its 2018 APEC Policy priorities under the FMP. Some of these include: advancing financial inclusion focusing on financial literacy and innovation; long-term infrastructure development and financing; and international tax corporation focusing on Base Erosion and Profit Shifting (BEPS) issues relating to tax payments. For PNG, the hosting of the FMP has broadened the region’s awareness of PNG’s domestic economic and financial policy priorities and challenges, facilitated the sharing of APEC economy experiences on addressing similar policy issues, and created opportunities to leverage capacity building and technical assistance. As part of the way forward, the Government will look at recommendations from departments and agencies to ensure that the work pursued so far under its host year will be given priority, to underpin a continuation of PNG’s sustainable, balanced and inclusive growth, as well as maintaining its presence in the global community.
9.5 IMPLEMENTATION OF THE SOVEREIGN WEALTH FUND OF PAPUA NEW GUINEA
The Sovereign Wealth Fund (SWF) of PNG is a resource-funded SWF. Resource-funded SWFs are responsible for managing the surplus receipts from the resource sector which are not used by the Government in the short term. In PNG, the resources responsible for financing the SWF are minerals and petroleum. The SWF has been designed to protect the PNG economy from external shocks through supporting macroeconomic stabilisation, prudent asset management in relation to financial assets accrued by the State from the mineral and petroleum sectors, and to spread the country’s wealth more equitably across generations. Work on the implementation and establishment of the SWF is guided by the Organic Law on the Sovereign Wealth Fund (OLSWF). The Government is in the process of appointing the inaugural Chairman and Board Members of the SWF of PNG. A recommended list of potential candidates for Board positions is currently under review. After its final review and approval, the Screening Committee will be convened to screen the list of recommended candidates and will make its recommendations to the Appointments Committee. Remuneration benchmarking reports recommending remunerations for the Chair and Members of the Board of the SWF of PNG have been completed, and submissions have been lodged with the Salaries and Remuneration Committee (SRC) and the Salaries and Conditions Monitoring Committee (SCMC). Work has also been undertaken on the development of an Investment Mandate expressing the Government’s expectations to the Board for the management and investment of SWF funds. This work is continuing in collaboration with a professional consulting firm and technical assistance from the Commonwealth Secretariat.

2019 National Budget, Volume 1
151
In view of the above, it is expected that the SWF Board will be established in 2019. The Organic Law on the Sovereign Wealth Fund (OLSWF) requires NEC to give approval for the rest of the provisions of the OLSWF to come into operation through a notice in the National Gazette by the Head of State based on advice from the NEC. This will legally enable the implementation of the various provisions of the OLSWF to establish the SWF. It is expected that this will be done following the appointment of the SWF Board in 2019. To this end the Government remains fully committed to the establishment of the SWF, but it needs to be recognised that it will not be fully operational until the fund balances have been built-up.

2019 National Budget, Volume 1
152
CHAPTER 10: IMPROVING STATE’S COMMERCIAL INTEREST
10.1 OVERVIEW
The State has various interests in businesses operating in the country and these include
majority equity shares in corporate enterprises mandated to provide essential services to the
people including telecommunications, aviation, ports, logistics, banking, electricity, water and sanitation and transport. Through their mandated roles, SOEs provide critical services in achieving development
outcomes in different sectors of the economy. These can only be achieved through efficient
and effective operations and service delivery governed with disciplined commercial principles, transparency and accountability. In 2019, the Government will continue to implement policy reforms that will help strengthen and build institutional capacity within SOEs and other State agencies. This will ensure enhanced capability within SOE’s to deliver lower cost efficient services that maximise returns to the State subject to any statutory or contractual community service obligation frameworks.
10.2 SOE OBJECTIVE & STATE’S INVESTMENT PERFORMANCE
The Kumul framework was designed to enable efficient management of state assets and interests through an exposure to commercial management practices and requirements. This facilitates better financial performance and improved services of the state’s assets. Most of the commercially oriented State assets were consolidated and managed through the Kumul structure consisting of three (3) Kumul entities namely: Kumul Consolidated Holdings Limited (KCHL); Kumul Mineral Holdings (KMH); and Kumul Petroleum Holdings Limited (KPHL). KCHL acts as trustee of the General Business Trust (GBT) which consists of majority interests in SOEs and interests in other assets whilst KMHL holds the state’s mining interests and KPHL holds the state’s interests in petroleum projects. A review into the Kumul structure will be undertaken in 2020 as part of the public finance management (PFM) reforms currently being undertaken by the National Government. The review will aim to ensure prudent fiscal management of state investments. 10.2.1 GENERAL BUSINESS TRUST (GBT) ASSETS The KCHL is the mandated trustee of the General Business Trust (GBT) and maintains oversight of the financial positions and fiscal risks associated with the operation of SOEs and listed shareholdings as vested through the Kumul Consolidated Holdings (KCH) Act 2002. The Government has the following interests under KCH as at June 2018:

2019 National Budget, Volume 1
153
Source: KCH
The GBT asset valuation as at 31st December 2017 was K5.1 billion, a modest increase on 2016, although most asset valuations were not altered in 2017. Of these total assets, the value of Quoted Equity Investments was K805.8 million, while the value of Unquoted Equity Investments (majority interests in SOEs) was K4.3 billion. The KCH has short and long term debt levels of K980.0 million as at end December 2017 which is predominately related to the POM Port Development. Table 34 below provides the total list of state assets in the General Business Trust, as well as valuations (fair value basis), gross revenues and net profit before tax for the major unquoted assets, and dividends paid to KCH for 2016 and 2017. In this respect, gross revenues increased modestly in 2017 compared with 2016, with increases in revenue by Telikom, MVIL and Water PNG being offset predominately by declining revenues in Air Niugini and PNG Power. In terms of net profit before tax, significant declines were recorded for Air Niugini, NDB and PNG Power, while profits were lifted in Eda Ranu, MVIL, PNG Ports, Water PNG and Post PNG. Overall total net profits before tax of the unquoted assets declined sharply from K128.3 million in 2016 to K55.9 million in 2017, resulting in a sharp decline in dividend payments to KCH from K162.7 million in 2016 to K103.2 million in 2017. Although much of the decline can be attributed to the failure of MVIL to remit a dividend payment in 2017.

2019 National Budget, Volume 1
154
Table 34: General Business Trust (GBT Assets), as at 31st December 2017 PARTICULARS
GBT (K’ Millions) (Assets 100% owned unless
indicated)
2016
Valuation
2017
Valuation
2016
Gross Revenue
2017
Gross Revenue
2016
Net Profit Before Tax
2017
Net Profit Before
Tax
2016
Dividends Paid to KCH
2017
Dividends Paid to KCH
Air Niugini L td 450.4 450.4 1,071.8 1,045.7 -8.2 -65.1 10.0 -
Eda Ranu 110.3 110.3 103.7 114.2 -3.3 2.5 2.0 0.5
Motor Vehicle Insurance Limited 524.9 524.9 118.0 145.6 63.4 95.4 70.4 -
National Development Bank Ltd 467.4 467.4 39.0 29.6 7.8 3.9 1.0 -
PNG Ports Corporation Ltd 457.4 457.4 258.7 261.4 50.1 61.9 - 5.0
PNG Power 671.9 671.9 883.7 865.3 119.0 -22.2 - -
PNG DataCo (20% share) 206.3 206.3 7.6 4.9 -14.4 -18.3 - -
Water PNG 62.5 62.5 84.3 99.8 12.1 24.2 4.2 3.0
Post PNG 102.8 102.8 36.2 42.3 1.4 2.4 0.5 0.5
Telikom PNG 439.6 439.6 275.9 294.4 -68.7 5.6 - -
Bemobile 135.7 135.4 125.8 128.1 -35.9 -34.3 - -
PNG Dams Ltd 304.3 304.3
Port Moresby Private Hospital Ltd 100.1 100.1
Other incl Work In Progress 350.0 360.0
Allowance for Impairments 138.5 138.5
TOTAL UNQUOTED EQUITIES 4,254.2 4,254.8
Bank of South Pacific (18% share) 758.8 801.0 74.6 94.2
Highlands Pacific Ltd 5.7 4.8 - -
TOTAL QUOTED EQUITIES 764.5 805.8
TOTAL 5,018.7 5,060.5 3,004.6 3,031.3 128.3 55.9 162.7 103.2
Source: KCH Annual Performance Report as at 31st December 2017 (unaudited).
The ability of KCHL to pay dividends to the State depends on the financial performance of its GBT assets, the costs of KCHL’s operation, the servicing of its liabilities, new investments undertaken and the desired amount of retained earnings. KCH in 2018 is targeting a minimum 50.0 per cent Net Profit After Tax (NPAT) as dividends to KCH. Despite the decline in dividend payments to KCH in 2017, KCH declared a dividend to the State of K35.8 million, although this was classified as deemed, with the same amount being retained by BSP from its dividend to KCH in lieu of an outstanding loan repayment commitment. In the 2017 Annual Performance Report, KCH records net outstanding debts by the State to KCH of K82.8 million reflecting outstanding debt service amounts for state-backed loans from BSP for the Port Relocation and from ANZ for the recapitalisation of Bemobile and KCH assistance to PNG Power Limited (PPL) in 2013. In 2018, KCH has focused on a number of major projects, including the Ramu 2 Power Project, the POM Sewerage System Upgrade project, the Lae Port Development, the POM Port Precinct Redevelopment, GBT land and property sales, additional developments under Kumul Agriculture (particularly on dairy and rice production), the merger of entities under Kumul Telikom Holdings, the Sydney International Submarine Cable, the merging of the two (2) water SOEs under Kumul Water, advancement of the Pacific Maritime Industrial Zone in Madang and the facilitation of SOE deliverables for APEC. Solid progress has generally been achieved on all these projects and a number of important appointments have been secured. In particular, KCH is currently restructuring the three (3) telecommunication entities (Telikom, Bemobile, and PNG Dataco) into one (1) communications service provider offering wholesale services, retail mobile and fixed line. Through infrastructure investment, particularly with the

2019 National Budget, Volume 1
155
International Submarine Cable between Australia and Sydney mostly funded by the Australian Government and further adoption of next generation network architecture and platforms, it is expected that the new company will be more efficient and competitive with much greater customer access to improved communications’ services that are both more affordable and reliable.
In the longer term, hydro power is the main focus given PNG’s abundant hydro potential. KCH and PPL, together with external partners, are currently progressing discussions on major hydro power projects, including the Ramu 2 and Naoro Brown Hydro Projects, as well as looking at other generation sources such as biomass and thermal energy for future development.
Under the Government’s National Energy Policy, PPL is in the process of being restructured into distinct entities operating in the generation, transmission, distribution and retail and regulatory roles to improve efficiency and encourage competition. The restructuring process will be undertaken in two phases.
The first phase is expected to be the stabilisation and consolidation of the regional power business units to reduce cost and improve profitability. The second phase is expected to be the creation of specialized business entities as part of the Government assets’ consolidation agenda.
As part of an overall industry reform, KCH is currently reviewing the existing operations of Air Niugini Limited (ANL) with a view to streamlining non-core business activities and exploring options related to the separation of the international and domestic route services. The focus will be for ANL to continue to operate profitably in a competitive environment, while meeting the increasing demands of its customers.
In this respect the Government is considering divesting a partial shareholding in ANL which dovetails with the planned redevelopment of Port Moresby’s Jackson’s Airport through a Public Private Partnership (PPP) arrangement. The Asian Development Bank is assisting the State develop the PPP structure and similar redevelopments are being undertaken for other airports in the country.
In 2018, KCHL is yet to pay the budgeted K100.0 million in dividends, this has been revised down to K30.0 million reflecting the projected decline in dividend receipts into KCH in 2018. In the 2019 Budget, K80.0 million in dividends from KCH to the State have been projected, along with a further dividend of K25.0 million from MVIL. This reflects the expected improvement in performance of the GBT assets in 2019. In terms of dividend policy, the Government expects KCH over 2019 to improve the collection of dividends. In terms of payment to the State by Kumul entities, the Government will strictly apply the approved Dividend Policy as endorsed in 2015. In this respect, the payout ratio for non-mineral or non-petroleum SOEs and Statutory Authorities is equal to or greater than the previous year’s dividend and is not less than 50.0 per cent of net profit after tax. For mining and petroleum SOEs the minimum amount is 70.0 per cent. The Kumul entities will be expected to comply with the current Dividend Policy and transfer the required amounts to the CRF.

2019 National Budget, Volume 1
156
10.2.2 KUMUL MINERAL AND PETROLEUM HOLDINGS Kumul Mineral Holdings Limited (KMHL) is the mandated State nominee in respect of participating interests in mining projects. KMHL holds assets formerly held by Petromin Limited. Petromin Limited previously held in trust both petroleum and mining project interests on behalf of the State, however, in 2016, all petroleum interests were transferred to Kumul Petroleum Holdings Limited (KPHL) as part of the Kumul restructure. KMHL asset holdings are expected to increase in 2019 and going forward with the transfer of other State interests in mining projects held elsewhere by the State. These transfers include the State’s 4.4 per cent interest in Highlands Pacific Limited still held by KCHL, Bougainville Copper Limited (BCL) equity interests and the 100.0 per cent equity interest in Ok Tedi Mining Limited held by the State. KMHL has not made any payments or dividends to the State since its establishment in 2015. This is mainly due to KMHL not participating in any current active mineral operations. The State, however, has received payments from its investment in Ok Tedi Mining Limited, which paid a dividend of K262.3 million in 2017 and K67.5 million of the projected K200.0 million in 2018. The remaining amount is expected to be received by the end of 2018. In this 2019 Budget, the dividend from Ok Tedi has been programmed to remain at K200.0 million. KPHL is the mandated State nominee and participant in oil and gas projects. It currently holds the State’s interest in oil and gas projects including a participating 16.57 per cent interest in the PNG Liquefied Natural Gas (LNG) project. KPHL paid K200.0 million in dividends to the State in 2016 and K300.0 million in 2017. In 2018, the State has received K250.0 million as dividends to date which excludes the K50.0 million paid earlier in 2018 to the Southern Highlands Province (SHP) as part of the earthquake relief efforts. The receipt of substantial dividends from Exxon expected in December 2018 due to higher gas prices has lifted projected receipts from KPHL to K700.0 million for 2018. A further K800.0 million in dividends is projected in the 2019 Budget which reflects the budget assumptions for oil and gas prices and the elevated expected production volumes in 2019. Table 35: Dividends paid to the State. (K million)
Entity 2016 Actual
2017 Actual
2018 YTD
2018 Est.
2019 Proj
Kumul Petroleum Holdings 200.0 300.0 250.0 700.0 800.0
Kumul Consolidated Holdings 0.0 0.0 0.0 30.0 80.0
Ok Tedi Mining Limited. 100.5 262.3 67.0 200.0 200.0 Source: Department of Treasury (as at 31st October 2018).
All dividends paid to the State form part of the Government’s non-tax revenue in support of PNG’s development needs. As noted above, the 2015 dividend policy of the Government will be strictly enforced in 2019 for all Kumul entities.

2019 National Budget, Volume 1
157
10.2.3 STRUCTURAL REFORMS & POLICIES Institutional capacity building, planning and resourcing are significant to improving infrastructure services and returns to the State. The Government has a number of ongoing policy initiatives aimed at building the capacity of institutions (state agencies). These ongoing policies include the Community Service Obligation (CSO) policy, State On-Lending Policy and State Guarantee Policy. These policies are aimed at addressing some of the service challenges particularly in non-commercial segments, and lowering the cost of capital and improving the availability of finance for SOEs. The development and implementation of further reforms in these areas will continue into the medium term. In parallel with the review into the Kumul legislation, the formulation of an asset management plan is also being considered. This process will require assessment reports on all assets currently being managed by state agencies, especially, the SOEs and is part of the Government’s broader policy intervention to improve governance frameworks for reporting and monitoring under the implementation of the Government Finance Statistics (GFS) 2014 reform work. 10.3 MANAGING MINING AND PETROLEUM ASSETS
Effectively managing the mining and petroleum sectors is important to the PNG economy and these sectors comprise significant portions of the State’s asset holdings. Economic growth has been driven by activities in the mining and petroleum sectors which have supported high levels of construction activity. The Government recognises the importance of prudently managing these sectors in order to maximise benefits for the community and ensure resource revenues are optimally utilised to assist in meeting its development objectives. In the medium term, commodity prices are expected to remain elevated, especially for mineral and petroleum commodities, allowing revenues to flow into the SWF thus allowing drawdowns into the budget. This is consistent with the formula of the SWF in the Organic Law that ensures the SWF’s important stabilisation role.
Potential future mining and petroleum projects include the Papua LNG, Pasca A Gas, Stanley Gas, P’nyang Gas, Yandera mining, Woodlark mining, Wafi-Golpu and Frieda River mining projects which are expected to contribute substantially to the domestic economy. On the proposed petroleum and gas projects, the Government established the State Negotiating Team (SNT) in early 2018 to facilitate agreement on the fiscal terms and term sheets have been submitted and significant progress has been made with agreement is expected to be reached over coming months with the project proponents. Developers of the Frieda River and Wafi-Golpu projects submitted their initial feasibility studies and application for mining licenses in 2016 for consideration and approval by the State. However, feasibility studies and the mining license applications have been delayed due to changes in the development concepts of both projects. The Wafi-Golpu project developer re-submitted its updated feasibility study in March 2018 and the Frieda River project developer has provided a commitments to submit its updated feasibility study report by the end of 2018. The State is currently assessing the Wafi-Golpu project mining license (ML) application before it grants the developer its ML, expected in the first half of 2019.

2019 National Budget, Volume 1
158
The Government will ensure the necessary policy and legislative changes are established to better regulate the sector and ensure revenue gains are optimised over the life of the project. In 2019 the Government will embark on the following:
• amend the Mining Act 1992 and the Petroleum Act 1998 to better regulate the mining sector;
• introduce a policy guiding State participation in resource projects and third party access in the oil and gas sector;
• introduce a policy to guide the distribution and management of benefits to landowners and sub-national governments;
• introduce policies on Domestic Market Obligations (DMO) for gas and petroleum products; and
• introduce policies and frameworks around ensuring national content. Whilst the Government embarks on the policy and legislative changes, it also recognizes the need to strengthen its concessional fiscal regime. The Government will apply a fiscal regime in the resource sector that broadly considers and promotes the following:
I. revenue maximisation – minimum State share (take) in net proceeds must be
50.0 per cent, preferably returned in the early part of the project life, but achieved
without deterring investment;
II. cost and risk minimisation – equity financing risks will be analysed and managed cost
effectively, with mitigation of revenue foregone through tax breaks, revenue
allocations through royalty credits and avoidance of tax risks;
III. global competiveness – ensuring the fiscal framework is competitively comparable to
other similar economies globally;
IV. standardisation – standardising the fiscal regime around terms that are less
concessional; and
V. segmentation – treating upstream and midstream taxation of projects separately,
thereby allowing for resource rents to be collected effectively from the utilisation of
resources in the different phases of production and this will be coupled with the IRC’s
increased ability to police potential transfer pricing issues.
The existing fiscal regime is considered reasonably concessional on global standards. Although this may have been justified on a first project basis, the keen interest in additional projects in the same sector should negate the need for higher-than-necessary concessional elements. The Government will focus on a major reform towards getting a standardised fiscal regime that is globally competitive and that provides maximum returns from resource extraction at minimal cost and acceptable risk levels.
10.4 BROADER REFORMS
In 2019, the Government will continue to review and implement a number of policy reforms to improve performance in the various sectors. The broad sector reforms that will continue into the medium term will focus on:
• reviewing the agricultural and other renewable resource sectors (forestry, fisheries, tourism, agriculture and livestock) to identify constraints and opportunities to increase production;

2019 National Budget, Volume 1
159
• formulating relevant policies and guidelines to ensure that the State provides needed support to agriculture and other impact renewable resource projects; and
• enforcing the Public Finance Management Act 1995 (Amended 2016) to:
i. improve compliance, monitoring and regulation of revenue streams to the Consolidated Revenue Fund (CRF) ;
ii. continue to support the Public Money Management Regularisation (PMMR) Act 2017; and
iii. implement the National Procurement Commission (NPC) Act. 10.4.1 Supporting the Renewable Resource Sector.
While resources are committed and focused towards building the renewable resource sector, challenges remain, which requires a concerted effort from relevant stakeholders to work collaboratively to achieve the Government’s policy objectives. One of these broader policy objectives is to ensure revenues generated from the mining and petroleum industries are used to revive the renewable resource sector to ensure a sustained and balanced economic growth path over the longer term. A review is being conducted with various state agencies involved in the renewable resource sectors, including commodity boards. The review started in 2017 and was done purposely to identify major challenges and opportunities in these sub sectors. The review intends to identify appropriate government intervention programs and will continue into 2019. 10.4.2 Public Financial Management Act (PFMA ) Reforms
The recently amended PFMA strengthens the Government’s public finance management system to streamline and better monitor the use of public funds by government agencies. This reform was part of the Public Expenditure and Financial Accountability (PEFA) assessment and roadmap 2015 – 2018. The roadmap assessment allows the government to identify and understand the challenges and weakness in the current public finance system and address the issues accordingly. This involves a multi–stakeholder approach with 13 various key Government agencies participating in the PEFA reform activities and providing reports to the PEFA Secretariat. The outcome is for improvement in the public finance management system that will translate into effective service delivery and development outputs in the country as a whole. Public Money Management Regularization (PMMR) Act 2017. As part of the holistic approach to reforming the Public Finance Management (PFM) system, the Government introduced the Public Money Management Regularisation (PMMR) Act 2017. PMMR Act 2017 is a reform process to ensure non-tax revenue derived from levies and fees/charges by both public and statutory bodies is directly remitted to the CRF. The PMMR Act 2017 requires 90.0 per cent of the revenue derived from levies and fees and charges collected by state agencies, on behalf of the Government, to be remitted back to CRF. State agencies are entitled to the remaining balance of 10.0 per cent to support their internal operations. Requests for additional operational and/or capital funding is
2019 National Budget, Volume 1
160
facilitated through the Budget Steering Committee (BSC) process as stipulated in the PMMR Act 2017. Any statutory entity that deals with public money in terms of revenue generated through levies and fees and charges and comes under the mandate of the PFMA, will have the PMMR Act 2017 applied to its operations. To facilitate the ongoing operations of affected entities, the swept funds were maintained in a mirror account allowing approved withdrawals with around K20.0 million a month directed to the CRF. The above process will be streamlined in 2019. The agencies that are affected by the PMMR Act would be required to make budget submissions starting 2019 to receive funding as the 90/10 revenue sharing rule will be null and void 2020 onwards. The PMMR Act requires all fees and charges to be remitted to the CRF starting 2020 onwards and the affected agencies would be wholly funded through the annual budget process. The detailed budget consultations with the affected agencies will commence in the first quarter of 2019 together with our annual process.
10.5 PUBLIC PRIVATE PARTNERSHIPS (PPP)
In 2019, a review of the Public Private Partnership (PPP) Act will be undertaken, with subsequent amendments submitted to Parliament for consideration. These amendments are expected to simplify the administration of the 2014 approved PPP legislation. The implementation of the 2014 PPP legislation will, however, continue in 2019. A high level work plan has been developed and includes activities such as:
i. setting up the PPP Centre; ii. developing a roadmap that will assist the Government to identify and implement a
pipeline of projects under potential PPP arrangements; and iii. ensuring that relevant PPP projects are selected, developed, delivered and managed
in a structured, transparent and efficient manner.
10.6 PNG EXTRACTIVE INDUSTRIES TRANSPARENCY INITIATIVE (PNGEITI)
The Papua New Guinea Extractive Industries Transparency Initiative (PNGEITI) Multi Stakeholder Group (MSG) has progressed work on the development of the PNGEITI National Policy and subsequent Legislation to provide the avenue for PNGEITI’s transition into an independent entity. A comprehensive consultation process has been undertaken with key stakeholders, industry and development partners culminating in the formulation of a Draft National Policy Paper. This draft Policy document will proceed into a final round of consultations with other stakeholder and the general public to ensure greater coverage of feedback and input is sought before the Policy Paper is finalized and presented to NEC for endorsement. This process is envisaged to align and compliment the currently endorsed NEC Decision on the Open Government Partnership (OGP) National Action Plan that incorporates Extractive Transparency as one of the four key clusters, with the main cluster activity being the development of the PNGEITI National Policy and Legislation. The PNGEITI also underwent Validation from April of this year. The Validation process is a key quality assurance mechanism undertaken by EITI International Secretariat on all EITI member countries to assess the implementation performance in becoming EITI compliant as per the EITI global best practice Standard. The International EITI Board determined that PNG has made ‘meaningful progress’ in its implementation of the EITI Standard and commended

2019 National Budget, Volume 1
161
PNG’s efforts in implementing reforms to address weaknesses in government systems and improving the level of transparency in the country’s extractive industries. PNG was also acknowledged as making satisfactory progress on all requirements related to governance and oversight of the EITI process, attributing the progress to strong government commitment and meaningful engagement by stakeholders. In 2019, PNGEITI MSG will continue to finalize work on the EITI National Policy and the subsequent legislation. It will also continue with the implementation of a number of projects including; Improving Extractive Resources Related Revenue Management under the JICA Technical Cooperation Program, implementation of activities related to Beneficial Ownership Roadmap Disclosure, Scoping Study on Subnational Payments funded by the Government of Australia under the Pacific Governance Facility (PGF) and other outreach and general awareness programs in preparation to establish EITI desks at resources host provinces. The PNGEITI MSG will continue to engage in various development forums for new projects (and review of existing agreements) to ensure that transparency mechanisms are built into the MOAs for EITI reporting purposes. The publication of the 2017 Financial Year EITI Report is expected to be released by December of 2018 ensuring that PNGEITI is now up to date with its reporting requirements as per the EITI Standard.

2019 National Budget, Volume 1
162
APPENDIX 1: GRANTS AND TRANSFERS TO PROVINCES
Table 1.1: National Governments Grants to Provincial and Local Level Governments (Kina Thousand)
Table 1.2: Grants, Transfers and other resources of the Provinces (Kina Thousand)

2019 National Budget, Volume 1
163
Table 1.1: National Governments Grants to Provincial and Local Level Governments (Kina Thousand)
PS Salaries Teachers Salaries PS leave fares Teachers leave faresVillage Court
Allowances
Land Mediation
Allowances
Western 15,010,188.00 43,187,255.00 2,100,002.00 2,730,122.00 - - 63,027,567.00 9,429,340 6,942,508 10,071,795 2,838,338 348,678 95,037 1,454,301 384,638 31,564,634 718,731 2,767,756 3,486,487 35,051,122 98,078,689
Gulf 11,817,640.00 19,414,895.00 300,002.00 618,893.00 - - 32,151,430.00 4,995,699 4,069,368 5,789,269 2,035,341 422,593 49,125 1,505,257 1,982,471 20,849,123 138,603 1,283,225 1,421,827 22,270,951 54,422,381
Central 15,641,879.00 61,294,651.00 300,002.00 2,705,353.00 - - 79,941,885.00 6,903,322 7,137,757 11,768,050 2,877,762 555,198 87,984 2,796,642 2,142,621 34,269,338 - 1,921,744 1,921,744 36,191,082 116,132,967
NCD* - - - - - - - - - -
Milne Bay 8,322,283.00 64,286,868.00 320,002.00 1,157,667.00 - - 74,086,820.00 6,679,438 7,027,015 6,824,854 2,614,588 388,775 69,632 3,305,328 1,997,683 28,907,312 279,254 2,284,121 2,563,376 31,470,688 105,557,508
Oro 11,577,999.00 27,438,584.00 500,002.00 1,243,145.00 - - 40,759,730.00 4,538,084 3,989,907 4,077,165 1,993,214 332,162 63,611 1,988,137 1,047,434 18,029,714 693,696 1,625,845 2,319,541 20,349,255 61,108,985
Southern Highlands 26,226,215.00 67,259,434.00 370,002.00 740,570.00 - - 94,596,221.00 4,661,225 7,225,773 5,449,080 1,317,461 441,197 53,252 1,645,553 1,408,273 22,201,813 660,606 2,345,900 3,006,506 25,208,319 119,804,540
Hela 9,939,400.00 34,690,649.00 150,002.00 309,355.00 - - 45,089,406.00 7,493,523 5,683,231 5,619,289 2,186,781 594,794 93,497 2,112,334 2,948,814 26,732,263 925,093 1,428,450 2,353,543 29,085,806 74,175,212
Enga 10,403,673.00 66,189,366.00 200,002.00 1,000,002.00 - - 77,793,043.00 2,960,577 3,970,824 6,597,473 782,050 307,997 25,912 1,592,746 1,193,232 17,430,811 230,290 2,486,855 2,717,145 20,147,956 97,940,999
Western Highlands 14,662,842.00 98,642,177.00 380,002.00 1,357,827.00 - - 115,042,848.00 3,361,757 3,217,397 4,576,163 1,058,955 359,070 53,099 955,080 849,304 14,430,824 773,207 1,807,664 2,580,871 17,011,695 132,054,543
Jiwaka 11,489,762.00 52,512,234.00 125,002.00 487,770.00 - - 64,614,768.00 5,408,713 7,793,931 11,850,437 1,309,973 402,723 83,834 2,218,997 2,273,780 31,342,387 - 1,226,532 1,226,532 32,568,919 97,183,687
Simbu 19,570,396.00 71,108,601.00 200,002.00 891,403.00 - - 91,770,402.00 7,025,681 11,041,034 11,756,459 2,001,395 788,472 90,308 3,244,788 4,143,976 40,092,112 366,160 1,403,245 1,769,406 41,861,517 133,631,919
Eastern Highlands 10,153,184.00 108,659,966.00 700,002.00 1,340,038.00 - - 120,853,190.00 7,389,851 10,971,768 17,676,023 2,713,767 657,738 77,356 3,657,272 3,020,224 46,164,000 719,838 2,577,687 3,297,525 49,461,525 170,314,715
Morobe 31,484,292.00 139,471,758.00 1,200,002.00 5,528,246.00 - - 177,684,298.00 - - - - - - - - - 2,404,902 4,554,710 6,959,612 6,959,612 184,643,910
Madang 25,367,917.00 94,782,136.00 700,002.00 2,217,868.00 - - 123,067,923.00 9,503,892 9,449,405 12,994,640 3,761,507 585,675 66,938 3,722,921 3,577,480 43,662,457 847,183 3,635,095 4,482,279 48,144,736 171,212,659
East Sepik 18,690,039.00 76,529,700.00 1,000,002.00 1,000,002.00 - - 97,219,743.00 9,664,817 11,264,660 18,323,795 3,180,789 651,478 54,781 2,814,333 3,198,114 49,152,768 633,874 4,050,464 4,684,338 53,837,107 151,056,850
Sandaun 11,998,124.00 45,878,507.00 700,002.00 1,121,497.00 - - 59,698,130.00 10,140,652 9,686,359 8,860,623 3,854,688 526,357 81,358 2,468,434 3,909,288 39,527,761 475,724 3,666,883 4,142,607 43,670,367 103,368,497
Manus 8,462,658.00 25,185,908.00 500,002.00 682,384.00 - - 34,830,952.00 741,771 820,226 677,382 244,820 107,176 54,027 149,424 81,590 2,876,416 209,187 478,804 687,992 3,564,408 38,395,360
New Ireland 15,568,683.00 35,984,371.00 2,350,002.00 853,577.00 - - 54,756,633.00 - - - - - - - - - 393,905 1,041,018 1,434,923 1,434,923 56,191,556
East New Britain 20,555,032.00 80,647,516.00 300,002.00 1,352,488.00 - - 102,855,038.00 2,526,003 2,598,167 2,824,859 1,499,368 151,701 38,519 620,008 487,614 10,746,239 865,530 2,514,817 3,380,347 14,126,586 116,981,624
West New Britain 16,626,514.00 55,645,483.00 1,000,002.00 3,354,521.00 - - 76,626,520.00 5,295,408 7,418,342 7,400,768 3,317,297 505,278 160,260 2,221,599 1,844,527 28,163,478 539,879 1,574,290 2,114,169 30,277,647 106,904,167
Bougainville* 41,057,047.00 65,034,004.00 465,000.00 2,965,996.00 - - 109,522,047.00
TOTAL 354,625,767 1,333,844,063 13,860,040 33,658,724.00 - - 1,735,988,594.00 108,719,752 120,307,671 153,138,125 39,588,094 8,127,063 1,298,529 38,473,153 36,491,064 506,143,451 11,875,662 44,675,108 56,550,769 562,694,220 2,189,160,767
Note:
NCD and Bougainville are not part of the Intergovernmental Financing Arrangement therefore do not receive any function grants
NCD receives Goods and Services Grant through a single Town and Services Grant indicated under urban LLG Grants category
ABG receive Goods and Services Grants through a single category of Recurrent Goods and Services Grants
Village Court and Land Mediation Allowances are now paid through the Alesco payroll system and are budgeted under the Village Court & Land Mediation Secretariat
Province
Personnel Emoluments Goods and Services
Total Recurrent Grants (a) + (b)
Salaries Leave fares Allowances
Sub-total PE (a)Health Function
Grant
Total Provincial
Government GrantsUrban LLG Grants Rural LLG Grants Total LLG Grants Sub - total G&S (b)Administration GrantEducation Function Grant
Transport
Infrastructure
Maintenance
Function Grant
Primary Production Function
GrantVillage Courts Function Grant Land Mediation Grant
Other Service Delivery
Function Grant

2019 National Budget, Volume 1
164
Table 1.2: Grants, Transfers and other resources of the Provinces (Kina Thousand)
Total Grants and Transfers
Recurrent Budget GST (1)Bookmakers Tax
(2)
Mining & Petroleum
Royalties/Dividends (3)
Own Source
Revenues (4)
Western 98,078,689 5,346,000 0 21,300,000 1,310,385 126,035,074
Gulf 54,422,381 930,060 0 9,485,000 276,728 65,114,169
Central 116,132,967 1,982,790 0 0 655,164 118,770,920
NCD* 0 280,973,540 5,468,000 0 0 286,441,540
Milne Bay 105,557,508 9,358,880 0 0 326,051 115,242,439
Oro 61,108,985 5,276,740 0 0 706,657 67,092,383
Southern Highlands 119,804,540 4,912,050 0 20,471,642 2,506,262 147,694,494
Hela 74,175,212 693,420 0 0 304,450 75,173,082
Enga 97,940,999 2,971,430 0 28,990,000 16,419,568 146,321,997
Western Highlands 132,054,543 29,568,960 302,000 0 3,709,343 165,634,846
Jiwaka 97,183,687 799,930 0 0 0 97,983,617
Simbu 133,631,919 4,025,050 0 0 1,826,599 139,483,569
Eastern Highlands 170,314,715 16,929,910 433,000 0 3,591,736 191,269,361
Morobe 184,643,910 123,277,350 1,418,000 1,173,313 11,470,659 321,983,232
Madang 171,212,659 15,295,710 1,296,000 0 2,610,480 190,414,849
East Sepik 151,056,850 17,099,500 0 0 2,886,187 171,042,537
Sandaun 103,368,497 3,814,990 0 0 3,357,368 110,540,855
Manus 38,395,360 22,122,330 0 0 1,006,613 61,524,303
New Ireland 56,191,556 7,487,520 0 59,987,484 1,530,485 125,197,045
East New Britain 116,981,624 35,055,770 148,000 0 3,716,000 155,901,394
West New Britain 106,904,167 16,440,380 143,000 0 3,258,500 126,746,047
Bougainville* 0 0 0 0 0
TOTAL 2,189,160,767 604,362,310 9,208,000 141,407,439 61,469,236 3,005,607,752
Notes
1) GST is based on 60% of the 2017 net inland GST collections, to be distributed to each province in 2019
2) Bookmakers is 40% of 2017 net collections
3) NEFC estimate based on 2017 actual collections which includes dividends from equity shares of mining and petroleum resource projects
4) NEFC estimate based on 2017 Actuals
5) NEFC does not provide Own Source Revenue (4) estimates for NCD and Bougainville as these provinces are not part of Intergovernmental Financing Arrangement
Province
Non-Grant tax transfers
Total

2019 National Budget, Volume 1
165
APPENDIX 2: TABLES ON ECONOMIC AND FISCAL DATA
Table 1: Gross Domestic Product by Economic Activity at Current and Constant
Prices Table 2: Contributions to Growth in Real Gross Domestic Product Table 3: Prices of Main Export Commodities Table 4: Volume of Main Export Commodities Table 5: Value of Main Export Commodities Table 6: Summary of Balance of Payments Table 7: Employment Classified by Industry Table 8: Monetary Aggregates Table 9: Major Assumptions Underlying the Budget Table 10: Statement of Operations for the General Government Table 11: Statement of Sources and Uses of Cash for the General Government Table 12: General Government Revenue by Economic Classification Table 13A: General Government Expense by Economic Classification Table 13B: General Government Expense by Agency Type and Economic Classification Table 14: Transactions in Assets and Liabilities for the General Government Table 15: Stocks of General Government Debt Table 16: Sovereign Wealth Fund – Stabilisation Fund Table 17: Sovereign Wealth Fund – Savings Fund
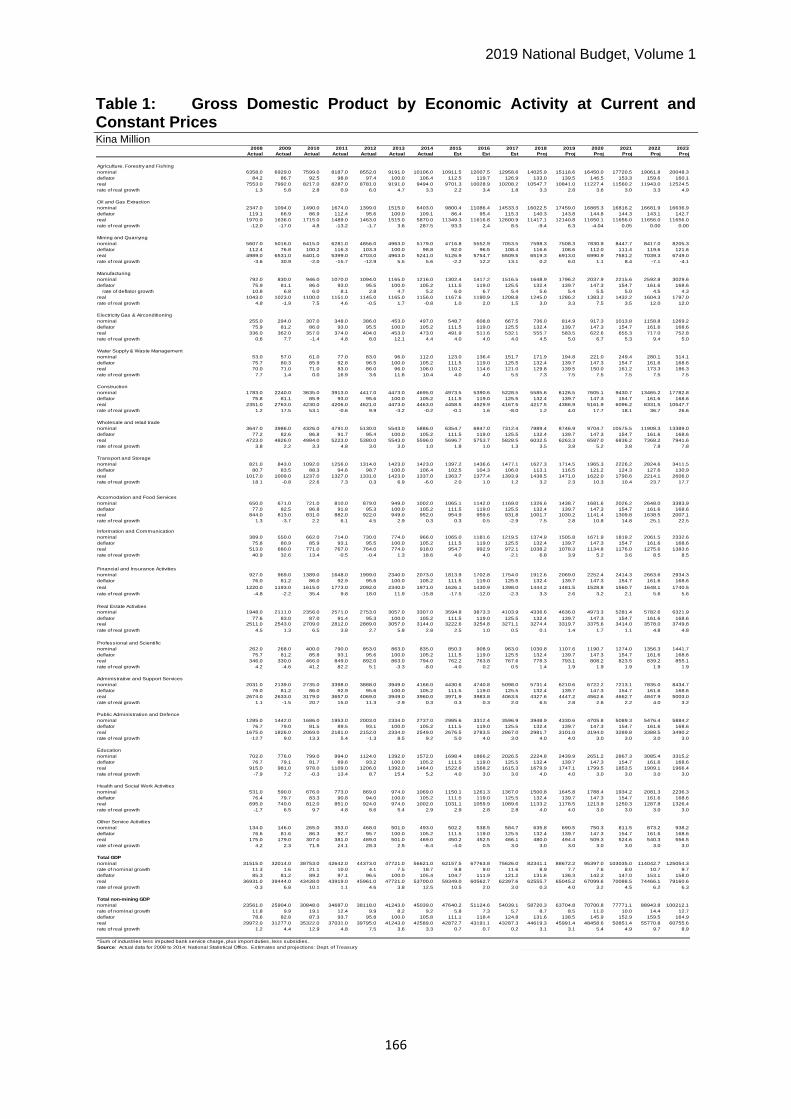
2019 National Budget, Volume 1
166
Table 1: Gross Domestic Product by Economic Activity at Current and Constant Prices Kina Million
2008 2009 2010 2011 2012 2013 2014 2015 2016 2017 2018 2019 2020 2021 2022 2023
Actual Actual Actual Actual Actual Actual Actual Est Est Est Proj Proj Proj Proj Proj Proj
Agriculture, Forestry and Fishing
nominal 6358.0 6929.0 7599.0 8187.0 8552.0 9191.0 10106.0 10911.5 12007.5 12958.6 14025.9 15118.6 16450.0 17720.5 19061.8 20048.3
deflator 84.2 86.7 92.5 98.8 97.4 100.0 106.4 112.5 119.7 126.9 133.0 139.5 146.5 153.3 159.6 160.1
real 7553.0 7992.0 8217.0 8287.0 8781.0 9191.0 9494.0 9701.3 10028.9 10208.2 10547.7 10841.0 11227.4 11560.2 11943.0 12524.5
rate of real growth 1.3 5.8 2.8 0.9 6.0 4.7 3.3 2.2 3.4 1.8 3.3 2.8 3.6 3.0 3.3 4.9
Oil and Gas Extraction
nominal 2347.0 1094.0 1490.0 1674.0 1399.0 1515.0 6403.0 9800.4 11086.4 14533.3 16022.5 17459.0 16865.3 16816.2 16681.9 16636.9
deflator 119.1 66.9 86.9 112.4 95.6 100.0 109.1 86.4 95.4 115.3 140.3 143.8 144.8 144.3 143.1 142.7
real 1970.0 1636.0 1715.0 1489.0 1463.0 1515.0 5870.0 11349.3 11616.8 12600.9 11417.1 12140.8 11650.1 11656.0 11656.0 11656.0
rate of real growth -12.0 -17.0 4.8 -13.2 -1.7 3.6 287.5 93.3 2.4 8.5 -9.4 6.3 -4.04 0.05 0.00 0.00
Mining and Quarrying
nominal 5607.0 5016.0 6415.0 6281.0 4856.0 4963.0 5179.0 4716.8 5552.9 7053.5 7598.3 7508.3 7830.9 8447.7 8417.0 8205.3
deflator 112.4 76.8 100.2 116.3 103.3 100.0 98.8 92.0 96.5 108.4 116.6 108.6 112.0 111.4 119.6 121.6
real 4989.0 6531.0 6401.0 5399.0 4703.0 4963.0 5241.0 5126.9 5754.7 6509.5 6519.3 6913.0 6990.9 7581.2 7039.3 6749.0
rate of real growth -3.6 30.9 -2.0 -15.7 -12.9 5.5 5.6 -2.2 12.2 13.1 0.2 6.0 1.1 8.4 -7.1 -4.1
Manufacturing
nominal 792.0 830.0 946.0 1070.0 1094.0 1165.0 1216.0 1302.4 1417.2 1516.5 1648.9 1796.2 2037.9 2215.6 2592.8 3029.6
deflator 75.9 81.1 86.0 93.0 95.5 100.0 105.2 111.5 119.0 125.5 132.4 139.7 147.3 154.7 161.6 168.6
rate of deflator growth 10.8 6.8 6.0 8.1 2.8 4.7 5.2 6.0 6.7 5.4 5.6 5.4 5.5 5.0 4.5 4.3
real 1043.0 1023.0 1100.0 1151.0 1145.0 1165.0 1156.0 1167.6 1190.9 1208.8 1245.0 1286.2 1383.2 1432.2 1604.3 1797.0
rate of real growth 4.8 -1.9 7.5 4.6 -0.5 1.7 -0.8 1.0 2.0 1.5 3.0 3.3 7.5 3.5 12.0 12.0
Electricity Gas & Airconditioning
nominal 255.0 294.0 307.0 348.0 386.0 453.0 497.0 548.7 608.8 667.5 736.0 814.9 917.3 1013.8 1158.8 1269.2
deflator 75.9 81.2 86.0 93.0 95.5 100.0 105.2 111.5 119.0 125.5 132.4 139.7 147.3 154.7 161.6 168.6
real 336.0 362.0 357.0 374.0 404.0 453.0 473.0 491.9 511.6 532.1 555.7 583.5 622.6 655.3 717.0 752.8
rate of real growth 0.6 7.7 -1.4 4.8 8.0 12.1 4.4 4.0 4.0 4.0 4.5 5.0 6.7 5.3 9.4 5.0
Water Supply & Waste Management
nominal 53.0 57.0 61.0 77.0 83.0 96.0 112.0 123.0 136.4 151.7 171.9 194.8 221.0 249.4 280.1 314.1
deflator 75.7 80.3 85.9 92.8 96.5 100.0 105.2 111.5 119.0 125.5 132.4 139.7 147.3 154.7 161.6 168.6
real 70.0 71.0 71.0 83.0 86.0 96.0 106.0 110.2 114.6 121.0 129.8 139.5 150.0 161.2 173.3 186.3
rate of real growth 7.7 1.4 0.0 16.9 3.6 11.6 10.4 4.0 4.0 5.5 7.3 7.5 7.5 7.5 7.5 7.5
Construction
nominal 1783.0 2240.0 3635.0 3913.0 4417.0 4473.0 4695.0 4973.5 5390.6 5228.5 5585.6 6126.5 7605.1 9430.7 13465.2 17782.8
deflator 75.8 81.1 85.9 93.0 95.6 100.0 105.2 111.5 119.0 125.5 132.4 139.7 147.3 154.7 161.6 168.6
real 2351.0 2763.0 4230.0 4206.0 4621.0 4473.0 4463.0 4458.5 4529.9 4167.5 4217.5 4386.9 5161.9 6096.2 8331.5 10547.7
rate of real growth 1.2 17.5 53.1 -0.6 9.9 -3.2 -0.2 -0.1 1.6 -8.0 1.2 4.0 17.7 18.1 36.7 26.6
Wholesale and retail trade
nominal 3647.0 3986.0 4326.0 4791.0 5130.0 5543.0 5886.0 6354.7 6847.0 7312.4 7989.4 8746.9 9704.7 10575.5 11908.3 13389.0
deflator 77.2 82.6 86.8 91.7 95.4 100.0 105.2 111.5 119.0 125.5 132.4 139.7 147.3 154.7 161.6 168.6
real 4723.0 4826.0 4984.0 5223.0 5380.0 5543.0 5596.0 5696.7 5753.7 5828.5 6032.5 6263.3 6587.0 6836.2 7368.2 7941.6
rate of real growth 3.8 2.2 3.3 4.8 3.0 3.0 1.0 1.8 1.0 1.3 3.5 3.8 5.2 3.8 7.8 7.8
Transport and Storage
nominal 821.0 843.0 1092.0 1256.0 1314.0 1423.0 1423.0 1397.2 1436.6 1477.1 1627.3 1714.5 1965.3 2226.2 2824.6 3411.5
deflator 80.7 83.5 88.3 94.6 98.7 100.0 106.4 102.5 104.3 106.0 113.1 116.5 121.2 124.3 127.6 130.9
real 1017.0 1009.0 1237.0 1327.0 1331.0 1423.0 1337.0 1363.7 1377.4 1393.9 1438.5 1471.0 1622.0 1790.6 2214.1 2606.0
rate of real growth 18.1 -0.8 22.6 7.3 0.3 6.9 -6.0 2.0 1.0 1.2 3.2 2.3 10.3 10.4 23.7 17.7
Accomodation and Food Services
nominal 650.0 671.0 721.0 810.0 879.0 949.0 1002.0 1065.1 1142.0 1169.0 1326.6 1438.7 1681.6 2026.2 2648.0 3383.9
deflator 77.0 82.5 86.8 91.8 95.3 100.0 105.2 111.5 119.0 125.5 132.4 139.7 147.3 154.7 161.6 168.6
real 844.0 813.0 831.0 882.0 922.0 949.0 952.0 954.9 959.6 931.8 1001.7 1030.2 1141.4 1309.8 1638.5 2007.1
rate of real growth 1.3 -3.7 2.2 6.1 4.5 2.9 0.3 0.3 0.5 -2.9 7.5 2.8 10.8 14.8 25.1 22.5
Information and Communication
nominal 389.0 550.0 662.0 714.0 730.0 774.0 966.0 1065.0 1181.6 1219.5 1374.9 1505.8 1671.9 1819.2 2061.5 2332.6
deflator 75.8 80.9 85.9 93.1 95.5 100.0 105.2 111.5 119.0 125.5 132.4 139.7 147.3 154.7 161.6 168.6
real 513.0 680.0 771.0 767.0 764.0 774.0 918.0 954.7 992.9 972.1 1038.2 1078.3 1134.8 1176.0 1275.6 1383.6
rate of real growth 40.9 32.6 13.4 -0.5 -0.4 1.3 18.6 4.0 4.0 -2.1 6.8 3.9 5.2 3.6 8.5 8.5
Financial and Insurance Activities
nominal 927.0 969.0 1389.0 1648.0 1999.0 2340.0 2073.0 1813.9 1702.8 1754.0 1912.6 2069.0 2252.4 2414.3 2663.6 2934.3
deflator 76.0 81.2 86.0 92.9 95.6 100.0 105.2 111.5 119.0 125.5 132.4 139.7 147.3 154.7 161.6 168.6
real 1220.0 1193.0 1615.0 1773.0 2092.0 2340.0 1971.0 1626.1 1430.9 1398.0 1444.2 1481.5 1528.8 1560.7 1648.1 1740.5
rate of real growth -4.8 -2.2 35.4 9.8 18.0 11.9 -15.8 -17.5 -12.0 -2.3 3.3 2.6 3.2 2.1 5.6 5.6
Real Estate Activities
nominal 1948.0 2111.0 2356.0 2571.0 2753.0 3057.0 3307.0 3594.8 3873.3 4103.9 4336.6 4636.0 4973.3 5281.4 5782.6 6321.9
deflator 77.6 83.0 87.0 91.4 95.3 100.0 105.2 111.5 119.0 125.5 132.4 139.7 147.3 154.7 161.6 168.6
real 2511.0 2543.0 2709.0 2812.0 2889.0 3057.0 3144.0 3222.6 3254.8 3271.1 3274.4 3319.7 3375.6 3414.0 3578.0 3749.8
rate of real growth 4.5 1.3 6.5 3.8 2.7 5.8 2.8 2.5 1.0 0.5 0.1 1.4 1.7 1.1 4.8 4.8
Professional and Scientific
nominal 262.0 268.0 400.0 790.0 853.0 863.0 835.0 850.3 908.9 963.0 1030.8 1107.6 1190.7 1274.0 1356.3 1441.7
deflator 75.7 81.2 85.8 93.1 95.6 100.0 105.2 111.5 119.0 125.5 132.4 139.7 147.3 154.7 161.6 168.6
real 346.0 330.0 466.0 849.0 892.0 863.0 794.0 762.2 763.8 767.6 778.3 793.1 808.2 823.5 839.2 855.1
rate of real growth 4.2 -4.6 41.2 82.2 5.1 -3.3 -8.0 -4.0 0.2 0.5 1.4 1.9 1.9 1.9 1.9 1.9
Administrative and Support Services
nominal 2031.0 2139.0 2735.0 3398.0 3888.0 3949.0 4166.0 4430.6 4740.8 5098.0 5731.4 6210.6 6722.2 7213.1 7835.0 8434.7
deflator 76.0 81.2 86.0 92.9 95.6 100.0 105.2 111.5 119.0 125.5 132.4 139.7 147.3 154.7 161.6 168.6
real 2674.0 2633.0 3179.0 3657.0 4069.0 3949.0 3960.0 3971.9 3983.8 4063.5 4327.6 4447.2 4562.6 4662.7 4847.9 5003.0
rate of real growth 1.1 -1.5 20.7 15.0 11.3 -2.9 0.3 0.3 0.3 2.0 6.5 2.8 2.6 2.2 4.0 3.2
Public Administration and Defence
nominal 1285.0 1442.0 1686.0 1953.0 2003.0 2334.0 2737.0 2985.6 3312.4 3596.9 3948.9 4330.6 4705.8 5089.3 5476.4 5884.2
deflator 76.7 79.0 81.5 89.5 93.1 100.0 105.2 111.5 119.0 125.5 132.4 139.7 147.3 154.7 161.6 168.6
real 1675.0 1826.0 2069.0 2181.0 2152.0 2334.0 2549.0 2676.5 2783.5 2867.0 2981.7 3101.0 3194.0 3289.8 3388.5 3490.2
rate of real growth -12.7 9.0 13.3 5.4 -1.3 8.5 9.2 5.0 4.0 3.0 4.0 4.0 3.0 3.0 3.0 3.0
Education
nominal 702.0 776.0 799.0 994.0 1124.0 1392.0 1572.0 1698.4 1866.2 2026.5 2224.8 2439.9 2651.2 2867.3 3085.4 3315.2
deflator 76.7 79.1 81.7 89.6 93.2 100.0 105.2 111.5 119.0 125.5 132.4 139.7 147.3 154.7 161.6 168.6
real 915.0 981.0 978.0 1109.0 1206.0 1392.0 1464.0 1522.6 1568.2 1615.3 1679.9 1747.1 1799.5 1853.5 1909.1 1966.4
rate of real growth -7.9 7.2 -0.3 13.4 8.7 15.4 5.2 4.0 3.0 3.0 4.0 4.0 3.0 3.0 3.0 3.0
Health and Social Work Activities
nominal 531.0 590.0 676.0 773.0 869.0 974.0 1069.0 1150.1 1261.3 1367.0 1500.8 1645.8 1788.4 1934.2 2081.3 2236.3
deflator 76.4 79.7 83.3 90.8 94.0 100.0 105.2 111.5 119.0 125.5 132.4 139.7 147.3 154.7 161.6 168.6
real 695.0 740.0 812.0 851.0 924.0 974.0 1002.0 1031.1 1059.9 1089.6 1133.2 1178.5 1213.9 1250.3 1287.8 1326.4
rate of real growth -1.7 6.5 9.7 4.8 8.6 5.4 2.9 2.9 2.8 2.8 4.0 4.0 3.0 3.0 3.0 3.0
Other Service Activities
nominal 134.0 146.0 265.0 353.0 468.0 501.0 493.0 502.2 538.5 584.7 635.8 690.5 750.3 811.5 873.2 938.2
deflator 76.6 81.6 86.3 92.7 95.7 100.0 105.2 111.5 119.0 125.5 132.4 139.7 147.3 154.7 161.6 168.6
real 175.0 179.0 307.0 381.0 489.0 501.0 469.0 450.2 452.5 466.1 480.0 494.4 509.3 524.6 540.3 556.5
rate of real growth 4.2 2.3 71.5 24.1 28.3 2.5 -6.4 -4.0 0.5 3.0 3.0 3.0 3.0 3.0 3.0 3.0
Total GDP
nominal 31515.0 32014.0 38753.0 42642.0 44373.0 47721.0 56621.0 62157.5 67763.8 75626.0 82341.1 88672.2 95397.0 103035.0 114042.7 125054.3
rate of nominal growth 11.3 1.6 21.1 10.0 4.1 7.5 18.7 9.8 9.0 11.6 8.9 7.7 7.6 8.0 10.7 9.7
deflator 85.3 81.2 89.2 97.1 96.5 100.0 105.4 104.7 111.9 121.2 131.6 136.3 142.2 147.0 153.1 158.0
real 36931.0 39444.0 43438.0 43919.0 45961.0 47721.0 53700.0 59349.0 60562.7 62397.6 62555.7 65045.2 67099.6 70088.5 74466.1 79160.6
rate of real growth -0.3 6.8 10.1 1.1 4.6 3.8 12.5 10.5 2.0 3.0 0.3 4.0 3.2 4.5 6.2 6.3
Total non-mining GDP
nominal 23561.0 25904.0 30848.0 34687.0 38118.0 41243.0 45039.0 47640.2 51124.6 54039.1 58720.3 63704.8 70700.8 77771.1 88943.8 100212.1
rate of nominal growth 11.8 9.9 19.1 12.4 9.9 8.2 9.2 5.8 7.3 5.7 8.7 8.5 11.0 10.0 14.4 12.7
deflator 78.6 82.8 87.3 93.7 95.8 100.0 105.8 111.1 118.4 124.8 131.6 138.5 145.9 152.9 159.5 164.9
real 29972.0 31277.0 35322.0 37031.0 39795.0 41243.0 42589.0 42872.7 43191.1 43287.3 44619.3 45991.4 48458.6 50851.4 55770.8 60755.6
rate of real growth 1.2 4.4 12.9 4.8 7.5 3.6 3.3 0.7 0.7 0.2 3.1 3.1 5.4 4.9 9.7 8.9
*Sum of industries less imputed bank service charge, plus import duties, less subsidies.
Source: Actual data for 2008 to 2014: National Statistical Office. Estimates and projections: Dept. of Treasury

2019 National Budget, Volume 1
167
Table 2: Contributions to Growth in Real Gross Domestic Product (Percentage points)
2008 2009 2010 2011 2012 2013 2014 2015 2016 2017 2018 2019 2020 2021 2022 2023
Actual Actual Actual Est Actual Actual Actual Actual Est Est Proj Proj Proj Proj Proj Proj
Agriculture, Forestry and Fishing 0.3 1.2 0.6 0.2 1.1 0.9 0.6 0.4 0.6 0.3 0.5 0.5 0.6 0.5 0.5 0.8
Oil and Gas Extraction -0.7 -0.9 0.2 -0.5 -0.1 0.1 9.1 10.2 0.5 1.6 -1.9 1.2 -0.8 0.0 0.0 0.0
Mining and Quarrying -0.5 4.2 -0.3 -2.3 -1.6 0.6 0.6 -0.2 1.1 1.2 0.0 0.6 0.1 0.9 -0.8 -0.4
Manufacturing 0.1 -0.1 0.2 0.1 0.0 0.0 0.0 0.0 0.0 0.0 0.1 0.1 0.1 0.1 0.2 0.3
Electricity Gas & Airconditioning 0.0 0.1 0.0 0.0 0.1 0.1 0.0 0.0 0.0 0.0 0.0 0.0 0.1 0.0 0.1 0.0
Water Supply & Waste Management 0.0 0.0 0.0 0.0 0.0 0.0 0.0 0.0 0.0 0.0 0.0 0.0 0.0 0.0 0.0 0.0
Construction 0.1 1.1 3.7 -0.1 0.9 -0.3 0.0 0.0 0.1 -0.6 0.1 0.3 1.2 1.4 3.2 3.0
Wholesale and retail trade 0.5 0.3 0.4 0.6 0.4 0.4 0.1 0.2 0.1 0.1 0.3 0.4 0.5 0.4 0.8 0.8
Transport and Storage 0.4 0.0 0.6 0.2 0.0 0.2 -0.2 0.0 0.0 0.0 0.1 0.1 0.2 0.3 0.6 0.5
Accomodation and Food Services 0.0 -0.1 0.0 0.1 0.1 0.1 0.0 0.0 0.0 0.0 0.1 0.0 0.2 0.3 0.5 0.5
Information and Communication 0.4 0.5 0.2 0.0 0.0 0.0 0.3 0.1 0.1 0.0 0.1 0.1 0.1 0.1 0.1 0.1
Financial and Insurance Activities -0.2 -0.1 1.1 0.4 0.7 0.5 -0.8 -0.6 -0.3 -0.1 0.1 0.1 0.1 0.0 0.1 0.1
Real Estate Activities 0.3 0.1 0.4 0.2 0.2 0.4 0.2 0.1 0.1 0.0 0.0 0.1 0.1 0.1 0.2 0.2
Professional and Scientific 0.0 0.0 0.3 0.9 0.1 -0.1 -0.1 -0.1 0.0 0.0 0.0 0.0 0.0 0.0 0.0 0.0
Administrative and Support Services 0.1 -0.1 1.4 1.1 0.9 -0.3 0.0 0.0 0.0 0.1 0.4 0.2 0.2 0.1 0.3 0.2
Public Administration and Defence -0.7 0.4 0.6 0.3 -0.1 0.4 0.5 0.2 0.2 0.1 0.2 0.2 0.1 0.1 0.1 0.1
Education -0.2 0.2 0.0 0.3 0.2 0.4 0.2 0.1 0.1 0.1 0.1 0.1 0.1 0.1 0.1 0.1
Health and Social Work Activities 0.0 0.1 0.2 0.1 0.2 0.1 0.1 0.1 0.0 0.0 0.1 0.1 0.1 0.1 0.1 0.1
Other Service Activities 0.0 0.0 0.3 0.2 0.2 0.0 -0.1 0.0 0.0 0.0 0.0 0.0 0.0 0.0 0.0 0.0
TOTAL GDP* -0.3 6.8 10.1 1.1 4.6 3.8 12.5 10.5 2.0 3.0 0.3 4.0 3.2 4.5 6.2 6.3
Total Non-mining GDP 1.2 4.4 12.9 4.8 7.5 3.6 3.3 0.7 0.7 0.2 3.1 3.1 5.4 4.9 9.7 8.9
*Sum of industries less imputed bank service charge, plus import duties, less subsidies.
Source: Actual National Statistsical data up to 2014.Estimates and projections-Department of Treasury

2019 National Budget, Volume 1
168
Table 3: Prices of Main Export Commodities
2015 2016 2017 2018 2019 2020 2021 2022 2023
Actual Est Est Proj Proj Proj Proj Proj Proj
AGRICULTURE
Copra 1339 1848 2999 2302 2341 2354 2358 2358 2358
Cocoa 8260 9358 6470 7546 7235 7349 7349 7349 7349
Coffee 9220 9358 10714 9841 10409 11584 12377 12377 12377
Palm Oil 1720 1877 2155 1951 1987 1987 1987 1987 1987
Rubber 3534 3333 4655 4517 4663 4621 4598 4598 4598
Tea 3939 4222 4727 4872 4994 5019 5039 5039 5039
Copra Oil 2690 3358 4519 3598 3643 3643 3643 3643 3643
Logs (K/m³) 269 294 302 312 314 313 313 313 313
MINERALS
Gold (US$/oz) 1160 1248 1258 1261 1218 1255 1257 1343 1381.7
Copper (US$/ton) 5502 4865 6166 6476 6200 6270 6220 6318 6318
Oil (Kutubu Crude: US$/barrel) 49 44 51 68 68 65 64 60 59.4
LNG (US$ per thousand cubic feet) 8 8 9 10 10 10 10 10 10
Nickel (US$/tonne) 11831 9595 10415 11190 9556 10648 10648 12231 13278
Cobalt (US$/tonne) 29255 25639 55988 75256 45682 40955 40955 44901 32739
Source: Actuals from BPNG. Projections Dept. of Treasury.

2019 National Budget, Volume 1
169
Table 4: Volume of Main Export Commodities
2015 2016 2017 2018 2019 2020 2021 2022 2023
Actual Est Est Proj Proj Proj Proj Proj Proj
AGRICULTURE
Copra 33.6 43.5 50.6 44.6 41.1 41.8 41.0 44.4 44.4
Cocoa 30.9 40.1 31.9 38.2 41.6 51.0 63.1 77.0 96.4
Coffee 42.8 68.0 47.8 54.2 45.7 51.5 45.7 51.5 45.7
Palm Oil 486.9 540.7 621.8 561.1 587.4 628.6 631.3 629.5 638.9
Rubber 2.2 2.4 2.9 2.9 2.9 2.9 2.8 2.8 3.0
Tea 1.3 0.9 1.1 1.0 1.2 1.3 1.3 1.3 1.3
Copra Oil 14.6 17.9 16.2 16.0 14.8 13.9 12.9 12.6 12.6
Logs 3869.3 3605.9 2756.9 3087.7 3180.4 3244.0 3276.4 3276.4 3276.4
Marine products 77.7 80.0 82.4 84.9 87.4 90.1 92.8 95.6 98.4
MINERAL
Gold (tonnes) 53.5 59.1 62.9 64.9 69.5 71.3 72.9 68.2 64.5
Silver (tonnes) 19.08 36.14 38.90 41.84 44.58 55.19 41.37 41.37
Copper (tonnes) 46.4 71.0 100.4 95.2 98.4 100.4 136.4 117.2 117.2
Oil (million barrels) 6.6 9.5 7.3 7.1 7.0 7.0 7.0 7.0 7.0
LNG (TBtu) 377.8 389.1 447.0 400.0 439.0 438.0 438.0 438.0 438.0
Condensate (MB) 10.4 11.0 11.9 11.0 11.0 9.0 9.0 9.0 9.0
Nickle (tonnes) 21,568.3 24,215.4 35,592.0 27,760.6 33,999.6 33,999.6 33,999.6 33,999.6 33,999.6
Cobalt (tonnes) 2090.2 2377.7 3426.6 2660.92 3305.49 3305.49 3305.49 3305.49 3305.49
Source: Actuals from BPNG. Projections Dept. of Treasury.

2019 National Budget, Volume 1
170
Table 5: Value of Main Export Commodities Kina Million
2015 2016 2017 2018 2019 2020 2021 2022 2023
Actual Est Est Proj Proj Proj Proj Proj Proj
AGRICULTURE, FORESTRY, FISHERIES
Copra 45.0 80.4 120.1 102.7 96.3 98.5 96.6 104.7 104.7
Copra Oil 39.2 60.1 73.2 57.6 54.0 50.7 47.1 46.0 46.0
Cocoa 255.7 359.9 202.0 288.0 300.9 374.6 463.7 566.2 708.3
Coffee 393.5 646.9 450.1 533.1 476.2 596.2 566.2 637.0 566.2
Palm Oil 837.6 1014.7 1339.7 1094.9 1167.2 1249.0 1254.4 1250.8 1269.4
Rubber 7.9 8.0 13.5 13.0 13.5 13.3 13.1 13.1 13.7
Tea 4.9 3.8 5.2 4.9 6.0 6.5 6.6 6.6 6.6
Other Agriculture (a) 243.2 294.2 609.8 262.4 274.6 284.4 292.8 302.5 317.2
Forest Products 1040.1 964.3 831.5 962.4 1000.0 1016.4 1026.6 1026.6 1026.6
Marine Products 496.9 573.1 436.3 474.4 515.2 559.9 605.5 651.6 700.1
Total Agricultural, Forestry, Fishing Exports 3364.0 4005.4 4081.5 3793.3 3904.0 4249.5 4372.5 4604.9 4758.7
MINERAL
Gold 5376.5 6976.4 7598.1 8634.1 9035.5 9565.5 9785.7 9781.9 9529.1
Copper 746.5 1114.9 1962.2 1965.3 1968.2 2032.3 2738.9 2388.9 2388.9
Silver 61.2 32.8 63.1 72.0 81.4 89.1 113.6 85.9 85.9
Oil 1003.4 1253.8 1255.9 1673.5 1675.1 1666.7 1600.6 1570.1 1493.3
LNG 9841.1 8188.9 10467.5 13358.4 14842.5 14808.6 14808.6 14808.6 14808.6
Condensate 1502.6 1592.3 1935.1 746.1 745.2 582.8 571.7 543.8 534.4
Nickel 695.1 668.2 1179.0 1019.8 1079.7 1203.1 1203.1 1382.1 1500.3
Cobalt 164.6 195.2 614.1 657.4 501.8 449.9 449.9 493.3 359.7
Refined Petroleum Products 541.3 862.5 1045.8 1461.8 1507.6 1470.0 1470.8 1426.9 14.3
Total Mineral Exports 19932.3 20885.0 26120.8 29588.5 31437.0 31868.2 32743.0 32481.3 30714.5
TOTAL EXPORT VALUE 23296.3 24890.4 30202.2 33381.8 35341.0 36117.7 37115.6 37086.2 35473.3
Source: Actuals from BPNG. Projections Dept. of Treasury.
(a) Includes Oil Palm by-products, canned tuna and vanila
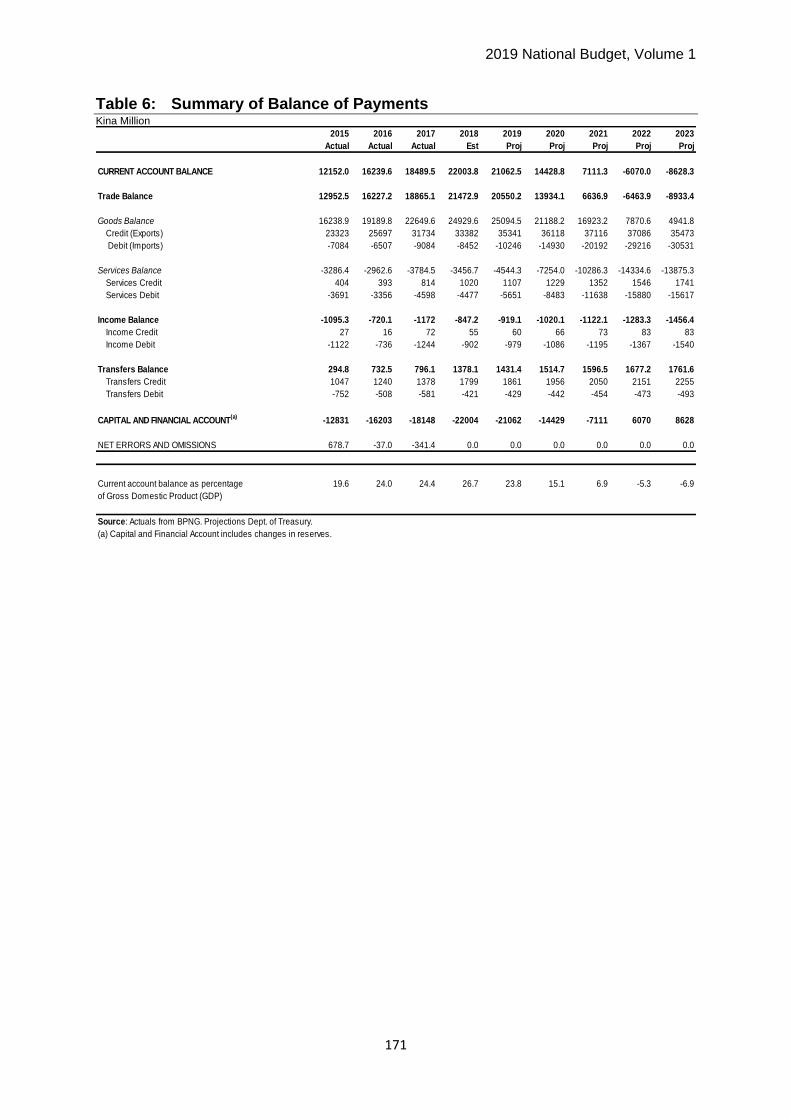
2019 National Budget, Volume 1
171
Table 6: Summary of Balance of Payments Kina Million
2015 2016 2017 2018 2019 2020 2021 2022 2023
Actual Actual Actual Est Proj Proj Proj Proj Proj
CURRENT ACCOUNT BALANCE 12152.0 16239.6 18489.5 22003.8 21062.5 14428.8 7111.3 -6070.0 -8628.3
Trade Balance 12952.5 16227.2 18865.1 21472.9 20550.2 13934.1 6636.9 -6463.9 -8933.4
Goods Balance 16238.9 19189.8 22649.6 24929.6 25094.5 21188.2 16923.2 7870.6 4941.8
Credit (Exports) 23323 25697 31734 33382 35341 36118 37116 37086 35473
Debit (Imports) -7084 -6507 -9084 -8452 -10246 -14930 -20192 -29216 -30531
Services Balance -3286.4 -2962.6 -3784.5 -3456.7 -4544.3 -7254.0 -10286.3 -14334.6 -13875.3
Services Credit 404 393 814 1020 1107 1229 1352 1546 1741
Services Debit -3691 -3356 -4598 -4477 -5651 -8483 -11638 -15880 -15617
Income Balance -1095.3 -720.1 -1172 -847.2 -919.1 -1020.1 -1122.1 -1283.3 -1456.4
Income Credit 27 16 72 55 60 66 73 83 83
Income Debit -1122 -736 -1244 -902 -979 -1086 -1195 -1367 -1540
Transfers Balance 294.8 732.5 796.1 1378.1 1431.4 1514.7 1596.5 1677.2 1761.6
Transfers Credit 1047 1240 1378 1799 1861 1956 2050 2151 2255
Transfers Debit -752 -508 -581 -421 -429 -442 -454 -473 -493
CAPITAL AND FINANCIAL ACCOUNT(a)
-12831 -16203 -18148 -22004 -21062 -14429 -7111 6070 8628
NET ERRORS AND OMISSIONS 678.7 -37.0 -341.4 0.0 0.0 0.0 0.0 0.0 0.0
Current account balance as percentage 19.6 24.0 24.4 26.7 23.8 15.1 6.9 -5.3 -6.9
of Gross Domestic Product (GDP)
Source: Actuals from BPNG. Projections Dept. of Treasury.
(a) Capital and Financial Account includes changes in reserves.

2019 National Budget, Volume 1
172
Table 7: Employment Classified by Industry Index March 2002=100
2008 2009 2010 2011 2012 2013 2014 2015 2016 2017 2018
Annual Annual Annual Annual Annual Annual Annual Annual Annual Annual Jun Qtr*
Retail 123.6 125.7 129.4 135.2 153.8 167.9 162.4 159.6 148.6 141.7 132.1
Wholesale 160.8 167.2 172.6 192.2 197.6 217.1 215.4 207.5 204.0 193.0 198.6
Manufacturing 156.6 166.0 163.7 176.6 185.2 198.7 188.3 180.2 178.4 169.4 169.5
Building and Construction 163.2 173.7 187.5 172.0 188.0 213.7 266.6 262.5 242.3 184.7 160.3
Transportation 125.2 126.5 122.0 150.8 165.2 177.0 174.4 172.7 172.4 163.3 152.0
Agriculture, Forestry, Fisheries 147.3 153.4 156.5 168.9 173.7 168.3 170.4 168.1 165.2 165.9 161.2
Financial and Business 122.7 132.9 132.5 136.3 139.9 133.6 124.4 123.7 119.6 121.7 123.4
TOTAL NON-MINERAL 141.9 148.6 149.6 159.4 168.2 172.2 170.9 169.7 166.1 161.6 157.9
MINERAL 137.8 141.8 150.7 163.6 177.7 266.1 240.1 241.2 262.2 281.8 290.7
Source: BPNG.
* June Quarter Preliminaries

2019 National Budget, Volume 1
173
Table 8: Monetary Aggregates Kina Million
2008 2009 2010 2011 2012 2013 2014 2015 2016 2017 2018
Actual Actual Actual Actual Actual Actual Actual Actual Actual Actual Jun Qtr*
Domestic Credit 4681.6 6665.3 7169.4 7703.8 8833.6 10103.8 11724.1 13054.7 13920.3 13819.8 14440.5
% Change 10.9 42.4 7.6 7.5 14.7 14.4 16.0 11.3 6.6 -0.7 4.5
Net Credit to Central Government -538.6 574.1 -202.8 -1076.8 297.0 2755.5 4163.8 5345.3 9008.7 9155.4 8320.6
% Change -414.8 -206.6 -135.3 431.0 -127.6 827.8 51.1 28.4 68.5 1.6 -9.1
Credit to Private Sector 5068.8 5901.8 6945.4 7519.0 8434.3 9910.6 10263.9 10611.9 11379.1 10991.3 11605.1
% Change 28.0 16.4 17.7 8.3 12.2 17.5 3.6 3.4 7.2 -3.4 5.6
Money Supply 9636.8 11822.6 13175.7 15292.2 16966.8 18105.6 18716.3 20218.6 22417.1 22259.3 21993.8
% Change 7.1 22.7 11.4 16.1 11.0 6.7 3.4 8.0 10.9 -0.7 -1.2
Money Velocity (M3*) (average) 3.3 2.7 2.9 2.8 2.6 2.6 3.0 3.1 3.0 3.4 3.7
Source: BPNG
*June Quarter Preliminaries

2019 National Budget, Volume 1
174
Table 9: Major Assumptions Underlying the Budget
2015 2016 2017 2018 2019 2020 2021 2022 2023
Actual Actual* Actual* Proj Proj Proj Proj Proj Proj
Economic Growth
Total Real GDP (%) 10.5 2.0 3.0 0.3 4.0 3.2 4.5 6.2 6.3
Non-mining Real GDP (%) 0.7 0.7 0.2 3.1 3.1 5.4 4.9 9.7 8.9
Inflation
Average on Average (%) 6.0 6.7 5.4 5.6 5.4 5.5 5.0 4.5 4.3
Dec on Dec (%) 6.4 6.6 4.7 7.6 3.4 6.3 3.4 4.6 4.5
Exchange rate
Real Exchange Rate Index (2007 = 100) 141.0 131.0 132.9 133.1 135.7 139.9 143.8 147.0 150.1
Interest rate
Kina Rate Facility (KFR) 6.25 6.25 6.25 6.25 6.25 6.25 6.25 6.25 6.25
Inscribed Stock (3 year yield) 9.7 9.7 9.7 9.7 9.7 9.7 9.7 9.7 9.7
Mineral Prices
Gold (US$/oz) 1160 1248 1258 1261 1218 1255 1257 1343 1382
Copper (US$/ton) 5502 4865 6166 6476 6200 6270 6220 6318 6318
Oil (Kutubu Crude: US$/barrel) 49 44 51 68 68 65 64 60 59
LNG (US$ per thousand cubic feet) 8 8 9 10 10 10 10 10 10
Condensate (US$/barrel) 49 44 51 68 68 65 64 60 59
Nickel (US$/tonne) 11831 9595 10415 11190 9556 10648 10648 12231 13278
Cobalt (US$/tonne) 29255 25639 55988 75256 45682 40955 40955 44901 32739
Source: Department of Treasury.
*Except GDP
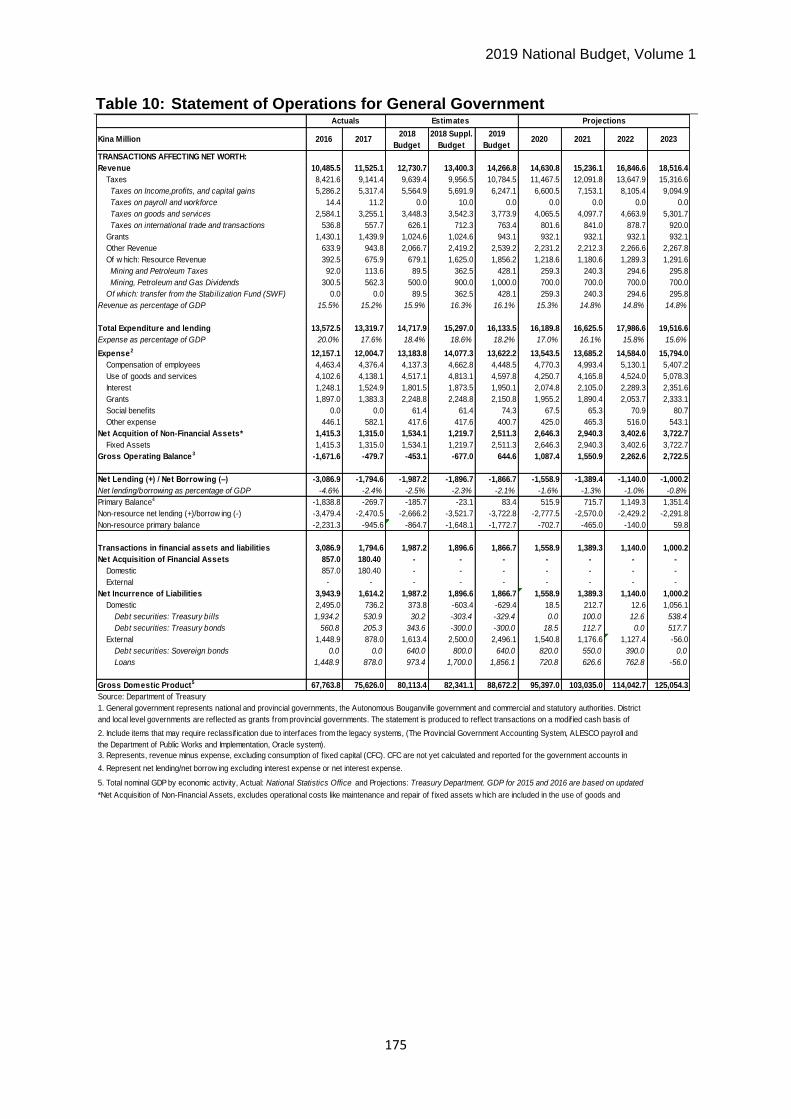
2019 National Budget, Volume 1
175
Table 10: Statement of Operations for General Government
10,485.5 11,525.1 12,730.7 13,400.3 14,266.8 14,630.8 15,236.1 16,846.6 18,516.4
8,421.6 9,141.4 9,639.4 9,956.5 10,784.5 11,467.5 12,091.8 13,647.9 15,316.6
Taxes on Income,profits, and capital gains 5,286.2 5,317.4 5,564.9 5,691.9 6,247.1 6,600.5 7,153.1 8,105.4 9,094.9
Taxes on payroll and workforce 14.4 11.2 0.0 10.0 0.0 0.0 0.0 0.0 0.0
Taxes on goods and services 2,584.1 3,255.1 3,448.3 3,542.3 3,773.9 4,065.5 4,097.7 4,663.9 5,301.7
Taxes on international trade and transactions 536.8 557.7 626.1 712.3 763.4 801.6 841.0 878.7 920.0
1,430.1 1,439.9 1,024.6 1,024.6 943.1 932.1 932.1 932.1 932.1
633.9 943.8 2,066.7 2,419.2 2,539.2 2,231.2 2,212.3 2,266.6 2,267.8
392.5 675.9 679.1 1,625.0 1,856.2 1,218.6 1,180.6 1,289.3 1,291.6
Mining and Petroleum Taxes 92.0 113.6 89.5 362.5 428.1 259.3 240.3 294.6 295.8
Mining, Petroleum and Gas Dividends 300.5 562.3 500.0 900.0 1,000.0 700.0 700.0 700.0 700.0
0.0 0.0 89.5 362.5 428.1 259.3 240.3 294.6 295.8
15.5% 15.2% 15.9% 16.3% 16.1% 15.3% 14.8% 14.8% 14.8%
13,572.5 13,319.7 14,717.9 15,297.0 16,133.5 16,189.8 16,625.5 17,986.6 19,516.6
20.0% 17.6% 18.4% 18.6% 18.2% 17.0% 16.1% 15.8% 15.6%
12,157.1 12,004.7 13,183.8 14,077.3 13,622.2 13,543.5 13,685.2 14,584.0 15,794.0
4,463.4 4,376.4 4,137.3 4,662.8 4,448.5 4,770.3 4,993.4 5,130.1 5,407.2
4,102.6 4,138.1 4,517.1 4,813.1 4,597.8 4,250.7 4,165.8 4,524.0 5,078.3
1,248.1 1,524.9 1,801.5 1,873.5 1,950.1 2,074.8 2,105.0 2,289.3 2,351.6
1,897.0 1,383.3 2,248.8 2,248.8 2,150.8 1,955.2 1,890.4 2,053.7 2,333.1
0.0 0.0 61.4 61.4 74.3 67.5 65.3 70.9 80.7
446.1 582.1 417.6 417.6 400.7 425.0 465.3 516.0 543.1
1,415.3 1,315.0 1,534.1 1,219.7 2,511.3 2,646.3 2,940.3 3,402.6 3,722.7
1,415.3 1,315.0 1,534.1 1,219.7 2,511.3 2,646.3 2,940.3 3,402.6 3,722.7
-1,671.6 -479.7 -453.1 -677.0 644.6 1,087.4 1,550.9 2,262.6 2,722.5
-3,086.9 -1,794.6 -1,987.2 -1,896.7 -1,866.7 -1,558.9 -1,389.4 -1,140.0 -1,000.2
-4.6% -2.4% -2.5% -2.3% -2.1% -1.6% -1.3% -1.0% -0.8%
-1,838.8 -269.7 -185.7 -23.1 83.4 515.9 715.7 1,149.3 1,351.4
-3,479.4 -2,470.5 -2,666.2 -3,521.7 -3,722.8 -2,777.5 -2,570.0 -2,429.2 -2,291.8
-2,231.3 -945.6 -864.7 -1,648.1 -1,772.7 -702.7 -465.0 -140.0 59.8
3,086.9 1,794.6 1,987.2 1,896.6 1,866.7 1,558.9 1,389.3 1,140.0 1,000.2
857.0 180.40 - - - - - - -
857.0 180.40 - - - - - - -
- - - - - - - - -
3,943.9 1,614.2 1,987.2 1,896.6 1,866.7 1,558.9 1,389.3 1,140.0 1,000.2
2,495.0 736.2 373.8 -603.4 -629.4 18.5 212.7 12.6 1,056.1
1,934.2 530.9 30.2 -303.4 -329.4 0.0 100.0 12.6 538.4
560.8 205.3 343.6 -300.0 -300.0 18.5 112.7 0.0 517.7
1,448.9 878.0 1,613.4 2,500.0 2,496.1 1,540.8 1,176.6 1,127.4 -56.0
0.0 0.0 640.0 800.0 640.0 820.0 550.0 390.0 0.0
1,448.9 878.0 973.4 1,700.0 1,856.1 720.8 626.6 762.8 -56.0
67,763.8 75,626.0 80,113.4 82,341.1 88,672.2 95,397.0 103,035.0 114,042.7 125,054.3
Source: Department of Treasury
Actuals Projections
Of which: transfer from the Stabilization Fund (SWF)
2017
5. Total nominal GDP by economic activity, Actual: National Statistics Office and Projections: Treasury Department. GDP for 2015 and 2016 are based on updated
3. Represents, revenue minus expense, excluding consumption of f ixed capital (CFC). CFC are not yet calculated and reported for the government accounts in
PNG.4. Represent net lending/net borrow ing excluding interest expense or net interest expense.
Debt securities: Treasury bills
Debt securities: Treasury bonds
Total Expenditure and lending
External
Loans
Transactions in financial assets and liabilities
Primary Balance4
Non-resource net lending (+)/borrow ing (-)
Non-resource primary balance
Social benefits
Debt securities: Sovereign bonds
Net Acquisition of Financial Assets
Domestic
Expense as percentage of GDP
Use of goods and services
Interest
Other expense
Net Acquition of Non-Financial Assets*
Fixed Assets
Net Lending (+) / Net Borrowing (–)
Gross Operating Balance 3
Grants
2016
TRANSACTIONS AFFECTING NET WORTH:
Revenue
Taxes
Of w hich: Resource Revenue
Kina Million
Grants
Other Revenue
Revenue as percentage of GDP
Expense2
Compensation of employees
2018 Suppl.
Budget2023
Estimates
*Net Acquisition of Non-Financial Assets, excludes operational costs like maintenance and repair of f ixed assets w hich are included in the use of goods and
2. Include items that may require reclassif ication due to interfaces from the legacy systems, (The Provincial Government Accounting System, ALESCO payroll and
the Department of Public Works and Implementation, Oracle system).
1. General government represents national and provincial governments, the Autonomous Bouganville government and commercial and statutory authorities. District
and local level governments are reflected as grants from provincial governments. The statement is produced to reflect transactions on a modif ied cash basis of
accounting and includes in-kind related transactions.
2018
Budget
2019
Budget2020 2021 2022
Net Incurrence of Liabilities
Domestic
External
Gross Domestic Product5
Net lending/borrowing as percentage of GDP

2019 National Budget, Volume 1
176
Table 11: Statement of Sources and Uses of Cash
.
9,055.4 10,085.2 11,705.5 12,375.7 13,323.7 13,698.8 14,304.1 15,914.5 17,584.4
8,421.6 9,141.4 9,639.4 9,956.5 10,784.5 11,467.5 12,091.8 13,647.9 15,316.6
0.0 0.0 0.0 0.0 0.0 0.0 0.0 0.0 0.0
633.9 943.8 2,066.7 2,419.2 2,539.2 2,231.2 2,212.3 2,266.6 2,267.8
13.4% 13.3% 14.6% 15.0% 0.2 14.4% 13.9% 14.0% 14.1%
10,607.2 10,457.4 11,975.7 12,930.6 12,464.1 12,396.1 12,535.5 13,423.2 14,614.7
4,343.5 4,268.9 4,015.2 4,540.7 4,307.8 4,622.5 4,841.0 4,972.3 5,240.6
4,102.6 4,138.1 4,517.1 4,813.1 4,597.8 4,250.7 4,165.8 4,524.0 5,078.3
1,248.1 1,524.9 1,801.5 1,873.5 1,950.1 2,074.8 2,105.0 2,289.3 2,351.6
466.9 -56.6 1,224.2 1,224.2 1,207.7 1,023.2 958.4 1,121.6 1,401.0
446.1 582.1 417.6 479.0 400.7 425.0 465.3 516.0 543.1
15.7% 13.8% 14.9% 15.7% 14.1% 13.0% 12.2% 11.8% 11.7%
-1,551.7 -372.2 -270.2 -554.9 859.6 1,302.7 1,768.5 2,491.4 2,969.7
1,415.3 1,315.0 1,534.1 1,219.7 2,511.3 2,646.3 2,940.3 3,402.6 3,722.7
12,022.5 11,772.4 13,509.8 14,150.3 14,975.4 15,042.4 15,475.8 16,825.8 18,337.3
-2,967.1 -1,687.2 -1,804.3 -1,774.5 -1,651.7 -1,343.6 -1,171.7 -911.2 -753.0
-4.4% -2.2% -2.3% -2.2% -1.9% -1.4% -1.1% -0.8% -0.6%
- - - - - - - -
- - - - - - - -
- - - - - - - -
3,943.9 1,614.2 1,987.2 1,896.6 1,866.7 1,559.3 1,389.3 1,140.0 1,000.1
2,495.0 736.2 373.8 -603.4 -629.4 18.5 212.7 12.6 1,056.1
1,448.9 878.0 1,613.4 2,500.0 2,496.1 1,540.8 1,176.6 1,127.4 -56.0
3,943.9 1,614.2 1,987.2 1,896.6 1,866.7 1,559.3 1,389.3 1,140.0 1,000.1
5.8% 2.1% 2.5% 2.3% 2.1% 1.6% 1.3% 1.0% 0.8%
976.8 -72.9 182.9 122.1 215.0 215.7 217.6 228.8 247.1
Gross Domestic Product3 67,763.8 75,626.0 80,113.4 82,341.1 88,672.2 95,397.0 103,035.0 114,042.7 125,054.3
2023
Actuals Estimates Projections
Expenditure cash flows
20222018
Budget
2019
Budget2020
2018 Suppl.
Budget
Cash surplus (+) / Cash deficit (–)
Net change in the stock of cash
2017
Surplus/Deficit as percentage of GDP
Net cash inflow from financing activities
Net cash inflow as percentage of GDP
CASH FLOWS FROM TRANSACTIONS IN FINANCIAL ASSETS AND
LIABILITIES (FINANCING):
Source: Department of Treasury
Uses of goods and services
Interest
Grants
Other payments
Expense as percentage of GDP
Net cash inflow from operating activities
CASH FLOWS FROM TRANSACTIONS IN NONFINANCIAL ASSETS:
Net cash outflow from investment in nonfinancial assets
Net incurrence of liabilities
Domestic
External
Net acquisition of financial assets other than cash
Domestic
External
3. Total nominal GDP by economic activity, Actual: National Statistics Office and Projections:
Kina Million 2016
CASH FLOWS FROM OPERATING ACTIVITIES
Revenue Cash Flows
Taxes
Grants
Other Revenue
Revenue as percentage of GDP
Expense cash flows2
Compensation of employees
1. General government represents national and provincial governments, the Autonomous Bouganville government and commercial and statutory authorities. District and local level
governments are reflected as grants from provincial governments. The statement is produced to reflect transactions on a modif ied cash basis of accounting but excludes in-kind
related transactions.2. Include items that may require reclassif ication due to interfaces from the legacy systems, (The Provincial Government Accounting System, ALESCO payroll and the Department
of Public Works and Implementation, Oracle system).
2021

2019 National Budget, Volume 1
177
Table 12: General Government Revenue by Economic Classification
Kina Million2016 2017
2018
Budget
2018 Supp.
Budget2019 2020 2021 2022 2023
REVENUE1 10,485.5 11,525.1 12,730.7 13,400.3 14,266.8 14,630.8 15,236.1 16,846.6 18,516.4
TAXES 8,421.6 9,141.4 9,639.4 9,956.5 10,784.5 11,467.5 12,091.8 13,647.9 15,316.6
Taxes on Income, Profits and Capital Gains 5,286.2 5,317.4 5,564.9 5,691.9 6,247.1 6,600.5 7,153.1 8,105.4 9,094.9
Payable by individuals 2,844.3 3,093.8 3,250.2 3,050.5 2,949.5 3,214.9 3,504.3 3,989.7 4,533.4
Personal Income Tax 2,844.3 3,093.8 3,250.2 3,050.5 2,949.5 3,214.9 3,504.3 3,989.7 4,533.4
Payable by corporations and other enterprises 2,230.1 1,950.4 2,092.9 2,397.9 3,032.2 3,096.2 3,333.4 3,767.1 4,181.8
Company Tax 2,093.8 1,794.1 1,971.5 1,991.5 2,556.3 2,784.8 3,036.3 3,410.5 3,818.5
Mining and Petroleum Taxes 92.0 113.6 89.5 362.5 428.1 259.3 240.3 294.6 295.8
Royalties Tax 26.6 25.6 18.9 25.6 27.9 30.4 33.2 36.2 39.4
Management Tax 17.7 17.1 13.0 18.3 19.9 21.7 23.7 25.8 28.1
Other taxes on income, profits and capital gains 211.8 273.1 221.8 243.5 265.4 289.3 315.4 348.7 379.6
Dividend Withholding Tax Non Mining 132.6 181.7 137.4 136.9 149.2 162.7 177.3 193.3 210.7
Interest Withholding Tax 78.7 91.4 84.2 106.4 116.0 126.4 137.8 155.2 168.7
Sundry IRC Taxes & Income 0.5 0.0 0.2 0.2 0.2 0.2 0.2 0.2 0.2
Taxes on Payroll and Workforce 14.4 11.2 0.0 10.0 0.0 0.0 0.0 0.0 0.0
Training Levy 14.4 11.2 0.0 10.0 0.0 0.0 0.0 0.0 0.0
Taxes on Goods and Services 2,584.1 3,255.1 3,448.3 3,542.3 3,773.9 4,065.5 4,097.7 4,663.9 5,301.7
General taxes on goods and services 1,521.8 1,911.3 2,034.2 2,176.6 2,286.1 2,443.9 2,332.7 2,742.2 3,211.4
Value Added Tax 1,442.6 1,868.8 1,974.2 2,086.6 2,188.8 2,338.6 2,218.7 2,618.8 3,077.7
GST2 1,442.6 1,868.8 1,974.2 2,086.6 2,188.8 2,338.6 2,218.7 2,618.8 3,077.7
Taxes on financial and capital transactions 79.2 42.4 60.0 90.0 97.3 105.3 114.0 123.5 133.8
Stamp Duties 79.2 42.4 60.0 90.0 97.3 105.3 114.0 123.5 133.8
Excise 875.9 1,105.0 1,177.4 1,091.2 1,244.4 1,356.3 1,476.4 1,607.3 1,748.2
Excise Duty 603.7 757.3 782.3 793.9 922.7 1,005.5 1,093.8 1,190.2 1,293.4
Import Excise 272.2 347.8 395.1 297.3 321.7 350.8 382.5 417.1 454.8
Taxes on specific services 175.7 228.9 220.2 218.0 237.6 258.8 281.9 307.0 334.5
Bookmakers' Turnover Tax 7.8 36.0 33.0 28.6 31.2 34.0 37.0 40.4 44.0
Gaming Machine Turnover Tax 163.5 178.7 174.4 181.0 197.3 215.0 234.3 255.4 278.4
Departure Tax 4.4 14.2 12.8 8.4 9.0 9.7 10.5 11.3 12.2
Taxes on use of goods and on permission to use goods or perform activities7.5 7.1 13.1 13.1 1.2 1.5 1.5 1.5 1.5
Motor vehicles taxes 6.8 6.4 11.9 11.9 0.3 0.3 0.3 0.3 0.3
Motor Vehicle Registration 6.2 5.8 11.2 11.2 0.3 0.3 0.3 0.3 0.3
Commercial Vehicle Licenses 0.5 0.6 0.7 0.7 0.0 0.0 0.0 0.0 0.0
Other taxes on use of goods and on permission to use goods or perform activities0.8 0.8 1.2 1.2 0.9 1.2 1.2 1.2 1.2
Other taxes on goods and services 3.1 2.7 3.4 43.4 4.6 5.0 5.3 5.8 6.0
Sundry Taxes (Customs) 3.1 2.7 3.4 43.4 4.6 5.0 5.3 5.8 6.0
Taxes on International Trade and Transactions 536.8 557.7 626.1 712.3 763.4 801.6 841.0 878.7 920.0
Customs and other import duties 242.9 260.3 296.1 321.7 358.1 390.1 424.8 462.5 503.9
Import Duty 242.9 246.4 296.1 321.7 358.1 390.1 424.8 462.5 503.9
Other Import Taxes - 14.0 0.0 - - - - - -
Sundry Tax Receipts (Import Duties) - 14.0 0.0 - - - - - -
Taxes on exports 294.0 297.3 330.0 390.6 405.4 411.5 416.2 416.2 416.2
Export Tax 294.0 297.3 330.0 390.6 405.4 411.5 416.2 416.2 416.2
GRANTS 1,430.1 1,439.9 1,024.6 1,024.6 943.1 932.1 932.1 932.1 932.1
From Foreign Governments 1,261.4 1,281.9 752.8 752.8 775.5 766.2 766.2 766.2 766.2
Current 1,207.1 1,025.5 602.2 602.2 620.4 612.9 612.9 612.9 612.9
Cash - - - - - - - - -
In-Kind 1,207.1 1,025.5 602.2 602.2 620.4 612.9 612.9 612.9 612.9
Capital 54.3 256.4 150.6 150.6 155.1 153.2 153.2 153.2 153.2
Cash - - - - - - - - -
In-Kind 54.3 256.4 150.6 150.6 155.1 153.2 153.2 153.2 153.2
From International Organizations 168.7 158.0 271.8 271.8 167.6 165.9 165.9 165.9 165.9
Current 147.0 126.4 217.4 217.4 134.1 132.7 132.7 132.7 132.7
Cash - - - - - - - - -
In-Kind 147.0 126.4 217.4 217.4 134.1 132.7 132.7 132.7 132.7
Capital 21.7 31.6 54.4 54.4 33.5 33.2 33.2 33.2 33.2
Cash - - - - - - - - -
In-Kind 21.7 31.6 54.4 54.4 33.5 33.2 33.2 33.2 33.2
OTHER REVENUE 633.9 943.8 2,066.7 2,419.2 2,539.2 2,231.2 2,212.3 2,266.6 2,267.8
Property Income 551.3 860.9 1,321.9 1,450.6 1,260.8 935.8 935.8 935.8 935.8
Interest - - 0.7 0.7 0.7 0.7 0.7 0.7 0.7
Interest from non-residents - - - - - - - - -
Interest from residents other than general government - - 0.7 0.7 0.7 0.7 0.7 0.7 0.7
Dividends 528.9 841.6 1,250.0 1,430.0 1,205.0 880.0 880.0 880.0 880.0
Mining Petroleum and Gas Dividends 300.5 562.3 500.0 900.0 1,000.0 700.0 700.0 700.0 700.0
Dividends from Statutory Authorites 225.0 279.3 625.0 500.0 100.0 100.0 100.0 100.0 100.0
Dividends from State Ow ned Enterprises - - 125.0 30.0 105.0 80.0 80.0 80.0 80.0
Other Dividends 3.4 - - - - - - - -
Withdraw als from income of quasi-corporations - - 40.0 - - - - - -
Rent 22.4 19.3 31.2 19.9 55.2 55.2 55.2 55.2 55.2
Land Lease Rental 18.3 16.3 27.8 16.8 51.6 51.6 51.6 51.6 51.6
License Fees and Royalty Payments - 0.0 0.0 0.0 0.0 0.0 0.0 0.0 0.0
Petroleum Prospecting Licenses 4.0 3.0 3.3 3.0 3.6 3.6 3.6 3.6 3.6
Sales of goods and services 63.5 62.8 112.5 63.3 124.2 239.7 239.7 239.7 239.7
Administrative fees 28.7 22.9 46.6 27.5 63.0 120.0 120.0 120.0 120.0
Incidental sales by nonmarket establishments 34.9 39.9 65.8 35.8 61.2 119.7 119.7 119.7 119.7
Fines, penalties, and forfeits 1.8 1.6 1.0 1.0 0.8 0.8 0.8 0.8 0.8
District Courts Fines 0.8 0.6 0.5 0.5 0.4 0.4 0.4 0.4 0.4
Forfeitures & Court Bails 1.0 1.0 0.5 0.5 0.4 0.4 0.4 0.4 0.4
Transfers not elsewhere classified 17.2 18.5 631.4 904.3 1,153.3 1,054.8 1,035.8 1,090.2 1,091.3
Current transfers not elsewhere classified 17.2 18.5 631.4 904.3 1,153.3 1,054.8 1,035.8 1,090.2 1,091.3
Other current transfers 17.2 18.5 631.4 904.3 1,153.3 1,054.8 1,035.8 1,090.2 1,091.3
Payroll Commission 15.1 17.4 16.0 16.0 12.1 12.1 12.1 12.1 12.1
State Services and Statutory Authority 0.1 0.3 525.0 525.0 690.0 760.0 760.0 760.0 760.0
Unclaimed Monies - - 0.0 0.0 0.0 0.0 0.0 0.0 0.0
Sundry/(Other) Income 2.1 0.8 0.8 0.8 1.0 1.0 1.0 1.0 1.0
Other 22.1 22.4 22.4 22.4 22.4
SWF - - 89.5 362.5 428.1 259.3 240.3 294.6 295.8
Premiums, fees and claims related to nonlife insurance and standardised guarantee schemes- - - - - - - -
ProjectionsActuals
1. Under the GFS 2014 methodology, non-paybale infrastructure tax credits, revenue on asset sales, recoveries and Trust Accounts are not classif ied as revenue
2. GST represents the total of collections by Provinces, PNG Ports and less Refunds.
Estimates

2019 National Budget, Volume 1
178
Table 13A: General Government Expense by Economic Classification
Kina Million 2016
20172018
Budget
2018
Suppl.
Budget
2019
Budget2020 2021 2022 2023
Compensation of Employees 4,463.4 4,376.4 4,137.3 4,662.8 4,448.5 4,770.3 4,993.4 5,130.1 5,407.2
Wages and salaries 4,021.6 4,201.2 3,750.3 4,150.3 4,015.5 4,312.3 4,521.6 4,644.1 4,892.1
Wages and salaries in cash 3,901.7 4,093.7 3,628.1 4,028.1 3,874.8 4,164.5 4,369.2 4,486.4 4,725.5
Wages and salaries in kind 119.9 107.4 122.1 122.1 140.7 147.8 152.4 157.8 166.6
Employers' social contributions 441.8 175.2 387.1 512.6 433.0 458.1 471.8 486.0 515.1
Actual social contributions 441.8 175.2 387.1 512.6 433.0 458.1 471.8 486.0 515.1
Use of goods and services* 4,102.6 4,138.1 4,517.1 4,813.1 4,597.8 4,250.7 4,165.8 4,524.0 5,078.3
Use of goods and services 4,102.6 4,138.1 4,517.1 4,813.1 4,597.8 4,250.7 4,165.8 4,524.0 5,078.3
Use of goods and services 4,102.6 4,138.1 4,517.1 4,813.1 4,597.8 4,250.7 4,165.8 4,524.0 5,078.3
Interest** 1,248.1 1,524.9 1,801.5 1,873.5 1,950.1 2,074.8 2,105.0 2,289.3 2,351.6
To nonresidents 1,171.1 168.9 249.1 321.1 471.0 501.1 508.4 552.9 568.0
Interest to Non residents 1,171.1 168.9 249.1 321.1 471.0 501.1 508.4 552.9 568.0
To residents other than general government 77.0 1,356.0 1,552.5 1,552.5 1,479.1 1,573.7 1,596.6 1,736.3 1,783.6
Interest to residents other than general governments 77.0 1,356.0 1,552.5 1,552.5 1,479.1 1,573.7 1,596.6 1,736.3 1,783.6
Grants*** 1,897.0 1,383.3 2,248.8 2,248.8 2,150.8 1,955.2 1,890.4 2,053.7 2,333.1
Grants to other general government units 1,897.0 1,383.3 2,248.8 2,248.8 2,150.8 1,955.2 1,890.4 2,053.7 2,333.1
Grants to other general governments current 1,117.9 1,206.8 1,484.7 1,484.7 1,067.4 970.9 939.0 1,019.4 1,157.1
Grants to other general governments capital 779.1 176.4 764.1 764.1 1,083.4 984.3 951.4 1,034.2 1,176.0
Social Benefits 0.0 0.0 61.4 61.4 74.3 67.5 65.3 70.9 80.7
Social assistance benefits 0.0 0.0 61.4 61.4 74.3 67.5 65.3 70.9 80.7
Social assistance benefits in cash 0.0 0.0 61.4 61.4 74.3 67.5 65.3 70.9 80.7
Other expenses 446.1 582.1 417.6 417.6 400.7 425.0 465.3 516.0 543.1
Transfers not elsewhere classified 446.1 582.1 417.6 417.6 400.7 425.0 465.3 516.0 543.1
Other expense - Current transfers not elsewhere classified 446.1 582.1 417.6 417.6 400.7 425.0 465.3 516.0 543.1
Net Aquisition Nonfinancial assets**** 1,415.3 1,315.0 1,534.1 1,219.7 2,511.3 2,646.3 2,940.3 3,402.6 3,722.7
Nonproduced assets 0.0 0.0 13.9 13.9 9.3 8.4 8.1 8.8 10.1
NFA:Intangible nonproduced assets 0.0 0.0 4.1 4.1 1.6 1.4 1.4 1.5 1.7
NFA:Land 0.0 0.0 9.8 9.8 7.7 7.0 6.8 7.3 8.4
Aquisition of Fixed assets 1,415.3 1,315.0 1,520.1 1,205.7 2,502.0 2,637.9 2,932.1 3,393.8 3,712.6
NFA:Buildings and structures 0.0 0.0 101.4 101.4 3.2 2.9 2.8 3.1 3.5
NFA: Dwellings 0.0 0.0 3.8 3.8 54.5 49.5 47.9 52.0 59.2
NFA:Fixed assets 1,353.7 1,275.2 1,278.7 964.3 2,364.6 2,513.0 2,811.4 3,262.5 3,563.4
NFA:Information, computer, & telecommunications equipment 20.3 22.3 20.4 20.4 24.1 21.9 21.2 23.0 26.2
NFA:Machinery & equipment other than transport equipment 24.2 12.6 15.6 15.6 13.8 12.6 12.1 13.2 15.0
NFA:Other structures 0.0 3.6 37.1 37.1 40.2 36.5 35.3 38.4 43.7
NFA:Transport equipment 17.1 1.4 4.0 4.0 1.6 1.5 1.4 1.5 1.8
Other expense - Current transfers not elsewhere classified 0.0 0.0 59.2 59.2 0.0 0.0 0.0 0.0 0.0
Total expenditure 13,572.5 13,319.7 14,717.9 15,297.0 16,133.5 16,189.8 16,625.5 17,986.6 19,516.6
as % of GDP 20.0% 18.0% 17.9% 18.6% 18.2% 17.0% 16.1% 15.8% 15.6%
* Use of goods and services includes operational cost like maintenance and repair of fixed assets.
** Excluding K63.2 million for fees, other than interest, captured under use of goods and services.
*** Grants are inclusive of payments made to other general government units for the purposes of capital projects.
**** Net Acquisition of Non-Financial Assets, excludes operational costs like maintenance and repair of fixed assets which are included in the use of goods and services.
Actuals Estimates Projections

2019 National Budget, Volume 1
179
Table 13B: General Government Expense by Agency Type
Kina Million 2016 20172018
Budget
2018
Suppl.
Budget
2019
Budget2020 2021 2022 2023
National Departments 5,390.3 5,728.2 6,472.8 6,729.9 7,750.8 7,392.3 7,336.0 7,831.8 8,699.8
Compensation of Employees 2,394.5 2,286.2 2,282.9 2,558.4 2,089.9 2,249.4 2,364.9 2,428.0 2,555.3
Wages and salaries 1,980.1 2,128.8 1,898.5 2,048.5 1,685.4 1,821.4 1,924.0 1,973.9 2,074.0
Wages and salaries in cash 1,913.3 2,067.7 1,827.5 1,977.5 1,603.9 1,735.2 1,835.2 1,882.4 1,977.0
Wages and salaries in kind 66.8 61.0 71.1 71.1 81.5 86.2 88.8 91.5 97.0
Employers' social contributions 414.4 157.5 384.3 509.8 404.6 428.0 440.9 454.1 481.3
Actual social contributions 414.4 157.5 384.3 509.8 404.6 428.0 440.9 454.1 481.3
Use of goods and services 1,746.2 2,306.6 2,660.5 2,956.5 3,554.2 3,228.9 3,121.1 3,392.8 3,857.8
Use of goods and services 1,746.2 2,306.6 2,660.5 2,956.5 3,554.2 3,228.9 3,121.1 3,392.8 3,857.8
Grants 610.7 613.2 643.5 643.5 932.0 846.7 818.4 889.7 1,011.6
Grants to other general government units 610.7 613.2 643.5 643.5 932.0 846.7 818.4 889.7 1,011.6
Grants to other general governments current 610.7 613.2 643.5 643.5 630.5 572.8 553.7 601.9 684.4
Grants to other general governments capital 0.0 0.0 0.0 0.0 301.5 273.9 264.7 287.8 327.2
Other expenses 84.1 79.7 77.4 77.4 88.2 80.1 77.4 84.2 95.7
Transfers not elsewhere classified 84.1 79.7 77.4 77.4 88.2 80.1 77.4 84.2 95.7
Other expense - Current transfers not elsewhere classified 84.1 79.7 77.4 77.4 88.2 80.1 77.4 84.2 95.7
Net Aquisition Nonfinancial assets 554.8 442.5 760.7 446.3 1,035.7 940.9 909.5 988.6 1,124.1
Nonproduced assets 0.0 0.0 13.9 13.9 9.3 8.4 8.1 8.8 10.1
NFA:Intangible nonproduced assets 0.0 0.0 4.1 4.1 1.6 1.4 1.4 1.5 1.7
NFA:Land 0.0 0.0 9.8 9.8 7.7 7.0 6.8 7.3 8.4
Aquisition of Fixed assets 554.8 442.5 746.7 432.3 1,026.4 932.5 901.3 979.8 1,114.1
NFA:Buildings and structures 0.0 0.0 64.8 64.8 0.5 0.4 0.4 0.5 0.5
NFA:Dwellings 0.0 0.0 3.8 3.8 18.0 16.3 15.8 17.2 19.5
NFA:Fixed assets 506.2 418.4 605.0 290.6 947.0 860.3 831.6 904.0 1,027.9
NFA:Information, computer, & telecommunications equipment 10.1 8.9 18.4 18.4 22.2 20.2 19.5 21.2 24.1
NFA:Machinery & equipment other than transport equipment 22.0 10.4 13.9 13.9 13.5 12.3 11.9 12.9 14.7
NFA:Other structures 0.0 3.4 37.0 37.0 23.6 21.5 20.8 22.6 25.7
NFA:Transport equipment 16.5 1.4 3.9 3.9 1.6 1.4 1.4 1.5 1.7
Social Benefits 0.0 0.0 47.9 47.9 50.6 46.0 44.5 48.3 55.0
Social assistance benefits 0.0 0.0 47.9 47.9 50.6 46.0 44.5 48.3 55.0
Provincial Governments 3,658.4 3,178.5 3,606.4 3,856.4 2,870.7 2,883.5 2,932.9 3,075.7 3,336.2
Compensation of Employees 1,641.7 1,686.4 1,456.4 1,706.4 1,671.4 1,794.0 1,879.8 1,931.0 2,034.6
Wages and salaries 1,641.7 1,685.5 1,456.4 1,706.4 1,671.4 1,794.0 1,879.8 1,931.0 2,034.6
Wages and salaries in cash 1,599.9 1,645.1 1,416.0 1,666.0 1,632.3 1,753.6 1,838.0 1,887.2 1,988.8
Wages and salaries in kind 41.8 40.4 40.4 40.4 39.1 40.4 41.8 43.8 45.79
Employers' social contributions 0.0 0.9 0.0 0.0 0.0 0.0 0.0 0.0 0.0
Actual social contributions 0.0 0.9 0.0 0.0 0.0 0.0 0.0 0.0
Use of goods and services 809.7 631.7 719.4 719.4 17.0 15.4 14.9 16.2 18.5
Use of goods and services 809.7 631.7 719.4 719.4 17.0 15.4 14.9 16.2 18.5
Grants 1,184.0 659.3 1,402.0 1,402.0 1,164.2 1,057.7 1,022.4 1,111.3 1,263.7
Grants to other general government units 1,184.0 659.3 1,402.0 1,402.0 1,164.2 1,057.7 1,022.4 1,111.3 1,263.7
Grants to other general governments current* 468.9 504.9 711.9 711.9 384.1 348.9 337.3 366.6 416.9
Grants to other general governments capital 715.1 154.4 690.1 690.1 780.2 708.8 685.1 744.7 846.8
Net Aquisition Nonfinancial assets 23.0 201.0 28.5 28.5 18.0 16.4 15.8 17.2 19.5
Aquisition of Fixed assets 23.0 201.0 28.5 28.5 18.0 16.4 15.8 17.2 19.5
Autonomous Bougainville Government 211.0 165.2 213.2 213.2 193.8 185.7 183.9 195.8 217.1
Compensation of Employees 113.9 111.3 95.7 95.7 64.6 68.3 70.3 72.5 76.8
Wages and salaries 113.9 111.2 95.7 95.7 64.6 68.3 70.3 72.5 76.8
Wages and salaries in cash 112.1 108.8 92.8 92.8 61.8 65.4 67.4 69.4 73.5
Wages and salaries in kind 1.8 2.4 2.9 2.9 2.8 2.9 3.0 3.1 3.3
Use of goods and services 24.8 22.4 27.8 27.8 34.6 31.5 30.4 33.1 37.6
Use of goods and services 24.8 22.4 27.8 27.8 34.6 31.5 30.4 33.1 37.6
Grants 72.3 31.5 89.7 89.7 35.9 32.6 31.6 34.3 39.0
Grants to other general government units 72.3 31.5 89.7 89.7 35.9 32.6 31.6 34.3 39.0
Grants to other general governments current 8.3 9.5 15.7 15.7 34.1 31.0 30.0 32.6 37.0
Grants to other general governments capital 64.0 22.0 74.0 74.0 1.8 1.7 1.6 1.7 2.0
Net Aquisition Nonfinancial assets 0.0 0.0 58.7 53.3 51.5 56.0 63.7
Fixed Assets 58.7 53.3 51.5 56.0 63.7
Commercial & Statutory Authorities 624.6 597.9 942.4 942.4 1,579.1 1,527.6 1,518.4 1,611.9 1,778.9
Compensation of Employees 313.2 292.4 302.3 302.3 622.5 658.6 678.3 698.7 740.6
Wages and salaries 285.9 275.7 299.6 299.6 594.1 628.5 647.4 666.8 706.8
Wages and salaries in cash 276.4 272.1 291.8 291.8 576.8 610.3 628.6 647.5 686.2
Wages and salaries in kind 9.5 3.6 7.8 7.8 17.3 18.3 18.8 19.4 20.5
Employers' social contributions 27.3 16.6 2.8 2.8 28.4 30.0 30.9 31.9 33.8
Actual social contributions 27.3 16.6 2.8 2.8 28.4 30.0 30.9 31.9 33.8
Use of goods and services 185.0 137.3 390.6 390.6 515.9 468.7 453.1 492.5 560.0
Use of goods and services 185.0 137.3 390.6 390.6 515.9 468.7 453.1 492.5 560.0
Grants 18.2 38.9 61.6 61.6 3.1 2.8 2.7 3.0 3.4
Grants to other general government units 18.2 38.9 61.6 61.6 3.1 2.8 2.7 3.0 3.4
Grants to other general governments current 18.2 38.9 61.6 61.6 3.1 2.8 2.7 3.0 3.4
Other expenses 8.0 13.6 20.7 20.7 2.0 1.9 1.8 2.0 2.2
Transfers not elsewhere classified 8.0 13.6 20.7 20.7 2.0 1.9 1.8 2.0 2.2
Other expense - Current transfers not elsewhere classified 8.0 13.6 20.7 20.7 2.0 1.9 1.8 2.0 2.2
Net Aquisition Nonfinancial assets 100.2 115.8 153.7 153.7 411.8 374.1 361.6 393.1 447.0
Aquisition of Fixed assets 100.2 115.8 153.7 153.7 411.8 374.1 361.6 393.1 447.0
NFA:Buildings and structures 0.0 0.0 0.0 0.0 2.7 2.5 2.4 2.6 3.0
NFA:Dwellings 36.5 33.2 32.1 34.9 39.6
NFA:Fixed assets 97.3 113.4 149.8 149.8 353.7 321.3 310.6 337.6 383.9
NFA:Machinery & equipment other than transport equipment 2.2 2.2 1.8 1.8 0.3 0.3 0.3 0.3 0.3
NFA:Other structures 0.0 0.2 0.0 0.0 16.6 15.1 14.6 15.8 18.0
NFA:Transport equipment 0.7 0.0 0.1 0.1 0.0 0.0 0.0 0.0 0.0
NFA: Information, computer, and telecommunications (ICT) equipment 0.0 0.0 2.0 2.0 1.9 1.7 1.7 1.8 2.1
Social Benefits 0.0 0.0 13.5 13.5 23.7 21.5 20.8 22.6 25.7
Social assistance benefits 0.0 0.0 13.5 13.5 23.7 21.5 20.8 22.6 25.7
Social assistance benefits in cash 0.0 0.0 13.5 13.5 23.7 21.5 20.8 22.6 25.7
Debt Service (Interest Payment) 1,264.3 1,633.9 1,864.7 1,936.7 1,979.3 2,105.9 2,136.6 2,323.6 2,386.9
Use of goods and services 16.2 109.0 63.1 63.1 29.3 31.1 31.6 34.3 35.3
Use of goods and services 16.2 109.0 63.1 63.1 29.3 31.1 31.6 34.3 35.3
Use of goods and services 16.2 109.0 63.1 63.1 29.3 31.1 31.6 34.3 35.3
Interest 1,248.1 1,524.9 1,801.5 1,873.5 1,950.1 2,074.8 2,105.0 2,289.3 2,351.6
To nonresidents 1,171.1 168.9 249.1 321.1 471.0 501.1 508.4 552.9 568.0
Interest to Non residents 1,171.1 168.9 249.1 321.1 471.0 501.1 508.4 552.9 568.0
To residents other than general government 77.0 1,356.0 1,552.5 1,552.5 1,479.1 1,573.7 1,596.6 1,736.3 1,783.6
Interest to residents other than general governments 77.0 1,356.0 1,552.5 1,552.5 1,479.1 1,573.7 1,596.6 1,736.3 1,783.6
Expenditure supported by donor grants 1,430.1 1,439.9 1,024.6 1,024.6 943.1 932.0 932.0 932.0 932.0
Use of goods and services 1,125.7 882.6 574.9 574.9 370.2 365.8 365.8 365.8 365.8
Use of goods and services 1,125.7 882.6 574.9 574.9 370.2 365.8 365.8 365.8 365.8
Grants 11.8 40.3 52.0 52.0 15.6 15.4 15.4 15.4 15.4
Grants to other general government units 11.8 40.3 52.0 52.0 15.6 15.4 15.4 15.4 15.4
Grants to other general governments current 11.8 40.3 52.0 52.0 15.6 15.4 15.4 15.4 15.4
Net Aquisition Nonfinancial assets 220.4 66.4 189.9 189.9 330.2 326.3 326.3 326.3 326.3
Aquisition of Fixed assets (Buildings and Structures) 220.4 66.4 189.9 189.9 330.2 326.3 326.3 326.3 326.3
NFA:Fixed assets 220.4 66.4 153.6 153.6 330.2 326.3 326.3 326.3 326.3
Other expense - Current transfers not elsewhere classified 0.0 0.0 36.3 36.3 0.0
Other expenses 72.2 450.7 207.8 207.8 227.2 224.6 224.6 224.6 224.6
Transfers not elsewhere classified 72.2 450.7 207.8 207.8 227.2 224.6 224.6 224.6 224.6
Other expense - Current transfers not elsewhere classified 72.2 450.7 207.8 207.8 227.2 224.6 224.6 224.6 224.6
Expenditure financed by concessional loans 993.8 576.1 593.9 593.9 816.9 1,163.0 1,586.0 2,016.0 2,166.0
Use of goods and services 195.0 48.6 80.8 80.8 76.7 109.2 148.9 189.3 203.4
Use of goods and services 195.0 48.6 80.8 80.8 76.7 109.2 148.9 189.3 203.4
Net Aquisition Nonfinancial assets 517.0 489.3 401.3 401.3 657.0 935.4 1,275.6 1,621.4 1,742.0
Aquisition of Fixed assets (Buildings and Structures) 517.0 489.3 401.3 401.3 657.0 935.4 1,275.6 1,621.4 1,742.0
NFA:Buildings and structures 0.0 0.0 36.6 36.6
NFA:Fixed assets 506.9 476.0 341.8 341.8 657.0 935.4 1,275.6 1,621.4 1,742.0
NFA:Information, computer, & telecommunications equipment 10.1 13.4 0.0 0.0 0.0 0.0 0.0 0.0 0.0
NFA:Machinery & equipment other than transport equipment 0.0 0.0 0.0 0.0 0.0 0.0 0.0 0.0 0.0
Other expense - Current transfers not elsewhere classified 0.0 0.0 22.9 22.9 0.0 0.0 0.0 0.0 0.0
Other expenses 281.8 38.2 111.8 111.8 83.2 118.4 161.5 205.3 220.6
Transfers not elsewhere classified 281.8 38.2 111.8 111.8 83.2 118.4 161.5 205.3 220.6
Other expense - Current transfers not elsewhere classified 281.8 38.2 111.8 111.8 83.2 118.4 161.5 205.3 220.6
Total expenditure 13,572.5 13,319.7 14,717.9 15,297.0 16,133.5 16,189.8 16,625.5 17,986.6 19,516.6
as % of GDP 20.1% 18.0% 18.4% 18.6% 18.2% 17.0% 16.1% 15.8% 15.6%
* Net Acquisition of Non-Financial Assets, excludes operational costs like maintenance and repair of f ixed assets w hich are included in the use of goods and services.
Actuals Estimates Projections
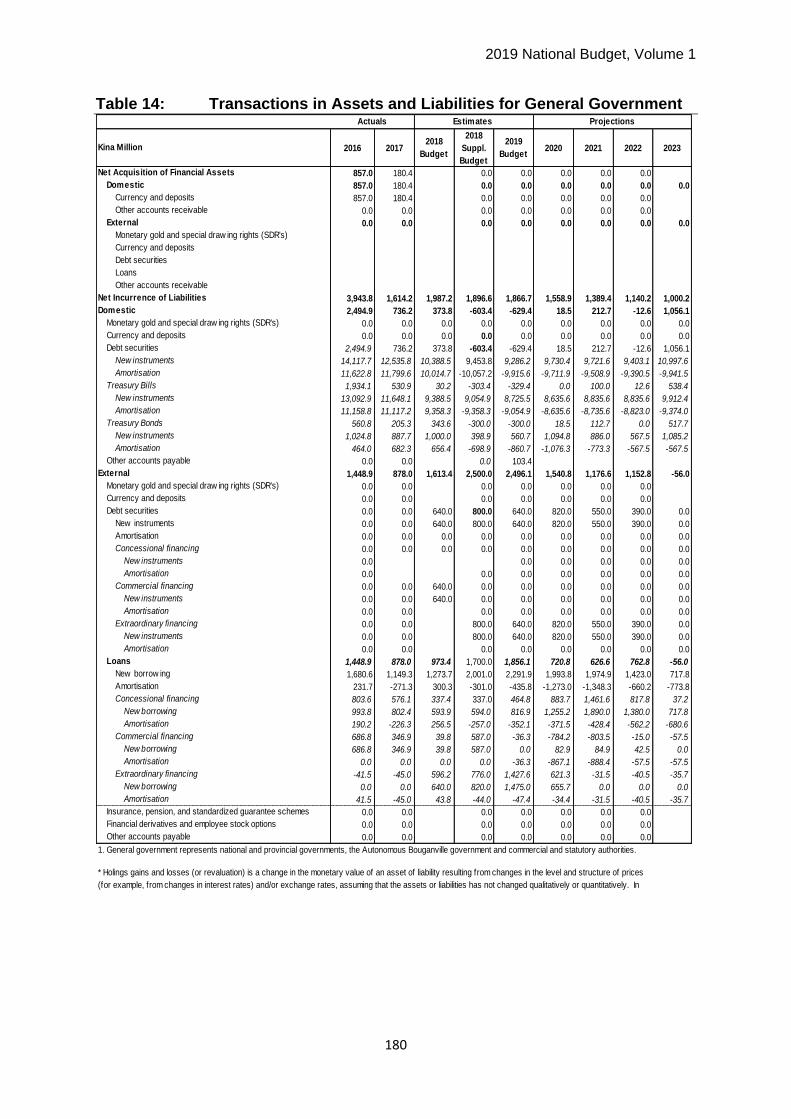
2019 National Budget, Volume 1
180
Table 14: Transactions in Assets and Liabilities for General Government
2016 20172018
Budget
2018
Suppl.
Budget
2019
Budget2020 2021 2022 2023
857.0 180.4 0.0 0.0 0.0 0.0 0.0
857.0 180.4 0.0 0.0 0.0 0.0 0.0 0.0
857.0 180.4 0.0 0.0 0.0 0.0 0.0
0.0 0.0 0.0 0.0 0.0 0.0 0.0
0.0 0.0 0.0 0.0 0.0 0.0 0.0 0.0
3,943.8 1,614.2 1,987.2 1,896.6 1,866.7 1,558.9 1,389.4 1,140.2 1,000.2
2,494.9 736.2 373.8 -603.4 -629.4 18.5 212.7 -12.6 1,056.1
0.0 0.0 0.0 0.0 0.0 0.0 0.0 0.0 0.0
0.0 0.0 0.0 0.0 0.0 0.0 0.0 0.0 0.0
2,494.9 736.2 373.8 -603.4 -629.4 18.5 212.7 -12.6 1,056.1
14,117.7 12,535.8 10,388.5 9,453.8 9,286.2 9,730.4 9,721.6 9,403.1 10,997.6
11,622.8 11,799.6 10,014.7 -10,057.2 -9,915.6 -9,711.9 -9,508.9 -9,390.5 -9,941.5
1,934.1 530.9 30.2 -303.4 -329.4 0.0 100.0 12.6 538.4
13,092.9 11,648.1 9,388.5 9,054.9 8,725.5 8,635.6 8,835.6 8,835.6 9,912.4
11,158.8 11,117.2 9,358.3 -9,358.3 -9,054.9 -8,635.6 -8,735.6 -8,823.0 -9,374.0
560.8 205.3 343.6 -300.0 -300.0 18.5 112.7 0.0 517.7
1,024.8 887.7 1,000.0 398.9 560.7 1,094.8 886.0 567.5 1,085.2
464.0 682.3 656.4 -698.9 -860.7 -1,076.3 -773.3 -567.5 -567.5
0.0 0.0 0.0 103.4
1,448.9 878.0 1,613.4 2,500.0 2,496.1 1,540.8 1,176.6 1,152.8 -56.0
0.0 0.0 0.0 0.0 0.0 0.0 0.0
0.0 0.0 0.0 0.0 0.0 0.0 0.0
0.0 0.0 640.0 800.0 640.0 820.0 550.0 390.0 0.0
0.0 0.0 640.0 800.0 640.0 820.0 550.0 390.0 0.0
0.0 0.0 0.0 0.0 0.0 0.0 0.0 0.0 0.0
0.0 0.0 0.0 0.0 0.0 0.0 0.0 0.0 0.0
0.0 0.0 0.0 0.0 0.0 0.0
0.0 0.0 0.0 0.0 0.0 0.0 0.0
0.0 0.0 640.0 0.0 0.0 0.0 0.0 0.0 0.0
0.0 0.0 640.0 0.0 0.0 0.0 0.0 0.0 0.0
0.0 0.0 0.0 0.0 0.0 0.0 0.0 0.0
0.0 0.0 800.0 640.0 820.0 550.0 390.0 0.0
0.0 0.0 800.0 640.0 820.0 550.0 390.0 0.0
0.0 0.0 0.0 0.0 0.0 0.0 0.0 0.0
1,448.9 878.0 973.4 1,700.0 1,856.1 720.8 626.6 762.8 -56.0
1,680.6 1,149.3 1,273.7 2,001.0 2,291.9 1,993.8 1,974.9 1,423.0 717.8
231.7 -271.3 300.3 -301.0 -435.8 -1,273.0 -1,348.3 -660.2 -773.8
803.6 576.1 337.4 337.0 464.8 883.7 1,461.6 817.8 37.2
993.8 802.4 593.9 594.0 816.9 1,255.2 1,890.0 1,380.0 717.8
190.2 -226.3 256.5 -257.0 -352.1 -371.5 -428.4 -562.2 -680.6
686.8 346.9 39.8 587.0 -36.3 -784.2 -803.5 -15.0 -57.5
686.8 346.9 39.8 587.0 0.0 82.9 84.9 42.5 0.0
0.0 0.0 0.0 0.0 -36.3 -867.1 -888.4 -57.5 -57.5
-41.5 -45.0 596.2 776.0 1,427.6 621.3 -31.5 -40.5 -35.7
0.0 0.0 640.0 820.0 1,475.0 655.7 0.0 0.0 0.0
41.5 -45.0 43.8 -44.0 -47.4 -34.4 -31.5 -40.5 -35.7
0.0 0.0 0.0 0.0 0.0 0.0 0.0
0.0 0.0 0.0 0.0 0.0 0.0 0.0
0.0 0.0 0.0 0.0 0.0 0.0 0.0
Projections
Amortisation
Insurance, pension, and standardized guarantee schemes
Financial derivatives and employee stock options
Other accounts payable
* Holings gains and losses (or revaluation) is a change in the monetary value of an asset of liability resulting from changes in the level and structure of prices
(for example, from changes in interest rates) and/or exchange rates, assuming that the assets or liabilities has not changed qualitatively or quantitatively. In
GFS holding gains and losses are not regarded transactions but other economic f low s.
New borrowing
Amortisation
Concessional financing
New borrowing
Amortisation
Amortisation
Extraordinary financing
Actuals
New instruments
Amortisation
Extraordinary financing
New instruments
Other accounts payable
External
Monetary gold and special draw ing rights (SDR's)
Currency and deposits
Debt securities
New instruments
Amortisation
Monetary gold and special draw ing rights (SDR's)
Concessional financing
Commercial financing
New borrowing
New instruments
Amortisation
Loans
New borrow ing
Amortisation
Commercial financing
Debt securities
New instruments
Amortisation
Treasury Bills
New instruments
Amortisation
Treasury Bonds
New instruments
Amortisation
Other accounts receivable
Net Incurrence of Liabilities
Domestic
Monetary gold and special draw ing rights (SDR's)
Currency and deposits
Debt securities
Loans
Estimates
1. General government represents national and provincial governments, the Autonomous Bouganville government and commercial and statutory authorities.
External
Kina Million
Net Acquisition of Financial Assets
Domestic
Currency and deposits
Other accounts receivable
Currency and deposits

2019 National Budget, Volume 1
181
Table 15: Stocks of General Government Debt
2016 20172018
Budget
2018
Suppl.
Budget
2019
Budget2020 2021 2022 2023
16,436.9 17,173.1 17,723.2 16,569.3 15,940.3 15,958.8 16,171.5 16,158.9 17,215.0
16,436.9 17,173.1 17,723.2 16,569.3 15,836.8 14,787.7 15,386.6 15,764.3 17,111.5
8,663.5 9,194.4 9,388.5 8,234.6 7,075.3 6,102.5 6,474.7 6,419.9 5,881.5
7,773.4 7,978.7 8,334.7 8,334.7 8,761.5 8,685.2 8,911.9 9,344.4 10,939.4
0.0 0.0 0.0 0.0 103.5 103.5 103.5 103.5 103.5
5,507.1 6,385.1 8,084.4 8,885.7 11,381.9 12,922.6 14,099.2 15,252.0 15,196.0
0.0 0.0 640.0 640.0 1,630.8 3,230.8 3,230.8 3,230.8 3,230.8
0.0 0.0 0.0 0.0 0.0 0.0 0.0 0.0 0.0
0.0 0.0 640.0 640.0 1,630.8 3,230.8 3,230.8 3,230.8 3,230.8
0.0 0.0 0.0 0.0 0.0 0.0 0.0 0.0 0.0
5,507.1 6,385.1 7,444.4 7,444.4 9,953.2 10,673.2 11,463.6 12,226.4 12,170.3
4,593.0 5,396.4 5,228.7 5,228.7 5,958.7 6,842.5 8,304.1 9,122.4 9,159.5
686.8 1,033.7 1,429.6 1,429.6 1,617.3 833.1 29.6 14.6 (43.0)
227.3 (45.0) 786.0 786.0 2,377.2 2,997.6 3,129.9 3,089.4 3,053.7
21,944.0 23,558.2 25,807.6 25,455.0 27,322.2 28,881.4 30,270.7 31,410.9 32,411.0
32.4% 31.2% 32.2% 30.9% 30.8% 30.3% 29.4% 27.5% 25.9%
67,762.2 75,626.0 80,113.4 82,341.1 88,672.2 95,397.0 103,035.0 114,042.7 125,054.3
2. Total nominal GDP by economic activity, Actual: National Statistics Office and Projections: Treasury Department.
Estimates Actuals Projections
Treasury Bills
1. General government represents national and provincial governments, the Autonomous Bouganville government and commercial and
statutory authorities.
Gross Domestic Product2
Loans
Concessional financing
Commercial financing
Extraordinary financing
Total Central Government Debt
Total debt as percentage of GDP
Kina Million
Domestic
Debt securities
Extraordinary financing
Treasury Bonds
Loans
External
Debt securities
Concessional financing
Commercial financing

2019 National Budget, Volume 1
182
Table 16: Sovereign Wealth Fund – Stabilisation Fund
(Kina Million) 2018 2019 2020 2021 2022 2023
REVENUE
TAXES 362.5 428.1 259.3 240.3 294.6 295.8
Taxes on Income, Profits and Capital Gains
Mining and Petroleum Taxes 362.5 428.1 259.3 240.3 294.6 295.8
OTHER REVENUE 0.2 0.3 0.2 0.2 0.2 0.2
Property Income 0.2 0.3 0.2 0.2 0.2 0.2
Interest 0.2 0.3 0.2 0.2 0.2 0.2
Dividends 0.0 0.0 0.0 0.0 0.0 0.0
Mining Petroleum and Gas Dividends 0.0 0.0 0.0 0.0 0.0 0.0
Other Dividends (eg money paid into SWF from sale of shares) 0 0 0 0 0 0
Current Transfers n.e.c. 0.0 0.0 0.0 0.0 0.0 0.0
TOTAL REVENUE 362.7 428.4 259.5 240.5 294.8 296.0
EXPENSES
Use of Goods and Services 0.07 0.08 0.05 0.05 0.06 0.06
Transfers n.e.c. 362.7 428.3 259.4 240.4 294.8 296.0
Current (Transfer to Budget) 362.7 428.3 259.4 240.4 294.8 296.0
Current (Transfer to Savings Fund) 0.0 0.0 0.0 0.0 0.0 0.0
TOTAL EXPENSES 362.7 428.4 259.5 240.5 294.8 296.0
GROSS/NET OPERATING BALANCE 0.0 0.0 0.0 0.0 0.0 0.0
NET ACQUISITION OF FINANCIAL ASSETS 0.0 0.0 0.0 0.0 0.0 0.0
Balance in Stabilisatio Fund at 31 December 0.0 0.0 0.0 0.0 0.0 0.0

2019 National Budget, Volume 1
183
Table 17: Sovereign Wealth Fund – Savings Fund
(Kina Million) 2018 2019 2020 2021 2022 2023
REVENUE
OTHER REVENUE 0.0 0.0 0.0 0.0 0.0 0.0
Property Income 0.0 0.0 0.0 0.0 0.0 0.0
Interest 0.0 0.0 0.0 0.0 0.0 0.0
Dividends 0.0 0.0 0.0 0.0 0.0 0.0
Mining Petroleum and Gas Dividends 0.0 0.0 0.0 0.0 0.0 0.0
Other Dividends (eg money paid into SWF from sale of shares) 0 0 0 0 0 0
Current Transfers n.e.c. 0.0 0.0 0.0 0.0 0.0 0.0
TOTAL REVENUE 0.0 0.0 0.0 0.0 0.0 0.0
EXPENSES
Use of Goods and Services 0.0 0.0 0.0 0.0 0.0 0.0
TOTAL EXPENSES 0.0 0.0 0.0 0.0 0.0 0.0
GROSS/NET OPERATING BALANCE 0.0 0.0 0.0 0.0 0.0 0.0
NET ACQUISITION OF FINANCIAL ASSETS 0.0 0.0 0.0 0.0 0.0 0.0
Balance in Savings Fund at 31 December 0.0 0.0 0.0 0.0 0.0 0.0