2018 oil strategy outlook: the battle for balance 12, 2017 2018 oil strategy outlook: the battle for...
TRANSCRIPT

December 12, 2017
2018 Oil Strategy Outlook: The Battle for Balance
While largely range-bound relative to the volatile swings seen in preceding years, oil price action was often trendless and, until recently, catatonic for much of 2017 despite the improving fundamental backdrop. The herd mentality remains fiercely strong, making investor positioning arguably more influential than market fundamentals at times.
Prices will ebb and flow over the coming months, but our conviction supports the notion of a rising price floor that is likely to limit potential risk to the downside. We view dips as key buying opportunities given the firming fundamental framework.
We are revising our 2018 average price forecast for WTI to $58/bbl (from $53/bbl) while Brent increases to an average of $62.30/bbl (from $55.50/bbl). While we see prices as largely range-bound, next year is fraught with potential “gap” risk given that many variables have upward skew potential.
One can argue that many of the variable risks present counterweights to a market that is widely expected to reach storage equilibrium next year—the bear US shale story and the bull Venezuela development are two variables, for example, that can make for disproportionate and lumpy price action over the course of 2018. We also highlight several other visible risks with variable outcomes to watch for in the year ahead.
With a tightening fundamental backdrop and a return to normalized stockpiles in sight, the logical next question is: What is the leading indicator to watch as a gauge of the broad health of the oil market? Spoiler alert: The Atlantic Basin.
While our West to East rebalancing thesis remains in motion, the global market is having difficulty simultaneously soaking up both the Atlantic Basin crudes and US barrels. The fungible nature of these barrels has left global balances in a cannibalizing position.
The US shale impact is now encroaching on unchartered territory. Until recently, US barrels never competed head on with global crudes outside the US Gulf. Previously, the shale phenomenon had localized impact with a global ripple effect. The US production boom has redrawn the global crude flow map and has wide-ranging implications for how we think about the future of the global oil trade.
Despite years of dominating Asian market share, OPEC is no longer benefiting from home field advantage. The bottom line is that US crude exports are disrupting the historical rules of thumb as it pertains to logistics and the physical movement of global oil.
Figure 1: Bloomberg Weekly Analyst Sentiment Survey vs. WTI Spot Price
Source: RBC Capital Markets, Bloomberg
RBC Capital Markets, LLC Michael Tran Commodity Strategist (212) 266-4020 [email protected] Helima Croft Global Head of Commodity Strategy (212) 618-7798 [email protected] Christopher Louney Commodity Strategist (212) 437-1925 [email protected]
All values in USD unless otherwise noted. Priced as of prior trading day’s market close, ET (unless otherwise stated).
For Required Conflicts Disclosures, please see page 16.
40
42
44
46
48
50
52
54
56
58
0%
10%
20%
30%
40%
50%
60%
70%
80%
Jan'17 Feb'17 Mar'17 Apr'17 May'17 Jun'17 Jul'17 Aug'17 Sep'17 Oct'17 Nov'17
$/bbl% Bullish
% of bullish analysts WTI PriceKey divergence between price & sentiment
Disseminated: December 12, 2017 00:15ET; Produced: December 11, 2017 23:44ET
2018 Oil Strategy Outlook: The Battle for Balance
December 12, 2017 2
Oil Strategy: The Battle for Balance
1) Wisdom of Crowds .............................................................................................................................................................. Page 2
2) Global Oil Price Outlook – Asymmetric Risks in 2018 .......................................................................................................... Page 3
3) What to Watch in 2018: The Atlantic Basin and the Battle for Balance .............................................................................. Page 8
4) What to Watch in 2018: Redrawing the Global Crude Flow Map ..................................................................................... Page 11
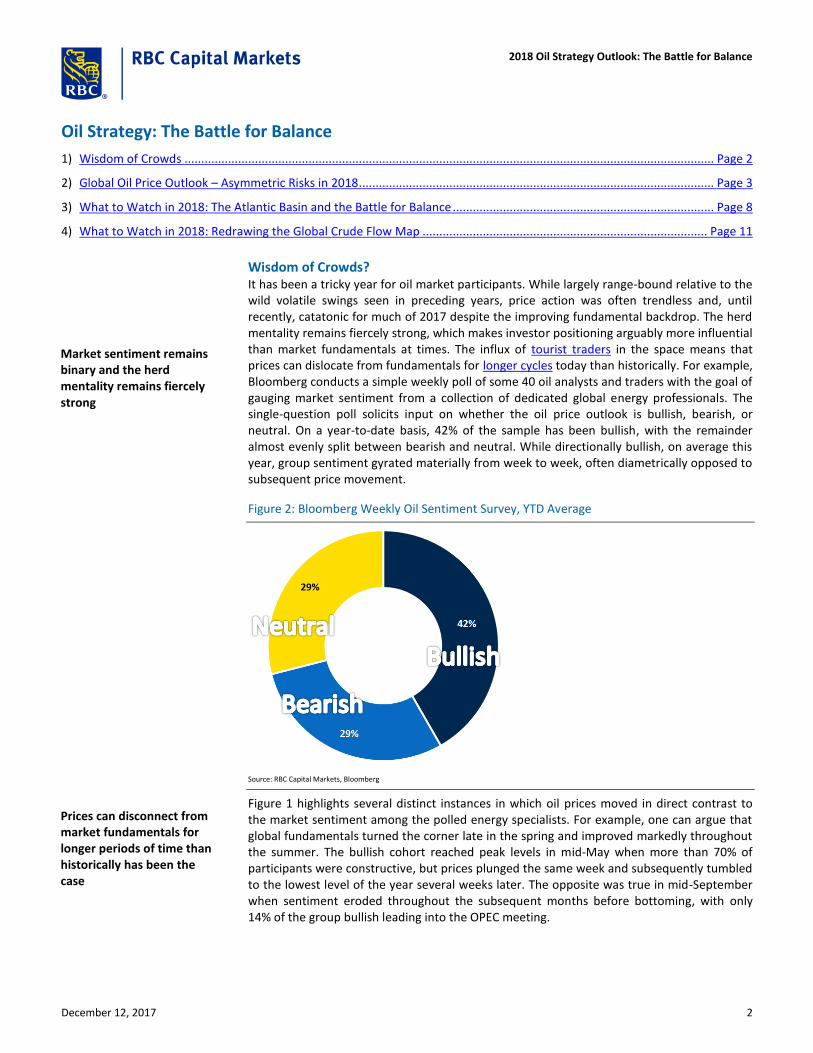
Wisdom of Crowds? It has been a tricky year for oil market participants. While largely range-bound relative to the wild volatile swings seen in preceding years, price action was often trendless and, until recently, catatonic for much of 2017 despite the improving fundamental backdrop. The herd mentality remains fiercely strong, which makes investor positioning arguably more influential than market fundamentals at times. The influx of tourist traders in the space means that prices can dislocate from fundamentals for longer cycles today than historically. For example, Bloomberg conducts a simple weekly poll of some 40 oil analysts and traders with the goal of gauging market sentiment from a collection of dedicated global energy professionals. The single-question poll solicits input on whether the oil price outlook is bullish, bearish, or neutral. On a year-to-date basis, 42% of the sample has been bullish, with the remainder almost evenly split between bearish and neutral. While directionally bullish, on average this year, group sentiment gyrated materially from week to week, often diametrically opposed to subsequent price movement.
Figure 2: Bloomberg Weekly Oil Sentiment Survey, YTD Average
Source: RBC Capital Markets, Bloomberg
Figure 1 highlights several distinct instances in which oil prices moved in direct contrast to the market sentiment among the polled energy specialists. For example, one can argue that global fundamentals turned the corner late in the spring and improved markedly throughout the summer. The bullish cohort reached peak levels in mid-May when more than 70% of participants were constructive, but prices plunged the same week and subsequently tumbled to the lowest level of the year several weeks later. The opposite was true in mid-September when sentiment eroded throughout the subsequent months before bottoming, with only 14% of the group bullish leading into the OPEC meeting.
Market sentiment remains binary and the herd mentality remains fiercely strong
Prices can disconnect from market fundamentals for longer periods of time than historically has been the case

2018 Oil Strategy Outlook: The Battle for Balance
December 12, 2017 3
To be fair, the anecdotal survey is a snapshot of near-term sentiment rather than an official price forecast, but the frequent divergence raises several questions: Is market consensus lying to us? Does sentiment among tourist traders matter more than a fundamentally driven outlook? Does the former have outsized near-term influence on prices? Have recurring faulty price recoveries de-sensitized energy specialists?
Dedicated energy analysts and traders track different market indicators than non-energy specialists. As has been the case during several occasions over recent years, fundamentalists may often be early on calls if balances send firm fundamental signals, but such a view may not necessarily be reflected in prices until indicators reach the mainstream media and are digested by investment generalists. In addition to modeling supply and demand, specialists often have to consider the actions of the broader crowd to ensure that views are immediately actionable and can be monetized. One can argue that being early is the same as being wrong given the fleeting nature of investment capital, but the convergence between price and fundamentals is now often realized over longer cycles than was the case previously.
Figure 3: OECD Oil Stocks – Surplus to Current Five-Year Average
Source: RBC Capital Markets, EIA, IEA, JODI, PAJ, Euroilstock, country and government reports
Global Oil Prices: Asymmetric Risks in 2018 Despite several premature price rallies over recent years, the drastically improved fundamental backdrop makes the recent recovery more sustainable than the previous myriad of stutter steps. While we remain cautious at current oil price levels given the pace of WTI’s surge toward $60/bbl, our conviction supports the notion of a rising price floor that is likely to limit potential risk to the downside. Investor positioning remains toppy and warrants watching given that subtle shifts in sentiment can have an outsized impact on price, particularly when positioning is pushing record length. The lesson learned over recent years is that the herd mentality is strong and tourist traders cycling in and out of positions can make for violent price swings even if prices are largely embedded in a $50–65/bbl range. We view dips as key buying opportunities given the firming fundamental framework, particularly as geopolitical risk plays an increasingly large needle-moving role as global storage shock absorbers become eradicated.
-200
-100
0
100
200
300
400
2010 2011 2012 2013 2014 2015 2016 2017
mb
OECD APACOECD EuropeOECD Americas
Investor positioning leaves room for pause, but global fundamentals remain firm
Dips are to be bought, particularly as global storage shock absorbers become eradicated
2018 Oil Strategy Outlook: The Battle for Balance
December 12, 2017 4
Figure 4: Global Oil Supply & Demand Balance
Source: RBC Capital Markets, EIA, IEA, JODI, country and government reports
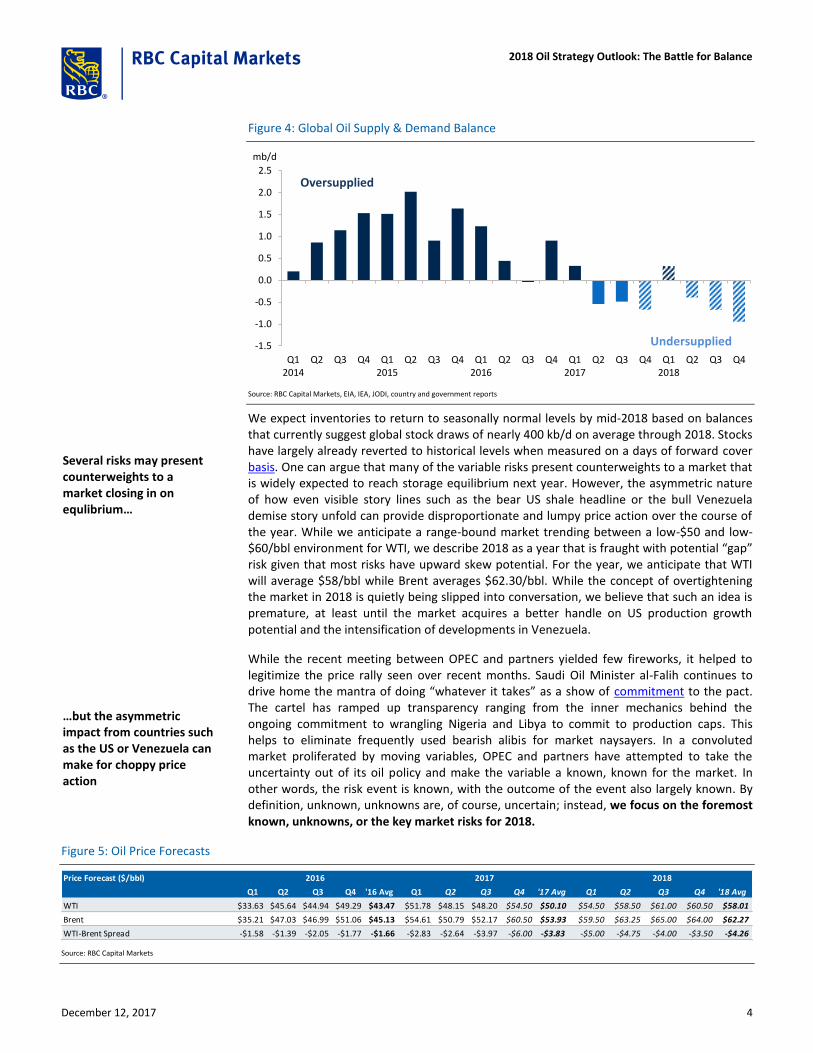
We expect inventories to return to seasonally normal levels by mid-2018 based on balances that currently suggest global stock draws of nearly 400 kb/d on average through 2018. Stocks have largely already reverted to historical levels when measured on a days of forward cover basis. One can argue that many of the variable risks present counterweights to a market that is widely expected to reach storage equilibrium next year. However, the asymmetric nature of how even visible story lines such as the bear US shale headline or the bull Venezuela demise story unfold can provide disproportionate and lumpy price action over the course of the year. While we anticipate a range-bound market trending between a low-$50 and low-$60/bbl environment for WTI, we describe 2018 as a year that is fraught with potential “gap” risk given that most risks have upward skew potential. For the year, we anticipate that WTI will average $58/bbl while Brent averages $62.30/bbl. While the concept of overtightening the market in 2018 is quietly being slipped into conversation, we believe that such an idea is premature, at least until the market acquires a better handle on US production growth potential and the intensification of developments in Venezuela.
While the recent meeting between OPEC and partners yielded few fireworks, it helped to legitimize the price rally seen over recent months. Saudi Oil Minister al-Falih continues to drive home the mantra of doing “whatever it takes” as a show of commitment to the pact. The cartel has ramped up transparency ranging from the inner mechanics behind the ongoing commitment to wrangling Nigeria and Libya to commit to production caps. This helps to eliminate frequently used bearish alibis for market naysayers. In a convoluted market proliferated by moving variables, OPEC and partners have attempted to take the uncertainty out of its oil policy and make the variable a known, known for the market. In other words, the risk event is known, with the outcome of the event also largely known. By definition, unknown, unknowns are, of course, uncertain; instead, we focus on the foremost known, unknowns, or the key market risks for 2018.
Figure 5: Oil Price Forecasts
Source: RBC Capital Markets
-1.5
-1.0
-0.5
0.0
0.5
1.0
1.5
2.0
2.5
Q12014
Q2 Q3 Q4 Q12015
Q2 Q3 Q4 Q12016
Q2 Q3 Q4 Q12017
Q2 Q3 Q4 Q12018
Q2 Q3 Q4
mb/d
Oversupplied
Undersupplied
Price Forecast ($/bbl)
Q1 Q2 Q3 Q4 '16 Avg Q1 Q2 Q3 Q4 '17 Avg Q1 Q2 Q3 Q4 '18 Avg
WTI $33.63 $45.64 $44.94 $49.29 $43.47 $51.78 $48.15 $48.20 $54.50 $50.10 $54.50 $58.50 $61.00 $60.50 $58.01
Brent $35.21 $47.03 $46.99 $51.06 $45.13 $54.61 $50.79 $52.17 $60.50 $53.93 $59.50 $63.25 $65.00 $64.00 $62.27
WTI-Brent Spread -$1.58 -$1.39 -$2.05 -$1.77 -$1.66 -$2.83 -$2.64 -$3.97 -$6.00 -$3.83 -$5.00 -$4.75 -$4.00 -$3.50 -$4.26
2016 2017 2018
Several risks may present counterweights to a market closing in on equlibrium…
…but the asymmetric impact from countries such as the US or Venezuela can make for choppy price action

2018 Oil Strategy Outlook: The Battle for Balance
December 12, 2017 5
Figure 6: Known, Unknowns (Visible Risks with Variable Outcomes) and the Impact on Price
Source: RBC Capital Markets
Known, Unknowns (Visible Risks, Unknown Outcomes) In a market with few true known, knowns, the visible risks with variable outcomes, or known, unknowns, often provide the biggest torque to oil prices. While geopolitical risk can often be lumped into the unknown, unknown category, it is not necessarily the uncertainty surrounding the geopolitical event itself; instead, the market reaction to the risk will become increasingly apparent as the global surplus in inventories continue to deplete. Simply put, the event may often be unknown, but the directional price movement likely has greater certainty given that the shrinking storage buffer means that markets are increasingly susceptible to being ignited by adverse global events. This is already unfolding, as several geopolitical events over recent months have sparked rallies that previously would have generated a relatively muted response. The demise of Venezuela is well known and arguably less of a hypothetical risk and more of an unraveling actuality, but the degree, pace, and timing of production continuing to falter remain in question. It is clear that the evolving situation is bullish, but how bullish? And over what time period?
Naturally, the biggest roadblock to prices continuing to trend higher remains clouded by question marks surrounding US production. While our medium-term constructive upward price trajectory remains intact, the shape and the tenor of the next cycle hang in the wait. Many view OPEC’s production cut extension as an attempt by the cartel to shore up fiscal balances (among other things), but it is also important to remember that the Saudi-led cartel continues to gather data points on the elasticity of non-OPEC production growth at various price points. US producers have long suggested that short cycle, price elastic shale can flourish in a mid-$50 price environment. The backdrop of multi-year price highs coupled with topped-up hedges provides a license to drill. However, in a way and unlikely by design, the
Outlook: Bearish. Upside price potential remains clouded by question marks surrounding production. US producers have long suggested that short-cycle, price-elastic shale can flourish in a mid-$50 price environment. The backdrop of multi-year price highs coupled with topped-up hedges provides a license to drill, but in a way and unlikely by design, the price environment inadvertently tests the ability of US producers to deliver. With prices in a self-described sweet spot, an inability to perform within the realm of expectations would undoubtedly alter the perception of the economics of shale.
Outlook: Bullish. While the geopolitical event itself is often unknown, the price reaction to the risk will become increasingly apparent as the market’s susceptibility to adverse global events increases as the global storage buffer narrows. Several recent geopolitical events have sparked rallies that previously would have generated a relatively muted response. The demise of Venezuela is well known and arguably no longer a risk, but the degree and pace at which production falters remain the key question.
Outlook: Neutral/Bullish. Concerns regarding the off ramp for OPEC and partners surrounding production cuts and ongoing compliance remain central for a skittish market. The emphasis on the health of the broader economy sets the stage for a future pivot to a strong demand growth narrative. The future focus on meeting demand growth will alter the broad market narrative and serves as a bridge from a market currently led by a supply push to that of a demand pull without a fall-out in price.
Outlook: Neutral/Bearish. OECD demand peaked 10 years ago and despite recent years of relative strength, we anticipate OECD demand growth to revert back to the anemic growth rates of previous years. The US and Europe have been reasonably strong of late, and that is unlikely to change given the firm economic backdrop, but participation will be limited in the years ahead. Growth from the OECD should be viewed as an upside surprise rather than counted on to carry the load. Emerging Asia remains the bright spot and will continue to anchor global demand growth, but concentration risk remains.
Outlook: Neutral. Despite the improved fundamental outlook, market participants are taking a defensive stance as the year winds down. With toppy investor positioning, one can argue that all of the bulls are already in the trade. Where will the next buyer come from? On the flip side, balances are trending tighter and fundamentals haven’t looked this strong in years. Will the turn of the calendar year bring more generalist investors back into the fold? Do the lessons learned from recent years alter how oil producers and consumers view risk management?
OPEC has attempted to make its policy a known variable…
…but several other known risks come with unknown outcomes

2018 Oil Strategy Outlook: The Battle for Balance
December 12, 2017 6
price environment inadvertently challenges US production to deliver. With prices in a self-described sweet spot, the inability to perform within the realm of expectations would undoubtedly alter the perception of the evolving economics of shale.
Market participants will continue to pontificate on both ongoing compliance levels and the off ramp for OPEC’s production cuts, particularly as prices firm. In our view, the group’s emphasis on global economic growth and the health of the broader economy help to set the stage for a future pivot to a strong demand growth narrative. In other words, OPEC and its partners will remain committed to tightening global inventories before passing the baton to resilient global oil demand growth to keep the fundamentals of the oil market balanced. The future focus on meeting demand growth will alter the broad narrative and serve as a bridge from a market currently led by a supply push to that of a demand pull without a fall-out in price.
Figure 7: Actual OECD Oil Demand vs. Pre-Recession Trend
Source: RBC Capital Markets, EIA, IEA, JODI, country and government reports
Our expectation for 2018 global demand growth remains status quo steady near 1.3 mb/d, YoY. While the oil price collapse of recent years has provided the opportunity for demand to outperform, we expect recent growth trends to slow modestly over the coming years. To be clear, global oil demand growth has been robust and even remarkable, at times, since the oil price collapse, but we expect global oil demand to revert back to a tale of two distinctly different regions: the OECD and the Emerging Markets. Global peak oil demand remains topical in the news cycle, but it is important to remind ourselves that OECD demand peaked nearly 10 years ago during the Financial Crisis, and despite several recent years of relative outperformance, we anticipate OECD demand growth to revert back to the anemic growth rates of previous years. Currently, three major pillars of growth support the bulk of global consumption growth: The US, Europe, and Emerging Asia. And while the US and Europe are unlikely to experience a dramatic drop-off given the reasonably strong economic backdrop of each region, we anticipate tepid participation in the years ahead given the structural downtrend in oil demand as fuel competition, vehicle efficiency, and broad consumption patterns all carry a bearish hue. In short, we see limited demand growth stemming from OECD countries this year and firm participation from the region should be viewed as an upside surprise rather than counted on to carry the load.
42
44
46
48
50
52
54
56
58
1995 1998 2001 2004 2007 2010 2013 2016
mb/d
OECD Demand
Pre-Recession Trend
US production is in the hot seat and will be counted on to deliver given that prices have risen to a self-declared “sweet spot”
Global oil demand growth will be a tale of two distinctly different regions: OECD and Emerging Markets

2018 Oil Strategy Outlook: The Battle for Balance
December 12, 2017 7
Figure 8: Middle East Oil Demand, YoY Change Figure 9: Global Oil Demand Growth by Region, YoY Change
Source: RBC Capital Markets, IEA, JODI, country and government sources
Emerging Markets demand growth can ultimately be distilled down to China, India, the rest of developing Asia, and pockets of the Middle East. Middle Eastern oil demand growth averaged some 330 kb/d in the three years prior to the oil price collapse and -31 kb/d in the three years since. While far from resurgent, a higher oil price environment and a more stable domestic fiscal backdrop for the oil-producing region translates into the Middle East chipping in some 130 kb/d of demand growth next year.
Global demand has grown at an annualized clip of 1.3 mb/d over the course of this decade, with two-thirds stemming from the collection of countries in Emerging Asia. In other words, this cohort has continually delivered, but the concentration risk always presents an asymmetric risk profile to the downside. For example, transitory soft patches in places like India earlier this year can temporarily magnify the fragile nature of future demand growth.
Traded volumes remain elevated, and investor length hovers near record highs across several benchmark contracts, yet market sentiment remains mixed and risk appetite is anecdotally fleeting. With toppy investor length and shorts at recent lows, one can argue that all of the bulls are already in the trade. In other words, given that prices have hovered in a high $50/bbl price environment for several months, where will the next buyer come from? Does profit-taking or length fatigue set in, particularly if prices continue to malaise at current levels over the coming weeks? Do the first signs of bearish news ignite a flurry of shorts to pile back into the trade? Do the lessons from recent years alter how oil producers and consumers view risk management? Despite the improved fundamental outlook, market participants appear to be defensive as the year winds down rather than forcing risk almost irrespective of outlook. Numerous head fakes have, at times, stymied investor appetite, but will the new fiscal year bring renewed interest or will investors be parked on the sidelines? As realized over recent years, market positioning can play a profound role in both disconnecting and converging prices to oil market fundamentals.
-200
-100
0
100
200
300
400
500
2010 2011 2012 2013 2014 2015 2016 2017 2018
kb/d
51%
100%57% 57% 65%
69%63% 61% 64%
-500
0
500
1,000
1,500
2,000
2,500
3,000
3,500
2010 2011 2012 2013 2014 2015 2016 2017 2018
kb/d
Rest of World
Emerging Asia
OECD growth should be viewed as an upside surprise rather than counted on to carry the load
Emerging Markets have delivered over recent years, but concentration risk remains
2018 Oil Strategy Outlook: The Battle for Balance
December 12, 2017 8
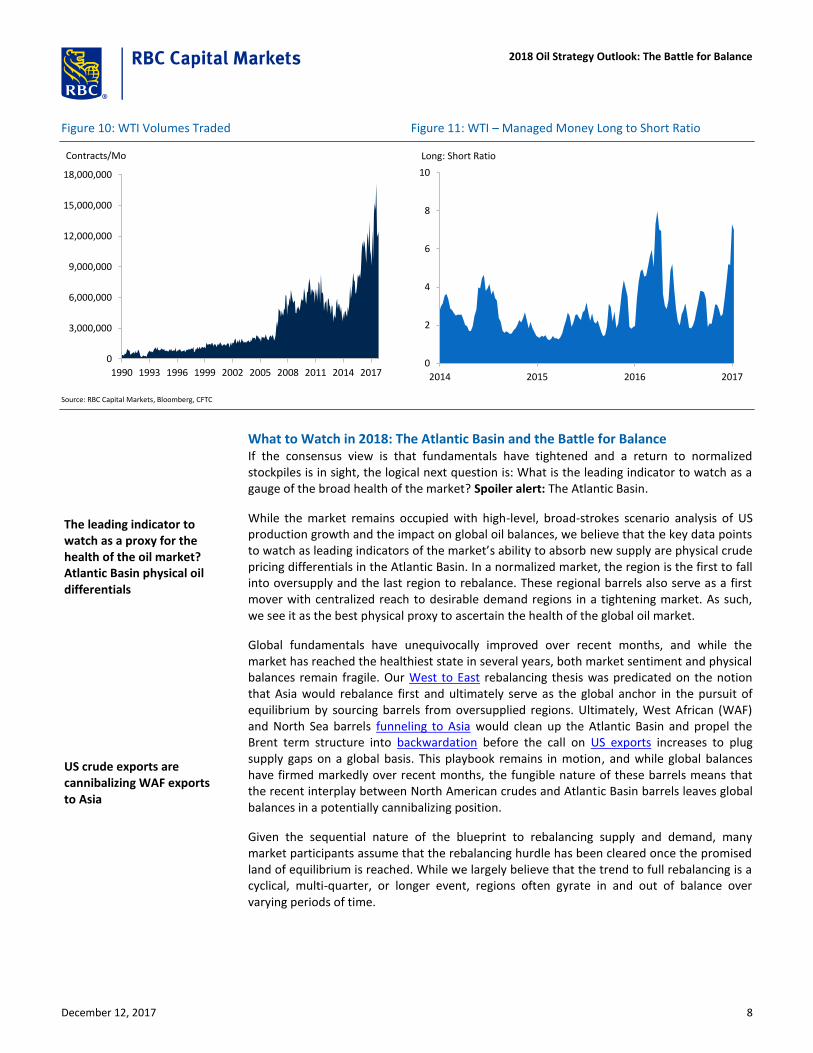
Figure 10: WTI Volumes Traded Figure 11: WTI – Managed Money Long to Short Ratio
Source: RBC Capital Markets, Bloomberg, CFTC
What to Watch in 2018: The Atlantic Basin and the Battle for Balance If the consensus view is that fundamentals have tightened and a return to normalized stockpiles is in sight, the logical next question is: What is the leading indicator to watch as a gauge of the broad health of the market? Spoiler alert: The Atlantic Basin.
While the market remains occupied with high-level, broad-strokes scenario analysis of US production growth and the impact on global oil balances, we believe that the key data points to watch as leading indicators of the market’s ability to absorb new supply are physical crude pricing differentials in the Atlantic Basin. In a normalized market, the region is the first to fall into oversupply and the last region to rebalance. These regional barrels also serve as a first mover with centralized reach to desirable demand regions in a tightening market. As such, we see it as the best physical proxy to ascertain the health of the global oil market.
Global fundamentals have unequivocally improved over recent months, and while the market has reached the healthiest state in several years, both market sentiment and physical balances remain fragile. Our West to East rebalancing thesis was predicated on the notion that Asia would rebalance first and ultimately serve as the global anchor in the pursuit of equilibrium by sourcing barrels from oversupplied regions. Ultimately, West African (WAF) and North Sea barrels funneling to Asia would clean up the Atlantic Basin and propel the Brent term structure into backwardation before the call on US exports increases to plug supply gaps on a global basis. This playbook remains in motion, and while global balances have firmed markedly over recent months, the fungible nature of these barrels means that the recent interplay between North American crudes and Atlantic Basin barrels leaves global balances in a potentially cannibalizing position.
Given the sequential nature of the blueprint to rebalancing supply and demand, many market participants assume that the rebalancing hurdle has been cleared once the promised land of equilibrium is reached. While we largely believe that the trend to full rebalancing is a cyclical, multi-quarter, or longer event, regions often gyrate in and out of balance over varying periods of time.
0
3,000,000
6,000,000
9,000,000
12,000,000
15,000,000
18,000,000
1990 1993 1996 1999 2002 2005 2008 2011 2014 2017
Contracts/Mo
0
2
4
6
8
10
2014 2015 2016 2017
Long: Short Ratio
The leading indicator to watch as a proxy for the health of the oil market? Atlantic Basin physical oil differentials
US crude exports are cannibalizing WAF exports to Asia

2018 Oil Strategy Outlook: The Battle for Balance
December 12, 2017 9
Figure 12: Atlantic Basin Physical Differential to Dated Brent Pricing
Source: RBC Capital Markets, Reuters
Asia has been balanced for much of this year, and while localized Brent-based fundamentals trended firmer late this summer, the Atlantic Basin has, at times, shown signs of softness. Physical indicators of regional balances such as Forties, Oseberg, Ekofisk, and other North Sea pricing differentials have recently waxed and waned since reaching peak backwardation “steepness” over recent weeks. WAF crudes like Qua Iboe have reflected a similarly looser regional fundamental framework. Front Brent spreads have oscillated between intermittent periods of relative softness, followed by bouts of strength over recent months. Regional physical differentials reflect the ability to find buyers and clear cargoes. Firm pricing signals barrels bid away while a trend of softer prices is indicative of a dearth of takers.
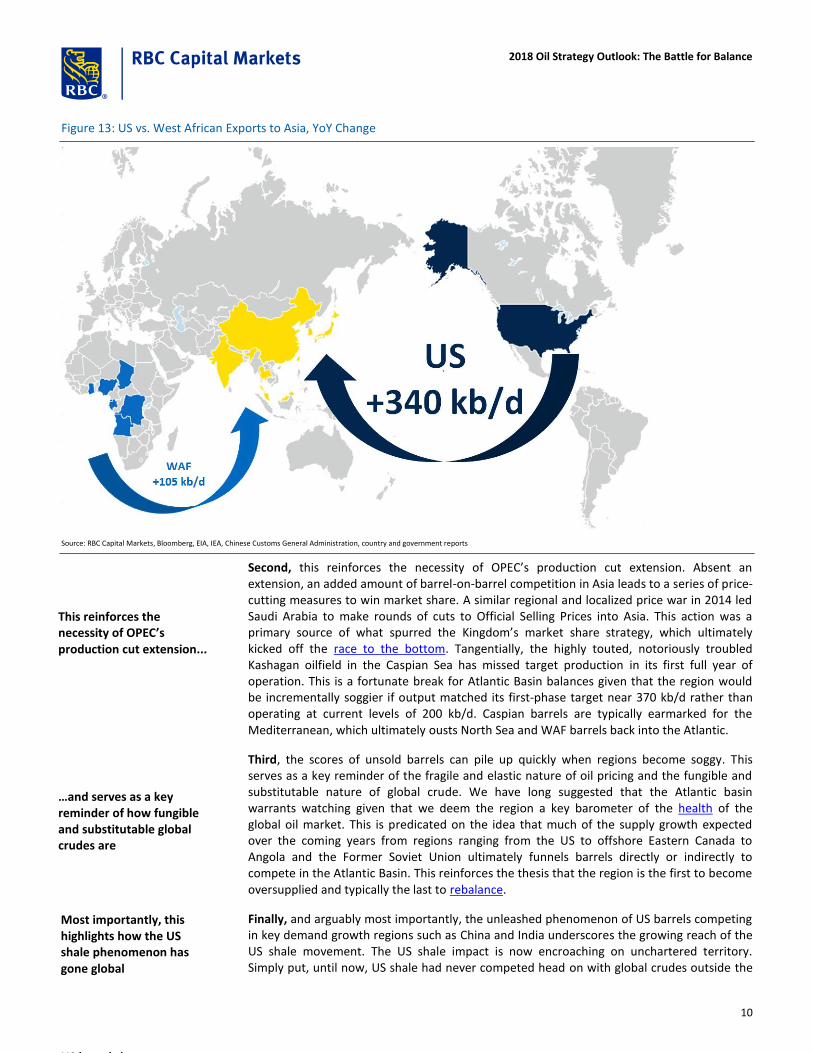
The market has applauded the recent record level of US exports, and the pace of these outbound shipments sets the tempo for how quickly domestic inventories are driven back toward seasonally normal levels. However, the surge in exports can cannibalize shipments from the Atlantic Basin. This does not necessarily mean that US Gulf crudes are forcefully competing head on with North Sea and WAF barrels for European market share. In fact, the recent uptick in Suezmax tanker usage in Europe is indicative of shorter haul voyages, meaning that localized barrels continue to find buyers. Instead, the proliferation of US exports to Asia has recently been crowding North Sea and WAF crudes out of the coveted Asian battleground region. West African crude exports to Asia recently fell to the lowest point this year, leaving the Atlantic Basin with scores of unsold cargoes. This interplay between US and other Atlantic Basin barrels competing in non-domestic jurisdictions reveals several key takeaways surrounding the current state of the oil market:
First, the global market is having difficulty simultaneously soaking up both the Atlantic Basin crudes (North Sea and WAF) and US barrels. Atlantic Basin pricing differentials will act as a leading indicator of the market’s ability to absorb additional barrels, particularly over the coming months as global demand hits a seasonal soft patch before picking up in the second quarter. Additionally, the market is perpetually plagued by the issue of light crudes struggling to find a home given the dearth of new incremental pockets of demand for a lighter, sweeter quality barrel. Additional exports from either side of the Atlantic ultimately reverberate the overhang of unsold crudes to a different pocket of the world. The WTI discount to Brent ebbs and flows based on current market conditions, but the arbitrage window ultimately has a built-in, self-correcting mechanism in the form of exports that will prevent the mass price dislocations seen earlier this decade.
-0.50
0.00
0.50
1.00
1.50
Jan Feb Mar Apr May Jun Jul Aug Sep Oct Nov Dec
$/bbl
Oseberg Ekofisk Qua Iboe Forties
Rallying physical diffs indicates that Atlantic Basin balances are tightening, propelling Brent into backwardation
Diffs weaken because WAFcargoes struggle to clear
Physical North Sea and West African differentials have oscillated between periods of relative softness followed by bouts of strength
What does this mean?
Global balances remain fragile and are having difficulty absorbing both Atlantic Basin and US crude exports
2018 Oil Strategy Outlook: The Battle for Balance
December 12, 2017 10
Figure 13: US vs. West African Exports to Asia, YoY Change
Source: RBC Capital Markets, Bloomberg, EIA, IEA, Chinese Customs General Administration, country and government reports
Second, this reinforces the necessity of OPEC’s production cut extension. Absent an extension, an added amount of barrel-on-barrel competition in Asia leads to a series of price-cutting measures to win market share. A similar regional and localized price war in 2014 led Saudi Arabia to make rounds of cuts to Official Selling Prices into Asia. This action was a primary source of what spurred the Kingdom’s market share strategy, which ultimately kicked off the race to the bottom. Tangentially, the highly touted, notoriously troubled Kashagan oilfield in the Caspian Sea has missed target production in its first full year of operation. This is a fortunate break for Atlantic Basin balances given that the region would be incrementally soggier if output matched its first-phase target near 370 kb/d rather than operating at current levels of 200 kb/d. Caspian barrels are typically earmarked for the Mediterranean, which ultimately ousts North Sea and WAF barrels back into the Atlantic.
Third, the scores of unsold barrels can pile up quickly when regions become soggy. This serves as a key reminder of the fragile and elastic nature of oil pricing and the fungible and substitutable nature of global crude. We have long suggested that the Atlantic basin warrants watching given that we deem the region a key barometer of the health of the global oil market. This is predicated on the idea that much of the supply growth expected over the coming years from regions ranging from the US to offshore Eastern Canada to Angola and the Former Soviet Union ultimately funnels barrels directly or indirectly to compete in the Atlantic Basin. This reinforces the thesis that the region is the first to become oversupplied and typically the last to rebalance.
Finally, and arguably most importantly, the unleashed phenomenon of US barrels competing in key demand growth regions such as China and India underscores the growing reach of the US shale movement. The US shale impact is now encroaching on unchartered territory. Simply put, until now, US shale had never competed head on with global crudes outside the
This reinforces the necessity of OPEC’s production cut extension...
…and serves as a key reminder of how fungible and substitutable global crudes are
Most importantly, this highlights how the US shale phenomenon has gone global
US barrels have never
2018 Oil Strategy Outlook: The Battle for Balance
December 12, 2017 11
US Gulf. The proliferation of barrels outside the US has wide-ranging implications for how we think about the future of global trade.
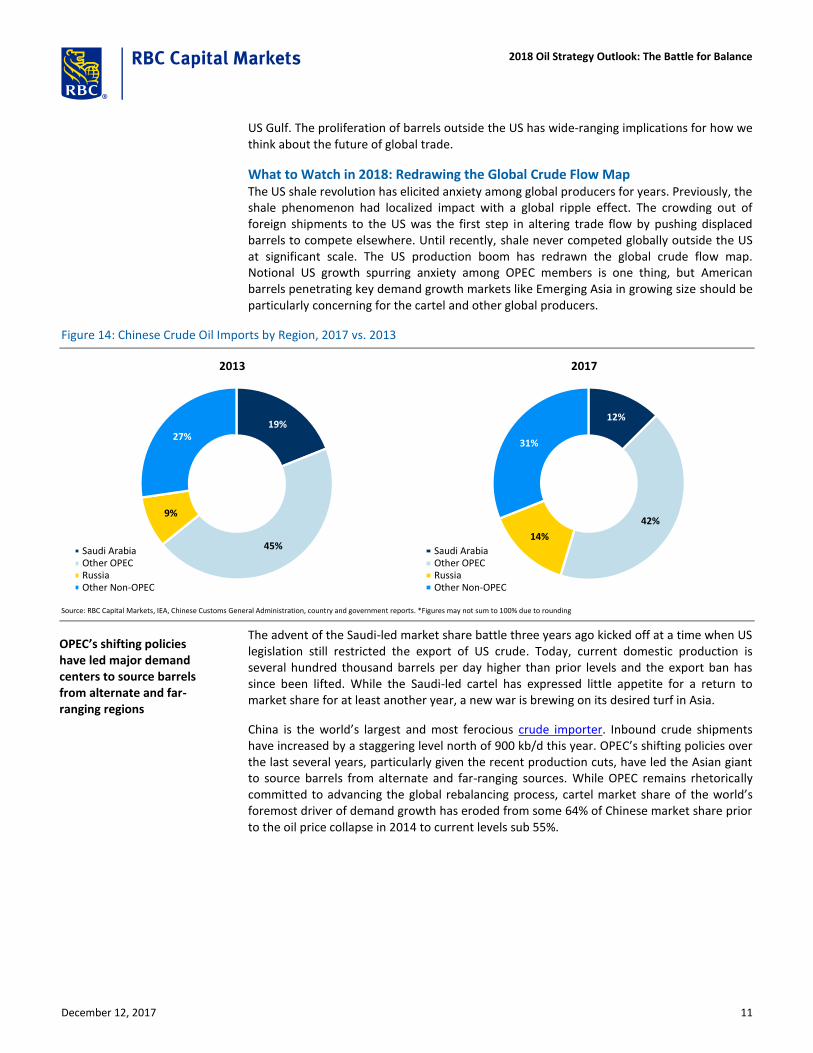
What to Watch in 2018: Redrawing the Global Crude Flow Map The US shale revolution has elicited anxiety among global producers for years. Previously, the shale phenomenon had localized impact with a global ripple effect. The crowding out of foreign shipments to the US was the first step in altering trade flow by pushing displaced barrels to compete elsewhere. Until recently, shale never competed globally outside the US at significant scale. The US production boom has redrawn the global crude flow map. Notional US growth spurring anxiety among OPEC members is one thing, but American barrels penetrating key demand growth markets like Emerging Asia in growing size should be particularly concerning for the cartel and other global producers.
Figure 14: Chinese Crude Oil Imports by Region, 2017 vs. 2013
Source: RBC Capital Markets, IEA, Chinese Customs General Administration, country and government reports. *Figures may not sum to 100% due to rounding
The advent of the Saudi-led market share battle three years ago kicked off at a time when US legislation still restricted the export of US crude. Today, current domestic production is several hundred thousand barrels per day higher than prior levels and the export ban has since been lifted. While the Saudi-led cartel has expressed little appetite for a return to market share for at least another year, a new war is brewing on its desired turf in Asia.
China is the world’s largest and most ferocious crude importer. Inbound crude shipments have increased by a staggering level north of 900 kb/d this year. OPEC’s shifting policies over the last several years, particularly given the recent production cuts, have led the Asian giant to source barrels from alternate and far-ranging sources. While OPEC remains rhetorically committed to advancing the global rebalancing process, cartel market share of the world’s foremost driver of demand growth has eroded from some 64% of Chinese market share prior to the oil price collapse in 2014 to current levels sub 55%.
19%
45%
9%
27%
2013
Saudi ArabiaOther OPECRussiaOther Non-OPEC
12%
42%
14%
31%
2017
Saudi ArabiaOther OPECRussiaOther Non-OPEC
OPEC’s shifting policies have led major demand centers to source barrels from alternate and far-ranging regions

2018 Oil Strategy Outlook: The Battle for Balance
December 12, 2017 12
Figure 15: Chinese Crude Imports by Country, YoY Change
Source: RBC Capital Markets, IEA, EIA, Chinese Customs General Administration, country and government reports
Truthfully, this is not strictly a Saudi, OPEC, or Middle East conundrum. The share of Chinese crude imports stemming from regions outside the Middle East has increased materially this year. Recent data suggest that 57% of Chinese crude imports stemmed from countries outside the Middle East, versus year-ago levels closer to half. Russia has been the primary beneficiary and expanded share from 9% to 14% over the same time frame. To be clear, shrinking market share does not necessarily translate to placing fewer barrels. Chinese crude imports have grown by nearly 2.8 mb during the same period, meaning that the pie has expanded, but simply maintaining notional market share means leaving percentage share on the table.
The recent game changer is the notion that US crudes are competing for the first time in regions outside the US. Despite years of dominating Asian market share, OPEC and the Saudis in particular are no longer benefiting from home-court advantage. The US has taken advantage of OPEC’s production curtailment to advance its footprint in Asia. We anticipate that this will continue to be the case assuming favorable economics given that the US Gulf also benefits from having a wide range of crude qualities on offer to customers.
2017 Growth vs 2016 (kb/d)X > 150150 ≥ X > 100100 ≥ X > 5050 ≥ X > 2525 ≥ X > 00 ≥ X > -25-25 ≥ X > -50X ≤ -50
A new market share battle is born and Emerging Asia is the epicenter both today and in the future

2018 Oil Strategy Outlook: The Battle for Balance
December 12, 2017 13
Figure 16: Chinese Crude Oil Imports, YoY Change Figure 17: Crude Exports to China by Country, Largest YoY Chg
Source: RBC Capital Markets, IEA, Chinese Customs General Administration, country and government reports
While a return to the free-for-all style of market share strategy has been scrubbed from the OPEC narrative this year, party crashers like the US are competing on foreign battlegrounds. This raises the stakes for coveted Asian demand irrespective of whether it is formally coined a market share battle or not. The bottom line is that US crude exports are disrupting historical rules of thumb as it pertains to logistics and the physical movement of oil.
Figure 18: Global Supply & Demand Balance (mb/d)
Source: RBC Capital Markets, Petro-Logistics SA, IEA, EIA, JODI, company and government sources
0
200
400
600
800
1,000
2010 2011 2012 2013 2014 2015 2016 2017
kb/d
Chinese Imports, YoY Chg
Period Average
0 50 100 150 200
Russia
Angola
United States
Brazil
Malaysia
UK
Libya
Egypt
Venezuela
Congo
kb/d
Global Supply & Demand Balance
mb/d Q1 Q2 Q3 Q4 YoY Q1 Q2 Q3 Q4 YoY Q1 Q2 Q3 Q4 YoY
Demand
OECD 46.5 45.8 47.1 47.3 0.6 46.6 46.6 47.2 47.2 0.2 46.5 46.5 47.3 47.3 0.0
Non-OECD 48.6 49.3 49.4 49.6 0.9 49.6 50.9 50.7 50.7 1.2 51.0 51.8 51.9 52.2 1.3
Total Demand 95.2 95.2 96.4 96.9 1.4 96.2 97.6 97.8 97.9 1.5 97.5 98.2 99.2 99.5 1.2
Supply
OPEC Crude 32.7 32.5 32.7 33.7 1.0 32.5 32.6 33.0 32.5 -0.2 32.1 32.4 32.8 32.2 -0.3
OPEC Other Liquids 6.7 7.0 7.0 6.8 0.3 6.9 6.8 7.0 6.9 0.0 6.7 6.8 6.8 6.8 -0.1
Non-OPEC Crude & Biofuels & Proc Gain 57.0 56.1 56.7 57.3 -0.7 57.2 57.5 57.3 57.9 0.7 59.1 58.7 58.9 59.6 1.6
Total Supply 96.4 95.6 96.4 97.8 0.5 96.5 96.9 97.3 97.3 0.5 97.9 97.9 98.5 98.6 1.2
Stock Change 1.2 0.4 0.0 0.9 0.3 -0.6 -0.5 -0.7 0.3 -0.4 -0.7 -0.9
Call on OPEC 31.5 32.1 32.7 32.8 1.9 32.1 33.2 33.5 33.2 0.8 31.7 32.7 33.5 33.2 -0.2
2016 2017 2018

2018 Oil Strategy Outlook: The Battle for Balance
December 12, 2017 14
Figure 19: Global Oil Demand (kb/d)
Source: RBC Capital Markets, Petro-Logistics SA, IEA, EIA, JODI, company and government sources
OECD Demand
Q1 Q2 Q3 Q4 Q1 Q2 Q3 Q4 Q1 Q2 Q3 Q4 YoY'16 YoY'17 YoY'18
US 19,869 19,795 20,240 20,087 19,829 20,209 20,203 20,254 19,955 20,289 20,452 20,297 159 126 125
Canada 2,334 2,317 2,463 2,418 2,351 2,340 2,492 2,422 2,395 2,420 2,515 2,430 11 18 39
Mexico 2,055 2,019 2,008 2,026 1,955 1,975 1,935 2,012 1,953 1,875 1,890 2,000 21 -58 -40
Total North America 24,258 24,131 24,711 24,531 24,135 24,524 24,630 24,688 24,303 24,584 24,857 24,727 190 87 124
OECD Europe
Germany 2,413 2,358 2,425 2,474 2,485 2,438 2,418 2,456 2,438 2,411 2,457 2,499 50 32 2
UK 1,555 1,604 1,601 1,584 1,525 1,590 1,621 1,589 1,542 1,610 1,641 1,606 39 -5 19
Other Europe 9,726 10,042 10,498 10,234 9,879 10,327 10,652 10,275 9,931 10,310 10,642 10,316 211 158 17
Total OECD Europe 13,694 14,004 14,524 14,292 13,889 14,355 14,691 14,320 13,911 14,331 14,740 14,421 300 185 37
OECD APAC 8,571 7,700 7,841 8,450 8,559 7,758 7,830 8,229 8,282 7,544 7,660 8,157 78 -47 -183
Total OECD Demand 46,523 45,835 47,076 47,273 46,583 46,637 47,151 47,237 46,496 46,459 47,257 47,305 568 225 -23
Non-OECD Demand
Q1 Q2 Q3 Q4 Q1 Q2 Q3 Q4 Q1 Q2 Q3 Q4 YoY'16 YoY'17 YoY'18
South & Central America
Argentina 739 776 779 754 748 770 776 742 732 763 762 753 -9 -3 -7
Brazil 3,021 3,071 3,133 3,071 3,007 3,047 3,167 3,099 3,025 3,093 3,170 3,111 -103 6 20
Other South & Central America 2,705 2,730 2,743 2,707 2,690 2,751 2,730 2,708 2,699 2,729 2,758 2,656 -43 -2 -9
South & Central America 6,465 6,577 6,655 6,532 6,445 6,568 6,673 6,549 6,456 6,585 6,690 6,520 -155 2 4
Middle East
Iran 1,839 1,821 1,786 1,824 1,843 1,821 1,792 1,835 1,834 1,827 1,820 1,845 -19 5 9
Saudi Arabia 3,024 3,388 3,528 3,114 2,879 3,353 3,535 3,085 3,007 3,432 3,566 3,164 -150 -51 79
Other MidEast 3,006 3,194 3,386 3,185 3,196 3,290 3,421 3,271 3,318 3,435 3,618 3,401 74 102 149
Middle East 7,869 8,403 8,700 8,123 7,918 8,464 8,748 8,185 8,087 8,514 8,896 8,338 -95 55 130
Emerging APAC
China 11,796 11,861 11,626 12,162 12,424 12,635 12,119 12,264 12,804 12,744 12,504 12,717 302 499 332
India 4,654 4,601 4,394 4,597 4,596 4,767 4,612 4,882 4,930 5,018 4,826 5,176 321 153 273
Other 8,370 8,409 8,322 8,396 8,546 8,797 8,618 8,835 8,925 9,029 8,973 9,274 220 325 351
Emerging APAC 24,820 24,871 24,342 25,155 25,566 26,199 25,349 25,981 26,659 26,791 26,303 27,167 843 977 956
Africa 4,201 4,183 4,023 4,143 4,350 4,223 4,119 4,314 4,501 4,367 4,239 4,445 45 114 137
Non-OECD Europe 693 724 720 714 703 738 752 760 715 733 757 754 26 26 2
FSU 4,587 4,560 4,922 4,927 4,600 4,748 5,028 4,918 4,621 4,789 5,059 4,979 203 75 39
Total Non-OECD Demand 48,635 49,318 49,362 49,594 49,582 50,940 50,669 50,707 51,039 51,779 51,944 52,203 866 1,247 1,267
Global Demand 95,158 95,153 96,438 96,867 96,165 97,577 97,820 97,944 97,535 98,238 99,201 99,508 1,434 1,473 1,244
2016 2017 2018
2016 2017 2018
2018 Oil Strategy Outlook: The Battle for Balance
December 12, 2017 15
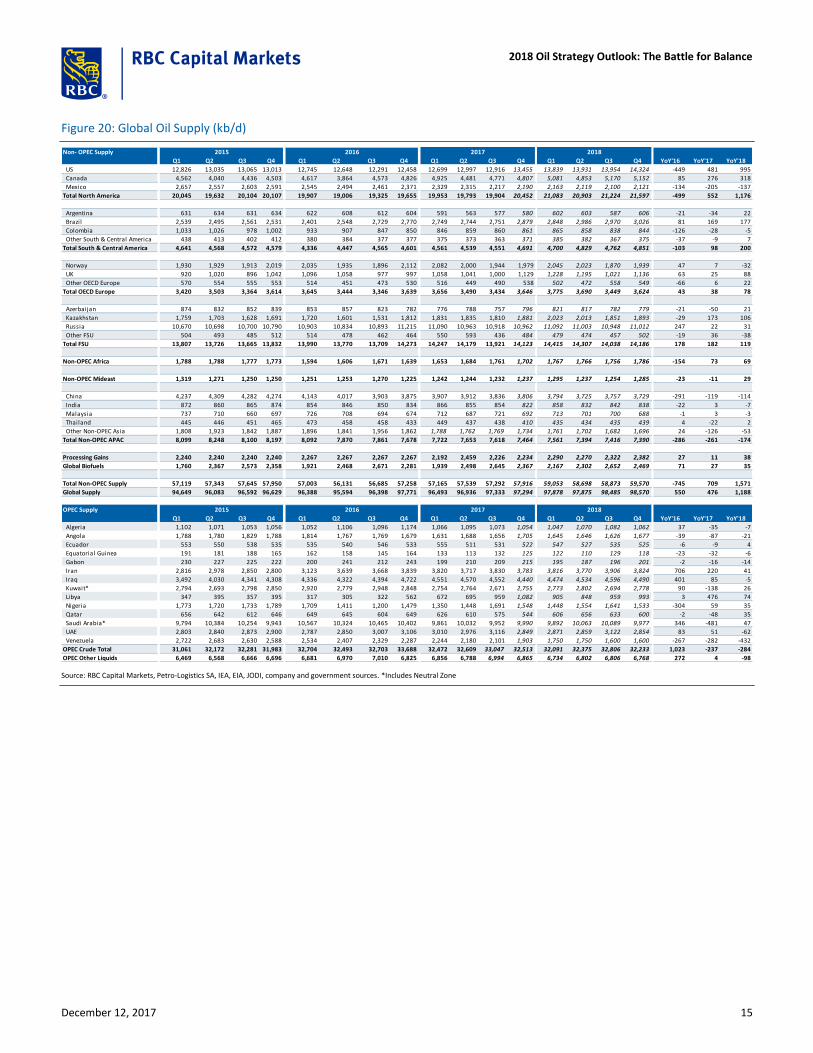
Figure 20: Global Oil Supply (kb/d)
Source: RBC Capital Markets, Petro-Logistics SA, IEA, EIA, JODI, company and government sources. *Includes Neutral Zone
Non- OPEC Supply
Q1 Q2 Q3 Q4 Q1 Q2 Q3 Q4 Q1 Q2 Q3 Q4 Q1 Q2 Q3 Q4 YoY'16 YoY'17 YoY'18
US 12,826 13,035 13,065 13,013 12,745 12,648 12,291 12,458 12,699 12,997 12,916 13,455 13,839 13,931 13,954 14,324 -449 481 995
Canada 4,562 4,040 4,436 4,503 4,617 3,864 4,573 4,826 4,925 4,481 4,771 4,807 5,081 4,853 5,170 5,152 85 276 318
Mexico 2,657 2,557 2,603 2,591 2,545 2,494 2,461 2,371 2,329 2,315 2,217 2,190 2,163 2,119 2,100 2,121 -134 -205 -137
Total North America 20,045 19,632 20,104 20,107 19,907 19,006 19,325 19,655 19,953 19,793 19,904 20,452 21,083 20,903 21,224 21,597 -499 552 1,176
Argentina 631 634 631 634 622 608 612 604 591 563 577 580 602 603 587 606 -21 -34 22
Brazil 2,539 2,495 2,561 2,531 2,401 2,548 2,729 2,770 2,749 2,744 2,751 2,879 2,848 2,986 2,970 3,026 81 169 177
Colombia 1,033 1,026 978 1,002 933 907 847 850 846 859 860 861 865 858 838 844 -126 -28 -5
Other South & Central America 438 413 402 412 380 384 377 377 375 373 363 371 385 382 367 375 -37 -9 7
Total South & Central America 4,641 4,568 4,572 4,579 4,336 4,447 4,565 4,601 4,561 4,539 4,551 4,691 4,700 4,829 4,762 4,851 -103 98 200
Norway 1,930 1,929 1,913 2,019 2,035 1,935 1,896 2,112 2,082 2,000 1,944 1,979 2,045 2,023 1,870 1,939 47 7 -32
UK 920 1,020 896 1,042 1,096 1,058 977 997 1,058 1,041 1,000 1,129 1,228 1,195 1,021 1,136 63 25 88
Other OECD Europe 570 554 555 553 514 451 473 530 516 449 490 538 502 472 558 549 -66 6 22
Total OECD Europe 3,420 3,503 3,364 3,614 3,645 3,444 3,346 3,639 3,656 3,490 3,434 3,646 3,775 3,690 3,449 3,624 43 38 78
Azerbaijan 874 832 852 839 853 857 823 782 776 788 757 796 821 817 782 779 -21 -50 21
Kazakhstan 1,759 1,703 1,628 1,691 1,720 1,601 1,531 1,812 1,831 1,835 1,810 1,881 2,023 2,013 1,851 1,893 -29 173 106
Russia 10,670 10,698 10,700 10,790 10,903 10,834 10,893 11,215 11,090 10,963 10,918 10,962 11,092 11,003 10,948 11,012 247 22 31
Other FSU 504 493 485 512 514 478 462 464 550 593 436 484 479 474 457 502 -19 36 -38
Total FSU 13,807 13,726 13,665 13,832 13,990 13,770 13,709 14,273 14,247 14,179 13,921 14,123 14,415 14,307 14,038 14,186 178 182 119
Non-OPEC Africa 1,788 1,788 1,777 1,773 1,594 1,606 1,671 1,639 1,653 1,684 1,761 1,702 1,767 1,766 1,756 1,786 -154 73 69
Non-OPEC Mideast 1,319 1,271 1,250 1,250 1,251 1,253 1,270 1,225 1,242 1,244 1,232 1,237 1,295 1,237 1,254 1,285 -23 -11 29
China 4,237 4,309 4,282 4,274 4,143 4,017 3,903 3,875 3,907 3,912 3,836 3,806 3,794 3,725 3,757 3,729 -291 -119 -114
India 872 860 865 874 854 846 850 834 866 855 854 822 858 832 842 838 -22 3 -7
Malaysia 737 710 660 697 726 708 694 674 712 687 721 692 713 701 700 688 -1 3 -3
Thailand 445 446 451 465 473 458 458 433 449 437 438 410 435 434 435 439 4 -22 2
Other Non-OPEC Asia 1,808 1,923 1,842 1,887 1,896 1,841 1,956 1,862 1,788 1,762 1,769 1,734 1,761 1,702 1,682 1,696 24 -126 -53
Total Non-OPEC APAC 8,099 8,248 8,100 8,197 8,092 7,870 7,861 7,678 7,722 7,653 7,618 7,464 7,561 7,394 7,416 7,390 -286 -261 -174
Processing Gains 2,240 2,240 2,240 2,240 2,267 2,267 2,267 2,267 2,192 2,459 2,226 2,234 2,290 2,270 2,322 2,382 27 11 38
Global Biofuels 1,760 2,367 2,573 2,358 1,921 2,468 2,671 2,281 1,939 2,498 2,645 2,367 2,167 2,302 2,652 2,469 71 27 35
Total Non-OPEC Supply 57,119 57,343 57,645 57,950 57,003 56,131 56,685 57,258 57,165 57,539 57,292 57,916 59,053 58,698 58,873 59,570 -745 709 1,571
Global Supply 94,649 96,083 96,592 96,629 96,388 95,594 96,398 97,771 96,493 96,936 97,333 97,294 97,878 97,875 98,485 98,570 550 476 1,188
OPEC Supply
Q1 Q2 Q3 Q4 Q1 Q2 Q3 Q4 Q1 Q2 Q3 Q4 Q1 Q2 Q3 Q4 YoY'16 YoY'17 YoY'18
Algeria 1,102 1,071 1,053 1,056 1,052 1,106 1,096 1,174 1,066 1,095 1,073 1,054 1,047 1,070 1,082 1,062 37 -35 -7
Angola 1,788 1,780 1,829 1,788 1,814 1,767 1,769 1,679 1,631 1,688 1,656 1,705 1,645 1,646 1,626 1,677 -39 -87 -21
Ecuador 553 550 538 535 535 540 546 533 555 511 531 522 547 527 535 525 -6 -9 4
Equatorial Guinea 191 181 188 165 162 158 145 164 133 113 132 125 122 110 129 118 -23 -32 -6
Gabon 230 227 225 222 200 241 212 243 199 210 209 215 195 187 196 201 -2 -16 -14
Iran 2,816 2,978 2,850 2,800 3,123 3,639 3,668 3,839 3,820 3,717 3,830 3,783 3,816 3,770 3,906 3,824 706 220 41
Iraq 3,492 4,030 4,341 4,308 4,336 4,322 4,394 4,722 4,551 4,570 4,552 4,440 4,474 4,534 4,596 4,490 401 85 -5
Kuwait* 2,794 2,693 2,798 2,850 2,920 2,779 2,948 2,848 2,754 2,764 2,671 2,755 2,773 2,802 2,694 2,778 90 -138 26
Libya 347 395 357 395 317 305 322 562 672 695 959 1,082 905 848 959 993 3 476 74
Nigeria 1,773 1,720 1,733 1,789 1,709 1,411 1,200 1,479 1,350 1,448 1,691 1,548 1,448 1,554 1,641 1,533 -304 59 35
Qatar 656 642 612 646 649 645 604 649 626 610 575 544 606 656 633 600 -2 -48 35
Saudi Arabia* 9,794 10,384 10,254 9,943 10,567 10,324 10,465 10,402 9,861 10,032 9,952 9,990 9,892 10,063 10,089 9,977 346 -481 47
UAE 2,803 2,840 2,873 2,900 2,787 2,850 3,007 3,106 3,010 2,976 3,116 2,849 2,871 2,859 3,122 2,854 83 51 -62
Venezuela 2,722 2,683 2,630 2,588 2,534 2,407 2,329 2,287 2,244 2,180 2,101 1,903 1,750 1,750 1,600 1,600 -267 -282 -432
OPEC Crude Total 31,061 32,172 32,281 31,983 32,704 32,493 32,703 33,688 32,472 32,609 33,047 32,513 32,091 32,375 32,806 32,233 1,023 -237 -284
OPEC Other Liquids 6,469 6,568 6,666 6,696 6,681 6,970 7,010 6,825 6,856 6,788 6,994 6,865 6,734 6,802 6,806 6,768 272 4 -98
2015 2016 2017 2018
2015 2016 2017 2018

2018 Oil Strategy Outlook: The Battle for Balance
December 12, 2017 16
Required disclosures
Conflicts disclosures The analyst(s) responsible for preparing this research report received compensation that is based upon various factors, including total revenues of the member companies of RBC Capital Markets and its affiliates, a portion of which are or have been generated by investment banking activities of the member companies of RBC Capital Markets and its affiliates.
Distribution of ratings For the purpose of ratings distributions, regulatory rules require member firms to assign ratings to one of three rating categories - Buy, Hold/Neutral, or Sell - regardless of a firm's own rating categories. Although RBC Capital Markets' ratings of Top Pick/Outperform, Sector Perform and Underperform most closely correspond to Buy, Hold/Neutral and Sell, respectively, the meanings are not the same because our ratings are determined on a relative basis (as described above).
Conflicts policy RBC Capital Markets Policy for Managing Conflicts of Interest in Relation to Investment Research is available from us on request. To access our current policy, clients should refer to https://www.rbccm.com/global/file-414164.pdf or send a request to RBC Capital Markets Research Publishing, P.O. Box 50, 200 Bay Street, Royal Bank Plaza, 29th Floor, South Tower, Toronto, Ontario M5J 2W7. We reserve the right to amend or supplement this policy at any time.
Dissemination of research and short-term trade ideas RBC Capital Markets endeavors to make all reasonable efforts to provide research simultaneously to all eligible clients, having regard to local time zones in overseas jurisdictions. RBC Capital Markets' equity research is posted to our proprietary website to ensure eligible clients receive coverage initiations and changes in ratings, targets and opinions in a timely manner. Additional distribution may be done by the sales personnel via email, fax, or other electronic means, or regular mail. Clients may also receive our research via third party vendors. RBC Capital Markets also provides eligible clients with access to SPARC on the Firm’s proprietary INSIGHT website, via email and via third-party vendors. SPARC contains market color and commentary regarding subject companies on which the Firm currently provides equity research coverage. Research Analysts may, from time to time, include short-term trade ideas in research reports and / or in SPARC. A short-term trade idea offers a short-term view on how a security may trade, based on market and trading events, and the resulting trading opportunity that may be available. A short-term trade idea may differ from the price targets and recommendations in our published research reports reflecting the research analyst's views of the longer-term (one year) prospects of the subject company, as a result of the differing time horizons, methodologies and/or other factors. Thus, it is possible that a subject company's common equity that is considered a long-term 'Sector Perform' or even an 'Underperform' might present a short-term buying opportunity as a result of temporary selling pressure in the market; conversely, a subject company's common equity rated a long-term 'Outperform' could be considered susceptible to a short-term downward price correction. Short-term trade ideas are not ratings, nor are they part of any ratings system, and the firm generally does not intend, nor undertakes any obligation, to maintain or update short-term trade ideas. Short-term trade ideas may not be suitable for all investors and have not been tailored to individual investor circumstances and objectives, and investors should make their own independent decisions regarding any securities or strategies discussed herein. Please contact your investment advisor or institutional salesperson for more information regarding RBC Capital Markets' research.

2018 Oil Strategy Outlook: The Battle for Balance
December 12, 2017 17
For a list of all recommendations on the company that were disseminated during the prior 12-month period, please click on the following link: https://rbcnew.bluematrix.com/sellside/MAR.action
The 12-month history of SPARCs can be viewed at https://www.rbcinsightresearch.com
Analyst certification All of the views expressed in this report accurately reflect the personal views of the responsible analyst(s) about any and all of the subject securities or issuers. No part of the compensation of the responsible analyst(s) named herein is, or will be, directly or indirectly, related to the specific recommendations or views expressed by the responsible analyst(s) in this report.
Third-party-disclaimers The Global Industry Classification Standard (“GICS”) was developed by and is the exclusive property and a service mark of MSCI Inc. (“MSCI”) and Standard & Poor’s Financial Services LLC (“S&P”) and is licensed for use by RBC. Neither MSCI, S&P, nor any other party involved in making or compiling the GICS or any GICS classifications makes any express or implied warranties or representations with respect to such standard or classification (or the results to be obtained by the use thereof), and all such parties hereby expressly disclaim all warranties of originality, accuracy, completeness, merchantability and fitness for a particular purpose with respect to any of such standard or classification. Without limiting any of the foregoing, in no event shall MSCI, S&P, any of their affiliates or any third party involved in making or compiling the GICS or any GICS classifications have any liability for any direct, indirect, special, punitive, consequential or any other damages (including lost profits) even if notified of the possibility of such damages.
References herein to “LIBOR”, “LIBO Rate”, “L” or other LIBOR abbreviations means the London interbank offered rate as administered by ICE Benchmark Administration (or any other person that takes over the administration of such rate).

2018 Oil Strategy Outlook: The Battle for Balance
December 12, 2017 18
Disclaimer RBC Capital Markets is the business name used by certain branches and subsidiaries of the Royal Bank of Canada, including RBC Dominion Securities Inc., RBC Capital Markets, LLC, RBC Europe Limited, Royal Bank of Canada, Hong Kong Branch and Royal Bank of Canada, Sydney Branch. The information contained in this report has been compiled by RBC Capital Markets from sources believed to be reliable, but no representation or warranty, express or implied, is made by Royal Bank of Canada, RBC Capital Markets, its affiliates or any other person as to its accuracy, completeness or correctness. All opinions and estimates contained in this report constitute RBC Capital Markets' judgement as of the date of this report, are subject to change without notice and are provided in good faith but without legal responsibility. Nothing in this report constitutes legal, accounting or tax advice or individually tailored investment advice. This material is prepared for general circulation to clients and has been prepared without regard to the individual financial circumstances and objectives of persons who receive it. The investments or services contained in this report may not be suitable for you and it is recommended that you consult an independent investment advisor if you are in doubt about the suitability of such investments or services. This report is not an offer to sell or a solicitation of an offer to buy any securities. Past performance is not a guide to future performance, future returns are not guaranteed, and a loss of original capital may occur. RBC Capital Markets research analyst compensation is based in part on the overall profitability of RBC Capital Markets, which includes profits attributable to investment banking revenues. Every province in Canada, state in the U.S., and most countries throughout the world have their own laws regulating the types of securities and other investment products which may be offered to their residents, as well as the process for doing so. As a result, the securities discussed in this report may not be eligible for sale in some jurisdictions. RBC Capital Markets may be restricted from publishing research reports, from time to time, due to regulatory restrictions and/ or internal compliance policies. If this is the case, the latest published research reports available to clients may not reflect recent material changes in the applicable industry and/or applicable subject companies. RBC Capital Markets research reports are current only as of the date set forth on the research reports. This report is not, and under no circumstances should be construed as, a solicitation to act as securities broker or dealer in any jurisdiction by any person or company that is not legally permitted to carry on the business of a securities broker or dealer in that jurisdiction. To the full extent permitted by law neither RBC Capital Markets nor any of its affiliates, nor any other person, accepts any liability whatsoever for any direct or consequential loss arising from any use of this report or the information contained herein. No matter contained in this document may be reproduced or copied by any means without the prior consent of RBC Capital Markets.
Additional information is available on request.
To U.S. Residents: This publication has been approved by RBC Capital Markets, LLC (member FINRA, NYSE, SIPC), which is a U.S. registered broker-dealer and which accepts responsibility for this report and its dissemination in the United States. Any U.S. recipient of this report that is not a registered broker-dealer or a bank acting in a broker or dealer capacity and that wishes further information regarding, or to effect any transaction in, any of the securities discussed in this report, should contact and place orders with RBC Capital Markets, LLC.
To Canadian Residents: This publication has been approved by RBC Dominion Securities Inc. (member IIROC). Any Canadian recipient of this report that is not a Designated Institution in Ontario, an Accredited Investor in British Columbia or Alberta or a Sophisticated Purchaser in Quebec (or similar permitted purchaser in any other province) and that wishes further information regarding, or to effect any transaction in, any of the securities discussed in this report should contact and place orders with RBC Dominion Securities Inc., which, without in any way limiting the foregoing, accepts responsibility for this report and its dissemination in Canada.
To U.K. Residents: This publication has been approved by RBC Europe Limited ('RBCEL'), which is authorized by the Prudential Regulation Authority and regulated by the Financial Conduct Authority ('FCA') and the Prudential Regulation Authority, in connection with its distribution in the United Kingdom. This material is not for general distribution in the United Kingdom to retail clients, as defined under the rules of the FCA. RBCEL accepts responsibility for this report and its dissemination in the United Kingdom.
To German Residents: This material is distributed in Germany by RBC Europe Limited, Frankfurt Branch, which is regulated by the Bundesanstalt für Finanzdienstleistungsaufsicht (BaFin).
To Persons Receiving This Advice in Australia: This material has been distributed in Australia by Royal Bank of Canada - Sydney Branch (ABN 86 076 940 880, AFSL No. 246521). This material has been prepared for general circulation and does not take into account the objectives, financial situation or needs of any recipient. Accordingly, any recipient should, before acting on this material, consider the appropriateness of this material having regard to their objectives, financial situation and needs. If this material relates to the acquisition or possible acquisition of a particular financial product, a recipient in Australia should obtain any relevant disclosure document prepared in respect of that product and consider that document before making any decision about whether to acquire the product. This research report is not for retail investors as defined in section 761G of the Corporations Act.
To Hong Kong Residents: This publication is distributed in Hong Kong by Royal Bank of Canada, Hong Kong Branch which is regulated by the Hong Kong Monetary Authority and the Securities and Futures Commission ('SFC'), RBC Investment Services (Asia) Limited and RBC Investment Management (Asia) Limited, both entities are regulated by the SFC. Financial Services provided to Australia: Financial services may be provided in Australia in accordance with applicable law. Financial services provided by the Royal Bank of Canada, Hong Kong Branch are provided pursuant to the Royal Bank of Canada's Australian Financial Services Licence ('AFSL') (No. 246521).
To Singapore Residents: This publication is distributed in Singapore by the Royal Bank of Canada, Singapore Branch, a registered entity granted offshore bank licence by the Monetary Authority of Singapore. This material has been prepared for general circulation and does not take into account the objectives, financial situation, or needs of any recipient. You are advised to seek independent advice from a financial adviser before purchasing any product. If you do not obtain independent advice, you should consider whether the product is suitable for you. Past performance is not indicative of future performance. If you have any questions related to this publication, please contact the Royal Bank of Canada, Singapore Branch. Royal Bank of Canada, Singapore Branch accepts responsibility for this report and its dissemination in Singapore.
To Japanese Residents: Unless otherwise exempted by Japanese law, this publication is distributed in Japan by or through RBC Capital Markets (Japan) Ltd. which is a Financial Instruments Firm registered with the Kanto Local Financial Bureau (Registered number 203) and a member of the Japan Securities Dealers Association (“JSDA”)
® Registered trademark of Royal Bank of Canada. RBC Capital Markets is a trademark of Royal Bank of Canada. Used under license. Copyright © RBC Capital Markets, LLC 2017 - Member SIPC
Copyright © RBC Dominion Securities Inc. 2017 - Member Canadian Investor Protection Fund Copyright © RBC Europe Limited 2017
Copyright © Royal Bank of Canada 2017 All rights reserved