2018 general rate case - southern california edison · enhance safety and reliability ... 13...
TRANSCRIPT

Application No.: A.16-09- Exhibit No.: SCE-02, Vol. 10 Witnesses: R. Ragsdale
(U 338-E)
2018 General Rate Case
Transmission & Distribution (T&D)
Volume 10 – Grid Modernization
Before the
Public Utilities Commission of the State of California
Rosemead, CaliforniaSeptember 1, 2016
A2B. Tolentino
2nd ERRATA

SCE-02: Transmission & Distribution (T&D) Volume 10 - Grid Modernization
Table Of Contents Section Page Witness
i
I. OVERVIEW ......................................................................................................1 R. Ragsdale
A. Introduction to Grid Modernization .......................................................1
B. SCE’s Grid Modernization Will Benefit All of SCE’s Customers ..............................................................................................5
1. Enhance Safety and Reliability ..................................................5
2. Enable DER Integration and Adoption ......................................7
3. Realize DER Benefits ................................................................8
C. Realizing Benefits Requires an Integrated Approach ..........................10
1. Grid Modernization Functional Capabilities ...........................13
a) Communications Capabilities ......................................14
b) Planning Capabilities ...................................................15
c) Operational Capabilities ...............................................17
2. SCE’s Demonstrations and Industry Best Practices Substantiate Benefits of Grid Modernization ..........................20
3. Summary of Grid Modernization Program and Customer Benefits ....................................................................24
D. Comparison of Authorized 2015 to Recorded .....................................25
II. O&M EXPENSE FORECASTS ......................................................................29
A. Grid Modernization Training and Support Activities ..........................30
1. Cost Forecast ............................................................................31
a) Organizational Change Management (OCM) for Workforce Preparation ...........................................31
b) Grid Modernization Training .......................................32
c) PCC Inspection for Distribution Volt/VAR Control (DVVC) ..........................................................33
B. Tolentino

28
Figure I-9 Grid Modernization49
2015 GRC Authorized Variance Summary 2015 Capital
(CPUC-Jurisdictional – Nominal $Millions)
49 Refer to WP SCE-02, Vol. 10, pp. 38-39 (Capital Authorized vs. Recorded).

Figure I-9
Grid Modernization492015 GRC Authorized Variance Summary
2015 Capital(CPUC-Jurisdictional – Nominal $Millions)
49 Refer to WP SCE-02, Vol. 10, pp. 38-39 (Capital Authorized vs. Recorded).
28 28A2

35
III. 1
CAPITAL EXPENDITURE FORECASTS 2
A. Summary of Cost Forecast 3
The tables below summarize the forecast capital activities discussed in this volume along with 4
the associated expenditures. 5
Table III-4 Summary of 2016 - 2020 Forecast Capital Expenditures
(CPUC-Jurisdictional –Nominal $000)
*Note that SA-3 also includes $1,069 and $331 for Alamitos MEER improvement in 2016 and 2017 respectively.
B. Distribution Automation Program 6
1. Overview 7
The Distribution Automation program will continue and improve on SCE’s historical 8
circuit automation program by installing automatic switches, circuit connections, sensors, and 9
communication equipment on distribution circuits. This program supports reliability and enables DERs 10
by (1) increasing situational awareness with more near real-time telemetry data points throughout the 11
circuits that will help identify issues quickly and accurately, (2) facilitating remote isolation and 12
restoration and therefore decreased outage duration and area of impact, and (3) increasing operational 13
flexibility with appropriately-sized line sections for circuit switching, which will minimize de-energized 14
sections during planned and unplanned outages. 15
The Distribution Automation proposed in this General Rate Case differs from the 16
historical program by scope and scale. Today, in response to reliability objectives and SCE’s basic 17
circuit automation efforts, about three-quarters of SCE’s circuits include some level of automation, i.e., 18
Program 2016 2017 2018 2019 2020 TotalDistribution Automation 10,995 66,908 277,168 285,863 293,795 934,729 SA-3 and CSP 10,385 50,385 114,340 122,109 123,390 420,609 FAN 6,988 17,841 20,976 89,336 108,002 243,143 WAN 860 4,951 38,985 38,422 39,218 122,436 System Modeling Tool 4,150 6,514 2,488 - - 13,152 DRP External Portal 370 1,853 3,673 - - 5,895 Grid Management System 264 12,410 39,801 48,827 33,793 135,095
Total 34,011 160,861 497,431 584,557 598,198 1,875,059

Corrected Values Shown in Red
1
III.
2 CAPITAL EXPENDITURE FORECASTS
3 A. Summary of Cost Forecast
4 The tables below summarize the forecast capital activities discussed in this volume along with
5 the associated expenditures.
Table III-4Summary of 2016 - 2020 Forecast Capital Expenditures
(CPUC-Jurisdictional –Nominal $000)
Program 2016 2017 2018 2019 2020 TotalDistribution Automation 9,386 65,393 278,927 287,677 295,661 937,044SA-3 and CSP 10,372 50,351 114,274 122,046 123,425 420,468FAN 6,981 17,738 20,848 89,061 108,184 242,812WAN 855 4,908 38,647 38,295 39,289 121,994System Modeling Tool 4,129 6,457 2,467 - - 13,053DRP External Portal 368 1,836 3,641 - - 5,845Grid Management System 262 12,302 39,456 48,665 33,854 134,540 Total 32,354 158,987 498,260 585,743 600,412 1,875,756
*Note that SA-3 also includes $1,069 and $331 for Alamitos MEER improvement in 2016 and 2017 respectively.
6 B. Distribution Automation Program
7 1. Overview
8 The Distribution Automation program will continue and improve on SCE’s historical
9 circuit automation program by installing automatic switches, circuit connections, sensors, and
10 communication equipment on distribution circuits. This program supports reliability and enables DERs
11 by (1) increasing situational awareness with more near real-time telemetry data points throughout the
12 circuits that will help identify issues quickly and accurately, (2) facilitating remote isolation and
13 restoration and therefore decreased outage duration and area of impact, and (3) increasing operational
14 flexibility with appropriately-sized line sections for circuit switching, which will minimize de-energized
15 sections during planned and unplanned outages.
16 The Distribution Automation proposed in this General Rate Case differs from the
17 historical program by scope and scale. Today, in response to reliability objectives and SCE’s basic
18 circuit automation efforts, about three-quarters of SCE’s circuits include some level of automation, i.e.,
35 35a2

60
Figure III-18 SA-392 93
Recorded 2011-2015/Forecast 2016-2020 WBS Elements CET-ET-GM, CET-ET-GM-SA
(CPUC-Jurisdictional – Constant 2015 and Nominal $000)
92 Refer to WP SCE-02, Vol. 10, pp. 20 – 35 (Capital Detail by WBS Element). 93 Not shown in Figure III-18: SA-3 also includes $1,069 and $331 for Alamitos MEER improvement in 2016
and 2017 respectively.
Nominal2016=7,9032017=46,418
Constant2016=7,7672017=44,635

61
Figure III-19 2016-2020 Forecast Capital Expenditures for Common Substation Platform94
WBS Element CIT-00-OP-NS (CPUC-Jurisdictional – Constant 2015 and Nominal $000)
4. What Exists Today 1
a) Substation Automation 2
At one time, virtually all substations were operated by field personnel, many 3
around the clock. To improve efficiency, reliability, and safety, SCE began automating its substations. 4
In the 1980s, SCE installed RTUs, which are electronic devices that provide remote monitoring and 5
control of circuit breakers and capture and transmit operational data (SCADA data) to system 6
operators.95 SCE has approximately 450 distribution substations with RTUs in service today. 7
In 1997, SCE installed its first generation of substation automation (SAS-1) to 8
replace the RTU technology, which added the capabilities of: (1) acquiring/transmitting non-operational 9
data (such as oil temperatures); (2) programming for automatic functions (such as timed or condition-10
94 Refer to WP SCE-02, Vol. 10, pp. 140 – 141 (Common Substation Platform Cost Forecast). 95 SCADA stands for Supervisory Control And Data Acquisition and is a system for remote monitoring and
control that operates with coded signals over telecommunications channels.
Nominal2016= 2,4692017= 3,9332018= 7,5132019= 18,9292020= 19,445

73
and continuing through 2018. FAN deployment will begin in 2018 and continue through 2020. SCE 1
forecasts the annual expenditure by multiplying the unit cost per FAN installation by the forecast units 2
to be installed. Forecast capital expenditures for the FAN is shown in the figure below. 3
Figure III-24 2016-2020 Forecast Capital Expenditures for the Field Area Network107
WBS Element CIT-00-OP-NS (CPUC-Jurisdictional – Constant 2015 and Nominal $000)
Historical and forecast capital expenditures for DSEEP is shown in the table below. SCE 4
forecasts the annual expenditure for DSEEP by multiplying the unit cost per DSEEP installation by the 5
forecast units to be installed.108 6
107 Refer to WP SCE-02, Vol. 10, pp. 151 – 159 (Field Area Network Cost Forecast). 108 Refer to WP SCE-02, Vol. 10, pp. 160 – 162 (NetComm Historical and Forecast Costs).
Nominal2016=1,4122017=11,6972018=14,6502019=82,6982020=101,652

82
Figure III-29 2016-2020 Forecast Capital Expenditures for the Wide Area Network112
WBS Element CIT-00-OP-NS (CPUC-Jurisdictional – Constant 2015 and Nominal $000)
4. What Exists Today 1
Fiber optic cable is the backbone of SCE’s existing communication network supporting 2
essential operations of the electrical grid such as SCADA, telemetry, and protective relaying. The fiber 3
network is also used for voice and data communications for internal business purposes. SCE began 4
installing fiber optic cable at its substations in 1997. Today we have approximately 5,380 miles of fiber 5
optic cable installed across our 50,000 sq. mile service territory which includes office facilities, grid 6
control centers, distribution operations centers, and substations. With the introduction of the FAN and 7
additional sensor and automation devices in the field and in substations to manage DER growth, this 8
wide area fiber optic network must be expanded and enhanced to increase the coverage, capacity and 9
security of the wide area network. 10
5. Program Description 11
SCE has 422 distribution substations currently connected to a wide area fiber network. 12
112 Refer to WP SCE-02, Vol. 10, pp. 170 – 172 (Wide Area Network Cost Forecast).
Nominal2016=8552017=4,9082018=38,6472019=38,2952020=39,289

83
Over the course of ten years, 320 substations will be upgraded to have SA-3 and a CSP requiring the full 1
speed/volume capacity of a WAN such that they will have both fiber optic cable and IP connectivity. Of 2
these 320 substations, 240 already have fiber optic cable (and the requisite fiber cable terminals) but 3
require IP connectivity. The remaining 80 substations will require fiber cable, fiber terminals, and IP 4
connectivity. 5
122 substations are forecast not to require high speed/volume data transmission 6
capabilities. These substations are currently connected to operations control centers through copper 7
communication wires, satellite communications, and fiber optic cable. These all will need to be 8
equipped with IP connectivity to enhance cybersecurity. 9
The interaction of the WAN with the other proposed capabilities needed to optimize DER 10
benefits to the grid is illustrated in Figure III-30 below. 11
Figure III-30 Relationship of the WAN with other Grid Modernization Programs
The upgrades proposed under the WAN program will yield enough speed (100Mps) and 12
86
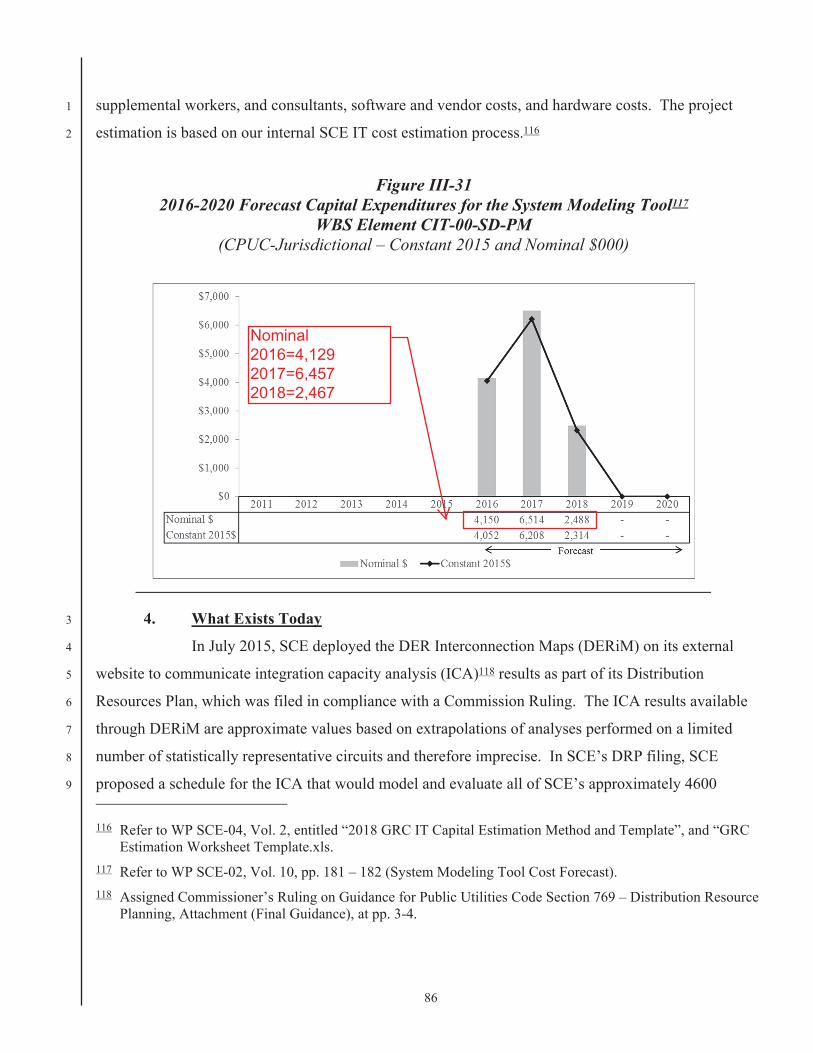
supplemental workers, and consultants, software and vendor costs, and hardware costs. The project 1
estimation is based on our internal SCE IT cost estimation process.116 2
Figure III-31 2016-2020 Forecast Capital Expenditures for the System Modeling Tool117
WBS Element CIT-00-SD-PM (CPUC-Jurisdictional – Constant 2015 and Nominal $000)
4. What Exists Today 3
In July 2015, SCE deployed the DER Interconnection Maps (DERiM) on its external 4
website to communicate integration capacity analysis (ICA)118 results as part of its Distribution 5
Resources Plan, which was filed in compliance with a Commission Ruling. The ICA results available 6
through DERiM are approximate values based on extrapolations of analyses performed on a limited 7
number of statistically representative circuits and therefore imprecise. In SCE’s DRP filing, SCE 8
proposed a schedule for the ICA that would model and evaluate all of SCE’s approximately 4600 9 116 Refer to WP SCE-04, Vol. 2, entitled “2018 GRC IT Capital Estimation Method and Template”, and “GRC
Estimation Worksheet Template.xls. 117 Refer to WP SCE-02, Vol. 10, pp. 181 – 182 (System Modeling Tool Cost Forecast). 118 Assigned Commissioner’s Ruling on Guidance for Public Utilities Code Section 769 – Distribution Resource
Planning, Attachment (Final Guidance), at pp. 3-4.
Nominal2016=4,1292017=6,4572018=2,467

88
interconnection customer.121 1
The interconnection wait times are expected to be exacerbated by the increasing volume 2
of DER interconnection applications. SCE expects the number of net energy metering (NEM) 3
applications for connections ranging from 1 kW to 27,000kW to continue rising over the next five years, 4
with over 70,000 applications expected in 2016 as shown in Figure III-32 below.122 5
Figure III-32 Historical NEM Application Rate
Note: 2016 is a forecast. Prior years are actual.
This level of growth will make this lengthy model creation process impractical, 6
increasing the time required for interconnection and undermining attempts to improve interconnection 7
review process efficiency. The current situation may discourage DER applicants and result in less DER 8
generation than could otherwise be achieved. 9
Because SCE’s existing modeling tools are incapable of performing engineering analyses 10
over large areas of the grid, a system analysis must be developed by compiling many analyses of smaller 11
portions of the grid. This process potentially reduces the accuracy of results by disregarding the inter-12
121 Refer to WP SCE-02, Vol. 10, pp. 183 – 186 (Engineering Interconnection Study Time Frames). 122 Data retrieved via Power Clerk Interconnect tool supplied by Clean Power Research.
60,727

93
capital forecast for this project includes project team costs for SCE employees, supplemental workers, 1
and consultants, software and vendor costs, and hardware costs. The project estimation is based on our 2
internal SCE IT cost estimation process.125 Forecast capital expenditures for the DRPEP is shown in the 3
Figure III-33 below. 4
Figure III-33 2016-2020 Forecast Capital Expenditures for the
Distribution Resource Plan External Portal126 WBS Element CIT-00-SD-PM
(CPUC-Jurisdictional – Constant 2015 and Nominal $000)
4. What Exists Today 5
SCE presents information about its distribution circuits and substations and DER 6
connection opportunities via its Distribution Energy Resource Interconnection Maps (DERiM), which is 7
accessible to customers on SCE’s website. This geospatial presentation allows third parties to view 8
distribution circuits overlaid on a geographical map of Southern California and identify interconnection 9
capacities at any point on the distribution grid. The DERiM represents a significant improvement over 10 125 Refer to WP SCE-04, Vol. 2, entitled “2018 GRC IT Capital Estimation Method and Template”, and “GRC
Estimation Worksheet Template.xls”. 126 Refer to WP SCE-02, Vol. 10, pp. 187 – 188 (Distribution Resources Plan External Portal Cost Forecast).
2016=3682017=1,8362018=3,641

99
Figure III-34 2016-2020 Forecast Capital Expenditures for the Grid Management System130
WBS Element CIT-00-SD-PM (CPUC-Jurisdictional – Constant 2015 and Nominal $000)
4. What Exists Today 1
The day-to-day operations of the distribution grid are managed by ten switching centers 2
and four Distribution Operations Centers (DOCs)131 dispersed throughout SCE’s service territory. The 3
switching centers and DOCs constitute the core of the distribution grid’s operation. 4
Switching centers act as the central authorizing points for all planned and unplanned 5
outage and switching actions taken inside substations and on circuits outside of the substation. Each 6
switching center is responsible for a portion of SCE’s grid and is managed by operators to maintain 7
reliability and security for the portion of the grid within its jurisdiction. Coordination of all grid 8
operations by the switching center helps ensure that a single entity maintains the complete view of the 9
system within that portion of the grid. Without this view, a maintenance crew at one location may not 10
know of an outage at another location nearby. This could severely hamper the reliability of the grid and 11
130 Refer to WP SCE-02, Vol. 10, pp. 189 – 193 (Grid Management System Cost Forecast). 131 Four of the switching centers are co-located with a Distribution Operations Center.
Nominal2016=2622017=12,3022018=39,4562019=48,6652020=33,854