2017 - 2018 algebra ia pacing guide.docx.pdf · pacing guide 2017 - 2018 course algebra ia grade 9....
TRANSCRIPT

Huntsville City Schools
Pacing Guide 2017 - 2018
Course Algebra IA Grade 9th
Note Please see documents on A+ College Ready website for more details
Ixlcom alignment for Pearson textbook is in the table at the end of the pacing guide
Links and Additional Resources
Dan Meyer Blog key=0AjIqyKM9d7ZYdEhtR3BJMmdBWnM httpblogmrmeyercomcategory3acts 2YWxWYVM1UWowTEEgid=0 Granite City Math Vocabulary
Dan Meyer List of Activities httpwwwgraniteschoolsorgmathvoca httpsdocsgooglecomspreadsheetccc bulary
Things to Remember 1 Mixed Reviews are at end of each section The teacher book has a list of standards next to questions
2 Interactmathcom commoncorepalcom and poweralgbracom are good resources for practice and review 3 Cumulative Standards Review is located at the end of each chapter for in-depth practice problem
Huntsville City Schools
Pacing Guide 2017 - 2018
Algebra IA Ninth Grade
First Nine Weeks
Basic Number Quantity Algebra amp Equations
Standard Resources
Approximate Pacing
Number of Days 41
days Unit Basic Number Quantity Basic AlgebraPre-Algebra
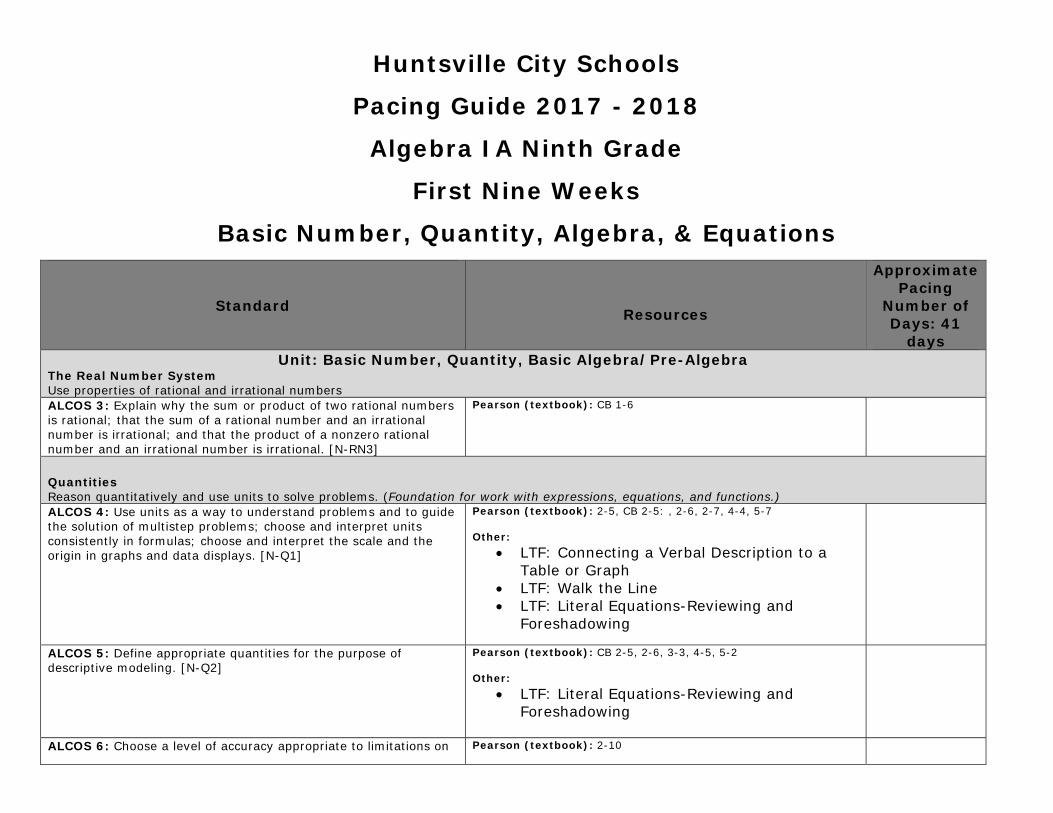
The Real Number System Use properties of rational and irrational numbers ALCOS 3 Explain why the sum or product of two rational numbers is rational that the sum of a rational number and an irrational number is irrational and that the product of a nonzero rational number and an irrational number is irrational [N-RN3]
Pearson (textbook) CB 1-6
Quantities Reason quantitatively and use units to solve problems (Foundation for work with expressions equations and functions) ALCOS 4 Use units as a way to understand problems and to guide the solution of multistep problems choose and interpret units consistently in formulas choose and interpret the scale and the origin in graphs and data displays [N-Q1]
Pearson (textbook) 2-5 CB 2-5 2-6 2-7 4-4 5-7
Other LTF Connecting a Verbal Description to a
Table or Graph LTF Walk the Line LTF Literal Equations-Reviewing and
Foreshadowing
ALCOS 5 Define appropriate quantities for the purpose of Pearson (textbook) CB 2-5 2-6 3-3 4-5 5-2 descriptive modeling [N-Q2]
Other LTF Literal Equations-Reviewing and
Foreshadowing
ALCOS 6 Choose a level of accuracy appropriate to limitations on Pearson (textbook) 2-10
measurement when reporting quantities [N-Q3] Seeing Structure in Expressions Interpret the structure of expressions (Linear only) ALCOS 7 Interpret expressions that represent a quantity in terms of its context [A-SSE1]
a Interpret parts of an expression such as terms factors and coefficients [A-SSE1a]
Pearson (textbook) 1-1 1-2 1-7 4-5 4-7 5-3 5-4
ALCOS 7 Interpret expressions that represent a quantity in terms of its context [A-SSE1]
b Interpret complicated expressions by viewing one or more of their parts as a single entity [A-SSE1b]
Example Interpret P(1+r)n as the product of P and a factor not depending on P
Pearson (textbook)1-7 3-7 4-7
ALCOS 8 Use the structure of an expression to identify ways to rewrite it [A-SSE2]
Example See x4 ‐ y4 as (x2)2 ‐ (y2)2 thus recognizing it as a difference of squares that can be factored as (x2 ‐ y2)(x2 + y2)
Pearson (textbook) 1-1 1-2 5-3 5-4 5-5
Unit Intro to EquationsInequalities Create Equations Create equations that describe numbers or relationships (Linear) ALCOS 12 Create equations and inequalities in one variable and use them to solve problems Include equations arising from linear and quadratic functions and simple rational and exponential functions [A-CED1]
Pearson (textbook) 1-8 2-1 2-2 2-3 2-4 2-5 2-7 2-8 3-2 3-3 3-4 3-6 3-7 3-8
Other LTF Linear Functions LTF Literal equations- Reviewing and
Foreshadowing
ALCOS 13 Create equations in two or more variables to represent relationships between quantities graph equations on coordinate axes with labels and scales [A-CED2]
Pearson (textbook) 1-9 4-5 5-2 5-3 5-4 5-5
Other LTF Connecting a Verbal Description to a
Table or Graph amp Walk the Line
ALCOS 14 Represent constraints by equations or inequalities and by systems of equations andor inequalities and interpret solutions as viable or non-viable options in a modeling context [A-CED3] Example Represent inequalities describing nutritional and cost constraints on combinations of different foods
Pearson (textbook) 6-4 6-5
Other LTF Maximizing Profit
ALCOS 15 Rearrange formulas to highlight a quantity of interest Pearson (textbook) 2-5 using the same reasoning as in solving equations [A-CED4] Example Rearrange Ohmrsquos law V = IR to highlight resistance R Other
LTF Literal Equations ndash Reviewing and Foreshadowing
LTF Linear Functions
Reasoning with Equations and Inequalities Understand solving equations as a process of reasoning and explain the reasoning (Master linear learn as general principle) ALCOS 16 Explain each step in solving a simple equation as following from the equality of numbers asserted at the previous step starting from the assumption that the original equation has a solution Construct a viable argument to justify a solution method [A-REI1]
Pearson (textbook) 2-2 2-3 2-4 2-5
Other LTF Literal Equations ndash Reviewing and
Foreshadowing Solve equations and inequalities in one variable (Linear inequalities literal that are linear in the variables being solved for) ALCOS 17 Solve linear equations and inequalities in one variable including equations with coefficients represented by letters [A-REI3]
Pearson (textbook) 2-1 2-2 2-3 2-4 2-5 2-7 2-8 3-2 3-3 3-4 3-5 3-6
Other LTF Literal Equations ndash Reviewing and
Foreshadowing
Other Resources for Chapters 1-3 Dan Meyer Circle-Square World Record Airbag Falling Glowsticks Falling Rocks
Huntsville City Schools
Pacing Guide 2017 - 2018
Algebra IA Ninth Grade
Second Nine Weeks
Intro to Inequalities amp Functions Approximate
Standard Resources
Pacing Number of Days 44
days
Unit Functions (linear) Interpreting Functions Understand the concept of a function and use function notation (Learn as general principle focus on linear and on arithmetic sequences) ALCOS 25 Understand that a function from one set (called the domain) to another set (called the range) assigns to each element of the domain exactly one element of the range If f is a function and x is an element of its domain then f(x) denotes the output of f corresponding to the input x The graph of f is the graph of the equation y = f(x) [F-IF1]
Pearson (textbook) 4-6
Other LTF Introduction to Function Notation LTF Connecting Table Graph and Function
Notation ALCOS 26 Use function notation evaluate functions for inputs in their domains and interpret statements that use function notation in terms of a context [F-IF2]
Pearson (textbook) 4-6
Other LTF Introduction to Function Notation LTF Connecting Table Graph and Function
Notation Interpret functions that arise in applications in terms of the context (Linear) ALCOS 28 For a function that models a relationship between two quantities interpret key features of graphs and tables in terms of the quantities and sketch graphs showing key features given a verbal description of the relationship Key features include intercepts intervals where the function is increasing decreasing positive or negative relative maximums and minimums symmetries end behavior and periodicity [F-IF4]
Pearson (textbook) 4-2 4-3 5-3 5-4 5-5
Other LTF Analysis of Functions LTF Translations of Linear Functions LTF Write the equation of the Line Review
ALCOS 29 Relate the domain of a function to its graph and where Pearson (textbook) 4-4
applicable to the quantitative relationship it describes [F-IF5] Example If the function h(n) gives the number of person-hours it takes to assemble n engines in a factory then the positive integers would be an appropriate domain for the function
Dan MeyerOther Resources for Chapter 4 Taco Cart
Huntsville City Schools
Pacing Guide 2017 - 2018
Algebra IA Ninth Grade
Third Nine Weeks
Linear Functions (focus on linear) Approximate
Standard Resources
Pacing Number of Days 41
days
Interpret functions that arise in applications in terms of the context (Linear) ALCOS 30 Calculate and interpret the average rate of change of a Pearson (textbook) 5-1 function (presented symbolically or as a table) over a specified interval Estimate the rate of change from a graph [F-IF6] Other
LTF Walk the Line (MG) LTF Average Rate of Change (MG) LTF Calculating Average Rate of Change LTF Slope Investigation
Analyze functions using different representations (Linear) ALCOS 31 Graph functions expressed symbolically and show key features of the graph by hand in simple cases and using technology for more complicated cases [F-IF7]
a Graph linear and quadratic functions and show intercepts maxima and minima [F-IF7a]
Pearson (textbook) 5-3 5-4 5-5 5-8
ALCOS 32 Write a function defined by an expression in different but equivalent forms to reveal and explain different properties of the function [F-IF8]
Pearson (textbook)
ALCOS 33 Compare properties of two functions each represented in a different way (algebraically graphically numerically in tables or by verbal descriptions) [F-IF9]
Example Given a graph of one quadratic function and an algebraic expression for another say which has the larger maximum
Pearson (textbook) 5-5
Other LTF Analysis of Functions LTF Translations of Linear Functions
Build new functions from existing functions (Linear) ALCOS 36 Identify the effect on the graph of replacing f(x) by f(x) + k k f(x) f(kx) and f(x + k) for specific values of k (both positive and negative) find the value of k given the graphs Experiment with cases and illustrate an explanation of the effects on the graph using technology Include recognizing even and odd functions from their graphs and algebraic expressions for them [F-BF3]
Pearson (textbook) 5-3 CB 5-3 5-4 5-8
Linear Models Construct and compare linear models and solve problems ALCOS 37 Distinguish between situations that can be modeled with linear functions and with exponential functions [F-LE1]
a Prove that linear functions grow by equal differences over equal intervals and that exponential functions grow by equal factors over equal intervals [F-LE1a]
Pearson (textbook)
ALCOS 37 Distinguish between situations that can be modeled with linear functions and with exponential functions [F-LE1]
b Recognize situations in which one quantity changes at a constant rate per unit interval relative to another [F-LE1b]
Pearson (textbook) 5-1
Other LTF Walk the Line (MG) LTF Average Rate of Change (MG) LTF Calculating Average Rate of Change LTF Slope Investigation
ALCOS 38 Construct linear and exponential functions including arithmetic and geometric sequences given a graph a description of a relationship or two input-output pairs (include reading these from a table) [F-LE2]
Pearson (textbook) 4-7 5-3 5-4 5-5
interpret expressions for functions in terms of the situation they model (Linear and exponential of form f(x) = DD D ALCOS 40 Interpret the parameters in a linear or exponential function in terms of a context [F-LE5]
Pearson (textbook) 5-3 5-4 5-5 5-7
Other LTF Exponential Function Exploration LTF Exponential Growth (Found under
Mathematical Foundations)
Other Resources for Chapter 5 Dan Meyer Penny Circle
Huntsville City Schools
Pacing Guide 2017 - 2018
Algebra IA Ninth Grade
Fourth Nine Weeks
Systems Sequences Statistics amp Probability
Standard Resources
Approximate Pacing
Number of Days 52
Unit Systems of Equations amp Inequalities
Reasoning with Equations and Inequalities
Solve systems of equations (Linear‐linear)
ALCOS 19 Prove that given a system of two equations in two variables replacing one equation by the sum of that equation and a multiple of the other produces a system with the same solutions [A-REI5]
Pearson (textbook) 6-3
Other
LTF Painting the House LTF Solving systems of Linear Equations
ALCOS 20 Solve systems of linear equations exactly and approximately (eg with graphs) focusing on pairs of linear equations in two variables [A-REI6]
Pearson (textbook) 6-1 6-2 6-3 6-4
Other LTF Painting the House LTF Solving systems of Linear Equations
Represent and solve equations and inequalities graphically (Linear learn as general principle) ALCOS 22 Understand that the graph of an equation in two Pearson (textbook) 1-9 4-2 4-3 4-4 variables is the set of all its solutions plotted in the coordinate plane often forming a curve (which could be a line) [A-REI10] Other
LTF Connecting a Verbal Description to Table and Graph
LTF Discrete and Continuous Data
ALCOS 23 Explain why the x-coordinates of the points where the graphs of the equations y = f(x) and y = g(x) intersect are the solutions of the equation f(x) = g(x) find the solutions
Pearson (textbook) CB 4-4 CB 6-1 7-6
approximately eg using technology to graph the functions make tables of values or find successive approximations Include cases where f(x) andor g(x) are linear polynomial rational absolute value exponential and logarithmic functions [A-REI11] ALCOS 24 Graph the solutions to a linear inequality in two variables as a half-plane (excluding the boundary in the case of a strict inequality) and graph the solution set to a system of linear inequalities in two variables as the intersection of the corresponding half-planes [A-REI12]
Pearson (textbook) 6-5 6-6 CB 6-6
Other LTF Maximizing Profit
Unit Sequences Building Functions Build a function that models a relationship between two quantities (For standards 34 and 35 linear) ALCOS 34 Write a function that describes a relationship between two quantities [F-BF1]
a Determine an explicit expression a recursive process or steps for calculation from a context [F-BF1a]
Pearson (textbook) 4-7 5-3 5-4 5-5
Other LTF Write the equation of the Line Review
ALCOS 34 Write a function that describes a relationship between two quantities [F-BF1]
b Combine standard function types using arithmetic operations [F-BF1b] Example Build a function that models the temperature of a cooling body by adding a constant function to a decaying exponential and relate these functions to the model
Pearson (textbook)
ALCOS 35 Write arithmetic and geometric sequences both Pearson (textbook) 4-7 7-8 recursively and with an explicit formula use them to model situations and translate between the two forms [F-BF2] Other
LTF Arithmetic Sequences (MG) LTF Writing Equations Using Sequences
Unit Statistics amp Probability Interpreting Categorical and Quantitative Data
Summarize represent and interpret data on two categorical and quantitative variables (Linear focus discuss general principle) ALCOS 45 Represent data on two quantitative variables on a scatter plot and describe how the variables are related [S-ID6]
a Fit a function to the data use functions fitted to data to solve problems in the context of data Use given function or choose a function suggested by the context Emphasize linear quadratic and exponential models [S-ID6a]
Pearson (textbook) 5-7
Other
LTF Fitting a Line to Data LTF Use Dotplots
ALCOS 45 Represent data on two quantitative variables on a Pearson (textbook) CB 5-7 scatter plot and describe how the variables are related [S-ID6]
Other b Informally assess the fit of a function by plotting and LTF Fitting a Line to Data
analyzing residuals LTF Use Dotplots
ALCOS 45 Represent data on two quantitative variables on a scatter plot and describe how the variables are related [S-ID6]
c Fit a linear function for scatter plot that suggests a linear association [S-ID6c]
Pearson (textbook) 5-7
Other
LTF Fitting a Line to Data LTF Use Dotplots
Interpret Linear Models
ALCOS 46 Interpret the slope (rate of change) and intercept (constant term) of a linear model in the context of the data [S-ID7]
Pearson (textbook) 5-7
Other LTF Calculating Average Rate of Change LTF Slope Investigation
Other Resources for Chapter 6 Dan Meyer Circle-Square
Other Resources for Chapter 7 Non LTF Lesson available on apluscollegereadycom How do you start and how do you change
Dan Meyer Super Stairs
IXL-Pearson Correlation Assignments Pearson Chapter‐Section IXL Assignments Pearson Chapter‐Section IXL Assignments
11 I1 I4 47 P1‐P7
12 B1 B3 B7 (Possibly V1 amp V8) 51 S2 S3 S4
13 A1 A2 A4 52 R1 R2 R3 R4 R5
14 H1 H2 H3 H4 53 S5 S6 S7 S8
15 B2 B4 B6 54 S17 S18 S19
16 A3 A7 B5 55 S12 S13 S14
17 (none) 56 S20 S21
18 I5 I6 I7 57 N6
19 J2 58 DD1 DD2 DD3 DD4
21 J3 61 U1 U2 U4
22 J4 62 U8
23 J5 63 U5 U10
24 J6 64 U3 U9 U11 U13 U14 U15
25 S9 65 T1 T2 T3 T4
26 C1 C2 C3 (C4) 66 T5 T6
27 C5 C6 71 V3
28 C7 72 V4
29 D1 D2 D3 73 V7
210 D4 D5 D6 D7 D8 74 V5 V6 V9
31 K1 K2 K3 75 V10
32 K4 76 X1 X2
33 K5 (Mix of 32‐32 K6 K7) 77 X3
34 K8 K9 K10 K11 78 P1‐P7
35 (none) 81 (Review with Y1‐Y5) Z1 Z4 Z5
36 K12 K13 K14 K15 82 Z6 Z10 AA1 AA2
37 L1 L2 L3 L4 83 Z8
38 (none) 84 Z9
41 Q1 85 AA3
42 Q3 Q13 Q14 86 AA4
43 S1 Q4 Q5 Q6 87 AA5
44 Q7 Q8 Q9 88 AA7 (AA8 is good review at this point) 45 Q10 91 BB1 BB2
46 Q2 92 BB3
Pearson Chapter‐Section IXL Assignments 93 BB4 BB5
94 BB6
95 BB7 BB8
96 BB9 BB10
97 CC1 CC2
98 BB11
101 (none) 102 EE1 EE2
103 EE3 EE4 EE5 EE6 EE7
104 FF1 FF2 FF3 FF4
105 (none) 111 GG3
112 GG4
113 GG5
114 GG6
115 GG7
116 R6 R7 R8
117 GG1
121 M1‐M2 M3 M4 M5 M6
122 N2
123 KK1
124 N5 KK2
125 KK3 KK4 KK5 KK6 KK7 KK8
126 JJ6 JJ8 (JJ4 JJ5 JJ7) 127 JJ1 JJ2
128 JJ3
Listed below are the technology standards for grades nine through twelve You are to make every effort to incorporate the applicable standards into your daily classroom lessons These standards should be noted in your lesson plans
Alabama Technology Standards Ninth ndash Twelfth Grade
Operations and Concepts
Students will
2 Diagnose hardware and software problems Examples viruses error messages Applying strategies to correct malfunctioning hardware and software Performing routine hardware maintenance Describing the importance of antivirus and security software
3 Demonstrate advanced technology skills including compressing converting importing exporting and backing up files Transferring data among applications Demonstrating digital file transfer Examples attaching uploading downloading
4 Utilize advanced features of word processing software including outlining tracking changes hyperlinking and mail merging
5 Utilize advanced features of spreadsheet software including creating charts and graphs sorting and filtering data creating formulas and applying functions
6 Utilize advanced features of multimedia software including image video and audio editing
Digital Citizenship
9 Practice ethical and legal use of technology systems and digital content Explaining consequences of illegal and unethical use of technology systems and digital content Examples cyberbullying plagiarism Interpreting copyright laws and policies with regard to ownership and use of digital content Citing sources of digital content using a style manual Examples Modern Language Association (MLA) American Psychological Association (APA)
Research and Information Fluency
11 Critique digital content for validity accuracy bias currency and relevance
Communication and Collaboration
12 Use digital tools to publish curriculum‐related content Examples Web page authoring software coding software wikis blogs podcasts
13 Demonstrate collaborative skills using curriculum‐related content in digital environments Examples completing assignments online interacting with experts and peers in a structured online learning environment
Critical Thinking Problem Solving and Decision Making
14 Use digital tools to defend solutions to authentic problems Example disaggregating data electronically
Creativity and Innovation
1 Create a product that integrates information from multiple software applications Example pasting spreadsheet‐generated charts into a presentation
Huntsville City Schools
Pacing Guide 2017 - 2018
Algebra IA Ninth Grade
First Nine Weeks
Basic Number Quantity Algebra amp Equations
Standard Resources
Approximate Pacing
Number of Days 41
days Unit Basic Number Quantity Basic AlgebraPre-Algebra
The Real Number System Use properties of rational and irrational numbers ALCOS 3 Explain why the sum or product of two rational numbers is rational that the sum of a rational number and an irrational number is irrational and that the product of a nonzero rational number and an irrational number is irrational [N-RN3]
Pearson (textbook) CB 1-6
Quantities Reason quantitatively and use units to solve problems (Foundation for work with expressions equations and functions) ALCOS 4 Use units as a way to understand problems and to guide the solution of multistep problems choose and interpret units consistently in formulas choose and interpret the scale and the origin in graphs and data displays [N-Q1]
Pearson (textbook) 2-5 CB 2-5 2-6 2-7 4-4 5-7
Other LTF Connecting a Verbal Description to a
Table or Graph LTF Walk the Line LTF Literal Equations-Reviewing and
Foreshadowing
ALCOS 5 Define appropriate quantities for the purpose of Pearson (textbook) CB 2-5 2-6 3-3 4-5 5-2 descriptive modeling [N-Q2]
Other LTF Literal Equations-Reviewing and
Foreshadowing
ALCOS 6 Choose a level of accuracy appropriate to limitations on Pearson (textbook) 2-10
measurement when reporting quantities [N-Q3] Seeing Structure in Expressions Interpret the structure of expressions (Linear only) ALCOS 7 Interpret expressions that represent a quantity in terms of its context [A-SSE1]
a Interpret parts of an expression such as terms factors and coefficients [A-SSE1a]
Pearson (textbook) 1-1 1-2 1-7 4-5 4-7 5-3 5-4
ALCOS 7 Interpret expressions that represent a quantity in terms of its context [A-SSE1]
b Interpret complicated expressions by viewing one or more of their parts as a single entity [A-SSE1b]
Example Interpret P(1+r)n as the product of P and a factor not depending on P
Pearson (textbook)1-7 3-7 4-7
ALCOS 8 Use the structure of an expression to identify ways to rewrite it [A-SSE2]
Example See x4 ‐ y4 as (x2)2 ‐ (y2)2 thus recognizing it as a difference of squares that can be factored as (x2 ‐ y2)(x2 + y2)
Pearson (textbook) 1-1 1-2 5-3 5-4 5-5
Unit Intro to EquationsInequalities Create Equations Create equations that describe numbers or relationships (Linear) ALCOS 12 Create equations and inequalities in one variable and use them to solve problems Include equations arising from linear and quadratic functions and simple rational and exponential functions [A-CED1]
Pearson (textbook) 1-8 2-1 2-2 2-3 2-4 2-5 2-7 2-8 3-2 3-3 3-4 3-6 3-7 3-8
Other LTF Linear Functions LTF Literal equations- Reviewing and
Foreshadowing
ALCOS 13 Create equations in two or more variables to represent relationships between quantities graph equations on coordinate axes with labels and scales [A-CED2]
Pearson (textbook) 1-9 4-5 5-2 5-3 5-4 5-5
Other LTF Connecting a Verbal Description to a
Table or Graph amp Walk the Line
ALCOS 14 Represent constraints by equations or inequalities and by systems of equations andor inequalities and interpret solutions as viable or non-viable options in a modeling context [A-CED3] Example Represent inequalities describing nutritional and cost constraints on combinations of different foods
Pearson (textbook) 6-4 6-5
Other LTF Maximizing Profit
ALCOS 15 Rearrange formulas to highlight a quantity of interest Pearson (textbook) 2-5 using the same reasoning as in solving equations [A-CED4] Example Rearrange Ohmrsquos law V = IR to highlight resistance R Other
LTF Literal Equations ndash Reviewing and Foreshadowing
LTF Linear Functions
Reasoning with Equations and Inequalities Understand solving equations as a process of reasoning and explain the reasoning (Master linear learn as general principle) ALCOS 16 Explain each step in solving a simple equation as following from the equality of numbers asserted at the previous step starting from the assumption that the original equation has a solution Construct a viable argument to justify a solution method [A-REI1]
Pearson (textbook) 2-2 2-3 2-4 2-5
Other LTF Literal Equations ndash Reviewing and
Foreshadowing Solve equations and inequalities in one variable (Linear inequalities literal that are linear in the variables being solved for) ALCOS 17 Solve linear equations and inequalities in one variable including equations with coefficients represented by letters [A-REI3]
Pearson (textbook) 2-1 2-2 2-3 2-4 2-5 2-7 2-8 3-2 3-3 3-4 3-5 3-6
Other LTF Literal Equations ndash Reviewing and
Foreshadowing
Other Resources for Chapters 1-3 Dan Meyer Circle-Square World Record Airbag Falling Glowsticks Falling Rocks
Huntsville City Schools
Pacing Guide 2017 - 2018
Algebra IA Ninth Grade
Second Nine Weeks
Intro to Inequalities amp Functions Approximate
Standard Resources
Pacing Number of Days 44
days
Unit Functions (linear) Interpreting Functions Understand the concept of a function and use function notation (Learn as general principle focus on linear and on arithmetic sequences) ALCOS 25 Understand that a function from one set (called the domain) to another set (called the range) assigns to each element of the domain exactly one element of the range If f is a function and x is an element of its domain then f(x) denotes the output of f corresponding to the input x The graph of f is the graph of the equation y = f(x) [F-IF1]
Pearson (textbook) 4-6
Other LTF Introduction to Function Notation LTF Connecting Table Graph and Function
Notation ALCOS 26 Use function notation evaluate functions for inputs in their domains and interpret statements that use function notation in terms of a context [F-IF2]
Pearson (textbook) 4-6
Other LTF Introduction to Function Notation LTF Connecting Table Graph and Function
Notation Interpret functions that arise in applications in terms of the context (Linear) ALCOS 28 For a function that models a relationship between two quantities interpret key features of graphs and tables in terms of the quantities and sketch graphs showing key features given a verbal description of the relationship Key features include intercepts intervals where the function is increasing decreasing positive or negative relative maximums and minimums symmetries end behavior and periodicity [F-IF4]
Pearson (textbook) 4-2 4-3 5-3 5-4 5-5
Other LTF Analysis of Functions LTF Translations of Linear Functions LTF Write the equation of the Line Review
ALCOS 29 Relate the domain of a function to its graph and where Pearson (textbook) 4-4
applicable to the quantitative relationship it describes [F-IF5] Example If the function h(n) gives the number of person-hours it takes to assemble n engines in a factory then the positive integers would be an appropriate domain for the function
Dan MeyerOther Resources for Chapter 4 Taco Cart
Huntsville City Schools
Pacing Guide 2017 - 2018
Algebra IA Ninth Grade
Third Nine Weeks
Linear Functions (focus on linear) Approximate
Standard Resources
Pacing Number of Days 41
days
Interpret functions that arise in applications in terms of the context (Linear) ALCOS 30 Calculate and interpret the average rate of change of a Pearson (textbook) 5-1 function (presented symbolically or as a table) over a specified interval Estimate the rate of change from a graph [F-IF6] Other
LTF Walk the Line (MG) LTF Average Rate of Change (MG) LTF Calculating Average Rate of Change LTF Slope Investigation
Analyze functions using different representations (Linear) ALCOS 31 Graph functions expressed symbolically and show key features of the graph by hand in simple cases and using technology for more complicated cases [F-IF7]
a Graph linear and quadratic functions and show intercepts maxima and minima [F-IF7a]
Pearson (textbook) 5-3 5-4 5-5 5-8
ALCOS 32 Write a function defined by an expression in different but equivalent forms to reveal and explain different properties of the function [F-IF8]
Pearson (textbook)
ALCOS 33 Compare properties of two functions each represented in a different way (algebraically graphically numerically in tables or by verbal descriptions) [F-IF9]
Example Given a graph of one quadratic function and an algebraic expression for another say which has the larger maximum
Pearson (textbook) 5-5
Other LTF Analysis of Functions LTF Translations of Linear Functions
Build new functions from existing functions (Linear) ALCOS 36 Identify the effect on the graph of replacing f(x) by f(x) + k k f(x) f(kx) and f(x + k) for specific values of k (both positive and negative) find the value of k given the graphs Experiment with cases and illustrate an explanation of the effects on the graph using technology Include recognizing even and odd functions from their graphs and algebraic expressions for them [F-BF3]
Pearson (textbook) 5-3 CB 5-3 5-4 5-8
Linear Models Construct and compare linear models and solve problems ALCOS 37 Distinguish between situations that can be modeled with linear functions and with exponential functions [F-LE1]
a Prove that linear functions grow by equal differences over equal intervals and that exponential functions grow by equal factors over equal intervals [F-LE1a]
Pearson (textbook)
ALCOS 37 Distinguish between situations that can be modeled with linear functions and with exponential functions [F-LE1]
b Recognize situations in which one quantity changes at a constant rate per unit interval relative to another [F-LE1b]
Pearson (textbook) 5-1
Other LTF Walk the Line (MG) LTF Average Rate of Change (MG) LTF Calculating Average Rate of Change LTF Slope Investigation
ALCOS 38 Construct linear and exponential functions including arithmetic and geometric sequences given a graph a description of a relationship or two input-output pairs (include reading these from a table) [F-LE2]
Pearson (textbook) 4-7 5-3 5-4 5-5
interpret expressions for functions in terms of the situation they model (Linear and exponential of form f(x) = DD D ALCOS 40 Interpret the parameters in a linear or exponential function in terms of a context [F-LE5]
Pearson (textbook) 5-3 5-4 5-5 5-7
Other LTF Exponential Function Exploration LTF Exponential Growth (Found under
Mathematical Foundations)
Other Resources for Chapter 5 Dan Meyer Penny Circle
Huntsville City Schools
Pacing Guide 2017 - 2018
Algebra IA Ninth Grade
Fourth Nine Weeks
Systems Sequences Statistics amp Probability
Standard Resources
Approximate Pacing
Number of Days 52
Unit Systems of Equations amp Inequalities
Reasoning with Equations and Inequalities
Solve systems of equations (Linear‐linear)
ALCOS 19 Prove that given a system of two equations in two variables replacing one equation by the sum of that equation and a multiple of the other produces a system with the same solutions [A-REI5]
Pearson (textbook) 6-3
Other
LTF Painting the House LTF Solving systems of Linear Equations
ALCOS 20 Solve systems of linear equations exactly and approximately (eg with graphs) focusing on pairs of linear equations in two variables [A-REI6]
Pearson (textbook) 6-1 6-2 6-3 6-4
Other LTF Painting the House LTF Solving systems of Linear Equations
Represent and solve equations and inequalities graphically (Linear learn as general principle) ALCOS 22 Understand that the graph of an equation in two Pearson (textbook) 1-9 4-2 4-3 4-4 variables is the set of all its solutions plotted in the coordinate plane often forming a curve (which could be a line) [A-REI10] Other
LTF Connecting a Verbal Description to Table and Graph
LTF Discrete and Continuous Data
ALCOS 23 Explain why the x-coordinates of the points where the graphs of the equations y = f(x) and y = g(x) intersect are the solutions of the equation f(x) = g(x) find the solutions
Pearson (textbook) CB 4-4 CB 6-1 7-6
approximately eg using technology to graph the functions make tables of values or find successive approximations Include cases where f(x) andor g(x) are linear polynomial rational absolute value exponential and logarithmic functions [A-REI11] ALCOS 24 Graph the solutions to a linear inequality in two variables as a half-plane (excluding the boundary in the case of a strict inequality) and graph the solution set to a system of linear inequalities in two variables as the intersection of the corresponding half-planes [A-REI12]
Pearson (textbook) 6-5 6-6 CB 6-6
Other LTF Maximizing Profit
Unit Sequences Building Functions Build a function that models a relationship between two quantities (For standards 34 and 35 linear) ALCOS 34 Write a function that describes a relationship between two quantities [F-BF1]
a Determine an explicit expression a recursive process or steps for calculation from a context [F-BF1a]
Pearson (textbook) 4-7 5-3 5-4 5-5
Other LTF Write the equation of the Line Review
ALCOS 34 Write a function that describes a relationship between two quantities [F-BF1]
b Combine standard function types using arithmetic operations [F-BF1b] Example Build a function that models the temperature of a cooling body by adding a constant function to a decaying exponential and relate these functions to the model
Pearson (textbook)
ALCOS 35 Write arithmetic and geometric sequences both Pearson (textbook) 4-7 7-8 recursively and with an explicit formula use them to model situations and translate between the two forms [F-BF2] Other
LTF Arithmetic Sequences (MG) LTF Writing Equations Using Sequences
Unit Statistics amp Probability Interpreting Categorical and Quantitative Data
Summarize represent and interpret data on two categorical and quantitative variables (Linear focus discuss general principle) ALCOS 45 Represent data on two quantitative variables on a scatter plot and describe how the variables are related [S-ID6]
a Fit a function to the data use functions fitted to data to solve problems in the context of data Use given function or choose a function suggested by the context Emphasize linear quadratic and exponential models [S-ID6a]
Pearson (textbook) 5-7
Other
LTF Fitting a Line to Data LTF Use Dotplots
ALCOS 45 Represent data on two quantitative variables on a Pearson (textbook) CB 5-7 scatter plot and describe how the variables are related [S-ID6]
Other b Informally assess the fit of a function by plotting and LTF Fitting a Line to Data
analyzing residuals LTF Use Dotplots
ALCOS 45 Represent data on two quantitative variables on a scatter plot and describe how the variables are related [S-ID6]
c Fit a linear function for scatter plot that suggests a linear association [S-ID6c]
Pearson (textbook) 5-7
Other
LTF Fitting a Line to Data LTF Use Dotplots
Interpret Linear Models
ALCOS 46 Interpret the slope (rate of change) and intercept (constant term) of a linear model in the context of the data [S-ID7]
Pearson (textbook) 5-7
Other LTF Calculating Average Rate of Change LTF Slope Investigation
Other Resources for Chapter 6 Dan Meyer Circle-Square
Other Resources for Chapter 7 Non LTF Lesson available on apluscollegereadycom How do you start and how do you change
Dan Meyer Super Stairs
IXL-Pearson Correlation Assignments Pearson Chapter‐Section IXL Assignments Pearson Chapter‐Section IXL Assignments
11 I1 I4 47 P1‐P7
12 B1 B3 B7 (Possibly V1 amp V8) 51 S2 S3 S4
13 A1 A2 A4 52 R1 R2 R3 R4 R5
14 H1 H2 H3 H4 53 S5 S6 S7 S8
15 B2 B4 B6 54 S17 S18 S19
16 A3 A7 B5 55 S12 S13 S14
17 (none) 56 S20 S21
18 I5 I6 I7 57 N6
19 J2 58 DD1 DD2 DD3 DD4
21 J3 61 U1 U2 U4
22 J4 62 U8
23 J5 63 U5 U10
24 J6 64 U3 U9 U11 U13 U14 U15
25 S9 65 T1 T2 T3 T4
26 C1 C2 C3 (C4) 66 T5 T6
27 C5 C6 71 V3
28 C7 72 V4
29 D1 D2 D3 73 V7
210 D4 D5 D6 D7 D8 74 V5 V6 V9
31 K1 K2 K3 75 V10
32 K4 76 X1 X2
33 K5 (Mix of 32‐32 K6 K7) 77 X3
34 K8 K9 K10 K11 78 P1‐P7
35 (none) 81 (Review with Y1‐Y5) Z1 Z4 Z5
36 K12 K13 K14 K15 82 Z6 Z10 AA1 AA2
37 L1 L2 L3 L4 83 Z8
38 (none) 84 Z9
41 Q1 85 AA3
42 Q3 Q13 Q14 86 AA4
43 S1 Q4 Q5 Q6 87 AA5
44 Q7 Q8 Q9 88 AA7 (AA8 is good review at this point) 45 Q10 91 BB1 BB2
46 Q2 92 BB3
Pearson Chapter‐Section IXL Assignments 93 BB4 BB5
94 BB6
95 BB7 BB8
96 BB9 BB10
97 CC1 CC2
98 BB11
101 (none) 102 EE1 EE2
103 EE3 EE4 EE5 EE6 EE7
104 FF1 FF2 FF3 FF4
105 (none) 111 GG3
112 GG4
113 GG5
114 GG6
115 GG7
116 R6 R7 R8
117 GG1
121 M1‐M2 M3 M4 M5 M6
122 N2
123 KK1
124 N5 KK2
125 KK3 KK4 KK5 KK6 KK7 KK8
126 JJ6 JJ8 (JJ4 JJ5 JJ7) 127 JJ1 JJ2
128 JJ3
Listed below are the technology standards for grades nine through twelve You are to make every effort to incorporate the applicable standards into your daily classroom lessons These standards should be noted in your lesson plans
Alabama Technology Standards Ninth ndash Twelfth Grade
Operations and Concepts
Students will
2 Diagnose hardware and software problems Examples viruses error messages Applying strategies to correct malfunctioning hardware and software Performing routine hardware maintenance Describing the importance of antivirus and security software
3 Demonstrate advanced technology skills including compressing converting importing exporting and backing up files Transferring data among applications Demonstrating digital file transfer Examples attaching uploading downloading
4 Utilize advanced features of word processing software including outlining tracking changes hyperlinking and mail merging
5 Utilize advanced features of spreadsheet software including creating charts and graphs sorting and filtering data creating formulas and applying functions
6 Utilize advanced features of multimedia software including image video and audio editing
Digital Citizenship
9 Practice ethical and legal use of technology systems and digital content Explaining consequences of illegal and unethical use of technology systems and digital content Examples cyberbullying plagiarism Interpreting copyright laws and policies with regard to ownership and use of digital content Citing sources of digital content using a style manual Examples Modern Language Association (MLA) American Psychological Association (APA)
Research and Information Fluency
11 Critique digital content for validity accuracy bias currency and relevance
Communication and Collaboration
12 Use digital tools to publish curriculum‐related content Examples Web page authoring software coding software wikis blogs podcasts
13 Demonstrate collaborative skills using curriculum‐related content in digital environments Examples completing assignments online interacting with experts and peers in a structured online learning environment
Critical Thinking Problem Solving and Decision Making
14 Use digital tools to defend solutions to authentic problems Example disaggregating data electronically
Creativity and Innovation
1 Create a product that integrates information from multiple software applications Example pasting spreadsheet‐generated charts into a presentation

Huntsville City Schools
Pacing Guide 2017 - 2018
Algebra IA Ninth Grade
Second Nine Weeks
Intro to Inequalities amp Functions Approximate
Standard Resources
Pacing Number of Days 44
days
Unit Functions (linear) Interpreting Functions Understand the concept of a function and use function notation (Learn as general principle focus on linear and on arithmetic sequences) ALCOS 25 Understand that a function from one set (called the domain) to another set (called the range) assigns to each element of the domain exactly one element of the range If f is a function and x is an element of its domain then f(x) denotes the output of f corresponding to the input x The graph of f is the graph of the equation y = f(x) [F-IF1]
Pearson (textbook) 4-6
Other LTF Introduction to Function Notation LTF Connecting Table Graph and Function
Notation ALCOS 26 Use function notation evaluate functions for inputs in their domains and interpret statements that use function notation in terms of a context [F-IF2]
Pearson (textbook) 4-6
Other LTF Introduction to Function Notation LTF Connecting Table Graph and Function
Notation Interpret functions that arise in applications in terms of the context (Linear) ALCOS 28 For a function that models a relationship between two quantities interpret key features of graphs and tables in terms of the quantities and sketch graphs showing key features given a verbal description of the relationship Key features include intercepts intervals where the function is increasing decreasing positive or negative relative maximums and minimums symmetries end behavior and periodicity [F-IF4]
Pearson (textbook) 4-2 4-3 5-3 5-4 5-5
Other LTF Analysis of Functions LTF Translations of Linear Functions LTF Write the equation of the Line Review
ALCOS 29 Relate the domain of a function to its graph and where Pearson (textbook) 4-4
applicable to the quantitative relationship it describes [F-IF5] Example If the function h(n) gives the number of person-hours it takes to assemble n engines in a factory then the positive integers would be an appropriate domain for the function
Dan MeyerOther Resources for Chapter 4 Taco Cart
Huntsville City Schools
Pacing Guide 2017 - 2018
Algebra IA Ninth Grade
Third Nine Weeks
Linear Functions (focus on linear) Approximate
Standard Resources
Pacing Number of Days 41
days
Interpret functions that arise in applications in terms of the context (Linear) ALCOS 30 Calculate and interpret the average rate of change of a Pearson (textbook) 5-1 function (presented symbolically or as a table) over a specified interval Estimate the rate of change from a graph [F-IF6] Other
LTF Walk the Line (MG) LTF Average Rate of Change (MG) LTF Calculating Average Rate of Change LTF Slope Investigation
Analyze functions using different representations (Linear) ALCOS 31 Graph functions expressed symbolically and show key features of the graph by hand in simple cases and using technology for more complicated cases [F-IF7]
a Graph linear and quadratic functions and show intercepts maxima and minima [F-IF7a]
Pearson (textbook) 5-3 5-4 5-5 5-8
ALCOS 32 Write a function defined by an expression in different but equivalent forms to reveal and explain different properties of the function [F-IF8]
Pearson (textbook)
ALCOS 33 Compare properties of two functions each represented in a different way (algebraically graphically numerically in tables or by verbal descriptions) [F-IF9]
Example Given a graph of one quadratic function and an algebraic expression for another say which has the larger maximum
Pearson (textbook) 5-5
Other LTF Analysis of Functions LTF Translations of Linear Functions
Build new functions from existing functions (Linear) ALCOS 36 Identify the effect on the graph of replacing f(x) by f(x) + k k f(x) f(kx) and f(x + k) for specific values of k (both positive and negative) find the value of k given the graphs Experiment with cases and illustrate an explanation of the effects on the graph using technology Include recognizing even and odd functions from their graphs and algebraic expressions for them [F-BF3]
Pearson (textbook) 5-3 CB 5-3 5-4 5-8
Linear Models Construct and compare linear models and solve problems ALCOS 37 Distinguish between situations that can be modeled with linear functions and with exponential functions [F-LE1]
a Prove that linear functions grow by equal differences over equal intervals and that exponential functions grow by equal factors over equal intervals [F-LE1a]
Pearson (textbook)
ALCOS 37 Distinguish between situations that can be modeled with linear functions and with exponential functions [F-LE1]
b Recognize situations in which one quantity changes at a constant rate per unit interval relative to another [F-LE1b]
Pearson (textbook) 5-1
Other LTF Walk the Line (MG) LTF Average Rate of Change (MG) LTF Calculating Average Rate of Change LTF Slope Investigation
ALCOS 38 Construct linear and exponential functions including arithmetic and geometric sequences given a graph a description of a relationship or two input-output pairs (include reading these from a table) [F-LE2]
Pearson (textbook) 4-7 5-3 5-4 5-5
interpret expressions for functions in terms of the situation they model (Linear and exponential of form f(x) = DD D ALCOS 40 Interpret the parameters in a linear or exponential function in terms of a context [F-LE5]
Pearson (textbook) 5-3 5-4 5-5 5-7
Other LTF Exponential Function Exploration LTF Exponential Growth (Found under
Mathematical Foundations)
Other Resources for Chapter 5 Dan Meyer Penny Circle
Huntsville City Schools
Pacing Guide 2017 - 2018
Algebra IA Ninth Grade
Fourth Nine Weeks
Systems Sequences Statistics amp Probability
Standard Resources
Approximate Pacing
Number of Days 52
Unit Systems of Equations amp Inequalities
Reasoning with Equations and Inequalities
Solve systems of equations (Linear‐linear)
ALCOS 19 Prove that given a system of two equations in two variables replacing one equation by the sum of that equation and a multiple of the other produces a system with the same solutions [A-REI5]
Pearson (textbook) 6-3
Other
LTF Painting the House LTF Solving systems of Linear Equations
ALCOS 20 Solve systems of linear equations exactly and approximately (eg with graphs) focusing on pairs of linear equations in two variables [A-REI6]
Pearson (textbook) 6-1 6-2 6-3 6-4
Other LTF Painting the House LTF Solving systems of Linear Equations
Represent and solve equations and inequalities graphically (Linear learn as general principle) ALCOS 22 Understand that the graph of an equation in two Pearson (textbook) 1-9 4-2 4-3 4-4 variables is the set of all its solutions plotted in the coordinate plane often forming a curve (which could be a line) [A-REI10] Other
LTF Connecting a Verbal Description to Table and Graph
LTF Discrete and Continuous Data
ALCOS 23 Explain why the x-coordinates of the points where the graphs of the equations y = f(x) and y = g(x) intersect are the solutions of the equation f(x) = g(x) find the solutions
Pearson (textbook) CB 4-4 CB 6-1 7-6
approximately eg using technology to graph the functions make tables of values or find successive approximations Include cases where f(x) andor g(x) are linear polynomial rational absolute value exponential and logarithmic functions [A-REI11] ALCOS 24 Graph the solutions to a linear inequality in two variables as a half-plane (excluding the boundary in the case of a strict inequality) and graph the solution set to a system of linear inequalities in two variables as the intersection of the corresponding half-planes [A-REI12]
Pearson (textbook) 6-5 6-6 CB 6-6
Other LTF Maximizing Profit
Unit Sequences Building Functions Build a function that models a relationship between two quantities (For standards 34 and 35 linear) ALCOS 34 Write a function that describes a relationship between two quantities [F-BF1]
a Determine an explicit expression a recursive process or steps for calculation from a context [F-BF1a]
Pearson (textbook) 4-7 5-3 5-4 5-5
Other LTF Write the equation of the Line Review
ALCOS 34 Write a function that describes a relationship between two quantities [F-BF1]
b Combine standard function types using arithmetic operations [F-BF1b] Example Build a function that models the temperature of a cooling body by adding a constant function to a decaying exponential and relate these functions to the model
Pearson (textbook)
ALCOS 35 Write arithmetic and geometric sequences both Pearson (textbook) 4-7 7-8 recursively and with an explicit formula use them to model situations and translate between the two forms [F-BF2] Other
LTF Arithmetic Sequences (MG) LTF Writing Equations Using Sequences
Unit Statistics amp Probability Interpreting Categorical and Quantitative Data
Summarize represent and interpret data on two categorical and quantitative variables (Linear focus discuss general principle) ALCOS 45 Represent data on two quantitative variables on a scatter plot and describe how the variables are related [S-ID6]
a Fit a function to the data use functions fitted to data to solve problems in the context of data Use given function or choose a function suggested by the context Emphasize linear quadratic and exponential models [S-ID6a]
Pearson (textbook) 5-7
Other
LTF Fitting a Line to Data LTF Use Dotplots
ALCOS 45 Represent data on two quantitative variables on a Pearson (textbook) CB 5-7 scatter plot and describe how the variables are related [S-ID6]
Other b Informally assess the fit of a function by plotting and LTF Fitting a Line to Data
analyzing residuals LTF Use Dotplots
ALCOS 45 Represent data on two quantitative variables on a scatter plot and describe how the variables are related [S-ID6]
c Fit a linear function for scatter plot that suggests a linear association [S-ID6c]
Pearson (textbook) 5-7
Other
LTF Fitting a Line to Data LTF Use Dotplots
Interpret Linear Models
ALCOS 46 Interpret the slope (rate of change) and intercept (constant term) of a linear model in the context of the data [S-ID7]
Pearson (textbook) 5-7
Other LTF Calculating Average Rate of Change LTF Slope Investigation
Other Resources for Chapter 6 Dan Meyer Circle-Square
Other Resources for Chapter 7 Non LTF Lesson available on apluscollegereadycom How do you start and how do you change
Dan Meyer Super Stairs
IXL-Pearson Correlation Assignments Pearson Chapter‐Section IXL Assignments Pearson Chapter‐Section IXL Assignments
11 I1 I4 47 P1‐P7
12 B1 B3 B7 (Possibly V1 amp V8) 51 S2 S3 S4
13 A1 A2 A4 52 R1 R2 R3 R4 R5
14 H1 H2 H3 H4 53 S5 S6 S7 S8
15 B2 B4 B6 54 S17 S18 S19
16 A3 A7 B5 55 S12 S13 S14
17 (none) 56 S20 S21
18 I5 I6 I7 57 N6
19 J2 58 DD1 DD2 DD3 DD4
21 J3 61 U1 U2 U4
22 J4 62 U8
23 J5 63 U5 U10
24 J6 64 U3 U9 U11 U13 U14 U15
25 S9 65 T1 T2 T3 T4
26 C1 C2 C3 (C4) 66 T5 T6
27 C5 C6 71 V3
28 C7 72 V4
29 D1 D2 D3 73 V7
210 D4 D5 D6 D7 D8 74 V5 V6 V9
31 K1 K2 K3 75 V10
32 K4 76 X1 X2
33 K5 (Mix of 32‐32 K6 K7) 77 X3
34 K8 K9 K10 K11 78 P1‐P7
35 (none) 81 (Review with Y1‐Y5) Z1 Z4 Z5
36 K12 K13 K14 K15 82 Z6 Z10 AA1 AA2
37 L1 L2 L3 L4 83 Z8
38 (none) 84 Z9
41 Q1 85 AA3
42 Q3 Q13 Q14 86 AA4
43 S1 Q4 Q5 Q6 87 AA5
44 Q7 Q8 Q9 88 AA7 (AA8 is good review at this point) 45 Q10 91 BB1 BB2
46 Q2 92 BB3
Pearson Chapter‐Section IXL Assignments 93 BB4 BB5
94 BB6
95 BB7 BB8
96 BB9 BB10
97 CC1 CC2
98 BB11
101 (none) 102 EE1 EE2
103 EE3 EE4 EE5 EE6 EE7
104 FF1 FF2 FF3 FF4
105 (none) 111 GG3
112 GG4
113 GG5
114 GG6
115 GG7
116 R6 R7 R8
117 GG1
121 M1‐M2 M3 M4 M5 M6
122 N2
123 KK1
124 N5 KK2
125 KK3 KK4 KK5 KK6 KK7 KK8
126 JJ6 JJ8 (JJ4 JJ5 JJ7) 127 JJ1 JJ2
128 JJ3
Listed below are the technology standards for grades nine through twelve You are to make every effort to incorporate the applicable standards into your daily classroom lessons These standards should be noted in your lesson plans
Alabama Technology Standards Ninth ndash Twelfth Grade
Operations and Concepts
Students will
2 Diagnose hardware and software problems Examples viruses error messages Applying strategies to correct malfunctioning hardware and software Performing routine hardware maintenance Describing the importance of antivirus and security software
3 Demonstrate advanced technology skills including compressing converting importing exporting and backing up files Transferring data among applications Demonstrating digital file transfer Examples attaching uploading downloading
4 Utilize advanced features of word processing software including outlining tracking changes hyperlinking and mail merging
5 Utilize advanced features of spreadsheet software including creating charts and graphs sorting and filtering data creating formulas and applying functions
6 Utilize advanced features of multimedia software including image video and audio editing
Digital Citizenship
9 Practice ethical and legal use of technology systems and digital content Explaining consequences of illegal and unethical use of technology systems and digital content Examples cyberbullying plagiarism Interpreting copyright laws and policies with regard to ownership and use of digital content Citing sources of digital content using a style manual Examples Modern Language Association (MLA) American Psychological Association (APA)
Research and Information Fluency
11 Critique digital content for validity accuracy bias currency and relevance
Communication and Collaboration
12 Use digital tools to publish curriculum‐related content Examples Web page authoring software coding software wikis blogs podcasts
13 Demonstrate collaborative skills using curriculum‐related content in digital environments Examples completing assignments online interacting with experts and peers in a structured online learning environment
Critical Thinking Problem Solving and Decision Making
14 Use digital tools to defend solutions to authentic problems Example disaggregating data electronically
Creativity and Innovation
1 Create a product that integrates information from multiple software applications Example pasting spreadsheet‐generated charts into a presentation

Huntsville City Schools
Pacing Guide 2017 - 2018
Algebra IA Ninth Grade
Third Nine Weeks
Linear Functions (focus on linear) Approximate
Standard Resources
Pacing Number of Days 41
days
Interpret functions that arise in applications in terms of the context (Linear) ALCOS 30 Calculate and interpret the average rate of change of a Pearson (textbook) 5-1 function (presented symbolically or as a table) over a specified interval Estimate the rate of change from a graph [F-IF6] Other
LTF Walk the Line (MG) LTF Average Rate of Change (MG) LTF Calculating Average Rate of Change LTF Slope Investigation
Analyze functions using different representations (Linear) ALCOS 31 Graph functions expressed symbolically and show key features of the graph by hand in simple cases and using technology for more complicated cases [F-IF7]
a Graph linear and quadratic functions and show intercepts maxima and minima [F-IF7a]
Pearson (textbook) 5-3 5-4 5-5 5-8
ALCOS 32 Write a function defined by an expression in different but equivalent forms to reveal and explain different properties of the function [F-IF8]
Pearson (textbook)
ALCOS 33 Compare properties of two functions each represented in a different way (algebraically graphically numerically in tables or by verbal descriptions) [F-IF9]
Example Given a graph of one quadratic function and an algebraic expression for another say which has the larger maximum
Pearson (textbook) 5-5
Other LTF Analysis of Functions LTF Translations of Linear Functions
Build new functions from existing functions (Linear) ALCOS 36 Identify the effect on the graph of replacing f(x) by f(x) + k k f(x) f(kx) and f(x + k) for specific values of k (both positive and negative) find the value of k given the graphs Experiment with cases and illustrate an explanation of the effects on the graph using technology Include recognizing even and odd functions from their graphs and algebraic expressions for them [F-BF3]
Pearson (textbook) 5-3 CB 5-3 5-4 5-8
Linear Models Construct and compare linear models and solve problems ALCOS 37 Distinguish between situations that can be modeled with linear functions and with exponential functions [F-LE1]
a Prove that linear functions grow by equal differences over equal intervals and that exponential functions grow by equal factors over equal intervals [F-LE1a]
Pearson (textbook)
ALCOS 37 Distinguish between situations that can be modeled with linear functions and with exponential functions [F-LE1]
b Recognize situations in which one quantity changes at a constant rate per unit interval relative to another [F-LE1b]
Pearson (textbook) 5-1
Other LTF Walk the Line (MG) LTF Average Rate of Change (MG) LTF Calculating Average Rate of Change LTF Slope Investigation
ALCOS 38 Construct linear and exponential functions including arithmetic and geometric sequences given a graph a description of a relationship or two input-output pairs (include reading these from a table) [F-LE2]
Pearson (textbook) 4-7 5-3 5-4 5-5
interpret expressions for functions in terms of the situation they model (Linear and exponential of form f(x) = DD D ALCOS 40 Interpret the parameters in a linear or exponential function in terms of a context [F-LE5]
Pearson (textbook) 5-3 5-4 5-5 5-7
Other LTF Exponential Function Exploration LTF Exponential Growth (Found under
Mathematical Foundations)
Other Resources for Chapter 5 Dan Meyer Penny Circle
Huntsville City Schools
Pacing Guide 2017 - 2018
Algebra IA Ninth Grade
Fourth Nine Weeks
Systems Sequences Statistics amp Probability
Standard Resources
Approximate Pacing
Number of Days 52
Unit Systems of Equations amp Inequalities
Reasoning with Equations and Inequalities
Solve systems of equations (Linear‐linear)
ALCOS 19 Prove that given a system of two equations in two variables replacing one equation by the sum of that equation and a multiple of the other produces a system with the same solutions [A-REI5]
Pearson (textbook) 6-3
Other
LTF Painting the House LTF Solving systems of Linear Equations
ALCOS 20 Solve systems of linear equations exactly and approximately (eg with graphs) focusing on pairs of linear equations in two variables [A-REI6]
Pearson (textbook) 6-1 6-2 6-3 6-4
Other LTF Painting the House LTF Solving systems of Linear Equations
Represent and solve equations and inequalities graphically (Linear learn as general principle) ALCOS 22 Understand that the graph of an equation in two Pearson (textbook) 1-9 4-2 4-3 4-4 variables is the set of all its solutions plotted in the coordinate plane often forming a curve (which could be a line) [A-REI10] Other
LTF Connecting a Verbal Description to Table and Graph
LTF Discrete and Continuous Data
ALCOS 23 Explain why the x-coordinates of the points where the graphs of the equations y = f(x) and y = g(x) intersect are the solutions of the equation f(x) = g(x) find the solutions
Pearson (textbook) CB 4-4 CB 6-1 7-6
approximately eg using technology to graph the functions make tables of values or find successive approximations Include cases where f(x) andor g(x) are linear polynomial rational absolute value exponential and logarithmic functions [A-REI11] ALCOS 24 Graph the solutions to a linear inequality in two variables as a half-plane (excluding the boundary in the case of a strict inequality) and graph the solution set to a system of linear inequalities in two variables as the intersection of the corresponding half-planes [A-REI12]
Pearson (textbook) 6-5 6-6 CB 6-6
Other LTF Maximizing Profit
Unit Sequences Building Functions Build a function that models a relationship between two quantities (For standards 34 and 35 linear) ALCOS 34 Write a function that describes a relationship between two quantities [F-BF1]
a Determine an explicit expression a recursive process or steps for calculation from a context [F-BF1a]
Pearson (textbook) 4-7 5-3 5-4 5-5
Other LTF Write the equation of the Line Review
ALCOS 34 Write a function that describes a relationship between two quantities [F-BF1]
b Combine standard function types using arithmetic operations [F-BF1b] Example Build a function that models the temperature of a cooling body by adding a constant function to a decaying exponential and relate these functions to the model
Pearson (textbook)
ALCOS 35 Write arithmetic and geometric sequences both Pearson (textbook) 4-7 7-8 recursively and with an explicit formula use them to model situations and translate between the two forms [F-BF2] Other
LTF Arithmetic Sequences (MG) LTF Writing Equations Using Sequences
Unit Statistics amp Probability Interpreting Categorical and Quantitative Data
Summarize represent and interpret data on two categorical and quantitative variables (Linear focus discuss general principle) ALCOS 45 Represent data on two quantitative variables on a scatter plot and describe how the variables are related [S-ID6]
a Fit a function to the data use functions fitted to data to solve problems in the context of data Use given function or choose a function suggested by the context Emphasize linear quadratic and exponential models [S-ID6a]
Pearson (textbook) 5-7
Other
LTF Fitting a Line to Data LTF Use Dotplots
ALCOS 45 Represent data on two quantitative variables on a Pearson (textbook) CB 5-7 scatter plot and describe how the variables are related [S-ID6]
Other b Informally assess the fit of a function by plotting and LTF Fitting a Line to Data
analyzing residuals LTF Use Dotplots
ALCOS 45 Represent data on two quantitative variables on a scatter plot and describe how the variables are related [S-ID6]
c Fit a linear function for scatter plot that suggests a linear association [S-ID6c]
Pearson (textbook) 5-7
Other
LTF Fitting a Line to Data LTF Use Dotplots
Interpret Linear Models
ALCOS 46 Interpret the slope (rate of change) and intercept (constant term) of a linear model in the context of the data [S-ID7]
Pearson (textbook) 5-7
Other LTF Calculating Average Rate of Change LTF Slope Investigation
Other Resources for Chapter 6 Dan Meyer Circle-Square
Other Resources for Chapter 7 Non LTF Lesson available on apluscollegereadycom How do you start and how do you change
Dan Meyer Super Stairs
IXL-Pearson Correlation Assignments Pearson Chapter‐Section IXL Assignments Pearson Chapter‐Section IXL Assignments
11 I1 I4 47 P1‐P7
12 B1 B3 B7 (Possibly V1 amp V8) 51 S2 S3 S4
13 A1 A2 A4 52 R1 R2 R3 R4 R5
14 H1 H2 H3 H4 53 S5 S6 S7 S8
15 B2 B4 B6 54 S17 S18 S19
16 A3 A7 B5 55 S12 S13 S14
17 (none) 56 S20 S21
18 I5 I6 I7 57 N6
19 J2 58 DD1 DD2 DD3 DD4
21 J3 61 U1 U2 U4
22 J4 62 U8
23 J5 63 U5 U10
24 J6 64 U3 U9 U11 U13 U14 U15
25 S9 65 T1 T2 T3 T4
26 C1 C2 C3 (C4) 66 T5 T6
27 C5 C6 71 V3
28 C7 72 V4
29 D1 D2 D3 73 V7
210 D4 D5 D6 D7 D8 74 V5 V6 V9
31 K1 K2 K3 75 V10
32 K4 76 X1 X2
33 K5 (Mix of 32‐32 K6 K7) 77 X3
34 K8 K9 K10 K11 78 P1‐P7
35 (none) 81 (Review with Y1‐Y5) Z1 Z4 Z5
36 K12 K13 K14 K15 82 Z6 Z10 AA1 AA2
37 L1 L2 L3 L4 83 Z8
38 (none) 84 Z9
41 Q1 85 AA3
42 Q3 Q13 Q14 86 AA4
43 S1 Q4 Q5 Q6 87 AA5
44 Q7 Q8 Q9 88 AA7 (AA8 is good review at this point) 45 Q10 91 BB1 BB2
46 Q2 92 BB3
Pearson Chapter‐Section IXL Assignments 93 BB4 BB5
94 BB6
95 BB7 BB8
96 BB9 BB10
97 CC1 CC2
98 BB11
101 (none) 102 EE1 EE2
103 EE3 EE4 EE5 EE6 EE7
104 FF1 FF2 FF3 FF4
105 (none) 111 GG3
112 GG4
113 GG5
114 GG6
115 GG7
116 R6 R7 R8
117 GG1
121 M1‐M2 M3 M4 M5 M6
122 N2
123 KK1
124 N5 KK2
125 KK3 KK4 KK5 KK6 KK7 KK8
126 JJ6 JJ8 (JJ4 JJ5 JJ7) 127 JJ1 JJ2
128 JJ3
Listed below are the technology standards for grades nine through twelve You are to make every effort to incorporate the applicable standards into your daily classroom lessons These standards should be noted in your lesson plans
Alabama Technology Standards Ninth ndash Twelfth Grade
Operations and Concepts
Students will
2 Diagnose hardware and software problems Examples viruses error messages Applying strategies to correct malfunctioning hardware and software Performing routine hardware maintenance Describing the importance of antivirus and security software
3 Demonstrate advanced technology skills including compressing converting importing exporting and backing up files Transferring data among applications Demonstrating digital file transfer Examples attaching uploading downloading
4 Utilize advanced features of word processing software including outlining tracking changes hyperlinking and mail merging
5 Utilize advanced features of spreadsheet software including creating charts and graphs sorting and filtering data creating formulas and applying functions
6 Utilize advanced features of multimedia software including image video and audio editing
Digital Citizenship
9 Practice ethical and legal use of technology systems and digital content Explaining consequences of illegal and unethical use of technology systems and digital content Examples cyberbullying plagiarism Interpreting copyright laws and policies with regard to ownership and use of digital content Citing sources of digital content using a style manual Examples Modern Language Association (MLA) American Psychological Association (APA)
Research and Information Fluency
11 Critique digital content for validity accuracy bias currency and relevance
Communication and Collaboration
12 Use digital tools to publish curriculum‐related content Examples Web page authoring software coding software wikis blogs podcasts
13 Demonstrate collaborative skills using curriculum‐related content in digital environments Examples completing assignments online interacting with experts and peers in a structured online learning environment
Critical Thinking Problem Solving and Decision Making
14 Use digital tools to defend solutions to authentic problems Example disaggregating data electronically
Creativity and Innovation
1 Create a product that integrates information from multiple software applications Example pasting spreadsheet‐generated charts into a presentation
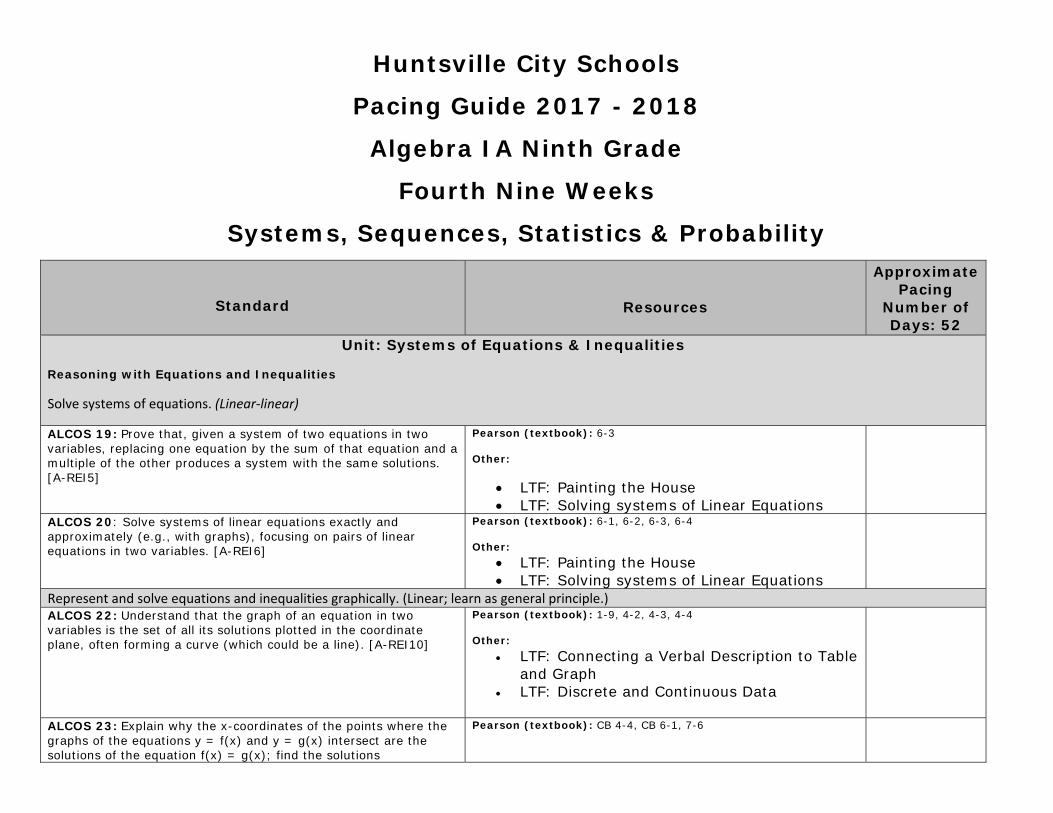
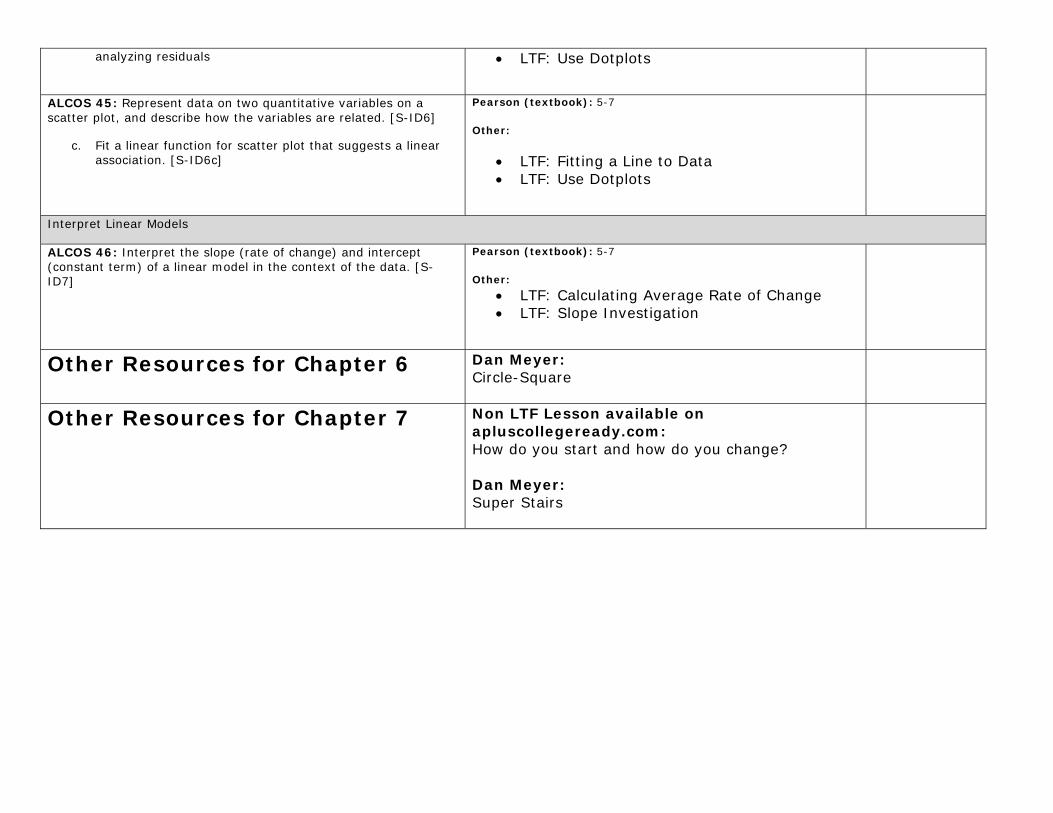
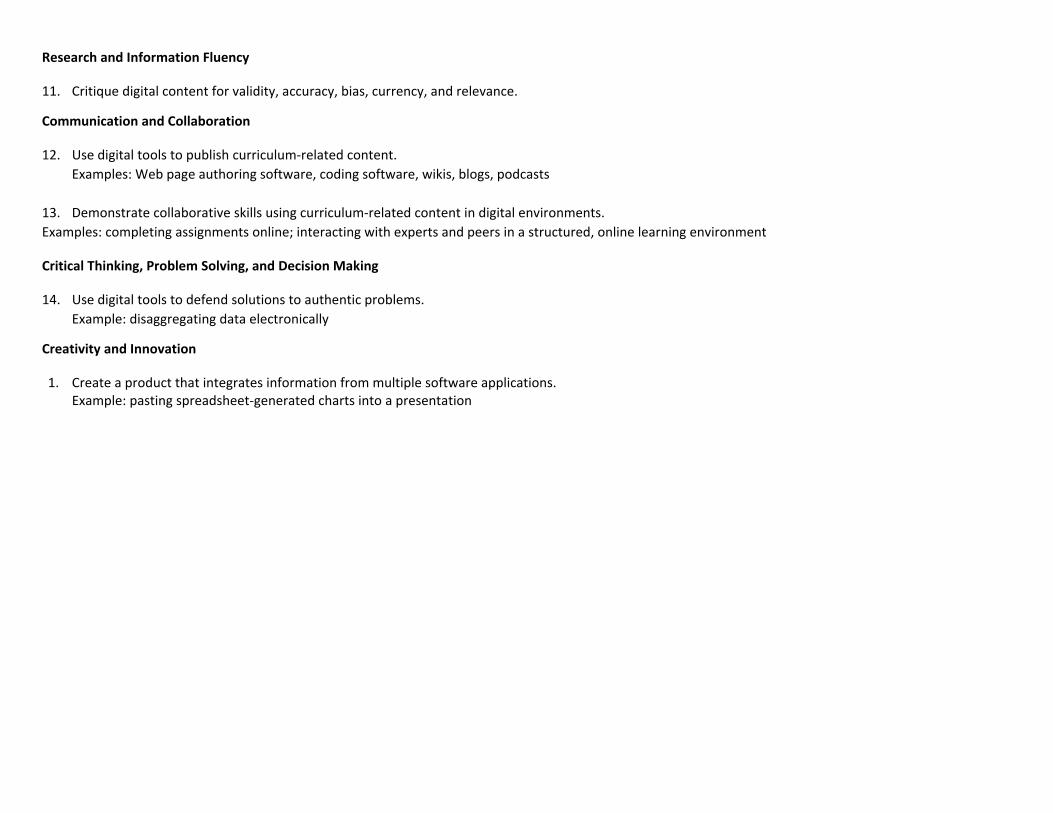