algebra 1 honors curriculum pacing guide 2013 2014 … · 2013-08-08 · algebra 1 honors –...
TRANSCRIPT
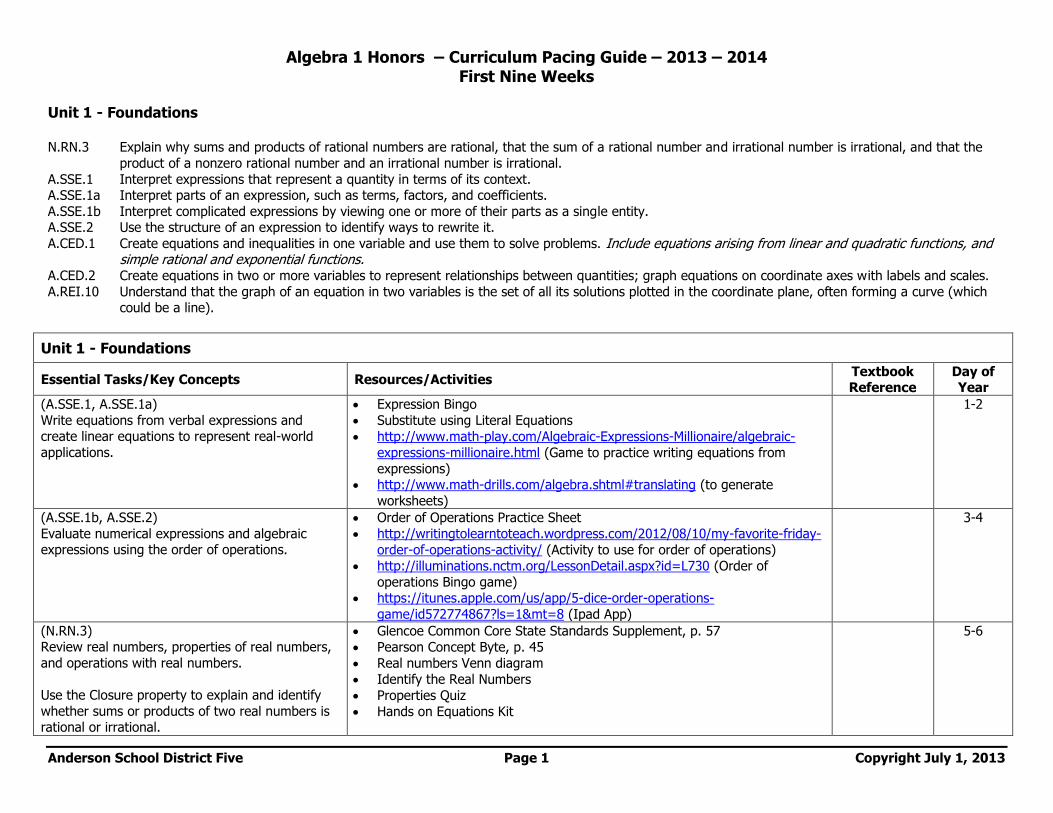
Algebra 1 Honors – Curriculum Pacing Guide – 2013 – 2014 First Nine Weeks
Anderson School District Five Page 1 Copyright July 1, 2013
Unit 1 - Foundations N.RN.3 Explain why sums and products of rational numbers are rational, that the sum of a rational number and irrational number is irrational, and that the
product of a nonzero rational number and an irrational number is irrational.
A.SSE.1 Interpret expressions that represent a quantity in terms of its context. A.SSE.1a Interpret parts of an expression, such as terms, factors, and coefficients.
A.SSE.1b Interpret complicated expressions by viewing one or more of their parts as a single entity. A.SSE.2 Use the structure of an expression to identify ways to rewrite it.
A.CED.1 Create equations and inequalities in one variable and use them to solve problems. Include equations arising from linear and quadratic functions, and simple rational and exponential functions.
A.CED.2 Create equations in two or more variables to represent relationships between quantities; graph equations on coordinate axes with labels and scales.
A.REI.10 Understand that the graph of an equation in two variables is the set of all its solutions plotted in the coordinate plane, often forming a curve (which could be a line).
Unit 1 - Foundations
Essential Tasks/Key Concepts Resources/Activities Textbook Reference
Day of Year
(A.SSE.1, A.SSE.1a)
Write equations from verbal expressions and create linear equations to represent real-world
applications.
Expression Bingo
Substitute using Literal Equations
http://www.math-play.com/Algebraic-Expressions-Millionaire/algebraic-
expressions-millionaire.html (Game to practice writing equations from
expressions) http://www.math-drills.com/algebra.shtml#translating (to generate
worksheets)
1-2
(A.SSE.1b, A.SSE.2)
Evaluate numerical expressions and algebraic expressions using the order of operations.
Order of Operations Practice Sheet
http://writingtolearntoteach.wordpress.com/2012/08/10/my-favorite-friday-
order-of-operations-activity/ (Activity to use for order of operations)
http://illuminations.nctm.org/LessonDetail.aspx?id=L730 (Order of
operations Bingo game) https://itunes.apple.com/us/app/5-dice-order-operations-
game/id572774867?ls=1&mt=8 (Ipad App)
3-4
(N.RN.3) Review real numbers, properties of real numbers,
and operations with real numbers.
Use the Closure property to explain and identify
whether sums or products of two real numbers is rational or irrational.
Glencoe Common Core State Standards Supplement, p. 57
Pearson Concept Byte, p. 45
Real numbers Venn diagram
Identify the Real Numbers
Properties Quiz
Hands on Equations Kit
5-6
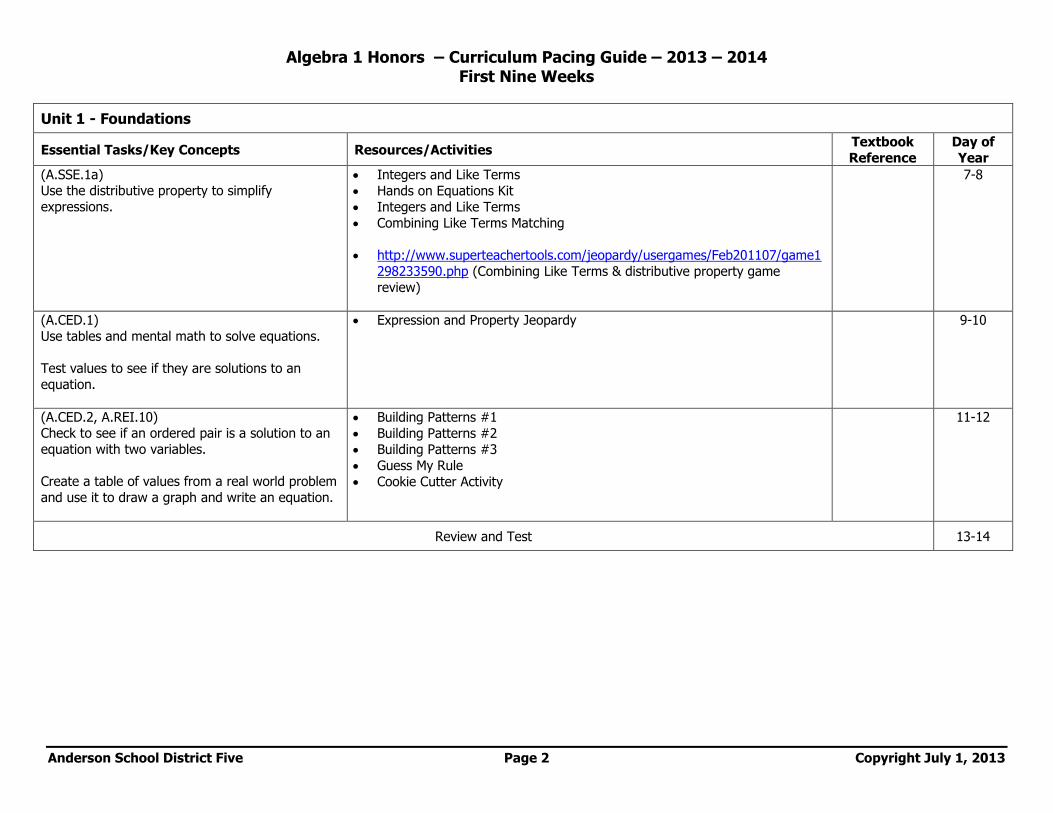
Algebra 1 Honors – Curriculum Pacing Guide – 2013 – 2014 First Nine Weeks
Anderson School District Five Page 2 Copyright July 1, 2013
Unit 1 - Foundations
Essential Tasks/Key Concepts Resources/Activities Textbook
Reference
Day of
Year
(A.SSE.1a) Use the distributive property to simplify
expressions.
Integers and Like Terms
Hands on Equations Kit
Integers and Like Terms
Combining Like Terms Matching
http://www.superteachertools.com/jeopardy/usergames/Feb201107/game1
298233590.php (Combining Like Terms & distributive property game
review)
7-8
(A.CED.1)
Use tables and mental math to solve equations.
Test values to see if they are solutions to an
equation.
Expression and Property Jeopardy 9-10
(A.CED.2, A.REI.10) Check to see if an ordered pair is a solution to an
equation with two variables.
Create a table of values from a real world problem
and use it to draw a graph and write an equation.
Building Patterns #1
Building Patterns #2
Building Patterns #3
Guess My Rule
Cookie Cutter Activity
11-12
Review and Test 13-14
Algebra 1 Honors – Curriculum Pacing Guide – 2013 – 2014 First Nine Weeks
Anderson School District Five Page 3 Copyright July 1, 2013
Unit 2 – Solving Equations N.Q.1 Use units as a way to understand problems and to guide the solution of multi-step problems; choose and interpret units consistently in formulas;
choose and interpret the scale and the origin in graphs and data displays.
N.Q.2 Define appropriate quantities for the purpose of descriptive modeling. N.Q.3 Choose a level of accuracy appropriate to limitations on measurement when reporting quantities.
A.CED.1 Create equations and inequalities in one variable and use them to solve problems. Include equations arising from linear and quadratic functions, and simple rational and exponential functions.
A.CED.4 Rearrange formulas to highlight a quantity of interest, using the same reasoning as in solving equations.
A.REI.1 Explain each step in solving a simple equation as following from the equality of numbers asserted at the previous step, starting from the assumption that the original equation has a solution. Construct a viable argument to justify a solution method.
A.REI.3 Solve linear equations and inequalities in one variable, including equations with coefficients represented by letters.
Unit 2 – Solving Equations
Essential Tasks/Key Concepts Resources/Activities Textbook
Reference
Day of
Year
(A.CED.1, A.REI.3) Model one step equations using either algebra tiles
or Hands on Equations.
Solve one-step equations in one variable.
Create one-step equations to solve real-world
problems.
Algebra Tiles
Hands on Equations
Equation Frames
Equation Bingo
Fractions and Decimals – One Step Equations
http://www.quia.com/mc/540939.html (Game to match equation &
solution)
http://www.quia.com/cc/540939.html (Concentration game to practice
solving) http://www.math-play.com/One-Step-Equation-Game.html (Game to solve)
15
(A.CED.1, A.REI.1, A.REI.3)
Model and solve two-step equations in one variable.
Create two-step equations in one variable to solve
real-world problems.
http://www.math-play.com/One-Step-Equation-Game.html (Game to solve)
http://www.onlinemathlearning.com/solving-two-step-equations-
integers.html (Game to practice solving)
http://www.onlinemathlearning.com/solving-two-step-equations-
fractions.html (Solving with fractions)
16

Algebra 1 Honors – Curriculum Pacing Guide – 2013 – 2014 First Nine Weeks
Anderson School District Five Page 4 Copyright July 1, 2013
Unit 2 – Solving Equations
Essential Tasks/Key Concepts Resources/Activities Textbook
Reference
Day of
Year
(A.CED.1, A.REI.1, A.REI.3) Model and solve multi-step equations in one
variable.
Create multi-step equations in one variable to
solve real-world problems.
Equation Word Problems
Distributive Equations
http://www.onlinemathlearning.com/solving-multple-step-equations.html
(Game to practice)
17
(A.CED.1, A.REI.1, A.REI.3)
Model and solve equations with variables on both sides and use them to solve real-world problems.
Solving Equations Exam Review
Problem Solving Equations
Sums of Consecutive Integers
Word Problems
http://www.onlinemathlearning.com/solving-equations-techniques.html
(Game to practice solving) http://love4thgrade.blogspot.com/2012/03/diy-learning-games-with-
minimal.html (clothespin game to solve)
18
(N.Q.1, A.CED.1, A.CED.4, A.REI.1, A.REI.3)
Rewrite and use literal equations to solve real-
world problems.
Literal Equation Manipulative
Substitution and Simplifying Literal Equations
http://mathequalslove.blogspot.com/2013/06/literal-equations-scavenger-
hunt.html (Scavenger Hunt)
http://www.quia.com/cb/77775.html (Jeopardy type review of all
equations)
19
(N.Q.1, N.Q.2)
Find unit rates and use dimensional analysis to convert units.
Use unit analysis to solve real-world problems.
Dimensional Analysis Challenge
http://www.yummymath.com/2011/cheesy-goldfish/ (Compare unit costs of
goldfish)
20
Algebra 1 Honors – Curriculum Pacing Guide – 2013 – 2014 First Nine Weeks
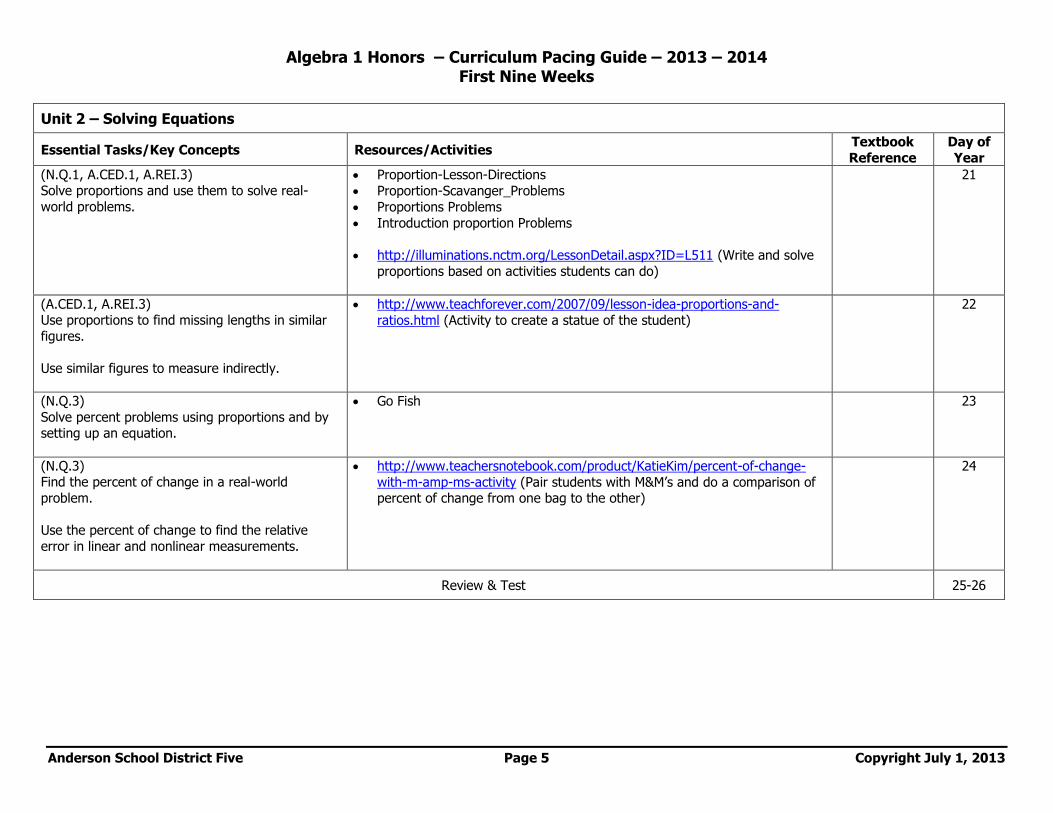
Anderson School District Five Page 5 Copyright July 1, 2013
Unit 2 – Solving Equations
Essential Tasks/Key Concepts Resources/Activities Textbook
Reference
Day of
Year
(N.Q.1, A.CED.1, A.REI.3) Solve proportions and use them to solve real-
world problems.
Proportion-Lesson-Directions
Proportion-Scavanger_Problems
Proportions Problems
Introduction proportion Problems
http://illuminations.nctm.org/LessonDetail.aspx?ID=L511 (Write and solve
proportions based on activities students can do)
21
(A.CED.1, A.REI.3) Use proportions to find missing lengths in similar
figures.
Use similar figures to measure indirectly.
http://www.teachforever.com/2007/09/lesson-idea-proportions-and-
ratios.html (Activity to create a statue of the student)
22
(N.Q.3)
Solve percent problems using proportions and by setting up an equation.
Go Fish 23
(N.Q.3) Find the percent of change in a real-world
problem.
Use the percent of change to find the relative
error in linear and nonlinear measurements.
http://www.teachersnotebook.com/product/KatieKim/percent-of-change-
with-m-amp-ms-activity (Pair students with M&M’s and do a comparison of percent of change from one bag to the other)
24
Review & Test 25-26
Algebra 1 Honors – Curriculum Pacing Guide – 2013 – 2014 First Nine Weeks
Anderson School District Five Page 6 Copyright July 1, 2013
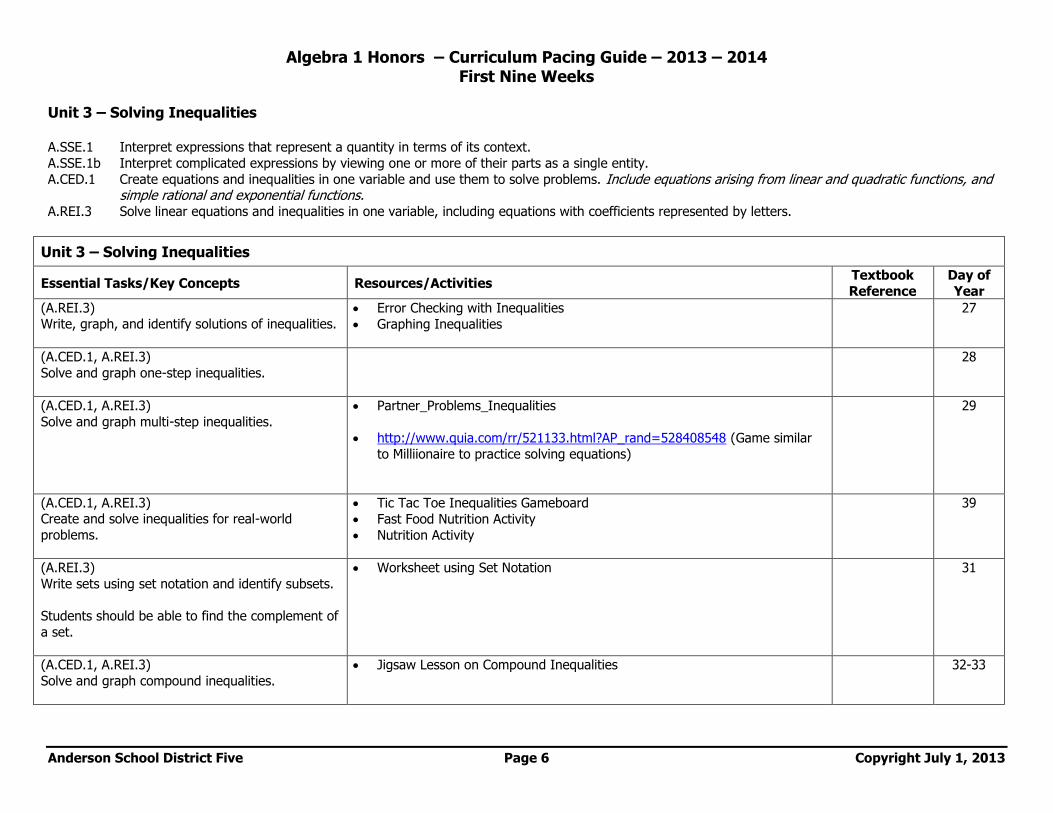
Unit 3 – Solving Inequalities A.SSE.1 Interpret expressions that represent a quantity in terms of its context.
A.SSE.1b Interpret complicated expressions by viewing one or more of their parts as a single entity.
A.CED.1 Create equations and inequalities in one variable and use them to solve problems. Include equations arising from linear and quadratic functions, and simple rational and exponential functions.
A.REI.3 Solve linear equations and inequalities in one variable, including equations with coefficients represented by letters.
Unit 3 – Solving Inequalities
Essential Tasks/Key Concepts Resources/Activities Textbook
Reference
Day of
Year
(A.REI.3) Write, graph, and identify solutions of inequalities.
Error Checking with Inequalities
Graphing Inequalities
27
(A.CED.1, A.REI.3)
Solve and graph one-step inequalities.
28
(A.CED.1, A.REI.3)
Solve and graph multi-step inequalities.
Partner_Problems_Inequalities
http://www.quia.com/rr/521133.html?AP_rand=528408548 (Game similar
to Milliionaire to practice solving equations)
29
(A.CED.1, A.REI.3) Create and solve inequalities for real-world
problems.
Tic Tac Toe Inequalities Gameboard
Fast Food Nutrition Activity
Nutrition Activity
39
(A.REI.3)
Write sets using set notation and identify subsets.
Students should be able to find the complement of
a set.
Worksheet using Set Notation 31
(A.CED.1, A.REI.3)
Solve and graph compound inequalities.
Jigsaw Lesson on Compound Inequalities 32-33
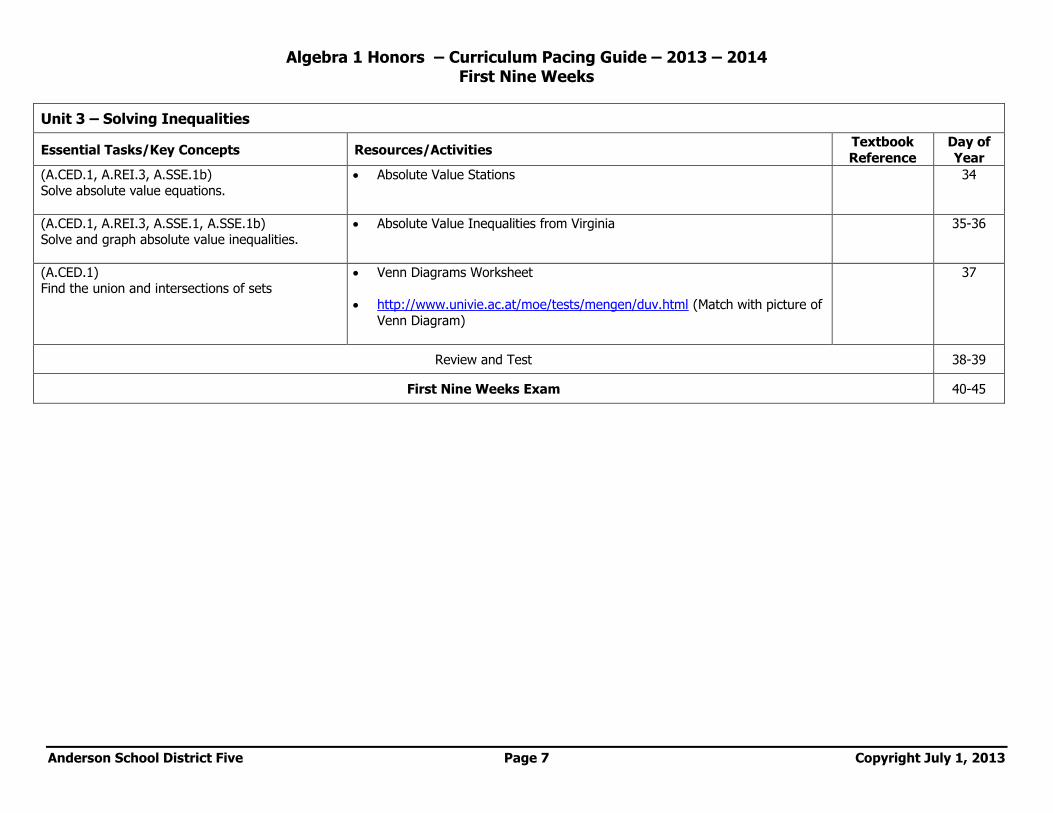
Algebra 1 Honors – Curriculum Pacing Guide – 2013 – 2014 First Nine Weeks
Anderson School District Five Page 7 Copyright July 1, 2013
Unit 3 – Solving Inequalities
Essential Tasks/Key Concepts Resources/Activities Textbook
Reference
Day of
Year
(A.CED.1, A.REI.3, A.SSE.1b) Solve absolute value equations.
Absolute Value Stations 34
(A.CED.1, A.REI.3, A.SSE.1, A.SSE.1b) Solve and graph absolute value inequalities.
Absolute Value Inequalities from Virginia 35-36
(A.CED.1) Find the union and intersections of sets
Venn Diagrams Worksheet
http://www.univie.ac.at/moe/tests/mengen/duv.html (Match with picture of
Venn Diagram)
37
Review and Test 38-39
First Nine Weeks Exam 40-45
Algebra 1 Honors – Curriculum Pacing Guide – 2013 – 2014 First Nine Weeks
Anderson School District Five Page 8 Copyright July 1, 2013
Algebra 1 Honors – Curriculum Pacing Guide – 2013 – 2014 Second Nine Weeks
Anderson School District Five Page 9 Copyright July 1, 2013
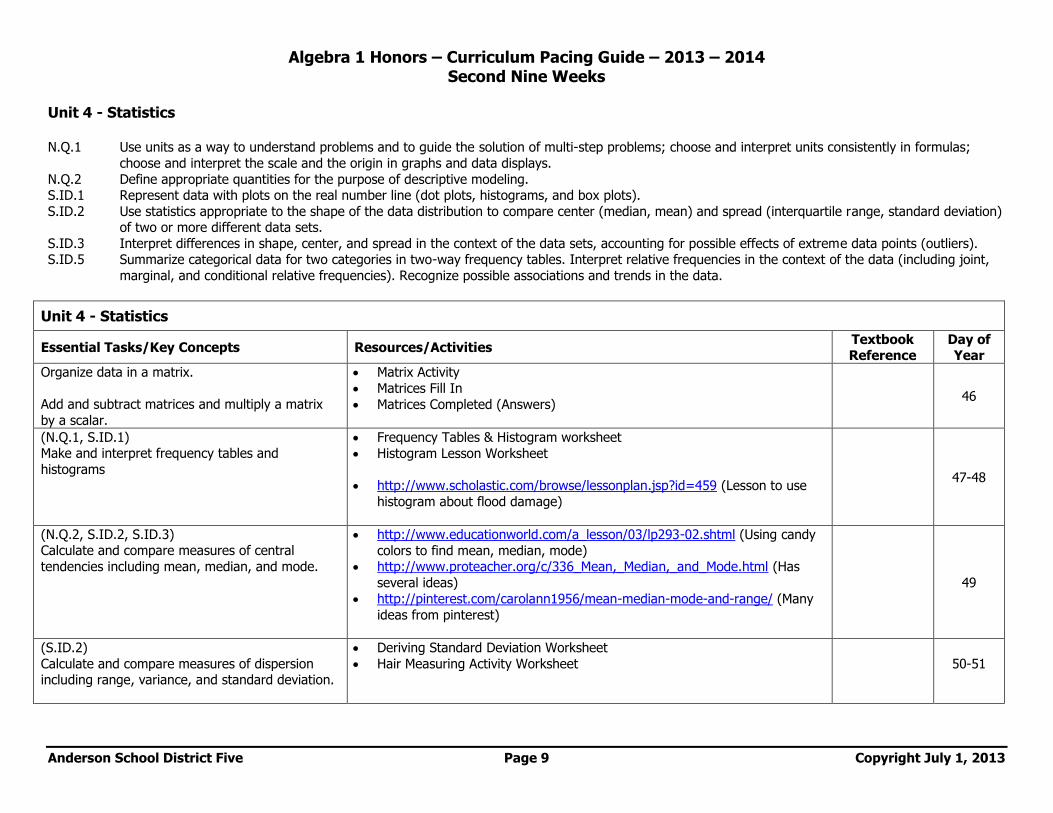
Unit 4 - Statistics N.Q.1 Use units as a way to understand problems and to guide the solution of multi-step problems; choose and interpret units consistently in formulas;
choose and interpret the scale and the origin in graphs and data displays.
N.Q.2 Define appropriate quantities for the purpose of descriptive modeling. S.ID.1 Represent data with plots on the real number line (dot plots, histograms, and box plots).
S.ID.2 Use statistics appropriate to the shape of the data distribution to compare center (median, mean) and spread (interquartile range, standard deviation) of two or more different data sets.
S.ID.3 Interpret differences in shape, center, and spread in the context of the data sets, accounting for possible effects of extreme data points (outliers). S.ID.5 Summarize categorical data for two categories in two-way frequency tables. Interpret relative frequencies in the context of the data (including joint,
marginal, and conditional relative frequencies). Recognize possible associations and trends in the data.
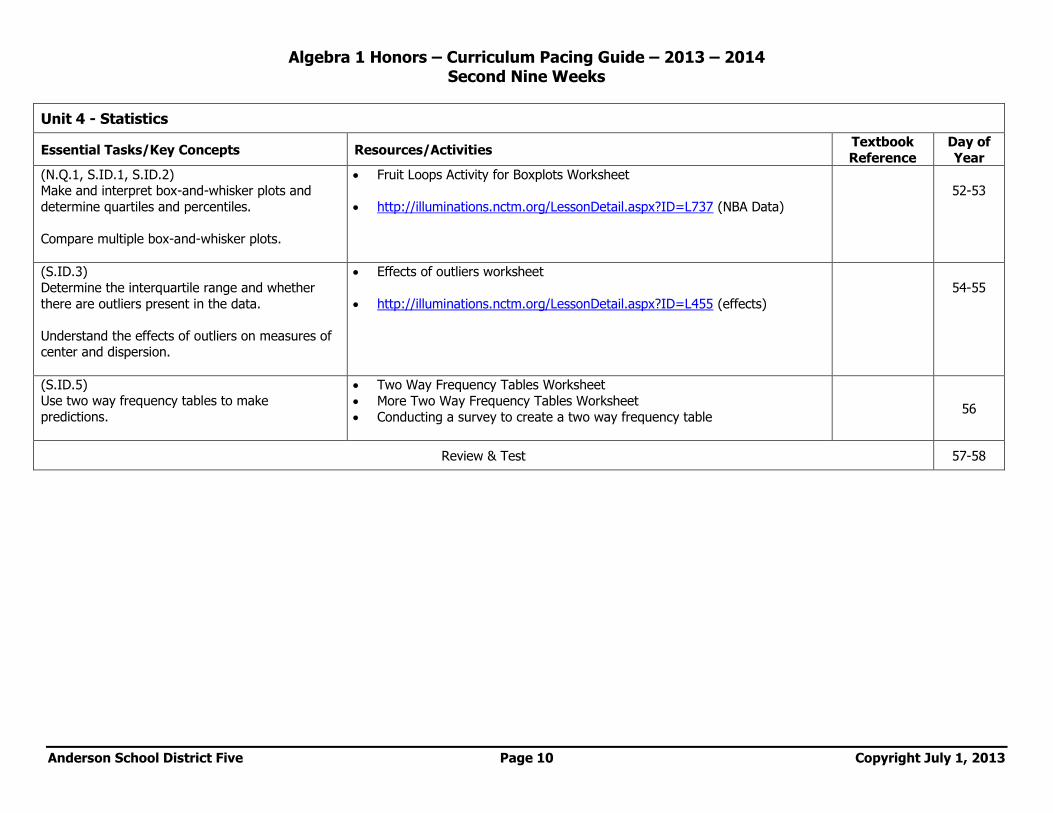
Unit 4 - Statistics
Essential Tasks/Key Concepts Resources/Activities Textbook Reference
Day of Year
Organize data in a matrix.
Add and subtract matrices and multiply a matrix
by a scalar.
Matrix Activity
Matrices Fill In
Matrices Completed (Answers)
46
(N.Q.1, S.ID.1) Make and interpret frequency tables and
histograms
Frequency Tables & Histogram worksheet
Histogram Lesson Worksheet
http://www.scholastic.com/browse/lessonplan.jsp?id=459 (Lesson to use
histogram about flood damage)
47-48
(N.Q.2, S.ID.2, S.ID.3) Calculate and compare measures of central
tendencies including mean, median, and mode.
http://www.educationworld.com/a_lesson/03/lp293-02.shtml (Using candy
colors to find mean, median, mode) http://www.proteacher.org/c/336_Mean,_Median,_and_Mode.html (Has
several ideas)
http://pinterest.com/carolann1956/mean-median-mode-and-range/ (Many
ideas from pinterest)
49
(S.ID.2)
Calculate and compare measures of dispersion including range, variance, and standard deviation.
Deriving Standard Deviation Worksheet
Hair Measuring Activity Worksheet
50-51
Algebra 1 Honors – Curriculum Pacing Guide – 2013 – 2014 Second Nine Weeks
Anderson School District Five Page 10 Copyright July 1, 2013
Unit 4 - Statistics
Essential Tasks/Key Concepts Resources/Activities Textbook
Reference
Day of
Year
(N.Q.1, S.ID.1, S.ID.2) Make and interpret box-and-whisker plots and
determine quartiles and percentiles.
Compare multiple box-and-whisker plots.
Fruit Loops Activity for Boxplots Worksheet
http://illuminations.nctm.org/LessonDetail.aspx?ID=L737 (NBA Data)
52-53
(S.ID.3)
Determine the interquartile range and whether
there are outliers present in the data.
Understand the effects of outliers on measures of center and dispersion.
Effects of outliers worksheet
http://illuminations.nctm.org/LessonDetail.aspx?ID=L455 (effects)
54-55
(S.ID.5) Use two way frequency tables to make
predictions.
Two Way Frequency Tables Worksheet
More Two Way Frequency Tables Worksheet
Conducting a survey to create a two way frequency table 56
Review & Test 57-58
Algebra 1 Honors – Curriculum Pacing Guide – 2013 – 2014 Second Nine Weeks
Anderson School District Five Page 11 Copyright July 1, 2013
Unit 5 – Introduction to Functions N.Q.1 Use units as a way to understand problems and to guide the solution of multi-step problems; choose and interpret units consistently in formulas;
choose and interpret the scale and the origin in graphs and data displays.
N.Q.2 Define appropriate quantities for the purpose of descriptive modeling. A.SSE.1 Interpret expressions that represent a quantity in terms of its context.
A.SSE.1a Interpret parts of an expression, such as terms, factors, and coefficients. A.SSE.1b Interpret complicated expressions by viewing one or more of their parts as a single entity.
A.SSE.2 Use the structure of an expression to identify ways to rewrite it. A.REI.10 Understand that the graph of an equation in two variables is the set of all its solutions plotted in the coordinate plane, often forming a curve (which
could be a straight line). A.REI.11 Explain why the x-coordinates of the points where the graphs of the equations and intersect are the solutions of the equation
; find the solutions approximately, e.g., using technology to graph the functions, make tables of values, or find successive approximations.
Include cases where and/or are linear, polynomial, rational, absolute value, exponential, and logarithmic functions.
F.IF.1 Understand that a function from one set (called the domain) to another set (called the range) assigns to each element of the domain exactly one element of the range. If is a function and is an element of its domain, then denotes the output of corresponding to the input . The
graph of is the graph of the equation . F.IF.2 Use function notation, evaluate functions for inputs in their domains, and interpret statements that use function notation in terms of a context. F.IF.3 Recognize that sequences are functions, sometimes defined recursively, whose domain is a subset of the integers.
F.IF.4 For a function that models a relationship between two quantities, interpret key features of graphs and tables in terms of the quantities, and sketch graphs showing key features given a verbal description of the relationship. Key features include: intercepts; intervals where the function is increasing,
decreasing, positive, ore negative; relative maximums and minimums; symmetries; end behavior; and periodicity.
F.IF.5 Relate the domain of a function to its graph and, where applicable, to the quantitative relationship it describes. F.BF.1 Write a function that describes a relationship between two quantities.
F.BF.1a Determine an explicit expression, a recursive process, or steps for calculation from a context. F.BF.2 Write arithmetic and geometric sequences both recursively and with an explicit formula, use them to model situations, and translate between the two
forms. F.LE.2 Construct linear and exponential functions, including arithmetic and geometric sequences, given a graph, a description of a relationship, or two input-
output pairs (including reading these from a table).
Unit 5 – Introduction to Functions
Essential Tasks/Key Concepts Resources/Activities Textbook Reference
Day of Year
(F.IF.4)
Represent mathematical data using graphs.
Interpreting stories as graphs worksheet
http://map.mathshell.org/materials/download.php?fileid=667 (Lesson on
interpreting stories into graphs)
59

Algebra 1 Honors – Curriculum Pacing Guide – 2013 – 2014 Second Nine Weeks
Anderson School District Five Page 12 Copyright July 1, 2013
Unit 5 – Introduction to Functions
Essential Tasks/Key Concepts Resources/Activities Textbook
Reference
Day of
Year
(A.REI.10, F.IF.4) Identify and represent patterns that describe
linear functions.
Attack of the Worms Worksheet
Parameters of Real Life Modeling Worksheet
Guess My Rule
What’s Your Function Card Game
60
(A.REI.10, F.IF.4)
Identify and represent patterns that describe non-
linear functions.
Quadratic Modeling Worksheet
Basketball Activity for Quadratics Worksheet
61
(N.Q.1, A.REI.10, F.IF.5)
Graph equations that represent linear functions by
using an x|y chart.
Tables of Linear Patterns Worksheet
Graphing Linear Equations and Guess the Rule
http://its.guilford.k12.nc.us/act/grade8/act8.asp?ID=825 (packet that
progresses from x|y charts to solving by hand to using the GC)
62-63
(A.REI.11) Graph a function using a graphing calculator and
use the calculator to solve the equation.
Lines_lines_everywhere on the GC Worksheet
Yoyo & penny problems to explore linear functions worksheet
64
(N.Q.2, A.SSE.1, A.SSE.1a, A.SSE.2)
Translate word problems into equations to
represent the functions.
Cell phones and profit – linear modeling worksheet.
Pass the Basketball Worksheet
Linear Problems Worksheet
65
(F.IF.1, F.IF.2) Determine whether a relation is a function. Find
the domain and range and use function notation.
Linear Functions and patterns, tables and graphs Worksheet
Function Basics Worksheet
Algebra Discovery Activities (has 48 pages of ideas)
Function Bridge
Function Flow Chart
Function Web
Function Notation
66
(A.SSE.1, A.SSE.1a, A.SSE.1b, F.IF.3. F.BF.1,
F.BF.1a, F.BF.2, F.LE.2) Identify and extend patterns in sequences.
Use function notation to represent arithmetic sequences.
Linear Relationships
Linear Function Application Problems
http://transformededucator.blogspot.com/2011/09/arithmetic-series-bucky-
badger.html (Introduction to arithmetic sequences)
67-68
Review & Test 69-70

Algebra 1 Honors – Curriculum Pacing Guide – 2013 – 2014 Second Nine Weeks
Anderson School District Five Page 13 Copyright July 1, 2013
Unit 6 – Linear Functions N.Q.1 Use units as a way to understand problems and to guide the solution of multi-step problems; choose and interpret units consistently in formulas;
choose and interpret the scale and the origin in graphs and data displays.
N.Q.2 Define appropriate quantities for the purpose of descriptive modeling. A.SSE.1 Interpret expressions that represent a quantity in terms of its context.
A.SSE.1a Interpret parts of an expression, such as terms, factors, and coefficients. A.SSE.2 Use the structure of an expression to identify ways to rewrite it.
A.CED.2 Create equations in two or more variables to represent relationships between quantities; graph equations on coordinate axes with labels and scales. F.IF.4 For a function that models a relationship between two quantities, interpret key features of graphs and tables in terms of the quantities, and sketch
graphs showing key features given a verbal description of the relationship. Key features include: intercepts; intervals where the function is increasing,
decreasing, positive, ore negative; relative maximums and minimums; symmetries; end behavior; and periodicity. F.IF.6 Calculate and interpret the average rate of change of a function (presented symbolically or as a table) over a specified interval. Estimate the rate of
change from a graph. F.IF.7 Graph functions expressed symbolically and show key features of the graph, by hand in simple cases and using technology for more complicated
cases.
F.IF.7a Graph linear and quadratic functions and show intercepts, maxima, and minima. F.IF.7b Graph square root, cube root, and piecewise-defined functions, including step functions and absolute value functions.
F.BF.1a Determine an explicit expression, a recursive process, or steps for calculation from a context. F.BF.3 Identify the effect on the graph of replacing by and for specific values of (both positive and negative); find the
value of given the graphs. Experiment with cases and illustrate an explanation of the effects on the graph using technology.
F.BF.4a Solve an equation of the form for a simple function that has an inverse and write an expression for the inverse.
F.LE.1b Recognize situations in which one quantity changes at a constant rate per unit interval relative to another.
F.LE.2 Construct linear and exponential functions, including arithmetic and geometric sequences, given a graph, a description of a relationship, or two input-output pairs (include reading these from a table).
F.LE.5 Interpret the parameters in a linear or exponential function in terms of a context. G.GPE.5* Prove the slope criteria for parallel and perpendicular lines and use them to solve geometric problems (e.g., find the equation of a line parallel or
perpendicular to a give line that passes through a given point). S.ID.6a Fit a function to the data; use functions fitted to data to solve problems in the context of the data. Use given functions or choose a function suggested
by the context. Emphasize linear, quadratic, and exponential models. S.ID.6b Informally assess the fit of a function by plotting and analyzing residuals. S.ID.7 Interpret the slope (rate of change) and the intercept (constant term) of a linear model in the context of the data.
S.ID.8 Compute (using technology) and interpret the correlation coefficient of a linear fit. S.ID.9 Distinguish between correlation and causation.
Algebra 1 Honors – Curriculum Pacing Guide – 2013 – 2014 Second Nine Weeks
Anderson School District Five Page 14 Copyright July 1, 2013
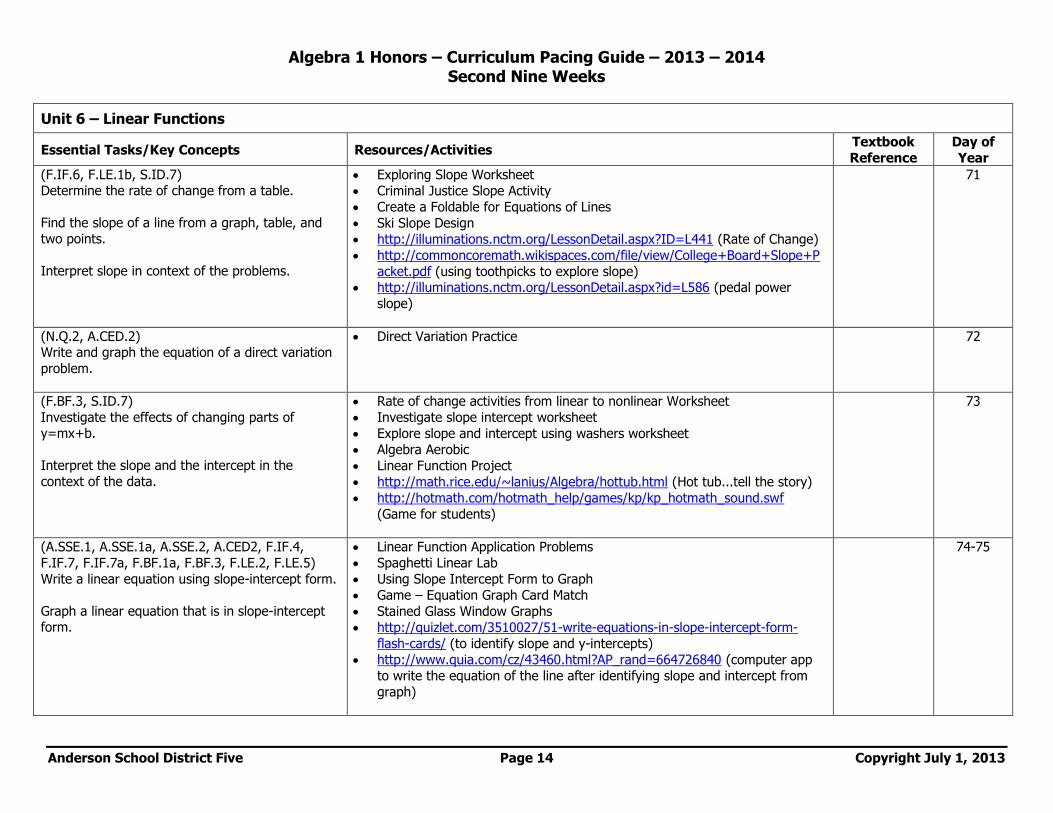
Unit 6 – Linear Functions
Essential Tasks/Key Concepts Resources/Activities Textbook
Reference
Day of
Year
(F.IF.6, F.LE.1b, S.ID.7) Determine the rate of change from a table.
Find the slope of a line from a graph, table, and
two points.
Interpret slope in context of the problems.
Exploring Slope Worksheet
Criminal Justice Slope Activity
Create a Foldable for Equations of Lines
Ski Slope Design
http://illuminations.nctm.org/LessonDetail.aspx?ID=L441 (Rate of Change)
http://commoncoremath.wikispaces.com/file/view/College+Board+Slope+P
acket.pdf (using toothpicks to explore slope) http://illuminations.nctm.org/LessonDetail.aspx?id=L586 (pedal power
slope)
71
(N.Q.2, A.CED.2) Write and graph the equation of a direct variation
problem.
Direct Variation Practice 72
(F.BF.3, S.ID.7)
Investigate the effects of changing parts of y=mx+b.
Interpret the slope and the intercept in the
context of the data.
Rate of change activities from linear to nonlinear Worksheet
Investigate slope intercept worksheet
Explore slope and intercept using washers worksheet
Algebra Aerobic
Linear Function Project
http://math.rice.edu/~lanius/Algebra/hottub.html (Hot tub...tell the story)
http://hotmath.com/hotmath_help/games/kp/kp_hotmath_sound.swf
(Game for students)
73
(A.SSE.1, A.SSE.1a, A.SSE.2, A.CED2, F.IF.4,
F.IF.7, F.IF.7a, F.BF.1a, F.BF.3, F.LE.2, F.LE.5)
Write a linear equation using slope-intercept form.
Graph a linear equation that is in slope-intercept form.
Linear Function Application Problems
Spaghetti Linear Lab
Using Slope Intercept Form to Graph
Game – Equation Graph Card Match
Stained Glass Window Graphs
http://quizlet.com/3510027/51-write-equations-in-slope-intercept-form-
flash-cards/ (to identify slope and y-intercepts)
http://www.quia.com/cz/43460.html?AP_rand=664726840 (computer app
to write the equation of the line after identifying slope and intercept from
graph)
74-75
Algebra 1 Honors – Curriculum Pacing Guide – 2013 – 2014 Second Nine Weeks
Anderson School District Five Page 15 Copyright July 1, 2013
Unit 6 – Linear Functions
Essential Tasks/Key Concepts Resources/Activities Textbook
Reference
Day of
Year
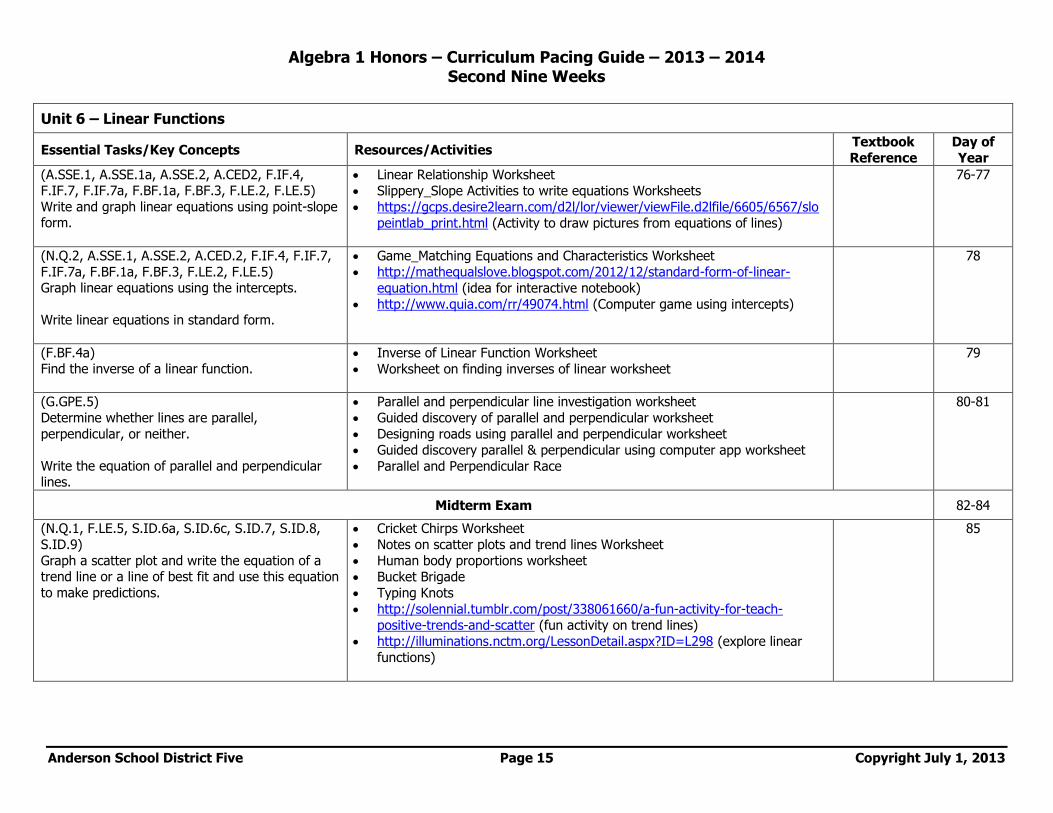
(A.SSE.1, A.SSE.1a, A.SSE.2, A.CED2, F.IF.4, F.IF.7, F.IF.7a, F.BF.1a, F.BF.3, F.LE.2, F.LE.5)
Write and graph linear equations using point-slope form.
Linear Relationship Worksheet
Slippery_Slope Activities to write equations Worksheets
https://gcps.desire2learn.com/d2l/lor/viewer/viewFile.d2lfile/6605/6567/slo
peintlab_print.html (Activity to draw pictures from equations of lines)
76-77
(N.Q.2, A.SSE.1, A.SSE.2, A.CED.2, F.IF.4, F.IF.7,
F.IF.7a, F.BF.1a, F.BF.3, F.LE.2, F.LE.5) Graph linear equations using the intercepts.
Write linear equations in standard form.
Game_Matching Equations and Characteristics Worksheet
http://mathequalslove.blogspot.com/2012/12/standard-form-of-linear-
equation.html (idea for interactive notebook)
http://www.quia.com/rr/49074.html (Computer game using intercepts)
78
(F.BF.4a) Find the inverse of a linear function.
Inverse of Linear Function Worksheet
Worksheet on finding inverses of linear worksheet
79
(G.GPE.5)
Determine whether lines are parallel,
perpendicular, or neither.
Write the equation of parallel and perpendicular lines.
Parallel and perpendicular line investigation worksheet
Guided discovery of parallel and perpendicular worksheet
Designing roads using parallel and perpendicular worksheet
Guided discovery parallel & perpendicular using computer app worksheet
Parallel and Perpendicular Race
80-81
Midterm Exam 82-84
(N.Q.1, F.LE.5, S.ID.6a, S.ID.6c, S.ID.7, S.ID.8,
S.ID.9)
Graph a scatter plot and write the equation of a trend line or a line of best fit and use this equation
to make predictions.
Cricket Chirps Worksheet
Notes on scatter plots and trend lines Worksheet
Human body proportions worksheet
Bucket Brigade
Typing Knots
http://solennial.tumblr.com/post/338061660/a-fun-activity-for-teach-
positive-trends-and-scatter (fun activity on trend lines)
http://illuminations.nctm.org/LessonDetail.aspx?ID=L298 (explore linear
functions)
85
Algebra 1 Honors – Curriculum Pacing Guide – 2013 – 2014 Second Nine Weeks
Anderson School District Five Page 16 Copyright July 1, 2013
Unit 6 – Linear Functions
Essential Tasks/Key Concepts Resources/Activities Textbook
Reference
Day of
Year
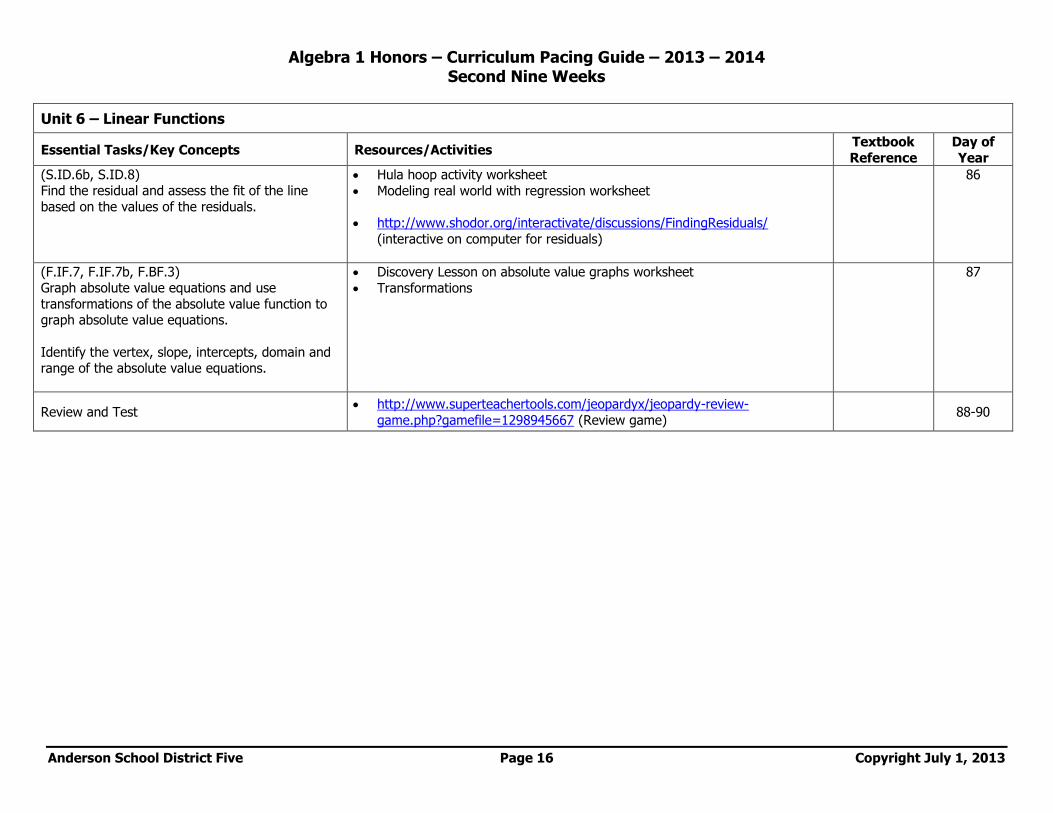
(S.ID.6b, S.ID.8) Find the residual and assess the fit of the line
based on the values of the residuals.
Hula hoop activity worksheet
Modeling real world with regression worksheet
http://www.shodor.org/interactivate/discussions/FindingResiduals/
(interactive on computer for residuals)
86
(F.IF.7, F.IF.7b, F.BF.3) Graph absolute value equations and use
transformations of the absolute value function to graph absolute value equations.
Identify the vertex, slope, intercepts, domain and range of the absolute value equations.
Discovery Lesson on absolute value graphs worksheet
Transformations
87
Review and Test http://www.superteachertools.com/jeopardyx/jeopardy-review-
game.php?gamefile=1298945667 (Review game) 88-90
Algebra 1 Honors – Curriculum Pacing Guide – 2013 – 2014 Third Nine Weeks
Anderson School District Five Page 17 Copyright July 1, 2013
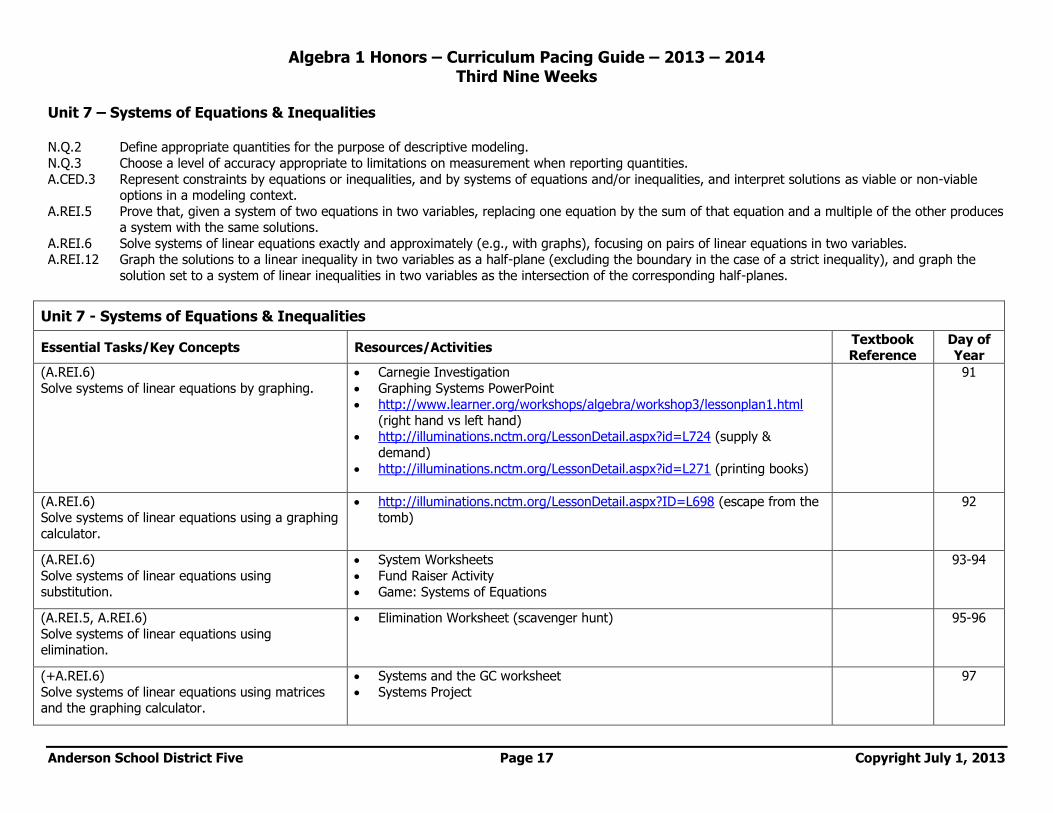
Unit 7 – Systems of Equations & Inequalities N.Q.2 Define appropriate quantities for the purpose of descriptive modeling.
N.Q.3 Choose a level of accuracy appropriate to limitations on measurement when reporting quantities.
A.CED.3 Represent constraints by equations or inequalities, and by systems of equations and/or inequalities, and interpret solutions as viable or non-viable options in a modeling context.
A.REI.5 Prove that, given a system of two equations in two variables, replacing one equation by the sum of that equation and a multiple of the other produces a system with the same solutions.
A.REI.6 Solve systems of linear equations exactly and approximately (e.g., with graphs), focusing on pairs of linear equations in two variables. A.REI.12 Graph the solutions to a linear inequality in two variables as a half-plane (excluding the boundary in the case of a strict inequality), and graph the
solution set to a system of linear inequalities in two variables as the intersection of the corresponding half-planes.
Unit 7 - Systems of Equations & Inequalities
Essential Tasks/Key Concepts Resources/Activities Textbook Reference
Day of Year
(A.REI.6)
Solve systems of linear equations by graphing.
Carnegie Investigation
Graphing Systems PowerPoint
http://www.learner.org/workshops/algebra/workshop3/lessonplan1.html
(right hand vs left hand) http://illuminations.nctm.org/LessonDetail.aspx?id=L724 (supply &
demand)
http://illuminations.nctm.org/LessonDetail.aspx?id=L271 (printing books)
91
(A.REI.6) Solve systems of linear equations using a graphing
calculator.
http://illuminations.nctm.org/LessonDetail.aspx?ID=L698 (escape from the
tomb)
92
(A.REI.6)
Solve systems of linear equations using substitution.
System Worksheets
Fund Raiser Activity
Game: Systems of Equations
93-94
(A.REI.5, A.REI.6)
Solve systems of linear equations using elimination.
Elimination Worksheet (scavenger hunt) 95-96
(+A.REI.6)
Solve systems of linear equations using matrices and the graphing calculator.
Systems and the GC worksheet
Systems Project
97
Algebra 1 Honors – Curriculum Pacing Guide – 2013 – 2014 Third Nine Weeks
Anderson School District Five Page 18 Copyright July 1, 2013
Unit 7 - Systems of Equations & Inequalities
Essential Tasks/Key Concepts Resources/Activities Textbook
Reference
Day of
Year
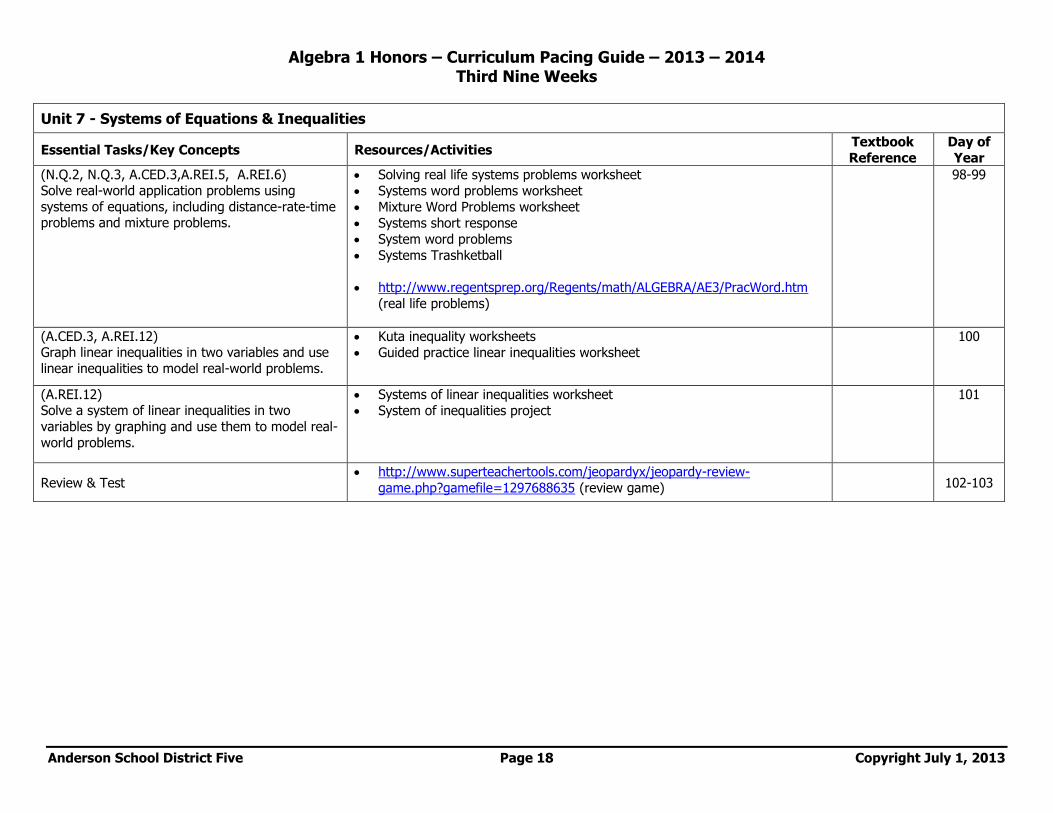
(N.Q.2, N.Q.3, A.CED.3,A.REI.5, A.REI.6) Solve real-world application problems using
systems of equations, including distance-rate-time problems and mixture problems.
Solving real life systems problems worksheet
Systems word problems worksheet
Mixture Word Problems worksheet
Systems short response
System word problems
Systems Trashketball
http://www.regentsprep.org/Regents/math/ALGEBRA/AE3/PracWord.htm
(real life problems)
98-99
(A.CED.3, A.REI.12) Graph linear inequalities in two variables and use
linear inequalities to model real-world problems.
Kuta inequality worksheets
Guided practice linear inequalities worksheet
100
(A.REI.12) Solve a system of linear inequalities in two
variables by graphing and use them to model real-
world problems.
Systems of linear inequalities worksheet
System of inequalities project
101
Review & Test http://www.superteachertools.com/jeopardyx/jeopardy-review-
game.php?gamefile=1297688635 (review game)
102-103
Algebra 1 Honors – Curriculum Pacing Guide – 2013 – 2014 Third Nine Weeks
Anderson School District Five Page 19 Copyright July 1, 2013
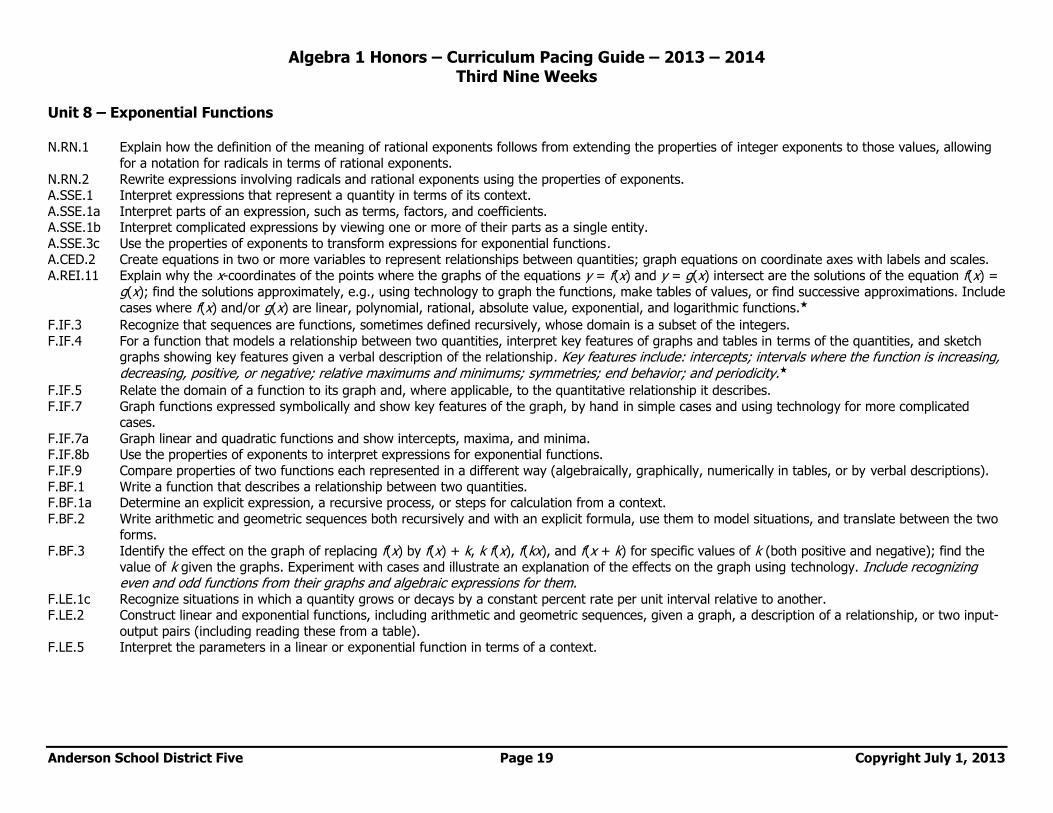
Unit 8 – Exponential Functions N.RN.1 Explain how the definition of the meaning of rational exponents follows from extending the properties of integer exponents to those values, allowing
for a notation for radicals in terms of rational exponents.
N.RN.2 Rewrite expressions involving radicals and rational exponents using the properties of exponents. A.SSE.1 Interpret expressions that represent a quantity in terms of its context.
A.SSE.1a Interpret parts of an expression, such as terms, factors, and coefficients. A.SSE.1b Interpret complicated expressions by viewing one or more of their parts as a single entity.
A.SSE.3c Use the properties of exponents to transform expressions for exponential functions. A.CED.2 Create equations in two or more variables to represent relationships between quantities; graph equations on coordinate axes with labels and scales.
A.REI.11 Explain why the x-coordinates of the points where the graphs of the equations y = f(x) and y = g(x) intersect are the solutions of the equation f(x) =
g(x); find the solutions approximately, e.g., using technology to graph the functions, make tables of values, or find successive approximations. Include
cases where f(x) and/or g(x) are linear, polynomial, rational, absolute value, exponential, and logarithmic functions.★
F.IF.3 Recognize that sequences are functions, sometimes defined recursively, whose domain is a subset of the integers.
F.IF.4 For a function that models a relationship between two quantities, interpret key features of graphs and tables in terms of the quantities, and sketch graphs showing key features given a verbal description of the relationship. Key features include: intercepts; intervals where the function is increasing, decreasing, positive, or negative; relative maximums and minimums; symmetries; end behavior; and periodicity.★
F.IF.5 Relate the domain of a function to its graph and, where applicable, to the quantitative relationship it describes.
F.IF.7 Graph functions expressed symbolically and show key features of the graph, by hand in simple cases and using technology for more complicated cases.
F.IF.7a Graph linear and quadratic functions and show intercepts, maxima, and minima. F.IF.8b Use the properties of exponents to interpret expressions for exponential functions.
F.IF.9 Compare properties of two functions each represented in a different way (algebraically, graphically, numerically in tables, or by verbal descriptions).
F.BF.1 Write a function that describes a relationship between two quantities. F.BF.1a Determine an explicit expression, a recursive process, or steps for calculation from a context.
F.BF.2 Write arithmetic and geometric sequences both recursively and with an explicit formula, use them to model situations, and translate between the two forms.
F.BF.3 Identify the effect on the graph of replacing f(x) by f(x) + k, k f(x), f(kx), and f(x + k) for specific values of k (both positive and negative); find the
value of k given the graphs. Experiment with cases and illustrate an explanation of the effects on the graph using technology. Include recognizing even and odd functions from their graphs and algebraic expressions for them.
F.LE.1c Recognize situations in which a quantity grows or decays by a constant percent rate per unit interval relative to another. F.LE.2 Construct linear and exponential functions, including arithmetic and geometric sequences, given a graph, a description of a relationship, or two input-
output pairs (including reading these from a table). F.LE.5 Interpret the parameters in a linear or exponential function in terms of a context.
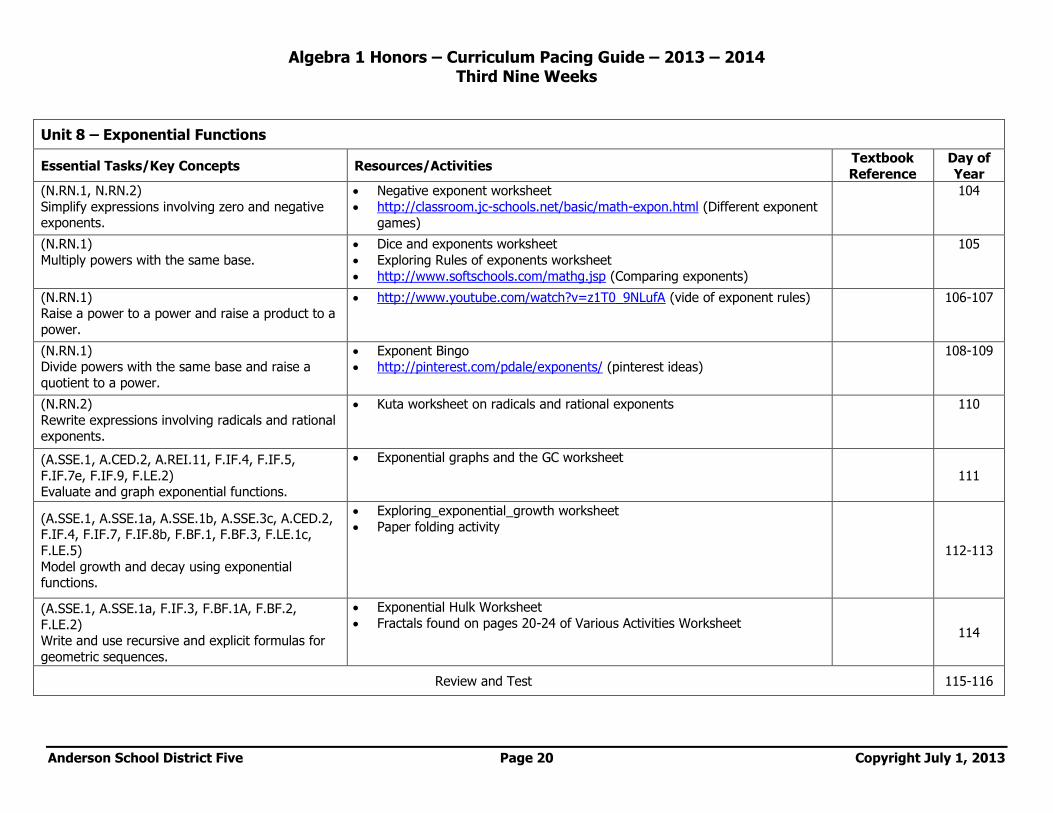
Algebra 1 Honors – Curriculum Pacing Guide – 2013 – 2014 Third Nine Weeks
Anderson School District Five Page 20 Copyright July 1, 2013
Unit 8 – Exponential Functions
Essential Tasks/Key Concepts Resources/Activities Textbook
Reference
Day of
Year
(N.RN.1, N.RN.2)
Simplify expressions involving zero and negative exponents.
Negative exponent worksheet
http://classroom.jc-schools.net/basic/math-expon.html (Different exponent
games)
104
(N.RN.1)
Multiply powers with the same base.
Dice and exponents worksheet
Exploring Rules of exponents worksheet
http://www.softschools.com/mathg.jsp (Comparing exponents)
105
(N.RN.1) Raise a power to a power and raise a product to a
power.
http://www.youtube.com/watch?v=z1T0_9NLufA (vide of exponent rules) 106-107
(N.RN.1) Divide powers with the same base and raise a
quotient to a power.
Exponent Bingo
http://pinterest.com/pdale/exponents/ (pinterest ideas)
108-109
(N.RN.2)
Rewrite expressions involving radicals and rational exponents.
Kuta worksheet on radicals and rational exponents 110
(A.SSE.1, A.CED.2, A.REI.11, F.IF.4, F.IF.5,
F.IF.7e, F.IF.9, F.LE.2) Evaluate and graph exponential functions.
Exponential graphs and the GC worksheet
111
(A.SSE.1, A.SSE.1a, A.SSE.1b, A.SSE.3c, A.CED.2, F.IF.4, F.IF.7, F.IF.8b, F.BF.1, F.BF.3, F.LE.1c,
F.LE.5)
Model growth and decay using exponential functions.
Exploring_exponential_growth worksheet
Paper folding activity
112-113
(A.SSE.1, A.SSE.1a, F.IF.3, F.BF.1A, F.BF.2,
F.LE.2) Write and use recursive and explicit formulas for
geometric sequences.
Exponential Hulk Worksheet
Fractals found on pages 20-24 of Various Activities Worksheet 114
Review and Test 115-116
Algebra 1 Honors – Curriculum Pacing Guide – 2013 – 2014 Third Nine Weeks
Anderson School District Five Page 21 Copyright July 1, 2013
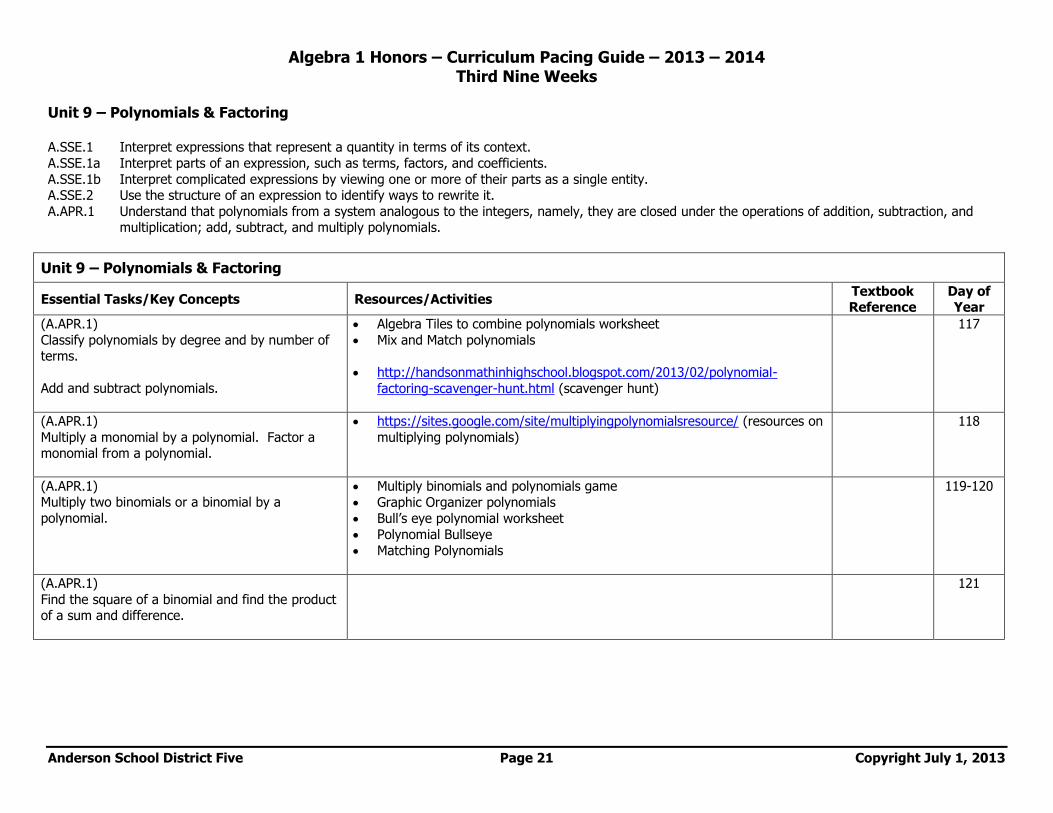
Unit 9 – Polynomials & Factoring A.SSE.1 Interpret expressions that represent a quantity in terms of its context.
A.SSE.1a Interpret parts of an expression, such as terms, factors, and coefficients.
A.SSE.1b Interpret complicated expressions by viewing one or more of their parts as a single entity. A.SSE.2 Use the structure of an expression to identify ways to rewrite it.
A.APR.1 Understand that polynomials from a system analogous to the integers, namely, they are closed under the operations of addition, subtraction, and multiplication; add, subtract, and multiply polynomials.
Unit 9 – Polynomials & Factoring
Essential Tasks/Key Concepts Resources/Activities Textbook Reference
Day of Year
(A.APR.1)
Classify polynomials by degree and by number of terms.
Add and subtract polynomials.
Algebra Tiles to combine polynomials worksheet
Mix and Match polynomials
http://handsonmathinhighschool.blogspot.com/2013/02/polynomial-
factoring-scavenger-hunt.html (scavenger hunt)
117
(A.APR.1)
Multiply a monomial by a polynomial. Factor a monomial from a polynomial.
https://sites.google.com/site/multiplyingpolynomialsresource/ (resources on
multiplying polynomials)
118
(A.APR.1) Multiply two binomials or a binomial by a
polynomial.
Multiply binomials and polynomials game
Graphic Organizer polynomials
Bull’s eye polynomial worksheet
Polynomial Bullseye
Matching Polynomials
119-120
(A.APR.1)
Find the square of a binomial and find the product of a sum and difference.
121
Algebra 1 Honors – Curriculum Pacing Guide – 2013 – 2014 Third Nine Weeks
Anderson School District Five Page 22 Copyright July 1, 2013
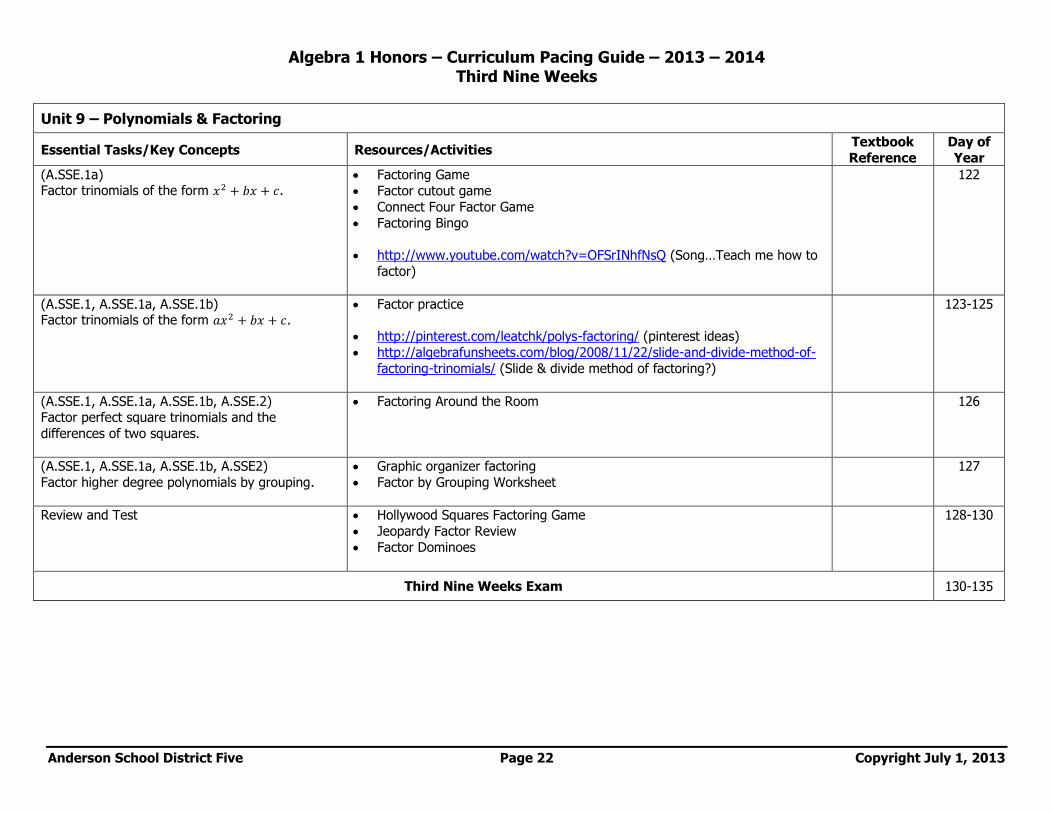
Unit 9 – Polynomials & Factoring
Essential Tasks/Key Concepts Resources/Activities Textbook
Reference
Day of
Year
(A.SSE.1a) Factor trinomials of the form .
Factoring Game
Factor cutout game
Connect Four Factor Game
Factoring Bingo
http://www.youtube.com/watch?v=OFSrINhfNsQ (Song…Teach me how to
factor)
122
(A.SSE.1, A.SSE.1a, A.SSE.1b) Factor trinomials of the form .
Factor practice
http://pinterest.com/leatchk/polys-factoring/ (pinterest ideas)
http://algebrafunsheets.com/blog/2008/11/22/slide-and-divide-method-of-
factoring-trinomials/ (Slide & divide method of factoring?)
123-125
(A.SSE.1, A.SSE.1a, A.SSE.1b, A.SSE.2) Factor perfect square trinomials and the
differences of two squares.
Factoring Around the Room 126
(A.SSE.1, A.SSE.1a, A.SSE.1b, A.SSE2)
Factor higher degree polynomials by grouping.
Graphic organizer factoring
Factor by Grouping Worksheet
127
Review and Test Hollywood Squares Factoring Game
Jeopardy Factor Review
Factor Dominoes
128-130
Third Nine Weeks Exam 130-135
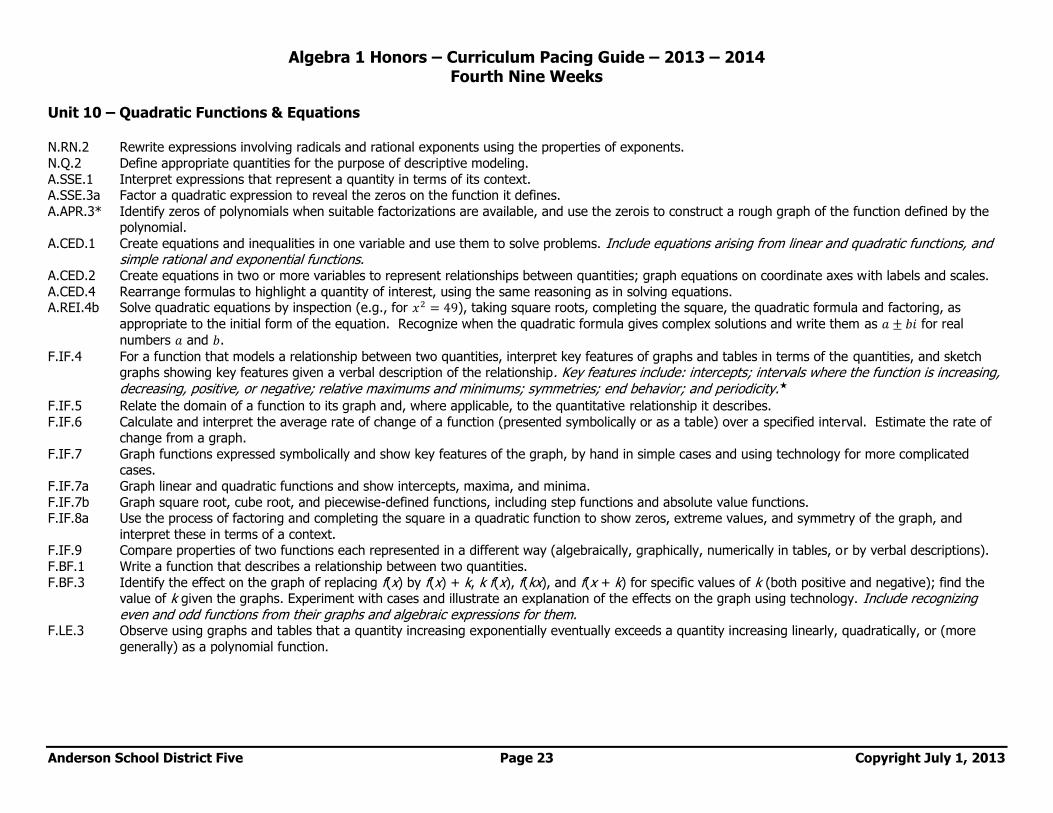
Algebra 1 Honors – Curriculum Pacing Guide – 2013 – 2014 Fourth Nine Weeks
Anderson School District Five Page 23 Copyright July 1, 2013
Unit 10 – Quadratic Functions & Equations N.RN.2 Rewrite expressions involving radicals and rational exponents using the properties of exponents.
N.Q.2 Define appropriate quantities for the purpose of descriptive modeling.
A.SSE.1 Interpret expressions that represent a quantity in terms of its context. A.SSE.3a Factor a quadratic expression to reveal the zeros on the function it defines.
A.APR.3* Identify zeros of polynomials when suitable factorizations are available, and use the zerois to construct a rough graph of the function defined by the polynomial.
A.CED.1 Create equations and inequalities in one variable and use them to solve problems. Include equations arising from linear and quadratic functions, and simple rational and exponential functions.
A.CED.2 Create equations in two or more variables to represent relationships between quantities; graph equations on coordinate axes with labels and scales.
A.CED.4 Rearrange formulas to highlight a quantity of interest, using the same reasoning as in solving equations. A.REI.4b Solve quadratic equations by inspection (e.g., for ), taking square roots, completing the square, the quadratic formula and factoring, as
appropriate to the initial form of the equation. Recognize when the quadratic formula gives complex solutions and write them as for real
numbers and .
F.IF.4 For a function that models a relationship between two quantities, interpret key features of graphs and tables in terms of the quantities, and sketch graphs showing key features given a verbal description of the relationship. Key features include: intercepts; intervals where the function is increasing, decreasing, positive, or negative; relative maximums and minimums; symmetries; end behavior; and periodicity.★
F.IF.5 Relate the domain of a function to its graph and, where applicable, to the quantitative relationship it describes.
F.IF.6 Calculate and interpret the average rate of change of a function (presented symbolically or as a table) over a specified interval. Estimate the rate of change from a graph.
F.IF.7 Graph functions expressed symbolically and show key features of the graph, by hand in simple cases and using technology for more complicated cases.
F.IF.7a Graph linear and quadratic functions and show intercepts, maxima, and minima.
F.IF.7b Graph square root, cube root, and piecewise-defined functions, including step functions and absolute value functions. F.IF.8a Use the process of factoring and completing the square in a quadratic function to show zeros, extreme values, and symmetry of the graph, and
interpret these in terms of a context. F.IF.9 Compare properties of two functions each represented in a different way (algebraically, graphically, numerically in tables, or by verbal descriptions).
F.BF.1 Write a function that describes a relationship between two quantities.
F.BF.3 Identify the effect on the graph of replacing f(x) by f(x) + k, k f(x), f(kx), and f(x + k) for specific values of k (both positive and negative); find the value of k given the graphs. Experiment with cases and illustrate an explanation of the effects on the graph using technology. Include recognizing even and odd functions from their graphs and algebraic expressions for them.
F.LE.3 Observe using graphs and tables that a quantity increasing exponentially eventually exceeds a quantity increasing linearly, quadratically, or (more
generally) as a polynomial function.
Algebra 1 Honors – Curriculum Pacing Guide – 2013 – 2014 Fourth Nine Weeks
Anderson School District Five Page 24 Copyright July 1, 2013
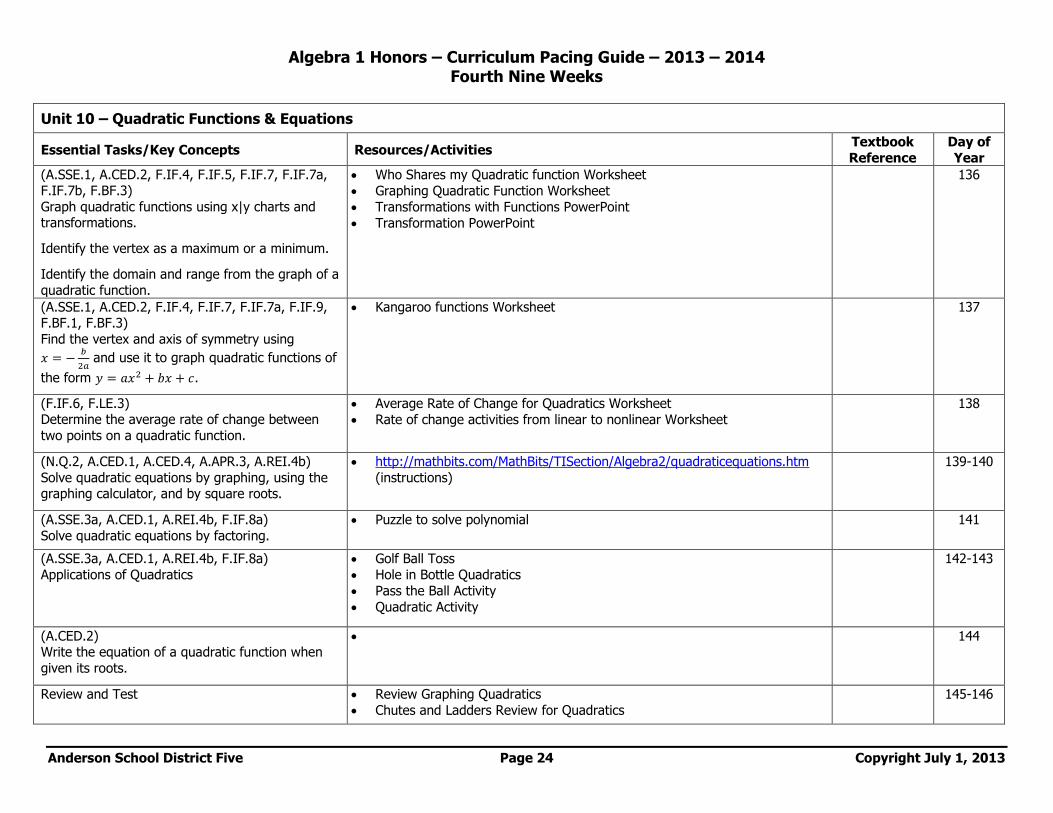
Unit 10 – Quadratic Functions & Equations
Essential Tasks/Key Concepts Resources/Activities Textbook
Reference
Day of
Year
(A.SSE.1, A.CED.2, F.IF.4, F.IF.5, F.IF.7, F.IF.7a, F.IF.7b, F.BF.3)
Graph quadratic functions using x|y charts and transformations.
Identify the vertex as a maximum or a minimum.
Identify the domain and range from the graph of a
quadratic function.
Who Shares my Quadratic function Worksheet
Graphing Quadratic Function Worksheet
Transformations with Functions PowerPoint
Transformation PowerPoint
136
(A.SSE.1, A.CED.2, F.IF.4, F.IF.7, F.IF.7a, F.IF.9, F.BF.1, F.BF.3)
Find the vertex and axis of symmetry using
and use it to graph quadratic functions of
the form .
Kangaroo functions Worksheet 137
(F.IF.6, F.LE.3) Determine the average rate of change between
two points on a quadratic function.
Average Rate of Change for Quadratics Worksheet
Rate of change activities from linear to nonlinear Worksheet
138
(N.Q.2, A.CED.1, A.CED.4, A.APR.3, A.REI.4b)
Solve quadratic equations by graphing, using the graphing calculator, and by square roots.
http://mathbits.com/MathBits/TISection/Algebra2/quadraticequations.htm
(instructions)
139-140
(A.SSE.3a, A.CED.1, A.REI.4b, F.IF.8a)
Solve quadratic equations by factoring.
Puzzle to solve polynomial 141
(A.SSE.3a, A.CED.1, A.REI.4b, F.IF.8a)
Applications of Quadratics
Golf Ball Toss
Hole in Bottle Quadratics
Pass the Ball Activity
Quadratic Activity
142-143
(A.CED.2) Write the equation of a quadratic function when
given its roots.
144
Review and Test Review Graphing Quadratics
Chutes and Ladders Review for Quadratics
145-146
Algebra 1 Honors – Curriculum Pacing Guide – 2013 – 2014 Fourth Nine Weeks
Anderson School District Five Page 25 Copyright July 1, 2013
Unit 11 – More on Quadratic Functions N.Q.3 Choose a level of accuracy appropriate to limitations on measurement when reporting quantities.
A.SSE.1 Interpret expressions that represent a quantity in terms of its context.
A.SSE.1a Interpret parts of an expression, such as terms, factors, and coefficients. A.SSE.1b Interpret complicated expressions by viewing one or more of their parts as a single entity. A.SSE.3b Complete the square in a quadratic expression to reveal the maximum or minimum value of the function it defines. A.CED.1 Create equations and inequalities in one variable and use them to solve problems. Include equations arising from linear and quadratic functions, and
simple rational and exponential functions. A.CED.3 Represent constraints by equations or inequalities, and by systems of equations and/or inequalities, and interpret solutions as viable or non-viable
options in a modeling context.
A.REI.1 Explain each step in solving a simple equation as following from the equality of numbers asserted at the previous step, starting from the assumption that the original equation has a solution. Construct a viable argument to justify a solution method.
A.REI.4 Solve quadratic equations in one variable. A.REI.4a Use the method of completing the square to transform any quadratic equation in into an equation of the form that has the same
solutions. Derive the quadratic formulas from this form. A.REI.4b Solve quadratic equations by inspection (e.g., for ), taking square roots, completing the square, the quadratic formula and factoring, as
appropriate to the initial form of the equation. Recognize when the quadratic formula gives complex solutions and write them as for real
numbers and .
A.REI.7* Solve a simple system consisting of a linear equation and a quadratic equation in two variables algebraically and graphically. A.REI.11 Explain why the x-coordinates of the points where the graphs of the equations and intersect are the solutions of the equation
; find the solutions approximately, e.g., usimg technology to graph the functions, make tables of values, or find successive
approximations. Include cases where and /or are linear, polynomial, rational, absolute value, exponential, and logarithmic functions.
F.IF.4 For a function that models a relationship between two quantities, interpret key features of graphs and tables in terms of the quantities, and sketch graphs showing key features given a verbal description of the relationship. Key features include: intercepts; intervals where the function is increasing, decreasing, positive, or negative; relative maximums and minimums; symmetries; end behavior; and periodicity.★
F.IF.8 Write a function defined by an expression in different but equivalent forms to reveal and explain different properties of the function.
F.BF.1b Combine standard function types using arithmetic operations. F.LE.1a Prove that linear functions grow by equal differences over equal intervals, and that exponential functions grow by equal factors over equal intervals.
F.LE.2 Construct linear and exponential functions, including arithmetic and geometric sequences, given a graph, a description of a relationship, or two input-output pairs (including reading these from a table).
F.LE.3 Observe using graphs and tables that a quantity increasing exponentially eventually exceeds a quantity increasing linearly, quadratically, or (more
generally) as a polynomial function. S.ID.6a Fit a function to the data; use functions fitted to data to solve problems in the context of the data. Use given functions or choose a function
suggested by the context. Emphasize linear and exponential models. S.ID.6b Informally assess the fit of a function by plotting and analyzing residuals.
Algebra 1 Honors – Curriculum Pacing Guide – 2013 – 2014 Fourth Nine Weeks
Anderson School District Five Page 26 Copyright July 1, 2013
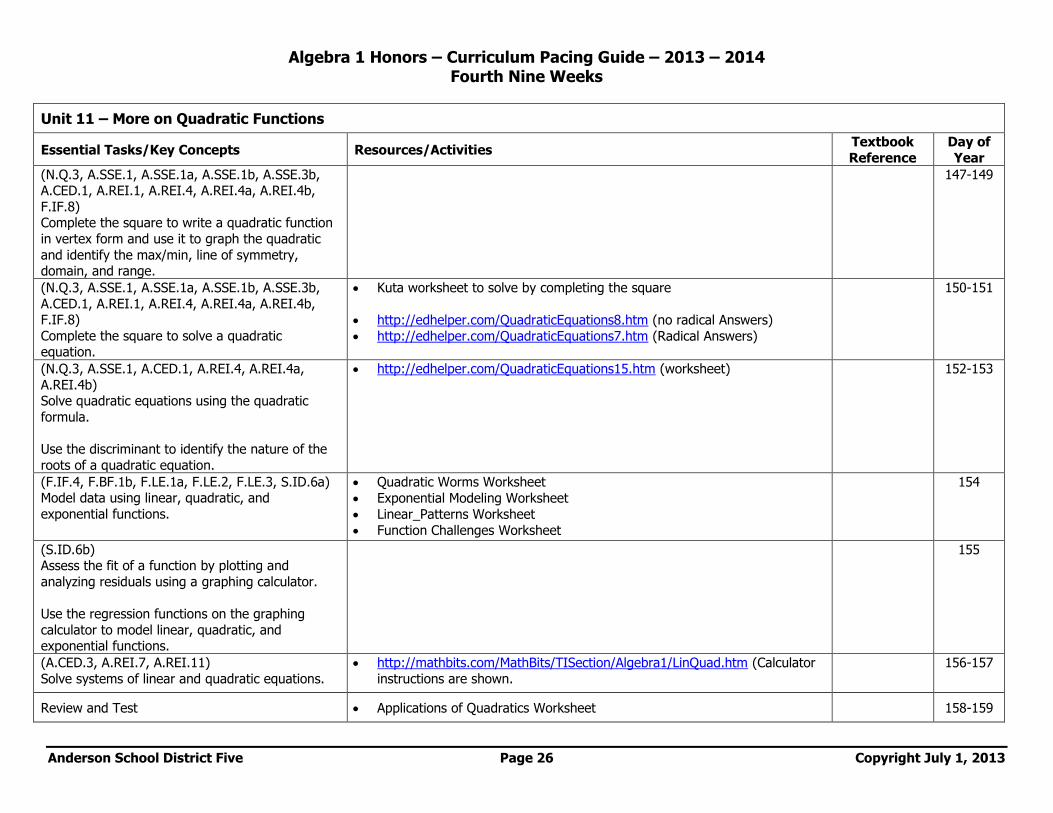
Unit 11 – More on Quadratic Functions
Essential Tasks/Key Concepts Resources/Activities Textbook
Reference
Day of
Year
(N.Q.3, A.SSE.1, A.SSE.1a, A.SSE.1b, A.SSE.3b, A.CED.1, A.REI.1, A.REI.4, A.REI.4a, A.REI.4b,
F.IF.8) Complete the square to write a quadratic function
in vertex form and use it to graph the quadratic
and identify the max/min, line of symmetry, domain, and range.
147-149
(N.Q.3, A.SSE.1, A.SSE.1a, A.SSE.1b, A.SSE.3b,
A.CED.1, A.REI.1, A.REI.4, A.REI.4a, A.REI.4b, F.IF.8)
Complete the square to solve a quadratic equation.
Kuta worksheet to solve by completing the square
http://edhelper.com/QuadraticEquations8.htm (no radical Answers)
http://edhelper.com/QuadraticEquations7.htm (Radical Answers)
150-151
(N.Q.3, A.SSE.1, A.CED.1, A.REI.4, A.REI.4a,
A.REI.4b) Solve quadratic equations using the quadratic
formula.
Use the discriminant to identify the nature of the
roots of a quadratic equation.
http://edhelper.com/QuadraticEquations15.htm (worksheet) 152-153
(F.IF.4, F.BF.1b, F.LE.1a, F.LE.2, F.LE.3, S.ID.6a) Model data using linear, quadratic, and
exponential functions.
Quadratic Worms Worksheet
Exponential Modeling Worksheet
Linear_Patterns Worksheet
Function Challenges Worksheet
154
(S.ID.6b) Assess the fit of a function by plotting and
analyzing residuals using a graphing calculator.
Use the regression functions on the graphing
calculator to model linear, quadratic, and exponential functions.
155
(A.CED.3, A.REI.7, A.REI.11)
Solve systems of linear and quadratic equations.
http://mathbits.com/MathBits/TISection/Algebra1/LinQuad.htm (Calculator
instructions are shown.
156-157
Review and Test Applications of Quadratics Worksheet 158-159
Algebra 1 Honors – Curriculum Pacing Guide – 2013 – 2014 Fourth Nine Weeks
Anderson School District Five Page 27 Copyright July 1, 2013
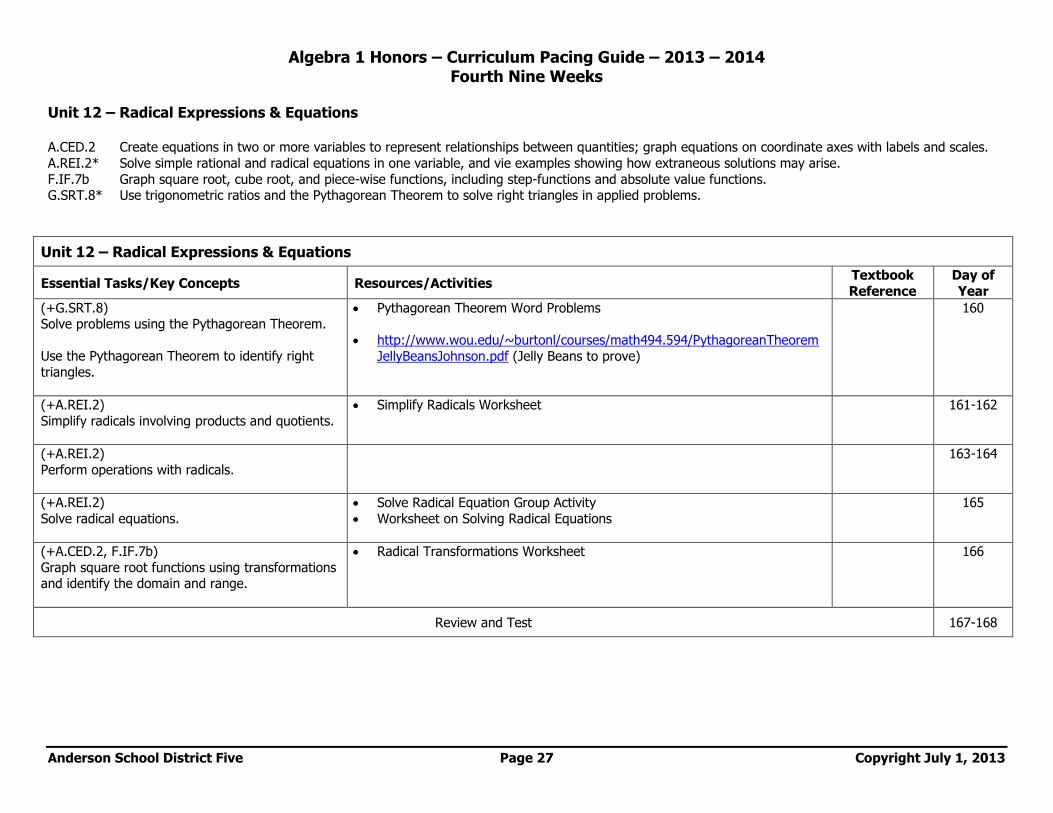
Unit 12 – Radical Expressions & Equations A.CED.2 Create equations in two or more variables to represent relationships between quantities; graph equations on coordinate axes with labels and scales.
A.REI.2* Solve simple rational and radical equations in one variable, and vie examples showing how extraneous solutions may arise.
F.IF.7b Graph square root, cube root, and piece-wise functions, including step-functions and absolute value functions. G.SRT.8* Use trigonometric ratios and the Pythagorean Theorem to solve right triangles in applied problems.
Unit 12 – Radical Expressions & Equations
Essential Tasks/Key Concepts Resources/Activities Textbook
Reference
Day of
Year
(+G.SRT.8) Solve problems using the Pythagorean Theorem.
Use the Pythagorean Theorem to identify right
triangles.
Pythagorean Theorem Word Problems
http://www.wou.edu/~burtonl/courses/math494.594/PythagoreanTheorem
JellyBeansJohnson.pdf (Jelly Beans to prove)
160
(+A.REI.2)
Simplify radicals involving products and quotients.
Simplify Radicals Worksheet 161-162
(+A.REI.2)
Perform operations with radicals.
163-164
(+A.REI.2)
Solve radical equations.
Solve Radical Equation Group Activity
Worksheet on Solving Radical Equations
165
(+A.CED.2, F.IF.7b)
Graph square root functions using transformations and identify the domain and range.
Radical Transformations Worksheet 166
Review and Test 167-168
Algebra 1 Honors – Curriculum Pacing Guide – 2013 – 2014 Fourth Nine Weeks
Anderson School District Five Page 28 Copyright July 1, 2013
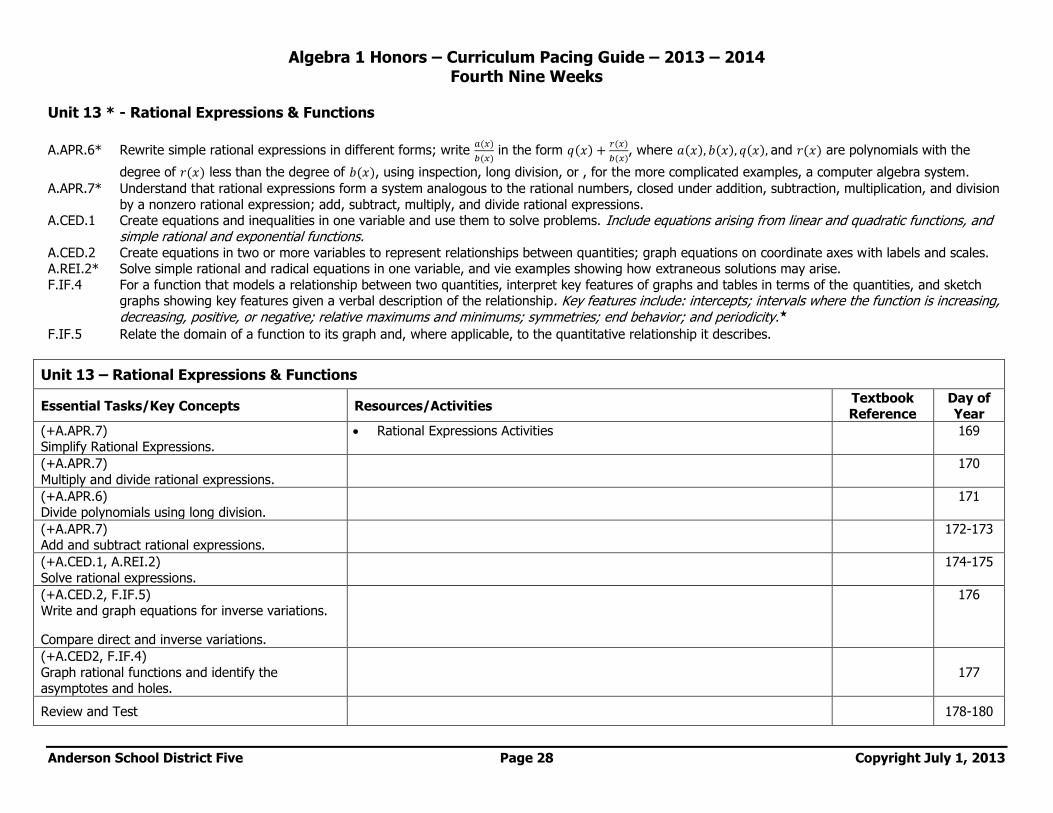
Unit 13 * - Rational Expressions & Functions
A.APR.6* Rewrite simple rational expressions in different forms; write
in the form
, where and are polynomials with the
degree of less than the degree of , using inspection, long division, or , for the more complicated examples, a computer algebra system.
A.APR.7* Understand that rational expressions form a system analogous to the rational numbers, closed under addition, subtraction, multiplication, and division
by a nonzero rational expression; add, subtract, multiply, and divide rational expressions. A.CED.1 Create equations and inequalities in one variable and use them to solve problems. Include equations arising from linear and quadratic functions, and
simple rational and exponential functions. A.CED.2 Create equations in two or more variables to represent relationships between quantities; graph equations on coordinate axes with labels and scales. A.REI.2* Solve simple rational and radical equations in one variable, and vie examples showing how extraneous solutions may arise.
F.IF.4 For a function that models a relationship between two quantities, interpret key features of graphs and tables in terms of the quantities, and sketch graphs showing key features given a verbal description of the relationship. Key features include: intercepts; intervals where the function is increasing, decreasing, positive, or negative; relative maximums and minimums; symmetries; end behavior; and periodicity.★
F.IF.5 Relate the domain of a function to its graph and, where applicable, to the quantitative relationship it describes.
Unit 13 – Rational Expressions & Functions
Essential Tasks/Key Concepts Resources/Activities Textbook Reference
Day of Year
(+A.APR.7) Simplify Rational Expressions.
Rational Expressions Activities 169
(+A.APR.7)
Multiply and divide rational expressions.
170
(+A.APR.6) Divide polynomials using long division.
171
(+A.APR.7) Add and subtract rational expressions.
172-173
(+A.CED.1, A.REI.2)
Solve rational expressions.
174-175
(+A.CED.2, F.IF.5) Write and graph equations for inverse variations.
Compare direct and inverse variations.
176
(+A.CED2, F.IF.4)
Graph rational functions and identify the asymptotes and holes.
177
Review and Test 178-180