2017-18 first quarter fiscal update and economic statement ... · $2 .5 billion lower than forecast...
TRANSCRIPT

August 2017
2017 –18 First Quarter Fiscal Update and Economic Statement
2017 –18 First Quarter FISCAL Update AND ECONOMIC Statement
2
2017 –18 FIRST QUARTER HIGHLIGHTS . . . . . . . . . . . . . . . . . . . . . . . . . . 3
2017 –18 FIRST QUARTER FISCAL UPDATE
Fiscal Plan Highlights . . . . . . . . . . . . . . . . . . . . . . . . . . . . . . . . . . . . . . . . . . . 4 Fiscal Plan Summary . . . . . . . . . . . . . . . . . . . . . . . . . . . . . . . . . . . . . . . . . . . 4
Revenue and Expense Highlights . . . . . . . . . . . . . . . . . . . . . . . . . . . . . . . . . . 5
Assets and Liabilities . . . . . . . . . . . . . . . . . . . . . . . . . . . . . . . . . . . . . . . . . . . 6
Balance Sheet Summary . . . . . . . . . . . . . . . . . . . . . . . . . . . . . . . . . . . . . . . . . 6
Revenue . . . . . . . . . . . . . . . . . . . . . . . . . . . . . . . . . . . . . . . . . . . . . . . . . . . . . 7
Operating Expense by Ministry . . . . . . . . . . . . . . . . . . . . . . . . . . . . . . . . . . . 8
Disaster / Emergency Assistance Expense . . . . . . . . . . . . . . . . . . . . . . . . . . . . 8
Inventory Consumption Expense . . . . . . . . . . . . . . . . . . . . . . . . . . . . . . . . . . 8
Capital Amortization Expense . . . . . . . . . . . . . . . . . . . . . . . . . . . . . . . . . . . . 9
Debt Servicing Costs . . . . . . . . . . . . . . . . . . . . . . . . . . . . . . . . . . . . . . . . . . . 9
Inventory Acquisition . . . . . . . . . . . . . . . . . . . . . . . . . . . . . . . . . . . . . . . . . . 9
Contingency Account . . . . . . . . . . . . . . . . . . . . . . . . . . . . . . . . . . . . . . . . . . . 10
2017 –18 Financing Requirements . . . . . . . . . . . . . . . . . . . . . . . . . . . . . . . . . 10
Capital Plan Highlights . . . . . . . . . . . . . . . . . . . . . . . . . . . . . . . . . . . . . . . . . 11
Capital Plan Summary . . . . . . . . . . . . . . . . . . . . . . . . . . . . . . . . . . . . . . . . . . 11
ECONOMIC OUTLOOK
Economic Growth Exceeds Expectations . . . . . . . . . . . . . . . . . . . . . . . . . . . . 12
Key Energy and Economic Assumptions . . . . . . . . . . . . . . . . . . . . . . . . . . . . . 14
REPORTING METHODOLOGY AND LEGISLATIVE COMPLIANCE . . . 15
NOTE: Amounts presented in tables may not add to totals due to rounding.
Table of Contents
ADDITIONAL COPIES OF THIS REPORT may be obtained by visiting our website at: www .finance .alberta .ca/publications/budget/index .html

2017 –18 First Quarter FISCAL Update AND ECONOMIC Statement
3
2017–18 FIRST QUARTER HIGHLIGHTS
Economic RecoveryAlberta’s economy continues to recover from the oil price shock and growth in the first several months of 2017 has surpassed expectations .
� Real GDP growth has been revised up to 3 .1%, from the 2 .6 % forecast at budget (see Figure 1) .
� Alberta added almost 17,000 jobs in the first seven months . Employment is now forecast to grow by 1 .3% in 2017, up from the budget forecast of 0 .9%, and employment is shifting from part-time to full-time .
� Strength is being seen across several sectors of the economy - retail sales, housing starts, wholesale trade, manufacturing shipments and non-energy exports have all increased .
Lower Government Revenue Despite the economic recovery, government continues to manage a challenging fiscal situation with revenue that is lower than expected .
� Lower-than expected oil prices have reduced the forecast for non-renewable resource revenue, which is down $377 million from budget . The decrease was partly offset by an improved light-heavy crude differential .
� Lingering effects of the economic downturn have pulled personal income tax down . Personal income tax revenue is now forecast to be $312 million lower than budget .
Managing Government’s FinancesDespite a drop in forecast revenue, government continues to maintain the $10 .5 billion deficit that was forecast in Budget 2017 .
Economy growing faster than expected; deficit on track
� Operating expense growth is in line with budget . Its growth of 2 .3% is well below the growth in population and inflation of 3 .3% .
� In-year savings to be achieved has increased to $400 million . Government expense continues to be reviewed to find efficiencies and savings while protecting vital programs Albertans rely on .
� $250 million of the budgeted risk adjustment is being used, as per its intended purpose . The risk adjustment was included in budget as a contingency in anticipation of the risks associated with Alberta’s volatile revenue .
� Government borrowing for the Fiscal Plan and the Capital Plan is $2 .5 billion lower than forecast .
pdf name: 3Q_chrt_01.pdf 3rd QuarterFiscal Update and Econ. Stm.
Nominal GDP per capita, 2017 forecast
Sources: Alberta Treasury Board and Finance, Statistics Canada and TD Economics.
pdf name: Q3_chrt_02_highlights.pdf
0 10 20 30 40 50 60 70 80
PENSNBQCMBNLBCONSKAB
($ thousands)
\\ter-fin-fs-01\Publications\_Economics_publications\Quarterly Economic Statement\Q1_EconomicUpdate_2017-18\Source_documents\Economic Highlights charts.xlsx / GDP per capita 8/18/2017 / 4:30 PM
Source: Statistics Canada, TD Economics and Alberta Treasury Board and Finance
FIGURE 2: NOMINAL GDP PER CAPITA, 2017
pdf name: 3Q_chrt_01.pdf 3rd QuarterFiscal Update and Econ. Stm.
Modest recovery expected over the medium termReal GDP and Nominal GDP Growth
Source: Statistics Canada and Alberta Treasury Board & Finance, e‐estimate, f‐forecasts
pdf name: Q3_chrt_01_highlights.pdf
-15
-10
-5
0
5
10
15
2010 2011 2012 2013 2014 2015 2016e 2017f 2018f
(%)Real GDPNominal GDP
\\ter-fin-fs-01\Publications\_Economics_publications\Quarterly Economic Statement\Q1_EconomicUpdate_2017-18\Source_documents\Economic Highlights charts.xlsx / GDP growth 8/18/2017 / 4:27 PM
Sources: Statistics Canada and Alberta Treasury Board and Finance
FIGURE 1: ALBERTA GDP GROWTH
2017 –18 First Quarter FISCAL Update AND ECONOMIC Statement
4
2017 –18 FIRST QUARTER FISCAL UPDATE
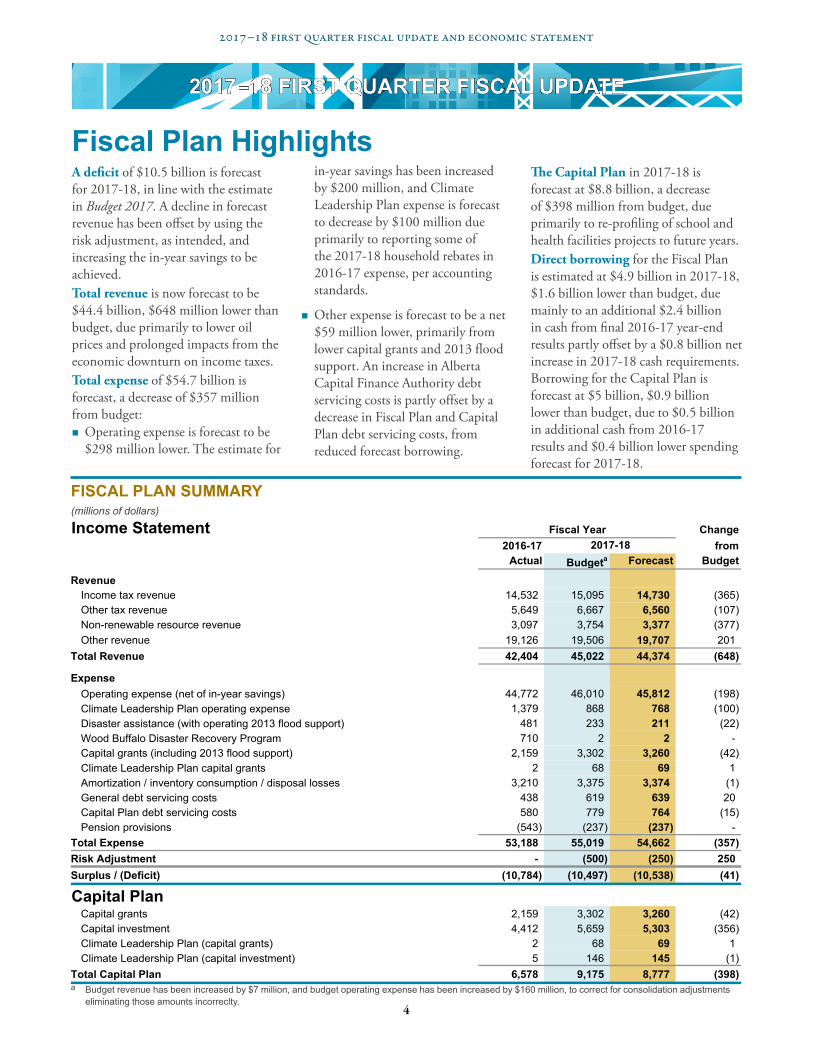
Fiscal Plan HighlightsA deficit of $10 .5 billion is forecast for 2017-18, in line with the estimate in Budget 2017 . A decline in forecast revenue has been offset by using the risk adjustment, as intended, and increasing the in-year savings to be achieved . Total revenue is now forecast to be $44 .4 billion, $648 million lower than budget, due primarily to lower oil prices and prolonged impacts from the economic downturn on income taxes . Total expense of $54 .7 billion is forecast, a decrease of $357 million from budget:
� Operating expense is forecast to be $298 million lower . The estimate for
in-year savings has been increased by $200 million, and Climate Leadership Plan expense is forecast to decrease by $100 million due primarily to reporting some of the 2017-18 household rebates in 2016-17 expense, per accounting standards .
� Other expense is forecast to be a net $59 million lower, primarily from lower capital grants and 2013 flood support . An increase in Alberta Capital Finance Authority debt servicing costs is partly offset by a decrease in Fiscal Plan and Capital Plan debt servicing costs, from reduced forecast borrowing .
The Capital Plan in 2017-18 is forecast at $8 .8 billion, a decrease of $398 million from budget, due primarily to re-profiling of school and health facilities projects to future years . Direct borrowing for the Fiscal Plan is estimated at $4 .9 billion in 2017-18, $1 .6 billion lower than budget, due mainly to an additional $2 .4 billion in cash from final 2016-17 year-end results partly offset by a $0 .8 billion net increase in 2017-18 cash requirements . Borrowing for the Capital Plan is forecast at $5 billion, $0 .9 billion lower than budget, due to $0 .5 billion in additional cash from 2016-17 results and $0 .4 billion lower spending forecast for 2017-18 .pdf named: 3Q_16-17_is-cp.pdf 2016-17, 3rd Quarter Fiscal Update
Fiscal Plan Summary(millions of dollars)
Income Statement Change2016-17 from
Actual Budgeta Forecast Budget
RevenueIncome tax revenue 14,532 15,095 14,730 (365) Other tax revenue 5,649 6,667 6,560 (107) Non-renewable resource revenue 3,097 3,754 3,377 (377) Other revenue 19,126 19,506 19,707 201
Total Revenue 42,404 45,022 44,374 (648)
ExpenseOperating expense (net of in-year savings) 44,772 46,010 45,812 (198) Climate Leadership Plan operating expense 1,379 868 768 (100) Disaster assistance (with operating 2013 flood support) 481 233 211 (22) Wood Buffalo Disaster Recovery Program 710 2 2 - Capital grants (including 2013 flood support) 2,159 3,302 3,260 (42) Climate Leadership Plan capital grants 2 68 69 1 Amortization / inventory consumption / disposal losses 3,210 3,375 3,374 (1) General debt servicing costs 438 619 639 20 Capital Plan debt servicing costs 580 779 764 (15) Pension provisions (543) (237) (237) -
Total Expense 53,188 55,019 54,662 (357) Risk Adjustment - (500) (250) 250 Surplus / (Deficit) (10,784) (10,497) (10,538) (41)
Capital PlanCapital grants 2,159 3,302 3,260 (42) Capital investment 4,412 5,659 5,303 (356) Climate Leadership Plan (capital grants) 2 68 69 1 Climate Leadership Plan (capital investment) 5 146 145 (1)
Total Capital Plan 6,578 9,175 8,777 (398)
Fiscal Year2017-18
M:\MinShare\PublnsProd\CorpFin\OBM.PUBLNS-2017-18\2017-18_Q1-Report\1Q_source-files\2017-18 Q 1 Report tables.xlsx /FP Sum - IncSt 8/16/2017/12:52 PM
a Budget revenue has been increased by $7 million, and budget operating expense has been increased by $160 million, to correct for consolidation adjustments eliminating those amounts incorreclty.
FISCAL PLAN SUMMARY(millions of dollars)

2017 –18 First Quarter FISCAL Update AND ECONOMIC Statement
5
Total Revenue is forecast to be $44 .4 billion, $648 million lower than estimated in Budget 2017 .
� Resource revenue has decreased $377 million, to $3 .4 billion, due mainly to a reduced oil price forecast resulting from higher-than-expected US supply growth and production return from Libya and Nigeria, countries exempted from the OPEC deal on production cuts, and to a higher US-Canadian dollar exchange rate . These are partially offset by a lower forecast for the light-heavy differential, caused mainly by reduced global heavy oil production as OPEC members have emphasized decreasing heavier crudes for supply restraint, and to local supply disruptions . While natural gas prices have also weakened, lower proccessing costs and slightly higher by-product royalties have more than offset the revenue impact . Land lease sales revenue has increased due to higher number of hectares and higher bid prices per hectare .
� The West Texas Intermediate oil price forecast has decreased from budget by US$6 to $49 per barrel . Fiscal year-to-date (August 17), prices have averaged US$47 .90 . The light-heavy differential forecast has declined by US$3 .80 to $12 .20 . The natural gas Alberta Reference Price forecast has decreased 30 cents, to Cdn$2 .60 per gigajoule, and the exchange rate forecast has increased by 1 cent, to 77 US¢/Cdn$ .
� Personal income tax revenue is forecast at $10 .9 billion, a reduction of $312 million from budget, due to 2016 preliminary assessments being lower than expected in Budget 2017 . The impact of the lower forecast base is partly offset by increased household income growth from improved 2017 employment, and a positive $41 million prior-years’ adjustment (the 2017 portion
of 2016-17 revenue was slightly under-reported) .
� Corporate income tax revenue is forecast at $3 .9 billion, a decrease of $53 million from Budget 2017, due mainly to lower oil prices and higher-than-expected refunds in the first three months of the 2017-18 fiscal year .
� Other tax revenue is forecast at $6 .6 billion, a $107 million decrease from budget, due primarily to lower tobacco consumption and lower growth in insurance premiums .
� Investment income is forecast at $2 .4 billion, $240 million higher than the Budget 2017 estimate, due mainly to realization of gains embedded in assets from recent strong equity markets, and higher Alberta Capital Finance Authority (ACFA) net income due mainly to lower payments on loan swaps (a similar impact on debt swaps increases debt servicing costs) .
� Total revenue from other sources is forecast at $17 .3 billion, $39 million lower than budget . Increases comprise $21 million in Alberta Treasury Branches (ATB) income, $32 million in agriculture insurance premiums (higher participation), $28 million in other premiums, fees and licences (mainly ATB payment in lieu of taxes and deposit guarantee fees), $25 million in Alberta Health Services recoveries and rental revenue and a net $7 million in other revenue (primarily federal transfers) . These are more than offset by decreases of $120 million from now being required to consolidate the Balancing Pool 2017-18 projected net loss in government reporting, and $32 million in Alberta Petroleum Marketing Commission net income, due to a later start up of the North West Redwater Partnership upgrader .
Total Expense is forecast to be $54 .7 billion, $357 million lower than estimated in Budget 2017 .
� Operating expense is forecast at $46 .6 billion, $298 million lower than Budget 2017, due primarily to increasing expected in-year savings from $200 million to $400 million, and to a $100 million reduction in forecast Climate Leadership Plan household rebates, mainly from reporting a portion of 2017-18 rebates in 2016-17 expense . The first set of rebate cheques issued in January 2017 were mostly for the January to June 2017 period, and the budget assumed amounts provided in advance for April to June could be reported in the expense of the related fiscal year . However, since the cash had been provided, accounting standards required reporting the full amount in 2016-17 expense .
� Disaster assistance is forecast to be $22 million lower, from re-profiling 2013 flood support under the floodway relocation program . The unallocated $200 million budgeted for disasters remains in expense .
� Capital grants of $3 .3 billion are $42 million lower, due mainly to re-profiling grants for continuing care beds . Several transfers from capital grants to capital investment are offset by a transfer from investment to grants for housing projects .
� General debt servicing costs have increased by a net $20 million from budget, due to $28 million in higher ACFA costs (as noted earlier, there is a related increase to investment income), partly offset by lower Fiscal Plan costs due primarily to lower expected borrowing . Capital Plan debt servicing costs are $15 million lower due to lower borrowing .
Revenue and Expense Highlights

2017 –18 First Quarter FISCAL Update AND ECONOMIC Statement
6
pdf named: 3Q_16-17_bs.pdf 2016-17, 3rd Quarter Fiscal Update
Balance Sheet Summary(millions of dollars)
Change2017 from
Actual Budgeta Forecast 2016
Financial AssetsHeritage Fund, endowment and other funds 19,836 20,177 20,172 336 Contingency Account 2,299 - - (2,299) Self-supporting lending organizations 20,904 21,444 21,521 617 Capital Plan financing account 1,394 545 - (1,394) Other financial assets (including SUCH sector) 21,854 21,752 21,503 (351)
Total Financial Assets 66,287 63,918 63,196 (3,091) Liabilities
Liabilities for capital projects 23,769 29,780 28,867 5,098 Debt for pre-1992 Teachers' Pension Plan 944 944 944 - Direct borrowing for the Fiscal Plan 8,585 15,080 13,446 4,861 Self-supporting lending organizations 18,385 18,570 18,612 227 Other liabilities (including SUCH sector) 13,482 12,382 13,636 154 Pension liabilities 10,023 9,786 9,786 (237)
Total Liabilities 75,188 86,542 85,291 10,103 Net Financial Assets / (Debt) (8,901) (22,624) (22,095) (13,194)
Capital / other non-financial assets 49,408 52,716 52,360 2,952 Spent deferred capital contributions (2,786) (2,868) (3,082) (296)
Net Assets 37,721 27,224 27,183 (10,538) Change in Net Assets (before adjustments) (10,784) (10,497) (10,538)
At March 312018
M:\MinShare\PublnsProd\CorpFin\OBM.PUBLNS-2017-18\2017-18_Q1-Report\1Q_source-files\2017-18 Q 1 Report tables.xlsx /FP Sum BalSh 8/17/2017/4:31 PM
a Budget numbers have been restated to reflect 2016‑17 actual results.
Assets and Liabilities
BALANCE SHEET SUMMARY(millions of dollars)
Financial Assets of $63 .2 billion are forecast for March 31, 2018, a decrease of $3 .1 billion from 2017 .
� Heritage Fund, endowment and other fund assets are increasing by $0 .3 billion, from inflation-proofing and net income retention .
� The Contingency Account balance is decreasing $2 .3 billion, as assets are withdrawn to fund 2017-18 cash requirements . An additional $2 .4 billion from final 2016-17 year-end results, deposited after March 31, is also being withdrawn . The Account has been drawn down to fund annual deficits, after a variety of cash adjustments are applied, including differences between reported accrued revenue and expense and actual cash receipts and outlays, net income retention by various funds, entities and business enterprises, and cash borrowing . More details are provided on page 10 .
� Assets of the Agriculture Financial Services Corporation (AFSC) and Alberta Capital Finance Authority (ACFA) are increasing $0 .6 billion due to retention of their net income .
� The Capital Plan financing account is decreasing $1 .4 billion as assets are withdrawn to fund capital spending .
� Other financial assets are decreasing by $0 .4 billion .
Liabilities are forecast at $85 .3 billion on March 31, 2018, a $10 .1 billion net increase from March 31, 2017 .
� Liabilities for capital projects are $5 .1 billion higher, due to direct borrowing of $5 billion, alternative financing of $0 .1 billion, less principal repayments on completed private-public partnership projects (P3s) of $59 million .
� Direct borrowing for the Fiscal Plan is increasing $4 .9 billion from March 31, 2017 .
� AFSC and ACFA liabilities are increasing $0 .2 billion, more than offset by increased assets .
� Other liabilities are up $0 .2 billion .
� The government obligations for pension plan liabilities are decreasing by $0 .2 billion .
Capital and other non-financial assets are forecast at a net $49 .3 billion on March 31, 2018, a $2 .7 billion net increase from March 31, 2017 . This reflects: the addition of $5 .4 billion in capital assets less $2 .4 billion in amortization and disposals; addition of $0 .9 billion in inventory assets (e .g . vaccines, highway maintenance gravel) less $0 .9 billion in consumption of inventory; and a $0 .3 billion increase in deferred capital contributions .
Net Assets of $27 .2 billion are forecast for March 31, 2018, a $10 .5 billion decrease from March 31, 2017, reflecting the deficit for 2017-18 .

2017 –18 First Quarter FISCAL Update AND ECONOMIC Statement
7
pdf named: 3Q_16-17_rev.pdf 2016-17, 3rd Quarter Fiscal Update
Revenue(millions of dollars)
Change2016-17 from
Actual Budget Forecast BudgetIncome Taxes
Personal income tax 10,763 11,177 10,865 (312) Corporate income tax 3,769 3,918 3,865 (53)
14,532 15,095 14,730 (365)Other Taxes
Education property tax 2,412 2,446 2,446 - Fuel tax 1,343 1,360 1,358 (2) Tobacco tax 953 1,026 957 (69) Insurance taxes 555 628 596 (32) Carbon levy 250 1,038 1,052 14 Freehold mineral rights tax 57 90 70 (20) Tourism levy 78 79 81 2
5,649 6,667 6,560 (107)Non-Renewable Resource Revenue
Bitumen royalty 1,483 2,546 1,983 (563) Crude oil royalty 716 476 468 (8) Natural gas and by-products royalty 520 455 513 58 Bonuses and sales of Crown leases 203 148 271 123 Rentals and fees / coal royalty 174 129 142 13
3,097 3,754 3,377 (377)Transfers from Government of Canada
Canada Health Transfer 4,201 4,360 4,360 - Canada Social Transfer 1,558 1,614 1,614 - Direct transfers to SUCH sector / Alberta Innovates Corp. 528 479 479 - Agriculture support programs 386 293 297 4 Infrastructure support 337 741 743 2 Labour market agreements 198 178 178 - Other (2016-17 includes $495 million for Wood Buffalo wildfire) 772 323 325 2
7,979 7,988 7,996 8Investment Income
Alberta Heritage Savings Trust Fund 2,467 1,290 1,456 166 Endowment funds 526 251 300 49 Alberta Capital Finance Authority 185 178 203 25 Agriculture Financial Services Corporation 130 142 142 - Other (includes SUCH sector / Contingency Account) 390 332 332 -
3,701 2,193 2,433 240Net Income from Government Business Enterprises
AGLC – Gaming / lottery 1,430 1,445 1,445 - AGLC – Liquor 855 876 876 - Alberta Treasury Branches 151 93 114 21 The Balancing Pool (1,952) - (120) (120) Other – CUDGCo / APMC 59 92 60 (32)
543 2,506 2,375 (131)Premiums, Fees and Licences
Post-secondary institution tuition fees 1,169 1,223 1,223 - Health / school board fees and charges 704 655 655 - Motor vehicle licences 502 505 505 - Crop, hail and livestock insurance premiums 370 333 365 32 Energy industry levies 300 310 310 - Other (includes land titles, land and grazing, health benefits premiums) 656 657 685 28
3,701 3,683 3,743 60Other
SUCH sector sales, rentals and services 1,063 1,040 1,065 25 SUCH sector fundraising, donations and gifts 708 627 627 - AIMCo investment management charges 291 318 318 - Fines and penalties 214 225 225 - Refunds of expense 282 197 198 1 Climate change and emissions management 160 196 200 4 Miscellaneous 484 533 527 (6)
3,202 3,136 3,160 24Total Revenue 42,404 45,022 44,374 (648)
Fiscal Year2017-18
M:\MinShare\PublnsProd\CorpFin\OBM.PUBLNS-2017-18\2017-18_Q1-Report\1Q_source-files\2017-18 Q 1 Report tables.xlsx /Revenue 6 8/21/2017/2:37 PM
REVENUE (millions of dollars)

2017 –18 First Quarter FISCAL Update AND ECONOMIC Statement
8
pdf named: 3Q_16-17_oebm.pdf 2016-17, 3rd Quarter Fiscal Update
Operating Expense by Ministry(millions of dollars)
Change2016-17 fromActual Budget Forecast Budget
Advanced Education 5,380 5,510 5,510 - Agriculture and Forestry 1,082 1,040 1,042 2 Children's Services 1,288 1,370 1,370 - Community and Social Services 3,248 3,313 3,313 - Culture and Tourism 290 285 287 2 Economic Development and Trade 266 341 341 - Education 7,794 7,853 7,853 - Energy 448 480 477 (3) Environment and Parks 409 448 447 (1) Executive Council 26 27 27 - Health 19,299 20,026 20,029 3 Indigenous Relations 176 180 177 (3) Infrastructure 487 496 496 - Justice and Solicitor General 1,396 1,401 1,402 1 Labour 192 202 202 - Municipal Affairs 240 269 267 (2) Seniors and Housing 586 594 595 1 Service Alberta 256 260 264 4 Status of Women 7 7 7 - Transportation 464 456 457 1 Treasury Board and Finance 1,320 1,525 1,523 (2) Legislative Assembly 118 126 126 - In-year savings - (200) (400) (200) Total Operating Expense - excluding Climate Leadership Plan 44,772 46,010 45,812 (198) Climate Leadership Plan:
Energy 1,119 35 35 - Environment and Parks 94 405 369 (36) Indigenous Relations 5 1 37 36 Treasury Board and Finance 154 417 317 (100) Other (Agriculture and Forestry / other) 7 10 10 -
Total Climate Leadership Plan Operating Expense 1,379 868 768 (100) Total Operating Expense 46,151 46,878 46,580 (298)
pdf named: 3Q_16-17_oebm.pdf
Fiscal Year2017-18
M:\MinShare\PublnsProd\CorpFin\OBM.PUBLNS-2017-18\2017-18_Q1-Report\1Q_source-files\2017-18 Q 1 Report tables.xlsx /Operating Exp 7 8/21/2017/11:26 AM
pdf named: 3Q_16-17_dea.pdf 2016-17, 3rd Quarter Fiscal Update
Disaster / Emergency Assistance Expense(millions of dollars)
Change2016-17 fromActual Budget Forecast Budget
Agriculture and Forestry - wildfires 243 - - - Agriculture and Forestry - agriculture indemnities 214 - - - Municipal Affairs - Wood Buffalo wildfire / other 711 2 2 - 2013 Alberta flood assistance (Environ. & Parks / Indigen. Rel. / Infrastructure / other) 23 33 11 (22) Unallocated - 200 200 - Total Disaster / Emergency Assistance 1,191 235 213 (22)
Fiscal Year2017-18
M:\MinShare\PublnsProd\CorpFin\OBM.PUBLNS-2017-18\2017-18_Q1-Report\1Q_source-files\2017-18 Q 1 Report tables.xlsx /Disaster-emerg Assist 7 8/16/2017/1:08 PM
OPERATING EXPENSE BY MINISTRY(millions of dollars)
pdf named: 3Q_16-17_ic.pdf 2016-17, 3rd Quarter Fiscal Update
Inventory Consumption Expense(millions of dollars)
Change2016-17 fromActual Budget Forecast Budget
Health 849 851 851 - Infrastructure 3 13 13 - Service Alberta 12 10 10 - Transportation 44 50 50 - Other (Agriculture and Forestry / Culture and Tourism) 1 2 2 - Total Inventory Consumption Expense 908 926 926 -
Fiscal Year2017-18
M:\MinShare\PublnsProd\CorpFin\OBM.PUBLNS-2017-18\2017-18_Q1-Report\1Q_source-files\2017-18 Q 1 Report tables.xlsx /Inventory Consump 7 8/16/2017/1:08 PM
DISASTER / EMERGENCY ASSISTANCE EXPENSE(millions of dollars)
INVENTORY CONSUMPTION EXPENSE(millions of dollars)

2017 –18 First Quarter FISCAL Update AND ECONOMIC Statement
9
pdf named: 3Q_16-17_ca.pdf 2016-17, 3rd Quarter Fiscal Update
Capital Amortization Expense(millions of dollars)
Change2016-17 fromActual Budget Forecast Budget
Advanced Education 507 523 523 - Agriculture and Forestry 25 29 29 - Children's Services 3 2 2 - Community and Social Services 5 12 12 - Culture and Tourism 3 3 3 - Economic Development and Trade 5 5 5 - Education 339 372 372 - Energy 22 22 22 - Environment and Parks 43 44 44 - Health 569 566 566 - Infrastructure 105 128 128 - Justice and Solicitor General 12 15 15 - Labour 1 1 1 - Municipal Affairs 2 3 3 - Seniors and Housing 37 41 41 - Service Alberta 64 85 85 - Transportation 516 568 568 - Treasury Board and Finance 23 25 24 (1) Legislative Assembly 1 4 4 - Total Amortization Expense 2,283 2,448 2,447 (1)
Fiscal Year2017-18
M:\MinShare\PublnsProd\CorpFin\OBM.PUBLNS-2017-18\2017-18_Q1-Report\1Q_source-files\2017-18 Q 1 Report tables.xlsx /Amortization 8 8/16/2017/1:08 PM
CAPITAL AMORTIZATION EXPENSE(millions of dollars)
DEBT SERVICING COSTS (millions of dollars)
pdf named: 3Q_16-17_dbs.pdf 2016-17, 3rd Quarter Fiscal Update
Debt Servicing Costs(millions of dollars)
Change2016-17 fromActual Budget Forecast Budget
GeneralAdvanced Education – post-secondary institutions 39 41 41 - Agriculture and Forestry – Agriculture Financial Services Corporation 69 71 71 - Education – school boards 14 9 9 - Health – Alberta Health Services 16 15 15 - Seniors and Housing – Alberta Social Housing Corporation 6 5 5 - Treasury Board and Finance – Alberta Capital Finance Authority / other 293 478 498 20
Total general debt servicing costs 438 619 639 20 Capital Plan
Education – Alberta Schools Alternative Procurement P3s 30 29 29 - Transportation – ring road P3s 83 94 94 - Treasury Board and Finance – direct borrowing 467 656 641 (15)
Total Capital Plan debt servicing costs 580 779 764 (15) Total Debt Servicing Costs 1,018 1,398 1,403 5
Fiscal Year2017-18
M:\MinShare\PublnsProd\CorpFin\OBM.PUBLNS-2017-18\2017-18_Q1-Report\1Q_source-files\2017-18 Q 1 Report tables.xlsx /Debt Servicing Costs 8 8/16/2017/1:09 PM
INVENTORY ACQUISITION(millions of dollars)
pdf named: 3Q_16-17_ia.pdf 2016-17, 3rd Quarter Fiscal Update
Inventory Acquisition(millions of dollars)
Change2016-17 fromActual Budget Forecast Budget
Health 840 851 851 - Infrastructure 3 3 3 - Service Alberta 12 10 10 - Transportation 41 50 50 - Other (Agriculture and Forestry / Culture and Tourism) 5 2 2 - Total Inventory Acquisition 900 916 916 -
pdf named: 3Q_16-17_ia.pdf
Fiscal Year2017-18
M:\MinShare\PublnsProd\CorpFin\OBM.PUBLNS-2017-18\2017-18_Q1-Report\1Q_source-files\2017-18 Q 1 Report tables.xlsx /Invent Acquisition 8 8/16/2017/1:09 PM

2017 –18 First Quarter FISCAL Update AND ECONOMIC Statement
10
pdf named: 3Q_16-17_ContAcct.pdf 2016-17, 3rd Quarter Fiscal Update
Contingency Account(millions of dollars)
Change2016-17 fromActual Budget Forecast Budget
Balance at Start of Year 3,625 2,299 2,299 - Surplus / (Deficit) (10,784) (10,497) (10,538) (41)
Cash Adjustments (negative = cash requirement; positive = cash source)SUCH / Alberta Innovates own-source revenue / expense 524 269 224 (45) Pension provisions (non-cash expense) (543) (237) (237) - Net deferred capital contribution adjustment (excluding SUCH) 104 37 256 219 Retained income of funds, agencies and accounts:
Alberta Heritage Savings Trust Fund inflation-proofing (182) (292) (246) 46 Alberta Treasury Branches (151) (93) (114) (21) Agriculture Financial Services Corporation (256) (355) (391) (36) Endowment funds (347) (66) (107) (41) Alberta Social Housing Corporation 4 78 53 (25) Alberta Capital Finance Authority (56) (47) (44) 3 Climate Change and Emiss. Mgmt. Fund / Carbon Levy acct. / Energy Effic. Ab. 1,013 24 (95) (119) Balancing Pool 1,952 - 120 120 Other (31) (157) (148) 9
Energy royalties (difference between accrued revenue and cash) (397) 100 357 257 Student loans (432) (362) (375) (13) Other cash adjustments 290 (80) (782) (702) 2013 Alberta flood assistance revenue / expense (182) (114) (191) (77) 2016 Wood Buffalo wildfire revenue / expense 240 (90) (250) (160) Inventory acquisition (122) (131) (131) - Inventory consumption (non-cash expense) 127 140 140 - Capital Plan (excluding SUCH sector) cash sources / (requirements):
Capital investment (3,714) (4,786) (4,549) 237 Amortization / book value of disposals (non-cash expense) 903 1,015 1,014 (1) Withdrawal from / (deposit to) Capital Plan financing account 498 849 1,394 545 Direct borrowing for the Capital Plan 4,686 5,954 5,038 (916) Alternative financing (P3s – public-private partnerships) 83 108 109 1 Current principal repayments (P3s) (51) (61) (59) 2
Surplus / (Deficit) plus net cash adjustments (6,824) (8,794) (9,552) (758) Cash from prior-year final results (695) - 2,392 2,392 Cash to be transferred next year (2,392) - - - Direct borrowing for the Fiscal Plan 8,585 6,495 4,861 (1,634) Balance at End of Year 2,299 - - -
pdf named: 3Q_16-17_ContAcct.pdf
Fiscal Year2017-18
a Negative adjustments are a cash requirement; positive adjustments are a cash source.
M:\MinShare\PublnsProd\CorpFin\OBM.PUBLNS-2017-18\2017-18_Q1-Report\1Q_source-files\2017-18 Q 1 Report tables.xlsx /Contingency Account 9 8/16/2017/1:09 PM
pdf named: 3Q_16-17_finr.pdf 2016-17, 3rd Quarter Fiscal Update
2016-17 Financing Requirements a
(millions of dollars)
Change2016-17 from
Estimate Actual Change Actual Budget Forecast BudgetFinancing Requirements / Completed to DateDirect borrowing for capital purposes 1,489 1,000 (489) 4,686 5,954 5,038 (916) Direct borrowing for the Fiscal Plan 1,591 1,550 (41) 8,585 6,362 4,861 (1,501) Term debt borrowing for provincial corporationsb:
Agriculture Financial Services Corporation 79 - (79) 196 315 315 - Alberta Capital Finance Authority 763 599 (164) 2,584 3,050 3,050 - Alberta Petroleum Marketing Commission 120 - (120) 329 481 481 - The Balancing Pool - 98 98 232 - 391 391 Alberta Treasury Branches 625 - (625) 699 2,500 2,000 (500)
Total Financing Requirements / Completed to Date 4,667 3,247 (1,420) 17,311 18,662 16,136 (2,526)
pdf named: 3Q_16-17_finr.pdf
First 3 months of 2017-18 Fiscal Year2017-18
M:\MinShare\PublnsProd\CorpFin\OBM.PUBLNS-2017-18\2017-18_Q1-Report\1Q_source-files\2017-18 Q 1 Report tables.xlsx /Financing Rqts 9 8/18/2017/6:38 PM
a Since June 30 2017, additional debt has been issued for Fiscal Plan purposes (Cdn$1,700 million), hte Capital Plan (Cdn$1,262 million) and Alberta Capital Finance Authority (Cdn$342 million).
b Gross borrowing requirements for provincial corporations. Include amounts of maturing debt being re‑financed.
2017 –18 FINANCING REQUIREMENTS a (millions of dollars)
CONTINGENCY ACCOUNT(millions of dollars)

2017 –18 First Quarter FISCAL Update AND ECONOMIC Statement
11
2017-18 Capital Plan spending is forecast to be $8 .8 billion, a decrease of $398 million from Budget 2017 .
The decrease is primarily due to re-profiling of school, health facility, continuing care, housing and other projects to future years and savings on projects, partly offset by increases related to federal infrastructure programs and projects carried over from 2016-17 .
Factors impacting project progress include rate of meeting federal elgibility criteria, project delays, scope and land conditions and timing related to planning and permitting .
Direct borrowing of $5 billion is forecast, a decrease of $916 million from budget, due mainly to additional borrowing in 2016-17 reflected in the higher capital plan financing account balance, and the lower spending forecast for 2017-18 .
Cash received for capital purposes has increased $215 million, due to higher federal transfers, and to including some federal transfers to post-secondary institutions and the Alberta Social Housing Corporation (ASHC), instead of reporting these as SUCH sector self-financed or from agency retained income . Lower ASHC spending has also reduced contributions from agency retained income .
Capital Plan Highlights
pdf named: 3Q_16-17_CP-sum.pdf 2016-17, 3rd Quarter Fiscal Update
Capital Plan (millions of dollars)
Change2016-17 from
By Ministry Actual Budget Forecast Budget
Advanced Education 731 1,051 1,056 5 Agriculture and Forestry 51 54 53 (1) Children's Services 1 2 2 - Community and Social Services 4 4 4 - Culture and Tourism 47 65 65 - Economic Development and Trade 11 11 11 - Education 1,390 1,389 1,131 (258) Energy 47 229 234 5 Environment and Parks 44 135 141 6 Health 667 1,132 1,046 (86) Indigenous Relations 8 8 8 - Infrastructure 199 282 220 (62) Justice and Solicitor General 3 4 5 1 Labour 2 1 3 2 Municipal Affairs 1,483 1,457 1,457 - Seniors and Housing 328 306 281 (25) Service Alberta 94 136 144 8 Transportation 1,267 2,586 2,604 18 Treasury Board and Finance 15 18 18 - Legislative Assembly 1 2 2 - 2013 Alberta flood assistance - various 179 90 78 (12) Climate Leadership Plan:
Economic Development and Trade - 10 10 - Environment and Parks - 168 168 - Health 2 16 16 - Transportation 1 17 17 - Other (Agric. and Forestry / Infra. / Muni. Affairs / Treasury Bd. And Finance) 4 3 3 -
Total Capital Plan 6,578 9,175 8,777 (398)
Capital Plan FinancingCash received / assets donated for capital purposes 535 842 1,057 215 Retained income of funds and agencies 56 189 66 (123) SUCH sector self-financed 703 1,019 899 (120) Climate Leadership Plan 7 214 214 - Book value of capital asset disposals 10 - - - Alternative financing (P3s) 83 108 109 1 Direct borrowing 4,686 5,954 5,038 (916) Capital Plan financing account withdrawal / (deposit) 498 849 1,394 545 Total Capital Plan Financing 6,578 9,175 8,777 (398)
Fiscal Year2017-18
M:\MinShare\PublnsProd\CorpFin\OBM.PUBLNS-2017-18\2017-18_Q1-Report\1Q_source-files\2017-18 Q 1 Report tables.xlsx /Capital Plan 10 8/16/2017/1:10 PM
CAPITAL PLAN SUMMARY(millions of dollars)

Economic growth exceeds expectationsThe Alberta economy exceeded expectations in the first half of 2017. Nearly every sector of the economy is rebounding, which has revived exports and manufacturing shipments and boosted employment by almost 17,000 so far this year. The Alberta Activity Index (AAX)1, a composite indicator of economic activity in the province, is up 4.9% year‑to‑date (Figure 1). Reflecting first half strength, real GDP is now expected to grow 3.1% in 2017, up from the 2.6% forecast in Budget 2017. The forecast for 2018 is mostly unchanged at 2.3%, as the pace of growth is expected to moderate heading into next year.
Despite the improved outlook, the lingering effects of the two‑year downturn continue to dampen corporate profits, household incomes and Government of Alberta revenues. The contraction in 2016 was deeper than expected with nominal GDP, a broad measure of income, falling an estimated 6.0%. Even with a strong rebound in 2017, corporate profits are expected to be well below 2014 levels.
1 More information about the Alberta Activity Index can be found at http://www.finance.alberta.ca/aboutalberta/archive‑alberta‑activity‑index.html
Lower prices weigh on profitsThe increase in economic activity in the province will help corporate profits rebound in 2017 after a dramatic decline in 2015 and 2016. However, the rebound is more muted than expected at Budget due to the weaker outlook for oil prices. Also impacting profits and export revenues is the recent appreciation of the Canadian dollar, mainly due to the recent interest rate increase by the Bank of Canada and broad‑based weakness in the US dollar. The Canadian dollar is now expected to average 77 US ¢/Cdn$ in 2017‑18, up a full cent from Budget.
Oil and gas sector fuels recoveryDrilling activity has been strong so far in 2017. Both the rig count and the number of metres drilled have doubled from last year’s levels. As a result, conventional oil and gas investment is projected to rise 40% in 2017. This is partly offset by a larger‑than‑expected contraction in non‑conventional investment, which is now forecast to decline by nearly14%. With many large oil sands projects moving from construction to production, oil production is expected to grow by over 300,000 barrels per day (bpd) in 2017‑18.
Commercial construction laggingNon‑residential investment outside of the oil and gas sector has continued to decrease. Many construction projects underway prior to the oil price drop continue to wind down, pushing commercial investment to the lowest level in over six years. Higher institutional and governmental building is partially offsetting the private sector declines. Weakness is likely to persist into 2018 as the value of non‑residential building permits has drifted lower in 2017.
Quarterly Economic Review2017
Last updated: 8/9/2017: 10:21 AM
Figure 1. Energy sector leads activity growthContribution to year‐over‐year change in the Alberta Activity Index
Source: Alberta Treasury Board and Finance
chrt_01.pdf
-8-6-4-202468
1012
(Percentage Points)
EnergyGeneral Business ActivityHousehold ActivityLabour MarketAlberta Activity Index
Source: Alberta Treasury Board and Finance
Figure 1. Contribution to year-over-year change in the Alberta Activity Index
Moreover, an improving labour market has yet to translate into higher average weekly earnings.
Energy prices lowerOil prices have not met Budget expectations. Elevated global inventories and higher‑than‑expected oil production in the US, Libya and Nigeria have kept a ceiling on oil prices despite a renewed commitment from OPEC and 11 other countries to extend production cuts into the first quarter of 2018. This has led to a revision in the 2017‑18 forecast for WTI to US$49/bbl, down US$6/bbl from the Budget forecast.
Alberta’s heavy oil exporters have benefited the most from the OPEC cuts, which have focused on heavier crude types. This, combined with supply outages in the oil sands, has boosted the price of the Alberta heavy oil benchmark (WCS) relative to WTI. However, pipeline capacity is expected to become limited towards the end of 2017 as rising oil sands production causes the differential to widen. Reflecting these developments, the forecast for the WTI‑WCS differential in 2017‑18 has been revised down $3.80/bbl from Budget to $12.20/bbl.
2017 –18 First Quarter FISCAL Update AND ECONOMIC Statement
12
ECONOMIC OUTLOOK

Alberta business output indicatorsChart Title
Source
chrt_02.pdf
4.5
5.0
5.5
6.0
6.5
7.0
5
6
7
8
9
10
11
($Billions)($Billions)International Merchandise Exports (Left)Manufacturing Sales (Right)
Source: Statistics Canada
Figure 2. Business output indicators
Business output reboundsExports and manufacturing sales have surged since bottoming out in late 2016. Both have recovered over half of the value lost during the downturn (Figure 2). Stronger oil prices helped to springboard the recovery by boosting the value of energy exports and petroleum and petrochemical manufacturing. Petrochemicals production further benefited from expanded capacity. Strong sales in food and wood products manufacturing helped to sustain the recovery in the first half of 2017. Real exports are expected to grow by 5.8% in 2017 and 4.2% in 2018.
Labour market improves As with the improvement in business activity, the recovery in employment has been stronger than expected at Budget. Since hitting bottom in July 2016, the Alberta economy has added 34,500 jobs; half were added in 2017. At the same time, there has been a shift from part‑time to full‑time employment, another indication that underlying labour market conditions are improving. Employment is forecast to grow by 1.3% in 2017 and 1.6% in 2018 (Figure 3), up from the Budget forecast of 0.9% and 1.4%, respectively. The unemployment rate has fallen 1.2 percentage points since
reaching a 20‑year high in November 2016, aided by stronger employment growth. Reflecting the improvement, the unemployment rate forecast has been lowered to 7.8% in 2017 and 7.3% in 2018.
Slower earnings recoveryA recovering labour market has not yet translated into a significant improvement in average weekly earnings (AWE), which have essentially remained at 2016 levels. The loss of high paying jobs during the recession, as well as reduced weekly hours worked, are a continuing source of weakness. Because of the trend to date, the forecast for AWE growth in 2017 has been revised 0.4 percentage points lower to 1.0%. The 2018 forecast is unchanged from Budget 2017 at 2.0%.
Housing market strengthensResidential investment has improved in the province, despite inventories of new and unsold homes remaining high. Single‑unit housing starts have picked up and multi‑unit construction has stabilized. In addition, rebuilding in Fort McMurray has proceeded faster than expected at Budget. Consequently, the forecast for housing starts has been increased from 24,500 to 27,100 for 2017. The forecast for housing starts in 2018 is now 28,500.
Risks to the Outlook ■ If OPEC production cuts are not sustained or US production continues to rise, oil prices could remain weaker for longer.
■ Ongoing appreciation of the Canadian dollar could be a drag on exports and revenue.
■ Canadian and Alberta households remain exposed to rising interest rates. Rising debt‑servicing costs could have a negative impact on consumption and overall growth.
Quarterly Economic Review2017
Last updated: 8/16/2017: 9:55 AM
Figure 3. Stronger employment expected to abate unemployment rateEmployment and Unemployment Rate
Sources: Statistics Canada and Alberta Treasury Board and Finance; f‐forecast
chrt_03.pdf
3
4
5
6
7
8
9
1.8
1.9
2.0
2.1
2.2
2.3
2.4
2010 2011 2012 2013 2014 2015 2016 2017f 2018f
(%)(millions)Employment (Left)Unemployment Rate (Right)
Sources: Statistics Canada & Alberta Treasury Board and Finance
Figure 3. Labour market indicators
2017 –18 First Quarter FISCAL Update AND ECONOMIC Statement
13
ECONOMIC OUTLOOK

Fiscal Year Assumptions 2016‑17 Actual2017‑18
3 Month Actual
2017‑18 Fiscal Year
Budget 1st Quarter
Prices
Crude Oil Price
WTI (US$/bbl) 47.93 48.29 55.00 49.00
Light‑Heavy Differential (US$/bbl) 13.93 11.13 16.00 12.20
WCS @ Hardisty (Cdn$/bbl) 44.67 49.99 51.30 47.70
Natural Gas Price
Alberta Reference Price (Cdn$/GJ) 2.01 2.40 2.90 2.60
Production
Conventional Crude Oil (000s barrels/day) 431 n/a 416 423
Raw Bitumen (000s barrels/day) 2,546 n/a 2,906 2,883
Natural Gas (billions of cubic feet) 4,183 n/a 4,094 4,095
Interest rates
3‑month Canada Treasury Bills (per cent) 0.51 0.56 0.54 0.87
10‑year Canada Bonds (per cent) 1.39 1.50 2.00 1.90
Exchange Rate (US¢/Cdn$) 76.2 74.4 76.0 77.0
Key Energy and Economic Assumptions
Calendar Year Assumptions2016 Calendar Year 2017 Calendar Year 2018 Calendar Year
Budget1st
QuarterBudget
1st Quarter
Budget1st
Quarter
Gross Domestic Product
Nominal (millions of dollars) 309,105a 306,731a 325,342 323,298 343,004 336,692
per cent change ‑5.3a ‑6.0a 5.3 5.4 5.4 4.1
Real (millions of 2007 dollars) 301,907a 299,767a 309,645 309,048 316,460 316,290
per cent change ‑2.8a ‑3.5a 2.6 3.1 2.2 2.3
Other Indicators
Employment (thousands) 2,264 2,264 2,285 2,293 2,316 2,329
per cent change ‑1.6 ‑1.6 0.9 1.3 1.4 1.6
Unemployment Rate (per cent) 8.1 8.1 8.0 7.8 7.6 7.3
Average Weekly Earnings (per cent change) ‑2.4 ‑2.4 1.4 1.0 2.0 2.0
Primary Household Income (per cent change) ‑3.5a ‑4.5a 1.8 2.7 3.5 3.8
Net Corporate Operating Surplus (per cent change) ‑35.1a ‑35.1a 66.4 61.0 35.9 14.2
Housing Starts (number of units) 24,500 24,500 24,500 27,100 25,700 28,500
Alberta Consumer Price Index (per cent change) 1.1 1.1 1.9 1.6 2.0 1.9
Population (July 1st, thousands) 4,253 4,253 4,306 4,306 4,367 4,367
per cent change 1.8 1.8 1.3 1.3 1.4 1.4
a Alberta Treasury Board and Finance estimate.
2017 –18 First Quarter FISCAL Update AND ECONOMIC Statement
14

2017 –18 First Quarter FISCAL Update AND ECONOMIC Statement
15
Method of ConsolidationThe 2017‑18 First Quarter Fiscal Update and Economic Statement reports on the same scope, using the same method of consolidation, as presented in Budget 2017. This is also the same scope and consolidation approach used in the Consolidated Financial Statements in the Government of Alberta Annual Report .
The results of all government departments, funds and agencies, except those designated as government business enterprises, are consolidated on a line-by-line basis . Revenue and expense transactions between consolidated entities have been eliminated .
The accounts of provincial agencies designated as government business enterprises are included on the modified equity basis, computed in accordance with International Financial Reporting Standards applicable to those entities .
Basis of Financial ReportingThe consolidated fiscal summary reports revenue (including gains from disposal of tangible capital assets), expense (including amortization, inventory consumption, loss on disposal and write-down of tangible capital assets), and surplus / (deficit) .
Revenue and expense are recorded using the accrual basis of accounting . Cash received for goods or services which have not been provided by period end is recorded as unearned revenue .
Transfers received for capital purposes, and donated capital assets, are recorded as “deferred capital contributions” when the cash or asset is received, and recognized in revenue over the related asset’s useful life (in effect matching the asset’s amortization expense) .
Expense includes the province’s cash payments towards the unfunded pension liabilities, and the non-cash change in unfunded pension liabilities .
Debt servicing costs include interest payable, and amortization of issue costs and discounts / premiums on debt issues .
Compliance with LegislationThe Fiscal Planning and Transparency Act (FPTA) requires a public report on the accuracy of the Fiscal Plan on or before August 31 . The FPTA gives the President of Treasury Board and Minister of Finance discretion over the form of the report .
The 2017‑18 First Quarter Fiscal Update and Economic Statement includes comparisons between the Budget 2017estimates and first quarter forecasts for revenue and expense (including details and categories of each); the surplus / (deficit); the Contingency Account balance and cash adjustments; a summary balance sheet; the Capital Plan; and financing (borrowing) requirements . An updated Alberta economic outlook, with associated assumptions, is also provided .
Under the FPTA, operating expense increases, excluding those for dedicated revenue-operating expense, collective bargaining or other remuneration settlements, First Nations settlements, or increases funded by reserves of school boards, post-secondary institutions or Alberta Health Services, are limited to 1% of budgeted operating expense .
The forecast provided in this report is in compliance with the requirements of the FPTA .
REPORTING METHODOLOGY AND LEGISLATIVE COMPLIANCE

Government