second quarter fiscal 2017
TRANSCRIPT

Second Quarter Fiscal 2017
Quarter Ended April 1, 2017

Safe Harbor Statement
2
Certain statements made during this presentation, including the Company's outlook for the third quarter fiscal year 2017 and expectations for the second half of fiscal 2017, constitute forward-looking statements within the meaning of the safe harbor provisions of Section 21E of the Securities Exchange Act of 1934. Actual results could differ materially from those projected in these statements as a result of a number of factors, including adverse changes to the key markets we target; risks arising from our international operations; competition that could cause us to lose sales; reliance on a relatively small number of customers for a majority of our sales; and the other factors set forth in the Company's annual and quarterly reports filed with the Securities Exchange Commission (“SEC”). In addition, during the course of today's presentation, we will refer to certain non-GAAP financial information. The corresponding GAAP financial information and a reconciliation of the non-GAAP results disclosed during this presentation to their more directly comparable GAAP measures are included on slide 17 of this presentation.
The Company is under no obligation to (and expressly disclaims any such obligation to) update or alter any of the forward-looking statements made in this presentation, the press release, the conference call or the Investor Relations section of our website whether as a result of new information, future events or otherwise, unless otherwise required by law.
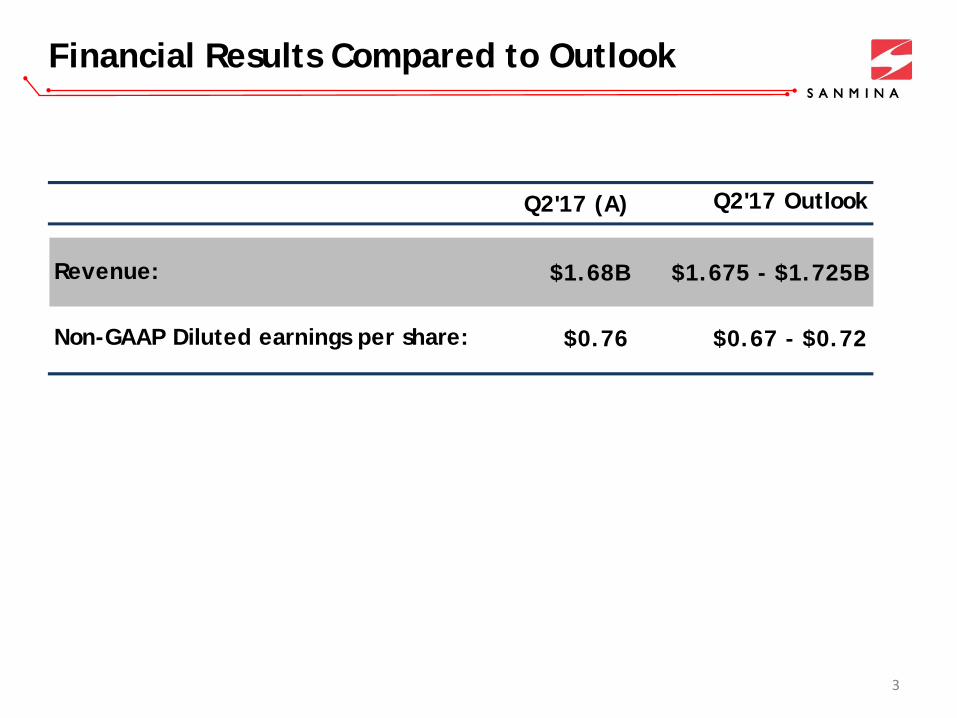
Financial Results Compared to Outlook
3
Q2'17 (A) Q2'17 Outlook
$1.68B $1.675 - $1.725B
$0.76 $0.67 - $0.72
Revenue:
Non-GAAP Diluted earnings per share:
Q2'17 Q1'17 Q2'16
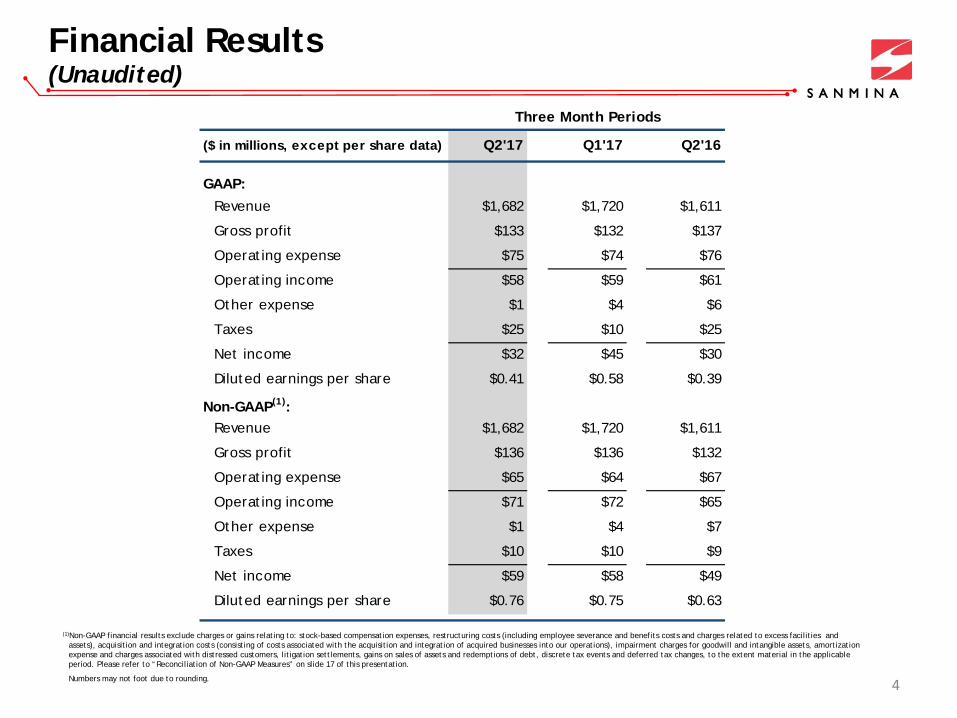
GAAP:
$1,682 $1,720 $1,611
$133 $132 $137
$75 $74 $76
$58 $59 $61
$1 $4 $6
$25 $10 $25
$32 $45 $30
$0.41 $0.58 $0.39
$1,682 $1,720 $1,611
$136 $136 $132
$65 $64 $67
$71 $72 $65
$1 $4 $7
$10 $10 $9
$59 $58 $49
$0.76 $0.75 $0.63
Operating income
Other expense
Taxes
Three Month Periods
Taxes
Net income
Non-GAAP(1):
($ in millions, except per share data)
Net income
Diluted earnings per share
Gross profit
Operating expense
Operating income
Diluted earnings per share
Other expense
Revenue
Revenue
Gross profit
Operating expense
4
Financial Results (Unaudited)
(1)Non-GAAP financial results exclude charges or gains relating to: stock-based compensation expenses, restructuring costs (including employee severance and benefits costs and charges related to excess facilities and assets), acquisition and integration costs (consisting of costs associated with the acquisition and integration of acquired businesses into our operations), impairment charges for goodwill and intangible assets, amortization expense and charges associated with distressed customers, litigation settlements, gains on sales of assets and redemptions of debt, discrete tax events and deferred tax changes, to the extent material in the applicable period. Please refer to “Reconciliation of Non-GAAP Measures” on slide 17 of this presentation.
Numbers may not foot due to rounding.

Components, Products & Services
Segment Reporting – Revenue and Non-GAAP Gross Margin* ($ in Millions)
5
Integrated Manufacturing Solutions Components, Products and Services
Components
‒ Interconnect Systems • High Technology Printed Circuits • Backplane Assemblies • Cable Assemblies
‒ Mechanical Systems • Precision Machining • Enclosures • Plastics
Integrated Manufacturing Solutions
PCB Assembly & Test Final System Assembly & Test Direct Order Fulfillment
Products
‒ Computing & Storage ‒ Defense & Aerospace ‒ Memory & SSD Modules ‒ Optical & RF Modules
Services ‒ Design & Engineering ‒ Logistics ‒ Repair
*Non-GAAP revenue and gross margin for IMS segment and CPS category includes inter-segment revenues that are eliminated under GAAP and exclude the same GAAP items that are excluded from the calculation of non-GAAP gross margin for the consolidated business. The reconciliation of non-GAAP gross margin for the consolidated business to GAAP gross margin is shown on slide 17.

Operating Income / Margin
Non-GAAP P&L Metrics ($ in Millions)
Gross Profit / Margin
6

Summary Balance Sheet ($ in Millions)
7
4/1/17 12/31/16 4/2/16
$433 $405 $407
971 993 999
1,019 964 923
623 621 612
501 513 476
173 172 182
$3,720 $3,668 $3,598
$1,174 $1,171 $1,104
3 43 136
394 393 438
432 397 425
1,717 1,663 1,495
$3,720 $3,668 $3,598
Total stockholders' equity
Total liabilities and stockholders' equity
Other assets
Inventories
Property, plant and equipment, net
Total assets
Accounts payable
Long-term debt
Other liabilities
Cash and cash equivalents
Accounts receivable, net
Short-term debt
Deferred tax assets
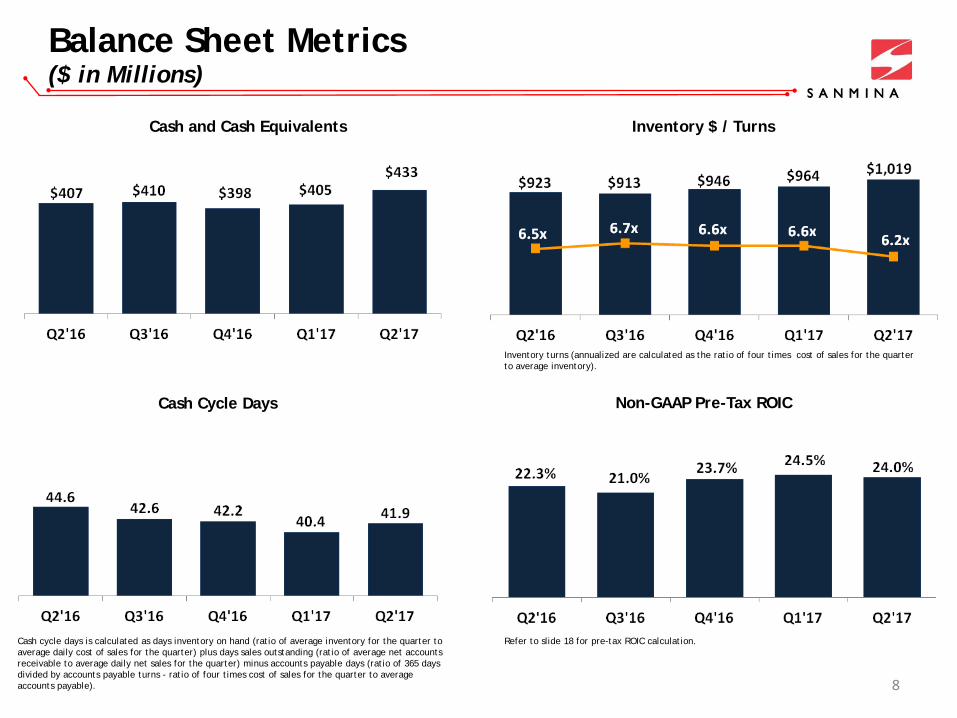
Balance Sheet Metrics ($ in Millions)
Cash and Cash Equivalents Inventory $ / Turns
Cash Cycle Days Non-GAAP Pre-Tax ROIC
8
Inventory turns (annualized are calculated as the ratio of four times cost of sales for the quarter to average inventory).
Cash cycle days is calculated as days inventory on hand (ratio of average inventory for the quarter to average daily cost of sales for the quarter) plus days sales outstanding (ratio of average net accounts receivable to average daily net sales for the quarter) minus accounts payable days (ratio of 365 days divided by accounts payable turns - ratio of four times cost of sales for the quarter to average accounts payable).
Refer to slide 18 for pre-tax ROIC calculation.

Q3’17 Outlook
The following outlook is for the third fiscal quarter ending July 1, 2017. These statements are forward-looking and actual results may differ materially.
Revenue: $1.7 - $1.8B
GAAP Diluted EPS(1) : $0.65 - $0.70
Non-GAAP Diluted EPS: $0.72 - $0.77
9
(1) Includes stock-based compensation expense of $0.06 and amortization of intangible assets of $0.01

CEO Remarks
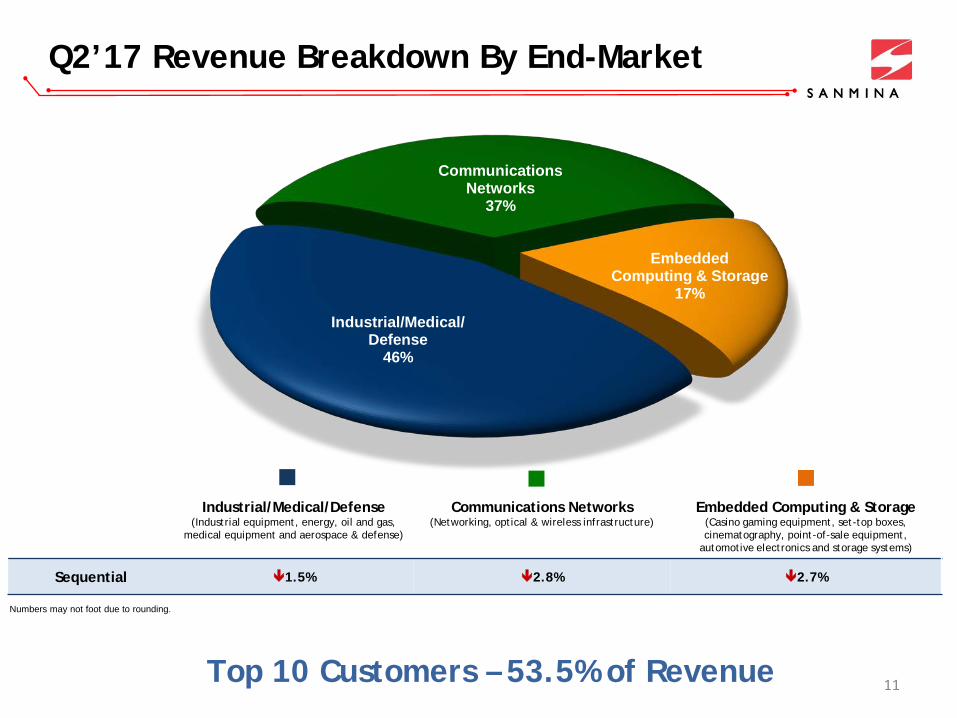
Industrial/Medical/Defense (Industrial equipment, energy, oil and gas,
medical equipment and aerospace & defense)
Communications Networks (Networking, optical & wireless infrastructure)
Embedded Computing & Storage (Casino gaming equipment, set-top boxes, cinematography, point-of-sale equipment,
automotive electronics and storage systems)
Sequential 1.5% 2.8% 2.7%
Q2’17 Revenue Breakdown By End-Market
11
Numbers may not foot due to rounding.
Top 10 Customers – 53.5% of Revenue
Embedded Computing & Storage
17%
Industrial/Medical/ Defense
46%
Communications Networks
37%
Embedded Computing & Storage
17%

Q3’17 End-Market Outlook
12
Industrial/Medical/Defense (Industrial equipment, energy, oil and gas and medical equipment, aerospace & defense)
FLAT
Communications Networks (Networking, optical & wireless infrastructure)
Embedded Computing & Storage (Casino gaming equipment, set-top boxes, cinematography, point-of-sale equipment, automotive electronics and storage systems)
Collaborative Design and Engineering
Interconnect Systems
Mechanical Systems
Optical / RF Solutions
Integrated Manufacturing
Solutions
Products and Services
Direct Order Fulfillment
and Logistics
Focused on Key Markets Providing Competitive Advantage

Summary
13
Q2’17:
Consistent gross and operating margin Non-GAAP EPS expanded Solid cash flow from operations
Q3’17:
Good demand
Remain focused on quality of growth
FY’17:
Solid first half, expect stronger second half fiscal 2017
Continue to drive improvements and shareholder value
Consistent and Predictable Results
Consolidated Financial Statements Reconciliation of GAAP vs Non-GAAP
Quarter Ended April 1, 2017

GAAP Condensed Consolidated Balance Sheet
15
April 1, October 1,(in thousdands) 2017 2016
(Unaudited)ASSETS
Current assets:Cash and cash equivalents 432,527$ 398,288$ Accounts receivable, net 971,363 973,680 Inventories 1,019,155 946,239 Prepaid expenses and other current assets 54,362 57,445
Total current assets 2,477,407 2,375,652
Property, plant and equipment, net 623,037 617,524 Deferred tax assets 500,675 514,314 Other 118,989 117,732
Total assets 3,720,108$ 3,625,222$
LIABILITIES AND STOCKHOLDERS' EQUITY
Current liabilities:Accounts payable 1,174,209$ 1,121,135$ Accrued liabilities 130,724 124,386 Accrued payroll and related benefits 118,852 127,326 Short-term debt 3,416 28,416
Total current liabilities 1,427,201 1,401,263
Long-term liabilities:Long-term debt 393,762 434,059 Other 182,442 180,097
Total long-term liabilities 576,204 614,156
Stockholders' equity 1,716,703 1,609,803 Total liabilities and stockholders' equity 3,720,108$ 3,625,222$

GAAP Condensed Consolidated Statement of Operations (Unaudited)
16
April 1, April 2, April 1, April 2,2017 2016 2017 2016
Net sales 1,682,262$ 1,611,174$ 3,402,239$ 3,145,888$ Cost of sales 1,549,052 1,474,462 3,136,867 2,885,538
Gross profit 133,210 136,712 265,372 260,350
Operating expenses:Selling, general and administrative 62,388 63,494 127,528 121,187 Research and development 8,437 9,997 16,608 19,644 Amortization of intangible assets 918 918 1,836 1,610 Restructuring costs 3,301 1,204 4,029 1,757 Asset impairments - - - 1,000 Gain on sales of long-lived assets - - (1,451) - Total operating expenses 75,044 75,613 148,550 145,198
Operating income 58,166 61,099 116,822 115,152
Interest income 238 159 439 307 Interest expense (5,486) (6,353) (10,753) (12,231) Other income, net 3,812 489 5,069 271
Interest and other, net (1,436) (5,705) (5,245) (11,653)
Income before income taxes 56,730 55,394 111,577 103,499 Provision for income taxes 25,013 25,033 34,996 46,000
Net income 31,717$ 30,361$ 76,581$ 57,499$
Basic income per share 0.42$ 0.40$ 1.03$ 0.75$ Diluted income per share 0.41$ 0.39$ 0.99$ 0.72$
Weighted-average shares used in computing per share amounts: Basic 74,761 75,477 74,156 76,605 Diluted 77,864 78,525 77,531 79,740
(in thousands, except per share data)
Six Months EndedThree Months Ended

Reconciliation of Non-GAAP Measures (Unaudited)
17
($ in thousands, except per share data) Q2'17 Q1'17 Q2'16
GAAP Gross Profit 133,210$ 132,162$ 136,712$ GAAP gross margin 7.9% 7.7% 8.5%
AdjustmentsStock compensation expense (1) 2,035 2,863 1,932 Amortization of intangible assets 902 902 1,202 Reversal of contingent consideration accrual (2) - - (7,558)
Non-GAAP Gross Profit 136,147$ 135,927$ 132,288$ Non-GAAP gross margin 8.1% 7.9% 8.2%
GAAP Operating Expenses 75,044$ 73,506$ 75,613$ Adjustments
Stock compensation expense (1) (5,607) (9,114) (6,553) Amortization of intangible assets (918) (918) (918) Restructuring costs (3,301) (728) (1,204) Gain on sales of long-lived assets - 1,451 - Asset impairments - - -
Non-GAAP Operating Expenses 65,218$ 64,197$ 66,938$
GAAP Operating Income 58,166$ 58,656$ 61,099$ GAAP operating margin 3.5% 3.4% 3.8%
AdjustmentsStock compensation expense (1) 7,642 11,977 8,485 Amortization of intangible assets 1,820 1,820 2,120 Reversal of contingent consideration accrual (2) - - (7,558) Restructuring costs 3,301 728 1,204 Gain on sales of long-lived assets - (1,451) - Asset impairments - - -
Non-GAAP Operating Income 70,929$ 71,730$ 65,350$ Non-GAAP operating margin 4.2% 4.2% 4.1%
GAAP Interest and Other, net (1,436)$ (3,809)$ (5,705)$ Adjustments
Bargain purchase gain, net of tax (3) - - (1,642) Non-GAAP Interest and Other, net (1,436)$ (3,809)$ (7,347)$
GAAP Provision for Income Taxes 25,013$ 9,983$ 25,033$ Adjustments
Tax effect of non-GAAP adjustments 4,684 4,798 1,560 Adjustments for deferred tax and discrete tax items (19,273) (4,593) (17,892)
Non-GAAP Provision for Income Taxes 10,424$ 10,188$ 8,701$
GAAP Net Income 31,717$ 44,864$ 30,361$
Adjustments:Operating income adjustments (see above) 12,763 13,074 4,251 Bargain purchase gain, net of tax (3) - - (1,642) Adjustments for taxes 14,589 (205) 16,332
Non-GAAP Net Income 59,069$ 57,733$ 49,302$
GAAP Net Income Per Share:Basic 0.42$ 0.61$ 0.40$ Diluted 0.41$ 0.58$ 0.39$
Non-GAAP Net Income Per Share:Basic 0.79$ 0.78$ 0.65$ Diluted 0.76$ 0.75$ 0.63$
Basic 74,761 73,554 75,477 Diluted 77,864 77,175 78,525
(1) Stock compensation expense was as follows:
Q2'17 Q1'17 Q2'16
Cost of sales 2,035$ 2,863$ 1,932$ Selling, general and administrative 5,376 8,840 6,422 Research and development 231 274 131 Total 7,642$ 11,977$ 8,485$
(2)
(3) Represents a bargain purchase gain recorded in connection with an acquisition.
Three Month Periods
Weighted-average shares used in computing per share amounts:
Three Month Periods
Represents a reduction in an accrual for contingent consideration related to an acquisiton completed in a previous period.

Pre-tax Return on Invested Capital (ROIC) (Unaudited)
18
Q2 FY17
Pre-tax Return on Invested Capital (ROIC)
GAAP operating income 58,166$ x 4
Annualized GAAP operating income 232,664 Average invested capital (1) ÷ 1,180,950 GAAP pre-tax ROIC 19.7%
Non-GAAP operating income 70,929$ x 4
Annualized non-GAAP operating income 283,716 Average invested capital (1) ÷ 1,180,950 Non-GAAP pre-tax ROIC 24.0%
(1) Invested capital is defined as total assets (not including cash and cash equivalents and deferred tax assets) less total liabilities (excluding short-term and long-term debt).

Condensed Consolidated Cash Flow (Unaudited)
19
(in thousands) Q2'17 Q1'17 Q2'16
GAAP Net Income 31,717$ 44,864$ 30,361$ Depreciation and amortization 29,277 28,972 27,692 Other, net* 19,021 14,098 8,933 Net change in net working capital 8,706 (34,007) 75,663 Cash provided by operating activities 88,721 53,927 142,649
Net purchases of property & equipment (33,370) (18,085) (28,973) Payments for acquisitions - - (58,878) Cash used in investing activities (33,370) (18,085) (87,851)
Net share repurchases 12,048 (2,980) (73,824) Payments for previous acquisitions - (2,262) - Net borrowing activities (40,000) (25,000) 28,034 Cash used in financing activities (27,952) (30,242) (45,790)
Effect of exchange rate changes (112) 1,352 (136)
Net change in cash & cash equivalents 27,287$ 6,952$ 8,872$
Free cash flow: Cash provided by operating activities 88,721$ 53,927$ 142,649$ Net purchases of property & equipment (33,370) (18,085) (28,973)
55,351$ 35,842$ 113,676$
*Primarily stock-based compensation expense and changes in deferred income taxes.
Three Month Periods