2016-17 world’s best workforce report summary · 2016-17 world’s best workforce report summary...
TRANSCRIPT

2016-17 World’s Best Workforce Report Summary
District or Charter Name: La Crescent-Hokah School District
Grades Served: K-12
Contact Person Name and Position: Kevin Cardille, Superintendent
In accordance with Minnesota Statutes, section 120B.11, a school board, at a public meeting, shall adopt a comprehensive, long-term strategic plan to support and improve teaching and learning that is aligned with creating the world's best workforce. The school board must publish an annual report on the previous year’s plan and hold an annual public meeting to review goals, outcomes and strategies. An electronic summary of the annual report must be sent to the Commissioner of Education each year.
This document serves as the required template for submission of the 2016-17 report summary. Districts must submit this completed template by December 15, 2017, to [email protected].
If you have questions while completing this summary, please feel free to email [email protected] or contact Susan Burris ([email protected]), Program Manager for District Support.
1. Stakeholder Engagement
1a. Annual Report
[Note: For each school year, the school board must publish a report in the local newspaper, by mail or by
electronic means on the district website.]
➢ http://www.isd300.k12.mn.us/district/index
➢ This is the link to the website where the World’s Best Workforce report is located. When this document is approved by the board the current report will be linked.
1b. Annual Public Meeting
[Note: School boards are to hold an annual public meeting to communicate plans for the upcoming school year based on a
review of goals, outcomes and strategies from the previous year. Stakeholders should be meaningfully involved, and this
meeting is to occur separately from a regularly scheduled school board meeting. The author’s intent was to have a separate
meeting just for this reason.]
➢ December 14, 7:00 PM MS/HS Cafeteria
➢ There were 30 community members were present.
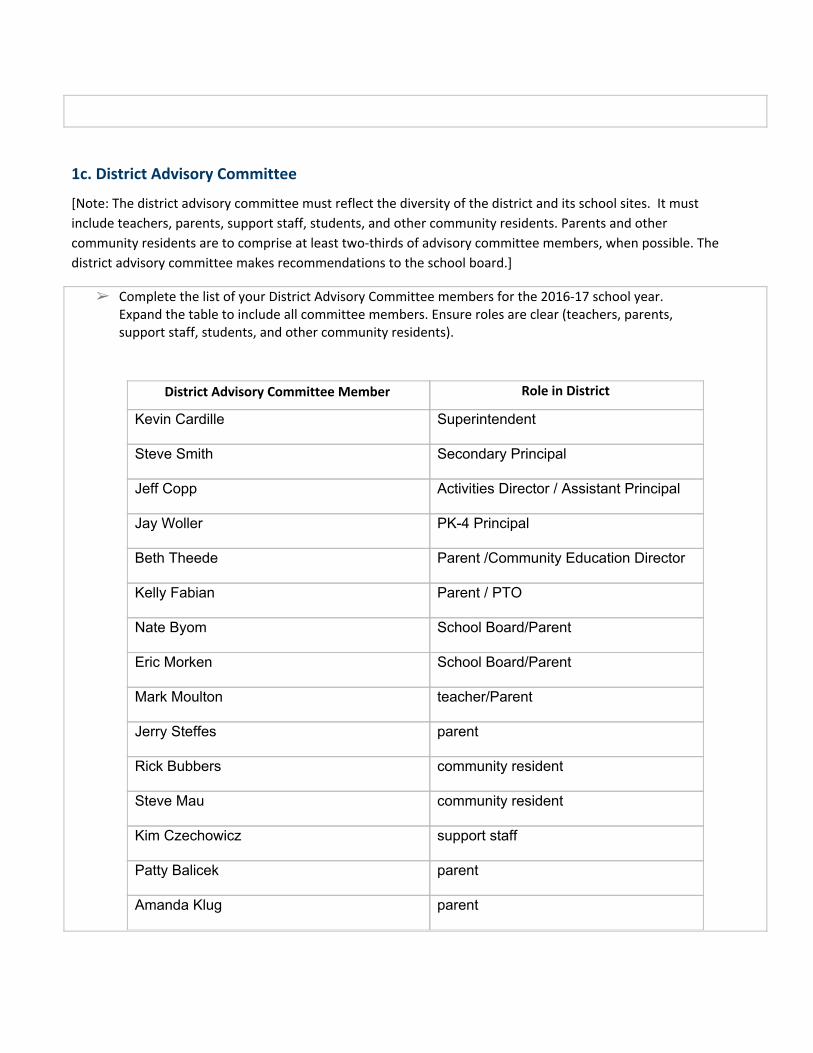
1c. District Advisory Committee
[Note: The district advisory committee must reflect the diversity of the district and its school sites. It must
include teachers, parents, support staff, students, and other community residents. Parents and other
community residents are to comprise at least two-thirds of advisory committee members, when possible. The
district advisory committee makes recommendations to the school board.]
➢ Complete the list of your District Advisory Committee members for the 2016-17 school year. Expand the table to include all committee members. Ensure roles are clear (teachers, parents, support staff, students, and other community residents).
District Advisory Committee Member Role in District
Kevin Cardille Superintendent
Steve Smith Secondary Principal
Jeff Copp Activities Director / Assistant Principal
Jay Woller PK-4 Principal
Beth Theede Parent /Community Education Director
Kelly Fabian Parent / PTO
Nate Byom School Board/Parent
Eric Morken School Board/Parent
Mark Moulton teacher/Parent
Jerry Steffes parent
Rick Bubbers community resident
Steve Mau community resident
Kim Czechowicz support staff
Patty Balicek parent
Amanda Klug parent

Pushpa Sudhakaran Technology staff
Paige Schoepel Support staff/Parent
2. Goals and Results
[Note: SMART goals are: specific and strategic, measurable, attainable (yet rigorous), results-based and
time-based. Goals should be linked to needs and written in SMART-goal format. Results should tie directly back
to the established goal so it is clear whether the goal was met. Districts may choose to use the data profiles
provided by MDE in reporting goals and results or other locally-determined measures. Be sure to check the box
with the most appropriate goal status.]
2a. All Students Ready for School
Goal Result Goal Status
Provide the established SMART goal for the 2016-2017 school year.
Decrease the percentage of children not yet screened at K entrance by 2% from the 15-16 school year.
Increase the percentage of children screened between their third and fourth birthday by 10% for the 16-17 school year.
Increase enrollment in School Readiness offerings (Discovery Preschool) by 10%.
Provide the result for the 2016-2017 school year that directly ties back to the established goal.
In 15-16, 8 of 91 children screened had started Kindergarten (9% of children screened.) In 16-17, 8 of 108 children screened had started Kindergarten (7% of children screened).
In 15-16, 22 of 91 children screened were age 3 (24% of children screened). In 16-17, 38 of 108 students were screened at age 3 (35% of children screened).
In 15-16, 18 3K students and 44 4K students were enrolled in Discovery Preschool. In 16-17, 27 3K students and 56 4K students were enrolled in Discovery Preschool. (50% increase in 3K enrollment; 27% increase in 4K).
Check one of the following:
X Goal Met ☐ Goal Not Met ☐ Goal in Progress (only for multi-year goals) X Goal Met ☐ Goal Not Met ☐ Goal in Progress (only for multi-year goals) X Goal Met ☐ Goal Not Met ☐ Goal in Progress (only for multi-year goals)


2b. All Students in Third Grade Achieving Grade-Level Literacy
Goal Result Goal Status
K-4 Students meeting or exceeding the national norms for expected growth on the FastBridge aReading test will be greater than 50%
As a K-4 site, we did achieve our stated goal. The average growth demonstrated by students tested was above the 50% target for expected growth.
Check one of the following:
xGoal Met ☐ Goal Not Met ☐ Goal in Progress (only for multi-year goals) ☐ District/charter does not enroll students in grade 3
2c. Close the Achievement Gap(s) Among All Groups
Goal Result Goal Status
The percentage of students receiving ADSIS services for reading in grades 5 through 8 in the middle school that show more than 1 years growth on NWEA MAP tests will increase from 68% in 15-16 to 70% in 16-17. Middle School
The percentage of students receiving ADSIS services for Math in grades 5 through 8 in the middle school that show more than 1 years growth on NWEA MAP tests will increase from 67% in 15-16 to 69% in 16-17
The total number of students receiving ADSIS supports in K-4 were (Math: 82) and (Reading: 85) The number of math students improving by greater than one year expected growth were: ( 55 Math) and (44 Reading).
18 of 27 students were able to make more than 1 years growth. 67% is short of our goal of 70% but was significantly greater than 2 years ago. We continue to make significant progress.
22 of our 44 students demonstrated more than 1 year of growth in math this year helping them to close the achievement gap. This is below the goal we set for ourselves.
At the Elementary school - we saw 67% of ADSIS students show above expected growth in Math, and 52% show above expected growth in Reading
Check one of the following:
☐ Goal Met x Goal Not Met ☐ Goal in Progress (only for multi-year goals)

2d. All Students Career- and College-Ready by Graduation
Goal Result Goal Status
Provide the established SMART goal for the 2016-2017 school year.
Goal: The percentage of students who take the ACT and meet or exceed the benchmark score for all 4 categories will increase by 2% from the 2016 measure (36%) to 38% for the 2017 measure. This will be based on the graduating class.
Provide the result for the 2016-2017 school year that directly ties back to the established goal.
Result: The class of 2017 and all seniors who participated in the ACT exam that scored at or above benchmark for all 4 subjects was 35% which did not meet our goal of 38%.
Check one of the following:
☐ Goal Met X Goal Not Met ☐ Goal in Progress (only for multi-year goals)
2e. All Students Graduate
Goal Result Goal Status
Provide the established SMART goal for the 2016-2017 school year.
The percentage of students who graduate will increase or remain the same from 98% from the 2016 to 2017 school year using the 4 year cohort.
Provide the result for the 2016-2017 school year that directly ties back to the established goal.
The percentage of students graduating in the 2017 4 year cohort was 100%.
Check one of the following:
X Goal Met ☐ Goal Not Met ☐ Goal in Progress (only for multi-year goals) ☐ District/charter does not enroll students in grade 12

3. Identified Needs Based on Data
[Note: Data that was reviewed to determine needs may include state-level accountability tests, such as Minnesota Comprehensive Assessments (MCAs) and/or local-level data, such as local assessments, attendance, graduation, mobility, remedial course-taking rates, child poverty, etc.]
➢ List and describe the district’s needs that were identified at the start of the 2016-2017 school year and the data the needs were based upon.
- The District established a concern and need to identify the reason for inconsistent MCA scores. It seems that the year to year scores are more a result of different students tested than the result of lacking of certain curriculum being or not being taught. This entices us to continue to review curriculum to improve what is taught and show that the results are driven by what we do with the students and not so much an inconsistent measure of differing student ability based on a different group of students being assessed.
- The District reviews the MCA data each year and discusses the progress made by students through data coaches and PLC’s. This past year we discussed the importance of comparing our demographics with the demographics of the state. It is the intent to identify a better level of expectation, such as always being above the State average in all areas and grades assessed in the MCA’s, ACT’s, and Fastbridge. Our task this year will be to find an appropriate level above the State average to set our goals. We will compare to similar size and demographic profile. We do feel our students have supportive homes and therefor should be able achieve at a level a fair amount above the state average.
- We are also looking closely at our special needs population. Currently our district spends 22% of it’s budget on special education and ADSIS programs. We are not convinced that our students overall are achieving at the level that they should given the number of safety nets and opportunities that we have for the students we are serving. We will again use the data mentioned in our Strategic Plan and maximize the opportunities for students.
➢ Include only the key data used to determine identified needs and limit response to 300 words. ➢ Bulleted points are welcome and appreciate.
4. Systems, Strategies and Support Category
4a. Students
➢ Describe the areas below. Include only the district focus areas for the 2016-2017 school year and limit response to 300 words. Bulleted points are welcome and appreciated.
o Process for assessing and evaluating student progress toward meeting state and local academic standards.
- Through the district Strategic Plan and IGDP’s the District has set goals and measurement tools to monitor progress at various levels for students. Goals are, Student will meet/exceed proficiency in reading, writing, math, and science in all normed assessments. Master identified essential skills in a comprehensive, diverse, and increasingly relevant curriculum and staff will work with students

to promote critical thinking, collaboration, and communication as critical aspects of teaching, learning, and self evaluation toward growth to success.
o Process to disaggregate data by student group.
- The district has hired 4 building level data coaches to compile and share student, classroom, and building level data with the PLC’s to improve student learning. Our measurement tools include, ACT, MCA, and Fastbridge assessments. In addition we are compiling data from students being served in our ADSIS and Special Education programs.
4b. Teachers and Principals
➢ Describe the areas below. Include only the district focus areas for the 2016-2017 school year and limit response to 300 words. Bulleted points are welcome and appreciated.
o System to review and evaluate the effectiveness of ▪ As part of our Teacher Development and Evaluation Model all staff will participate in a 3
year cycle of support. Each staff will participate in 3 observations each year, years 1 and 2 are peer reviews, year 3 is a peer review and 2 summative administrative observations. Year 3 also includes trend data on student achievement and engagement.
▪ Annually our Curriculum Steering Committee reviews needs and data to determine next steps for each department. Facilitators lead each department to develop those guidelines annually. Curriculum alignment has been a strong focus in the last two years. We are trying to identify holes in the curriculum taught compared to the Standards and Benchmarks expected by MDE. We are attempting to identify the holes based on the results of assessments such as MCA’s, ACT’s, and FastBridge.
▪ Each year our superintendent sets goals with each administrator and conducts a reflective summary conference at the end of the year looking at those goals, stakeholder survey results and other relevant data to promote growth for our administrators and help to focus their growth on the growth of the building, staff, and students they supervise.

4c. District
➢ Describe the areas below. Include only the district focus areas for the 2016-2017 school year and limit response to 300 words. Bulleted points are welcome and appreciated.
o Include the district practices around high-quality instruction and rigorous curriculum which integrate:
https://docs.google.com/document/d/1ILbjE38qE6URke0lVxb5vXHTGGuBba8Xcd6f7RKJPXc/edit
- The above link is to the School District’s strategic plan. The Strategic Plan was developed last year after the failure of a District levy. This plan helped to direct our focus and identified the District’s commitment to the students and student learning. The plan includes many practices and processes that the District sees as important to the number one goal of student learning and career and college preparation. This Plan guided our decisions during our time of reductions so that we could maximize opportunities for students and provide a sound and appropriate educational plan for students.
5. Equitable Access to Excellent Teachers
On June 1, 2015, MDE submitted a plan to the U.S. Department of Education that required all states to address long term needs for improving equitable access of all students to excellent educators. The Every Student Succeeds Act (ESSA), signed on December 10, 2015, now requires states to evaluate and publicly report whether low-income and minority students are disproportionately served by ineffective, out-of-field, or inexperienced teachers.
To reach the goals of the WBWF, it is important to ensure that all students, particularly students from low income families, students of color and American Indian students have equitable access to teachers and principals who can help them reach their potential. WBWF now requires:
1. Districts to have a process to examine the equitable distribution of teachers and strategies to ensure low-income and minority children are not taught at higher rates than other children by inexperienced, ineffective, or out-of-field teachers.
2. District advisory committees to recommend to the school board the means to improve students' equitable access to effective and more diverse teachers.
In this 2016-2017 summary report submission, please provide the information below.
➢ Describe the areas below. Limit response to 300 words. Bulleted points are welcome and appreciated. o District process to examine the distribution of experienced, effective and in-field teachers across the
district and within school sites using data. - Students are placed with teachers through a collaborative process between the teachers,
counselor, and Principals. Parent suggestions or requests are accepted but placement is done

through the best placement for students. Placement is based on what will be best for the student and matching them up with skills and personality traits that will be best for the student.
▪ Include how the district reviews data to examine the equitable distribution of teachers. - We have a three to four section school so often there is not a lot of options for students.
We look at test data, social emotional needs, behavior history, and personal needs in determining what students will be the best placement and learning environment for the student.
o Strategies used to improve students’ equitable access to experienced, effective and in-field teachers. - In upper grades elective placement is also used to help put students personal goals out front of
their learning plan. We are working to improve our students career portfolio and planning for their future. We see it as important that students make informed and appropriate decisions about what they want for their future. The more interest a student has in a course the more effort they will put into the course they choose. This is still an area that we are working to improve.

