2015 and 2019 final lcr study results - greater bay area
TRANSCRIPT

2015 and 2019 Final LCR Study
Results - Greater Bay Area
Bryan Fong
Senior Regional Transmission Engineer
Stakeholder Web Conference
April 10, 2014
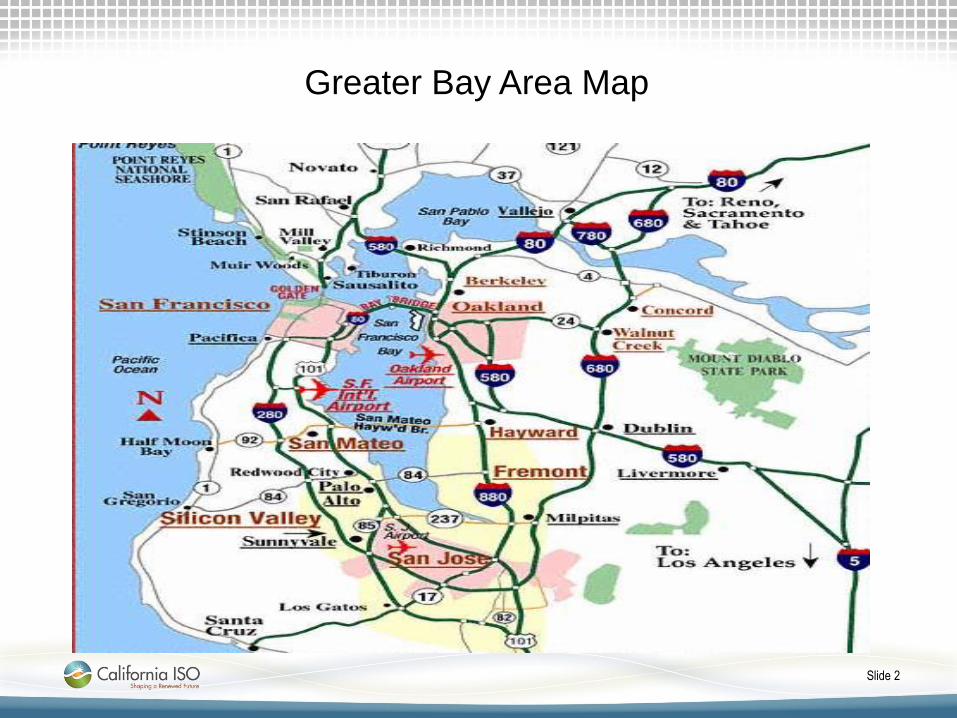
Greater Bay Area Map
Slide 2

Greater Bay Area Transmission System
Slide 3

New major transmission projects
• Contra Costa – Moraga 230 kV Line Reconductoring – 12/14
• East Shore-Oakland J 115 kV Reconductoring Project – 05/16
• Embarcadero-Potrero 230 kV Transmission Project – 12/15
• Evergreen-Mabury Conversion to 115 kV - 05/17
• Metcalf-Evergreen 115 kV Line Reconductoring – 05/18
• Metcalf-Piercy & Swift and Newark-Dixon Landing 115 kV
Upgrade – 05/18
• Moraga Transformers Capacity Increase – 12/15
• Pittsburg – Tesla 230 kV Reconductoring – 10/15
• Tesla-Newark 230 kV Path Upgrade – 05/16
• Vaca Dixon-Lakeville 230 kV Reconductoring – 06/17
Slide 4

Power plant changes
Additions:
• Marsh Landing Generating Station
• Los Esteros Critical Energy Facility (LECEF) capacity increase
• Russel City
• Oakley (2019 only)
Retirements:
• Contra Costa units #6 and #7
• GWF #1-5
Slide 5

2015 1-in-10 Year Load Representation
Total Load = 9,781 MW
Transmission Losses = 184 MW
Pumps = 264 MW
Total Load + Losses + Pumps = 10,229 MW
2019 1-in-10 Year Load Representation
Total Load = 9,868 MW
Transmission Losses = 200 MW
Pumps = 262 MW
Total Load + Losses + Pumps = 10,330 MW
Greater Bay Area Load
Slide 6

San Jose Sub Area
San Jose Sub-area – Category B
Contingency: Metcalf-Evergreen #2 115 kV Line with Duane PP out of service
Limiting component: Thermal overload of Metcalf-Evergreen #1 115 kV Line
2015 LCR need: 265 MW (includes 61 MW of QF and 202 MW of generation)
2019 LCR need: 119 MW (includes 263 MW of QF/Muni generation)
San Jose Sub-area – Category C
Contingency: Metcalf El Patio #1 or #2 overlapped with the outage of Metcalf-Evergreen #2 115 kV
Limiting component: Thermal overload of Metcalf-Evergreen #1 115 kV Line
2015 LCR need: 692 MW (includes 61 MW of QF and 202 MW of generation as well as 136 MW of deficiency )
2019 LCR need: 385 MW (includes 263 MW of QF/Muni generation)
Slide 7

Llagas Sub Area
Llagas Sub-area – Category B
Contingency: Metcalf D-Morgan Hill 115 kV with one of the Gilroy
peakers off line
Limiting component: Thermal overload on the Morgan Hill-Llagas 115
kV Line as well as 5% voltage drop at the Morgan Hill substation
2015 LCR need: 137 MW (includes 0 MW of QF/Muni generation)
2019 LCR need: 158 MW (includes 0 MW of QF/Muni generation)
Llagas Sub-area – Category C
Same as Category B
Slide 8

Oakland Sub Area
Oakland Sub-area – Category B
Contingency: Moraga – Claremont #1 or #2 230 kV line with one Oakland CT off-line
Limiting component: Remaining Moraga – Claremont 230 kV line
2015 LCR need: No requirement
2019 LCR need: 141 MW (includes 49 MW of QF/Muni generation)
Oakland Sub-area – Category C
Contingency: overlapping C-X #2 and C-X #3 115 kV cables
Limiting component: Thermal overload on the Moraga – Claremont #1 or #2 230kV Line.
2015 LCR need: 25 MW (includes 49 MW of QF/Muni generation)
2019 LCR need: Same as category B
This requirement does not include the need for the Pittsburg/ Oakland sub-area
Slide 9

Pittsburg/Oakland Sub Area
Pittsburg/Oakland Sub-area – Category B
Contingency: Moraga #3 230/115 kV Bank
Limiting component: Thermal overload on Moraga #1 230/115 kV Bank
2015 LCR need: 1688 MW (includes 369 MW of QF and 49 MW of Muni generation)
2019 LCR need: No requirement.
Pittsburg/Oakland Sub-area – Category C
Contingency: Moraga #3 230/115 kV Bank and Delta Energy Center
Limiting component: Thermal overload on Moraga #1 230/115 kV Bank (400 MW of Trans Bay Cable run back has been used)
2015 LCR need: 2524 MW (includes 369 MW of QF and 49 MW of Muni generation)
2019 LCR need: No requirement.
Slide 10
Contra Costa Sub Area
Contra Costa Sub-area – Category B
Contingency: Kelso-Tesla 230 kV with the Gateway off line
Limiting component: Thermal overload on the Delta Switching Yard-
Tesla 230 kV Line
2015 LCR need: 1259 MW (includes 256 MW of Wind generation and 264 MW of MUNI pumps)
2019 LCR need: 1629 MW (includes 264 MW of MUNI pumps and
256 MW of wind generation)
Contra Costa Sub-area – Category C
Same as Category B
Slide 11

Greater Bay Area Overall
Bay Area Overall – Category B
Contingency: Tesla-Metcalf 500 kV line with Delta Energy Center out of service
Limiting component: Reactive margin within the Bay Area
2015 LCR need: 3492 MW (including 485 MW of QF, 519 MW of MUNI and 258 MW of wind generation)
2019 LCR need: 3198 MW (including 485 MW of QF, 519 MW of MUNI and 258 MW of wind generation)
Slide 12

Greater Bay Area Overall (con’t)
Bay Area Overall – Category C
Contingency: overlapping Tesla-Metcalf 500 kV line and Tesla-Newark #1 230 kV line
Limiting component: Thermal overload on the Tesla-Newark #1 230 or Lone Tree–Cayatano 230kv Line
2015 LCR need: 4231 MW (including 485 MW of QF, 519 MW of MUNI and 258 MW of wind generation)
2019 LCR need: 4224 MW (including 485 MW of QF, 519 MW of MUNI and 258 MW of wind generation)
Slide 13

Greater Bay Area Total
Bay Area Total – Category B
Limiting component: Overall Contingency
2015 LCR need: 3492 MW (includes 1262 MW of QF/Muni/Wind generation)
Limiting component: Overall Contingency
2019 LCR need: 3198 MW (includes 1262 MW of QF/Muni/Wind generation)
Bay Area Overall – Category C
Limiting component: Sum of sub-area requirements
2015 LCR need: 4231 MW (includes 1262 MW of QF/Muni/Wind generation
as well as 136 MW of Deficiency)
Limiting component: Overall Contingency
2019 LCR need: 4224 MW (includes 1262 MW of QF/Muni/Wind generation)
Slide 14

Greater Bay Area
Slide 15
Existing Generation
Capacity Needed
(MW)
Deficiency (MW) Total MW Need
2015 2019 2015 2019 2015 2019
Category B (Single) 3492 3198 0 0 3492 3198
Category C (Multiple) 4231 4224 136 0 4367 4224
Year
QF
(MW)
Muni
(MW)
Wind
(MW)
Market
(MW)
Max. Qualifying
Capacity (MW)
2015 485 519 258 6243 7505
2019 485 519 258 6900 8162
Available Generation
Total LCR need

Changes
Slide 16
Since last year: 1) 2015 load forecast is lower by 190 MW vs. 2014
2) LCR need has decreased by 271 MW vs. 2014
3) Sum of sub-area LCR needs drive the Bay Area total requirement in 2015
4) 2019 load forecast is lower by 594 MW vs. 2018
5) Added Generation: Oakley (2019 only)
6) Long-term LCR need has decreased by 262 MW vs. 2018
7) Sum of sub-area LCR needs is not enough to meet the Bay Area overall requirement in 2019
Since last stakeholder call: 1) Updated NQC
Your comments and questions are welcome.
For written comments, please send to: [email protected]