2014 annual report (pdf) - chemring group/media/...report/2014-year.../chemring-2014-ra.pdf ·...
TRANSCRIPT
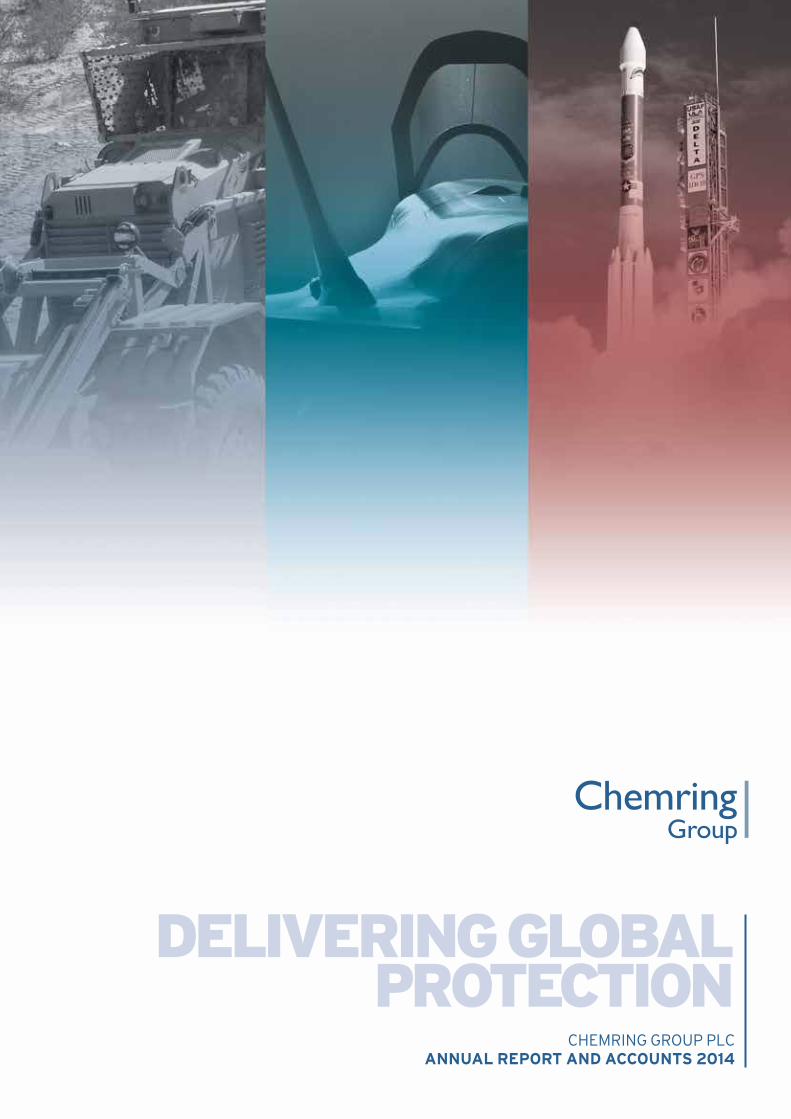
DELIVERING GLOBAL PROTECTION
CHEMRING GROUP PLCANNUAL REPORT AND ACCOUNTS 2014

CHEMRING Chemring is a global business that specialises in the manufacture of high-technology products. Chemring operates in three strategic product segments: Countermeasures, Sensors & Electronics, and Energetic Systems, and delivers high-reliability solutions to protect people, platforms, missions and information against constantly changing threats. With global production facilities, Chemring meets specific customer requirements in defence and security markets in more than fifty countries worldwide.
STRATEGIC REPORT01 2014 performance02 Chairman’s statement04 What we do05 Where we operate06 Our strategy for growth08 Strategy10 Our business model
Segmental reviews12 Countermeasures16 Sensors & Electronics20 Energetic Systems
23 Financial review28 Key performance indicators32 Principal risks and uncertainties36 Corporate responsibility review
GOVERNANCE 42 Board of directors44 Directors’ report48 Corporate governance report54 Audit committee report58 Directors’ remuneration report
FINANCIAL STATEMENTS78 Independent auditor’s report to the members
of Chemring Group PLC84 Consolidated income statement85 Consolidated statement of comprehensive
income86 Consolidated statement of changes in equity87 Consolidated balance sheet88 Consolidated cash flow statement89 Notes to the group financial statements129 Parent company balance sheet130 Parent company statement of total recognised
gains and losses130 Parent company reconciliation of movements
in shareholders’ funds131 Notes to the parent company financial
statements
OTHER INFORMATION137 Corporate information and website
Visit us online at
www.chemring.co.uk

2014 PERFORMANCE
OPERATIONAL
• Continuing improvements in operational performance, coupled with a strengthened position on future US, NATO and global programmes
• A tragic incident occurred at the Kilgore facility resulting in an employee being fatally injured. A full investigation has taken place
• Strategic review completed, resulting in divestment of Mecar, Simmel, Chemring Energetic Devices’ Clear Lake business and Chemring Defence Germany. This has resulted in a far more focused Group, with core competencies in market sectors where Chemring has a leading position
• Whilst dilutive to earnings, the divestments have significantly strengthened Chemring’s balance sheet, creating greater flexibility to pursue growth opportunities
• Successfully negotiated improvements in loan note terms, and concluded the refinancing of revolving credit facility
• Completed acquisition of 3d-Radar AS, consolidating Chemring’s leading international position in ground penetrating radar
• Significant reduction in net debt to £135.6 million (2013: £248.7 million), reflecting both the receipt of disposal proceeds and further improvement in the management of working capital
Pictured top: Infra-red flaresPictured middle: Naval countermeasurePictured bottom: A soldier preparing the APOBS explosive line charge system
FINANCIAL*
Order book
£486.8m(2013: £494.9m)
Underlying operating profit**
£46.7m(2013: £56.3m)
Revenue
£403.1m(2013: £472.3m)
Underlying operating margin
11.6%(2013: 11.9%)
* Excluding discontinued operations** Underlying measures referred to in these financial statements are stated before costs relating to acquisitions and disposals,
business restructuring and incident costs, profit/loss on disposal of businesses, items deemed to be of an exceptional nature, impairment of goodwill and acquired intangibles, impairment of assets held for sale, amortisation of acquired intangibles and gains/losses on the movement in the fair value of derivative financial instruments. A reconciliation of underlying and total operating profit is set out in note 5 of the group financial statements
01CHEMRING GROUP PLCANNUAL REPORT AND ACCOUNTS 2014
STRATEGIC REPORT
GOVERNANCE
FINANCIAL STATEMENTS
OTHER INFORMATION
The sale of the munitions businesses, whilst dilutive to earnings, took us out of an activity where we had a relatively small market position in a highly-competitive, international market place. The sale relieved the pressure on the Group’s balance sheet, which had become over-stretched following the downturn in defence markets, and removed the earnings and cash volatility associated with these businesses. Two additional, smaller disposals further helped to streamline the business, as we exited low margin activities in Germany and the US. As a result, Chemring is now more coherent, with a clear strategy for product development and the pursuit of growth opportunities.
However, the year was overshadowed by the tragic incident that occurred at Chemring Countermeasures’ Kilgore facility in Tennessee in February 2014. As a result of a fire, an employee was fatally injured and the Board deeply regrets this. All production was suspended while a full investigation took place. The investigation found that proper processes and procedures were in place but they had not been followed. Following regulatory clearance, a controlled re-start of production began in March but was not fully completed until October 2014.
2014 has been a further year of change for Chemring. Not only have we needed to adapt to lower demand within the international defence market, we have also continued the process of improving the operational efficiency of our business. In addition, we made a number of important disposals, the most significant being the sale of the Group’s European munitions businesses, Simmel and Mecar.
CHAIRMAN’S STATEMENT
Trading summaryRevenue from continuing operations was £403.1 million (2013: £472.3 million) and, including discontinued operations, was £474.9 million (2013: £624.9 million). This revenue generated an underlying operating profit of £49.0 million (2013: £72.1 million), of which £46.7 million (2013: £56.3 million) related to continuing operations. Including non-underlying items, there was a total operating loss of £28.2 million (2013: £36.9 million). Including discontinued operations, underlying profit before tax reduced by 41.3% to £30.3 million, resulting in underlying earnings per share of 12.4p (2013: 21.2p).
The continuing operations’ order book increased by £85.0 million in the second half of the year. As a result, the closing order book for continuing operations was £486.8 million (2013: £494.9 million).
The Group’s net debt was £135.6 million (2013: £248.7 million), with the reduction principally resulting from the receipt of disposal proceeds.
DividendsThe Board is recommending a final dividend in respect of the year to 31 October 2014 of 1.7p (2013: 3.8p). With the interim dividend of 2.4p (2013: 3.4p), this results in a total dividend of 4.1p (2013: 7.2p). This total dividend is in line with the Group’s stated policy of maintaining a dividend that is covered three times by underlying earnings. If approved, the final dividend will be paid on 8 May 2015 to shareholders on the register on 17 April 2015.
Board of directorsMichael Flowers was appointed to the Board on 24 June 2014, when he replaced Mark Papworth as Group Chief Executive. Vanda Murray, who joined the Board as a non-executive director on 1 November 2011, has said she will not be seeking re-election and will stand down at the Group’s Annual General Meeting on 19 March 2015.
02 CHEMRING GROUP PLCANNUAL REPORT AND ACCOUNTS 2014
STRATEGIC REPORT
OutlookGood progress was made in 2014 with the Group continuing to make structural and financial improvements. As a result, Chemring is now a focused defence technology business with established core competencies in Countermeasures, Sensors & Electronics and Energetic Systems.
While the trading environment remains challenging, Chemring has gained a number of research and development contracts that position the Group for long-term US Programs of Record, particularly in Sensors & Electronics. During this research and development phase, our immediate priority is securing crucial production orders for US Sensors & Electronics products in NATO and the Middle East to offset the pause in manufacturing for the US Department of Defense (“US DoD”).
Overall, the outlook for 2015 is unchanged though the timing of Sensors & Electronics contracts is expected to lead to the result being weighted towards the second half.
Peter HicksonChairman
22 January 2015
03CHEMRING GROUP PLCANNUAL REPORT AND ACCOUNTS 2014
STRATEGIC REPORT
GOVERNANCE
FINANCIAL STATEMENTS
OTHER INFORMATION
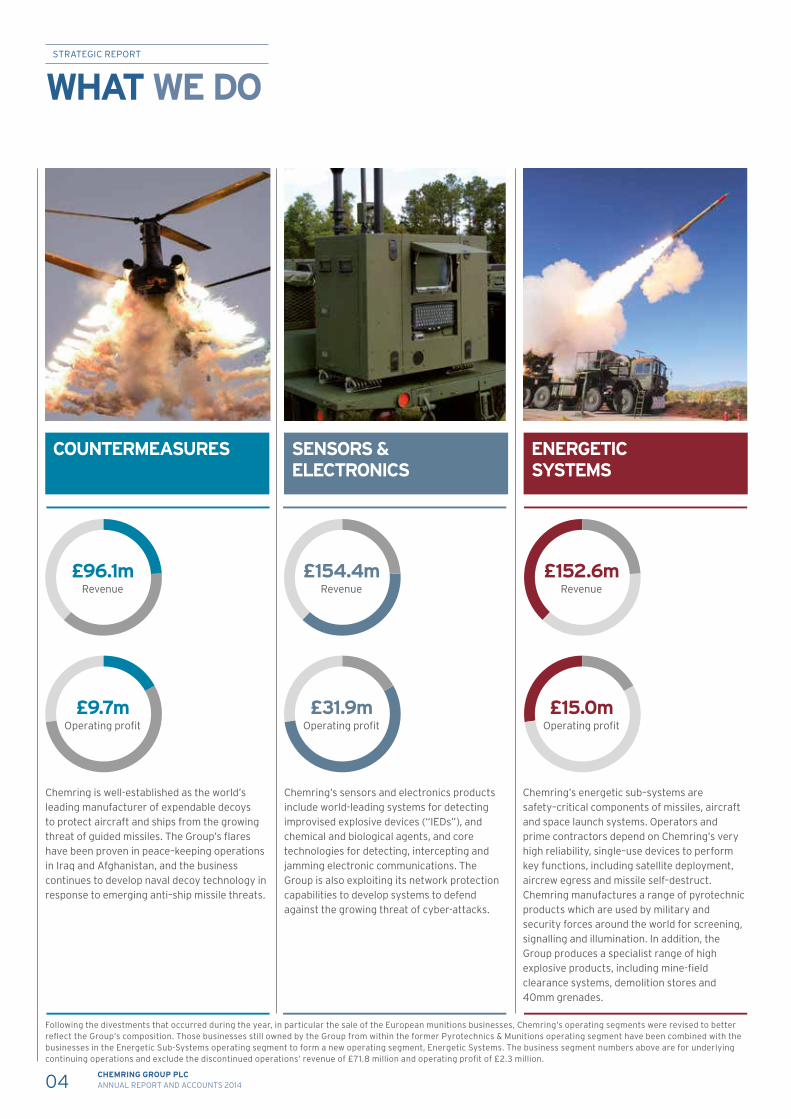
WHAT WE DO
Chemring is well-established as the world’s leading manufacturer of expendable decoys to protect aircraft and ships from the growing threat of guided missiles. The Group’s flares have been proven in peace–keeping operations in Iraq and Afghanistan, and the business continues to develop naval decoy technology in response to emerging anti–ship missile threats.
Chemring’s sensors and electronics products include world-leading systems for detecting improvised explosive devices (“IEDs”), and chemical and biological agents, and core technologies for detecting, intercepting and jamming electronic communications. The Group is also exploiting its network protection capabilities to develop systems to defend against the growing threat of cyber-attacks.
Chemring’s energetic sub–systems are safety–critical components of missiles, aircraft and space launch systems. Operators and prime contractors depend on Chemring’s very high reliability, single–use devices to perform key functions, including satellite deployment, aircrew egress and missile self–destruct. Chemring manufactures a range of pyrotechnic products which are used by military and security forces around the world for screening, signalling and illumination. In addition, the Group produces a specialist range of high explosive products, including mine-field clearance systems, demolition stores and 40mm grenades.
COUNTERMEASURES SENSORS & ELECTRONICS
ENERGETIC SYSTEMS
£9.7mOperating profit
£31.9mOperating profit
£15.0mOperating profit
£96.1mRevenue
£154.4mRevenue
£152.6mRevenue
Following the divestments that occurred during the year, in particular the sale of the European munitions businesses, Chemring’s operating segments were revised to better reflect the Group’s composition. Those businesses still owned by the Group from within the former Pyrotechnics & Munitions operating segment have been combined with the businesses in the Energetic Sub-Systems operating segment to form a new operating segment, Energetic Systems. The business segment numbers above are for underlying continuing operations and exclude the discontinued operations’ revenue of £71.8 million and operating profit of £2.3 million.
04 CHEMRING GROUP PLCANNUAL REPORT AND ACCOUNTS 2014
STRATEGIC REPORT
Chemring operates four business units in North America, supplying mainly to the US Department of Defense and its prime contractors:
• Chemring Countermeasures USA (Alloy Surfaces in Pennsylvania and Kilgore Flares in Tennessee) - manufactures conventional, advanced and special material decoys
• Chemring Sensors & Electronic Systems (NIITEK in Virginia and Chemring Detection Systems in South Carolina) - manufactures IED, chemical and biological detection systems
• Chemring Energetic Devices (California and Illinois) - makes pyrotechnic components for aircraft, missile and space applications
• Chemring Ordnance (Florida) - manufactures the Anti-Personnel Obstacle Breaching System and 40mm grenade ammunition
WHERE WE OPERATEA focused Group in the US, Europe and Australia, with a strong international network and customers in over fifty countries
Where we operate
Growth potential
NORTH AMERICA EUROPE
MIDDLE EAST
ASIA PACIFIC
Chemring operates seven businesses in Europe, supplying NATO and non-NATO customers:
• Chemring Countermeasures (UK) - manufactures conventional and advanced air countermeasures, naval decoys and launchers
• Chemring Defence (UK) - designs, develops and produces smoke and illumination pyrotechnics and payloads for military, Original Equipment Manufacturers (“OEM”) and safety customers
• Roke Manor Research (UK) - a leading contract research and development organisation with a growing portfolio of electronic warfare, electronic detection and cyber protection products
Chemring Australia - operates a modern countermeasures and pyrotechnics manufacturing facility, and supplies other Group products into the Australian market
Chemring also has a marketing joint venture in India to promote its products into this growing market
Chemring has long-standing relationships in the region, where it supplies a range of advanced products, including military aircraft flares, and detection and electronic warfare systems
• Chemring EOD (UK) - manufactures IED detection and neutralisation products
• Chemring Energetics (UK) - makes pyrotechnic components for aircraft, missile and space applications, and high-quality military demolition stores
• Chemring Nobel (Norway) - synthesises explosive raw materials
• 3d-Radar (Norway) - developer of ground penetrating radar
05CHEMRING GROUP PLCANNUAL REPORT AND ACCOUNTS 2014
STRATEGIC REPORT
GOVERNANCE
FINANCIAL STATEMENTS
OTHER INFORMATION
2014 has been an important and challenging year for Chemring, characterised by a stabilisation and subsequent improvement in operational performance, coupled with a strengthened position on major future US, NATO and broader global programmes. Against a backdrop of a subdued defence market, we see clear opportunities for future revenue growth and improving margins, although risks remain due to continued difficulty in predicting the timing of orders.
SafetyIt is important that we recognise the tragic incident which occurred at Kilgore on 22 February 2014. This resulted in the death of one of our employees, which we deeply regret. Investigation of the incident found that Kilgore had proper processes and procedures in place but that they had not been properly followed. The incident has reinforced the fact that, despite all the safety-related improvements made across the Group in the past decade, we operate in a hazardous industry and paramount to all our operations is safety. We have ensured there is renewed emphasis on communicating safety at every level, and on auditing our activities to ensure robust compliance. We have implemented a Safety Leadership Programme
OUR STRATEGY FOR GROWTH
for all executives, managers and supervisors, aimed at further enhancing our safety culture and embedding safety at the core of our business. Additionally, we have undertaken a review of our operations to ensure our controls reflect best practice, particularly regarding the handling of, and exposure to, energetic materials. Ongoing investment in safety remains our first priority.
Strategy and organisationA strategic review was completed in 2013, resulting in the divestment of a number of assets in our former Energetic Sub-Systems and Pyrotechnics & Munitions segments during the year. This has resulted in the Group being more focused on the sectors where we are, or can become, market leader. The divestments enabled early repayment of long-term debt, strengthening Chemring’s balance sheet. In turn, this has increased our resilience and created greater flexibility to pursue growth opportunities. Our focus remains on maintaining and growing our leading position in Countermeasures, securing orders in Sensors & Electronics whilst positioning for future US Programs of Record, and driving operational excellence in Energetic Systems.
OperationsIn looking to the year ahead, it is critical that we consolidate the operational gains made in 2014, particularly at Chemring Energetic Devices and
Chemring Ordnance. Delivery performance at Chemring Energetic Devices improved markedly in the second half, with margins returning to acceptable levels, and Chemring Ordnance returned to profitability on the back of consistent manufacturing. At Kilgore, where the 2014 emphasis has been on safety culture and production quality, we must now also focus on operational efficiency in order to drive margins. Throughout our operations, scope exists for further incremental improvements as we share best practice.
Markets and strategic outlookThe global defence market remains subdued and, while the recent trend of substantial declines in defence spending has concluded, US operational funding continues to reduce. Whilst there has been growth in some markets, notably the Middle East, these regions are still modest in scale when compared to NATO defence spending. Current geopolitical tensions have led to claims that defence expenditure will increase, particularly for items in Chemring’s portfolio. Although we are able to ramp-up quickly in support of customer requirements, we are not yet witnessing any wholesale increase in demand.
Priorities for the year aheadIn 2015, the Group will seek to grow market share in Sensors & Electronics, particularly counter-IED. We shall do this through greater customer and partner interaction, with market driven research and development ensuring we maintain our strong positions for forthcoming US Programs of Record and broader global opportunities. We are well-positioned on strategic programmes in the US, with success in capturing research and development phases of both counter-IED and chemical detection Programs of Record. Our immediate priorities are to secure orders in NATO and the Middle East for our US Sensors & Electronics products, while continuing to improve the performance of all our manufacturing operations. Overall, the outlook for 2015 is unchanged though the timing of Sensors & Electronics contracts is expected to lead to a weighting towards the second half.
Michael FlowersGroup Chief Executive
06 CHEMRING GROUP PLCANNUAL REPORT AND ACCOUNTS 2014
STRATEGIC REPORT
Q: You’ve been Group Chief Executive since late June 2014 - how have your first months in the job been?A: I was absolutely delighted to be appointed as Group Chief Executive back in June and have really enjoyed my first few months in the role. Having been with Chemring since 2006, I already had a solid understanding of our business and the markets in which we operate but, in the months since my appointment, I have spent even more time in really getting under the skin of our operations, visiting our sites, and speaking and listening to our operational management teams, as well as meeting with key customers, partners and investors.
In short, the first few months have been immensely rewarding and I’m excited about what the future holds for our business.
Q: Has the Group become more focused on its areas of business? A: The Group has made important progress in the year by re-focusing its operations and strengthening the balance sheet to create greater strategic flexibility. We have divested non-core elements of the business which detracted from our primary offering of world-leading technologies in Countermeasures, Sensors & Electronics and Energetic Systems, while also acquiring 3d-Radar to diversify our expertise in ground penetrating radar and open up sales channels into both non-NATO and commercial markets. The Group now has the core technologies, products and market positioning to take it forward and achieve sustainable improvements in margins and revenue.
Q&A
Q: How have the recent disposals benefited the Group?A: The disposal of the European munitions businesses reduced our net debt levels and put Chemring in a much stronger financial position. At 31 October 2014, net debt was £135.6 million, which is a significantly improved position compared to where the business was last year (2013: £248.7 million).
Q: What needs to be done to reach your strategic objectives?A: There is still more to do but, after a challenging period, Chemring is now in a robust position from which to progress. The quality of the Group’s operations continues to improve, as does its ability to invest in cutting edge technologies and products that provide the greatest opportunities for growth and give us a competitive lead in our markets.
Q: Do you intend to sell and acquire further businesses? A: The divestment of the European munitions businesses was a key milestone for Chemring and concluded the disposal process that stemmed from our strategic review. Chemring’s focus is now on organic growth. However, if a compelling acquisition opportunity arises in an area of the market that we understand well and where there are opportunities for synergies, then we would of course consider it. The strategically-important acquisition of 3d-Radar in May 2014 illustrates this approach, as the acquisition consolidated Chemring’s position as a world leader in ground penetrating radar and opened up markets previously not available to us.
Q: When do you expect defence spending, particularly in the US, to pick up, and how well-placed is Chemring to take advantage of opportunities in non-NATO markets?A: The latest analysis of global defence spending confirms previously identified trends, with the rate of decline moderating through 2015, before stabilising and slowly recovering from 2016. The situation in the US is more positive than it has been for some time, with clearer timetables for long-term development programmes. Meanwhile, the Group continues to take advantage of opportunities in other international markets; we have strategic partnerships around the world and are actively pursuing opportunities for our product portfolio. Timing of order placements in non-NATO markets is more difficult to predict, and we continue to manage our cost base to mitigate the effect of any delays in order receipt.
Q: What effect is the increase in global tensions having on Chemring’s business?A: The current geopolitical tensions we are seeing in the Middle East, as well as those stemming from the dispute between Russia and Ukraine, have sharpened the focus of governments around the world and highlighted the need for robust defence and security measures. Whilst the timing of international order placements remain difficult to predict, Chemring is well-positioned to benefit from any sustained increase in demand as a result of the conflict in the Middle East. Furthermore, although there has been a slowdown in the West’s military spending, it is important not to forget that in both Asia and the Middle East there are signs that military spending is on the increase and Chemring will be looking to take advantage of this trend wherever possible.
07CHEMRING GROUP PLCANNUAL REPORT AND ACCOUNTS 2014
STRATEGIC REPORT
GOVERNANCE
FINANCIAL STATEMENTS
OTHER INFORMATION
08 CHEMRING GROUP PLCANNUAL REPORT AND ACCOUNTS 2014
Target investment to preserve and maintain position in mature markets, and to maximise opportunities in growth markets.
Maintain world leadership in Countermeasures market > Fix operational problems at Kilgore > Maintain a technological lead in core markets > Optimise the Group’s manufacturing base and
routes to market
Build a world–leading technology base in Sensors & Electronics > Ensure critical wins in NATO and Middle
East markets > Build a world–leading technology base across
the Group’s transatlantic footprint > Migrate technologies from advanced defence
markets to fast-developing and non-defence markets
Optimise operational performance of Energetic Systems > Complete operational improvements > Promote newly-developed products > Ensure position on new US and European
missile and space programmes
In 2013, the Group eliminated a large part of its divisional structure, improving: > Inter-company communication > Technology sharing > Teaming
Examples include: > Energetic Systems’ collaboration to address
European space market > Sensors & Electronics’ development of new
electronic warfare modules > Countermeasures second source for F-35 flare
During 2014, operational performance has improved significantly in the Energetic Systems segment, and there are further opportunities across the Group.
In addition, the Group continues to focus on the individual business units’ performance, with targeted improvements to: > Safety > Transition from design to manufacture > Reduce scrap and waste > On-time delivery
Chemring’s technology strategy focuses on developing advanced products to meet customer needs in its “home” markets in the US, UK, Australia and NATO. These advanced products defeat new and changing threats, and will gain a growing share of defence budgets.
With most NATO countries squeezing spend on defence, Chemring is also targeting countries with growing defence budgets. Chemring is expanding its reach to include Middle Eastern countries and new NATO members seeking step-changes in force capability. The international success of the Husky Mounted Detection System (“HMDS”) illustrates this; the initial user was the US Army, followed by Canada, Australia, Italy, Turkey and Spain, and, with the 3d-Radar technology, a number of Middle East and Asia Pacific customers are expected to follow.
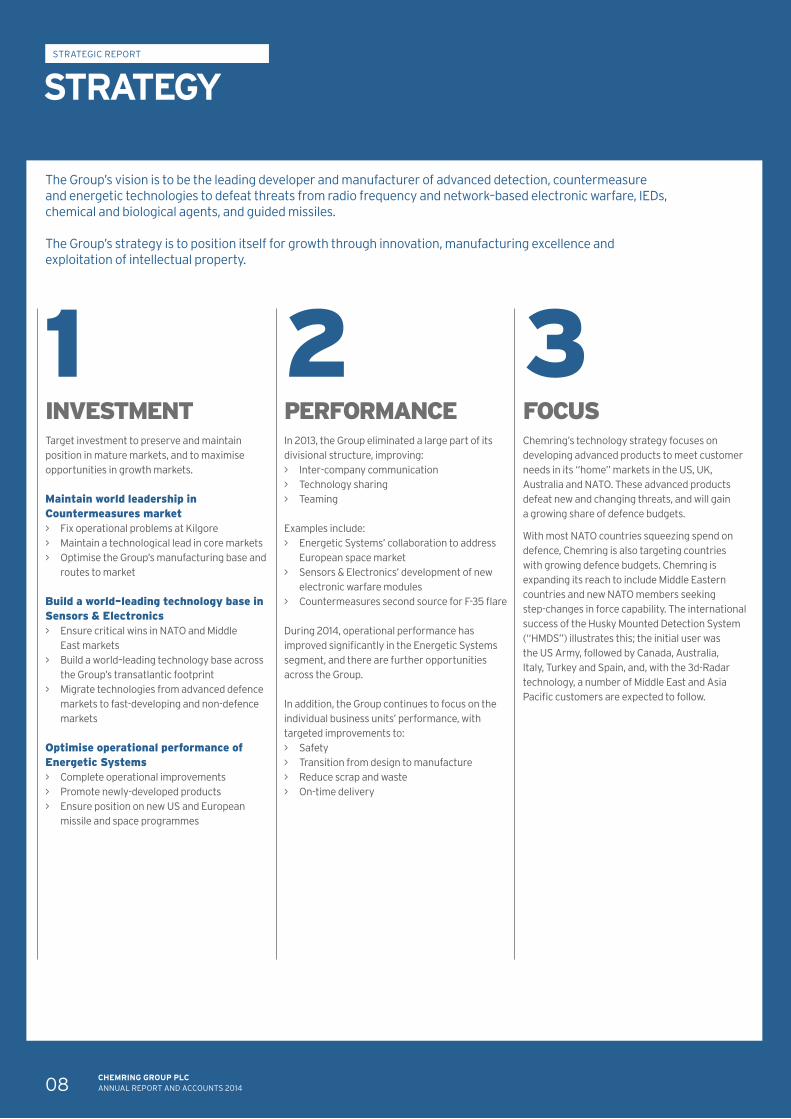
1INVESTMENT
2PERFORMANCE
3FOCUS
The Group’s vision is to be the leading developer and manufacturer of advanced detection, countermeasure and energetic technologies to defeat threats from radio frequency and network–based electronic warfare, IEDs, chemical and biological agents, and guided missiles.
The Group’s strategy is to position itself for growth through innovation, manufacturing excellence and exploitation of intellectual property.
STRATEGYSTRATEGIC REPORT

STRATEGIC REPORT
GOVERNANCE
FINANCIAL STATEMENTS
OTHER INFORMATION
09CHEMRING GROUP PLCANNUAL REPORT AND ACCOUNTS 2014
STRATEGIC REPORT
GOVERNANCE
FINANCIAL STATEMENTS
OTHER INFORMATION
EXTE
ND REACH TRACK AND IDENTIFY TH
REATS
LEVERAGE INTELLE
CTU
AL
PROPERTY
CO
MM
ER
CIALISE KNOW-HOW
EXCE
LLEN
CE IN
DEL
IV
ERY
NEW TECHNOLOGY
CUSTOMER UNDERSTAN
DIN
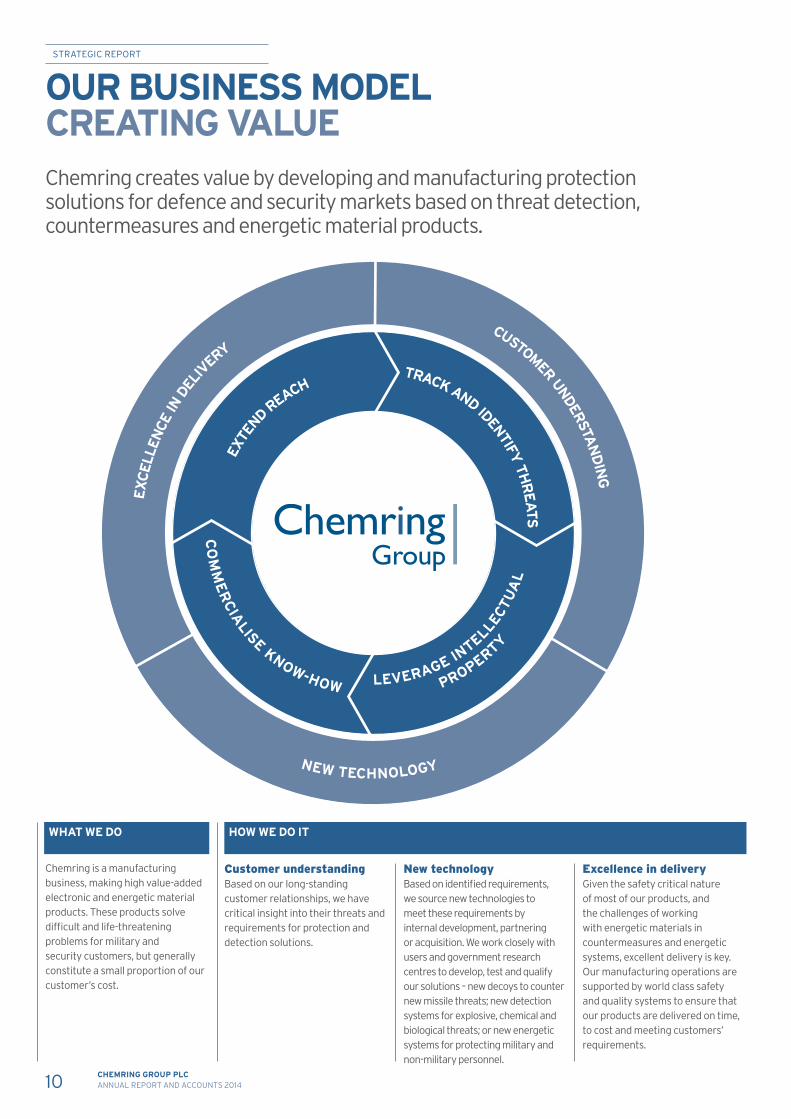
GChemring creates value by developing and manufacturing protection solutions for defence and security markets based on threat detection, countermeasures and energetic material products.
OUR BUSINESS MODEL CREATING VALUE
Chemring is a manufacturing business, making high value-added electronic and energetic material products. These products solve difficult and life-threatening problems for military and security customers, but generally constitute a small proportion of our customer’s cost.
WHAT WE DO HOW WE DO IT
Customer understandingBased on our long-standing customer relationships, we have critical insight into their threats and requirements for protection and detection solutions.
New technologyBased on identified requirements, we source new technologies to meet these requirements by internal development, partnering or acquisition. We work closely with users and government research centres to develop, test and qualify our solutions – new decoys to counter new missile threats; new detection systems for explosive, chemical and biological threats; or new energetic systems for protecting military and non-military personnel.
Excellence in deliveryGiven the safety critical nature of most of our products, and the challenges of working with energetic materials in countermeasures and energetic systems, excellent delivery is key. Our manufacturing operations are supported by world class safety and quality systems to ensure that our products are delivered on time, to cost and meeting customers’ requirements.
10 CHEMRING GROUP PLCANNUAL REPORT AND ACCOUNTS 2014
STRATEGIC REPORT

Chemring delivers protection solutions in a world facing rapidly–evolving threats from both organised militaries and the growing base of insurgents. Tracking and identifying threats and understanding their implications are critical precursors to detecting and countering these threats. The Group has strong, long–standing customer relationships around the world, which provide insight into a unique mix of military doctrines and security challenges faced by NATO, non–NATO and other security forces. The “home” markets in the US, UK and Australia provide a base of sophisticated and influential users, whilst a network
of relationships in the Middle East, Asia Pacific and South America provide insight into specific security challenges, ranging from the Olympic Games to protecting offshore assets from pirates or insurgents. Chemring monitors this evolving pattern of threats, and this provides the base for exploring technology options to address these threats.
Chemring is a manufacturing business, and seeks to maintain a high margin portfolio by producing and selling proprietary products. This means that the Group optimises manufacturing capability to protect its technology, and product and process–related intellectual property. Energetic material products, including countermeasures and energetic systems involve the blending, forming and packing of energetic materials. Rigour in these processes is critical to ensure product quality and performance, and the Group uses its world–leading capabilities in this field to operate from its large and well–equipped sites.
For less critical production processes, such as metal part manufacture, component production may be outsourced. For Sensors & Electronics products, the critical production processes are associated with assembly, test and software.
In some cases, the Group exploits its knowledge by undertaking contract research and development for clients, where this provides an opportunity to extend the knowledge base, understand new opportunities and operational scenarios, or build new customer relationships.
Chemring has a strong portfolio of technology which it draws upon to develop solutions for customers. The Group strategically invests “seedcorn” capital to investigate technical alternatives and to secure critical intellectual property underpinning potential solutions. Where promising technologies are found outside the Group, a flexible approach is adopted to securing these for targeted applications – for example, by securing licences, funding joint development, or in some cases, outright acquisition to secure both the technology and the underlying ability to develop it. Having secured the critical intellectual property, the Group takes a pragmatic approach to product design and development. In the case of specialist military products, such as IED detectors, countermeasures or missile
components, where the user’s specialist operational, qualification and test requirements place a disproportionate cost on development, customer funding, support and qualification is sought to develop specific solutions. For example, our countermeasures require significant investment in flight qualification, and we work closely with a lead customer in the US or Europe to prove the product. Where qualification costs are less prohibitive and their applications are wider than a single customer’s requirements, the Group invests development funding to secure a more versatile solution which can be sold more widely – for example, funding network protection offerings to ensure the Group can exploit the commercial market for these solutions.
Chemring sells to over fifty countries globally, through an established network of sales partners. These partners have strong in–country relationships with national procurement offices, and these channels are used in promoting Chemring’s full range of capabilities. These partners are critical to the launch of the Group’s new products, and also provide local intelligence and product support. Defence is a sensitive capability for all countries, and many aim to develop a local industrial base to support their national security. This is particularly true in consumables such as countermeasures, where the ability of a supply chain to support military operations is key – the Group’s US and UK–based flare manufacturing capabilities were critical to support operations in Iraq and Afghanistan, and
many other nations are also seeking to be self–sufficient in their own supply chain. The Group will work with nations who wish to develop indigenous capability, and will support product development and local manufacturing facilities. For example, Chemring Australia has established a development programme in Australia, in collaboration with Chemring Technology Solutions, to develop a next–generation enhancement to man–portable Electronic Warfare (“EW”) equipment.
TRACK AND IDENTIFY THREATS
COMMERCIALISE KNOW-HOW
LEVERAGE INTELLECTUAL PROPERTY
EXTEND REACH
11CHEMRING GROUP PLCANNUAL REPORT AND ACCOUNTS 2014
STRATEGIC REPORT
GOVERNANCE
FINANCIAL STATEMENTS
OTHER INFORMATION

12 CHEMRING GROUP PLCANNUAL REPORT AND ACCOUNTS 2014
Order book
£193.3m(2013: £160.8m)
Revenue
£96.1m(2013: £125.0m)
Underlying operating profit
£9.7m(2013: £13.2m)
Underlying operating margin
10.1%(2013: 10.6%)
COUNTERMEASURES
Chemring Countermeasures USA – incorporating Alloy Surfaces, the sole manufacturer of covert multi-spectral special material decoys, and Kilgore Flares, manufacturer of infra-red (“IR”) aircraft countermeasures.
The business is the foremost supplier of airborne expendable IR decoy flares, and serves as the sole–source IR decoy flare supplier for some of the world’s most sophisticated and advanced airborne platforms, including the F-22 and F-35 Joint Strike Fighter.
Chemring Countermeasures UK – a world leader in the design, development and manufacture of advanced expendable countermeasures for air and sea platforms, and a developer of next generation launchers for deploying naval decoys. Chemring Countermeasures UK is the sole source supplier of countermeasures for the Eurofighter Typhoon.
Chemring Australia – Australia’s only manufacturer of aircraft expendable countermeasures, and supplier of a range of pyrotechnic and military training products.
OUR BUSINESS UNITS
STRATEGIC REPORT
SummaryRevenue in the Countermeasures segment reduced by 23.1%. This was primarily a consequence of continued deferrals in US order placement and the impact of the incident at Kilgore in February 2014.
The closing order book for Countermeasures was £193.3 million, up 20.2% on the previous year, reflecting the receipt of a number of orders in the final quarter of the year. While elements of this order intake are for multi-year delivery reaching into the medium-term, this nonetheless provides support for our view that customer demand has reached minimum sustaining volumes.
Activities during the year
USAThe most significant factor in the performance of the Countermeasures segment was the tragic incident that occurred at Chemring Countermeasures USA’s Kilgore facility in February 2014, in which an employee was fatally injured. All production was suspended while an investigation took place. The investigation found that proper processes and procedures were in place but they had not been followed. Following regulatory clearance, a structured and controlled re-start of production commenced in March 2014. However, re-commissioning of the portion of the facility where the incident occurred and the receipt of appropriate regulatory approvals was not completed until October 2014.
Operational issues at Kilgore have led to poor performance in recent years, which the Group has been actively addressing. A new General Manager of the Kilgore site and a new President of Chemring Countermeasures USA were appointed during the year, and these appointments are driving improvement in process controls and site management. Improving operational performance at Kilgore is expected to enable all overdue orders, which constitute the majority of Kilgore’s order backlog, to be fulfilled during 2015.
Uncertainties regarding the US DoD’s budget continue to cause significant delays to orders and sales. However, in August 2014, a $22.2 million order was received for infra-red decoys to be manufactured at Alloy Surfaces’ facility, and customer trials are expected to be concluded in early 2015. As an encouraging sign of longer-term prospects, in December 2013 Chemring Countermeasures USA received a $1.5 million production order for initial supplies to the F-35 Joint Strike Fighter programme.
UKChemring Countermeasures UK had an encouraging year, with profit growth driven by operational improvement that is delivering enhanced quality and productivity. Order intake increased significantly, indicating greater confidence within the customer base and providing near-term production volume.
The order intake included demand for naval products from NATO customers who, despite budgetary pressures, are seeking new capabilities in missile defence due to growing appreciation of the capability of countermeasures when co-ordinated with other ship defence systems.
As anti-ship missiles become more varied and effective, co-ordination of a ship’s defence system is becoming increasingly important. As a result, interest in Chemring’s CENTURION trainable launcher continues to be strong. A successful “proof of concept” firing of a Javelin missile using CENTURION took place in collaboration with Raytheon Missile Systems during the year.
13CHEMRING GROUP PLCANNUAL REPORT AND ACCOUNTS 2014
STRATEGIC REPORT
GOVERNANCE
FINANCIAL STATEMENTS
OTHER INFORMATION
AustraliaRevenue at Chemring Australia reduced as a consequence of lower expenditure by the Australian Defence Force.
In October 2014, the Australian Department of Defence extended Chemring Australia’s long-term supply contract by a further two years to 2020, and a clear performance-based mechanism for future contract extension has been put in place.
In August 2014, Chemring Australia was awarded a contract for the F-35 Joint Strike Fighter demonstration project. This two year project will lead to Chemring Australia becoming qualified as the second supplier of countermeasures for the F-35 Joint Strike Fighter, alongside Kilgore. It is the most strategically important order that Chemring Australia has been awarded since securing the long-term supply contract with the Australian Department of Defence in 2008, and will underpin the long-term viability of the Australian countermeasures capability.
Chemring Australia continues to work on the development of an electronic attack solution under an Australian Government grant-funded project, which completed a key design milestone in September 2014.
COUNTERMEASURES CONTINUED
Outlook While the medium-term outlook for air countermeasures is positive, the near-term remains challenging with NATO and European customers constrained by tight budgets. There was an increase in customer enquiries towards the end of the year, as a result of tensions in the Ukraine and the start of limited operations in response to the threat from Islamic State. However, unless there is a significant escalation in operational tempo, the Group does not expect to see these enquiries converted into material order intake.
This increased tension is generating greater interest within NATO in the Group’s new countermeasures capability, from which we expect to benefit as we introduce a series of new products. Opportunities in the Middle and Far East remain significant in terms of volume, but the timing of order intake is unpredictable.
As defence budgets are expected to remain constrained, and the introduction of new aircraft subject to delays, we do not anticipate significant near-term market growth unless driven by increased operational needs.
However, in the medium-term, the Group’s sole-source qualified positions on the major new platforms, F-35 Joint Strike Fighter and Typhoon, and the resulting procurement of war reserves and training rounds for these fleets, have the potential to generate substantial incremental revenue. Furthermore, as these platforms enter service and retiring aircraft are sold in the after market, overall demand for the Group’s products expands, providing further opportunities.
14 CHEMRING GROUP PLCANNUAL REPORT AND ACCOUNTS 2014
STRATEGIC REPORT

CHEMRING GROUP PLCANNUAL REPORT AND ACCOUNTS 2014 15
STRATEGIC REPORT
GOVERNANCE
FINANCIAL STATEMENTS
OTHER INFORMATION

16 CHEMRING GROUP PLCANNUAL REPORT AND ACCOUNTS 2014
SENSORS & ELECTRONICS
Chemring Sensors & Electronic Systems – incorporating Non–Intrusive Inspection Technology (“NIITEK”) and Chemring Detection Systems – is the leading US manufacturer of vehicle–mounted ground penetrating radar mine detection systems, and the leading developer and supplier of vehicle–mounted chemical and biological detection systems. The business also incorporates 3d-Radar, the new business acquired in the year, based in Trondheim, Norway, a leading developer of commercial three-dimensional ground penetrating radar technology.
Chemring Technology Solutions – incorporating Roke Manor Research and Chemring EOD – is a leading contract development organisation with a growing portfolio of EW, electronic detection and cyber protection technologies. It also manufactures IED detection and neutralisation products.
OUR BUSINESS UNITS
Order book
£77.5m(2013: £106.2m)
Underlying operating profit
£31.9m(2013: £44.7m)
Revenue
£154.4m(2013: £211.3m)
Underlying operating margin
20.7%(2013: 21.2%)
STRATEGIC REPORT
Summary Revenue in the Sensors & Electronics segment reduced by 26.9%. This largely reflected the conclusion of the $579 million multi–year HMDS ground penetrating radar indefinite delivery, indefinite quantity (“IDIQ”) contract, and the transition of activity from urgent operational requirements to customer-funded research and development contracts in support of long-term US DoD Programs of Record. The closing order book for Sensors & Electronics was £77.5 million, down 27.0% on 2013.
Activities during the year
USChemring Sensors & Electronic Systems (“CSES”) has continued to leverage its technology capabilities following the integration of NIITEK with Chemring Detection Systems in 2013. The multi-year contracts with the US DoD for the supply of HMDS ground penetrating radar and chemical detection systems both performed strongly, with all orders being completed during the period, slightly ahead of expectations. Operational efficiencies and the fulfilment of these two contracts enabled risk reserves to be released.
A final order under the HMDS IDIQ had been anticipated in the second half of the financial year. However, in July 2014, it was confirmed that this order would not be placed due to the accelerated rate of troop withdrawal from Afghanistan. The absence of this order, while disappointing, was partly offset by the award of a significant order for HMDS from a customer in the Middle East and by a number of funded research and development contracts. Encouragingly, CSES has continued to receive interest in its ground penetrating radar from other NATO countries, with continued system and spares sales to Canada, Australia, Italy, Turkey and Spain during the year.
The HMDS programme, originally funded as an urgent operational requirement for campaigns in Iraq and Afghanistan, is transitioning into a long–term capability funded by the US DoD’s base budget through a Program of Record. In June 2014, we received a $26.1 million research and development contract in support of this transition, which followed the $10.6 million contract awarded in October 2013 for the procurement of six HMDS test systems. These contracts enhance the position of HMDS as a long–term capability for the US military.
The ground penetrating radar product range, which began with the HMDS, is migrating into smaller scale solutions designed to deliver capability to dismounted troops. These include a vehicle–mounted unit designed for fast–moving infantry, an autonomous mine detection system mounted on a man–packable robot, and handheld ground penetrating radar and metal detector solutions. During 2014, the Polish Department of Defence placed a $1.0 million order for handheld detection units.
On 9 May 2014, Chemring completed the strategically important acquisition of 3d-Radar, consolidating its position as a world leader in ground penetrating radar. 3d-Radar, based in Norway, was acquired for a cash consideration of $3.0 million (£1.8 million). 3d-Radar’s technology is not restricted by US International Traffic in Arms Regulations (“ITAR”), enabling Chemring to target opportunities in non-NATO and commercial markets which were previously not accessible. Commercial applications include archaeological surveys, tunnel detection and railway infrastructure surveys. 3d-Radar is benefiting from access to Chemring’s sales channels and recently won a number of contracts within the Japanese utility sector.
The chemical and biological detection systems business delivered a strong performance and was awarded a final contract for the supply of Joint Biological Point Detection Systems to the US Army. Participation was secured in all three initial research and development contracts for the Next Generation Chemical Detector Program of Record, to an initial value of $3.9 million. These are strategically important wins, as this Program of Record is a key future programme in the US chemical, biological, radiological and nuclear detection marketplace. Since 31 October 2014, further awards of $5.6 million have been received for the next stage of the development programme. CSES has also submitted a proposal for the US DoD’s Joint Biological Tactical Detection System, a further key long-term development programme, with announcement of this award expected in 2015.
17CHEMRING GROUP PLCANNUAL REPORT AND ACCOUNTS 2014
STRATEGIC REPORT
GOVERNANCE
FINANCIAL STATEMENTS
OTHER INFORMATION

SENSORS & ELECTRONICS CONTINUED
UKIn the UK, the performance at Chemring Technology Solutions, which incorporates Roke Manor Research (“Roke”) and Chemring EOD, was mixed. Revenue reduced as a number of customer procurements were cancelled and production orders from non-NATO customers were subject to delay.
Roke’s IED detection capability has been successfully demonstrated to the US Army, and is being considered for integration into the HMDS Program of Record. The Resolve electronic warfare system continues to make progress, with sales during the year to customers in the Middle East and Europe. These have included upgrades for existing customers to automatically classify electronic signals to detect threats and provide direction finding in real time.
Roke’s contract research and development business continues to grow through the provision of research, development, consultancy and test services. These enable governments and commercial enterprises to address threats to national security and cyber-attack, and to manage and understand risks inherent in technology change.
Roke continues to capitalise on its investment in non–defence products and technology. The first orders for the SmartSwitch data management product have been received and proof-of-concept trials have commenced. An innovative cyber-protection solution, Perception, has been launched, with technical evaluations underway.
Chemring EOD has made good headway into the growing site security market, with VehicleScan sales to a number of UK prisons and airports. VehicleScan enables underside vehicle searches to be conducted while maintaining traffic flow, allowing vehicles to enter an area without delay.
Outlook Overall, the near-term outlook for Sensors & Electronics is expected to be constrained. Major US production contracts driven by urgent operational requirements have ended and while international demand is strong, the timing of orders, particularly in non-NATO countries, remains difficult to predict. Receipt of these international orders remains key to near-term performance. Encouragingly, the US DoD has recognised the need for a broad range of detection systems by the inclusion of these capabilities as Programs of Record in the base budget, and continued participation in these Programs of Record underpins our longer-term prospects.
Chemring is therefore well-placed to grow its position in the Sensors & Electronics market through the development and launch of its next-generation products, having already won key research and development contracts for the initial phases of the Programs of Record. In addition, our products and technologies are targeted at detecting and mitigating new, growing threats such as IEDs and cyber-attacks. We believe these capabilities will form a growing proportion of future defence budgets.
18 CHEMRING GROUP PLCANNUAL REPORT AND ACCOUNTS 2014
STRATEGIC REPORT

19CHEMRING GROUP PLCANNUAL REPORT AND ACCOUNTS 2014
STRATEGIC REPORT
GOVERNANCE
FINANCIAL STATEMENTS
OTHER INFORMATION
20 CHEMRING GROUP PLCANNUAL REPORT AND ACCOUNTS 2014
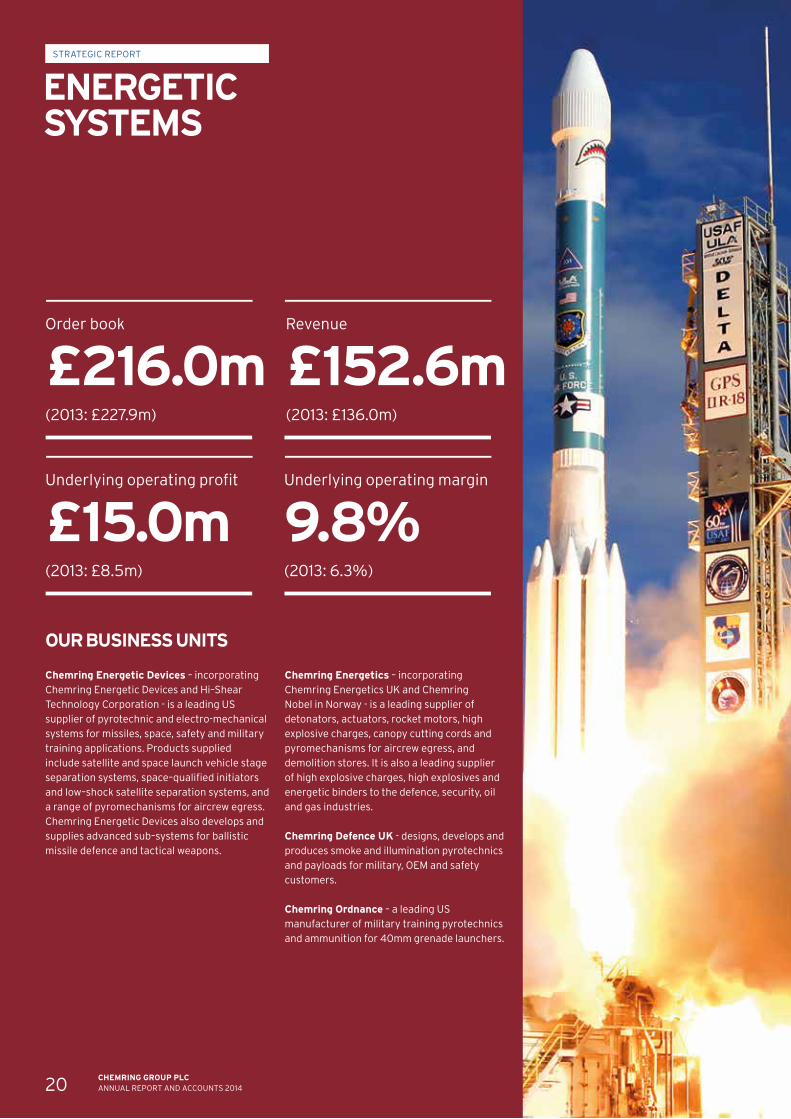
ENERGETIC SYSTEMS
Chemring Energetic Devices – incorporating Chemring Energetic Devices and Hi–Shear Technology Corporation - is a leading US supplier of pyrotechnic and electro-mechanical systems for missiles, space, safety and military training applications. Products supplied include satellite and space launch vehicle stage separation systems, space–qualified initiators and low–shock satellite separation systems, and a range of pyromechanisms for aircrew egress. Chemring Energetic Devices also develops and supplies advanced sub–systems for ballistic missile defence and tactical weapons.
Chemring Energetics – incorporating Chemring Energetics UK and Chemring Nobel in Norway - is a leading supplier of detonators, actuators, rocket motors, high explosive charges, canopy cutting cords and pyromechanisms for aircrew egress, and demolition stores. It is also a leading supplier of high explosive charges, high explosives and energetic binders to the defence, security, oil and gas industries.
Chemring Defence UK - designs, develops and produces smoke and illumination pyrotechnics and payloads for military, OEM and safety customers.
Chemring Ordnance – a leading US manufacturer of military training pyrotechnics and ammunition for 40mm grenade launchers.
OUR BUSINESS UNITS
Order book
£216.0m(2013: £227.9m)
Revenue
£152.6m(2013: £136.0m)
Underlying operating profit
£15.0m(2013: £8.5m)
Underlying operating margin
9.8%(2013: 6.3%)
STRATEGIC REPORT
Summary Energetic Systems revenue was £152.6 million, a 12.2% increase from 2013. This increase was a result of the focus on resolving production issues and integrating manufacturing sites, which delivered a marked improvement in operational performance and production volumes. Operating profit and operating margins improved significantly as a result.
The closing order book for Energetic Systems was £216.0 million, a reduction of 5.2%. Order intake strengthened in the final quarter of the year, with contract awards for pyrotechnic products from the Middle East and orders on long-standing programmes including Lockheed Martin’s Patriot PAC-3 missile programme.
Activities during the year
USThe integration of Hi–Shear into Chemring Energetic Devices has been completed, enabling synergies to be realised from the common technology platforms and production techniques used at the two sites. The priority has been the gaining of customer approvals to enable the transfer of over $6.0 million of order backlog from Hi-Shear’s capacity-constrained facility in California to Chemring Energetic Devices’ facility in Illinois. A common enterprise resource planning system is now in place at both sites, enabling improved workflow and customer service levels.
The space and missile sectors have been the focus of much activity at Chemring Energetic Devices, with orders received from NASA for the Mars 2020 programme, and from Mitsubishi Heavy Industries and Northrop Grumman for launch vehicle and other space programmes.On 24 January 2014, the Group divested Chemring Energetic Devices’ build-to-print business located in Clear Lake, South Dakota for £6.2 million ($10.5 million).
Chemring Ordnance in Florida delivered much improved performance, with increasing consistency and quality in its production processes. This enabled significant growth in revenue compared to the prior year, when manufacturing was halted by a series of production issues. Order intake was substantially ahead of the previous year, and included contracts for the supply of non-standard ammunition to customers in the Middle East and orders for 40mm ammunition.
UKChemring Energetics had a challenging year as technical issues associated with pyro-mechanical devices and propellant products impacted performance, particularly in the first half. The technical performance issues associated with the supply of components for the Next Generation Light Anti–Tank Weapon have been overcome, and, while sales under this contract had been delayed, final deliveries were made during the year.
A long-term, sole-source agreement has been signed with Martin-Baker for the continued supply of rocket motors and pyro-mechanical devices for aircrew egress systems.
Growth continues in the production of demolition stores, with commissioning of a bespoke manufacturing facility for the supply of plastic block explosive to the UK Ministry of Defence nearing completion. Deliveries under this contract will commence in 2015.
Chemring Defence UK has seen continued deterioration in demand from its NATO customer base. However, during the second half of the year, significant orders were received from Middle East customers, providing essential base load manufacturing activity for 2015.
21CHEMRING GROUP PLCANNUAL REPORT AND ACCOUNTS 2014
STRATEGIC REPORT
GOVERNANCE
FINANCIAL STATEMENTS
OTHER INFORMATION
ENERGETIC SYSTEMS CONTINUED
NorwayChemring Nobel had a record year in terms of manufacturing volumes for its high explosive product range. Further capital investment is being made to remove production bottlenecks and increase capacity. The business continues to develop its portfolio of products, which are supplied to defence primes in Europe and America, and to the oil and gas industry worldwide.
OutlookOverall, demand for our Energetic Systems products is expected to be relatively flat in the near-term. Requirements for military pyrotechnics within NATO have reduced significantly and our focus therefore remains on securing positions in emerging markets, particularly the Middle East. Growth is also being targeted through diversification into non-defence markets, with the development of bespoke products for fire suppression, security and space applications. Against this market backdrop, continued emphasis is being placed on maintaining improvements in operational efficiency and optimising cash conversion.
22 CHEMRING GROUP PLCANNUAL REPORT AND ACCOUNTS 2014
STRATEGIC REPORT
Group results An analysis of underlying and total results is set out below:
2014 2013
Underlying£m
Total£m
Underlying£m
Total£m
Revenue– continuing operations 403.1 403.1 472.3 472.3– discontinued operations 71.8 71.8 152.6 152.6
474.9 474.9 624.9 624.9
Operating profit/(loss) – continuing operations 46.7 25.4 56.3 (46.7)– discontinued operations 2.3 (53.6) 15.8 9.8
49.0 (28.2) 72.1 (36.9)Net finance expense (18.7) (30.7) (20.5) (20.5)
Profit/(loss) before tax 30.3 (58.9) 51.6 (57.4)Tax (6.4) 4.0 (10.6) 9.1
Profit/(loss) after tax 23.9 (54.9) 41.0 (48.3)
The use of underlying measures, in addition to total measures, is considered by the Board to improve comparability of business performance between periods.Underlying measures referred to are stated before costs relating to acquisitions and disposals, business restructuring and incident costs, profit/loss on disposal of businesses, items deemed to be of an exceptional nature, impairment of goodwill and acquired intangibles, impairment of assets held for sale, amortisation of acquired intangibles and gains/losses on the movement in the fair value of derivative financial instruments. A reconciliation of underlying and total operating profit is set out in note 5 of the group financial statements.
During the year, changes in foreign exchange rates, principally the appreciation of sterling against the US dollar, reduced reported revenue from continuing operations by £19.8 million. At constant exchange rates, revenue from continuing operations was £422.9 million, a reduction of 10.5%.
Following the divestments completed during the year, in particular the sale of the European munitions businesses, Chemring’s operating segments were revised to better reflect the Group’s composition. Those businesses still owned by the Group from within the former Pyrotechnics & Munitions segment have been combined with those from the Energetic Sub-Systems segment to form a new segment, Energetic Systems. Continuing operations include 3d-Radar, acquired in May 2014, and Chemring Energetic Devices’ Clear Lake facility that was divested in January 2014. An analysis of segmental revenue and underlying operating profit reflecting these new segments is set out below:
2014 2013
Revenue £m
Underlying operating
profit£m
Underlying operating
margin%
Revenue£m
Underlying operating
profit£m
Underlying operating
margin%
Countermeasures 96.1 9.7 10.1 125.0 13.2 10.6Sensors & Electronics 154.4 31.9 20.7 211.3 44.7 21.2Energetic Systems 152.6 15.0 9.8 136.0 8.5 6.3
403.1 56.6 14.0 472.3 66.4 14.1Unallocated corporate costs – (9.9) – – (10.1) –
Continuing operations 403.1 46.7 11.6 472.3 56.3 11.9Discontinued operations 71.8 2.3 3.2 152.6 15.8 10.4
Including discontinued operations 474.9 49.0 10.3 624.9 72.1 11.5
3d-Radar has been included in the Sensors & Electronics segment and Chemring Energetic Devices’ Clear Lake facility is included in continuing operations in the Energetic Systems segment.
FINANCIAL REVIEW
23CHEMRING GROUP PLCANNUAL REPORT AND ACCOUNTS 2014
STRATEGIC REPORT
GOVERNANCE
FINANCIAL STATEMENTS
OTHER INFORMATION
FINANCIAL REVIEW CONTINUED
Countermeasures revenue decreased by 23.1%, due to reductions in demand from the UK and US as a result of the withdrawal from Afghanistan. Production volumes in the US were also affected by the incident at the Kilgore facility in February 2014, which led to production being suspended while investigations were conducted and regulatory clearance obtained. Following a gradual re-start of production that commenced in March 2014, the facility became fully operational in October 2014. Countermeasures operating margin of 10.1% (2013: 10.6%) reflects the impact of the issues at Kilgore, partially offset by the benefit of headcount reductions and cost saving measures, together with resolution of certain technical problems previously encountered in 2012 on the development of an advanced countermeasure.
Sensors & Electronics revenue reduced by 26.9%, as fulfilment of the major production contract with the US DoD for the supply of the HMDS ground penetrating radar was completed. Significant research and development contracts with the US DoD are underway for the next generation of ground penetrating radar and chemical detection systems. The operating margin of 20.7% (2013: 21.2%) reflects the benefit of the release of contract risk reserves on completed US programmes, offset by the impact of lower margin funded research and development activity and a reduced level of higher margin international product sales.
The increase in Energetic Systems revenue reflects improved production throughput at our US operations. Underlying operating profit increased by 76.5% to £15.0 million (2013: £8.5 million), with operating margins benefiting from the operational improvement. This improvement was particularly marked at Chemring Energetic Devices, and at Chemring Ordnance, which returned to profit after a loss-making position in the prior year.
Unallocated corporate costs were £9.9 million (2013: £10.1 million), with the small reduction reflecting further savings from the simplification of the Group’s management structure.
Underlying operating profit from continuing operations was £46.7 million (2013: £56.3 million), a decrease of 17.1%. The underlying operating margin was 11.6% (2013: 11.9%).
Discontinued operations comprise the European munitions businesses, Mecar, based in Belgium, and Simmel, located in Italy, and Chemring Defence Germany. All these businesses were sold in May 2014. At the European munitions businesses there were positive order intake signs during the period to the date of disposal, but this was offset by weakness in the naval munitions sector.
The discontinued operations had revenue in the period to disposal of £71.8 million (year to 31 October 2013: £152.6 million) and achieved an operating profit in that period of £2.3 million (year to 31 October 2013: £15.8 million). Their order book at 30 April 2014 was £189.3 million (31 October 2013: £180.6 million).
The total operating loss was £28.2 million (2013: £36.9 million). This includes non–underlying costs of £77.2 million (2013: £109.0 million), which are analysed later in this review.
Net finance expense was £18.7 million (2013: £20.5 million), of which £0.1 million (2013: £0.7 million) related to discontinued operations. In addition, £12.0 million of non-underlying accelerated interest costs were incurred on the repayment of loan note debt.
Underlying profit before tax from continuing operations was £28.1 million (2013: £36.5 million), a decrease of 23.0%. Tax on underlying profit before tax from continuing operations was £5.7 million (2013: £6.5 million), representing an effective tax rate of 20.3% (2013: 17.8%). The tax rate is comparable to the UK corporation tax rate and benefits from the utilisation of research and development tax credits. Including non–underlying items, the total loss before tax from continuing operations was £5.2 million (2013: £66.5 million).
The effective tax rate on the total loss before tax from continuing operations was 73.1% (2013: 16.4%), due to the higher proportion of non–underlying costs that are not deductible for tax purposes.
Including discontinued operations, underlying profit after tax was £23.9 million (2013: £41.0 million), a decrease of 41.7%, and the total loss after tax was £54.9 million (2013: £48.3 million).
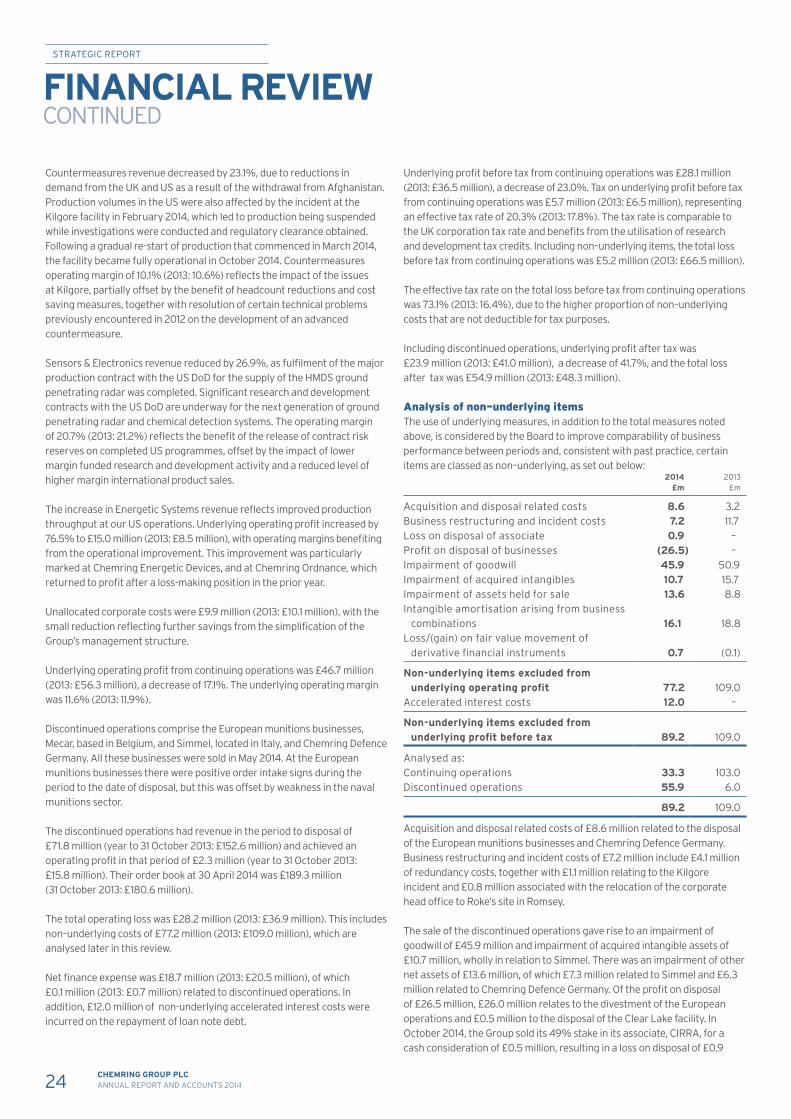
Analysis of non–underlying items The use of underlying measures, in addition to the total measures noted above, is considered by the Board to improve comparability of business performance between periods and, consistent with past practice, certain items are classed as non–underlying, as set out below:
2014 £m
2013£m
Acquisition and disposal related costs 8.6 3.2Business restructuring and incident costs 7.2 11.7Loss on disposal of associate 0.9 –Profit on disposal of businesses (26.5) –Impairment of goodwill 45.9 50.9Impairment of acquired intangibles 10.7 15.7Impairment of assets held for sale 13.6 8.8Intangible amortisation arising from business
combinations 16.1 18.8Loss/(gain) on fair value movement of
derivative financial instruments 0.7 (0.1)
Non-underlying items excluded from underlying operating profit 77.2 109.0
Accelerated interest costs 12.0 –
Non-underlying items excluded from underlying profit before tax 89.2 109.0
Analysed as:Continuing operations 33.3 103.0Discontinued operations 55.9 6.0
89.2 109.0
Acquisition and disposal related costs of £8.6 million related to the disposal of the European munitions businesses and Chemring Defence Germany. Business restructuring and incident costs of £7.2 million include £4.1 million of redundancy costs, together with £1.1 million relating to the Kilgore incident and £0.8 million associated with the relocation of the corporate head office to Roke’s site in Romsey.
The sale of the discontinued operations gave rise to an impairment of goodwill of £45.9 million and impairment of acquired intangible assets of £10.7 million, wholly in relation to Simmel. There was an impairment of other net assets of £13.6 million, of which £7.3 million related to Simmel and £6.3 million related to Chemring Defence Germany. Of the profit on disposal of £26.5 million, £26.0 million relates to the divestment of the European operations and £0.5 million to the disposal of the Clear Lake facility. In October 2014, the Group sold its 49% stake in its associate, CIRRA, for a cash consideration of £0.5 million, resulting in a loss on disposal of £0.9
24 CHEMRING GROUP PLCANNUAL REPORT AND ACCOUNTS 2014
STRATEGIC REPORT
million. An impairment analysis, based on value–in–use calculations reflecting current conditions in the defence industry, has been conducted and no further impairments are considered to exist at 31 October 2014.
In the year to 31 October 2013, £50.9 million of goodwill relating to Hi-Shear, now part of Chemring Energetic Devices, was fully impaired, and an impairment of £15.7 million of acquired intangible assets was recognised in relation to Chemring Energetic Devices’ Clear Lake facility, which was subsequently disposed of in January 2014.
The amortisation of intangible assets arising from business combinations was £16.1 million (2013: £18.8 million), with the decrease reflecting the fact that certain intangible assets are now fully amortised. This amortisation is treated as non–underlying to improve comparability and understanding of the results given its large size and its non–cash nature. The cash outflow from non-underlying items was £25.9 million (2013: £12.7 million).
Shareholder returns Including discontinued operations, underlying earnings per share were 12.4p (2013: 21.2p), a decrease of 41.5%. The total loss per share was 28.4p (2013: 25.0p). For continuing operations, underlying earnings per share were 11.6p (2013: 15.5p) and there was a total loss per share of 0.7p (2013: 28.8p).
Shareholders’ funds were £300.3 million (2013: £383.8 million), with the reduction principally resulting from the non-underlying loss on disposal of the European munitions businesses and the related one-off accelerated interest payment incurred in repaying loan notes.
Pensions The deficit on the Group’s defined benefit pension schemes was £21.8 million (2013: £25.1 million), measured in accordance with IAS 19 (Revised) Employee Benefits, which was adopted during the year. This adoption led to a reduction in the expected rate of return on pension scheme assets, and, therefore, in profit before tax of £0.8 million for the year ended 31 October 2013, with a corresponding increase in the actuarial gain recognised for that year. The deficit relates to the Chemring Group Staff Pension Scheme (the “Scheme”), a UK defined benefit scheme whose assets are held in a separately administered fund. The Scheme was closed to future accrual in April 2012. A full actuarial valuation for the Scheme as at 6 April 2012 has been prepared and updated to 31 October 2014, using the projected unit credit method. This valuation showed a deficit of £22.0 million (2013: £24.2 million). The reduction reflects the new funding structure agreed with the trustees in June 2013, under which contributions of £8.2 million were paid in the year to 31 October 2014, partly offset by the effect of changes in actuarial assumptions. The Group has given a bank guarantee and letters of credit totalling £21.6 million (2013: £27.2 million) to the Scheme in respect of future contributions, which are progressively reducing as contributions are paid under the new funding structure.
Chemring’s UK employees are now offered membership of a defined contribution pension scheme, and the majority of the Group’s overseas pension arrangements are also defined contribution.
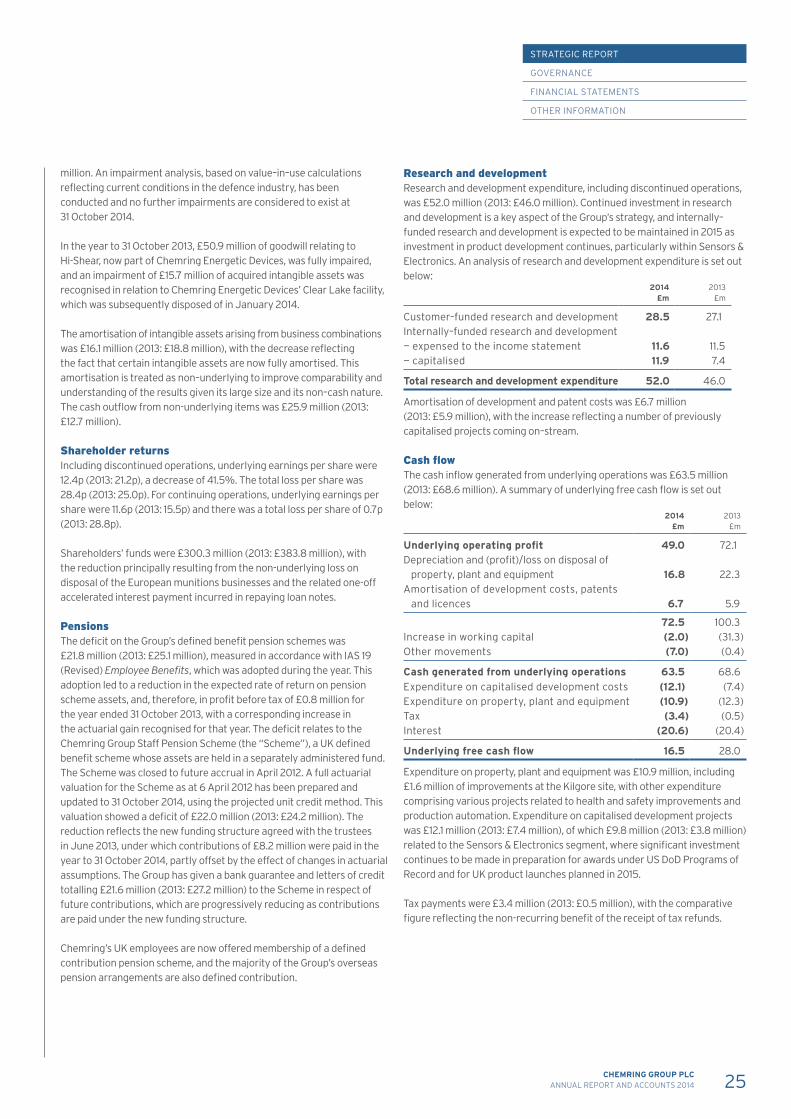
Research and development Research and development expenditure, including discontinued operations, was £52.0 million (2013: £46.0 million). Continued investment in research and development is a key aspect of the Group’s strategy, and internally–funded research and development is expected to be maintained in 2015 as investment in product development continues, particularly within Sensors & Electronics. An analysis of research and development expenditure is set out below:
2014£m
2013£m
Customer–funded research and development 28.5 27.1Internally–funded research and development — expensed to the income statement 11.6 11.5— capitalised 11.9 7.4
Total research and development expenditure 52.0 46.0
Amortisation of development and patent costs was £6.7 million (2013: £5.9 million), with the increase reflecting a number of previously capitalised projects coming on–stream.
Cash flow The cash inflow generated from underlying operations was £63.5 million (2013: £68.6 million). A summary of underlying free cash flow is set out below:
2014 £m
2013£m
Underlying operating profit 49.0 72.1Depreciation and (profit)/loss on disposal of
property, plant and equipment 16.8 22.3Amortisation of development costs, patents
and licences 6.7 5.9
72.5 100.3Increase in working capital (2.0) (31.3)Other movements (7.0) (0.4)
Cash generated from underlying operations 63.5 68.6Expenditure on capitalised development costs (12.1) (7.4)Expenditure on property, plant and equipment (10.9) (12.3)Tax (3.4) (0.5)Interest (20.6) (20.4)
Underlying free cash flow 16.5 28.0
Expenditure on property, plant and equipment was £10.9 million, including £1.6 million of improvements at the Kilgore site, with other expenditure comprising various projects related to health and safety improvements and production automation. Expenditure on capitalised development projects was £12.1 million (2013: £7.4 million), of which £9.8 million (2013: £3.8 million) related to the Sensors & Electronics segment, where significant investment continues to be made in preparation for awards under US DoD Programs of Record and for UK product launches planned in 2015.
Tax payments were £3.4 million (2013: £0.5 million), with the comparative figure reflecting the non-recurring benefit of the receipt of tax refunds.
25CHEMRING GROUP PLCANNUAL REPORT AND ACCOUNTS 2014
STRATEGIC REPORT
GOVERNANCE
FINANCIAL STATEMENTS
OTHER INFORMATION

Working capital A summary of working capital in respect of continuing operations is set out below:
2014£m
2013£m
Inventories 78.1 73.1Trade receivables 59.3 39.9Contract receivables 20.2 41.5Trade payables (37.1) (31.1)Advance payments (4.5) (5.8)Other items (46.0) (56.4)
Working capital 70.0 61.2
Working capital was £70.0 million (2013: £61.2 million). Trade receivables increased as a result of the phasing of sales, however this was offset by a reduction in contract receivables as Sensors & Electronics’ US production contracts were completed. Contract-accounted revenues, which included these production contracts, represented 22.0% (2013: 31.7%) of revenue from continuing operations.
Working capital continues to be a key focus area and the operational improvement at sites such as Kilgore will drive greater efficiency, notably through the reduction of inventories. Going forward, the principal drivers of working capital will be the timing of major production contracts within Sensors & Electronics and the scheduling of production activity within Energetic Systems.
Net debt and covenants Net debt at 31 October 2014 was £135.6 million (2013: £248.7 million). The Group’s principal debt facilities comprise £161.0 million of private placement loan notes and a £70.0 million revolving credit facility. The revolving credit facility was established in July 2014 and refinanced a previous facility scheduled to mature in April 2015. The facility is with a syndicate of three banks and has a four year term. Together with a smaller US facility, the Group had £75.7 million (2013: £126.8 million) of undrawn borrowing facilities at the year end.
Following receipt of proceeds from the divestment of the European munitions businesses, £14.5 million ($24.7 million) of the Group’s loan notes were repaid at par in June 2014. In September 2014, the Group applied a further £87.2 million ($142.8 million) of the disposal proceeds to repay loan notes, which led to an accelerated interest payment of £12.0 million being incurred, equivalent to 13.8% of the principal repaid. In view of the non-recurring nature of this payment, it has been disclosed as a non-underlying item. The remaining loan notes are repayable in November 2016 ($48.9 million), November 2017 (£8.1 million and $79.8 million), and November 2019 ($115.9 million).
In addition to borrowing facilities, the Group had £62.3 million of facilities in respect of bonding and trade finance requirements, all of which were refinanced during the year. At 31 October 2014, £31.4 million of these facilities were utilised.
The Group is subject to two key financial covenants, which are tested quarterly. These covenants relate to the leverage ratio, being the ratio between underlying earnings before interest, tax, depreciation and amortisation (“underlying EBITDA”) and debt, and the interest cover ratio between underlying EBITDA and finance costs. The calculation of these ratios involves the translation of non–sterling denominated debt using average, rather than closing, rates of exchange. The revolving credit facility and the loan notes have differing covenant compliance calculations.
FINANCIAL REVIEW CONTINUED
In respect of the revolving credit facility established in July 2014 and its predecessor facility, leverage is measured by reference to net debt. The maximum permitted ratio of net debt to underlying EBITDA under the revolving credit facilities was 3.25x at January and April 2014 and 3.00x thereafter. The revised permitted ratio at April 2014 of 3.25x was agreed with the revolving credit facility syndicate during the year and a ratio of 3.00x applied at that date prior to this revision.
In respect of the loan notes, leverage has historically been measured using total gross debt. This restricted Chemring’s ability to divest businesses, given that the resulting loss of underlying EBITDA would not necessarily be accompanied by a reduced gross debt level. In April 2014, Chemring successfully concluded a revision of financial covenants with the loan note holders to enable greater flexibility in the application of disposal proceeds. For the period until January 2015, the revised covenants entitle Chemring to offer a proportion of disposal proceeds to loan note holders to repay outstanding notes at par. To the extent that such an offer was not accepted by note holders, rejected proceeds can be offset against gross debt to derive an adjusted debt value that is used in calculating covenant compliance. Following the receipt of proceeds from the sale of the European munitions businesses in May 2014, leverage under the loan notes is calculated based on the ratio of underlying EBITDA to this adjusted debt value, with such ratio not to exceed 3.00x. As part of the revision to the terms of the loan notes, a leverage test based upon total gross debt has been retained, but at a permanently increased level of 3.75x underlying EBITDA. As part of the April 2014 revision, the permitted ratio based upon total gross debt was increased to 3.50x at the April 2014 test date. Prior to this revision, the permitted leverage ratio based upon total gross debt was 3.50x at January 2014 before reverting to 3.00x thereafter.
The Group complied with these covenants throughout the year and the results of covenant tests at the year end are detailed below:
2014 2013
Covenant ratios – revolving credit facility Maximum allowed ratio of net debt to
underlying EBITDA 3.00x 3.25xActual ratio of net debt to underlying
EBITDA 1.93x 2.65xMinimum allowed ratio of underlying
EBITDA to finance costs 4.00x 4.00xActual ratio of underlying EBITDA to
finance costs 4.28x 4.98xCovenant ratios – loan note agreements Maximum allowed ratio of adjusted debt to
underlying EBITDA 3.00x –Actual ratio of adjusted debt to underlying
EBITDA 2.25x –Maximum allowed ratio of total debt to
underlying EBITDA 3.75x 3.50xActual ratio of total debt to underlying
EBITDA 2.31x 2.78xMinimum allowed ratio of underlying
EBITDA to finance costs 3.50x 3.50xActual ratio of underlying EBITDA to
finance costs 4.39x 5.61x
26 CHEMRING GROUP PLCANNUAL REPORT AND ACCOUNTS 2014
STRATEGIC REPORT
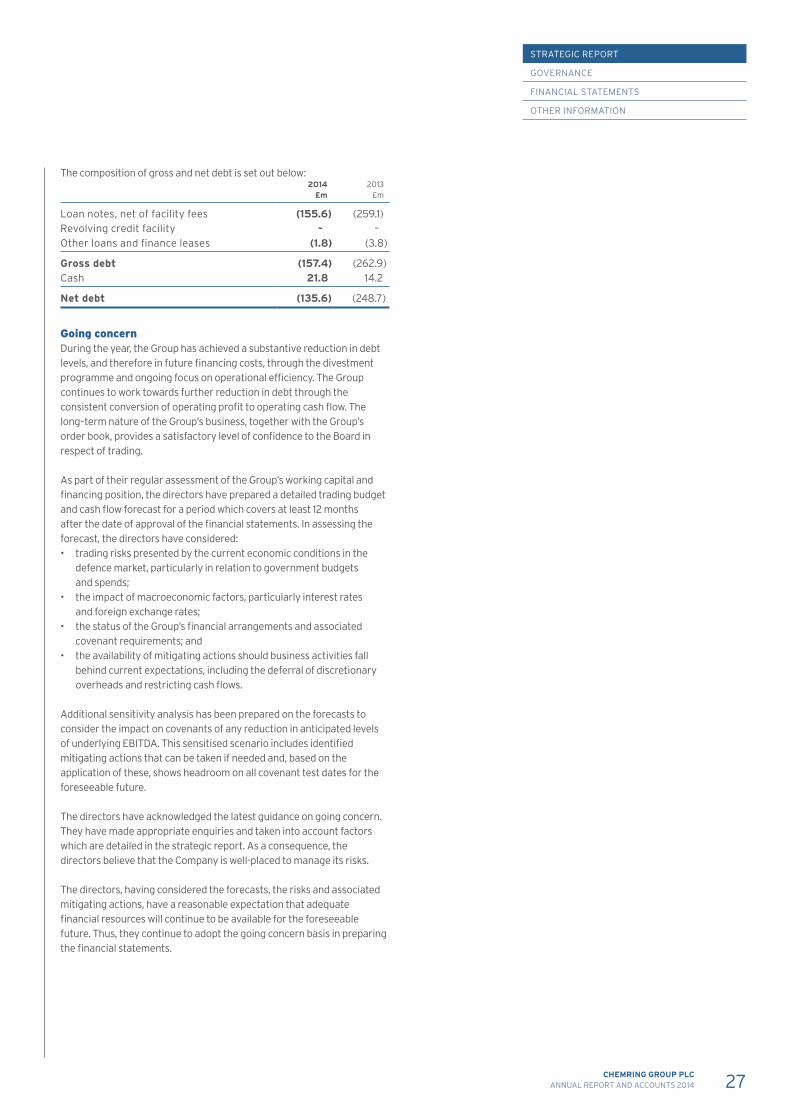
The composition of gross and net debt is set out below: 2014
£m2013
£m
Loan notes, net of facility fees (155.6) (259.1)Revolving credit facility – –Other loans and finance leases (1.8) (3.8)
Gross debt (157.4) (262.9)Cash 21.8 14.2
Net debt (135.6) (248.7)
Going concern During the year, the Group has achieved a substantive reduction in debt levels, and therefore in future financing costs, through the divestment programme and ongoing focus on operational efficiency. The Group continues to work towards further reduction in debt through the consistent conversion of operating profit to operating cash flow. The long–term nature of the Group’s business, together with the Group’s order book, provides a satisfactory level of confidence to the Board in respect of trading.
As part of their regular assessment of the Group’s working capital and financing position, the directors have prepared a detailed trading budget and cash flow forecast for a period which covers at least 12 months after the date of approval of the financial statements. In assessing the forecast, the directors have considered: • trading risks presented by the current economic conditions in the
defence market, particularly in relation to government budgets and spends;
• the impact of macroeconomic factors, particularly interest rates and foreign exchange rates;
• the status of the Group’s financial arrangements and associated covenant requirements; and
• the availability of mitigating actions should business activities fall behind current expectations, including the deferral of discretionary overheads and restricting cash flows.
Additional sensitivity analysis has been prepared on the forecasts to consider the impact on covenants of any reduction in anticipated levels of underlying EBITDA. This sensitised scenario includes identified mitigating actions that can be taken if needed and, based on the application of these, shows headroom on all covenant test dates for the foreseeable future.
The directors have acknowledged the latest guidance on going concern. They have made appropriate enquiries and taken into account factors which are detailed in the strategic report. As a consequence, the directors believe that the Company is well-placed to manage its risks.
The directors, having considered the forecasts, the risks and associated mitigating actions, have a reasonable expectation that adequate financial resources will continue to be available for the foreseeable future. Thus, they continue to adopt the going concern basis in preparing the financial statements.
27CHEMRING GROUP PLCANNUAL REPORT AND ACCOUNTS 2014
STRATEGIC REPORT
GOVERNANCE
FINANCIAL STATEMENTS
OTHER INFORMATION
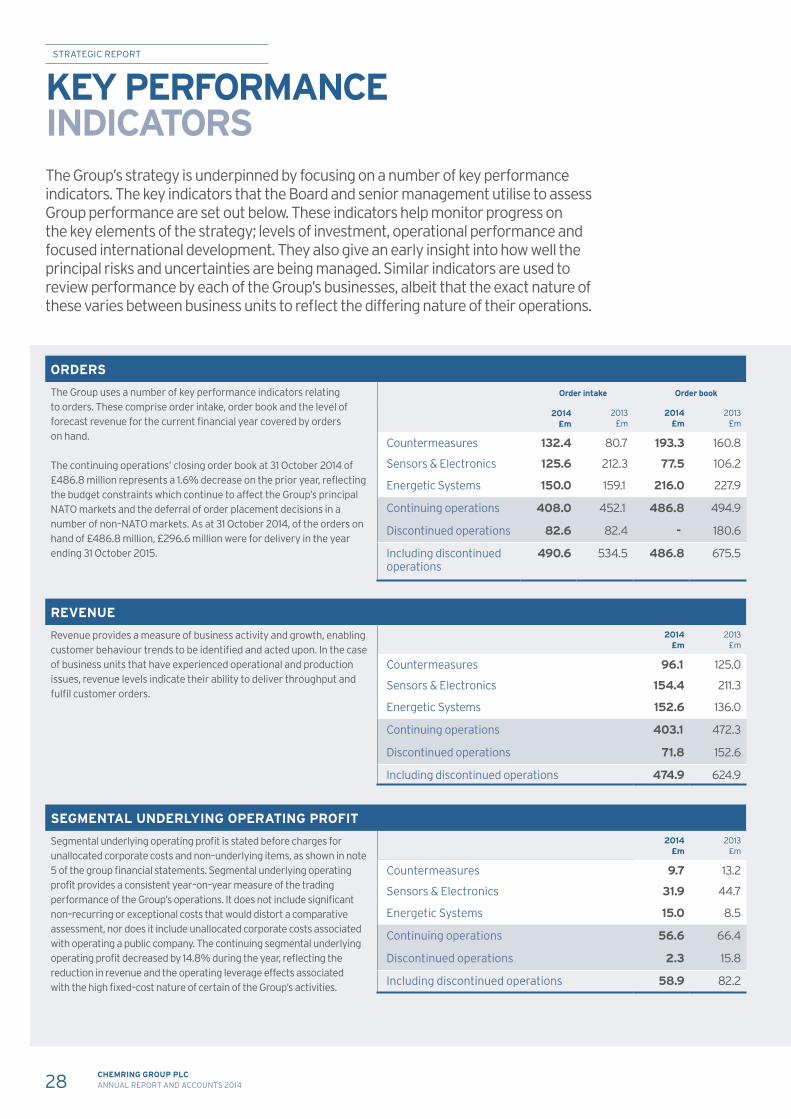
The Group’s strategy is underpinned by focusing on a number of key performance indicators. The key indicators that the Board and senior management utilise to assess Group performance are set out below. These indicators help monitor progress on the key elements of the strategy; levels of investment, operational performance and focused international development. They also give an early insight into how well the principal risks and uncertainties are being managed. Similar indicators are used to review performance by each of the Group’s businesses, albeit that the exact nature of these varies between business units to reflect the differing nature of their operations.
KEY PERFORMANCE INDICATORS
ORDERS
The Group uses a number of key performance indicators relating to orders. These comprise order intake, order book and the level of forecast revenue for the current financial year covered by orders on hand.
The continuing operations’ closing order book at 31 October 2014 of £486.8 million represents a 1.6% decrease on the prior year, reflecting the budget constraints which continue to affect the Group’s principal NATO markets and the deferral of order placement decisions in a number of non–NATO markets. As at 31 October 2014, of the orders on hand of £486.8 million, £296.6 million were for delivery in the year ending 31 October 2015.
Order intake Order book
2014£m
2013£m
2014£m
2013£m
Countermeasures 132.4 80.7 193.3 160.8
Sensors & Electronics 125.6 212.3 77.5 106.2
Energetic Systems 150.0 159.1 216.0 227.9
Continuing operations 408.0 452.1 486.8 494.9
Discontinued operations 82.6 82.4 - 180.6
Including discontinued operations
490.6 534.5 486.8 675.5
REVENUE
Revenue provides a measure of business activity and growth, enabling customer behaviour trends to be identified and acted upon. In the case of business units that have experienced operational and production issues, revenue levels indicate their ability to deliver throughput and fulfil customer orders.
2014£m
2013£m
Countermeasures 96.1 125.0
Sensors & Electronics 154.4 211.3
Energetic Systems 152.6 136.0
Continuing operations 403.1 472.3
Discontinued operations 71.8 152.6
Including discontinued operations 474.9 624.9
SEGMENTAL UNDERLYING OPERATING PROFIT
Segmental underlying operating profit is stated before charges for unallocated corporate costs and non–underlying items, as shown in note 5 of the group financial statements. Segmental underlying operating profit provides a consistent year–on–year measure of the trading performance of the Group’s operations. It does not include significant non–recurring or exceptional costs that would distort a comparative assessment, nor does it include unallocated corporate costs associated with operating a public company. The continuing segmental underlying operating profit decreased by 14.8% during the year, reflecting the reduction in revenue and the operating leverage effects associated with the high fixed–cost nature of certain of the Group’s activities.
2014£m
2013£m
Countermeasures 9.7 13.2
Sensors & Electronics 31.9 44.7
Energetic Systems 15.0 8.5
Continuing operations 56.6 66.4
Discontinued operations 2.3 15.8
Including discontinued operations 58.9 82.2
28 CHEMRING GROUP PLCANNUAL REPORT AND ACCOUNTS 2014
STRATEGIC REPORT
WORKING CAPITAL AND INVENTORY
Working capital is defined as inventories, trade and other receivables, contract receivables, trade and other payables, and provisions. The primary focus for improvement within working capital is inventory.
Optimum inventory levels drive both effective staff utilisation and cost efficiency. In addition, excess inventory results in second order costs such as increased storage and inventory management costs, the write–off of ageing or obsolete inventory, and disposal costs, which can be significant for energetic materials.
Chemring currently measures total inventory levels.
Working capital Inventory
2014£m
2013£m
2014£m
2013£m
Countermeasures 28.0 26.4 30.4 29.0
Sensors & Electronics 15.2 16.7 13.4 11.4
Energetic Systems 41.9 35.3 34.3 32.7
Continuing operations 85.1 78.4 78.1 73.1
Discontinued operations - 64.3 - 40.6
Including discontinued operations
85.1 142.7 78.1 113.7
UNDERLYING OPERATING MARGIN
Underlying operating margin is based on underlying segmental operating profit and provides an assessment of the profitability of the business. A focus on operating margin allows the impact of changes in revenue and cost base to be monitored, enabling comparisons to be made of management performance and trading effectiveness. The changes in margin of each segment reflect the weak market conditions, volume changes and performance improvement actions, as set out in this strategic report. The improvement in Energetic Systems comes principally from the much improved performance and revenue growth at Chemring Ordnance.
2014%
2013%
Countermeasures 10.1 10.6
Sensors & Electronics 20.7 21.2
Energetic Systems 9.8 6.3
Continuing operations 14.0 14.1
Discontinued operations 3.2 10.4
Including discontinued operations 12.4 13.2
STRATEGIC REPORT
GOVERNANCE
FINANCIAL STATEMENTS
OTHER INFORMATION
29CHEMRING GROUP PLCANNUAL REPORT AND ACCOUNTS 2014
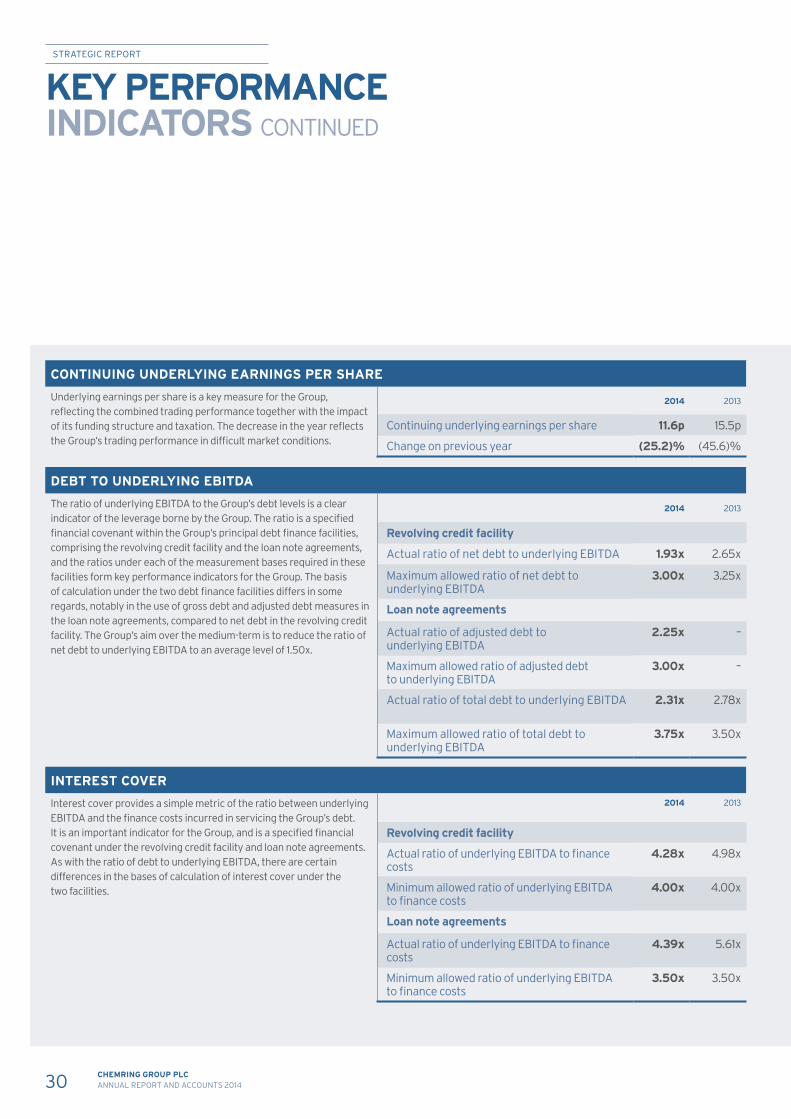
CONTINUING UNDERLYING EARNINGS PER SHARE
Underlying earnings per share is a key measure for the Group, reflecting the combined trading performance together with the impact of its funding structure and taxation. The decrease in the year reflects the Group’s trading performance in difficult market conditions.
2014 2013
Continuing underlying earnings per share 11.6p 15.5p
Change on previous year (25.2)% (45.6)%
DEBT TO UNDERLYING EBITDA
The ratio of underlying EBITDA to the Group’s debt levels is a clear indicator of the leverage borne by the Group. The ratio is a specified financial covenant within the Group’s principal debt finance facilities, comprising the revolving credit facility and the loan note agreements, and the ratios under each of the measurement bases required in these facilities form key performance indicators for the Group. The basis of calculation under the two debt finance facilities differs in some regards, notably in the use of gross debt and adjusted debt measures in the loan note agreements, compared to net debt in the revolving credit facility. The Group’s aim over the medium-term is to reduce the ratio of net debt to underlying EBITDA to an average level of 1.50x.
2014 2013
Revolving credit facility
Actual ratio of net debt to underlying EBITDA 1.93x 2.65x
Maximum allowed ratio of net debt to underlying EBITDA
3.00x 3.25x
Loan note agreements
Actual ratio of adjusted debt to underlying EBITDA
2.25x –
Maximum allowed ratio of adjusted debt to underlying EBITDA
3.00x –
Actual ratio of total debt to underlying EBITDA 2.31x 2.78x
Maximum allowed ratio of total debt to underlying EBITDA
3.75x 3.50x
INTEREST COVER
Interest cover provides a simple metric of the ratio between underlying EBITDA and the finance costs incurred in servicing the Group’s debt. It is an important indicator for the Group, and is a specified financial covenant under the revolving credit facility and loan note agreements. As with the ratio of debt to underlying EBITDA, there are certain differences in the bases of calculation of interest cover under the two facilities.
2014 2013
Revolving credit facility
Actual ratio of underlying EBITDA to finance costs
4.28x 4.98x
Minimum allowed ratio of underlying EBITDA to finance costs
4.00x 4.00x
Loan note agreements
Actual ratio of underlying EBITDA to finance costs
4.39x 5.61x
Minimum allowed ratio of underlying EBITDA to finance costs
3.50x 3.50x
KEY PERFORMANCE INDICATORS CONTINUED
30 CHEMRING GROUP PLCANNUAL REPORT AND ACCOUNTS 2014
STRATEGIC REPORT
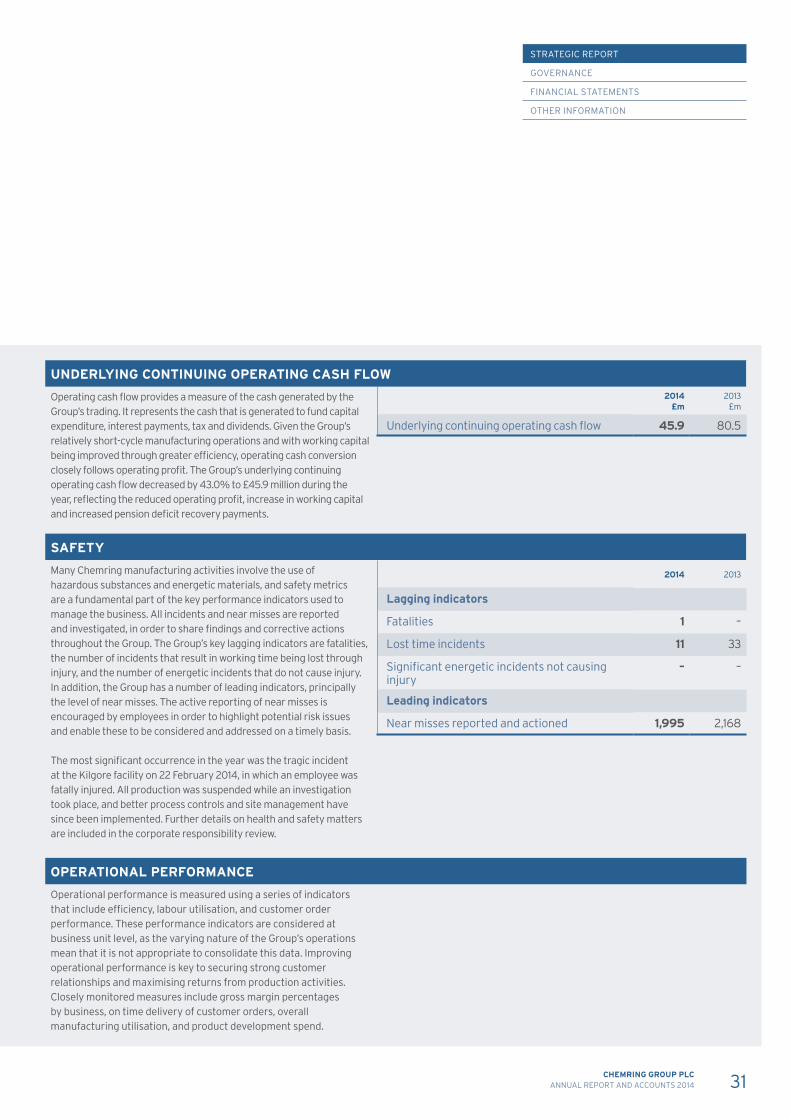
UNDERLYING CONTINUING OPERATING CASH FLOW
Operating cash flow provides a measure of the cash generated by the Group’s trading. It represents the cash that is generated to fund capital expenditure, interest payments, tax and dividends. Given the Group’s relatively short-cycle manufacturing operations and with working capital being improved through greater efficiency, operating cash conversion closely follows operating profit. The Group’s underlying continuing operating cash flow decreased by 43.0% to £45.9 million during the year, reflecting the reduced operating profit, increase in working capital and increased pension deficit recovery payments.
2014£m
2013£m
Underlying continuing operating cash flow 45.9 80.5
SAFETY
Many Chemring manufacturing activities involve the use of hazardous substances and energetic materials, and safety metrics are a fundamental part of the key performance indicators used to manage the business. All incidents and near misses are reported and investigated, in order to share findings and corrective actions throughout the Group. The Group’s key lagging indicators are fatalities, the number of incidents that result in working time being lost through injury, and the number of energetic incidents that do not cause injury. In addition, the Group has a number of leading indicators, principally the level of near misses. The active reporting of near misses is encouraged by employees in order to highlight potential risk issues and enable these to be considered and addressed on a timely basis.
The most significant occurrence in the year was the tragic incident at the Kilgore facility on 22 February 2014, in which an employee was fatally injured. All production was suspended while an investigation took place, and better process controls and site management have since been implemented. Further details on health and safety matters are included in the corporate responsibility review.
2014 2013
Lagging indicators
Fatalities 1 –
Lost time incidents 11 33
Significant energetic incidents not causing injury
– –
Leading indicators
Near misses reported and actioned 1,995 2,168
OPERATIONAL PERFORMANCE
Operational performance is measured using a series of indicators that include efficiency, labour utilisation, and customer order performance. These performance indicators are considered at business unit level, as the varying nature of the Group’s operations mean that it is not appropriate to consolidate this data. Improving operational performance is key to securing strong customer relationships and maximising returns from production activities. Closely monitored measures include gross margin percentages by business, on time delivery of customer orders, overall manufacturing utilisation, and product development spend.
STRATEGIC REPORT
GOVERNANCE
FINANCIAL STATEMENTS
OTHER INFORMATION
31CHEMRING GROUP PLCANNUAL REPORT AND ACCOUNTS 2014
PRINCIPAL RISKS AND UNCERTAINTIESAs described on page 53, the Board is responsible for the Group’s systems of internal control and its risk management systems. The Board has constituted a Risk Management Committee, which meets quarterly, to review the key risks associated with the achievement of the annual budget and the three year plan for each business, the most significant health and safety risks identified at each site, and the risk control procedures implemented. The Committee reports bi-annually to the Audit Committee and the Board, and through this process, the Board has identified the following principal risks currently facing the Group. The mitigating actions taken by the Group management to address these risks are also set out below, together with an indication of whether the risk exposure is increasing, decreasing or remains broadly unchanged. The Group’s key performance indicators also give insight into how these risks and uncertainties are being managed. The Group mitigates certain elements of its risk exposure through an insurance programme that covers property and liability risks, where it is appropriate and cost effective to do so. The arrows indicate whether the risks and impacts have been assessed to have increased, decreased or remained broadly consistent during the year.
RISKS AND IMPACTS KEY MITIGATIONS
Health and safety risks
The Group’s operations which utilise energetic materials are subject to inherent health and safety risks. From time to time, incidents may occur which could result in harm to employees, the temporary shutdown of facilities or other disruption to manufacturing processes, causing production delays and resulting in financial loss and potential liability for workplace injuries and fatalities.
The Board believes that responsibility for the delivery of world-class safety standards is an integral part of operational management accountability. The Board is committed to ensuring that the Group’s leadership operates with health and safety as the top priority, and that the strength of the Group’s safety culture and the quality of its protective systems deliver operations where all employees and visitors feel and are absolutely safe.
Chemring’s Safety Leadership Programme was attended by the senior management teams of every Group business during 2014. All employees have received a booklet setting out the Group’s statements of intent in relation to delivery of its health and safety strategy and the behaviours required of them as individuals. All employees are encouraged to report potential hazards, and to raise any health and safety concerns through the appropriate channels.
The Group continues to invest in state–of–the–art process safety systems and equipment. The Group’s safety and loss prevention programmes require detailed pre–construction reviews of process changes and new operations, and safety audits of operations are undertaken on a regular basis. All businesses are expected to pro-actively manage their own risks but, in addition, the most significant site risks at each business and their associated mitigation programmes are reviewed quarterly by the Risk Management Committee.
Health and safety is included on the agenda at every Board meeting and is discussed at the monthly Group Executive Committee meeting. Further details on the Group’s approach to health and safety are set out in the corporate responsibility review.
Possible defence budget cuts
Defence spending levels depend on a complex mix of political considerations, budgetary constraints and the requirements of the armed forces to address specific threats and perform certain missions. As such, defence spending may be subject to significant fluctuations from year to year. In 2015, UK defence budgets may also be affected by additional spending reviews triggered by the outcome of the May 2015 general election. Given the large budget deficits and the prevailing economic conditions in many NATO countries, the Group expects there to be continued downward pressure on budgets and consequently defence expenditure could be severely impacted.
In recognition of the issues affecting the Group’s traditional NATO markets, business development activities are being focused on non–NATO markets, where defence expenditure is forecast to grow strongly over the next five to ten years. The Group continues to make progress on developing its routes to market in the Middle East, India and Brazil.
The Group also continually assesses whether its planned organic growth strategies and product developments align with government priorities for future funding. Most product development programmes take between six and twelve months to complete, and this gives the Group the ability to quickly redeploy engineering staff to product areas where funding is more secure.
The Group continues to closely monitor the position in all the key markets in which it operates.
32 CHEMRING GROUP PLCANNUAL REPORT AND ACCOUNTS 2014
STRATEGIC REPORT
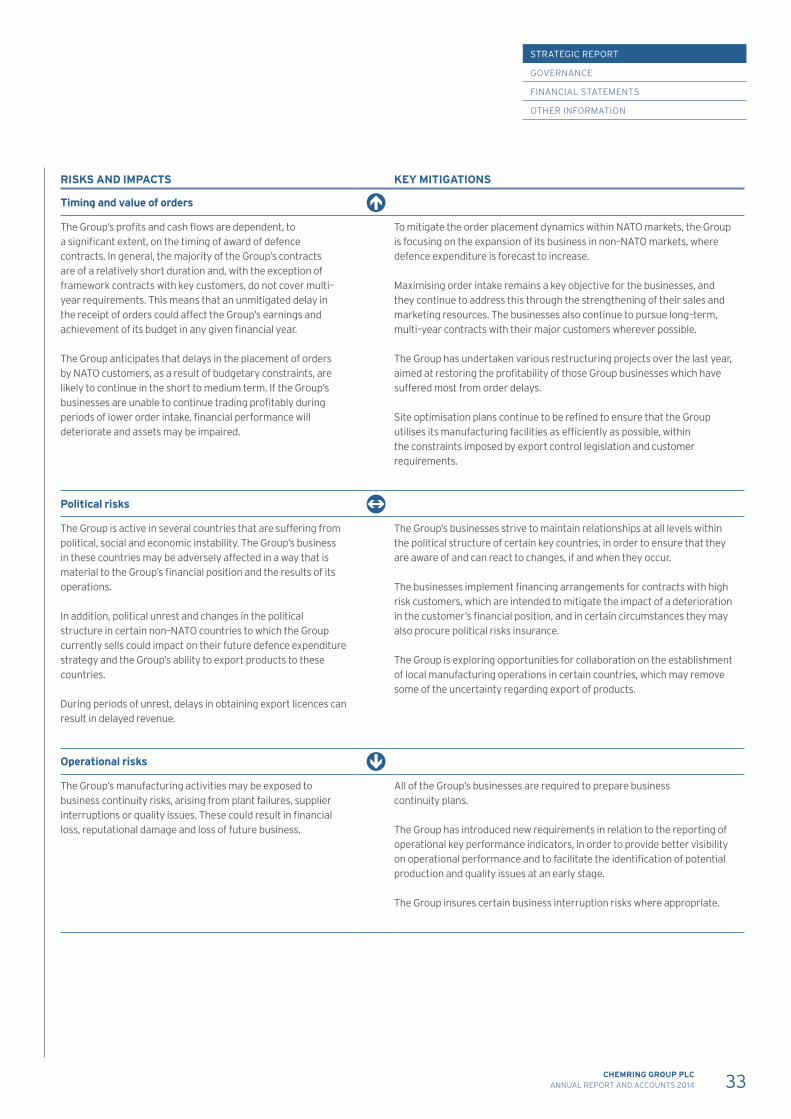
RISKS AND IMPACTS KEY MITIGATIONS
Timing and value of orders
The Group’s profits and cash flows are dependent, to a significant extent, on the timing of award of defence contracts. In general, the majority of the Group’s contracts are of a relatively short duration and, with the exception of framework contracts with key customers, do not cover multi–year requirements. This means that an unmitigated delay in the receipt of orders could affect the Group’s earnings and achievement of its budget in any given financial year.
The Group anticipates that delays in the placement of orders by NATO customers, as a result of budgetary constraints, are likely to continue in the short to medium term. If the Group’s businesses are unable to continue trading profitably during periods of lower order intake, financial performance will deteriorate and assets may be impaired.
To mitigate the order placement dynamics within NATO markets, the Group is focusing on the expansion of its business in non–NATO markets, where defence expenditure is forecast to increase.
Maximising order intake remains a key objective for the businesses, and they continue to address this through the strengthening of their sales and marketing resources. The businesses also continue to pursue long–term, multi–year contracts with their major customers wherever possible.
The Group has undertaken various restructuring projects over the last year, aimed at restoring the profitability of those Group businesses which have suffered most from order delays.
Site optimisation plans continue to be refined to ensure that the Group utilises its manufacturing facilities as efficiently as possible, within the constraints imposed by export control legislation and customer requirements.
Political risks
The Group is active in several countries that are suffering from political, social and economic instability. The Group’s business in these countries may be adversely affected in a way that is material to the Group’s financial position and the results of its operations.
In addition, political unrest and changes in the political structure in certain non–NATO countries to which the Group currently sells could impact on their future defence expenditure strategy and the Group’s ability to export products to these countries.
During periods of unrest, delays in obtaining export licences can result in delayed revenue.
The Group’s businesses strive to maintain relationships at all levels within the political structure of certain key countries, in order to ensure that they are aware of and can react to changes, if and when they occur.
The businesses implement financing arrangements for contracts with high risk customers, which are intended to mitigate the impact of a deterioration in the customer’s financial position, and in certain circumstances they may also procure political risks insurance.
The Group is exploring opportunities for collaboration on the establishment of local manufacturing operations in certain countries, which may remove some of the uncertainty regarding export of products.
Operational risks
The Group’s manufacturing activities may be exposed to business continuity risks, arising from plant failures, supplier interruptions or quality issues. These could result in financial loss, reputational damage and loss of future business.
All of the Group’s businesses are required to prepare business continuity plans.
The Group has introduced new requirements in relation to the reporting of operational key performance indicators, in order to provide better visibility on operational performance and to facilitate the identification of potential production and quality issues at an early stage.
The Group insures certain business interruption risks where appropriate.
33CHEMRING GROUP PLCANNUAL REPORT AND ACCOUNTS 2014
STRATEGIC REPORT
GOVERNANCE
FINANCIAL STATEMENTS
OTHER INFORMATION

PRINCIPAL RISKS AND UNCERTAINTIES CONTINUED
RISKS AND IMPACTS KEY MITIGATIONS
Introduction of new products
The Group’s approach to innovation and continued emphasis on research and development activity means that it is continually adding new products to the range. There is a need to ensure that this new product development is completed in a timely manner, and to a standard which allows volume manufacturing to be undertaken and the production of products against high reliability and safety criteria to meet customers’ requirements. Failure to achieve this may have both financial and reputational impacts.
The Group also needs to ensure that it continues to upgrade its existing product range to compete with emerging technologies, and to avoid the risk of obsolescence or loss of business.
The Group has introduced a more focused product development and technology investment approach, in order to ensure that resources are applied appropriately across the Group in support of the three year plan. A Technology Board has been established to review all proposed research and development projects, to ensure that key initiatives are being prioritised, and to prevent possible duplication of effort in different parts of the Group. Working groups have been established to drive and co–ordinate technology investment in certain key areas, such as cyber-security.
Product liability and other customer claims
The Group may be subject to product liability and other claims from customers or third parties, in connection with the non–compliance of these products or services with the customer’s requirements, due to faults in design or production; the delay or failed supply of the products or the services indicated in the contract; or possible malfunction or misuse of products. As many of the Group’s products are single–use devices, it is often impossible to conduct functional testing without destroying the product, and this increases the risk of possible product failure, either in use or during customers’ own sample–based functional tests.
Substantial claims could harm the Group’s business and its financial position. In addition, any accident, failure, incident or liability, even if fully insured, could negatively affect the Group’s reputation among customers and the public, thereby making it more difficult for the Group to compete effectively.
Material breaches in the performance of contractual obligations may also lead to contract termination and the calling of performance bonds.
The businesses maintain rigorous control of their production processes, monitoring critical parameters on a batch or unit basis. State–of–the–art techniques, including statistical process control or Six Sigma, are applied and, where appropriate, processes are automated to reduce the scope for human error. Detailed assessments of incoming components and materials are conducted to ensure compliance with specifications.
Product liability claims from third parties for damage to property or persons are generally covered by the Group’s insurance policies, subject to applicable insurance conditions.
Management resource
The Group requires competent management to lead it through the next stage of its development. In challenging markets and difficult times, there is a need to retain and incentivise senior managers and key employees, in order to ensure that the operations of the Group do not suffer from loss of management expertise and knowledge. As the shape of the Group’s business also changes, with an increased focus on electronics, there is a need to ensure that the businesses build an appropriate skill base to enable them to compete successfully in new markets and product areas.
Incentivisation arrangements have been streamlined and improved, to ensure that employees are suitably incentivised to deliver key strategic objectives.
34 CHEMRING GROUP PLCANNUAL REPORT AND ACCOUNTS 2014
STRATEGIC REPORT

RISKS AND IMPACTS KEY MITIGATIONS
Compliance and corruption risks
The Group operates in over fifty countries worldwide, in a highly regulated environment, and is subject to applicable laws and regulations in each of these jurisdictions. The Group must ensure that all of its businesses, its employees and third parties providing services on its behalf comply with all relevant legal obligations, as non–compliance could result in administrative, civil or criminal liabilities, and could expose the Group to fines, penalties, suspension or debarment, and reputational damage.
The nature of the Group’s operations could also expose it to government investigations relating to import–export controls, money laundering, false accounting, and corruption or bribery.
The Group has a central legal and compliance function which assists and monitors all Group businesses, supported by dedicated internal legal resource in the US. The Group’s internal audit activities also incorporate a review of legal risks.
The Group operates under a Global Code of Business Principles, which stipulates the standard of acceptable business conduct required from all employees and third parties acting on the Group’s behalf. The Group has also adopted a Bribery Act Compliance Manual, incorporating all of its anti–bribery policies and procedures.
A significant proportion of the Group’s management have received training in relation to ethics and anti–corruption.
Environmental laws and regulations
The Group’s operations and ownership or use of real property is subject to a number of federal, state and local environmental laws and regulations, including those relating to discharge of hazardous materials, remediation of contaminated sites, and restoration of damage to the environment. At certain sites that the Group owns or operates, or formerly owned or operated, there is known or potential contamination for which there is a requirement to remediate or provide resource restoration. The Group could incur substantial costs, including remediation costs, resource restoration costs, fines and penalties, or be exposed to third party property damage or personal injury claims, as a result of liabilities associated with past practices or violations of environmental laws or non–compliance with environmental permits.
All of the Group’s businesses are certified to the environmental management system ISO 14001, which requires the setting of environmental goals and objectives focused on local aspects and impacts.
The Group has managed monitoring and remediation programmes at certain sites, for which appropriate financial provision has been made. In certain circumstances, the Group procures environmental liability insurance, subject to insurance conditions.
Financial risks
Details of the financial risks to which the Group is potentially exposed and details of mitigating factors are set out in the financial review and note 24 of the group financial statements.
35CHEMRING GROUP PLCANNUAL REPORT AND ACCOUNTS 2014
STRATEGIC REPORT
GOVERNANCE
FINANCIAL STATEMENTS
OTHER INFORMATION
The Group’s approach The Board has overall responsibility for establishing and maintaining the Group’s policies in this area, and the Group Chief Executive is accountable to the Board for ensuring that the Group’s businesses adhere to these policies.
The Board recognises that the long–term success of the Group will be enhanced by a positive interaction with all of its stakeholders, and has determined that the Group’s corporate responsibility initiatives should be focused on the following key areas: • health and safety; • employee support and development; • environmental protection; and• ethical business conduct.
The Board intends that the Group’s corporate responsibility approach will be fully embedded within its business units, and the senior management bonus plan incorporates specific objectives in the above areas.
Further details of the Group’s approach are set out below.
In the workplace Health and safety Policy and practicesThe Board recognises that the highest levels of safety are required in order to protect employees, product users and the general public. The Board believes that all incidents and injuries are preventable, and that all employees have the right to expect to return home safely at the end of every working day. The long–term strategies the Group has adopted within its three year plan for health, safety and the environment are designed to ensure that it continually improves its performance and reduces risk.
The Group Chief Executive has overall responsibility for health, safety and environmental matters across the Group. The Group Director of Safety reports directly to the Group Chief Executive, and is responsible for the effective administration and implementation of the Group’s health, safety and environment strategy. The Group Director of Safety is a member of the Group Executive Committee and reports on the performance of all businesses against agreed targets and objectives. The Group Chief Executive reports monthly to the Board on all key health and safety issues.
The Board requires that all businesses systematically manage their health and safety hazards, set objectives, monitor progress by regular measurement, audit and review, and take additional action where necessary. Each managing director is responsible for the management of health and safety within their business, and for providing adequate resources to satisfy the Board’s requirements. All managing directors have health and safety related objectives incorporated within their annual bonus plan.
Managers and supervisors in the Group’s businesses are required to enforce procedures, and to provide leadership and commitment to promote and embrace a positive health and safety culture. The Board emphasises the importance of individual responsibility for health and safety at all levels of the organisation, and expects employees to report potential hazards, to be involved in implementing solutions, and to adhere to rules and procedures.
A key element in the continual improvement of health and safety management is sharing best practice and lessons learnt from incidents across the Group’s businesses and the wider industry. Accidents, incidents and near misses are investigated, with actions generated to prevent recurrence. Compliance audits are conducted and all findings are subject to corrective action reviews to ensure closure.
All of the Group’s businesses are certified to the international health and safety management system OHSAS18001.
Energetic eventsOn 22 February 2014, an employee at the Kilgore facility suffered severe burns when a flare composition ignited during a cleaning process. Tragically, he subsequently died from his injuries. Extensive investigations by both staff and the local regulator found that proper processes and procedures were in place but they had not been followed. Kilgore supported the employee’s family through very difficult times, and continues to extend its support and deepest sympathies to his family, friends and work colleagues.
Following this incident an “alert” was issued to all Group businesses which required urgent action to identify and close any gaps that might lead to a similar incident elsewhere, and these are now being monitored to closure.
On 13 March 2014, an APOBS grenade detonated in a press tool at the Chemring Ordnance facility in Florida. All safety equipment worked and although there was damage to machinery and tooling there were no injuries to any employees.
The Group had no other significant energetic events during the year.
Culture and behaviourIn 2014, the Group’s Safety Leadership Programme was delivered to members of the Executive Committee, non-executive directors, and all business unit management teams. The aims of the programme are to reinforce safety leadership, and to provide tools and techniques to drive improvements in safety culture across the Group. Each business now has an improvement programme, with defined goals and timescales. Materials are currently being prepared to extend the Safety Leadership Programme to managers and supervisors.
CORPORATE RESPONSIBILITY REVIEW The Group acknowledges its obligation to ensure the responsible operation of its business at all times, and is fully committed to sound and ethical business conduct in its interaction with key stakeholders (shareholders, employees, customers, business partners and suppliers), governments and regulators, communities and society, and the environment.
36 CHEMRING GROUP PLCANNUAL REPORT AND ACCOUNTS 2014
STRATEGIC REPORT
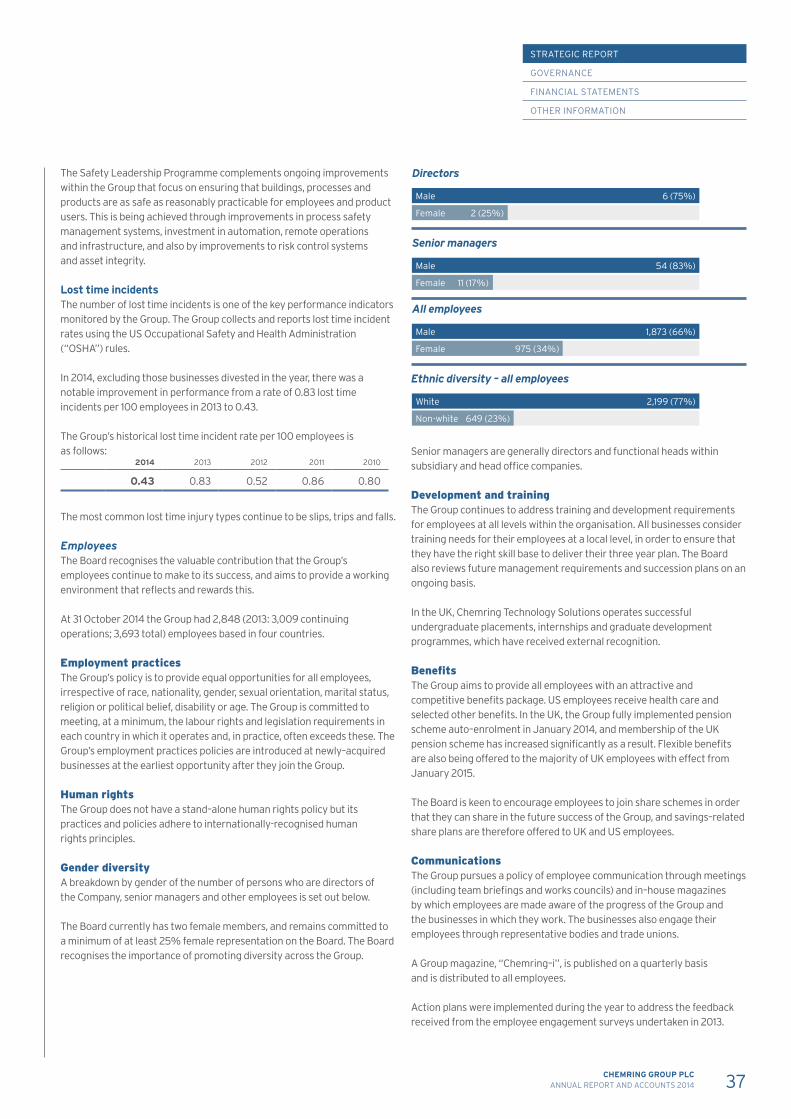
The Safety Leadership Programme complements ongoing improvements within the Group that focus on ensuring that buildings, processes and products are as safe as reasonably practicable for employees and product users. This is being achieved through improvements in process safety management systems, investment in automation, remote operations and infrastructure, and also by improvements to risk control systems and asset integrity.
Lost time incidentsThe number of lost time incidents is one of the key performance indicators monitored by the Group. The Group collects and reports lost time incident rates using the US Occupational Safety and Health Administration (“OSHA”) rules.
In 2014, excluding those businesses divested in the year, there was a notable improvement in performance from a rate of 0.83 lost time incidents per 100 employees in 2013 to 0.43.
The Group’s historical lost time incident rate per 100 employees is as follows:
2014 2013 2012 2011 2010
0.43 0.83 0.52 0.86 0.80
The most common lost time injury types continue to be slips, trips and falls.
EmployeesThe Board recognises the valuable contribution that the Group’s employees continue to make to its success, and aims to provide a working environment that reflects and rewards this.
At 31 October 2014 the Group had 2,848 (2013: 3,009 continuing operations; 3,693 total) employees based in four countries.
Employment practicesThe Group’s policy is to provide equal opportunities for all employees, irrespective of race, nationality, gender, sexual orientation, marital status, religion or political belief, disability or age. The Group is committed to meeting, at a minimum, the labour rights and legislation requirements in each country in which it operates and, in practice, often exceeds these. The Group’s employment practices policies are introduced at newly–acquired businesses at the earliest opportunity after they join the Group.
Human rightsThe Group does not have a stand–alone human rights policy but its practices and policies adhere to internationally-recognised human rights principles.
Gender diversityA breakdown by gender of the number of persons who are directors of the Company, senior managers and other employees is set out below.
The Board currently has two female members, and remains committed to a minimum of at least 25% female representation on the Board. The Board recognises the importance of promoting diversity across the Group.
Directors
Female 2 (25%)
Male 6 (75%)
Senior managers
Female 11 (17%)
Male 54 (83%)
All employees
Female 975 (34%)
Male 1,873 (66%)
Ethnic diversity – all employees
Non-white 649 (23%)
White 2,199 (77%)
Senior managers are generally directors and functional heads within subsidiary and head office companies.
Development and training The Group continues to address training and development requirements for employees at all levels within the organisation. All businesses consider training needs for their employees at a local level, in order to ensure that they have the right skill base to deliver their three year plan. The Board also reviews future management requirements and succession plans on an ongoing basis.
In the UK, Chemring Technology Solutions operates successful undergraduate placements, internships and graduate development programmes, which have received external recognition.
Benefits The Group aims to provide all employees with an attractive and competitive benefits package. US employees receive health care and selected other benefits. In the UK, the Group fully implemented pension scheme auto–enrolment in January 2014, and membership of the UK pension scheme has increased significantly as a result. Flexible benefits are also being offered to the majority of UK employees with effect from January 2015.
The Board is keen to encourage employees to join share schemes in order that they can share in the future success of the Group, and savings–related share plans are therefore offered to UK and US employees.
Communications The Group pursues a policy of employee communication through meetings (including team briefings and works councils) and in–house magazines by which employees are made aware of the progress of the Group and the businesses in which they work. The businesses also engage their employees through representative bodies and trade unions.
A Group magazine, “Chemring–i”, is published on a quarterly basis and is distributed to all employees.
Action plans were implemented during the year to address the feedback received from the employee engagement surveys undertaken in 2013.
37CHEMRING GROUP PLCANNUAL REPORT AND ACCOUNTS 2014
STRATEGIC REPORT
GOVERNANCE
FINANCIAL STATEMENTS
OTHER INFORMATION
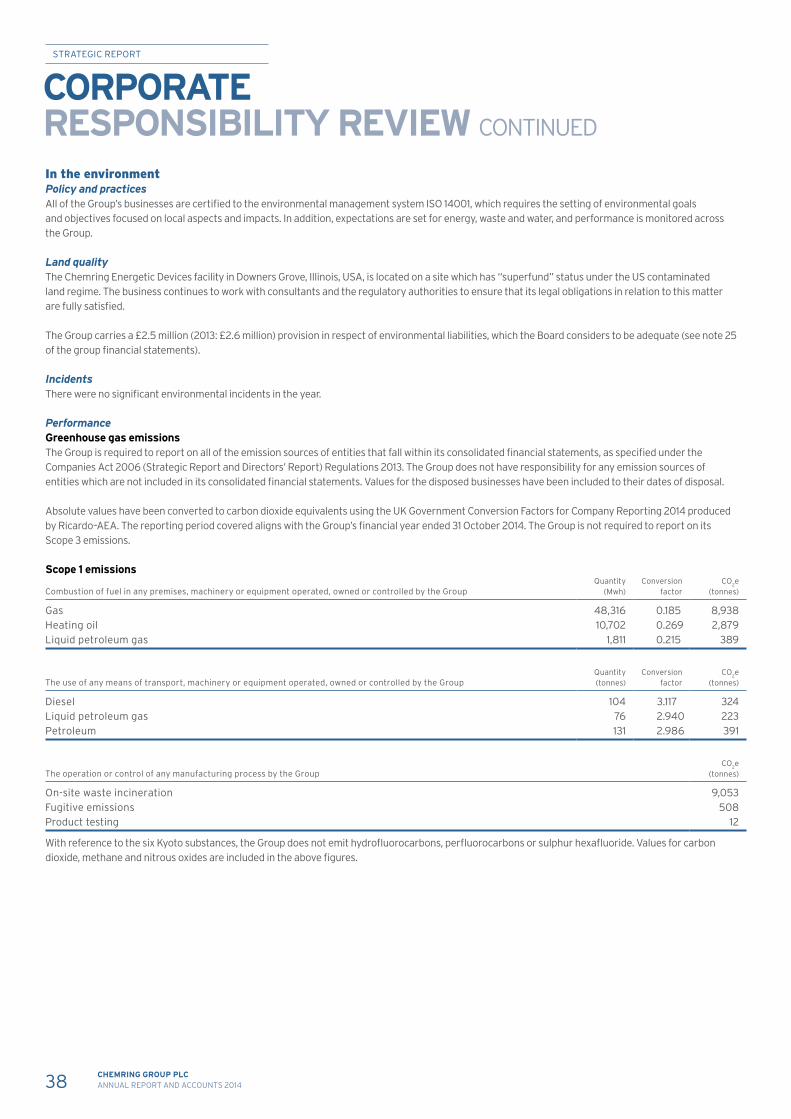
In the environment Policy and practices All of the Group’s businesses are certified to the environmental management system ISO 14001, which requires the setting of environmental goals and objectives focused on local aspects and impacts. In addition, expectations are set for energy, waste and water, and performance is monitored across the Group.
Land quality The Chemring Energetic Devices facility in Downers Grove, Illinois, USA, is located on a site which has “superfund” status under the US contaminated land regime. The business continues to work with consultants and the regulatory authorities to ensure that its legal obligations in relation to this matter are fully satisfied.
The Group carries a £2.5 million (2013: £2.6 million) provision in respect of environmental liabilities, which the Board considers to be adequate (see note 25 of the group financial statements).
Incidents There were no significant environmental incidents in the year.
PerformanceGreenhouse gas emissionsThe Group is required to report on all of the emission sources of entities that fall within its consolidated financial statements, as specified under the Companies Act 2006 (Strategic Report and Directors’ Report) Regulations 2013. The Group does not have responsibility for any emission sources of entities which are not included in its consolidated financial statements. Values for the disposed businesses have been included to their dates of disposal.
Absolute values have been converted to carbon dioxide equivalents using the UK Government Conversion Factors for Company Reporting 2014 produced by Ricardo–AEA. The reporting period covered aligns with the Group’s financial year ended 31 October 2014. The Group is not required to report on its Scope 3 emissions.
Scope 1 emissions
Combustion of fuel in any premises, machinery or equipment operated, owned or controlled by the GroupQuantity
(Mwh)Conversion
factorCO2e
(tonnes)
Gas 48,316 0.185 8,938Heating oil 10,702 0.269 2,879Liquid petroleum gas 1,811 0.215 389
The use of any means of transport, machinery or equipment operated, owned or controlled by the GroupQuantity (tonnes)
Conversion factor
CO2e (tonnes)
Diesel 104 3.117 324Liquid petroleum gas 76 2.940 223Petroleum 131 2.986 391
The operation or control of any manufacturing process by the GroupCO2e
(tonnes)
On-site waste incineration 9,053Fugitive emissions 508Product testing 12
With reference to the six Kyoto substances, the Group does not emit hydrofluorocarbons, perfluorocarbons or sulphur hexafluoride. Values for carbon dioxide, methane and nitrous oxides are included in the above figures.
CORPORATE RESPONSIBILITY REVIEW CONTINUED
38 CHEMRING GROUP PLCANNUAL REPORT AND ACCOUNTS 2014
STRATEGIC REPORT
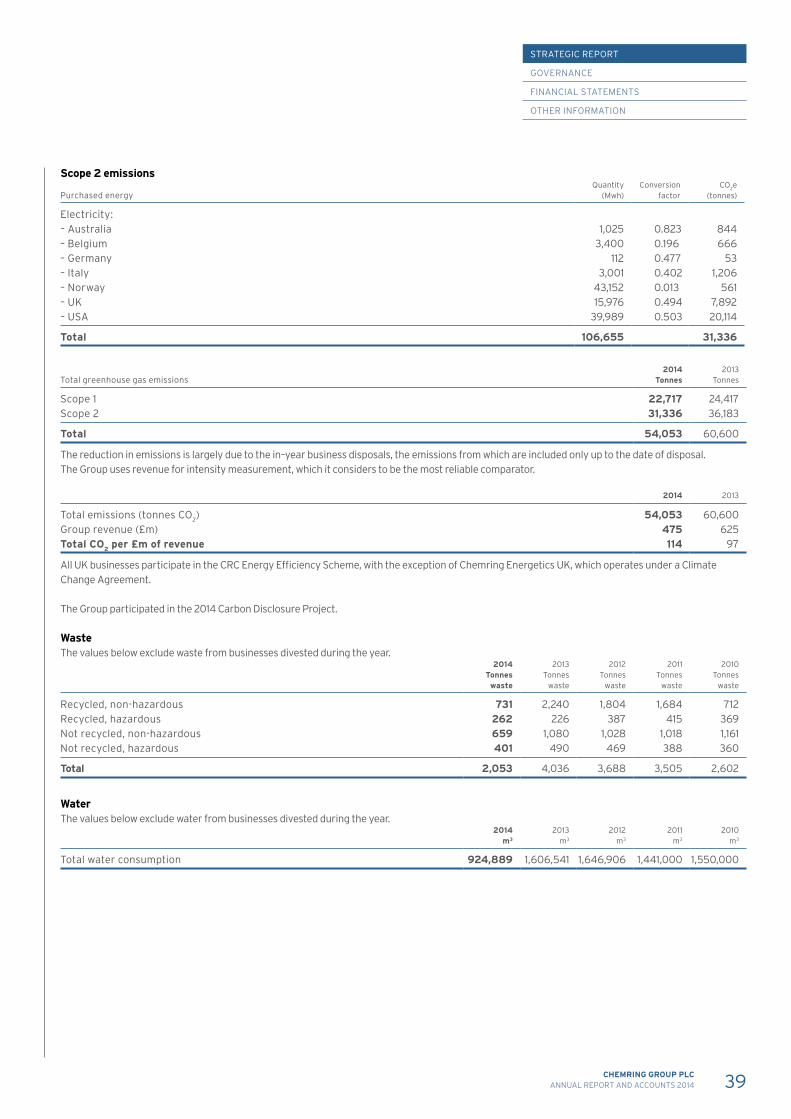
Scope 2 emissions
Purchased energyQuantity
(Mwh)Conversion
factorCO2e
(tonnes)
Electricity:– Australia 1,025 0.823 844– Belgium 3,400 0.196 666– Germany 112 0.477 53– Italy 3,001 0.402 1,206– Norway 43,152 0.013 561– UK 15,976 0.494 7,892– USA 39,989 0.503 20,114
Total 106,655 31,336
Total greenhouse gas emissions2014
Tonnes2013
Tonnes
Scope 1 22,717 24,417Scope 2 31,336 36,183
Total 54,053 60,600
The reduction in emissions is largely due to the in–year business disposals, the emissions from which are included only up to the date of disposal. The Group uses revenue for intensity measurement, which it considers to be the most reliable comparator.
2014 2013
Total emissions (tonnes CO2) 54,053 60,600Group revenue (£m) 475 625Total CO2 per £m of revenue 114 97
All UK businesses participate in the CRC Energy Efficiency Scheme, with the exception of Chemring Energetics UK, which operates under a Climate Change Agreement.
The Group participated in the 2014 Carbon Disclosure Project.
WasteThe values below exclude waste from businesses divested during the year.
2014 Tonnes
waste
2013Tonnes
waste
2012Tonnes
waste
2011Tonnes
waste
2010Tonnes
waste
Recycled, non-hazardous 731 2,240 1,804 1,684 712Recycled, hazardous 262 226 387 415 369Not recycled, non-hazardous 659 1,080 1,028 1,018 1,161Not recycled, hazardous 401 490 469 388 360
Total 2,053 4,036 3,688 3,505 2,602
WaterThe values below exclude water from businesses divested during the year.
2014 m3
2013 m3
2012 m3
2011 m3
2010 m3
Total water consumption 924,889 1,606,541 1,646,906 1,441,000 1,550,000
39CHEMRING GROUP PLCANNUAL REPORT AND ACCOUNTS 2014
STRATEGIC REPORT
GOVERNANCE
FINANCIAL STATEMENTS
OTHER INFORMATION
In the community Helping others The Board recognises that each of the Group’s businesses has an important role to play in its local community.
The Board operates a charitable policy, which confirms its commitment to support selected charitable causes with a focus on the military and armed services, and those linked to the local communities in which the Group’s businesses operate. Each business has its own locally held charity budget, and at a Group level, charitable donations are considered on a monthly basis by the Executive Committee. The Group continues to sponsor the Red Devils.
In addition to making cash donations, the Group also encourages and supports employees who undertake voluntary work in the local community, where appropriate. During the year, employees donated their time and services on a wide range of projects, several of which had an educational bias.
The Group is involved with a number of educational initiatives, notably including the sponsorship of various local schools. The Group has relationships with several universities, whereby funding is provided for students’ research activities.
Local impact With regards to the impact of the Group’s manufacturing activities on the local community, at locations where operations may inconvenience neighbours through product proofing, the businesses liaise with local residents to minimise any impact. The Group is also cognisant of the potential impact of its operations on the local environment, and is addressing this through its environmental strategy.
In the marketplace Policy on the Sale of Goods and Services The Board has adopted a Policy on the Sale of Goods and Services, which provides guidance to all stakeholders on the products and services that the Group will supply, to which customers and to which countries, and sets out a clear definition of what the businesses will not supply. All Group businesses are required to comply with this policy, which addresses both legal and ethical considerations with regards to certain products. The policy is reviewed and updated on a regular basis.
Ethics and business conduct The Group has adopted a Global Code of Business Principles, which requires its employees, its businesses and all third parties who act on the Group’s behalf to comply with the Group’s standards of acceptable business conduct and applicable laws and regulations in all of the countries in which the Group operates.
Anti–bribery and corruption The Group’s Bribery Act Compliance Manual incorporates all of its anti–corruption policies and procedures, including the following: • requirements for bribery risk assessments to be carried out as part of
normal operating procedures; • Group–wide policies and procedures on the appointment of all sales
partners and other third party advisers, stipulating due diligence and contractual requirements, approval levels, and monitoring and review processes;
• regular training for management and employees working within commercial, sales and marketing, finance and human resource functions; and
• policies and procedures on the giving and receiving of gifts and hospitality.
The Group’s US businesses have an ethical compliance programme to satisfy US Government requirements for ethical training for employees, compliance audits, a confidential reporting line for employees, and related investigation procedures.
The Group has a whistleblowing policy and procedures in place which enable all employees to raise concerns, in confidence, about possible improprieties. These arrangements reflect the requirements of the UK Bribery Act 2010.
Strategic report
Cautionary statement This report contains forward-looking statements that are based on current expectations or beliefs, as well as assumptions about future events. These forward-looking statements can be identified by the fact that they do not relate only to historical or current facts. Forward-looking statements often use words such as anticipate, target, expect, estimate, intend, plan, goal, believe, will, may, should, would, could, is confident, or other words of similar meaning. Undue reliance should not be placed on any such statements because they speak only as at the date of this document and, by their very nature, they are subject to known and unknown risks and uncertainties and can be affected by other factors that could cause actual results, and Chemring’s plans and objectives, to differ materially from those expressed or implied in the forward-looking statements.
There are a number of factors which could cause actual results to differ materially from those expressed or implied in forward-looking statements. Among the factors that could cause actual results to differ materially from those described in the forward-looking statements are; increased competition, the loss of or damage to one or more key customer relationships, changes to customer ordering patterns, delays in obtaining customer approvals for engineering or price level changes, the failure of one or more key suppliers, the outcome of business or industry restructuring, the outcome of any litigation, changes in economic conditions, currency fluctuations, changes in interest and tax rates, changes in raw material or energy market prices, changes in laws, regulations or regulatory policies, developments in legal or public policy doctrines, technological developments, the failure to retain key management, or the key timing and success of future acquisition opportunities or major investment projects.
Chemring is under no obligation to revise or update any forward-looking statement contained within these financial statements, regardless of whether those statements are affected as a result of new information, future events or otherwise, save as required by law and regulations.
The strategic report on pages 1 to 40 has been approved by the Board of directors and signed on its behalf by:
Michael FlowersGroup Chief Executive
22 January 2015
CORPORATE RESPONSIBILITY REVIEW CONTINUED
40 CHEMRING GROUP PLCANNUAL REPORT AND ACCOUNTS 2014
STRATEGIC REPORT

CHEMRING GROUP PLCANNUAL REPORT AND ACCOUNTS 2014 41
STRATEGIC REPORT
GOVERNANCE
FINANCIAL STATEMENTS
OTHER INFORMATION

BOARD OF DIRECTORSName/Position/ Committee membership
Length of service on the Board (as at 22 January 2015) Experience Independent
Public board
experienceOperational experience
International experience
Legal/M&A experience
Financial experience
Government/ regulatory experience Commentary
Peter Hickson Non–Executive Chairman Nomination (Chair) Remuneration
4 years 7 months
• Finance experience from CFO positions
• Board experience at Chairman level
• Chartered Accountant N/A ✓ ✓ ✓ ✓ ✓ ✓
Peter Hickson joined the Group as a non–executive director on 1 July 2010, and was appointed Chairman of the Board on 1 October 2010. Currently Chairman of Communisis plc, and a non–executive director of Coalfield Resources plc.Peter has had senior management experience with a number of large international companies, and previous appointments include Chairman of Anglian Water Group, Senior Independent Director of London & Continental Railways Ltd, Finance Director of Powergen plc and non–executive directorships of Scottish Power plc, Marconi Corporation plc, RAC plc and Kazakhmys plc. He is also a trustee and Board member of Orbis Charitable Trust, the international sight saving charity, and a Fellow of the Institute of Chartered Accountants.
Michael Flowers Group Chief Executive
7 months • Extensive senior management experience in the defence sector
• International experience in both service and manufacturing industries
N/A ✓ ✓ ✓ ✓ ✓
Michael Flowers was appointed to the Board as Group Chief Executive on 24 June 2014, having previously been Group Director — Munitions, with responsibility for running and subsequently disposing of the Group’s European munitions businesses.Michael joined Chemring in 2006, and ran the Group’s Australian operations for seven years. Prior to joining Chemring, Michael worked for BAE Systems in programme management roles, principally in the weapons systems and electronic warfare domains. Prior to his time with BAE Systems, Michael served as an officer in the Australian Army for 22 years and was a graduate of the Australian Command and Staff College and the British Royal Military College of Science.
Steve Bowers Group Finance Director
2 years 1 month
• Financial expertise • Chartered Accountant
N/A ✓ ✓ ✓ ✓ ✓ ✓
Steve Bowers was appointed Group Finance Director on 7 January 2013. He was formerly Finance Director of Umeco plc until its acquisition by Cytec UK Holdings Limited in July 2012. During Steve’s time with Umeco he was involved in both acquisitions and disposals, as well as in the management of financial reporting, treasury functions and banking relationships. Prior to his appointment as Finance Director, he held a number of financial roles at Umeco, alongside the role of Company Secretary. He qualified as a Chartered Accountant with KPMG LLP and is a member of the Institute of Chartered Accountants.
Sarah Ellard Group Legal Director & Company Secretary
3 years 4 months
• Fellow of the Institute of Chartered Secretaries and Administrators
• Appointed Group Company Secretary in 1998
N/A ✓ ✓ ✓ ✓
Sarah Ellard was appointed as Group Legal Director on 7 October 2011, having been Group Company Secretary since 1998. Prior to joining the Group, Sarah trained and worked at Ernst & Young LLP. She is a Fellow of the Institute of Chartered Secretaries and Administrators.
Andy Hamment Non–Executive Director Audit Remuneration
1 year 7 months
• Extensive knowledge of the defence industry
• Executive Board experience ✓ ✓ ✓ ✓ ✓ ✓
Andy Hamment was appointed as a non–executive director on 1 July 2013. He is also the Senior Independent Director of Senior plc, and was previously Group Marketing Director and a main Board director of Ultra Electronics plc. Andy has worked in defence and manufacturing industries for most of his career, primarily in business development and management roles. He joined Dowty in 1988 as Managing Director of its Controls business, and participated in the management buy–out that created Ultra Electronics.
Ian Much Senior Independent Non–Executive Director Audit Nomination Remuneration (Chair)
10 years 2 months
• Board experience at Chief Executive level
• Key shareholder representative ✓ ✓ ✓ ✓ ✓
Ian Much joined the Group as a non–executive director in December 2004. He is Senior Independent Director and Chairman of the Remuneration Committee. Previous appointments include Chief Executive of De La Rue plc and T&N plc, and non–executive director of Admiral plc, Camelot plc, Manchester United plc, Simplyhealth Group Ltd and Senior plc. He is currently a non–executive director and Chairman of the Remuneration Committee of BTG plc.
Vanda Murray OBE Non–Executive Director Audit Nomination Remuneration
3 years 3 months
• Board experience at Chief Executive level
• Fellow of the Chartered Institute of Marketing
✓ ✓ ✓ ✓ ✓
Vanda Murray joined the Group as a non–executive director on 1 November 2011. She currently holds a portfolio of non–executive directorships, including The Manchester Airports Group, Evova plc, Microgen plc and Fenner plc, where she is Senior Independent Director. Previous appointments include Chief Executive of Blick plc, Chair of Business Link NW, Deputy Chair of the North West Regional Development Agency, and non-executive director of Carillion plc and SIG plc. She is a Fellow of the Chartered Institute of Marketing, and in 2002 was appointed OBE for Services to Industry and to Export.
Nigel Young Non–Executive Director Audit (Chair) Remuneration
1 year 9 months
• Previously Interim Chief Financial Officer of the Group from August 2012 to January 2013
• Finance experience from previous CFO positions
• Chartered Accountant
✓ ✓ ✓ ✓ ✓ ✓
Nigel Young became a non–executive director on 1 May 2013, following his appointment as Interim Chief Financial Officer in August 2012. He is a fellow of the Institute of Chartered Accountants. Previous appointments include Finance Director of ALVIS PLC, First Technology PLC, Babcock International PLC and Morgan Advanced Materials plc. Since then, Nigel has undertaken a number of interim and consultancy roles, including roles with the UK Atomic Energy Authority and McBride PLC.Nigel is a trustee and board member of certain development charities, and a non-executive director of P2i Limited, a provider of liquid repellant nano-coating protection.
42 CHEMRING GROUP PLCANNUAL REPORT AND ACCOUNTS 2014
GOVERNANCE
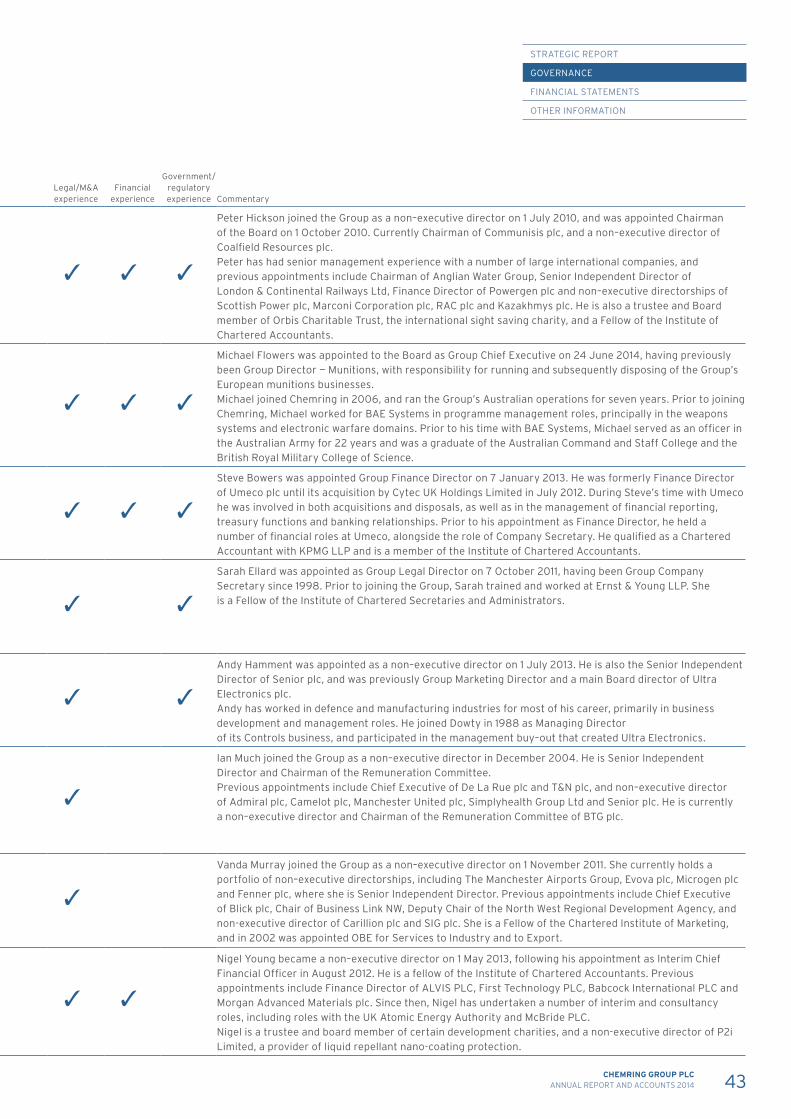
Name/Position/ Committee membership
Length of service on the Board (as at 22 January 2015) Experience Independent
Public board
experienceOperational experience
International experience
Legal/M&A experience
Financial experience
Government/ regulatory experience Commentary
Peter Hickson Non–Executive Chairman Nomination (Chair) Remuneration
4 years 7 months
• Finance experience from CFO positions
• Board experience at Chairman level
• Chartered Accountant N/A ✓ ✓ ✓ ✓ ✓ ✓
Peter Hickson joined the Group as a non–executive director on 1 July 2010, and was appointed Chairman of the Board on 1 October 2010. Currently Chairman of Communisis plc, and a non–executive director of Coalfield Resources plc.Peter has had senior management experience with a number of large international companies, and previous appointments include Chairman of Anglian Water Group, Senior Independent Director of London & Continental Railways Ltd, Finance Director of Powergen plc and non–executive directorships of Scottish Power plc, Marconi Corporation plc, RAC plc and Kazakhmys plc. He is also a trustee and Board member of Orbis Charitable Trust, the international sight saving charity, and a Fellow of the Institute of Chartered Accountants.
Michael Flowers Group Chief Executive
7 months • Extensive senior management experience in the defence sector
• International experience in both service and manufacturing industries
N/A ✓ ✓ ✓ ✓ ✓
Michael Flowers was appointed to the Board as Group Chief Executive on 24 June 2014, having previously been Group Director — Munitions, with responsibility for running and subsequently disposing of the Group’s European munitions businesses.Michael joined Chemring in 2006, and ran the Group’s Australian operations for seven years. Prior to joining Chemring, Michael worked for BAE Systems in programme management roles, principally in the weapons systems and electronic warfare domains. Prior to his time with BAE Systems, Michael served as an officer in the Australian Army for 22 years and was a graduate of the Australian Command and Staff College and the British Royal Military College of Science.
Steve Bowers Group Finance Director
2 years 1 month
• Financial expertise • Chartered Accountant
N/A ✓ ✓ ✓ ✓ ✓ ✓
Steve Bowers was appointed Group Finance Director on 7 January 2013. He was formerly Finance Director of Umeco plc until its acquisition by Cytec UK Holdings Limited in July 2012. During Steve’s time with Umeco he was involved in both acquisitions and disposals, as well as in the management of financial reporting, treasury functions and banking relationships. Prior to his appointment as Finance Director, he held a number of financial roles at Umeco, alongside the role of Company Secretary. He qualified as a Chartered Accountant with KPMG LLP and is a member of the Institute of Chartered Accountants.
Sarah Ellard Group Legal Director & Company Secretary
3 years 4 months
• Fellow of the Institute of Chartered Secretaries and Administrators
• Appointed Group Company Secretary in 1998
N/A ✓ ✓ ✓ ✓
Sarah Ellard was appointed as Group Legal Director on 7 October 2011, having been Group Company Secretary since 1998. Prior to joining the Group, Sarah trained and worked at Ernst & Young LLP. She is a Fellow of the Institute of Chartered Secretaries and Administrators.
Andy Hamment Non–Executive Director Audit Remuneration
1 year 7 months
• Extensive knowledge of the defence industry
• Executive Board experience ✓ ✓ ✓ ✓ ✓ ✓
Andy Hamment was appointed as a non–executive director on 1 July 2013. He is also the Senior Independent Director of Senior plc, and was previously Group Marketing Director and a main Board director of Ultra Electronics plc. Andy has worked in defence and manufacturing industries for most of his career, primarily in business development and management roles. He joined Dowty in 1988 as Managing Director of its Controls business, and participated in the management buy–out that created Ultra Electronics.
Ian Much Senior Independent Non–Executive Director Audit Nomination Remuneration (Chair)
10 years 2 months
• Board experience at Chief Executive level
• Key shareholder representative ✓ ✓ ✓ ✓ ✓
Ian Much joined the Group as a non–executive director in December 2004. He is Senior Independent Director and Chairman of the Remuneration Committee. Previous appointments include Chief Executive of De La Rue plc and T&N plc, and non–executive director of Admiral plc, Camelot plc, Manchester United plc, Simplyhealth Group Ltd and Senior plc. He is currently a non–executive director and Chairman of the Remuneration Committee of BTG plc.
Vanda Murray OBE Non–Executive Director Audit Nomination Remuneration
3 years 3 months
• Board experience at Chief Executive level
• Fellow of the Chartered Institute of Marketing
✓ ✓ ✓ ✓ ✓
Vanda Murray joined the Group as a non–executive director on 1 November 2011. She currently holds a portfolio of non–executive directorships, including The Manchester Airports Group, Evova plc, Microgen plc and Fenner plc, where she is Senior Independent Director. Previous appointments include Chief Executive of Blick plc, Chair of Business Link NW, Deputy Chair of the North West Regional Development Agency, and non-executive director of Carillion plc and SIG plc. She is a Fellow of the Chartered Institute of Marketing, and in 2002 was appointed OBE for Services to Industry and to Export.
Nigel Young Non–Executive Director Audit (Chair) Remuneration
1 year 9 months
• Previously Interim Chief Financial Officer of the Group from August 2012 to January 2013
• Finance experience from previous CFO positions
• Chartered Accountant
✓ ✓ ✓ ✓ ✓ ✓
Nigel Young became a non–executive director on 1 May 2013, following his appointment as Interim Chief Financial Officer in August 2012. He is a fellow of the Institute of Chartered Accountants. Previous appointments include Finance Director of ALVIS PLC, First Technology PLC, Babcock International PLC and Morgan Advanced Materials plc. Since then, Nigel has undertaken a number of interim and consultancy roles, including roles with the UK Atomic Energy Authority and McBride PLC.Nigel is a trustee and board member of certain development charities, and a non-executive director of P2i Limited, a provider of liquid repellant nano-coating protection.
43CHEMRING GROUP PLCANNUAL REPORT AND ACCOUNTS 2014
STRATEGIC REPORT
GOVERNANCE
FINANCIAL STATEMENTS
OTHER INFORMATION
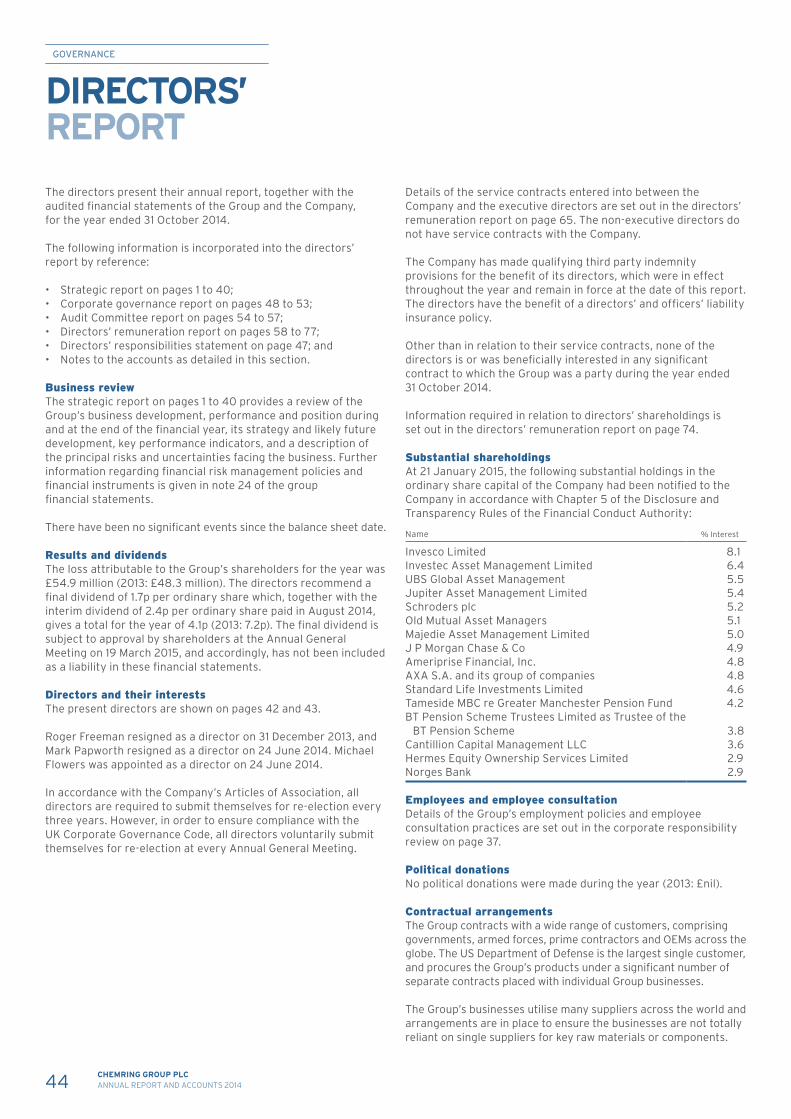
44 CHEMRING GROUP PLCANNUAL REPORT AND ACCOUNTS 2014
GOVERNANCEGOVERNANCE
The directors present their annual report, together with the audited financial statements of the Group and the Company, for the year ended 31 October 2014.
The following information is incorporated into the directors’ report by reference:
• Strategic report on pages 1 to 40;• Corporate governance report on pages 48 to 53;• Audit Committee report on pages 54 to 57;• Directors’ remuneration report on pages 58 to 77;• Directors’ responsibilities statement on page 47; and• Notes to the accounts as detailed in this section.
Business reviewThe strategic report on pages 1 to 40 provides a review of the Group’s business development, performance and position during and at the end of the financial year, its strategy and likely future development, key performance indicators, and a description of the principal risks and uncertainties facing the business. Further information regarding financial risk management policies and financial instruments is given in note 24 of the group financial statements.
There have been no significant events since the balance sheet date.
Results and dividendsThe loss attributable to the Group’s shareholders for the year was £54.9 million (2013: £48.3 million). The directors recommend a final dividend of 1.7p per ordinary share which, together with the interim dividend of 2.4p per ordinary share paid in August 2014, gives a total for the year of 4.1p (2013: 7.2p). The final dividend is subject to approval by shareholders at the Annual General Meeting on 19 March 2015, and accordingly, has not been included as a liability in these financial statements.
Directors and their interestsThe present directors are shown on pages 42 and 43.
Roger Freeman resigned as a director on 31 December 2013, and Mark Papworth resigned as a director on 24 June 2014. Michael Flowers was appointed as a director on 24 June 2014.
In accordance with the Company’s Articles of Association, all directors are required to submit themselves for re-election every three years. However, in order to ensure compliance with the UK Corporate Governance Code, all directors voluntarily submit themselves for re-election at every Annual General Meeting.
DIRECTORS’ REPORT
Details of the service contracts entered into between the Company and the executive directors are set out in the directors’ remuneration report on page 65. The non-executive directors do not have service contracts with the Company.
The Company has made qualifying third party indemnity provisions for the benefit of its directors, which were in effect throughout the year and remain in force at the date of this report. The directors have the benefit of a directors’ and officers’ liability insurance policy.
Other than in relation to their service contracts, none of the directors is or was beneficially interested in any significant contract to which the Group was a party during the year ended 31 October 2014.
Information required in relation to directors’ shareholdings is set out in the directors’ remuneration report on page 74.
Substantial shareholdingsAt 21 January 2015, the following substantial holdings in the ordinary share capital of the Company had been notified to the Company in accordance with Chapter 5 of the Disclosure and Transparency Rules of the Financial Conduct Authority:
Name % Interest
Invesco Limited 8.1Investec Asset Management Limited 6.4UBS Global Asset Management 5.5Jupiter Asset Management Limited 5.4Schroders plc 5.2Old Mutual Asset Managers 5.1Majedie Asset Management Limited 5.0J P Morgan Chase & Co 4.9Ameriprise Financial, Inc. 4.8AXA S.A. and its group of companies 4.8Standard Life Investments Limited 4.6Tameside MBC re Greater Manchester Pension Fund 4.2BT Pension Scheme Trustees Limited as Trustee of the
BT Pension Scheme 3.8Cantillion Capital Management LLC 3.6 Hermes Equity Ownership Services Limited 2.9Norges Bank 2.9
Employees and employee consultationDetails of the Group’s employment policies and employee consultation practices are set out in the corporate responsibility review on page 37.
Political donationsNo political donations were made during the year (2013: £nil).
Contractual arrangementsThe Group contracts with a wide range of customers, comprising governments, armed forces, prime contractors and OEMs across the globe. The US Department of Defense is the largest single customer, and procures the Group’s products under a significant number of separate contracts placed with individual Group businesses.
The Group’s businesses utilise many suppliers across the world and arrangements are in place to ensure the businesses are not totally reliant on single suppliers for key raw materials or components.
45CHEMRING GROUP PLCANNUAL REPORT AND ACCOUNTS 2014
STRATEGIC REPORT
GOVERNANCE
FINANCIAL STATEMENTS
OTHER INFORMATION
STRATEGIC REPORT
GOVERNANCE
FINANCIAL STATEMENTS
OTHER INFORMATION
Change of controlIndividual Group businesses have contractual arrangements with third parties, entered into in the normal course, which may be amended or may terminate on a change of control of the relevant business, or in certain circumstances, following a takeover of the Group.
The most significant agreements entered into by the Group which contain provisions granting the counterparties certain rights in the event of a change of control of the Company are the credit facility agreements entered into with the Group’s banks and the loan note agreements, pursuant to which the Company issued loan notes under a series of private placements. These agreements provide that, in the event of a change of control, the Company must repay all outstanding borrowings, together with accrued interest and other sums owing under each agreement.
Share capital and shareholder rights General The Company’s share capital consists of ordinary shares of 1p each and preference shares of £1 each, which are fully paid–up and quoted on the main market of the London Stock Exchange. Full details of the movements in the issued share capital of the Company during the financial year are provided in note 27 of the group financial statements.
Details of the rights attaching to shares are set out in the Articles of Association (the “Articles”). All holders of ordinary shares are entitled to attend, speak and vote at any general meeting of the Company and to appoint a proxy or proxies to exercise these rights. At a general meeting, every shareholder present in person, by proxy or (in the case of a corporate member) by corporate representative has one vote on a show of hands, and on a poll has one vote for every share held. The Notice of Annual General Meeting specifies deadlines for exercising voting rights and appointing a proxy or proxies to vote in respect of resolutions to be passed at the Annual General Meeting.
There are no restrictions on the transfer of ordinary shares in the capital of the Company, other than certain restrictions which may from time to time be imposed by law. In accordance with the Listing Rules of the Financial Conduct Authority, certain employees are required to seek the approval of the Company to deal in its shares.
The cumulative preference shares carry an entitlement to a dividend at the rate of 7p per share per annum, payable in equal instalments on 30 April and 31 October each year. Holders of the preference shares have the right on a winding–up to receive, in priority to any other classes of shares, the sum of £1 per share together with any arrears of dividends.
The Company is not aware of any agreements between shareholders that may result in restrictions on the transfer of securities and/or voting rights.
The Articles may only be amended by special resolution at a general meeting of shareholders.
Issue of shares Under the provisions of section 551 of the Companies Act 2006 (the “Act”), the Board is prevented from exercising its powers under the Articles to allot shares without an authority contained either in the Articles or in a resolution of the shareholders passed in general meeting. The authority, when given, can last for a maximum period of five years, but the Board proposes that renewal should be sought at each Annual General Meeting. An ordinary resolution, seeking such authority, will be proposed at the forthcoming Annual General Meeting.
Section 561 of the Act requires that an allotment of shares for cash may not be made unless the shares are first offered to existing shareholders on a pre–emptive basis in accordance with the terms of the Act. In accordance with general practice, to ensure that small issues of shares can be made without the necessity of convening a general meeting, the Board proposes that advantage be taken of the provisions of section 571 of the Act not to apply the Act’s pre–emptive requirements. Accordingly, a special resolution will be proposed at the forthcoming Annual General Meeting which, if passed, will have the effect of granting the directors the power to allot not more than 5% of the present issued ordinary share capital free of the requirements of section 561 of the Act. No issue of these shares will be made which would effectively alter the control of the Company without the prior approval of the shareholders in general meeting.
46 CHEMRING GROUP PLCANNUAL REPORT AND ACCOUNTS 2014
GOVERNANCEGOVERNANCE
Purchase of own shares The Company did not purchase any of its ordinary shares (2013: nil) during the year, and no shares (2013: nil) were distributed in respect of vesting of awards under the Chemring Group Performance Share Plan. At 31 October 2014, the Company held 2,198,814 ordinary shares in treasury (representing 1.12% of the ordinary shares in issue on 31 October 2014).
A special resolution will be proposed at the forthcoming Annual General Meeting to renew the Company’s authority to purchase its own shares in the market up to a limit of 10% of its issued ordinary share capital. The maximum and minimum prices are stated in the resolution. The directors believe that it is advantageous for the Company to have this flexibility to make market purchases of its own shares. The directors of the Company may consider holding repurchased shares pursuant to the authority conferred by this resolution as treasury shares. This will give the Company the ability to reissue treasury shares quickly and cost effectively, and will provide the Company with additional flexibility in the management of its capital base. Any issues of treasury shares for the purposes of the Company’s employee share schemes will be made within the 10% anti–dilution limit set by the Investment Association’s share capital management guidelines. The directors will only exercise this authority if they are satisfied that a purchase would result in an increase in expected earnings per share and would be in the interests of shareholders generally.
Employee share schemes and plansApproach to share ownershipThe Group actively encourages its employees to share in the future success of the Group, and therefore operates share-based arrangements to provide incentives and rewards to employees. Detail on awards and vesting, are provided in note 31 to the group financial statements.
The Group operated the following plans during the year:
The Chemring Group 2008 UK Sharesave Plan (the “UK Sharesave Plan”)The UK Sharesave Plan is open to all eligible UK employees. Employees may choose between three and five-year savings periods, at the end of which they can choose to exercise the option or seek the return of their savings. A grant of options was made on 30 July 2014.
The Chemring Group 2008 US Stock Purchase Plan (the “US Stock Purchase Plan”)The US Stock Purchase Plan is open to all eligible US employees. Participants enter into a two-year savings contract at the end of which the participant can choose to exercise the option or seek the return of their savings. A grant of options was made on 30 July 2014.
The Chemring Group Performance Share Plan (the “PSP”)This is the primary long-term incentive plan for executive directors and senior employees. Discretionary awards are granted over a fixed number of shares by reference to salary, and awards ordinarily vest, subject to meeting performance criteria, on the third anniversary of the grant date.
The Chemring Group Restricted Share Plan (the “RSP”)The RSP provides for the discretionary grant of deferred share awards to selected key employees. Executive directors are not eligible to participate. Awards typically vest on the second anniversary of the grant date, subject to meeting continuous service criteria. Awards under the RSP may only be satisfied with market-purchased shares.
Close company provisions As far as the directors are aware, the close company provisions of the Taxes Acts do not apply to the Group nor has there been any change in that respect since 31 October 2014.
Disclosure of information to the auditorEach director at the date of this report confirms that, so far as they are each aware, there is no relevant audit information of which the Company’s auditor is unaware, and each director has taken all the steps that he or she ought to have taken as a director to make himself or herself aware of any relevant audit information and to establish that the Company’s auditor is aware of that information.
This confirmation is given and should be interpreted in accordance with the provisions of section 418 of the Companies Act 2006. Auditor A resolution to reappoint Deloitte LLP as auditor and to authorise the directors to determine the auditor’s remuneration will be proposed at the Annual General Meeting.
Annual General Meeting The resolutions to be proposed at the Annual General Meeting to be held on 19 March 2015, together with explanatory notes, appear in the separate Notice of Annual General Meeting sent to all shareholders.
Going concernDetails of the conclusions arrived at by the directors in preparing the financial statements on a going concern basis are set out in the financial review on page 27.
DIRECTORS’ REPORT CONTINUED
47CHEMRING GROUP PLCANNUAL REPORT AND ACCOUNTS 2014
STRATEGIC REPORT
GOVERNANCE
FINANCIAL STATEMENTS
OTHER INFORMATION
STRATEGIC REPORT
GOVERNANCE
FINANCIAL STATEMENTS
OTHER INFORMATION
Statement of directors’ responsibilitiesThe directors are responsible for preparing the annual report and the financial statements in accordance with applicable law and regulations.
Company law requires the directors to prepare financial statements for each financial year. Under that law, the directors are required to prepare the group financial statements in accordance with International Financial Reporting Standards (“IFRSs”) as adopted by the European Union (“EU”) and Article 4 of the IAS Regulation and have also chosen to prepare the parent company financial statements under IFRSs as adopted by the EU. Under company law the directors must not approve the accounts unless they are satisfied that they give a true and fair view of the state of affairs of the Company and of the profit or loss of the Company for that period. In preparing these financial statements, IAS 1 Presentation of Financial Statements requires that directors:
• properly select and apply accounting policies; • present information, including accounting policies, in a
manner that provides relevant, reliable, comparable and understandable information;
• provide additional disclosures when compliance with the specific requirements of IFRS are insufficient to enable users to understand the impact of particular transactions, other events and conditions on the entity’s financial position and financial performance; and
• make an assessment of the Company’s ability to continue as a going concern.
The directors are responsible for keeping adequate accounting records that are sufficient to show and explain the Company’s transactions disclose with reasonable accuracy at any time the financial position of the Group and the Company and enable them to ensure that the financial statements comply with the Companies Act 2006. They are also responsible for safeguarding the assets of the Company, and hence for taking reasonable steps for the prevention and detection of fraud and other irregularities.
The directors are responsible for the maintenance and integrity of the corporate and financial information included on the Company’s website. Legislation in the United Kingdom governing the preparation and dissemination of financial statements may differ from legislation in other jurisdictions.
Directors’ responsibility statement Each of the directors, whose names and functions are listed on pages 42 to 43, confirms that to the best of their knowledge:
• the financial statements, prepared in accordance with IFRS as adopted by the European Union, give a true and fair view of the assets, liabilities, financial position and profit or loss of the Company and the undertakings included in the consolidation taken as a whole;
• the strategic report includes a fair review of the development and performance of the business and the position of the Company and the undertakings included in the consolidation taken as a whole, together with a description of the principal risks and uncertainties that they face; and
• the annual report and financial statements, taken as a whole, are fair, balanced and understandable, and provide the information necessary for shareholders to assess the Company’s performance, business model and strategy.
This responsibility statement was approved by the Board of directors on 22 January 2015 and is signed on its behalf by:
Michael FlowersGroup Chief Executive
Steve BowersGroup Finance Director
48 CHEMRING GROUP PLCANNUAL REPORT AND ACCOUNTS 2014
GOVERNANCEGOVERNANCE
Introduction by the ChairmanThe Board is committed to upholding high standards on corporate governance, protecting and growing shareholder value, and engaging in a fair and transparent manner with all of the Group’s stakeholders. The Board takes responsibility for approving the Group’s long-term goals and strategies, and provides overall financial and organisational control. The Board also ensures that the Group’s businesses have appropriate and effective internal control and risk management systems.
The composition of the Board changed during the year, with the appointment of Michael Flowers as Group Chief Executive on 24 June 2014, replacing Mark Papworth. In making this appointment, the Board had to consider the longer-term strategy for the Group, and recognised Michael‘s extensive knowledge and understanding of the defence markets in which the Group operates, and also his deep knowledge of the Group’s businesses, both from an end-user and industrial perspective.
Since the end of the year, Vanda Murray has informed the Board of her intention not to seek re-election at the forthcoming Annual General Meeting on 19 March 2015, and she will stand down from the Board at that date. Ian Much has also indicated his intention to retire from the Board at the 2016 Annual General Meeting. A recruitment process is currently underway.
Last year we indicated that we would appoint an external adviser to facilitate our board performance evaluation during 2014. This exercise was delayed following the appointment of a new Group Chief Executive but we have now engaged Lintstock Limited to guide us through the process, which is currently underway.
In other areas, the Board and the Audit Committee have considered and implemented changes to our internal audit activities during the last few months, and we continue to review our risk management processes against the principles set out in the September 2014 issue of the UK Corporate Governance Code, which will apply to the Group in the current financial year.
In the year under review, the Company was required to apply the main and supporting principles of good governance set out in the UK Corporate Governance Code issued in September 2012 by the Financial Reporting Council (the “Code”). The detailed report on the following pages 49 to 53 sets out how the Company applied these principles in practice.
The Company was in compliance with the provisions of the Code throughout the year ended 31 October 2014, with the exception, as referred to above, that the performance evaluation of the Board has not been externally facilitated in the last three years.
Peter HicksonChairman
CORPORATE GOVERNANCE REPORT
49CHEMRING GROUP PLCANNUAL REPORT AND ACCOUNTS 2014
STRATEGIC REPORT
GOVERNANCE
FINANCIAL STATEMENTS
OTHER INFORMATION
STRATEGIC REPORT
GOVERNANCE
FINANCIAL STATEMENTS
OTHER INFORMATION
The Board Composition and operation of the Board The Board currently comprises three executive directors and five non-executive directors (including the Chairman). The Board considers all of the non-executive directors to be independent in judgement and character, and considered Peter Hickson to be independent on his appointment as Chairman.
Nigel Young was employed as the Group’s Interim Chief Financial Officer for a period of six months prior to his appointment as a non-executive director but the Board does not consider that this short period of employment impacted his independence, and his contribution to the Board continues to be impartial and objective. The Board is of the view that notwithstanding that Ian has served more than three three-year terms, he continues to fulfil both of his roles as Senior Independent Director and Chairman of the Remuneration Committee in an unbiased and objective manner, and his experience remains very valuable to the Board.
The directors’ biographical details are set out on pages 42 and 43.
In accordance with the Company’s Articles of Association, all directors are required to submit themselves for re-election every three years. However, in order to ensure compliance with the Code, all directors, with the exception of Vanda Murray, will voluntarily submit themselves for re-election at the forthcoming Annual General Meeting. Vanda has confirmed that she intends to stand down as a non-executive director at the Annual General Meeting. Michael Flowers was appointed to the Board during the year, and will therefore seek election by shareholders for the first time.
The Board meets at least eight times a year, and has a formal schedule of matters specifically reserved to it for consideration and approval, including:
• approval of the Group’s three year plan; • approval of annual budgets; • approval of acquisitions, disposals and major capital
expenditure; • approval of policies on financing and treasury, ethical matters,
and health and safety; and • oversight of the Group’s systems of financial control and risk
management.
All directors take decisions objectively in the interests of the Company.
An internal induction programme on the Group’s operations and its strategic and business plans is provided for newly-appointed directors. The Company Secretary also provides detailed information on directors’ legal duties and responsibilities on appointment, and updates the Board on a regular basis with regards to regulatory changes affecting the directors and the Group’s operations generally. Directors are continually updated on the Group’s businesses and the matters affecting the markets in which they operate. The Company meets the cost of appropriate external training for directors, the requirement for which is kept under review by the Chairman.
Each director has full access to the advice and services of the Company Secretary who, under the direction of the Chairman, is responsible for maintaining good information flows within the Board and its committees; assisting with induction; keeping the directors informed about changes to their duties and responsibilities; and advising the Board on governance matters. The appointment and removal of the Company Secretary is a matter for the Board as a whole.
All directors are entitled to take independent professional advice in furtherance of their duties at the Company’s expense, should the need arise.
The Company maintains directors’ and officers’ liability insurance in respect of legal action against its directors.
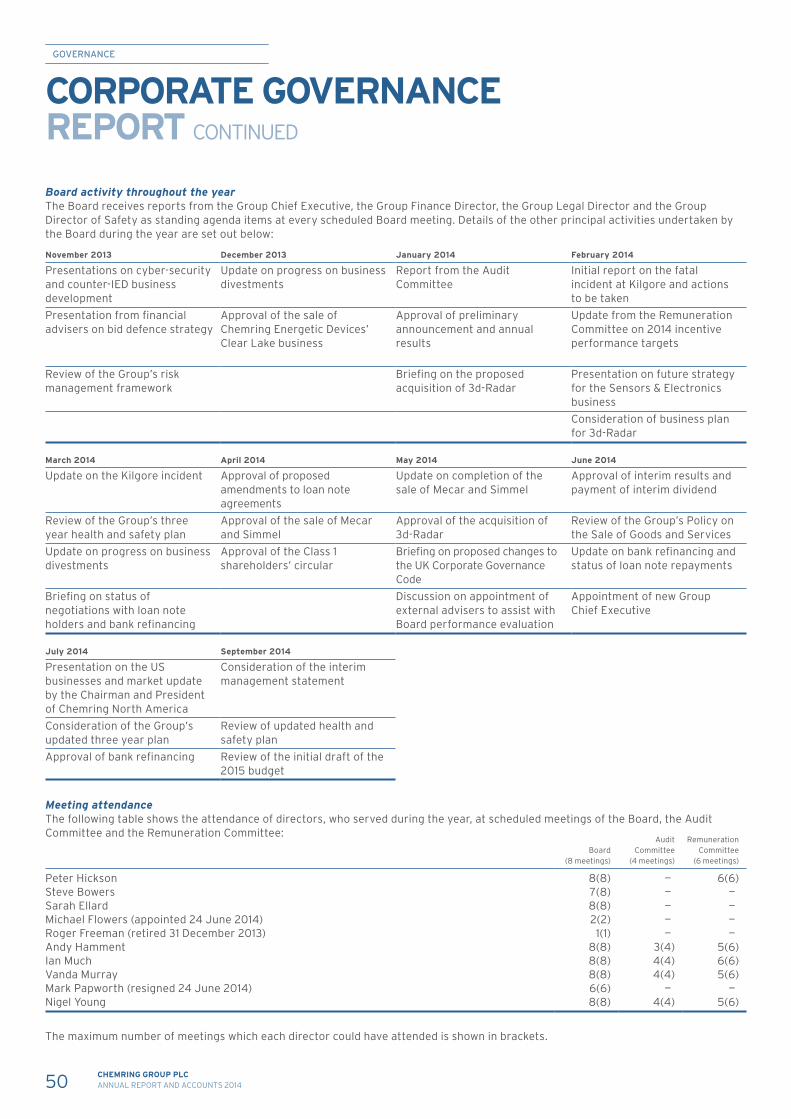
50 CHEMRING GROUP PLCANNUAL REPORT AND ACCOUNTS 2014
GOVERNANCEGOVERNANCE
Board activity throughout the year The Board receives reports from the Group Chief Executive, the Group Finance Director, the Group Legal Director and the Group Director of Safety as standing agenda items at every scheduled Board meeting. Details of the other principal activities undertaken by the Board during the year are set out below:
November 2013 December 2013 January 2014 February 2014
Presentations on cyber-security and counter-IED business development
Update on progress on business divestments
Report from the Audit Committee
Initial report on the fatal incident at Kilgore and actions to be taken
Presentation from financial advisers on bid defence strategy
Approval of the sale of Chemring Energetic Devices’ Clear Lake business
Approval of preliminary announcement and annual results
Update from the Remuneration Committee on 2014 incentive performance targets
Review of the Group’s risk management framework
Briefing on the proposed acquisition of 3d-Radar
Presentation on future strategy for the Sensors & Electronics businessConsideration of business plan for 3d-Radar
March 2014 April 2014 May 2014 June 2014
Update on the Kilgore incident Approval of proposed amendments to loan note agreements
Update on completion of the sale of Mecar and Simmel
Approval of interim results and payment of interim dividend
Review of the Group’s three year health and safety plan
Approval of the sale of Mecar and Simmel
Approval of the acquisition of 3d-Radar
Review of the Group’s Policy on the Sale of Goods and Services
Update on progress on business divestments
Approval of the Class 1 shareholders’ circular
Briefing on proposed changes to the UK Corporate Governance Code
Update on bank refinancing and status of loan note repayments
Briefing on status of negotiations with loan note holders and bank refinancing
Discussion on appointment of external advisers to assist with Board performance evaluation
Appointment of new Group Chief Executive
July 2014 September 2014
Presentation on the US businesses and market update by the Chairman and President of Chemring North America
Consideration of the interim management statement
Consideration of the Group’s updated three year plan
Review of updated health and safety plan
Approval of bank refinancing Review of the initial draft of the 2015 budget
Meeting attendance The following table shows the attendance of directors, who served during the year, at scheduled meetings of the Board, the Audit Committee and the Remuneration Committee:
Board (8 meetings)
Audit Committee
(4 meetings)
Remuneration Committee
(6 meetings)
Peter Hickson 8(8) — 6(6)Steve Bowers 7(8) — —Sarah Ellard 8(8) — —Michael Flowers (appointed 24 June 2014) 2(2) — —Roger Freeman (retired 31 December 2013) 1(1) — —Andy Hamment 8(8) 3(4) 5(6)Ian Much 8(8) 4(4) 6(6)Vanda Murray 8(8) 4(4) 5(6)Mark Papworth (resigned 24 June 2014) 6(6) — —Nigel Young 8(8) 4(4) 5(6)
The maximum number of meetings which each director could have attended is shown in brackets.
CORPORATE GOVERNANCE REPORT CONTINUED

51CHEMRING GROUP PLCANNUAL REPORT AND ACCOUNTS 2014
STRATEGIC REPORT
GOVERNANCE
FINANCIAL STATEMENTS
OTHER INFORMATION
STRATEGIC REPORT
GOVERNANCE
FINANCIAL STATEMENTS
OTHER INFORMATION
In addition to the scheduled meetings, a further seven ad hoc Board meetings and three ad hoc Remuneration Committee meetings were convened during the year to deal with matters arising between scheduled meetings.
The Nomination Committee did not meet separately during the year, as the new Board appointment made during the year and related matters were dealt with by the Board as a whole.
The Chairman The Company separates the roles of Chairman and Group Chief Executive in accordance with the recommendations of the Code. The division of responsibilities between the Chairman and the Group Chief Executive, and their respective job descriptions, are set out in writing and agreed by the Board. The Chairman is responsible for the leadership and governance of the Board as a whole, and the Group Chief Executive is responsible for the management of the Group and the successful planning and implementation of Board strategy. The Chairman and the Group Chief Executive meet on a regular basis to discuss current issues affecting the Group, and to prepare for Board meetings.
In addition to chairing the Board, the Chairman is responsible for ensuring that the Board is kept properly informed and is consulted on all decisions reserved to it; promoting constructive relations between the executive and non-executive directors; ensuring that the training and development needs of directors are identified; that the performance of the Board is evaluated on a regular basis; ensuring effective communication with shareholders and acting as a conduit to ensure that the views of shareholders are communicated to the Board. The Chairman’s other business commitments, which are detailed on page 43, have been fully disclosed to the Board, and the Board is comfortable that he has sufficient time available to commit to his role.
Non-executive directors The non-executive directors perform an essential role in safeguarding shareholders’ interests. They actively participate in the development of strategic objectives, and monitor the performance of executive management in achieving these objectives, in a constructively-challenging manner where appropriate. The non-executive directors also review financial performance, and consider the integrity of the financial information produced by the Group and whether the financial controls and risk management systems are robust and defensible. They meet periodically with the management of the Group’s operating companies, and visit the sites.
In addition to participating in Board meetings, the four independent non-executive directors are the members of the standing committees set up to deal with audit and the remuneration of executive directors and senior management. The Board considers that the current balance of executive and non-executive influence which exists is appropriate for the Company, taking into account its size and status.
The non-executive directors have letters of appointment covering, amongst other items, their terms of appointment and expected time commitment. These letters of appointment usually provide for a three year appointment, unless terminated earlier by and at the discretion of either party upon three months’ written notice. Further details are set out in the directors’ remuneration report on page 66, and copies of the letters of appointment are available for inspection on request to the Company Secretary.
During the year, the Chairman met regularly with the non-executive directors without the executives being present.
Ian Much served as the Senior Independent Director throughout the year. Shareholders may bring issues to his attention if they have concerns which have not been resolved through the normal channels of the Chairman, the Group Chief Executive or the Group Finance Director.
The papers accompanying the Notice of Annual General Meeting include a statement from the Chairman confirming that the performance of each non-executive director seeking re-election at the meeting continues to be effective and that each director continues to demonstrate commitment to their role.
Board performance evaluationThe performance of the Board and its effectiveness are subject to periodic review by the Chairman. The Chairman and the non-executive directors review the individual performance of the executive directors as part of the annual remuneration review, and the Chairman and the Group Chief Executive consider the performance of the non-executive directors. Any weaknesses identified as a result of the individual performance evaluations are considered during the overall evaluation of the Board and addressed appropriately.
With the appointment of a new Group Chief Executive during the year, the Board decided to defer the appointment of an external adviser to facilitate its performance evaluation. However, Lintstock Limited has now been engaged, and an externally-facilitated performance review is in progress, which will be reported on in the 2015 annual report.
DiversityThe Board supports the principles set out in Lord Davies’ Review into Women on Boards published in February 2011, and the current Board includes two female members. The Board also recognises the importance of promoting diversity across the Group, and remains committed to a minimum of at least 25% female representation on the Board, amongst senior management and across the Group in general.
Board committeesThe terms of reference of the Audit Committee, the Nomination Committee and the Remuneration Committee are published on the Company’s website (www.chemring.co.uk/investors/corporategovernance) and copies are available on request from the Company Secretary.
Audit CommitteeThe Audit Committee comprises four independent non-executive directors. At the date of this report, the Audit Committee members were Nigel Young (Chairman), Andy Hamment, Ian Much and Vanda Murray.
Nigel Young acted as Interim Chief Financial Officer for the Group between August 2012 and January 2013, and was formerly the finance director of several public companies. The remaining members of the Committee have all served as executive directors of public companies and as non-executive directors on other audit committees, and have extensive commercial and financial experience. The Board therefore considers that each member of the Audit Committee has the requisite recent and relevant
52 CHEMRING GROUP PLCANNUAL REPORT AND ACCOUNTS 2014
GOVERNANCEGOVERNANCE
financial experience to satisfy the requirements of the Code.The Audit Committee met four times during the year.
The Audit Committee report is set out on pages 54 to 57.
Remuneration CommitteeThe Remuneration Committee comprises five independent non-executive directors. At the date of this report, the Remuneration Committee members were Ian Much (Chairman), Andy Hamment, Peter Hickson, Vanda Murray and Nigel Young.
Six scheduled Remuneration Committee meetings were held during the year, and three ad hoc meetings. Further details on the Remuneration Committee and its activities, and the Company’s policies on directors’ remuneration are set out in the directors’ remuneration report on pages 58 to 77.
Nomination CommitteeThe Nomination Committee comprises three independent non-executive directors. At the date of this report, the Nomination Committee members were Peter Hickson (Chairman), Ian Much and Vanda Murray. Peter Hickson is Chairman of the Nomination Committee but, in accordance with the Committee’s terms of reference, is not permitted to chair meetings when the Committee is dealing with the appointment of his successor.
The appointment of Michael Flowers as Group Chief Executive in June 2014 was considered by the whole Board, having reviewed the needs of the business and the skills required for the development of its future strategy.
Executive Committee The Executive Committee is responsible for the executive day-to-day running of the Group, submission to the Board of strategic plans and budgets for the Group’s operations, and monitoring the trading performance of the Group as a whole. The Board delegates certain responsibilities to the Executive Committee, including:
• implementation of the Group’s strategies and policies as determined by the Board;
• monitoring of operational and financial results against budget; • allocation of resources across the Group within the overall plan
approved by the Board; • approval of capital expenditure within limits imposed by the
Board; and • developing and implementing risk management systems.
The current members of the Executive Committee are:
• Michael Flowers (Group Chief Executive) • Rik Armitage (Group Director - Strategy & Technology) • Steve Bowers (Group Finance Director) • Terry Bridgewater (Group Director of Safety) • Stuart Cameron (Managing Director - Chemring Energetics)• Simon Darling (Managing Director - Chemring
Countermeasures UK)• Sarah Ellard (Group Legal Director & Company Secretary) • Stephen Grinham (Managing Director - Chemring Technology
Solutions) • Juan Navarro (President - Chemring North America) • Rupert Pittman (Group Director of Communications &
Investor Relations)
Michael Flowers chairs the Executive Committee, which meets monthly.
Relations with shareholders and other providers of capital The Company maintains an active dialogue with institutional shareholders through regular briefing meetings and formal presentations following the release of interim and annual results. Meetings are usually attended by the Group Chief Executive and the Group Finance Director, although the Chairman and the Senior Independent Director also meet with shareholders to discuss specific matters. The other non-executive directors are also offered the opportunity to meet with major shareholders, and attend meetings if so requested by shareholders.
Communication with private investors is achieved largely through the medium of the interim results statement, interim management statements, and the annual report.
The Company’s website (www.chemring.co.uk) provides financial and business information on the Group.
The directors are provided with reports and other written briefings from the Company’s brokers, and are regularly informed by the Company Secretary about changes to significant shareholdings.
It is the Company’s policy that all directors should attend and make themselves available to take questions from shareholders or address any concerns at the Annual General Meeting. At other times of the year, the directors can be contacted via the Company’s head office.
All substantial issues, including the adoption of the annual report and financial statements, are proposed on separate resolutions at the Annual General Meeting. In line with best practice guidelines, voting at the Annual General Meeting is conducted by way of a poll. This allows all votes to be counted, not just those of shareholders who attend the meeting. Poll results are published on the Company’s website as soon as practicable following the conclusion of the meeting. The Notice of the Annual General Meeting is sent to shareholders at least twenty working days before the meeting.
In addition to issuing shares, the Company also finances its activities through external bank loans and by the issue of loan notes. The Board recognises the importance of maintaining good relationships with the providers of this capital, and the Group Chief Executive and the Group Finance Director brief banks and note holders on a regular basis on the Company and its performance. The Board receives regular reports on any issues impacting these relationships.
Financial and business reporting The statement of directors’ responsibilities in respect of the financial statements and accounting records maintained by the Company is set out on page 47.
Having taken all the matters considered by the Board and brought to the attention of the Board during the year into account, the Board is satisfied that the annual report and accounts for the year ended 31 October 2014, taken as a whole, is fair, balanced and understandable. Furthermore, the Board believes that the disclosures set out on pages 1 to 40 provide the information necessary to assess the Company’s performance, business model and strategy.
CORPORATE GOVERNANCE REPORT CONTINUED
53CHEMRING GROUP PLCANNUAL REPORT AND ACCOUNTS 2014
STRATEGIC REPORT
GOVERNANCE
FINANCIAL STATEMENTS
OTHER INFORMATION
STRATEGIC REPORT
GOVERNANCE
FINANCIAL STATEMENTS
OTHER INFORMATION
Risk management and internal controlThe Board reviews the effectiveness of the Group’s systems of internal control, including financial, operational and compliance controls, and risk management systems.
The Board acknowledges its responsibility for the Group’s systems of internal control and attaches considerable importance to these systems, which are designed to meet the Group’s particular needs and identify those risks to which it is exposed. However, the systems can only provide reasonable, not absolute, assurance against material misstatement, loss or mismanagement of the Group’s assets.
In carrying out its annual review of the effectiveness of the Group’s systems of internal control in compliance with provision C2.1 of the Code, the Board considered the following key features of the Group’s risk management systems and control procedures which operated during the year:
• the Board assesses the key risks associated with achievement of the Group’s business objectives as part of the annual strategic planning process. Following completion of this process, each business establishes a three year plan and annual budget, which are subject to approval by the Board. The performance of each business against budget and the prior year is reviewed on a monthly basis at both the operational management level and by the Board. Achievement of strategic business objectives and the associated risks are monitored by the Board on an ongoing basis;
• the Group Chief Executive, the Group Finance Director and other members of the Executive Committee attend review meetings with each of the businesses on a quarterly basis. In the case of the US businesses, formal Board meetings are also held quarterly, and these are attended by main Board directors and external non-executive directors appointed in the US. The US non-executive directors are available to provide guidance and monitor governance in the US businesses throughout the year. External non-executive directors are also appointed to the Boards of the Group’s Norwegian and Australian subsidiaries;
• each business is required to comply with the Group’s accounting policy manual, which sets out formal procedures for incurring certain types of expenditure and making contractual commitments. Compliance with the accounting policy manual is audited by the internal auditors, who report regularly to the Audit Committee on their findings;
• the Board retains primary responsibility for acquisitions and disposals, and financing arrangements for the Group. Treasury management, IT strategy, insurance and significant legal matters are dealt with centrally from the Group head office, and the Board receives regular reports on each of these items. Reviews of the Group’s pensions, insurance and risk management arrangements are carried out by external advisers on a regular basis;
• the Group Director of Safety, supported by business-specific health and safety management committees, co-ordinates and controls the activities of each business in relation to health and safety and environmental matters, which are a key focus for the Board in view of the nature of the Group’s operations. The Group Chief Executive is the Board member nominated with specific responsibility for health and safety. The Group Chief Executive meets formally with health and safety professionals from each business on an annual basis; and
• the Group maintains a Bribery Act compliance manual incorporating its anti-bribery policies and procedures.
The Group’s Risk Management Committee meets on a quarterly basis. All members of the Executive Committee are also members of the Risk Management Committee. The Committee reports biannually to the Audit Committee and the Board on the top risks from a Group perspective and monitors the actions being taken to mitigate these risks.
The Board confirms that it has reviewed the effectiveness of the Group’s systems of internal control and risk management which were in place during the year ended 31 October 2014, and it confirms that systems of internal control and risk management compliant with the Code and the Turnbull Guidance were in place throughout the year and have remained in place up to the date of approval of these financial statements. Notwithstanding this, the Board will continue to take steps to embed internal control and risk management further into the operations of the Group and to deal with any areas of improvement which come to the attention of management and the Board.
Procedures to deal with directors’ conflicts of interest All directors have a duty under the Companies Act 2006 (the “2006 Act”) to avoid a situation in which he or she has or can have a direct or indirect interest that conflicts or may possibly conflict with the interests of the Company. The Company’s Articles of Association include provisions for dealing with directors’ conflicts of interest in accordance with the 2006 Act. The Company has procedures in place to deal with situations where directors may have any such conflicts, which require the Board to:
• consider each conflict situation separately on its particular facts;• consider the conflict situation in conjunction with the rest of
their duties under the 2006 Act;• keep records and Board minutes as to authorisations granted
by directors and the scope of any approvals given; and• regularly review conflict authorisation.
Going concernDetails of the conclusions arrived at by the directors in preparing the financial statements on a going concern basis are set out in the financial review on page 27.
54 CHEMRING GROUP PLCANNUAL REPORT AND ACCOUNTS 2014
GOVERNANCEGOVERNANCE
Annual statement by the Chairman of the Audit CommitteeThe Audit Committee continues to play a very important role in the governance of the Group’s financial affairs, and during the year under review, the Committee instigated several initiatives which should continue to deliver improvements in the Group’s financial management and reporting.
Following the deterioration in the Group’s trading performance at the end of the 2013 financial year, which resulted in the Group failing to meet full year expectations, the Committee undertook a detailed review of the business units’ financial controls, accounting resources and financial reporting systems. This exercise was intended to identify ways in which the businesses could improve their financial forecasting accuracy during periods when external market conditions remain volatile and unpredictable. As a result of the review, the financial management has been strengthened at several businesses, and improvements are being made to a number of accounting systems across the Group.
The Committee also undertook a detailed review of the Group’s internal audit activities during the year, and concluded that it would be beneficial to broaden the scope of the internal audit function to incorporate a more comprehensive review of non-financial controls. As a consequence, KPMG LLP has now been appointed to provide internal audit services for the Group’s businesses outside of the US and the Group is exploring options to obtain similar internal audit services for the US businesses.
Further details of the Committee’s activities during the year are set out on pages 55 to 57.
Nigel YoungChairman
AUDIT COMMITTEE REPORT
55CHEMRING GROUP PLCANNUAL REPORT AND ACCOUNTS 2014
STRATEGIC REPORT
GOVERNANCE
FINANCIAL STATEMENTS
OTHER INFORMATION
Operation of the Audit Committee The Audit Committee monitors the integrity of the Group’s financial statements and the effectiveness of the external audit process. It is responsible for:
• making recommendations on the appointment and remuneration of the external auditor;• ensuring that an appropriate relationship between the Group and the external auditor is maintained, and overseeing the provision
of non-audit services;• reviewing the effectiveness of the Group’s internal controls and financial risk management systems;• considering the effectiveness of the Group’s internal audit function;• reviewing arrangements by which the Group’s employees may confidentially raise concerns about possible improprieties; and• providing guidance to the Board in its consideration of whether the annual report and accounts are fair, balanced and
understandable.
The Committee is authorised to seek any information it requires from any employee of the Company in order to perform its duties, and to obtain any outside legal or other professional advice it requires at the Company’s expense.
The Committee reviews its terms of reference and its effectiveness annually, and recommends to the Board any changes required as the result of the review.
Meetings Meetings of the Committee are attended, at the invitation of the Chairman, by the external auditor, the Chairman of the Board, the Group Chief Executive, the Group Finance Director and representatives from the Group finance and internal audit functions. The Committee meets with the auditor on a regular basis without the executive directors being present. The Company Secretary acts as secretary to the Committee and minutes of meetings are circulated to all Board members.
The Audit Committee plans to meet four times in the current financial year.
Principal activities of the Audit Committee during the year
January 2014 April 2014 June 2014 September 2014
Review of the Group’s preliminary announcement and annual results for the year ended 31 October 2013
Update on renegotiation of the Group’s financing arrangements
Review of the Group’s half year results
Review of audit services for the 2014 financial year and consideration of the reappointment of the external auditor
Consideration of the auditor’s report on the results of their full year audit
Review of progress on preparation of working capital report
Consideration of the auditor’s report on the results of their interim review
Consideration of the auditor’s plan for the year end audit and their proposed fees
Review of the Group’s going concern status
Review of the Group’s risk management framework and processes
Review of the Group’s going concern status
Review of benchmarking report on the Group’s 2013 annual report and accounts
Consideration of the auditor’s report on the Group’s financial controls, accounting resources and financial reporting systems
Consideration of the auditor’s plan for the interim review
Review of the internal control environment and the auditor’s observations thereon
Annual review of policy on the provision of non-audit services by the external auditor
Consideration of the internal auditor’s report and review of revised internal audit arrangements in the US
Annual review of the Committee’s terms of reference
Review of the Group’s risk register
Review of the Group’s risk management framework
Approval of appointment of Deloitte LLP as reporting accountants
Annual review of the Group’s whistleblowing policy and procedures
Consideration of the internal auditor’s report
Consideration of the internal auditor’s report
Consideration of the Group Legal Director’s ethics and compliance report
Consideration of the internal auditor’s report
56 CHEMRING GROUP PLCANNUAL REPORT AND ACCOUNTS 2014
GOVERNANCEGOVERNANCE
Significant issues considered by the Audit Committee during the year
Revenue recognition and contract accounting policies and procedures
The Committee reviews the Group’s revenue recognition and contracting accounting policies and procedures on an ongoing basis, to ensure that they remain appropriate and that the Group’s internal controls are operating effectively in this area. The internal auditors undertake a review of revenue recognition practices at each half and full year end, and report on their findings to both the Committee and the external auditor.
The Committee considered the key assumptions underlying the accounting treatment of all contracts which were subject to contract accounting during the year, and approved the treatment where appropriate. The level of revenue recognised from those contracts which were material to the Group’s half and full year results was also reviewed in detail by the Committee.
Impairment of goodwill and other intangible assets
In January 2014, the Committee considered executive management’s review of the carrying value of goodwill and intangible assets held on the Group’s balance sheet as at 31 October 2013, against the updated forecasts and three year plans for each of the applicable businesses. As a consequence of this review, the Committee concurred that it would be appropriate to recognise an impairment loss of £50.9 million in respect of all the goodwill arising on the acquisition of Hi-Shear Technology Corporation (now part of Chemring Energetic Devices), and the value of the tangible fixed assets of Chemring Energetic Devices’ Clear Lake business was impaired by £8.8 million to a level which was equivalent to the expected proceeds from the sale of the business. A further impairment review was undertaken in June 2014, and whilst no additional impairments were deemed necessary (other than in respect of the business assets held for sale), it was noted that the headroom on the value of Chemring Defence UK had reduced and would need to be reviewed again at the year end.
Accounting for divested businesses
The Committee reviewed the accounting treatment and presentation of the results of divested businesses in the 2013 full year results and the 2014 interim results, including establishing provisions for remaining liabilities under the sale agreements.
The Committee also provided guidance to the Remuneration Committee on appropriate adjustments to the performance targets for the Group’s incentive arrangements to reflect the impact of the disposals.
Capitalised research and development costs
Following ongoing investment in Sensors & Electronics products, the level of capitalised research and development costs increased during the year. The Committee undertook a review of these capitalised costs in June 2014, and agreed to begin amortising certain costs. Enhanced procedures have now been adopted in relation to the approval of capitalisation of costs and the periodic review of all such costs held on the balance sheet.
Going concern In order to satisfy itself that the Group has sufficient financial resources to enable it to continue trading for the foreseeable future, the Committee regularly reviews the adequacy of the Group’s financing facilities against future funding requirements and working capital projections. The Committee received regular reports from the Group Finance Director on the Group’s financial covenant compliance position throughout the year, and was kept closely informed on the progress of discussions with the Group’s banks and loan note holders regarding the refinancing of the Group’s facilities and partial repayment of the loan notes which was completed during the year.
Based on its review of the Group’s forecasts and detailed discussions with the external auditor, the Committee recommended to the Board the adoption of the going concern basis for the preparation of both the 2013 financial statements and the 2014 interim results.
Further details on the Group’s going concern status can be found in the financial review on page 27.
External auditor The Audit Committee is responsible for making recommendations to the Board on the appointment, reappointment and removal of the Company’s external auditor. The Committee also undertakes an annual assessment of the auditor’s independence and objectivity, taking into account relevant professional and regulatory requirements and the relationship with the auditor as a whole, including the provision of any non-audit services.
Audit effectiveness and tenderingDeloitte LLP has been the Company’s auditor for many years, and was reappointed at the last Annual General Meeting in March 2014. In the opinion of the Committee, the relationship with the auditor currently works well, and having reviewed their independence and effectiveness, the Committee has not considered it necessary to date to require Deloitte LLP to re-tender for the audit work. Accordingly, the Committee has recommended to the Board that Deloitte LLP be proposed for reappointment as auditor at the forthcoming Annual General Meeting. The Group is not a constituent of the FTSE 350 and so is not currently subject to any mandatory rotation requirement. However, the Group will continue to monitor the legislation in this area.
AUDIT COMMITTEE REPORT CONTINUED
57CHEMRING GROUP PLCANNUAL REPORT AND ACCOUNTS 2014
STRATEGIC REPORT
GOVERNANCE
FINANCIAL STATEMENTS
OTHER INFORMATION
STRATEGIC REPORT
GOVERNANCE
FINANCIAL STATEMENTS
OTHER INFORMATION
The Committee acknowledges the recommendation in the Code that the external audit contract should be put out to tender at least every ten years. The appointment of a new Audit Partner for the Group in 2013 has provided fresh oversight of the audit process. Given this change, the Committee will keep under review the timing of its next tender process but does not currently intend that the audit will be put out to tender during 2015.
In assessing the effectiveness of the external auditor during the year, the Committee reviewed:
• the arrangements for ensuring the external auditor’s independence and objectivity;
• the external auditor’s fulfilment of the agreed audit plan and any variations from the plan;
• the robustness and perceptiveness of the auditor in their handling of the key accounting and audit judgements; and
• the content of the external auditor’s reports and internal control recommendations.
There are no contractual or similar obligations to restrict the choice of external auditor.
Auditor independenceThe Committee keeps under review the level of any non-audit services which are provided by the external auditor, to ensure that this does not impair their independence and objectivity.
The Committee has adopted a policy which states that the external auditor should not be appointed to provide any corporate finance or similar consultancy services, unless the Committee agrees that their appointment would be in the best interests of the Company’s shareholders in particular circumstances and would not create any direct conflict with their role as external auditor.
The policy does permit the provision of tax advisory services by the auditor, provided that the provision of such advice does not conflict with the external auditor’s statutory responsibilities and ethical guidance.
During the year, Deloitte LLP provided the following non-audit services to the Group:
• tax compliance services relating to corporation tax returns and other overseas regulatory tax returns;
• tax advisory services relating to advice given on the Group’s tax structures;
• corporate finance services relating to various proposed financial transactions, where the auditor is considered best placed to perform these services; and
• advice to the Remuneration Committee on appropriate adjustments to the 2014 share awards and bonus performance targets.
In particular, Deloitte LLP provided transaction services in relation to the sale of the European munitions businesses and acted as reporting accountant on the related shareholders’ circular. This was a significant transaction for the Group, and it was considered that Deloitte LLP’s pre-existing knowledge of the Group would be very beneficial in undertaking these tasks. The Committee received assurance from the audit partner that the provision of these services would not impact on the external auditor’s independence in any way.
Details of the amounts paid to the external auditor during the year for audit and other services are set out in note 6 of the group financial statements.
The Committee, in conjunction with the Group Finance Director, ensures that the Group maintains relationships with a sufficient choice of appropriately qualified alternative audit firms for the provision of non-audit services.
Internal audit The Audit Committee is responsible for reviewing the work undertaken by the Group’s internal audit function, assessing the adequacy of the internal audit resource, and recommending changes for increasing the scope of the internal audit activities.
The Group’s internal audit programme incorporates an annual rolling review of all businesses, and focuses on both financial and non-financial controls and procedures. The Committee approves the annual internal audit plan and receives regular reports from the internal auditors.
The Group’s internal audit activities were partially segregated during the year, following changes by the US Government to its rules and regulations regarding the foreign control of businesses which are subject to a Special Security Agreement with the US Defence Security Service. The Group’s US businesses employed a dedicated internal auditor who reported to the Board of Chemring North America. The appropriateness and effectiveness of the US internal audit arrangements will be reviewed in 2015.
During the year, the Committee undertook a detailed review of the Group’s internal audit activities in respect of the Group’s businesses outside the Special Security Agreement, and concluded that it would be beneficial to broaden the scope of these activities to incorporate a more comprehensive review of non-financial controls. As a consequence, KPMG LLP has been appointed to provide internal audit services for these businesses in the year ending 31 October 2015.
58 CHEMRING GROUP PLCANNUAL REPORT AND ACCOUNTS 2014
GOVERNANCE
DIRECTORS’ REMUNERATION REPORT
Annual statement by the Chairman of the Remuneration Committee2014 was another busy year for the Remuneration Committee.
At the beginning of the year, we consulted with a number of shareholders on our new policy on executive directors’ remuneration, and I am pleased to report that we received a 96% vote in favour of the policy at the 2014 Annual General Meeting. The policy, which is restated in this report for ease of reference, will now remain valid until the 2017 Annual General Meeting. We are not proposing any changes to the policy this year.
I set out below further details of how the policy was applied in practice in 2014:
• As referred to in last year’s remuneration report, the salaries of the former Group Chief Executive, Mark Papworth, and the Group Finance Director, Steve Bowers, were increased at a rate above inflation with effect from 1 January 2014, reflecting the fact that their salaries when they joined the Company were below market rate. This year, the executive directors will receive an inflationary salary increase of 3.0% (prorated to 1.5% in the case of Michael Flowers, to reflect his June 2014 appointment date), in line with the general level of increases received by other employees.
• In determining the remuneration package for Michael Flowers on his appointment as Group Chief Executive, the Committee decided that it was appropriate to offer an initial base salary of £400,000, which was lower than the £475,000 salary previously received by Mark Papworth. This principally reflected the reduction in the size of the Group over the last year, and Michael’s relative inexperience on a public company board. However, all other elements of Michael’s remuneration package are in line with those received by Mark. It is anticipated that, in time, Michael’s salary will be increased to the level the Committee would consider appropriate for a fully-experienced Group Chief Executive. This is likely to require a number of above-inflation increases over a period of time. However, there is no set timetable for making this adjustment, and the rate of increase will depend on Michael’s performance and development as Group Chief Executive.
• The Committee agreed to honour Mark Papworth’s contractual entitlements on termination of his employment, and he is therefore receiving twelve months’ salary, pension contributions and benefits paid in monthly instalments. His deferred bonus share award in respect of his 2013 bonus and his performance share plan awards lapsed on termination of his employment.
• The structure of the executive directors’ annual bonus plan reverted to a 75%/25% split between financial measures and personal objectives in 2014, except in the case of Steve Bowers, whose bonus had a 35% weighting on personal objectives for 2014 only. The Committee considered it appropriate to apply the slightly higher weighting on personal objectives for Steve, given the importance of the restructuring of the Group’s financing arrangements, which was successfully completed during the year, and the need to improve the financial management of the business.
• The financial targets for the annual bonus plan were adjusted mid-year to reflect the impact of the business divestments which were completed during the year. The Committee sought advice from Deloitte LLP on the appropriate adjustments to be made to both the Earnings per share (“EPS”) and cash flow targets, further details of which are set out on page 70.
• The actual bonus payments due to the executive directors for 2014 are set out on page 70. 40% of the payouts will be deferred in shares for three years.
• As previously indicated, the performance condition for awards under the performance share plan was amended in 2014 to include two metrics, namely growth in adjusted underlying EPS and relative Total Shareholder Return (“TSR”) measured against an international peer group of defence sector companies. These measures were selected by the Remuneration Committee as they are aligned to the success of the Group’s recovery. EPS is a measure of the Group’s overall financial success and TSR provides an external assessment of the Company’s performance against companies of a similar size and complexity. TSR also aligns the rewards received by executives with the returns received by shareholders. Each will determine the vesting of 50% of the awards made in 2014, and the same performance conditions will also be applied to awards made during 2015.
• Following completion of the business divestments during the year, the Committee also decided that it would be appropriate to use an adjusted underlying proforma baseline EPS figure for the year ended 31 October 2013, in calculating the EPS growth for the performance condition applied to 2014 awards under the performance share plan. Adjustments were made to reflect both the impact of the disposals and the reduction in interest charges achieved following the application of the disposal proceeds to repayment of a proportion of the Company’s outstanding loan notes. In doing so, the Committee sought to ensure that the target would remain as challenging as when it was originally set. The Committee again sought advice from Deloitte LLP on the calculation of the proforma figure, and it was agreed that the adjusted, proforma baseline EPS for the year ended 31 October 2013 would be 16.3p.
• In 2014, we also amended our policy on paying dividend equivalents on vested performance share plan awards and deferred bonus share awards. In order to increase alignment with shareholders and bring our arrangements into line with market practice, dividend equivalents will now be paid on vested performance share plan awards and deferred bonus share awards granted from 2014.
We continue to welcome feedback on our remuneration arrangements from all interested parties, and hope that you will again support our implementation report at the Annual General Meeting on 19 March 2015.
Ian MuchChairman of the Remuneration Committee
59CHEMRING GROUP PLCANNUAL REPORT AND ACCOUNTS 2014
STRATEGIC REPORT
GOVERNANCE
FINANCIAL STATEMENTS
OTHER INFORMATION
REMUNERATION POLICYThis report sets out the information required by Part 4 of Schedule 8 to the Large and Medium Sized Companies and Groups (Accounts and Reports) Regulations 2008 (as amended). The report also satisfies the relevant requirements of the Listing Rules of the Financial Conduct Authority and describes how the Board has applied the principles and complied with the provisions relating to directors’ remuneration in the Code.
The Remuneration Committee has been established by the Board and is responsible for executive remuneration. The Committee’s terms of reference are available in full on the Company’s website or from the Company Secretary on request.
In determining remuneration for the executive directors and other senior managers, the Remuneration Committee seeks to maintain a competitive package of rewards, which enables the Company to attract and retain the highest calibre of executive, without being excessive by reference to market rates across comparator companies. Performance-related elements form a significant proportion of the total remuneration package of each executive director, and take into account the individual contribution of each executive and the performance of the business against financial objectives, details of which are set out in this report. These variable elements are designed to align the interests of executives with those of shareholders, by ensuring that a significant proportion of remuneration is performance-related and delivered in shares.
The table below summarises the Committee’s policy on the remuneration of executive directors, as approved by shareholders at the 2014 Annual General Meeting. Further details of the full policy, which remains valid until the 2017 Annual General Meeting, are set out on pages 62 to 66.
60 CHEMRING GROUP PLCANNUAL REPORT AND ACCOUNTS 2014
GOVERNANCE
Notes:1. A description of how the Company intends to implement the policy set out in this table for 2015 is set out in the annual report on remuneration on pages 67 to 77. The
remuneration policy for the executive directors and other senior executives is designed with regard to the policy for employees across the Group as a whole. However, there are some differences in the structure of the remuneration policy for senior executives. In general, these differences arise from the development of remuneration arrangements that are market competitive for the various categories of individuals. They also reflect the fact that, in the case of the executive directors and other senior executives, a greater emphasis tends to be placed on performance-related pay in the market.
Element Purpose and link to strategy Operation Maximum Performance assessment
Salary • Reflects the performance of the individual, their skills and experience over time, and the responsibilities of the role
• Provides an appropriate level of basic fixed income, avoiding excessive risk arising from over reliance on variable income
• Reviewed annually on 1 January• Benchmarked periodically against companies with similar
characteristics and companies within the same sector• Salaries take account of complexity of the role, market
competitiveness, Group performance and the increases awarded to the wider workforce
• Salary increases will normally be in line with those received by the wider workforce
• More significant increases may be awarded at the discretion of the Committee, for example where there is a change in responsibilities, to reflect individual development and performance in the role
• None, although overall individual performance is a factor considered when setting and reviewing salaries
Bonus • Incentivises annual delivery of financial, strategic and personal goals
• Maximum bonus only payable for achieving demanding targets• Delivery of a proportion of bonus in deferred shares provides
alignment with shareholders’ interests and assists with retention
• Allowing executives to receive, on vesting, the value of dividends which accrue on deferred shares helps align executives’ rewards with shareholders’ interests
• Paid in cash, with up to 40% deferred as a conditional award of deferred shares
• Vesting of deferred shares is subject to continued employment (save in “good leaver” scenarios) at the end of three years from the award of the bonus
• The payment of any earned bonus remains ultimately at the discretion of the Committee
• Non-pensionable• Executives are entitled to receive, on vesting of deferred share
awards, the value of dividend payments that would otherwise have been paid on the deferred shares during the deferral period
• Group Chief Executive - 125% of salary • Other executive directors - 100% of salary
• Mix of Group financial objectives and personal objectives - financial performance targets will determine the majority of the award and will typically include measures such as EPS and cash flow, although the Committee has discretion to set other targets
• Personal objectives will be measurable and linked to goals that are consistent with the Group’s longer-term goals
• No bonus will be paid in respect of any element unless threshold financial performance targets have been achieved
• Performance below threshold results in zero payment. Payment rises from 0% to 100% of the maximum opportunity for levels of performance between threshold and maximum with 50% of the maximum payable for on-target performance
• The Committee has discretion to reduce (potentially to zero) any bonus payout based on its assessment of the health and safety performance of the Group or an individual business within the Group
• Includes a clawback mechanism in the event of a material misstatement of the Group’s financial results
Long-term incentive plan (Performance Share Plan - “PSP”)
• Incentivises executives to achieve targets aligned to the Group’s main strategic objectives of delivering sustainable growth and shareholder returns
• Allowing executives to receive, on vesting, the value of dividends (in cash or shares) which accrue on vested awards helps align executives’ rewards with shareholders’ interests
• Annual grants of shares, which vest subject to the Group’s performance measured over three years
• Executives are entitled to receive the value of dividend payments that would otherwise have been paid on vested awards
• All awards are subject to the discretions given to the Committee in the plan rules during the vesting period
• Normally 150% of base salary (although grants up to 200% of base salary may be made in exceptional circumstances such as on recruitment)
• Awards made prior to 2014 are based on the conditions described on page 73 of this report
• Awards from 2014 onwards are subject to targets based on EPS growth and relative TSR measured against a peer group of international defence sector companies. For awards granted in 2014 and 2015, each measure will determine the vesting of 50% of the award; however, the Committee will have discretion to set different weightings for awards in future years
• Targets for the EPS condition are set by the Remuneration Committee prior to each grant. Targets for the relative TSR condition are based on a sliding scale, with median representing threshold performance and upper quartile representing maximum performance
• For each measure, performance below threshold results in zero payment. Payment rises from 25% to 100% of the maximum opportunity for that measure for levels of performance between threshold and maximum
• Includes a clawback mechanism in the event of a material misstatement of the Group’s financial results
All-employee share schemes
• All employees, including executives, are encouraged to acquire shares by participating in the Group’s all-employee share plans - the UK Sharesave Plan and the US Stock Purchase Plan
• The UK Sharesave Plan and US Stock Purchase Plans have standard terms
• Under the UK Sharesave Plan (the scheme applicable to the current executive directors), participants can enter into a savings contract, in return for which they are granted options to acquire shares at a discount to the market value of the shares at the start of the performance period
• The rules for the UK Sharesave Plan were approved by shareholders at the 2008 Annual General Meeting
• Participation limits are those set by the relevant tax authorities from time-to-time
• N/A
Pension • Provides modest retirement benefits that reward sustained contribution
• Defined benefit scheme until 6 April 2010, in which pension at a rate of 1/80th of final pensionable salary plus a cash lump sum of 3/80ths accrued for each year of membership. Final pensionable salary was capped at the HMRC notional earnings cap, and the scheme assumed a normal retirement age of 65. The scheme is now closed to future accrual
• Cash supplement after 6 April 2010, subject to auto-enrolment in the Group Stakeholder Scheme from 1 January 2014
• Post 6 April 2010 - 20% of base salary cash supplement paid in lieu of occupational pension scheme membership
• However, from 1 January 2014, all UK employees, including the executive directors, are subject to auto-enrolment into the Group’s defined contribution stakeholder scheme, with an employer contribution of 4% of base salary. If executives do not opt out of this scheme, their cash supplement will be reduced by 4%
• N/A
Other benefits • Provides a competitive package of benefits that assists with recruitment and retention
• Main benefits currently provided to UK executives are a fully–expensed company car or car allowance, life assurance, permanent health insurance and private medical insurance
• Company car up to an annual lease cost of £12,000 or cash allowance of up to £25,000 per annum
• Other benefits will be in line with market. The value of each benefit is based on the cost to the Company and is not pre–determined
• N/A
DIRECTORS’ REMUNERATION REPORT CONTINUED
61CHEMRING GROUP PLCANNUAL REPORT AND ACCOUNTS 2014
STRATEGIC REPORT
GOVERNANCE
FINANCIAL STATEMENTS
OTHER INFORMATION
2. All-employee share plans do not have performance conditions. Executive directors are eligible to participate in the UK Sharesave Plan on the same terms as other employees.
3. Copies of the PSP rules are available on request from the Company Secretary.4. As described on page 74, the Company operates share ownership guidelines requiring executive directors to acquire and hold a specified level of shareholding.
Element Purpose and link to strategy Operation Maximum Performance assessment
Salary • Reflects the performance of the individual, their skills and experience over time, and the responsibilities of the role
• Provides an appropriate level of basic fixed income, avoiding excessive risk arising from over reliance on variable income
• Reviewed annually on 1 January• Benchmarked periodically against companies with similar
characteristics and companies within the same sector• Salaries take account of complexity of the role, market
competitiveness, Group performance and the increases awarded to the wider workforce
• Salary increases will normally be in line with those received by the wider workforce
• More significant increases may be awarded at the discretion of the Committee, for example where there is a change in responsibilities, to reflect individual development and performance in the role
• None, although overall individual performance is a factor considered when setting and reviewing salaries
Bonus • Incentivises annual delivery of financial, strategic and personal goals
• Maximum bonus only payable for achieving demanding targets• Delivery of a proportion of bonus in deferred shares provides
alignment with shareholders’ interests and assists with retention
• Allowing executives to receive, on vesting, the value of dividends which accrue on deferred shares helps align executives’ rewards with shareholders’ interests
• Paid in cash, with up to 40% deferred as a conditional award of deferred shares
• Vesting of deferred shares is subject to continued employment (save in “good leaver” scenarios) at the end of three years from the award of the bonus
• The payment of any earned bonus remains ultimately at the discretion of the Committee
• Non-pensionable• Executives are entitled to receive, on vesting of deferred share
awards, the value of dividend payments that would otherwise have been paid on the deferred shares during the deferral period
• Group Chief Executive - 125% of salary • Other executive directors - 100% of salary
• Mix of Group financial objectives and personal objectives - financial performance targets will determine the majority of the award and will typically include measures such as EPS and cash flow, although the Committee has discretion to set other targets
• Personal objectives will be measurable and linked to goals that are consistent with the Group’s longer-term goals
• No bonus will be paid in respect of any element unless threshold financial performance targets have been achieved
• Performance below threshold results in zero payment. Payment rises from 0% to 100% of the maximum opportunity for levels of performance between threshold and maximum with 50% of the maximum payable for on-target performance
• The Committee has discretion to reduce (potentially to zero) any bonus payout based on its assessment of the health and safety performance of the Group or an individual business within the Group
• Includes a clawback mechanism in the event of a material misstatement of the Group’s financial results
Long-term incentive plan (Performance Share Plan - “PSP”)
• Incentivises executives to achieve targets aligned to the Group’s main strategic objectives of delivering sustainable growth and shareholder returns
• Allowing executives to receive, on vesting, the value of dividends (in cash or shares) which accrue on vested awards helps align executives’ rewards with shareholders’ interests
• Annual grants of shares, which vest subject to the Group’s performance measured over three years
• Executives are entitled to receive the value of dividend payments that would otherwise have been paid on vested awards
• All awards are subject to the discretions given to the Committee in the plan rules during the vesting period
• Normally 150% of base salary (although grants up to 200% of base salary may be made in exceptional circumstances such as on recruitment)
• Awards made prior to 2014 are based on the conditions described on page 73 of this report
• Awards from 2014 onwards are subject to targets based on EPS growth and relative TSR measured against a peer group of international defence sector companies. For awards granted in 2014 and 2015, each measure will determine the vesting of 50% of the award; however, the Committee will have discretion to set different weightings for awards in future years
• Targets for the EPS condition are set by the Remuneration Committee prior to each grant. Targets for the relative TSR condition are based on a sliding scale, with median representing threshold performance and upper quartile representing maximum performance
• For each measure, performance below threshold results in zero payment. Payment rises from 25% to 100% of the maximum opportunity for that measure for levels of performance between threshold and maximum
• Includes a clawback mechanism in the event of a material misstatement of the Group’s financial results
All-employee share schemes
• All employees, including executives, are encouraged to acquire shares by participating in the Group’s all-employee share plans - the UK Sharesave Plan and the US Stock Purchase Plan
• The UK Sharesave Plan and US Stock Purchase Plans have standard terms
• Under the UK Sharesave Plan (the scheme applicable to the current executive directors), participants can enter into a savings contract, in return for which they are granted options to acquire shares at a discount to the market value of the shares at the start of the performance period
• The rules for the UK Sharesave Plan were approved by shareholders at the 2008 Annual General Meeting
• Participation limits are those set by the relevant tax authorities from time-to-time
• N/A
Pension • Provides modest retirement benefits that reward sustained contribution
• Defined benefit scheme until 6 April 2010, in which pension at a rate of 1/80th of final pensionable salary plus a cash lump sum of 3/80ths accrued for each year of membership. Final pensionable salary was capped at the HMRC notional earnings cap, and the scheme assumed a normal retirement age of 65. The scheme is now closed to future accrual
• Cash supplement after 6 April 2010, subject to auto-enrolment in the Group Stakeholder Scheme from 1 January 2014
• Post 6 April 2010 - 20% of base salary cash supplement paid in lieu of occupational pension scheme membership
• However, from 1 January 2014, all UK employees, including the executive directors, are subject to auto-enrolment into the Group’s defined contribution stakeholder scheme, with an employer contribution of 4% of base salary. If executives do not opt out of this scheme, their cash supplement will be reduced by 4%
• N/A
Other benefits • Provides a competitive package of benefits that assists with recruitment and retention
• Main benefits currently provided to UK executives are a fully–expensed company car or car allowance, life assurance, permanent health insurance and private medical insurance
• Company car up to an annual lease cost of £12,000 or cash allowance of up to £25,000 per annum
• Other benefits will be in line with market. The value of each benefit is based on the cost to the Company and is not pre–determined
• N/A
62 CHEMRING GROUP PLCANNUAL REPORT AND ACCOUNTS 2014
GOVERNANCE
Committee discretionsThe Committee operates the Group’s variable incentive plans according to their respective rules and in accordance with HMRC rules where relevant. To ensure the efficient administration of these plans, the Committee will apply certain operational discretions. These include the following:
• selecting the participants in the plans on an annual basis;• determining the timing of grants of awards and/or payment;• determining the quantum of awards and/or payments (within the limits set out in the policy table above);• determining the extent of vesting based on the assessment of performance;• making the appropriate adjustments required in certain circumstances (eg change of control, rights issues, corporate
restructuring events, and special dividends);• determining “good leaver” status for incentive plan purposes and applying the appropriate treatment; and• undertaking the annual review of weighting of performance measures, and setting targets for the annual bonus plan and PSP
from year to year.
If an event occurs which results in the annual bonus plan or PSP performance conditions and/or targets being deemed no longer appropriate (eg a material acquisition or divestment), the Committee will have the ability to adjust appropriately the measures and/or targets and alter weightings, provided that the revised conditions or targets are not materially less difficult to satisfy.
Outstanding share incentive awards that remain unvested or unexercised at the date of this report, as detailed on pages 73 and 74, remain eligible for vesting or exercise based on their original award terms.
Selection of performance metrics and targetsThe performance-related elements of remuneration take into account the Group’s risk policies and systems, and are designed to align the senior executives’ interests with those of shareholders. The Committee reviews the annual bonus plan measures set for all of the Group’s senior executives (not just the executive directors) every year, in order to ensure that they are aligned with the Group’s strategy and to ensure consistent bonus arrangements amongst the senior executive team. All financial targets are set on a sliding scale. Non-financial targets are set at the beginning of the year based on individual and management team responsibilities.
The annual bonus plan performance metrics include a mix of financial targets and personal objectives, reflecting the key annual priorities of the Group. The financial metrics determine the majority of the bonus and normally include cash flow - a key measure of the Group’s ability to invest in the business and pay dividends to its shareholders, and EPS, which reflects the Group’s financial performance and is a key measure for its shareholders. The personal objectives agreed on an annual basis will be measurable and based on individual performance, and will be consistent with the achievement of the Group’s longer-term goals.
The following information has been updated for 2015:The Remuneration Committee has decided to apply TSR and EPS performance conditions to awards made under the PSP from 2014 onwards, as these measures are directly aligned to the success of the Group’s recovery. EPS is a measure of the Group’s overall financial success and TSR provides an external assessment of the Company’s performance against its peer group. TSR also aligns the rewards received by executives with the returns received by shareholders. Details of the EPS targets applied to 2014 awards and those to be made in 2015 are set out on pages 69 and 72, and further details on the TSR targets for 2014 and 2015 awards are also set out on pages 69 and 72.
The Committee will review the choice and relative balance of performance measures and the appropriateness of performance targets prior to each grant of awards under the PSP. The EPS targets are reset prior to each grant, following a review of internal and external expectations of future EPS growth for the Group. The TSR comparator group is reviewed prior to each grant to ensure it remains appropriate. The Committee retains discretion to set different targets for future awards, providing that, in the opinion of the Committee, the new targets are no less challenging in light of the prevailing circumstances than those set previously.
How employees’ pay is taken into account In addition to determining the remuneration arrangements for the executive directors, the Committee considers and approves the base salaries for thirteen other senior executives, and reviews salaries for the next tier of management at each of the Group’s businesses. The Committee also receives information on general pay levels and policies across the Group. The Committee, therefore, has due regard to salary levels across the Group in applying its remuneration policy.
How the executive directors’ remuneration policy relates to the wider Group The remuneration policy described above provides an overview of the structure that operates for the most senior executives in the Group. Lower aggregate incentive quanta are applied below executive level, with levels driven by market comparatives and the impact of the role.
DIRECTORS’ REMUNERATION REPORT CONTINUED
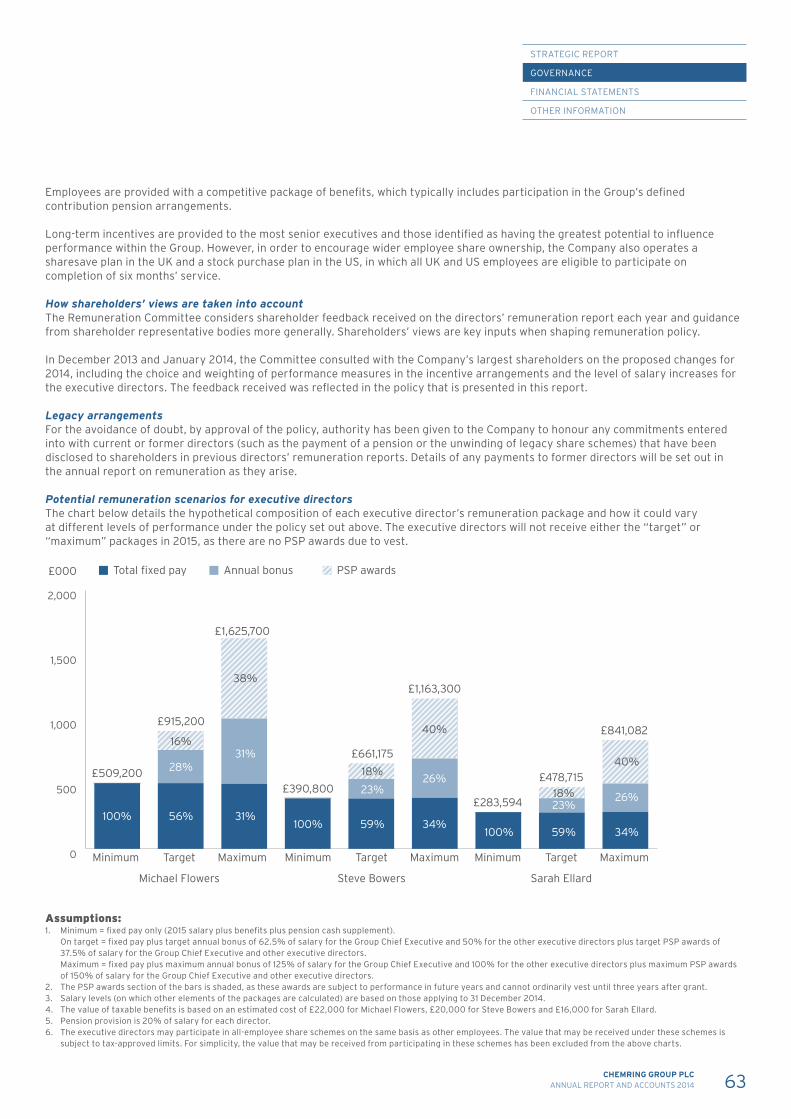
63CHEMRING GROUP PLCANNUAL REPORT AND ACCOUNTS 2014
STRATEGIC REPORT
GOVERNANCE
FINANCIAL STATEMENTS
OTHER INFORMATION
Employees are provided with a competitive package of benefits, which typically includes participation in the Group’s defined contribution pension arrangements.
Long-term incentives are provided to the most senior executives and those identified as having the greatest potential to influence performance within the Group. However, in order to encourage wider employee share ownership, the Company also operates a sharesave plan in the UK and a stock purchase plan in the US, in which all UK and US employees are eligible to participate on completion of six months’ service.
How shareholders’ views are taken into account The Remuneration Committee considers shareholder feedback received on the directors’ remuneration report each year and guidance from shareholder representative bodies more generally. Shareholders’ views are key inputs when shaping remuneration policy.
In December 2013 and January 2014, the Committee consulted with the Company’s largest shareholders on the proposed changes for 2014, including the choice and weighting of performance measures in the incentive arrangements and the level of salary increases for the executive directors. The feedback received was reflected in the policy that is presented in this report.
Legacy arrangements For the avoidance of doubt, by approval of the policy, authority has been given to the Company to honour any commitments entered into with current or former directors (such as the payment of a pension or the unwinding of legacy share schemes) that have been disclosed to shareholders in previous directors’ remuneration reports. Details of any payments to former directors will be set out in the annual report on remuneration as they arise.
Potential remuneration scenarios for executive directors The chart below details the hypothetical composition of each executive director’s remuneration package and how it could vary at different levels of performance under the policy set out above. The executive directors will not receive either the “target” or “maximum” packages in 2015, as there are no PSP awards due to vest.
Minimum MaximumTarget
Michael Flowers
Total fixed pay£000
Minimum MaximumTarget
Steve Bowers
Minimum MaximumTarget
Sarah Ellard
0
500
1,000
1,500
2,000
Annual bonus PSP awards
100% 56%
28%
16%
31%
31%
38%
100% 59%
23%
18%
34%
26%
40%
100% 59%
23%18%
34%
26%
40%£509,200
£915,200
£1,625,700
£390,800
£661,175
£1,163,300
£283,594
£478,715
£841,082
Assumptions:1. Minimum = fixed pay only (2015 salary plus benefits plus pension cash supplement). On target = fixed pay plus target annual bonus of 62.5% of salary for the Group Chief Executive and 50% for the other executive directors plus target PSP awards of
37.5% of salary for the Group Chief Executive and other executive directors. Maximum = fixed pay plus maximum annual bonus of 125% of salary for the Group Chief Executive and 100% for the other executive directors plus maximum PSP awards
of 150% of salary for the Group Chief Executive and other executive directors.2. The PSP awards section of the bars is shaded, as these awards are subject to performance in future years and cannot ordinarily vest until three years after grant. 3. Salary levels (on which other elements of the packages are calculated) are based on those applying to 31 December 2014.4. The value of taxable benefits is based on an estimated cost of £22,000 for Michael Flowers, £20,000 for Steve Bowers and £16,000 for Sarah Ellard.5. Pension provision is 20% of salary for each director.6. The executive directors may participate in all-employee share schemes on the same basis as other employees. The value that may be received under these schemes is
subject to tax-approved limits. For simplicity, the value that may be received from participating in these schemes has been excluded from the above charts.
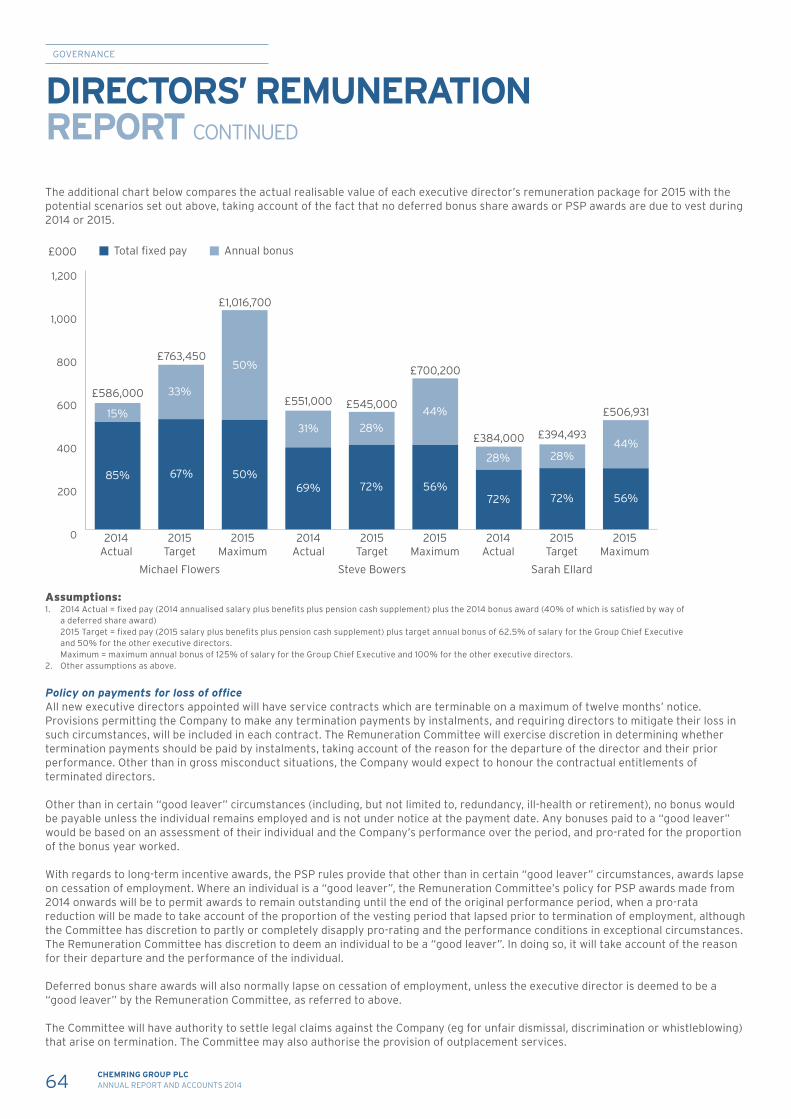
64 CHEMRING GROUP PLCANNUAL REPORT AND ACCOUNTS 2014
GOVERNANCE
The additional chart below compares the actual realisable value of each executive director’s remuneration package for 2015 with the potential scenarios set out above, taking account of the fact that no deferred bonus share awards or PSP awards are due to vest during 2014 or 2015.
£384,000
2014Actual
2015Maximum
2015Target
Michael Flowers
Total fixed pay£000
2014Actual
2015Maximum
2015Target
Steve Bowers
2014Actual
2015Maximum
2015Target
Sarah Ellard
0
200
400
600
800
1,000
1,200
Annual bonus
85% 67%
33%
50%69%
31%
72%
28%
56%
44%
72%
28%
72%
28%
56%
44%
50%
£586,000
£763,450
£1,016,700
£551,000 £545,000
£700,200
£506,931
£394,493
15%
Assumptions:1. 2014 Actual = fixed pay (2014 annualised salary plus benefits plus pension cash supplement) plus the 2014 bonus award (40% of which is satisfied by way of
a deferred share award) 2015 Target = fixed pay (2015 salary plus benefits plus pension cash supplement) plus target annual bonus of 62.5% of salary for the Group Chief Executive
and 50% for the other executive directors. Maximum = maximum annual bonus of 125% of salary for the Group Chief Executive and 100% for the other executive directors.2. Other assumptions as above.
Policy on payments for loss of office All new executive directors appointed will have service contracts which are terminable on a maximum of twelve months’ notice. Provisions permitting the Company to make any termination payments by instalments, and requiring directors to mitigate their loss in such circumstances, will be included in each contract. The Remuneration Committee will exercise discretion in determining whether termination payments should be paid by instalments, taking account of the reason for the departure of the director and their prior performance. Other than in gross misconduct situations, the Company would expect to honour the contractual entitlements of terminated directors.
Other than in certain “good leaver” circumstances (including, but not limited to, redundancy, ill-health or retirement), no bonus would be payable unless the individual remains employed and is not under notice at the payment date. Any bonuses paid to a “good leaver” would be based on an assessment of their individual and the Company’s performance over the period, and pro-rated for the proportion of the bonus year worked.
With regards to long-term incentive awards, the PSP rules provide that other than in certain “good leaver” circumstances, awards lapse on cessation of employment. Where an individual is a “good leaver”, the Remuneration Committee’s policy for PSP awards made from 2014 onwards will be to permit awards to remain outstanding until the end of the original performance period, when a pro-rata reduction will be made to take account of the proportion of the vesting period that lapsed prior to termination of employment, although the Committee has discretion to partly or completely disapply pro-rating and the performance conditions in exceptional circumstances. The Remuneration Committee has discretion to deem an individual to be a “good leaver”. In doing so, it will take account of the reason for their departure and the performance of the individual.
Deferred bonus share awards will also normally lapse on cessation of employment, unless the executive director is deemed to be a “good leaver” by the Remuneration Committee, as referred to above.
The Committee will have authority to settle legal claims against the Company (eg for unfair dismissal, discrimination or whistleblowing) that arise on termination. The Committee may also authorise the provision of outplacement services.
DIRECTORS’ REMUNERATION REPORT CONTINUED
65CHEMRING GROUP PLCANNUAL REPORT AND ACCOUNTS 2014
STRATEGIC REPORT
GOVERNANCE
FINANCIAL STATEMENTS
OTHER INFORMATION
Executive directors’ service agreements and loss of office payments The current executive directors have rolling service contracts, details of which are summarised in the table below:
Provision Detailed terms
Contract dates Michael Flowers — 23 June 2014 (effective 24 June 2014)Steve Bowers — 2 January 2013 (effective 7 January 2013)Sarah Ellard — 2 November 2011 (effective 7 October 2011)
Notice period Twelve months from both the Company and from the executive
Termination payment Contracts may be terminated without notice by the payment of a sum equal to the sum of salary due for the unexpired notice period plus the fair value of any contractual benefits (including pension)
Payments may be made in instalments and in these circumstances there is a requirement to mitigate loss
Incentive arrangements A pro—rata bonus may also become payable for the period of active service, along with vesting of outstanding PSP and deferred bonus share awards (see above)
The executive directors’ service contracts are available for inspection at the Company’s registered office.
Recruitment of executive directors Salaries for new hires (including internal promotions) will be set to reflect their skills and experience, the Company’s intended pay positioning, and the market rate for the applicable role.
Where it is appropriate to offer a below-median salary initially, the Committee will have the discretion to allow phased salary increases over a period of time for newly-appointed directors, even though this may involve increases in excess of the rate for the wider workforce and inflation.
Benefits will be provided in line with those offered to other executive directors, taking account of local market practice, with relocation expenses or arrangements provided if necessary. Tax equalisation may also be considered if an executive is adversely affected by taxation due to their employment with the Company. Legal fees and other costs incurred by the individual may also be paid by the Company.
The aggregate incentive opportunity offered to new recruits will normally be no higher than that offered under the annual bonus plan and the PSP to the existing executive directors. Different performance measures and targets may be set initially for the annual bonus plan, taking into account the responsibilities of the individual and the point in the financial year at which they join. Any increases in incentive quantum offered above this limit will be contingent on the Company receiving shareholder approval for an amendment to its approved policy at its next general meeting.
Current entitlements (benefits, bonus and share schemes) may be bought out on terms that are no more favourable than a like-for-like basis (with a comparable time horizon, fair value and subject to performance conditions). The Group’s existing incentive arrangements will be used to the extent possible, although awards may also be granted outside of these schemes, if necessary, and as permitted under the Listing Rules.
In the case of an internal hire, any outstanding variable pay awarded in relation to the previous role will be allowed to pay out according to its terms of grant (adjusted as relevant to take into account the Board appointment).
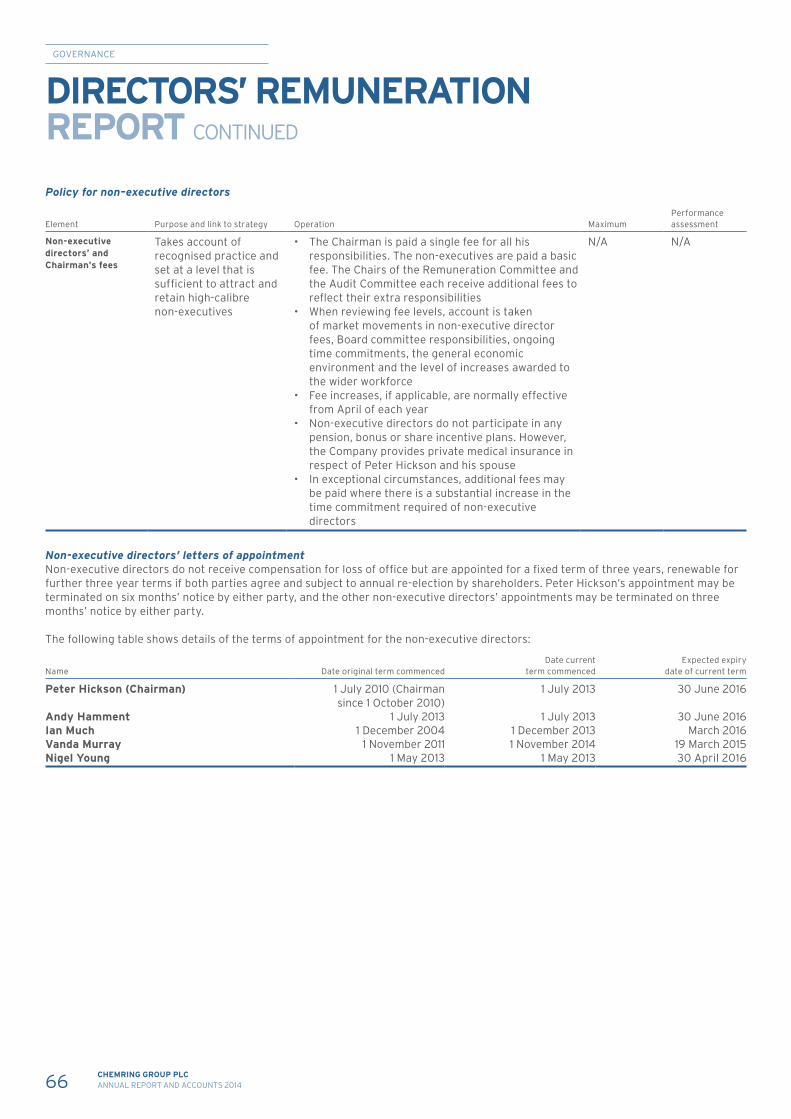
66 CHEMRING GROUP PLCANNUAL REPORT AND ACCOUNTS 2014
GOVERNANCE
Policy for non–executive directors
Element Purpose and link to strategy Operation MaximumPerformance assessment
Non-executive directors’ and Chairman’s fees
Takes account of recognised practice and set at a level that is sufficient to attract and retain high-calibre non-executives
• The Chairman is paid a single fee for all his responsibilities. The non-executives are paid a basic fee. The Chairs of the Remuneration Committee and the Audit Committee each receive additional fees to reflect their extra responsibilities
• When reviewing fee levels, account is taken of market movements in non-executive director fees, Board committee responsibilities, ongoing time commitments, the general economic environment and the level of increases awarded to the wider workforce
• Fee increases, if applicable, are normally effective from April of each year
• Non-executive directors do not participate in any pension, bonus or share incentive plans. However, the Company provides private medical insurance in respect of Peter Hickson and his spouse
• In exceptional circumstances, additional fees may be paid where there is a substantial increase in the time commitment required of non-executive directors
N/A N/A
Non-executive directors’ letters of appointment Non-executive directors do not receive compensation for loss of office but are appointed for a fixed term of three years, renewable for further three year terms if both parties agree and subject to annual re-election by shareholders. Peter Hickson’s appointment may be terminated on six months’ notice by either party, and the other non-executive directors’ appointments may be terminated on three months’ notice by either party.
The following table shows details of the terms of appointment for the non-executive directors:
Name Date original term commencedDate current
term commencedExpected expiry
date of current term
Peter Hickson (Chairman) 1 July 2010 (Chairman since 1 October 2010)
1 July 2013 30 June 2016
Andy Hamment 1 July 2013 1 July 2013 30 June 2016Ian Much 1 December 2004 1 December 2013 March 2016Vanda Murray 1 November 2011 1 November 2014 19 March 2015Nigel Young 1 May 2013 1 May 2013 30 April 2016
DIRECTORS’ REMUNERATION REPORT CONTINUED
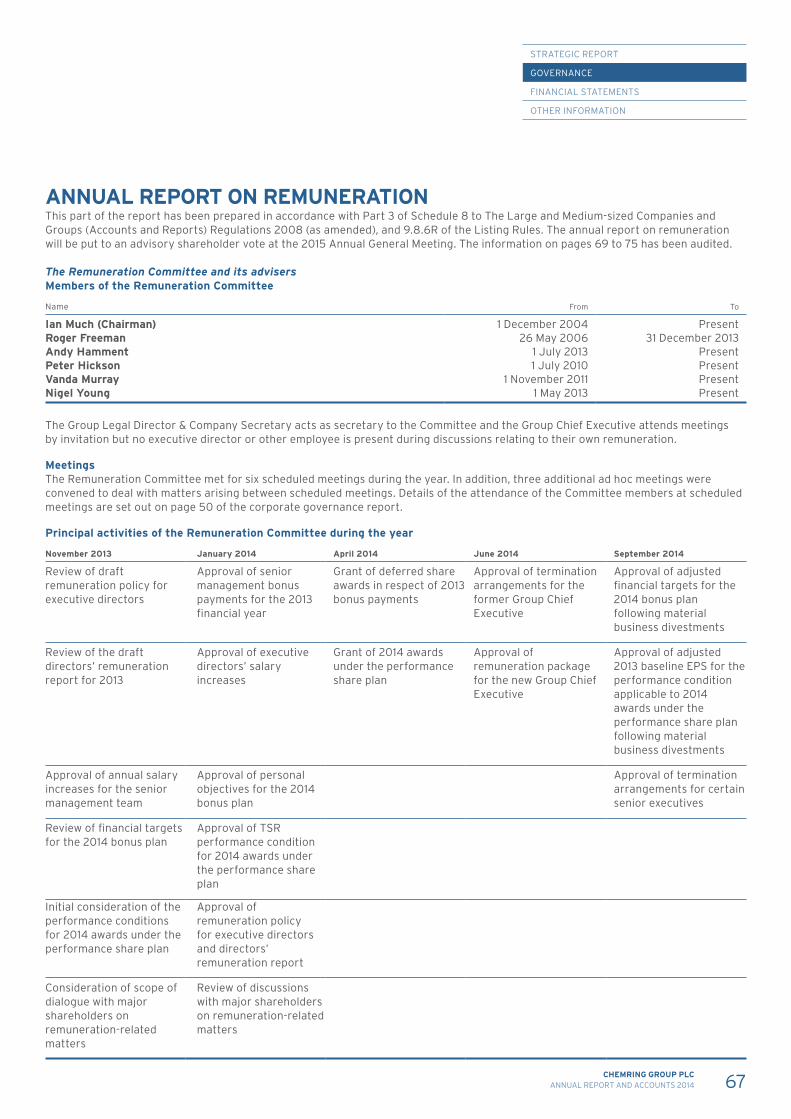
67CHEMRING GROUP PLCANNUAL REPORT AND ACCOUNTS 2014
STRATEGIC REPORT
GOVERNANCE
FINANCIAL STATEMENTS
OTHER INFORMATION
ANNUAL REPORT ON REMUNERATIONThis part of the report has been prepared in accordance with Part 3 of Schedule 8 to The Large and Medium-sized Companies and Groups (Accounts and Reports) Regulations 2008 (as amended), and 9.8.6R of the Listing Rules. The annual report on remuneration will be put to an advisory shareholder vote at the 2015 Annual General Meeting. The information on pages 69 to 75 has been audited.
The Remuneration Committee and its advisersMembers of the Remuneration Committee
Name From To
Ian Much (Chairman) 1 December 2004 PresentRoger Freeman 26 May 2006 31 December 2013Andy Hamment 1 July 2013 PresentPeter Hickson 1 July 2010 PresentVanda Murray 1 November 2011 PresentNigel Young 1 May 2013 Present
The Group Legal Director & Company Secretary acts as secretary to the Committee and the Group Chief Executive attends meetings by invitation but no executive director or other employee is present during discussions relating to their own remuneration.
Meetings The Remuneration Committee met for six scheduled meetings during the year. In addition, three additional ad hoc meetings were convened to deal with matters arising between scheduled meetings. Details of the attendance of the Committee members at scheduled meetings are set out on page 50 of the corporate governance report.
Principal activities of the Remuneration Committee during the year
November 2013 January 2014 April 2014 June 2014 September 2014
Review of draft remuneration policy for executive directors
Approval of senior management bonus payments for the 2013 financial year
Grant of deferred share awards in respect of 2013 bonus payments
Approval of termination arrangements for the former Group Chief Executive
Approval of adjusted financial targets for the 2014 bonus plan following material business divestments
Review of the draft directors’ remuneration report for 2013
Approval of executive directors’ salary increases
Grant of 2014 awards under the performance share plan
Approval of remuneration package for the new Group Chief Executive
Approval of adjusted 2013 baseline EPS for the performance condition applicable to 2014 awards under the performance share plan following material business divestments
Approval of annual salary increases for the senior management team
Approval of personal objectives for the 2014 bonus plan
Approval of termination arrangements for certain senior executives
Review of financial targets for the 2014 bonus plan
Approval of TSR performance condition for 2014 awards under the performance share plan
Initial consideration of the performance conditions for 2014 awards under the performance share plan
Approval of remuneration policy for executive directors and directors’ remuneration report
Consideration of scope of dialogue with major shareholders on remuneration-related matters
Review of discussions with major shareholders on remuneration-related matters
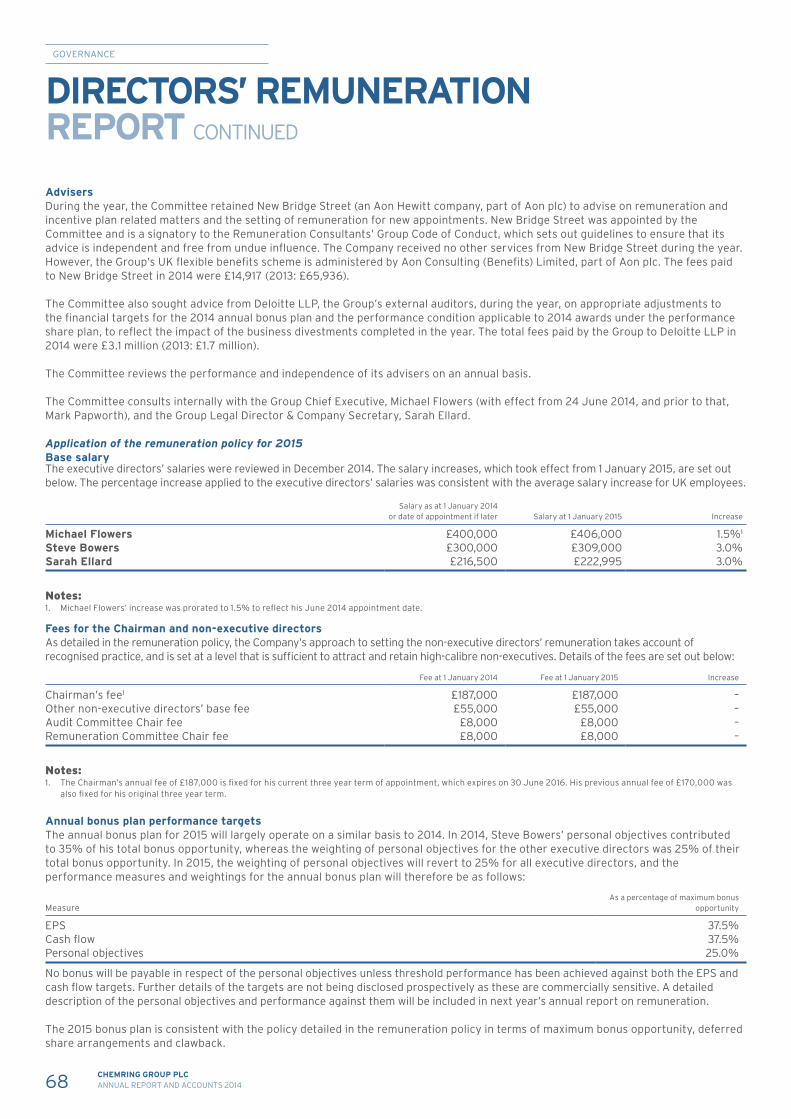
68 CHEMRING GROUP PLCANNUAL REPORT AND ACCOUNTS 2014
GOVERNANCE
Advisers During the year, the Committee retained New Bridge Street (an Aon Hewitt company, part of Aon plc) to advise on remuneration and incentive plan related matters and the setting of remuneration for new appointments. New Bridge Street was appointed by the Committee and is a signatory to the Remuneration Consultants’ Group Code of Conduct, which sets out guidelines to ensure that its advice is independent and free from undue influence. The Company received no other services from New Bridge Street during the year. However, the Group’s UK flexible benefits scheme is administered by Aon Consulting (Benefits) Limited, part of Aon plc. The fees paid to New Bridge Street in 2014 were £14,917 (2013: £65,936).
The Committee also sought advice from Deloitte LLP, the Group’s external auditors, during the year, on appropriate adjustments to the financial targets for the 2014 annual bonus plan and the performance condition applicable to 2014 awards under the performance share plan, to reflect the impact of the business divestments completed in the year. The total fees paid by the Group to Deloitte LLP in 2014 were £3.1 million (2013: £1.7 million).
The Committee reviews the performance and independence of its advisers on an annual basis.
The Committee consults internally with the Group Chief Executive, Michael Flowers (with effect from 24 June 2014, and prior to that, Mark Papworth), and the Group Legal Director & Company Secretary, Sarah Ellard.
Application of the remuneration policy for 2015Base salaryThe executive directors’ salaries were reviewed in December 2014. The salary increases, which took effect from 1 January 2015, are set out below. The percentage increase applied to the executive directors’ salaries was consistent with the average salary increase for UK employees.
Salary as at 1 January 2014 or date of appointment if later Salary at 1 January 2015 Increase
Michael Flowers £400,000 £406,000 1.5%1
Steve Bowers £300,000 £309,000 3.0%Sarah Ellard £216,500 £222,995 3.0%
Notes:1. Michael Flowers’ increase was prorated to 1.5% to reflect his June 2014 appointment date.
Fees for the Chairman and non-executive directorsAs detailed in the remuneration policy, the Company’s approach to setting the non-executive directors’ remuneration takes account of recognised practice, and is set at a level that is sufficient to attract and retain high-calibre non-executives. Details of the fees are set out below:
Fee at 1 January 2014 Fee at 1 January 2015 Increase
Chairman’s fee1 £187,000 £187,000 –Other non-executive directors’ base fee £55,000 £55,000 –Audit Committee Chair fee £8,000 £8,000 –Remuneration Committee Chair fee £8,000 £8,000 –
Notes:1. The Chairman’s annual fee of £187,000 is fixed for his current three year term of appointment, which expires on 30 June 2016. His previous annual fee of £170,000 was
also fixed for his original three year term.
Annual bonus plan performance targetsThe annual bonus plan for 2015 will largely operate on a similar basis to 2014. In 2014, Steve Bowers’ personal objectives contributed to 35% of his total bonus opportunity, whereas the weighting of personal objectives for the other executive directors was 25% of their total bonus opportunity. In 2015, the weighting of personal objectives will revert to 25% for all executive directors, and the performance measures and weightings for the annual bonus plan will therefore be as follows:
MeasureAs a percentage of maximum bonus
opportunity
EPS 37.5%Cash flow 37.5%Personal objectives 25.0%
No bonus will be payable in respect of the personal objectives unless threshold performance has been achieved against both the EPS and cash flow targets. Further details of the targets are not being disclosed prospectively as these are commercially sensitive. A detailed description of the personal objectives and performance against them will be included in next year’s annual report on remuneration.
The 2015 bonus plan is consistent with the policy detailed in the remuneration policy in terms of maximum bonus opportunity, deferred share arrangements and clawback.
DIRECTORS’ REMUNERATION REPORT CONTINUED
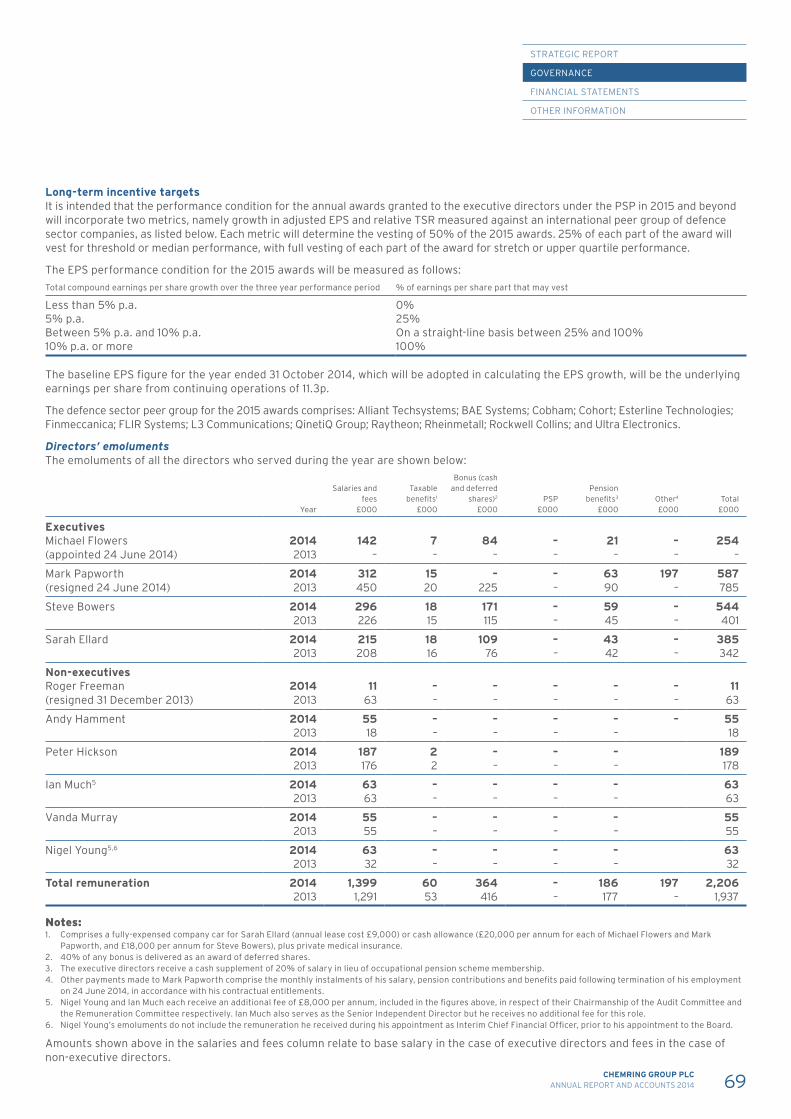
69CHEMRING GROUP PLCANNUAL REPORT AND ACCOUNTS 2014
STRATEGIC REPORT
GOVERNANCE
FINANCIAL STATEMENTS
OTHER INFORMATION
Long-term incentive targetsIt is intended that the performance condition for the annual awards granted to the executive directors under the PSP in 2015 and beyond will incorporate two metrics, namely growth in adjusted EPS and relative TSR measured against an international peer group of defence sector companies, as listed below. Each metric will determine the vesting of 50% of the 2015 awards. 25% of each part of the award will vest for threshold or median performance, with full vesting of each part of the award for stretch or upper quartile performance.
The EPS performance condition for the 2015 awards will be measured as follows:Total compound earnings per share growth over the three year performance period % of earnings per share part that may vest
Less than 5% p.a. 0%5% p.a. 25%Between 5% p.a. and 10% p.a. On a straight-line basis between 25% and 100%10% p.a. or more 100%
The baseline EPS figure for the year ended 31 October 2014, which will be adopted in calculating the EPS growth, will be the underlying earnings per share from continuing operations of 11.3p.
The defence sector peer group for the 2015 awards comprises: Alliant Techsystems; BAE Systems; Cobham; Cohort; Esterline Technologies; Finmeccanica; FLIR Systems; L3 Communications; QinetiQ Group; Raytheon; Rheinmetall; Rockwell Collins; and Ultra Electronics.
Directors’ emoluments The emoluments of all the directors who served during the year are shown below:
Year
Salaries and fees
£000
Taxable benefits1
£000
Bonus (cash and deferred
shares)2
£000PSP
£000
Pension benefits3
£000Other4
£000Total
£000
ExecutivesMichael Flowers(appointed 24 June 2014)
2014 142 7 84 – 21 – 2542013 – – – – – – –
Mark Papworth (resigned 24 June 2014)
2014 312 15 – – 63 197 5872013 450 20 225 – 90 – 785
Steve Bowers 2014 296 18 171 – 59 – 5442013 226 15 115 – 45 – 401
Sarah Ellard 2014 215 18 109 – 43 – 3852013 208 16 76 – 42 – 342
Non-executivesRoger Freeman(resigned 31 December 2013)
2014 11 – – – – – 112013 63 – – – – – 63
Andy Hamment 2014 55 – – – – – 552013 18 – – – – 18
Peter Hickson 2014 187 2 – – – 1892013 176 2 – – – 178
Ian Much5 2014 63 – – – – 632013 63 – – – – 63
Vanda Murray 2014 55 – – – – 552013 55 – – – – 55
Nigel Young5,6 2014 63 – – – – 632013 32 – – – – 32
Total remuneration 2014 1,399 60 364 – 186 197 2,2062013 1,291 53 416 – 177 – 1,937
Notes: 1. Comprises a fully-expensed company car for Sarah Ellard (annual lease cost £9,000) or cash allowance (£20,000 per annum for each of Michael Flowers and Mark
Papworth, and £18,000 per annum for Steve Bowers), plus private medical insurance. 2. 40% of any bonus is delivered as an award of deferred shares.3. The executive directors receive a cash supplement of 20% of salary in lieu of occupational pension scheme membership.4. Other payments made to Mark Papworth comprise the monthly instalments of his salary, pension contributions and benefits paid following termination of his employment
on 24 June 2014, in accordance with his contractual entitlements. 5. Nigel Young and Ian Much each receive an additional fee of £8,000 per annum, included in the figures above, in respect of their Chairmanship of the Audit Committee and
the Remuneration Committee respectively. Ian Much also serves as the Senior Independent Director but he receives no additional fee for this role.6. Nigel Young’s emoluments do not include the remuneration he received during his appointment as Interim Chief Financial Officer, prior to his appointment to the Board.
Amounts shown above in the salaries and fees column relate to base salary in the case of executive directors and fees in the case of non-executive directors.
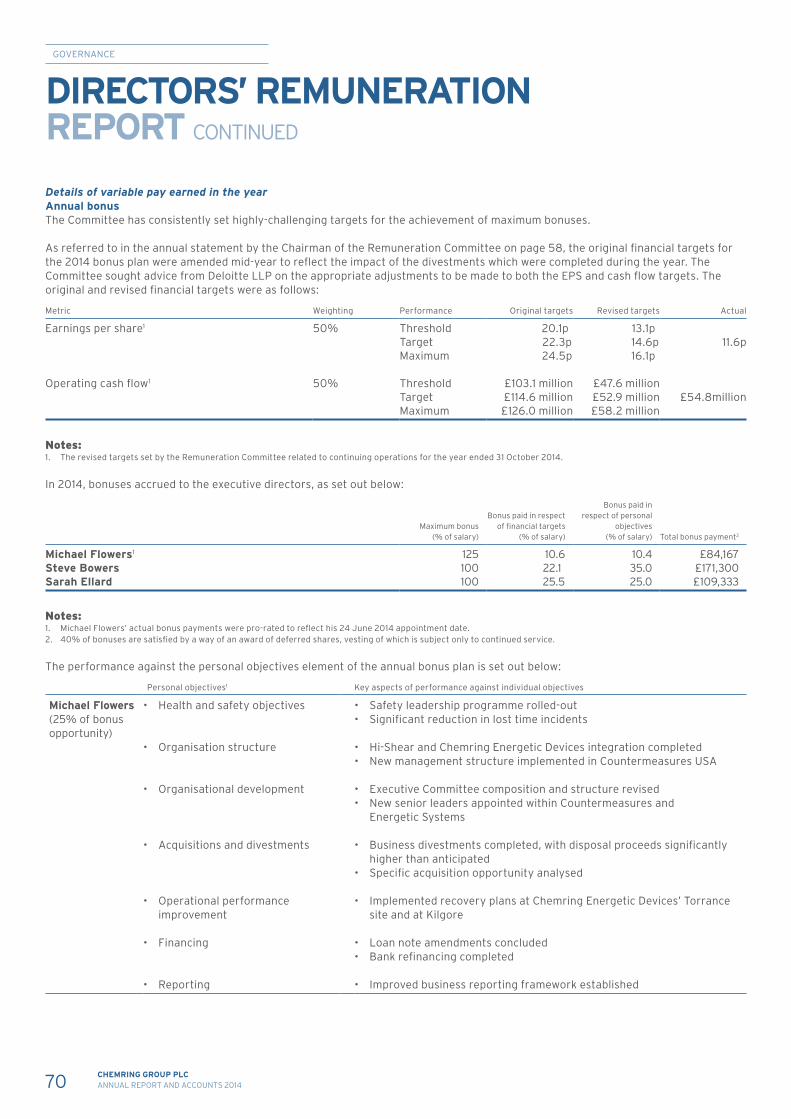
70 CHEMRING GROUP PLCANNUAL REPORT AND ACCOUNTS 2014
GOVERNANCE
Details of variable pay earned in the year Annual bonusThe Committee has consistently set highly-challenging targets for the achievement of maximum bonuses.
As referred to in the annual statement by the Chairman of the Remuneration Committee on page 58, the original financial targets for the 2014 bonus plan were amended mid-year to reflect the impact of the divestments which were completed during the year. The Committee sought advice from Deloitte LLP on the appropriate adjustments to be made to both the EPS and cash flow targets. The original and revised financial targets were as follows:
Metric Weighting Performance Original targets Revised targets Actual
Earnings per share1 50% Threshold 20.1p 13.1pTarget 22.3p 14.6p 11.6pMaximum 24.5p 16.1p
Operating cash flow1 50% Threshold £103.1 million £47.6 millionTarget £114.6 million £52.9 million £54.8millionMaximum £126.0 million £58.2 million
Notes:1. The revised targets set by the Remuneration Committee related to continuing operations for the year ended 31 October 2014.
In 2014, bonuses accrued to the executive directors, as set out below:
Maximum bonus (% of salary)
Bonus paid in respect of financial targets
(% of salary)
Bonus paid in respect of personal
objectives(% of salary) Total bonus payment2
Michael Flowers1 125 10.6 10.4 £84,167Steve Bowers 100 22.1 35.0 £171,300Sarah Ellard 100 25.5 25.0 £109,333
Notes:1. Michael Flowers’ actual bonus payments were pro-rated to reflect his 24 June 2014 appointment date.2. 40% of bonuses are satisfied by a way of an award of deferred shares, vesting of which is subject only to continued service.
The performance against the personal objectives element of the annual bonus plan is set out below:
Personal objectives1 Key aspects of performance against individual objectives
Michael Flowers(25% of bonus opportunity)
• Health and safety objectives
• Organisation structure
• Organisational development
• Acquisitions and divestments
• Operational performance improvement
• Financing
• Reporting
• Safety leadership programme rolled-out• Significant reduction in lost time incidents
• Hi-Shear and Chemring Energetic Devices integration completed• New management structure implemented in Countermeasures USA
• Executive Committee composition and structure revised• New senior leaders appointed within Countermeasures and
Energetic Systems
• Business divestments completed, with disposal proceeds significantly higher than anticipated
• Specific acquisition opportunity analysed
• Implemented recovery plans at Chemring Energetic Devices’ Torrance site and at Kilgore
• Loan note amendments concluded• Bank refinancing completed
• Improved business reporting framework established
DIRECTORS’ REMUNERATION REPORT CONTINUED
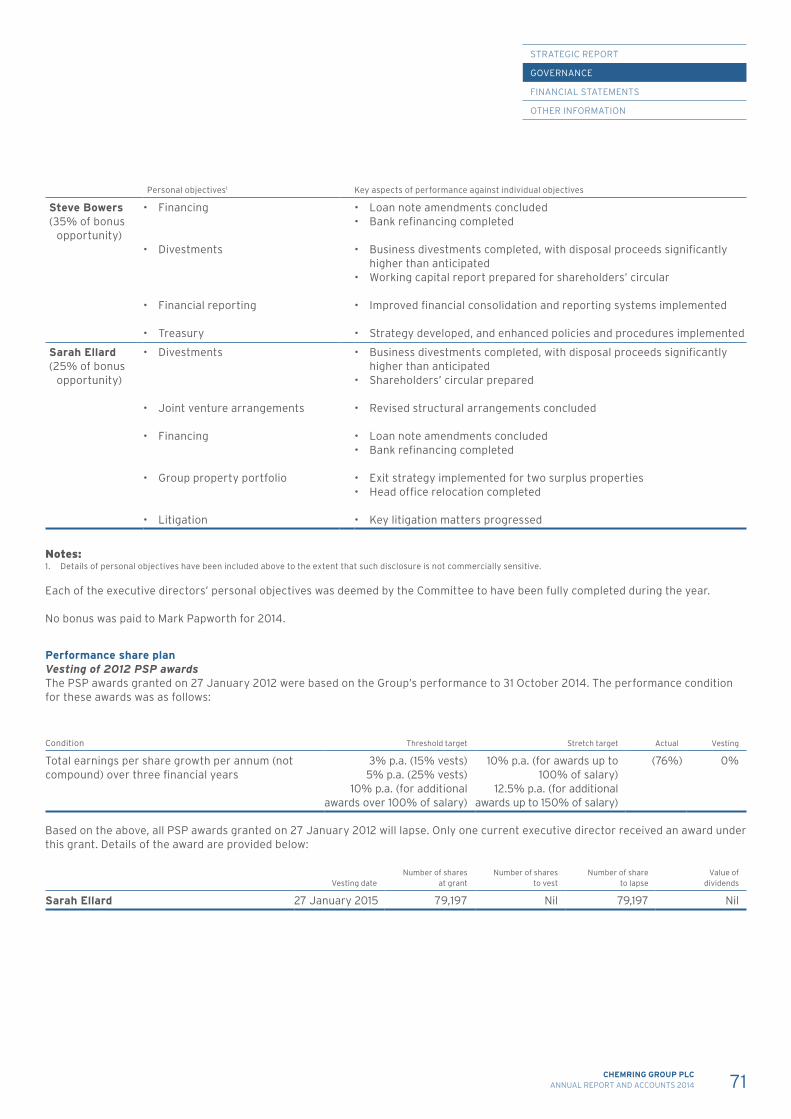
71CHEMRING GROUP PLCANNUAL REPORT AND ACCOUNTS 2014
STRATEGIC REPORT
GOVERNANCE
FINANCIAL STATEMENTS
OTHER INFORMATION
Personal objectives1 Key aspects of performance against individual objectives
Steve Bowers(35% of bonus
opportunity)
• Financing
• Divestments
• Financial reporting
• Treasury
• Loan note amendments concluded• Bank refinancing completed
• Business divestments completed, with disposal proceeds significantly higher than anticipated
• Working capital report prepared for shareholders’ circular
• Improved financial consolidation and reporting systems implemented
• Strategy developed, and enhanced policies and procedures implemented
Sarah Ellard(25% of bonus
opportunity)
• Divestments
• Joint venture arrangements
• Financing
• Group property portfolio
• Litigation
• Business divestments completed, with disposal proceeds significantly higher than anticipated
• Shareholders’ circular prepared
• Revised structural arrangements concluded
• Loan note amendments concluded• Bank refinancing completed
• Exit strategy implemented for two surplus properties• Head office relocation completed
• Key litigation matters progressed
Notes:1. Details of personal objectives have been included above to the extent that such disclosure is not commercially sensitive.
Each of the executive directors’ personal objectives was deemed by the Committee to have been fully completed during the year.
No bonus was paid to Mark Papworth for 2014.
Performance share plan Vesting of 2012 PSP awardsThe PSP awards granted on 27 January 2012 were based on the Group’s performance to 31 October 2014. The performance condition for these awards was as follows:
Condition Threshold target Stretch target Actual Vesting
Total earnings per share growth per annum (not compound) over three financial years
3% p.a. (15% vests)5% p.a. (25% vests)
10% p.a. (for additional awards over 100% of salary)
10% p.a. (for awards up to 100% of salary)
12.5% p.a. (for additional awards up to 150% of salary)
(76%) 0%
Based on the above, all PSP awards granted on 27 January 2012 will lapse. Only one current executive director received an award under this grant. Details of the award are provided below:
Vesting dateNumber of shares
at grantNumber of shares
to vestNumber of share
to lapseValue of
dividends
Sarah Ellard 27 January 2015 79,197 Nil 79,197 Nil
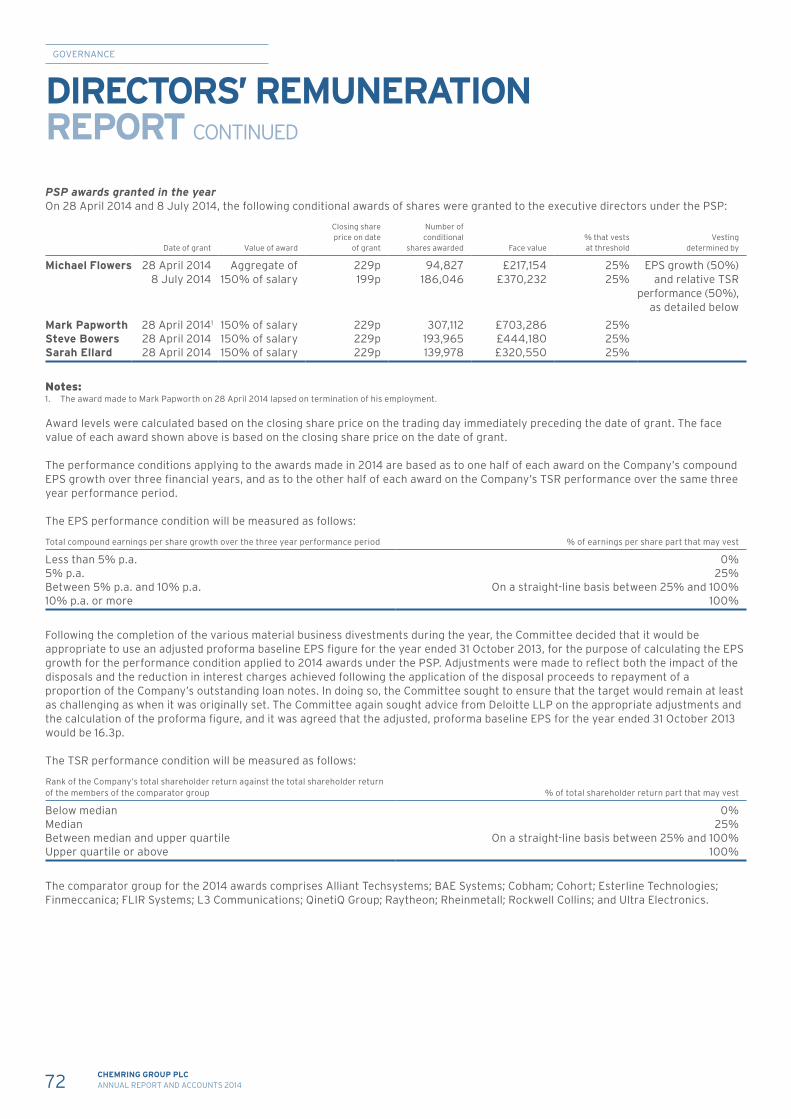
72 CHEMRING GROUP PLCANNUAL REPORT AND ACCOUNTS 2014
GOVERNANCE
PSP awards granted in the yearOn 28 April 2014 and 8 July 2014, the following conditional awards of shares were granted to the executive directors under the PSP:
Date of grant Value of award
Closing shareprice on date
of grant
Number ofconditional
shares awarded Face value% that vestsat threshold
Vestingdetermined by
Michael Flowers 28 April 20148 July 2014
Aggregate of 150% of salary
229p199p
94,827186,046
£217,154£370,232
25%25%
EPS growth (50%) and relative TSR
performance (50%), as detailed below
Mark Papworth 28 April 20141 150% of salary 229p 307,112 £703,286 25%Steve Bowers 28 April 2014 150% of salary 229p 193,965 £444,180 25%Sarah Ellard 28 April 2014 150% of salary 229p 139,978 £320,550 25%
Notes: 1. The award made to Mark Papworth on 28 April 2014 lapsed on termination of his employment.
Award levels were calculated based on the closing share price on the trading day immediately preceding the date of grant. The face value of each award shown above is based on the closing share price on the date of grant.
The performance conditions applying to the awards made in 2014 are based as to one half of each award on the Company’s compound EPS growth over three financial years, and as to the other half of each award on the Company’s TSR performance over the same three year performance period.
The EPS performance condition will be measured as follows:
Total compound earnings per share growth over the three year performance period % of earnings per share part that may vest
Less than 5% p.a. 0%5% p.a. 25%Between 5% p.a. and 10% p.a. On a straight-line basis between 25% and 100%10% p.a. or more 100%
Following the completion of the various material business divestments during the year, the Committee decided that it would be appropriate to use an adjusted proforma baseline EPS figure for the year ended 31 October 2013, for the purpose of calculating the EPS growth for the performance condition applied to 2014 awards under the PSP. Adjustments were made to reflect both the impact of the disposals and the reduction in interest charges achieved following the application of the disposal proceeds to repayment of a proportion of the Company’s outstanding loan notes. In doing so, the Committee sought to ensure that the target would remain at least as challenging as when it was originally set. The Committee again sought advice from Deloitte LLP on the appropriate adjustments and the calculation of the proforma figure, and it was agreed that the adjusted, proforma baseline EPS for the year ended 31 October 2013 would be 16.3p.
The TSR performance condition will be measured as follows:
Rank of the Company’s total shareholder return against the total shareholder return of the members of the comparator group % of total shareholder return part that may vest
Below median 0%Median 25%Between median and upper quartile On a straight-line basis between 25% and 100%Upper quartile or above 100%
The comparator group for the 2014 awards comprises Alliant Techsystems; BAE Systems; Cobham; Cohort; Esterline Technologies; Finmeccanica; FLIR Systems; L3 Communications; QinetiQ Group; Raytheon; Rheinmetall; Rockwell Collins; and Ultra Electronics.
DIRECTORS’ REMUNERATION REPORT CONTINUED
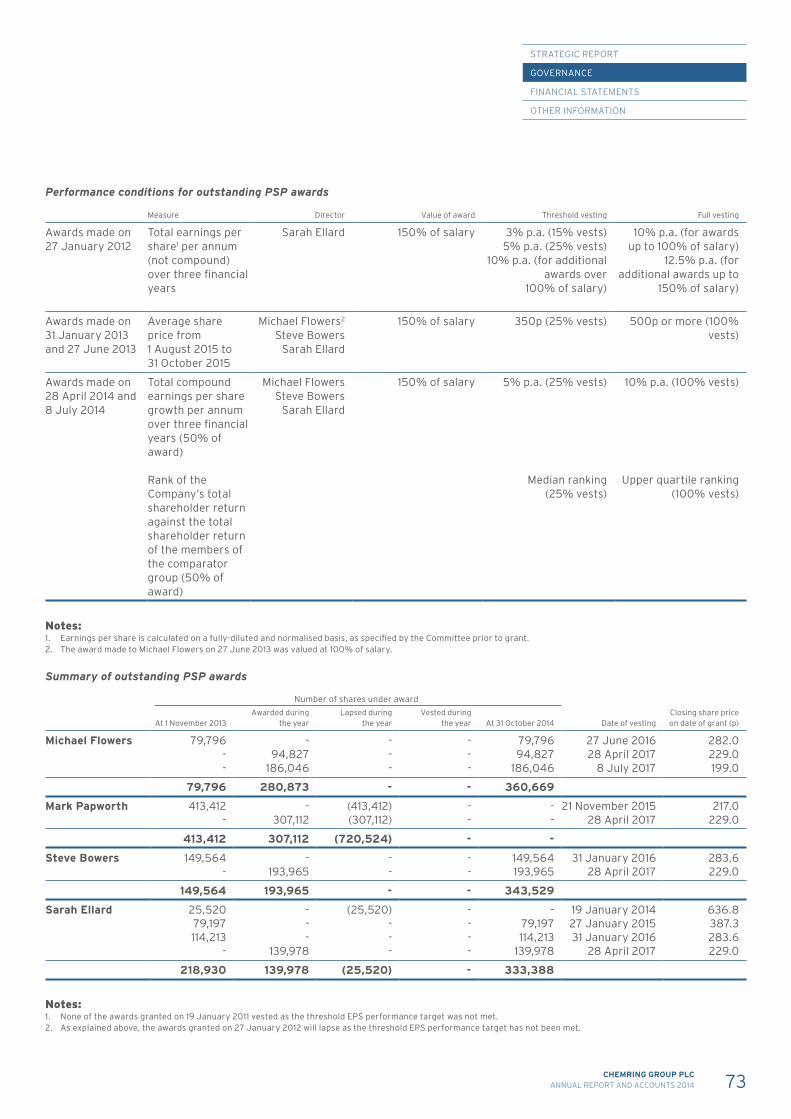
73CHEMRING GROUP PLCANNUAL REPORT AND ACCOUNTS 2014
STRATEGIC REPORT
GOVERNANCE
FINANCIAL STATEMENTS
OTHER INFORMATION
Performance conditions for outstanding PSP awards
Measure Director Value of award Threshold vesting Full vesting
Awards made on 27 January 2012
Total earnings per share1 per annum (not compound) over three financial years
Sarah Ellard 150% of salary 3% p.a. (15% vests)5% p.a. (25% vests)
10% p.a. (for additional awards over
100% of salary)
10% p.a. (for awards up to 100% of salary)
12.5% p.a. (for additional awards up to
150% of salary)
Awards made on 31 January 2013 and 27 June 2013
Average share price from 1 August 2015 to 31 October 2015
Michael Flowers2
Steve BowersSarah Ellard
150% of salary 350p (25% vests) 500p or more (100% vests)
Awards made on 28 April 2014 and 8 July 2014
Total compound earnings per share growth per annum over three financial years (50% of award)
Rank of the Company’s total shareholder return against the total shareholder return of the members of the comparator group (50% of award)
Michael FlowersSteve Bowers
Sarah Ellard
150% of salary 5% p.a. (25% vests)
Median ranking (25% vests)
10% p.a. (100% vests)
Upper quartile ranking (100% vests)
Notes: 1. Earnings per share is calculated on a fully-diluted and normalised basis, as specified by the Committee prior to grant.2. The award made to Michael Flowers on 27 June 2013 was valued at 100% of salary.
Summary of outstanding PSP awards
Number of shares under award
At 1 November 2013Awarded during
the yearLapsed during
the yearVested during
the year At 31 October 2014 Date of vestingClosing share price on date of grant (p)
Michael Flowers 79,796 - - - 79,796 27 June 2016 282.0- 94,827 - - 94,827 28 April 2017 229.0- 186,046 - - 186,046 8 July 2017 199.0
79,796 280,873 - - 360,669
Mark Papworth 413,412 - (413,412) - - 21 November 2015 217.0- 307,112 (307,112) - - 28 April 2017 229.0
413,412 307,112 (720,524) - -
Steve Bowers 149,564 - - - 149,564 31 January 2016 283.6- 193,965 - - 193,965 28 April 2017 229.0
149,564 193,965 - - 343,529
Sarah Ellard 25,520 - (25,520) - - 19 January 2014 636.879,197 - - - 79,197 27 January 2015 387.3114,213 - - - 114,213 31 January 2016 283.6
- 139,978 - - 139,978 28 April 2017 229.0
218,930 139,978 (25,520) - 333,388
Notes:1. None of the awards granted on 19 January 2011 vested as the threshold EPS performance target was not met.2. As explained above, the awards granted on 27 January 2012 will lapse as the threshold EPS performance target has not been met.
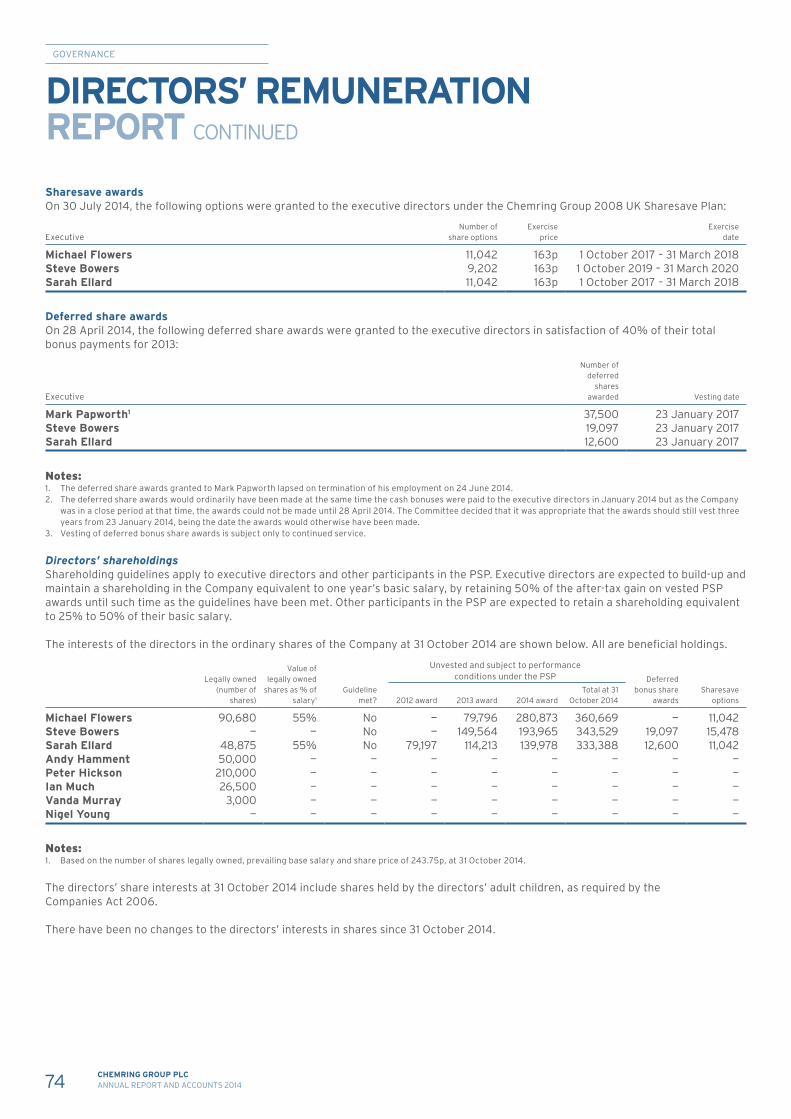
74 CHEMRING GROUP PLCANNUAL REPORT AND ACCOUNTS 2014
GOVERNANCE
Sharesave awardsOn 30 July 2014, the following options were granted to the executive directors under the Chemring Group 2008 UK Sharesave Plan:
ExecutiveNumber of
share optionsExercise
priceExercise
date
Michael Flowers 11,042 163p 1 October 2017 – 31 March 2018Steve Bowers 9,202 163p 1 October 2019 – 31 March 2020Sarah Ellard 11,042 163p 1 October 2017 – 31 March 2018
Deferred share awardsOn 28 April 2014, the following deferred share awards were granted to the executive directors in satisfaction of 40% of their total bonus payments for 2013:
Executive
Number of deferred
shares awarded Vesting date
Mark Papworth1 37,500 23 January 2017Steve Bowers 19,097 23 January 2017Sarah Ellard 12,600 23 January 2017
Notes:1. The deferred share awards granted to Mark Papworth lapsed on termination of his employment on 24 June 2014.2. The deferred share awards would ordinarily have been made at the same time the cash bonuses were paid to the executive directors in January 2014 but as the Company
was in a close period at that time, the awards could not be made until 28 April 2014. The Committee decided that it was appropriate that the awards should still vest three years from 23 January 2014, being the date the awards would otherwise have been made.
3. Vesting of deferred bonus share awards is subject only to continued service.
Directors’ shareholdingsShareholding guidelines apply to executive directors and other participants in the PSP. Executive directors are expected to build-up and maintain a shareholding in the Company equivalent to one year’s basic salary, by retaining 50% of the after-tax gain on vested PSP awards until such time as the guidelines have been met. Other participants in the PSP are expected to retain a shareholding equivalent to 25% to 50% of their basic salary.
The interests of the directors in the ordinary shares of the Company at 31 October 2014 are shown below. All are beneficial holdings.
Legally owned (number of
shares)
Value of legally owned
shares as % of salary1
Guideline met?
Unvested and subject to performance conditions under the PSP Deferred
bonus share awards
Sharesave options2012 award 2013 award 2014 award
Total at 31 October 2014
Michael Flowers 90,680 55% No — 79,796 280,873 360,669 — 11,042Steve Bowers — — No — 149,564 193,965 343,529 19,097 15,478Sarah Ellard 48,875 55% No 79,197 114,213 139,978 333,388 12,600 11,042Andy Hamment 50,000 — — — — — — — —Peter Hickson 210,000 — — — — — — — —Ian Much 26,500 — — — — — — — —Vanda Murray 3,000 — — — — — — — —Nigel Young — — — — — — — — —
Notes:1. Based on the number of shares legally owned, prevailing base salary and share price of 243.75p, at 31 October 2014.
The directors’ share interests at 31 October 2014 include shares held by the directors’ adult children, as required by the Companies Act 2006.
There have been no changes to the directors’ interests in shares since 31 October 2014.
DIRECTORS’ REMUNERATION REPORT CONTINUED

75CHEMRING GROUP PLCANNUAL REPORT AND ACCOUNTS 2014
STRATEGIC REPORT
GOVERNANCE
FINANCIAL STATEMENTS
OTHER INFORMATION
Pension The following table sets out the pension benefits earned by Sarah Ellard during her former membership of the Chemring Group Staff Pension Scheme.
Total benefit accrued at 31 Oct 2013
Transfer value of accrued benefit at
31 Oct 2013Total benefit accrued at
31 Oct 2014
Transfer value of accrued benefit at
31 Oct 2014
Increase in transfer value
during year (less member’s contributions)
Pension £p.a.
Cash£ £
Pension £p.a.
Cash £ £
£
Sarah Ellard 23,948 71,844 460,587 23,948 71,844 460,587 –
Notes:1. Transfer values represent liabilities of the applicable scheme, and do not represent sums paid to individuals.2. Transfer values have been calculated in accordance with the Occupational Pension Scheme (Transfer Value) Regulations 1996. 3. Sarah Ellard left pensionable service on 6 April 2010 and therefore has not accrued additional pension over the year. The accrued benefits shown are the benefits at the
date of exit.4. The scheme provided pension at a rate of 1/80th of final pensionable salary plus a cash lump sum of 3/80ths for each year of membership. Final pensionable salary was
capped at the HMRC notional earnings cap, and the scheme assumed a normal retirement age of 65. Early retirement is permissible form age 55 but accrued benefits are reduced accordingly using the early retirement factors in force at the date of early retirement.
Loss of office payments The principles governing compensation for loss of office are set out on page 64.
The Company has agreed to make a total payment of £593,135, representing twelve months’ pay in lieu of notice and compensation for loss of contractual benefits (including pension contributions), to Mark Papworth following the termination of his employment as Group Chief Executive on 24 June 2014. The payment is being made in twelve monthly instalments, over the period from July 2014 to June 2015, in accordance with his contract. Mr Papworth is required to mitigate his loss during this period, and any employment income he receives will reduce the value of any outstanding payments from the Company.
Mr Papworth has filed an employment tribunal claim against the Company in respect of the termination of his employment, which the Company is defending.
Payments to past directors No payments were made to past directors during the year.
Performance graph and table The following graph shows the Company’s cumulative total shareholder return over the last six financial years relative to the FTSE 250 Index. The FTSE 250 Index has been selected by the Committee for this comparison because it provides the most appropriate measure of performance of listed companies of a similar size to the Company.
The graph shows the value, by 31 October 2014, of £100 invested in Chemring Group PLC on 31 October 2008, compared with the value of £100 invested in the FTSE 250 Index. The other points plotted are the values at intervening financial year ends.
50
100
150
200
250
300
31 Oct 1431 Oct 1331 Oct 1231 Oct 1131 Oct 1031 Oct 0931 Oct 08
Chemring Group PLCFTSE 250 Index
Valu
e (£
)
Total shareholder return Source: Thomson Reuters
Total shareholder return
Source: Thomson Reuters
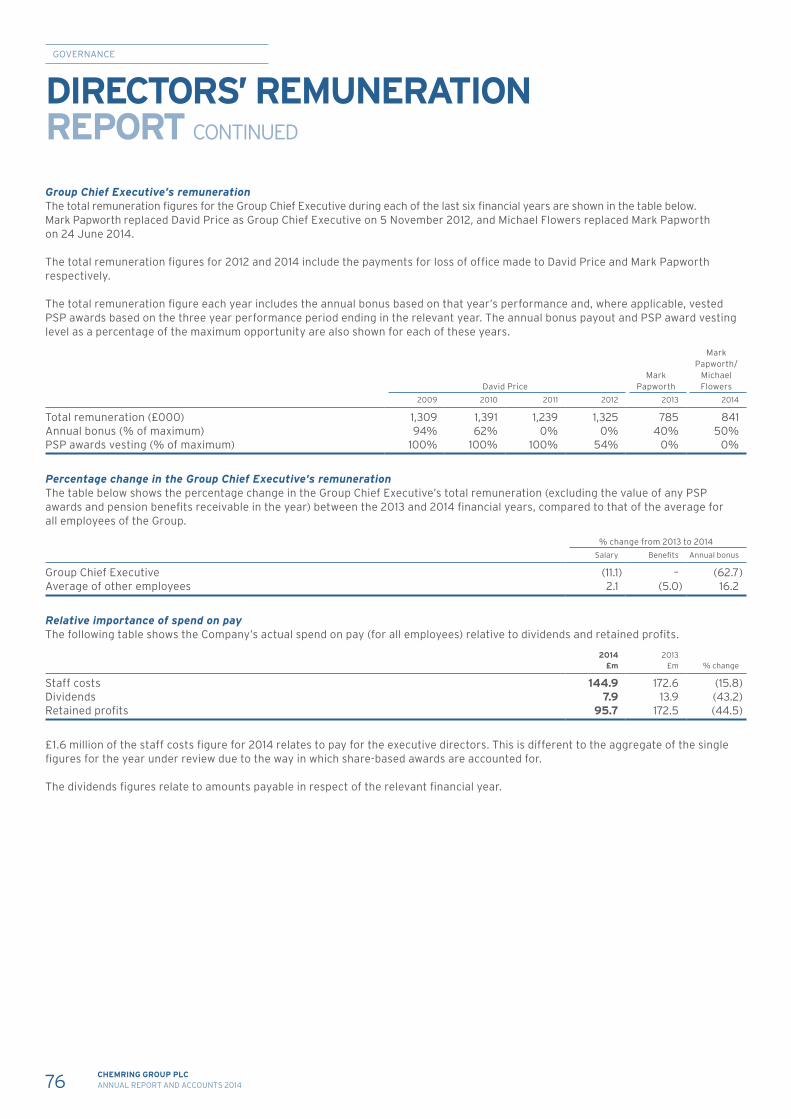
76 CHEMRING GROUP PLCANNUAL REPORT AND ACCOUNTS 2014
GOVERNANCE
Group Chief Executive’s remunerationThe total remuneration figures for the Group Chief Executive during each of the last six financial years are shown in the table below. Mark Papworth replaced David Price as Group Chief Executive on 5 November 2012, and Michael Flowers replaced Mark Papworth on 24 June 2014.
The total remuneration figures for 2012 and 2014 include the payments for loss of office made to David Price and Mark Papworth respectively.
The total remuneration figure each year includes the annual bonus based on that year’s performance and, where applicable, vested PSP awards based on the three year performance period ending in the relevant year. The annual bonus payout and PSP award vesting level as a percentage of the maximum opportunity are also shown for each of these years.
David PriceMark
Papworth
Mark Papworth/
Michael Flowers
2009 2010 2011 2012 2013 2014
Total remuneration (£000) 1,309 1,391 1,239 1,325 785 841Annual bonus (% of maximum) 94% 62% 0% 0% 40% 50%PSP awards vesting (% of maximum) 100% 100% 100% 54% 0% 0%
Percentage change in the Group Chief Executive’s remunerationThe table below shows the percentage change in the Group Chief Executive’s total remuneration (excluding the value of any PSP awards and pension benefits receivable in the year) between the 2013 and 2014 financial years, compared to that of the average for all employees of the Group.
% change from 2013 to 2014
Salary Benefits Annual bonus
Group Chief Executive (11.1) – (62.7)Average of other employees 2.1 (5.0) 16.2
Relative importance of spend on payThe following table shows the Company’s actual spend on pay (for all employees) relative to dividends and retained profits.
2014£m
2013£m % change
Staff costs 144.9 172.6 (15.8)Dividends 7.9 13.9 (43.2)Retained profits 95.7 172.5 (44.5)
£1.6 million of the staff costs figure for 2014 relates to pay for the executive directors. This is different to the aggregate of the single figures for the year under review due to the way in which share-based awards are accounted for.
The dividends figures relate to amounts payable in respect of the relevant financial year.
DIRECTORS’ REMUNERATION REPORT CONTINUED
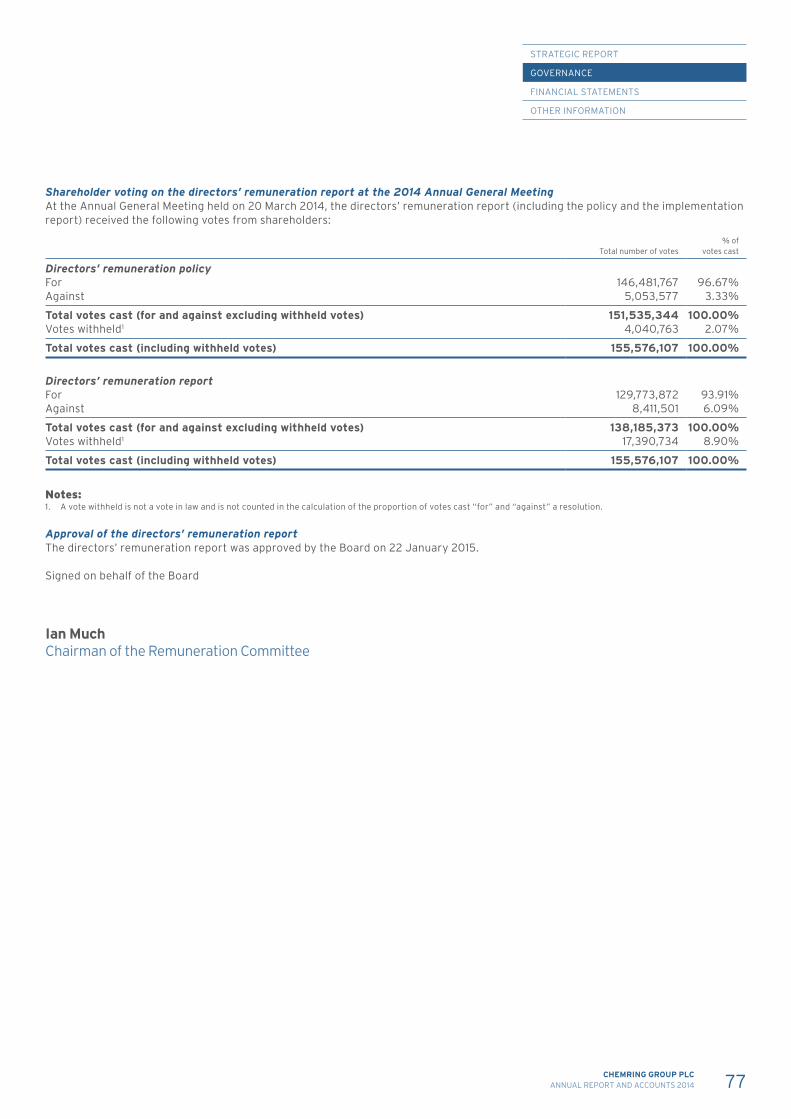
77CHEMRING GROUP PLCANNUAL REPORT AND ACCOUNTS 2014
STRATEGIC REPORT
GOVERNANCE
FINANCIAL STATEMENTS
OTHER INFORMATION
Shareholder voting on the directors’ remuneration report at the 2014 Annual General Meeting At the Annual General Meeting held on 20 March 2014, the directors’ remuneration report (including the policy and the implementation report) received the following votes from shareholders:
Total number of votes% of
votes cast
Directors’ remuneration policyFor 146,481,767 96.67%Against 5,053,577 3.33%
Total votes cast (for and against excluding withheld votes) 151,535,344 100.00%Votes withheld1 4,040,763 2.07%
Total votes cast (including withheld votes) 155,576,107 100.00%
Directors’ remuneration reportFor 129,773,872 93.91%Against 8,411,501 6.09%
Total votes cast (for and against excluding withheld votes) 138,185,373 100.00%Votes withheld1 17,390,734 8.90%
Total votes cast (including withheld votes) 155,576,107 100.00%
Notes:1. A vote withheld is not a vote in law and is not counted in the calculation of the proportion of votes cast “for” and “against” a resolution.
Approval of the directors’ remuneration report The directors’ remuneration report was approved by the Board on 22 January 2015.
Signed on behalf of the Board
Ian Much Chairman of the Remuneration Committee
FINANCIAL STATEMENTS
78 CHEMRING GROUP PLCANNUAL REPORT AND ACCOUNTS 2014
FINANCIAL STATEMENTS
Opinion on financial statements of Chemring Group PLC
In our opinion:• the financial statements give a true and fair view of the state of the Group’s and of the
parent company’s affairs as at 31 October 2014 and of the Group’s loss for the year then ended;
• the group financial statements have been properly prepared in accordance with International Financial Reporting Standards (IFRSs) as adopted by the European Union;
• the parent company financial statements have been properly prepared in accordance with United Kingdom Generally Accepted Accounting Practice; and
• the financial statements have been prepared in accordance with the requirements of the Companies Act 2006 and, as regards the group financial statements, Article 4 of the IAS Regulation.
The financial statements comprise the consolidated income statement, the consolidated statement of comprehensive income, the consolidated statement of changes in equity, the consolidated and parent company balance sheets, the consolidated cash flow statement, the parent company reconciliation of movements in shareholders’ funds, the parent company statement of total recognised gains and losses and the related Group notes 1 to 41 and parent company notes 1 to 12. The financial reporting framework that has been applied in the preparation of the group financial statements is applicable law and IFRSs as adopted by the European Union. The financial reporting framework that has been applied in the preparation of the parent company financial statements is applicable law and United Kingdom Accounting Standards (United Kingdom Generally Accepted Accounting Practice).
Going concern As required by the Listing Rules we have reviewed the directors’ statement contained within the strategic report that the Group is a going concern. We confirm that:
• we have concluded that the directors’ use of the going concern basis of accounting in the preparation of the financial statements is appropriate; and
• we have not identified any material uncertainties that may cast significant doubt on the Group’s ability to continue as a going concern.
However, because not all future events or conditions can be predicted, this statement is not a guarantee as to the Group’s ability to continue as a going concern.
Our assessment of risks of material misstatement
The assessed risks of material misstatement described below are those that had the greatest effect on our audit strategy, the allocation of resources in the audit and directing the efforts of the engagement team.
INDEPENDENT AUDITOR’S REPORT TOTHE MEMBERS OF CHEMRING GROUP PLC
STRATEGIC REPORT
GOVERNANCE
FINANCIAL STATEMENTS
OTHER INFORMATION
79CHEMRING GROUP PLCANNUAL REPORT AND ACCOUNTS 2014
Risk How the scope of our audit responded to the risk
Revenue recognition:Refer to page 95 (critical accounting judgements and key sources of estimation uncertainty – assessment of contract accounting); page 90 (accounting policies – revenue recognition); and page 56 (Audit Committee report – significant issues considered).• Subject to meeting specific criteria,
Chemring adopts long-term contract accounting for certain of its contracts. Revenue recognised on this basis in year was £125.2 million. In these circumstances, a number of judgements are undertaken which specifically impact the extent of revenue recognised, such as judgements taken related to the existence of contractual arrangements with customers, the stage of completion, milestone attainment and risks associated with completing the contract.
Our audit work assessed the adequacy of the design and implementation of controls over long-term contract accounting. For a sample of contracts we reviewed the contract risk registers and evidence for progress made against the contract to confirm that revenue and profit recognised to date are based on management’s current best estimate of the degree of contract completion. For new contracts negotiated in the year, we assessed the contractual arrangements in place and challenged the level of risk associated. We verified that the manufactured assets were specific to the contract. We also assessed the extent to which the outcome of the contract could be estimated reliably and obtained adequate support for key judgements taken. We understood and challenged management’s assumptions by referring to evidence including signed contract terms and associated evidence of an arrangement, latest project status reports, and discussing contract progress and future risks with contract engineers. We also critically assessed the reliability of management estimates through consideration of the historical accuracy of prior year management estimates and considering the existence of contradictory evidence.
• Judgements are taken in recognising revenue relating to the delivery of goods, most notably due to the complex contractual and shipping terms with regards to the transfer of risk and reward and the appropriate point at which revenue should be recognised.
Our audit work assessed the adequacy of the design and implementation of controls around revenue recognition. In response to the risk arising from complex contractual terms, we reviewed contractual evidence to understand how the specific terms were recorded and the appropriate revenue recognition policies applied. We then performed a sample test of sales recognised either side of the year end to substantiate that the appropriate terms of the relevant contracts had been followed and that the risks and rewards associated with the contract had passed to the customer. We used external evidence such as shipping documentation or client acceptance documentation to confirm that revenue had been recognised in the appropriate period.
Valuation of goodwill and/or intangibles:Refer to page 95 (critical accounting judgements and key sources of estimation uncertainty – goodwill impairment); page 91 (accounting policies – intangible assets); and page 56 (Audit Committee report – significant issues considered).• The assessment of the valuation
of goodwill arising on historical acquisitions is a judgemental process due to management’s assertions regarding their recoverable amount. The Group recognised goodwill of £119.7 million at 31 October 2014. There are a number of key judgements in determining the recoverable amount, including growth rates in future cash flow forecasts and discount rates applied to these forecasts.
Our audit work assessed the adequacy of the design and implementation of controls over monitoring the carrying value of goodwill. We challenged the assumptions used by management in their annual impairment assessment by benchmarking to independently available data, peer group analysis, by using our understanding of the secured orders underpinning the Group’s short-term cash flow forecasts and our assessment of the longer-term growth rates employed. In addition, valuation specialists within the audit team provided a challenge over the discount rate applied to these cash flows through the use of external data and benchmarking. Having audited the assumptions within management’s annual impairment assessment, we checked the arithmetic accuracy of the impairment model using these assumptions to confirm their conclusions with respect to the recoverability of the carrying value of goodwill and other intangibles.
FINANCIAL STATEMENTS
80 CHEMRING GROUP PLCANNUAL REPORT AND ACCOUNTS 2014
Risk How the scope of our audit responded to the risk
• The valuation of intangibles arising from internal capitalised development costs is judgemental due to management’s assertions regarding their capital nature and their recoverable amount. £33.2 million of such costs have been capitalised at 31 October 2014.
We reviewed the design and implementation of controls over the capture of costs and the ongoing monitoring of capitalised development projects. For significant projects we tested a sample of costs incurred. Additionally we gained an understanding of the project plan and progress made to date through enquiries with non-finance personnel, the status of orders and income, routes to market and the identification of potential customers to help us assess whether carrying values were supportable. This involved a review of documentation with third parties and discussing contract progress, ongoing customer interest and future risks with the commercial and business development team, and allowed us to critically assess the recoverability of the related assets.
Provisioning for taxation requires complex judgements to be taken in respect of the various tax jurisdictions in which the Group operates. The provisions are judgemental as a result of their nature and technical complexity.
Refer to page 95 (critical accounting judgements and key sources of estimation uncertainty – tax); and page 92 (accounting policies – tax).
Our audit work assessed the adequacy of the design and implementation of controls over accounting for taxation. We evaluated the appropriateness of management’s assumptions and estimates in their assessment and valuation of the tax risks within the Group including review of correspondence on the status of tax compliance and tax audits in the various jurisdictions in which the Group operates, and benchmarking against our assessment of the range of potential outcomes in respect of the uncertain tax treatments adopted. We involved tax specialists within the audit team to provide detailed knowledge and expertise in assessing tax treatments in certain jurisdictions.
The appropriateness and completeness of provisions made by management in respect of product failures, environmental matters and legal claims in respect of the outcomes of these issues is subject to judgement. Provisions total £27.0 million at 31 October 2014.
Refer to page 95 (critical accounting judgements and key sources of estimation uncertainty – legal); page 94 (accounting policies – provisions and contingent liabilities); and page 116 (notes to the group financial statements – provisions and contingent liabilities).
Our audit work assessed the adequacy of the design and implementation of controls in relation to provisions. We recalculated and challenged management’s estimates for the provisions in conjunction with our understanding of the potential liability as set out in contract terms.
For product failures, we challenged the level of provisioning by verifying the actual failure costs incurred to date and the products in circulation subject to customer dispute using external evidence, such as correspondence with third parties.
In response to litigation and environmental risks, we circularised the Group’s external legal advisors and held specific discussions with certain external advisors that are providing services to the Group in relation to certain claims, and reviewed legal costs incurred in the year to confirm the completeness of legal cases to which the Group is party. Through external evidence including submitted legal advice and discussion with management, we sought to corroborate the basis for management’s expectations over likely outcomes and their subsequent quantification of the related provisions.
Last year, our report included one other risk which is not included in our report this year: the appropriateness of the going concern principle. In the current year, new funding arrangements were confirmed and business disposal processes were completed that released significant amounts of cash back into the business. Additionally, in last year’s report our risk around judgemental provisions included consideration of the risk in relation to obsolete inventory which is no longer included in our report this year (no significant ‘at risk’ inventory on hand). In the current year, we have extended our goodwill and intangibles risk to address the risk in relation to the valuation of capitalised development costs.
The description of risks above should be read in conjunction with the significant issues considered by the Audit Committee which are detailed on page 56.
Our audit procedures relating to these matters were designed in the context of our audit of the financial statements as a whole, and not to express an opinion on individual accounts or disclosures. Our opinion on the financial statements is not modified with respect to any of the risks described above, and we do not express an opinion on these individual matters.
INDEPENDENT AUDITOR’S REPORTTO THE MEMBERS OF CHEMRING GROUP PLC CONTINUED

STRATEGIC REPORT
GOVERNANCE
FINANCIAL STATEMENTS
OTHER INFORMATION
81CHEMRING GROUP PLCANNUAL REPORT AND ACCOUNTS 2014
Our application of materiality We define materiality as the magnitude of misstatement in the financial statements that makes it probable that the economic decisions of a reasonably knowledgeable person would be changed or influenced. We use materiality both in planning the scope of our audit work and in evaluating the results of our work.
We have used professional judgement in determining an appropriate materiality benchmark. As a result of the business disposals made in the year, ongoing market pressure and the statutory loss before tax from continuing operations, we have included consideration of alternative benchmarks in reaching our conclusion. Aligning more closely with comparable companies, we derived materiality from the underlying pre-tax profit measure reported by the Group that is adjusted to the reported results that management believe is of interest to the users of the financial statements.
On this basis we determined materiality for the Group to be £2.9 million (2013: £5.0 million), which equates to 10% of underlying pre-tax profit (2013: 10%), under 1% of revenue (2013: 1%), 5% of loss before tax (2013: 10%) and under 1% of a significantly larger net asset position (2013: 2%).
We agreed the materiality levels with the Audit Committee following the presentation of our Audit Plan in September 2014, and further agreed that we would report to the Committee all audit differences in excess of £58,000 (2013: £100,000), as well as differences below that threshold that, in our view, warranted reporting on qualitative grounds. We also report to the Audit Committee on disclosure matters that we identified when assessing the overall presentation of the financial statements.
An overview of the scope of our audit
Our Group audit was scoped by obtaining an understanding of the Group and its environment, including Group-wide controls, and assessing the risks of material misstatement at the Group level. Based on that assessment, we focused our Group audit scope primarily on the audit work at 17 locations (2013: 17 locations). 10 (2013: 11) of these were subject to a full audit, whilst the remaining 7 (2013: 6) were subject to either an audit of specified account balances or specified audit procedures where the extent of our testing was based on our assessment of the risks of material misstatement and of the materiality of the Group’s operations at those locations. These 17 locations represent the principal business units and account for 97% (2013: 94%) of the Group’s net assets, 96% (2013: 96%) of the Group’s revenue and 99% (2013: 98%) of the Group’s loss before tax. They were also selected to provide an appropriate basis for undertaking audit work to address the risks of material misstatement identified above. Our audit work at the 17 locations was executed at levels of materiality applicable to each individual entity which were lower than Group materiality and ranged from £0.5 million to £1.9 million (2013: £0.4 million to £3.8 million).
At the parent entity level we also tested the consolidation process and carried out analytical procedures to confirm our conclusion that there were no significant risks of material misstatement of the aggregated financial information of the remaining components not subject to audit or audit of specified account balances.
The Group audit team continued to follow a programme of planned visits that has been designed so that the Senior Statutory Auditor or a senior member of the Group audit team visits each of the locations where the Group audit scope was focused at least once every three years and the most significant of them at least once a year. Every year, regardless of whether we have visited or not, we include the component audit team in our team briefing, direct the scope of their work for the purposes of our Group audit, discuss their local risk assessment, and review documentation of the findings from their work.
The Group has undertaken a number of business disposals in the current year, two of which related to significant components of the Group. For these, we engaged and directed component auditors to perform specified audit procedures in relation to the trading and final balance sheet position of these businesses up to disposal.

FINANCIAL STATEMENTS
82 CHEMRING GROUP PLCANNUAL REPORT AND ACCOUNTS 2014
Opinion on other matters prescribed by the Companies Act 2006
In our opinion:• the part of the directors’ remuneration report to be audited has been properly prepared in
accordance with the Companies Act 2006; and• the information given in the strategic report and the directors’ report for the financial year
for which the financial statements are prepared is consistent with the financial statements.
Matters on which we are required to report by exception
Adequacy of explanations received and accounting records
Under the Companies Act 2006 we are required to report to you if, in our opinion:• we have not received all the information and explanations we require for our audit; or• adequate accounting records have not been kept by the parent company, or returns adequate
for our audit have not been received from branches not visited by us; or• the parent company financial statements are not in agreement with the accounting records
and returns.
We have nothing to report in respect of these matters.
Directors’ remuneration Under the Companies Act 2006 we are also required to report if in our opinion certain disclosures of directors’ remuneration have not been made or the part of the directors’ remuneration report to be audited is not in agreement with the accounting records and returns.
We have nothing to report arising from these matters.
Corporate governance statement Under the Listing Rules we are also required to review the part of the corporate governance statement relating to the company’s compliance with ten provisions of the UK Corporate Governance Code. We have nothing to report arising from our review.
Our duty to read other information in the annual report
Under International Standards on Auditing (UK and Ireland), we are required to report to you if, in our opinion, information in the annual report is:• materially inconsistent with the information in the audited financial statements; or• apparently materially incorrect based on, or materially inconsistent with, our knowledge of the
Group acquired in the course of performing our audit; or• otherwise misleading.
In particular, we are required to consider whether we have identified any inconsistencies between our knowledge acquired during the audit and the directors’ statement that they consider the annual report is fair, balanced and understandable, and whether the annual report appropriately discloses those matters that we communicated to the Audit Committee which we consider should have been disclosed. We confirm that we have not identified any such inconsistencies or misleading statements.
Respective responsibilities of directors and auditor
As explained more fully in the directors’ responsibilities statement, the directors are responsible for the preparation of the financial statements and for being satisfied that they give a true and fair view. Our responsibility is to audit and express an opinion on the financial statements in accordance with applicable law and International Standards on Auditing (UK and Ireland). Those standards require us to comply with the Auditing Practices Board’s Ethical Standards for Auditors. We also comply with International Standard on Quality Control 1 (UK and Ireland). Our audit methodology and tools aim to ensure that our quality control procedures are effective, understood and applied. Our quality controls and systems include our dedicated professional standards review team and independent partner reviews.
This report is made solely to the Company’s members, as a body, in accordance with Chapter 3 of Part 16 of the Companies Act 2006. Our audit work has been undertaken so that we might state to the Company’s members those matters we are required to state to them in an auditor’s report and for no other purpose. To the fullest extent permitted by law, we do not accept or assume responsibility to anyone other than the Company and the Company’s members as a body, for our audit work, for this report, or for the opinions we have formed.
INDEPENDENT AUDITOR’S REPORT TO THE MEMBERS OF CHEMRING GROUP PLC CONTINUED
STRATEGIC REPORT
GOVERNANCE
FINANCIAL STATEMENTS
OTHER INFORMATION
83CHEMRING GROUP PLCANNUAL REPORT AND ACCOUNTS 2014
Matters on which we are required to report by exception
Scope of the audit of the financial statements
An audit involves obtaining evidence about the amounts and disclosures in the financial statements sufficient to give reasonable assurance that the financial statements are free from material misstatement, whether caused by fraud or error. This includes an assessment of: whether the accounting policies are appropriate to the Group’s and the parent company’s circumstances and have been consistently applied and adequately disclosed; the reasonableness of significant accounting estimates made by the directors; and the overall presentation of the financial statements. In addition, we read all the financial and non-financial information in the annual report to identify material inconsistencies with the audited financial statements and to identify any information that is apparently materially incorrect based on, or materially inconsistent with, the knowledge acquired by us in the course of performing the audit. If we become aware of any apparent material misstatements or inconsistencies we consider the implications for our report.
Anna Marks (Senior Statutory Auditor)for and on behalf of Deloitte LLPChartered Accountants and Statutory AuditorReading, United Kingdom22 January 2015
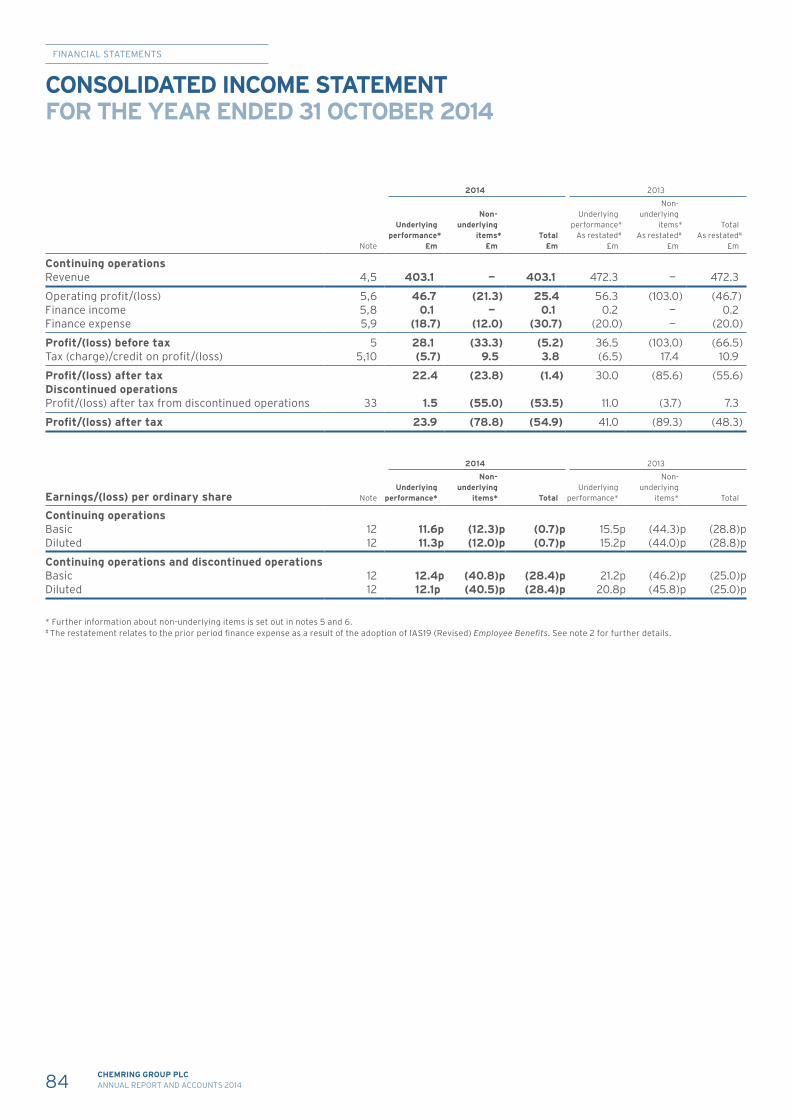
FINANCIAL STATEMENTS
84 CHEMRING GROUP PLCANNUAL REPORT AND ACCOUNTS 2014
CONSOLIDATED INCOME STATEMENT FOR THE YEAR ENDED 31 OCTOBER 2014
2014 2013
Note
Underlyingperformance*
£m
Non-underlying
items*£m
Total£m
Underlyingperformance* As restated#
£m
Non-underlying
items*As restated#
£m
TotalAs restated#
£m
Continuing operationsRevenue 4,5 403.1 — 403.1 472.3 — 472.3
Operating profit/(loss) 5,6 46.7 (21.3) 25.4 56.3 (103.0) (46.7)Finance income 5,8 0.1 — 0.1 0.2 — 0.2Finance expense 5,9 (18.7) (12.0) (30.7) (20.0) — (20.0)
Profit/(loss) before tax 5 28.1 (33.3) (5.2) 36.5 (103.0) (66.5)Tax (charge)/credit on profit/(loss) 5,10 (5.7) 9.5 3.8 (6.5) 17.4 10.9
Profit/(loss) after tax 22.4 (23.8) (1.4) 30.0 (85.6) (55.6)Discontinued operationsProfit/(loss) after tax from discontinued operations 33 1.5 (55.0) (53.5) 11.0 (3.7) 7.3
Profit/(loss) after tax 23.9 (78.8) (54.9) 41.0 (89.3) (48.3)
2014 2013
Earnings/(loss) per ordinary share NoteUnderlying
performance*
Non-underlying
items* TotalUnderlying
performance*
Non-underlying
items* Total
Continuing operationsBasic 12 11.6p (12.3)p (0.7)p 15.5p (44.3)p (28.8)pDiluted 12 11.3p (12.0)p (0.7)p 15.2p (44.0)p (28.8)p
Continuing operations and discontinued operationsBasic 12 12.4p (40.8)p (28.4)p 21.2p (46.2)p (25.0)pDiluted 12 12.1p (40.5)p (28.4)p 20.8p (45.8)p (25.0)p
* Further information about non-underlying items is set out in notes 5 and 6.# The restatement relates to the prior period finance expense as a result of the adoption of IAS19 (Revised) Employee Benefits. See note 2 for further details.
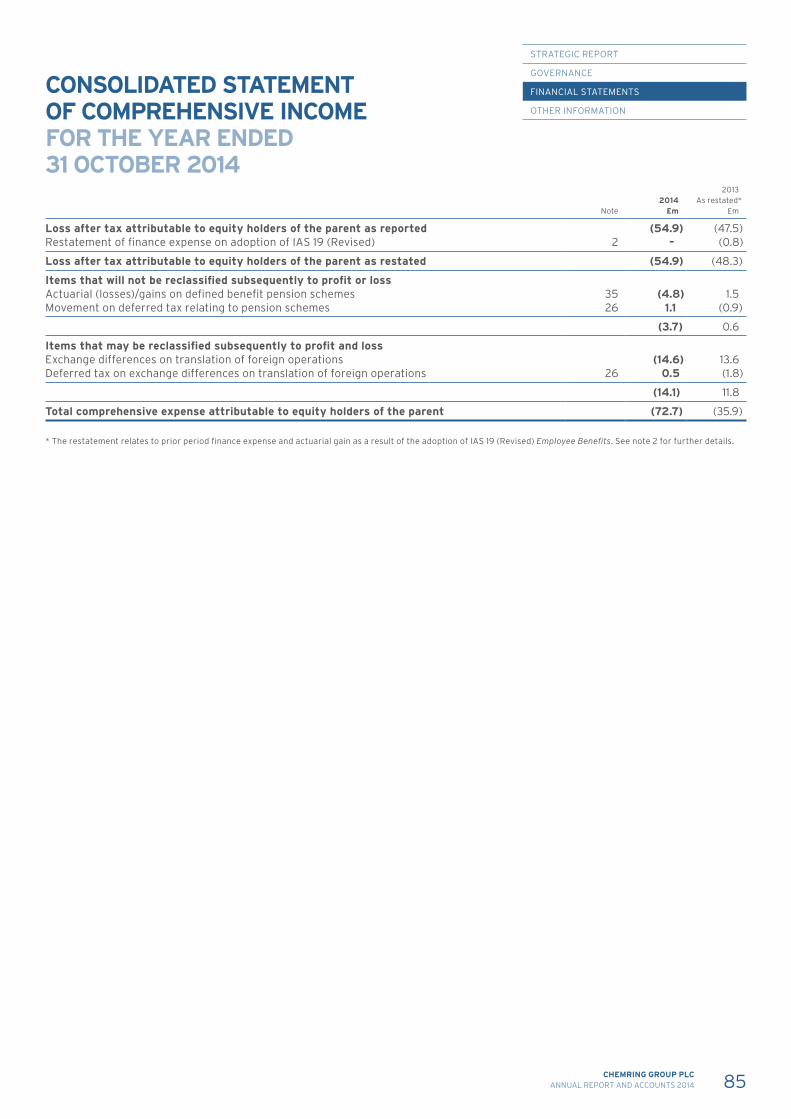
STRATEGIC REPORT
GOVERNANCE
FINANCIAL STATEMENTS
OTHER INFORMATION
85CHEMRING GROUP PLCANNUAL REPORT AND ACCOUNTS 2014
CONSOLIDATED STATEMENT OF COMPREHENSIVE INCOME FOR THE YEAR ENDED 31 OCTOBER 2014
Note2014
£m
2013As restated*
£m
Loss after tax attributable to equity holders of the parent as reported (54.9) (47.5)Restatement of finance expense on adoption of IAS 19 (Revised) 2 – (0.8)
Loss after tax attributable to equity holders of the parent as restated (54.9) (48.3)
Items that will not be reclassified subsequently to profit or lossActuarial (losses)/gains on defined benefit pension schemes 35 (4.8) 1.5Movement on deferred tax relating to pension schemes 26 1.1 (0.9)
(3.7) 0.6
Items that may be reclassified subsequently to profit and lossExchange differences on translation of foreign operations (14.6) 13.6Deferred tax on exchange differences on translation of foreign operations 26 0.5 (1.8)
(14.1) 11.8
Total comprehensive expense attributable to equity holders of the parent (72.7) (35.9)
* The restatement relates to prior period finance expense and actuarial gain as a result of the adoption of IAS 19 (Revised) Employee Benefits. See note 2 for further details.
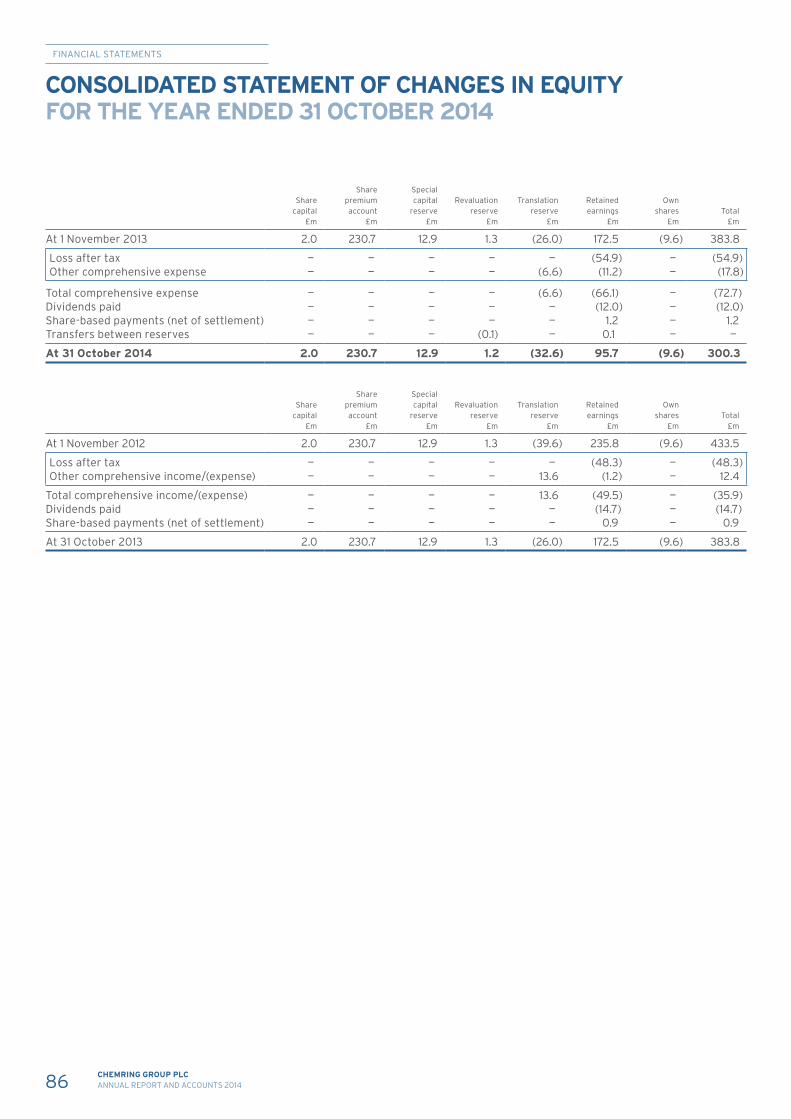
FINANCIAL STATEMENTS
86 CHEMRING GROUP PLCANNUAL REPORT AND ACCOUNTS 2014
CONSOLIDATED STATEMENT OF CHANGES IN EQUITY FOR THE YEAR ENDED 31 OCTOBER 2014
Sharecapital
£m
Share premium account
£m
Specialcapital
reserve£m
Revaluation reserve
£m
Translation reserve
£m
Retained earnings
£m
Ownshares
£mTotal
£m
At 1 November 2013 2.0 230.7 12.9 1.3 (26.0) 172.5 (9.6) 383.8
Loss after tax — — — — — (54.9) — (54.9)Other comprehensive expense — — — — (6.6) (11.2) — (17.8)
Total comprehensive expense — — — — (6.6) (66.1) — (72.7)Dividends paid — — — — — (12.0) — (12.0)Share-based payments (net of settlement) — — — — — 1.2 — 1.2Transfers between reserves — — — (0.1) — 0.1 — —
At 31 October 2014 2.0 230.7 12.9 1.2 (32.6) 95.7 (9.6) 300.3
Sharecapital
£m
Share premium account
£m
Special capital
reserve£m
Revaluation reserve
£m
Translation reserve
£m
Retained earnings
£m
Ownshares
£mTotal
£m
At 1 November 2012 2.0 230.7 12.9 1.3 (39.6) 235.8 (9.6) 433.5
Loss after tax — — — — — (48.3) — (48.3)Other comprehensive income/(expense) — — — — 13.6 (1.2) — 12.4
Total comprehensive income/(expense) — — — — 13.6 (49.5) — (35.9)Dividends paid — — — — — (14.7) — (14.7)Share-based payments (net of settlement) — — — — — 0.9 — 0.9
At 31 October 2013 2.0 230.7 12.9 1.3 (26.0) 172.5 (9.6) 383.8

STRATEGIC REPORT
GOVERNANCE
FINANCIAL STATEMENTS
OTHER INFORMATION
87CHEMRING GROUP PLCANNUAL REPORT AND ACCOUNTS 2014
STRATEGIC REPORT
GOVERNANCE
FINANCIAL STATEMENTS
OTHER INFORMATION
CONSOLIDATED BALANCE SHEET AS AT 31 OCTOBER 2014
2014 2013
Note £m £m £m £m
Non-current assetsGoodwill 13 119.7 168.3Development costs 14 33.2 32.7Other intangible assets 14 85.9 135.5Property, plant and equipment 15 177.1 222.3Interest in associate 17 — 1.5Deferred tax 26 31.9 21.7
447.8 582.0
Current assetsInventories 18 78.1 113.7Trade and other receivables 19 90.7 203.9Cash and cash equivalents 20,38 21.8 14.2Derivative financial instruments 24 0.7 1.5Assets held for sale 34 — 6.7
191.3 340.0
Total assets 639.1 922.0
Current liabilitiesBorrowings 21,38 (0.3) (0.4)Obligations under finance leases 21,22 (1.0) (1.6)Trade and other payables 23 (86.0) (176.7)Provisions 25 (2.9) (2.7)Current tax (6.7) (15.4)Derivative financial instruments 24 (1.7) (0.4)Liabilities held for sale 34 — (1.1)
(98.6) (198.3)
Non-current liabilitiesBorrowings 21,38 (155.6) (259.4)Obligations under finance leases 21,22 (0.4) (1.4)Trade and other payables 23 (2.0) (2.3)Provisions 25 (24.1) (10.3)Deferred tax 26 (35.5) (38.8)Preference shares 21,27 (0.1) (0.1)Retirement benefit obligations 35 (21.8) (25.1)Derivative financial instruments 24 (0.7) (2.5)
(240.2) (339.9)
Total liabilities (338.8) (538.2)
Net assets 300.3 383.8
EquityShare capital 27 2.0 2.0Share premium account 230.7 230.7Special capital reserve 12.9 12.9Revaluation reserve 1.2 1.3Translation reserve (32.6) (26.0)Retained earnings 95.7 172.5
309.9 393.4Own shares 29 (9.6) (9.6)
Equity attributable to equity holders of the parent 300.3 383.8
Total equity 300.3 383.8
These financial statements of Chemring Group PLC (registered number 86662) were approved and authorised for issue by the Board of directors on 22 January 2015.
Signed on behalf of the Board
Michael Flowers Steve Bowers Director Director

FINANCIAL STATEMENTS
88 CHEMRING GROUP PLCANNUAL REPORT AND ACCOUNTS 2014
FINANCIAL STATEMENTS
CONSOLIDATED CASH FLOW STATEMENT FOR THE YEAR ENDED 31 OCTOBER 2014
Note2014
£m2013
£m
Cash flows from operating activitiesCash generated from continuing underlying operations 36 45.9 80.5Cash generated from discontinued underlying operations 33,36 17.6 (11.9)
Cash generated from underlying operations 36 63.5 68.6Acquisition and disposal related costs 32 (7.5) (3.8)Business restructuring and incident costs 5 (6.4) (8.9)
49.6 55.9Tax paid (3.4) (0.5)
Net cash inflow from operating activities 46.2 55.4
Cash flows from investing activitiesPurchases of intangible assets (12.1) (7.4)Purchases of property, plant and equipment (10.9) (12.3)Receipt of finance income 0.2 0.2Receipts from sales of businesses, net of cash transferred 17,33 137.1 —Acquisition of subsidiary undertaking, net of cash acquired (1.4) —Proceeds on disposal of property, plant and equipment 0.4 —
Net cash inflow/(outflow) from investing activities 113.3 (19.5)
Cash flows from financing activitiesDividends paid 11 (12.0) (14.7)Finance expense paid (32.8) (20.6)Capitalised facility fees paid (2.8) (1.7)Repayments of borrowings (102.1) (79.1)Repayments of finance leases (1.6) (1.7)
Net cash outflow from financing activities (151.3) (117.8)
Increase/(decrease) in cash and cash equivalents 8.2 (81.9)Cash and cash equivalents at beginning of year 14.2 96.0Effect of foreign exchange rate changes (0.6) 0.1
Cash and cash equivalents at end of year 20,38 21.8 14.2
STRATEGIC REPORT
GOVERNANCE
FINANCIAL STATEMENTS
OTHER INFORMATION
89CHEMRING GROUP PLCANNUAL REPORT AND ACCOUNTS 2014
STRATEGIC REPORT
GOVERNANCE
FINANCIAL STATEMENTS
OTHER INFORMATION
NOTES TO THE GROUP FINANCIAL STATEMENTS
1. General informationChemring Group PLC is a company incorporated in England and Wales under registration number 86662. The address of the registered office is Roke Manor, Old Salisbury Lane, Romsey, Hampshire, SO51 0ZN. The nature of the Group’s operations and its principal activities are set out in note 5 and in the directors’ report on pages 44 to 47. These financial statements are the consolidated financial statements of Chemring Group PLC and its subsidiaries (the “Group”).
The financial statements are presented in pounds sterling and rounded to the nearest £0.1 million. Foreign operations are included in accordance with the policy set out in note 3.
Going concern The directors have, at the time of approving the financial statements, a reasonable expectation that the Group and the Company have adequate resources to continue to adopt the going concern basis of accounting in preparing these financial statements. Further detail is contained in the statement on going concern on page 27.
2. Adoption of new and revised standardsIn the year ended 31 October 2014, the following revised standard was adopted and has affected the amounts reported in these financial statements:
• Amendments to IAS19 (Revised) Employee Benefits.
The interest cost and expected return on defined benefit pension schemes assets used in the previous version of IAS 19 are replaced with a ‘net interest’ amount, which is calculated by applying a discount rate to the net defined benefit liability or asset. Furthermore, IAS 19 (Revised) also introduces more extensive disclosures in the presentation of the defined benefit cost, including the separate disclosure of the schemes’ administrative expenses. To aid comparison, the consolidated financial statements and affected notes for the year ended 31 October 2013 have been restated as if IAS 19 (Revised) had always applied during that year.
In the year ended 31 October 2013, the effect of adopting IAS 19 (Revised) was a decrease in the expected return on pension scheme assets of £0.8 million, with a corresponding increase in the actuarial gain. The impact on profit for the year was an increase in finance expense of £0.8 million and an increase in loss after tax of £0.8 million. The impact on the consolidated statement of comprehensive income was an increase in the loss after tax attributable to equity holders of the parent of £0.8 million and an increase in the actuarial gains on defined benefit pension schemes of £0.8 million. The total comprehensive expense attributable to equity holders of the parent and the balance sheet is unaffected.
The effect on basic and underlying earnings per share was a decrease of 0.4p. There was no effect on net cash flow from operations as a result of the change in accounting policy.
The following International Financial Reporting Committee (“IFRIC”) interpretations, amendments to existing standards and new standards were adopted in the year ended 31 October 2014 but have not impacted the reported results or the financial position:
• IFRS 1 (amended) Government Loans;• IFRS 7 (amended) Disclosures Offsetting Financial Assets and
Financial Liabilities;• IFRS 10 Consolidated Financial Statements;• IFRS 11 Joint Arrangements;• IFRS 12 Investment Entities;• IAS 28 (Revised) Investment in Associated and Joint Ventures;• IFRS 13 Fair Value Measurement; • IAS 12 (amended) Deferred Tax Recovery of Underlying Assets; and• Annual Improvements to IFRSs (2009-2011) Cycle.
Changes in accounting policiesAt the date of authorisation of these financial statements, the following standards and interpretations that are potentially relevant to the Group and which have not been applied in these financial statements were in issue but not yet effective (and in some cases had not yet been adopted by the European Union):
• IFRS 9 Financial Instruments Novation of Derivatives and Continuation of Hedge Accounting;
• IFRS 10 (amended) and IFRS 12 (amended) Amendments Regarding the Application of the Consolidation Exception;
• IFRS 11 (amended) Accounting for Acquisitions of an Interest in a Joint Operation;
• IFRS 15 Revenue from Contracts with Customers;• IAS 32 (amended) Offsetting Assets and Liabilities;• IAS 36 (amended) Recoverable Amounts Disclosure for
Non-Financial Assets; • IAS 39 (amended) Novations of Derivatives;• Annual Improvements to IFRSs (2010-2012) Cycle;• Annual Improvements to IFRSs (2011-2013) Cycle;• Annual Improvements to IFRSs (September 2014); and• IFRIC Interpretation 21 Levies.
The directors do not expect the adoption of these standards and interpretations will have a material impact on the financial statements of the Group in future periods except as follows:
• IFRS 9 Financial Instruments will impact both the measurement and disclosure of financial instruments; and
• IFRS 15 Revenue from Contracts with Customers will impact the validity and timing of revenue recognised under contract accounting. This may particularly affect contracts with variable consideration or specific contract terms allowing the customer to modify or curtail its requirements.
Beyond this information, it is not practicable to provide a reasonable estimate of the effect of these standards until a detailed review has been completed.
3. Accounting policiesBasis of preparationThese financial statements have been prepared in accordance with IFRS adopted for use in the EU. These will be those IAS, IFRS and related IFRIC interpretations, subsequent amendments to those standards and related interpretations, future standards and related interpretations issued or adopted by the International Accounting Standards Board (“IASB”) that have been endorsed by the European Commission (collectively referred to as IFRS). These are subject to ongoing review and endorsement by the European Commission or possible amendment by interpretive guidance from the IASB and the IFRIC, and are therefore still subject to change.
FINANCIAL STATEMENTS
90 CHEMRING GROUP PLCANNUAL REPORT AND ACCOUNTS 2014
FINANCIAL STATEMENTS
Basis of accountingThe financial statements have been prepared in accordance with IFRS adopted by the European Union and therefore the group financial statements comply with Article 4 of the EU IAS Regulation. The particular accounting policies adopted have been applied consistently throughout the current and previous years and are described below.
Accounting conventionThe financial statements are prepared under the historical cost convention, except for the revaluation of certain properties and financial instruments.
Basis of consolidationThe group financial statements consolidate those of the Company and all of its subsidiaries. A subsidiary undertaking is an entity over which the Group has the power to govern the financial and operating policies so as to obtain benefits from its activities. The results of subsidiaries acquired are consolidated from the date on which control passes to the Group and the results of disposed subsidiaries are consolidated up to the date on which control passes from the Group.
The Company considers that it has the power to govern the financial and operating policies of the US entities falling within the Special Security Agreement, details of which are set out in the corporate governance report, and these entities have therefore been consolidated in these financial statements.
The Company and all of its subsidiaries make up their financial statements to the same date. All intra–group transactions, balances, income and expenses are eliminated on consolidation.
Operating profitOperating profit is stated before the share of results of associates and before finance income and expense. The use of underlying measures, in addition to total measures, is considered by the Board to improve comparability of business performance between periods. Underlying measures referred to are stated before costs relating to acquisitions and disposals, business restructuring and incident costs, profit/loss on disposal of businesses, items deemed to be of an exceptional nature, impairment of goodwill and acquired intangibles, impairment of assets held for sale, amortisation of acquired intangibles and gains/losses on the movement in the fair value of derivative financial instruments.
Revenue recognitionRevenue is measured at the fair value of the consideration received or receivable and represents amounts receivable for goods and services provided in the normal course of business, net of discounts, VAT and other revenue-related taxes.
Sale of goodsRevenue from the sale of goods is recognised when all of the following conditions are satisfied:
• the Group has transferred to the buyer the significant risks and rewards of ownership, typically on formal acceptance;
• the Group retains neither continuing managerial involvement to the degree usually associated with ownership nor effective control over the goods sold;
• the amount of revenue can be measured reliably;• it is probable that the economic benefits associated with
the transaction will flow to the Group; and• the costs incurred or to be incurred in respect of the
transaction can be measured reliably.
Rendering of servicesRevenue from a contract to provide services is recognised by reference to the stage of completion of the contract. Stage of completion is typically estimated by either completion of relevant milestones or proportion of contract costs incurred for work performed to date, as appropriate.
Contract accountingContract accounting may be applied to appropriate contracts that are significantly large, built specifically for a particular customer order and have expected production duration of over twelve months.
When the outcome can be estimated reliably, revenue and costs are recognised by reference to the stage of completion at the balance sheet date. This is normally measured by the proportion of contract costs incurred for work performed to date against the estimated total contract costs, except where this would not be representative of the actual stage of completion. Variations in contract work, claims and incentive payments are included to the extent that the amounts can be measured reliably and their receipt is considered probable.
When the outcome of such contracts cannot be estimated reliably, contract revenue is recognised to the extent of contract costs incurred where it is probable they will be recoverable. Contract costs are recognised as expenses in the period in which they are incurred. When it is probable that total contract costs will exceed total contract revenue, the expected loss is recognised as an expense immediately.
Investment incomeDividend income from investments is recognised when the shareholders’ rights to receive payment have been established, provided that the economic benefits will flow to the Group and the amount of income can be measured reliably.
Interest income is recognised when it is probable that the economic benefits will flow to the Group and the amount of income can be measured reliably. Interest income is accrued on a time basis, by reference to the principal outstanding and at the effective interest rate applicable, which is the rate that exactly discounts estimated future cash receipts through the expected life of the financial asset to that asset’s net carrying amount on initial recognition.
Acquisitions and disposals On acquisition of a subsidiary, associate or jointly controlled entity, the cost is measured as the fair value of the consideration. The assets, liabilities and contingent liabilities of subsidiary undertakings that meet the IFRS 3 (Revised) Business Combinations recognition criteria are measured at the fair value at the date of acquisition, except that:
3. Accounting policies continued
NOTES TO THE GROUP FINANCIAL STATEMENTS CONTINUED
STRATEGIC REPORT
GOVERNANCE
FINANCIAL STATEMENTS
OTHER INFORMATION
91CHEMRING GROUP PLCANNUAL REPORT AND ACCOUNTS 2014
STRATEGIC REPORT
GOVERNANCE
FINANCIAL STATEMENTS
OTHER INFORMATION
• deferred tax assets or liabilities, and liabilities or assets relating to employee benefit arrangements, are recognised and measured in accordance with IAS 12 Income Taxes and IAS 19 (Revised) Employee Benefits respectively;
• liabilities or equity instruments related to the replacement by the Group of an acquiree’s share–based payment awards are measured in accordance with IFRS 2 Share–based Payments; and
• assets (or disposal groups) that are classified as held for sale, in accordance with IFRS 5 Non–current Assets Held for Sale and Discontinued Operations, are measured in accordance with that standard.
Where cost exceeds fair value of the net assets acquired, the difference is recorded as goodwill.
Where the fair value of the net assets exceeds the cost, the difference is recorded directly in the income statement. The accounting policies of subsidiary undertakings are changed where necessary to be consistent with those of the Group.
If the initial accounting for a business combination is incomplete by the end of the reporting period in which the combination occurs, the Group reports provisional amounts for the items for which the accounting is incomplete. Those provisional amounts are adjusted during the measurement period (see below), or additional assets or liabilities recognised, to reflect new information obtained about facts and circumstances that existed as at the acquisition date that, if known, would have affected the amounts recognised as at that date.
The measurement period runs from the date of acquisition to the date the Group obtains complete information about facts and circumstances that existed as at the acquisition date, subject to a maximum period of one year.
In accordance with IFRS 3 (Revised) Business Combinations, acquisition costs are expensed through the income statement. Acquisition and disposal related costs refer to external costs incurred in acquiring and disposing of companies, together with the costs of aborted bids and the establishment of joint ventures.
Non–current assets held for sale Non–current assets and disposal groups classified as held for sale are measured at the lower of carrying amount and fair value less costs to sell.
Non–current assets and disposal groups are classified as held for sale if their carrying amount will be recovered through a sale transaction rather than through continuing use. This condition is regarded as met only when the sale is highly probable and the asset or disposal group is available for immediate sale in its present condition. Management must be committed to the sale, which should be expected to qualify for recognition as a completed sale within one year from the date of classification.
Intangible assetsGoodwillThe purchased goodwill of the Group is regarded as having an indefinite useful economic life and, in accordance with IAS 36 Impairment of Assets, is not amortised but is subject to annual tests for impairment. On disposal of a subsidiary, associate or
jointly controlled entity, the amount attributable to goodwill is included in the determination of the profit or loss on disposal.
Acquired intangibles For acquisitions after 1 November 2004, the Group recognises separately from goodwill, intangible assets that are separable or arise from contractual or other legal rights and whose fair value can be measured reliably. These intangible assets are amortised at rates calculated to write down their cost or valuation to their estimated residual values by equal instalments over their estimated useful economic lives, which are:
• technology – average of ten years • customer relationships – average of ten years • order books – average of two years
Development costs Development costs that qualify as intangible assets are capitalised as incurred and, once the relevant intangible asset is ready for use, are amortised on a straight–line basis over their estimated useful lives, averaging five years (2013: three years).
The carrying value of development assets is assessed for recoverability at least annually or when a trigger is identified.
Patents and licences Patents and licences are measured initially at purchase cost and are amortised on a straight–line basis over their estimated useful lives, averaging seven years (2013: seven years).
Property, plant and equipment Other than historically revalued land and buildings, property, plant and equipment is held at cost less accumulated depreciation and any recognised impairment loss. Borrowing costs on significant capital expenditure projects are capitalised and allocated to the cost of the project.
No depreciation is provided on freehold land. On other assets, depreciation is provided at rates calculated to write down their cost or valuation to their estimated residual values by equal instalments over their estimated useful economic lives, which are:
• freehold buildings – up to fifty years• leasehold buildings – the period of the lease• plant and equipment – up to ten years
Investments in associatesThe results and the assets and liabilities of associates are accounted for using the equity method of accounting. Any excess of the cost of investment over the Group’s share of the fair value of identifiable assets and liabilities within the associate at the date of acquisition is accounted for as goodwill that is included in the carrying value of the investment and is assessed for impairment as part of that investment.
Impairment of non–current assetsAssets that have indefinite lives are allocated to the Group’s cash–generating units and tested for impairment at least annually. Assets that are subject to depreciation or amortisation are reviewed for impairment whenever changes in circumstances indicate that the carrying value may not be recoverable. To the extent that the carrying value exceeds the recoverable amount,
3. Accounting policies continued
FINANCIAL STATEMENTS
92 CHEMRING GROUP PLCANNUAL REPORT AND ACCOUNTS 2014
FINANCIAL STATEMENTS
an impairment loss is recorded for the difference as an expense in the income statement. The recoverable amount used for impairment testing is the higher of the value–in–use and the asset’s fair value less costs of disposal. For the purpose of impairment testing, assets are grouped at the lowest levels for which there are separately identifiable cash flows.
InventoriesInventories are recorded at the lower of cost and net realisable value. Cost represents materials, direct labour, other direct costs and related production overheads, and is determined using the “first–in, first–out” (“FIFO”) method. Net realisable value is based on estimated selling price, less further costs expected to be incurred to completion and disposal.
Provision is made for slow-moving, obsolete and defective items where appropriate.
Borrowing costsBorrowing costs directly attributable to the acquisition, construction or production of qualifying assets, which are assets that necessarily take a substantial period of time to prepare for their intended use, are added to the cost of those assets, until such time as the assets are ready for their intended use. Once the assets are ready for their intended use, these capitalised borrowing costs are depreciated in line with the underlying asset.
All other borrowing costs are recognised in the income statement in the period in which they are incurred.
Government grantsGovernment grants are not recognised until there is reasonable assurance that the Group will comply with the conditions attaching to them and that the grants will be received.
The benefit of a government loan at a below–market rate of interest is treated as a government grant, measured as the difference between proceeds received and the fair value of the loan based on prevailing market interest rates.
Government grants for staff retraining costs are recognised as income over the periods necessary to match them with the related costs and are deducted in reporting the related expense.
Government grants relating to property, plant and equipment are treated as deferred income and released to the income statement over the expected useful economic lives of the assets concerned.
TaxThe tax expense represents the sum of current tax and deferred tax.
Current tax is based on taxable profit for the year. Taxable profit differs from profit as reported in the income statement because it excludes items of income or expense that are taxable or deductible in other years, and it excludes items of income or expense that are never taxable or deductible. The Group’s liability for current tax is calculated using tax rates that have been enacted or substantively enacted at the balance sheet date.
Deferred tax represents amounts expected to be payable or recoverable on differences between the carrying amounts of assets and liabilities in the financial statements and the corresponding tax bases used in the computation of taxable profit, and is accounted for using the balance sheet liability method. Deferred tax liabilities are generally recognised for all taxable temporary differences, and deferred tax assets are recognised to the extent that it is probable taxable profits will be available in the future against which deductible temporary differences can be utilised. Such assets and liabilities are not recognised if the temporary difference arises from goodwill or from the initial recognition (other than in a business combination) of other assets and liabilities in a transaction that affects neither the taxable profit nor the accounting profit.
Deferred tax liabilities are recognised for taxable temporary differences arising on investments in subsidiaries and associates, and interests in joint ventures, except where the Group is able to control the reversal of the temporary difference and it is probable that the temporary difference will not reverse in the foreseeable future.
The carrying amount of deferred tax assets is reviewed at each balance sheet date and reduced to the extent that it is no longer probable that sufficient taxable profits will be available to allow all or part of the asset to be recovered. Deferred tax is calculated at the tax rates that are expected to apply in the period when the liability is settled or the asset is realised. Deferred tax is charged or credited in the income statement, except where it relates to items charged or credited directly to equity, in which case the deferred tax is also dealt with in equity.
Deferred tax assets and liabilities are offset when there is a legally enforceable right to set off current tax assets against current tax liabilities, when they relate to income taxed by the same tax authority, and when the Group intends to settle its current tax assets and liabilities on a net basis.
Special capital reserve The special capital reserve was created as part of a capital reduction scheme involving the cancellation of the share premium account which was approved by the Court in 1986, in accordance with the requirements of the Companies Act 1985.
Foreign currencies The individual financial statements of each Group company are presented in its functional currency, being the currency of the primary economic environment in which it operates. For the purpose of these group financial statements, the results and financial position of each Group company are expressed in pounds sterling, which is the functional currency of the Company, and the presentation currency for these financial statements.
In preparing the financial statements of each Group company, transactions in foreign currencies, being currencies other than the entity’s functional currency, are recorded at the rates of exchange prevailing on the dates of the transactions. At each balance sheet date, monetary assets and liabilities that are denominated in foreign currencies are retranslated at the rates prevailing on the balance sheet date. Non–monetary items carried at fair value that are denominated in foreign currencies are translated at the rates prevailing at the date when the fair value
3. Accounting policies continued
NOTES TO THE GROUP FINANCIAL STATEMENTS CONTINUED
STRATEGIC REPORT
GOVERNANCE
FINANCIAL STATEMENTS
OTHER INFORMATION
93CHEMRING GROUP PLCANNUAL REPORT AND ACCOUNTS 2014
STRATEGIC REPORT
GOVERNANCE
FINANCIAL STATEMENTS
OTHER INFORMATION
was determined. Non–monetary items that are measured in terms of historical cost in a foreign currency are not retranslated.
Exchange differences arising on the settlement of monetary items and on the retranslation of monetary items are included in the income statement for the period.
In order to hedge its exposure to certain foreign exchange risks, the Group enters into forward foreign exchange contracts and forward currency structures which are accounted for as derivative financial instruments (see below for details of the Group’s accounting policies in respect of such derivative financial instruments).
For the purpose of presenting these financial statements, the assets and liabilities of the Group’s foreign operations are translated at exchange rates prevailing on the balance sheet date. Income and expense items are translated at the average exchange rates for the period.
Goodwill and fair value adjustments arising on the acquisition of a foreign entity are treated as assets and liabilities of the foreign entity and translated at the closing rate.
Financial instruments Financial assets and liabilities are recognised on the Group’s balance sheet when the Group becomes a party to the contractual provisions of the instrument.
Financial assets Trade receivablesTrade receivables do not carry any interest and are stated at their nominal value as reduced by appropriate allowances for estimated irrecoverable amounts.
Cash and cash equivalents Cash and cash equivalents comprise cash on hand and demand deposits, and other short–term highly liquid investments that are readily convertible to a known amount of cash and are subject to an insignificant risk of change in value.
Financial liabilities and derivative financial instruments Financial liabilities Financial liabilities and equity instruments are classified according to the substance of the contractual arrangements entered into.
Bank borrowings Interest bearing bank loans and overdrafts are recorded at the proceeds received, net of direct issue costs. Finance charges, including premiums payable on settlement or redemption, and direct issue costs are accounted for on an accruals basis in the income statement using the effective interest method, and are added to the carrying amount of the instrument to the extent that they are not settled in the period in which they arise.
Trade payablesTrade payables are not interest bearing and are stated at their nominal value.
Derivative financial instruments and hedge accountingThe Group’s activities expose it to the financial risks of interest rate and foreign currency transactions, and it uses derivative financial instruments to hedge its exposure to these transactional risks. The Group uses interest rate swap contracts and forward foreign exchange contracts to reduce these exposures. The Group does not use derivative financial instruments for speculative purposes.
Derivative financial instruments are recognised at fair value on the date the derivative contract is entered into and are revalued to fair value at each balance sheet date. The method by which any gain or loss is recognised depends on whether the instrument is designated a hedging instrument or not. To be designated as a hedging instrument, the instrument must be documented as such at inception, and must be assessed at inception and on an ongoing basis to be highly effective in offsetting changes in fair values or cash flows of hedged items.
Hedge accounting principles are used for forward foreign exchange contracts and interest rate swap contracts where appropriate, with movements in fair value taken to equity for cash flow hedges and to the income statement for fair value hedges, until such time as the underlying amounts of the contract mature. At maturity or disposal of the net investment, the amounts held in equity will be recycled to the income statement. Changes in fair value of any ineffective portion of net investment hedges and interest rate swap contracts are recognised in the income statement immediately. The fair values of derivative financial instruments are calculated by third party valuers.
Where derivative financial instruments do not meet the criteria for hedge accounting, the changes in fair value are immediately recognised in the income statement.
Hedges of net investments in foreign operationsAny gain or loss on the hedging instrument relating to the effective portion of the hedge is recognised in the statement of comprehensive income and accumulated in the translation reserve. The gain or loss relating to the ineffective portion is recognised immediately in the income statement.
Embedded derivative financial instrumentsEmbedded derivative financial instruments that are not closely related to the host contract are treated as separate derivative financial instruments, with unrealised gains and losses reported in the income statement.
Retirement benefit costsPayments to defined contribution retirement benefit schemes are charged as an administrative expense in the period to which they relate. For defined benefit schemes, the cost of providing benefits is determined using the projected unit credit method, with actuarial valuations being carried out at each balance sheet date. Actuarial gains and losses are recognised in full in the period in which they occur in the statement of comprehensive income.
Past service cost is recognised immediately to the extent that the benefits are already vested, and otherwise is amortised on a straight–line basis over the average period until the benefits become vested.
3. Accounting policies continued

FINANCIAL STATEMENTS
94 CHEMRING GROUP PLCANNUAL REPORT AND ACCOUNTS 2014
FINANCIAL STATEMENTS
Expected return on scheme assets less interest cost on defined benefit obligations is included within finance expense.
The retirement benefit obligation recognised in the balance sheet represents the present value of the defined benefit obligation as adjusted for unrecognised past service cost and as reduced by the fair value of scheme assets. Any asset resulting from this calculation is limited to past service cost, plus the present value of available refunds and reductions in future contributions to the scheme.
Leased assetsWhere the Group enters into a lease which entails taking substantially all the risks and rewards of ownership of an asset, the lease is treated as a finance lease. The asset is recorded in the balance sheet as property, plant and equipment, and is depreciated over the shorter of its estimated useful economic life and the lease term. Future instalments under such leases, net of finance charges, are recognised as a liability. The finance element of the instalments is charged to the income statement at a constant rate of interest on the remaining balance of the obligation.
All other leases are operating leases, for which rental charges are recognised in the income statement on a straight–line basis over the life of the lease.
Share–based compensationThe Group operates equity-settled and cash-settled share–based compensation schemes.
For grants made under the Group’s share–based compensation schemes, the fair value of an award is measured at the date of grant and reflects any market–based vesting conditions. Non–market based vesting conditions are excluded from the fair value of the award. At the date of grant, the Company estimates the number of awards expected to vest as a result of non–market based vesting conditions, and the fair value of this estimated number of awards is recognised as an expense in the income statement on a straight–line basis over the vesting period. At each balance sheet date, the impact of any revision to vesting estimates is recognised in the income statement over the vesting period. Proceeds received, net of any directly attributable transaction costs, are credited to share capital and share premium.
For cash-settled share–based grants, the total amount recognised is based on the fair value of the liability incurred. The fair value of the liability is remeasured at each balance sheet date, with changes in the fair value recognised in the income statement.
ProvisionsProvisions are recognised when the Group has a present obligation, either legal or constructive, as a result of a past event, it is probable that the Group will be required to settle that obligation, and a reliable estimate can be made of the amount of the obligation. The amount recognised as a provision is the best estimate of the consideration required to settle the present obligation at the balance sheet date, taking into account the risks and uncertainties surrounding the obligation. Where a provision is measured using the estimated cash flows to settle the present obligation, its carrying amount is the present value of those cash flows.
When some or all of the economic benefits required to settle a provision are expected to be recovered from a third party, a receivable is recognised as an asset if it is virtually certain that reimbursement will be received and the amount of the receivable can be measured reliably.
Environmental provisionsWhere the Group is liable for decontamination work or the restoration of sites to their original condition, an estimate is made of the costs needed to complete these works, discounted back to present values, relying upon independent third party valuers where appropriate.
Restructuring provisionsA restructuring provision is recognised when the Group has developed a detailed formal plan for the restructuring and has raised a valid expectation in those affected that it will carry out the restructuring by starting to implement the plan or announcing its main features to those affected by it. The measurement of a restructuring provision includes only the direct expenditures arising from the restructuring and not those associated with the ongoing activities of the entity.
Warranty provisionsProvisions for the expected cost of warranty obligations under local sale of goods legislation are recognised at the date of sale of the relevant products, based upon the best estimate of the expenditure required to settle the Group’s obligations.
Contingent liabilitiesThe Group exercises judgement in recognising exposures to contingent liabilities related to pending litigation or other outstanding claims subject to negotiated settlement, mediation, arbitration or government regulation, as well as other contingent liabilities. Judgement may be necessary in assessing the likelihood that a pending claim will succeed, or a liability will arise, and/or to quantify the possible range of the financial settlement.
3. Accounting policies continued
NOTES TO THE GROUP FINANCIAL STATEMENTS CONTINUED
STRATEGIC REPORT
GOVERNANCE
FINANCIAL STATEMENTS
OTHER INFORMATION
95CHEMRING GROUP PLCANNUAL REPORT AND ACCOUNTS 2014
STRATEGIC REPORT
GOVERNANCE
FINANCIAL STATEMENTS
OTHER INFORMATION
Non–GAAP informationIn the analysis of the Group’s financial performance and position, operating results and cash flows, information is presented to provide readers with additional information that is prepared on a non–GAAP basis and which is regularly reviewed by management. However, this additional information is not uniformly defined by all companies and so may not be comparable with similarly titled measures and disclosures by other companies. Additionally, certain information presented is derived from amounts calculated in accordance with IFRS but is not itself an expressly permitted GAAP measure. Such non–GAAP measures should not be viewed in isolation or as an alternative to the equivalent GAAP measure.
Post balance sheet events In accordance with IAS 10 Events after the Balance Sheet Date, the Group continues to disclose events that it considers material, non–disclosure of which can influence the economic decisions of users of the financial statements.
Critical accounting judgements and sources of estimation uncertainty When applying the Group’s accounting policies, management must make assumptions and estimates concerning the future that affect the carrying amounts of assets and liabilities at the balance sheet date and the amounts of revenue and expenses recognised during the period. Such assumptions and estimates are based upon factors including historical experience, the observance of trends in the industries in which the Group operates, and information available from the Group’s customers and other external sources. The key assumptions concerning the future and other key sources of estimation uncertainty at the balance sheet date that have a significant risk of causing a material adjustment to the carrying amounts of assets and liabilities within the next financial year include:
Assessment of contract accounting The Group has contracts that fall into different accounting periods. In assessing the allocation of revenues and costs to individual accounting periods, and the consequential assets and liabilities, the Group estimates the total revenues and costs forecast to arise in respect of the contract and the stage of completion based on an appropriate measure of performance as described under the revenue recognition policy on page 90. The Group utilises assumptions and projections, principally relating to future material, labour and overhead costs. As a consequence there is a risk that total contract costs will exceed those originally estimated and the margin will decrease. Changes to initial assumptions, which are reviewed on a regular basis, may result in
revisions to estimated costs and anticipated margins. These are recognised in the period in which the estimated costs are determined. The determination of appropriate accounting policies for recognising revenue and costs in respect of these contracts requires judgement, in particular (i) whether contract accounting is the most appropriate method of recognising revenue on these contracts; and (ii) the appropriate measure of stage of completion of the contract.
Goodwill impairment Determining whether goodwill is impaired requires an estimation of the value–in–use of the cash–generating units to which goodwill has been allocated. The value–in–use calculation requires the entity to estimate the future cash flows expected to arise from the cash–generating unit, and to determine a suitable discount rate in order to calculate present value (see note 13). In reviewing the carrying value of goodwill of the Group’s businesses, the Board has considered the separate plans and cash flows of these businesses consistent with the requirements of IAS 36 Impairment of Assets. The plans and cash flows of these businesses reflect current and anticipated conditions in the defence industry.
Tax The largest category of deferred tax asset which contains significant estimation uncertainty and which requires management judgement in assessing its recoverability relates to tax losses carried forward (see note 10).
Applicable accounting standards permit the recognition of deferred tax assets only to the extent that it is probable that future taxable profits will be available to utilise the tax losses carried forward. The assessment of future taxable profits involves significant estimation uncertainty, principally relating to an assessment of management’s projections of future taxable income based on business plans and ongoing tax planning strategies. These projections include assumptions about the future strategy of the Group, the economic and regulatory environment in which the Group operates, future tax legislation, and customer behaviour, amongst other variables. Details of tax losses on which deferred tax assets have not been recognised are set out in note 26.
LegalThe Group is subject to legal proceedings and other claims arising in the ordinary course of business. The Group is required to assess the likelihood of any adverse judgements or outcomes, as well as potential ranges of probable losses. A determination of the amount of reserves required for these matters is based on a careful analysis of each individual issue with the assistance of outside legal counsel. However, actual claims incurred could differ from their estimated value.
3. Accounting policies continued

FINANCIAL STATEMENTS
96 CHEMRING GROUP PLCANNUAL REPORT AND ACCOUNTS 2014
4. Revenue All of the Group’s revenue is derived from the sale of goods, including revenue recognised in respect of contract–accounted arrangements, and the provision of services. The following table provides an analysis of the Group’s revenue by destination:
Revenue by destination2014
£m
2013As restated
£m
Continuing operationsUK 80.5 92.0USA 230.2 278.0Europe 41.4 34.5Asia Pacific 30.2 36.0Middle East 17.5 28.0Rest of the world 3.3 3.8
403.1 472.3
Discontinued operationsUK 1.8 17.9USA 3.1 2.7Europe 8.8 25.9Asia Pacific 3.9 14.4Middle East 54.2 91.0Rest of the world — 0.7
71.8 152.6
474.9 624.9
Revenue from contract accounting for continuing operations within the above figures amounted to £88.6 million (2013: £149.9 million). The decrease since 2013 reflects the overall decline in revenue and the completion of Sensors & Electronics’ US production contracts. Including discontinued operations, revenue from contract accounting was £125.2 million (2013: £240.5 million).
In addition to the revenues shown above, finance income of £0.2 million (2013: £0.2 million) has been recognised. The directors consider the only countries that are significant in accordance with IFRS 8 Operating Segments are the USA and the UK, as disclosed above, and the Kingdom of Saudi Arabia, which is included within the Middle East category. Sales to the Kingdom of Saudi Arabia from continuing operations generated revenue of £9.2 million (2013: £14.5 million). Including discontinued operations, sales to the Kingdom of Saudi Arabia generated revenue of £47.8 million (2013: £97.6 million).
5. Business segmentsIFRS 8 Operating Segments requires operating segments to be identified on the basis of internal reports about components of the Group that are regularly reviewed by the Group Chief Executive and the Board to allocate resources to the segments and to assess their performance. For management purposes, and following the disposals, the Group’s operating and reporting structure has been revised during the year to better cluster similar businesses together within the following three operating segments – Countermeasures, Sensors & Electronics, and Energetic Systems. These segments are the basis on which the Group reports its segmental information. The principal activities of each segment are as follows:
Countermeasures Development and manufacture of expendable active and passive countermeasures for naval and air platforms, and land–based electronic warfare equipment.
Sensors & Electronics Development and manufacture of IED detection equipment, chemical and biological threat detection equipment, IED electronic countermeasures, network protection technologies, explosive ordnance disposal equipment and demilitarisation services.
Energetic Systems Development and manufacture of signals and illumination devices and payloads, cartridge/propellant actuated devices, pyrotechnic devices for satellite launch and deployment, missile and ammunition components, propellants, warheads, fuses, separation sub–systems, actuators and energetic materials.
NOTES TO THE GROUP FINANCIAL STATEMENTS CONTINUED

STRATEGIC REPORT
GOVERNANCE
FINANCIAL STATEMENTS
OTHER INFORMATION
97CHEMRING GROUP PLCANNUAL REPORT AND ACCOUNTS 2014
A segmental analysis of revenue and operating profit is set out below:
Revenue2014
£m
2013As restated
£m
Continuing operationsCountermeasures 96.1 125.0Sensors & Electronics 154.4 211.3Energetic Systems 152.6 136.0
403.1 472.3Discontinued operations 71.8 152.6
474.9 624.9
Underlying operating profit2014
£m2013
£m
Continuing operationsCountermeasures 9.7 13.2Sensors & Electronics 31.9 44.7Energetic Systems 15.0 8.5
56.6 66.4Unallocated corporate costs (9.9) (10.1)
46.7 56.3
Year ended 31 October 2014
ContinuingUnderlying
£m
ContinuingTotal
£m
DiscontinuedUnderlying
£m
DiscontinuedTotal
£m
TotalUnderlying
£mTotal
£m
Underlying operating profit 46.7 46.7 2.3 2.3 49.0 49.0Acquisition and disposal related costs (note 32) — (0.6) — (8.0) — (8.6)Business restructuring and incident costs — (7.2) — — — (7.2)Loss on disposal of associate (note 17) — — — (0.9) — (0.9)Profit on disposal of business (note 33) — 0.5 — 26.0 — 26.5Impairment of goodwill (note 13) — — — (45.9) — (45.9)Impairment of acquired intangibles (note 14) — — — (10.7) — (10.7)Impairment of assets held for sale (note 34) — — — (13.6) — (13.6)Intangible amortisation arising from business combinations
(note 14) — (13.5) — (2.6) — (16.1)Movement in fair value of derivative financial instruments
(note 24) — (0.5) — (0.2) — (0.7)
Non-underlying items — (21.3) — (55.9) — (77.2)
Operating profit/(loss) 46.7 25.4 2.3 (53.6) 49.0 (28.2)Finance income 0.1 0.1 0.1 0.1 0.2 0.2Finance expense (18.7) (18.7) (0.2) (0.2) (18.9) (18.9)Non-underlying accelerated interest costs — (12.0) — — — (12.0)
Profit/(loss) before tax 28.1 (5.2) 2.2 (53.7) 30.3 (58.9)Tax (5.7) 3.8 (0.7) 0.2 (6.4) 4.0
Profit/(loss) after tax 22.4 (1.4) 1.5 (53.5) 23.9 (54.9)
5. Business segments continued

FINANCIAL STATEMENTS
98 CHEMRING GROUP PLCANNUAL REPORT AND ACCOUNTS 2014
5. Business segments continued
Year ended 31 October 2013
ContinuingUnderlyingAs restated
£m
ContinuingTotal
As restated£m
DiscontinuedUnderlying
£m
DiscontinuedTotal
£m
TotalUnderlyingAs restated
£m
TotalAs restated
£m
Underlying operating profit 56.3 56.3 15.8 15.8 72.1 72.1Acquisition and disposal related costs (note 32) — (2.6) — (0.6) — (3.2)Business restructuring and incident costs — (11.7) — — — (11.7)Impairment of goodwill (note 13) — (50.9) — — — (50.9)Impairment of acquired intangibles (notes 14) — (15.7) — — — (15.7)Impairment of assets held for sale (note 34) — (8.8) — — — (8.8)Intangible amortisation arising from
business combinations (note 14) — (13.4) — (5.4) — (18.8)Movement in fair value of derivative financial instruments (note 24) — 0.1 — — — 0.1
— (103.0) — (6.0) — (109.0)
Operating profit/(loss) 56.3 (46.7) 15.8 9.8 72.1 (36.9)Finance income 0.2 0.2 — — 0.2 0.2Finance expense (20.0) (20.0) (0.7) (0.7) (20.7) (20.7)
Profit/(loss) before tax 36.5 (66.5) 15.1 9.1 51.6 (57.4)Tax (6.5) 10.9 (4.1) (1.8) (10.6) 9.1
Profit/(loss) after tax 30.0 (55.6) 11.0 7.3 41.0 (48.3)
The accounting policies of the reportable segments are the same as the Group’s accounting policies described in note 3.
Segmental profit represents the profit earned by each segment, before allocation of corporate costs including directors’ salaries, non–underlying items, the share of profit of associates, finance income and expense, and tax. This is the measure reported to the Group Chief Executive for the purpose of resource allocation and assessment of segment performance.
Segmental analyses of depreciation and amortisation are set out below. All depreciation is reflected in both underlying and total measures of operating profit. The analysis of amortisation is shown for both the underlying and total operating profit measures.
Depreciation2014
£m2013
£m
Countermeasures 7.0 7.2Sensors & Electronics 2.7 2.8Energetic Systems 4.8 5.8Discontinued operations 1.8 3.5Unallocated corporate items 0.7 0.8
17.0 20.1
2014 2013
Amortisation
Within underlyingoperating
profit£m
Within total
operating profit
£m
Within underlyingoperating
profit£m
Within total
operating profit
£m
Countermeasures 1.1 1.1 0.8 0.8Sensors & Electronics 3.3 10.3 1.8 9.0Energetic Systems 1.2 7.7 1.9 8.1Discontinued operations 0.9 3.5 1.2 6.6Unallocated corporate items 0.2 0.2 0.2 0.2
6.7 22.8 5.9 24.7
Unallocated corporate costs Unallocated corporate costs were £9.9 million (2013: £10.1 million), with the reduction due mainly to lower staff numbers following the relocation of the corporate head office during the year.
Intra–group transactionsThere are no material intra–group transactions included within the revenue and profit values disclosed in this note.
NOTES TO THE GROUP FINANCIAL STATEMENTS CONTINUED
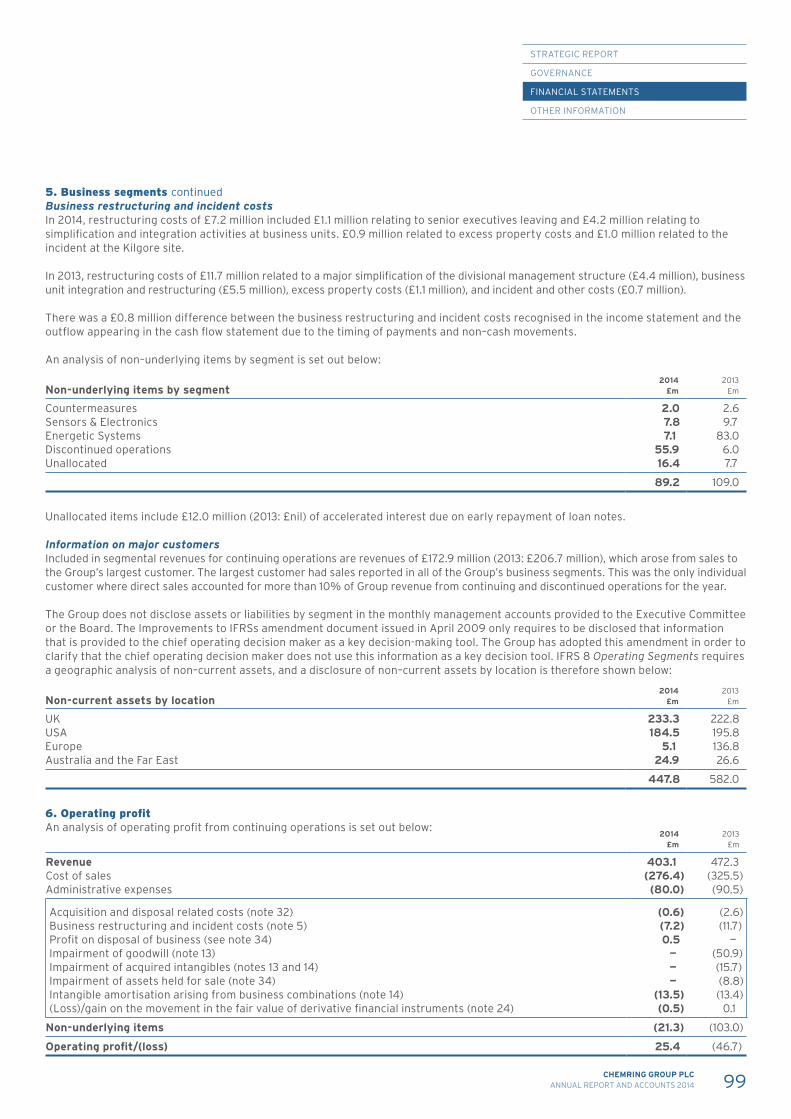
STRATEGIC REPORT
GOVERNANCE
FINANCIAL STATEMENTS
OTHER INFORMATION
99CHEMRING GROUP PLCANNUAL REPORT AND ACCOUNTS 2014
5. Business segments continuedBusiness restructuring and incident costsIn 2014, restructuring costs of £7.2 million included £1.1 million relating to senior executives leaving and £4.2 million relating to simplification and integration activities at business units. £0.9 million related to excess property costs and £1.0 million related to the incident at the Kilgore site.
In 2013, restructuring costs of £11.7 million related to a major simplification of the divisional management structure (£4.4 million), business unit integration and restructuring (£5.5 million), excess property costs (£1.1 million), and incident and other costs (£0.7 million).
There was a £0.8 million difference between the business restructuring and incident costs recognised in the income statement and the outflow appearing in the cash flow statement due to the timing of payments and non–cash movements.
An analysis of non–underlying items by segment is set out below:
Non-underlying items by segment2014
£m2013
£m
Countermeasures 2.0 2.6Sensors & Electronics 7.8 9.7Energetic Systems 7.1 83.0Discontinued operations 55.9 6.0Unallocated 16.4 7.7
89.2 109.0
Unallocated items include £12.0 million (2013: £nil) of accelerated interest due on early repayment of loan notes.
Information on major customers Included in segmental revenues for continuing operations are revenues of £172.9 million (2013: £206.7 million), which arose from sales to the Group’s largest customer. The largest customer had sales reported in all of the Group’s business segments. This was the only individual customer where direct sales accounted for more than 10% of Group revenue from continuing and discontinued operations for the year.
The Group does not disclose assets or liabilities by segment in the monthly management accounts provided to the Executive Committee or the Board. The Improvements to IFRSs amendment document issued in April 2009 only requires to be disclosed that information that is provided to the chief operating decision maker as a key decision-making tool. The Group has adopted this amendment in order to clarify that the chief operating decision maker does not use this information as a key decision tool. IFRS 8 Operating Segments requires a geographic analysis of non–current assets, and a disclosure of non–current assets by location is therefore shown below:
Non-current assets by location2014
£m2013
£m
UK 233.3 222.8USA 184.5 195.8Europe 5.1 136.8Australia and the Far East 24.9 26.6
447.8 582.0
6. Operating profit An analysis of operating profit from continuing operations is set out below:
2014£m
2013£m
Revenue 403.1 472.3Cost of sales (276.4) (325.5)Administrative expenses (80.0) (90.5)
Acquisition and disposal related costs (note 32) (0.6) (2.6)Business restructuring and incident costs (note 5) (7.2) (11.7)Profit on disposal of business (see note 34) 0.5 —Impairment of goodwill (note 13) — (50.9)Impairment of acquired intangibles (notes 13 and 14) — (15.7)Impairment of assets held for sale (note 34) — (8.8)Intangible amortisation arising from business combinations (note 14) (13.5) (13.4)(Loss)/gain on the movement in the fair value of derivative financial instruments (note 24) (0.5) 0.1
Non-underlying items (21.3) (103.0)
Operating profit/(loss) 25.4 (46.7)
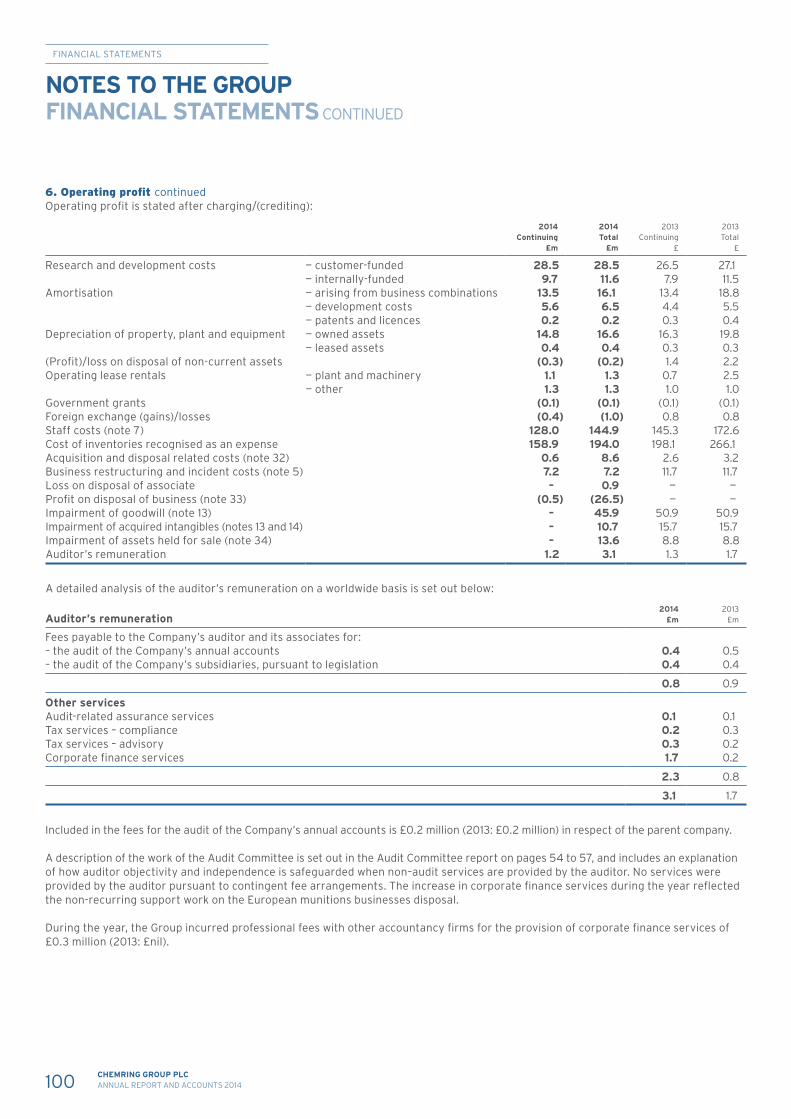
FINANCIAL STATEMENTS
100 CHEMRING GROUP PLCANNUAL REPORT AND ACCOUNTS 2014
Operating profit is stated after charging/(crediting):
2014Continuing
£m
2014Total
£m
2013Continuing
£
2013Total
£
Research and development costs — customer-funded 28.5 28.5 26.5 27.1— internally-funded 9.7 11.6 7.9 11.5
Amortisation — arising from business combinations 13.5 16.1 13.4 18.8— development costs 5.6 6.5 4.4 5.5— patents and licences 0.2 0.2 0.3 0.4
Depreciation of property, plant and equipment — owned assets 14.8 16.6 16.3 19.8— leased assets 0.4 0.4 0.3 0.3
(Profit)/loss on disposal of non-current assets (0.3) (0.2) 1.4 2.2Operating lease rentals — plant and machinery 1.1 1.3 0.7 2.5
— other 1.3 1.3 1.0 1.0Government grants (0.1) (0.1) (0.1) (0.1)Foreign exchange (gains)/losses (0.4) (1.0) 0.8 0.8Staff costs (note 7) 128.0 144.9 145.3 172.6Cost of inventories recognised as an expense 158.9 194.0 198.1 266.1Acquisition and disposal related costs (note 32) 0.6 8.6 2.6 3.2Business restructuring and incident costs (note 5) 7.2 7.2 11.7 11.7Loss on disposal of associate – 0.9 — —Profit on disposal of business (note 33) (0.5) (26.5) — —Impairment of goodwill (note 13) – 45.9 50.9 50.9Impairment of acquired intangibles (notes 13 and 14) – 10.7 15.7 15.7Impairment of assets held for sale (note 34) – 13.6 8.8 8.8Auditor’s remuneration 1.2 3.1 1.3 1.7
A detailed analysis of the auditor’s remuneration on a worldwide basis is set out below:
Auditor’s remuneration2014
£m2013
£m
Fees payable to the Company’s auditor and its associates for:– the audit of the Company’s annual accounts 0.4 0.5– the audit of the Company’s subsidiaries, pursuant to legislation 0.4 0.4
0.8 0.9
Other servicesAudit-related assurance services 0.1 0.1Tax services – compliance 0.2 0.3Tax services – advisory 0.3 0.2Corporate finance services 1.7 0.2
2.3 0.8
3.1 1.7
Included in the fees for the audit of the Company’s annual accounts is £0.2 million (2013: £0.2 million) in respect of the parent company.
A description of the work of the Audit Committee is set out in the Audit Committee report on pages 54 to 57, and includes an explanation of how auditor objectivity and independence is safeguarded when non–audit services are provided by the auditor. No services were provided by the auditor pursuant to contingent fee arrangements. The increase in corporate finance services during the year reflected the non-recurring support work on the European munitions businesses disposal.
During the year, the Group incurred professional fees with other accountancy firms for the provision of corporate finance services of £0.3 million (2013: £nil).
6. Operating profit continued
NOTES TO THE GROUP FINANCIAL STATEMENTS CONTINUED
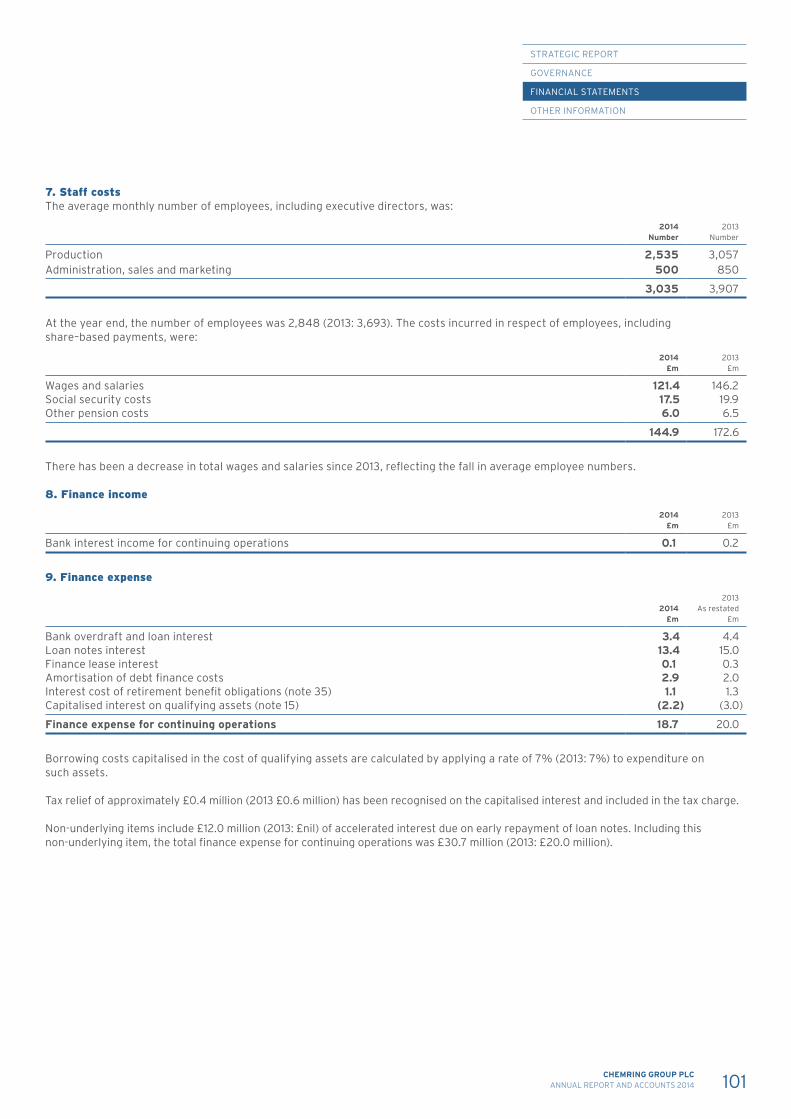
STRATEGIC REPORT
GOVERNANCE
FINANCIAL STATEMENTS
OTHER INFORMATION
101CHEMRING GROUP PLCANNUAL REPORT AND ACCOUNTS 2014
7. Staff costs The average monthly number of employees, including executive directors, was:
2014Number
2013Number
Production 2,535 3,057Administration, sales and marketing 500 850
3,035 3,907
At the year end, the number of employees was 2,848 (2013: 3,693). The costs incurred in respect of employees, including share–based payments, were:
2014£m
2013£m
Wages and salaries 121.4 146.2Social security costs 17.5 19.9Other pension costs 6.0 6.5
144.9 172.6
There has been a decrease in total wages and salaries since 2013, reflecting the fall in average employee numbers.
8. Finance income
2014£m
2013£m
Bank interest income for continuing operations 0.1 0.2
9. Finance expense
2014£m
2013As restated
£m
Bank overdraft and loan interest 3.4 4.4Loan notes interest 13.4 15.0Finance lease interest 0.1 0.3Amortisation of debt finance costs 2.9 2.0Interest cost of retirement benefit obligations (note 35) 1.1 1.3Capitalised interest on qualifying assets (note 15) (2.2) (3.0)
Finance expense for continuing operations 18.7 20.0
Borrowing costs capitalised in the cost of qualifying assets are calculated by applying a rate of 7% (2013: 7%) to expenditure on such assets.
Tax relief of approximately £0.4 million (2013 £0.6 million) has been recognised on the capitalised interest and included in the tax charge.
Non-underlying items include £12.0 million (2013: £nil) of accelerated interest due on early repayment of loan notes. Including this non-underlying item, the total finance expense for continuing operations was £30.7 million (2013: £20.0 million).
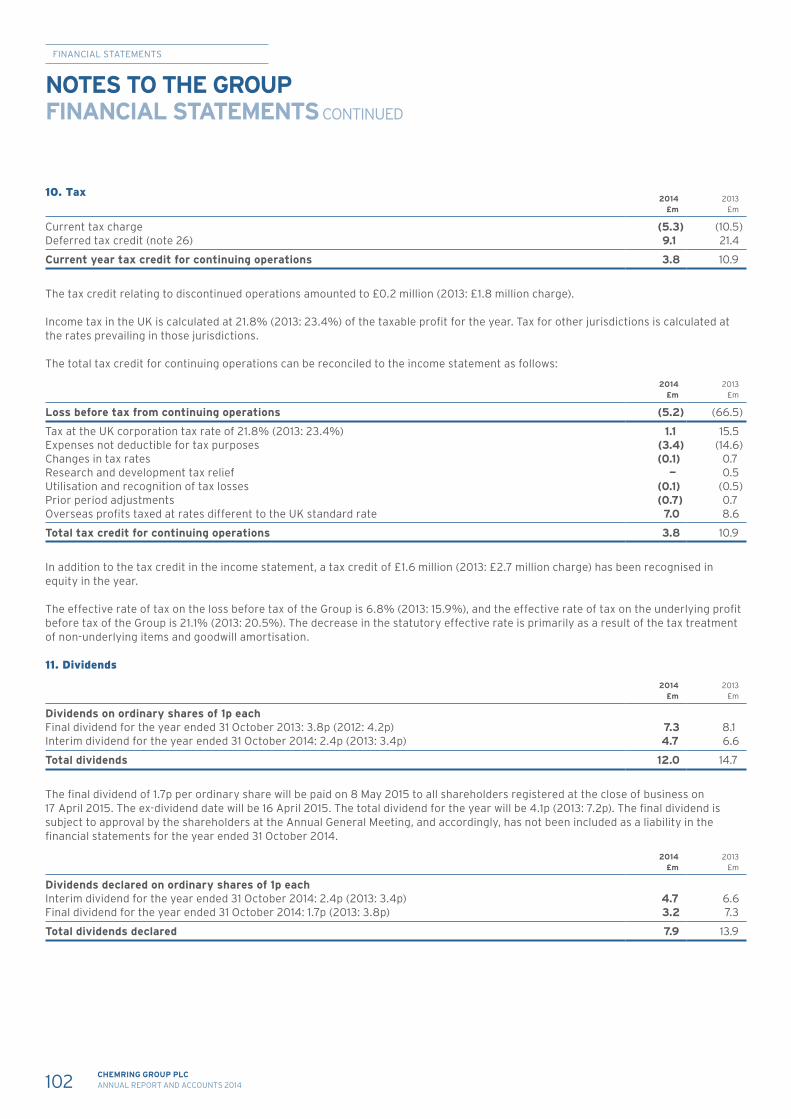
FINANCIAL STATEMENTS
102 CHEMRING GROUP PLCANNUAL REPORT AND ACCOUNTS 2014
10. Tax 2014
£m2013
£m
Current tax charge (5.3) (10.5)Deferred tax credit (note 26) 9.1 21.4
Current year tax credit for continuing operations 3.8 10.9
The tax credit relating to discontinued operations amounted to £0.2 million (2013: £1.8 million charge). Income tax in the UK is calculated at 21.8% (2013: 23.4%) of the taxable profit for the year. Tax for other jurisdictions is calculated at the rates prevailing in those jurisdictions.
The total tax credit for continuing operations can be reconciled to the income statement as follows:
2014£m
2013£m
Loss before tax from continuing operations (5.2) (66.5)
Tax at the UK corporation tax rate of 21.8% (2013: 23.4%) 1.1 15.5Expenses not deductible for tax purposes (3.4) (14.6)Changes in tax rates (0.1) 0.7Research and development tax relief — 0.5Utilisation and recognition of tax losses (0.1) (0.5)Prior period adjustments (0.7) 0.7Overseas profits taxed at rates different to the UK standard rate 7.0 8.6
Total tax credit for continuing operations 3.8 10.9
In addition to the tax credit in the income statement, a tax credit of £1.6 million (2013: £2.7 million charge) has been recognised in equity in the year.
The effective rate of tax on the loss before tax of the Group is 6.8% (2013: 15.9%), and the effective rate of tax on the underlying profit before tax of the Group is 21.1% (2013: 20.5%). The decrease in the statutory effective rate is primarily as a result of the tax treatment of non-underlying items and goodwill amortisation.
11. Dividends
2014£m
2013£m
Dividends on ordinary shares of 1p each Final dividend for the year ended 31 October 2013: 3.8p (2012: 4.2p) 7.3 8.1Interim dividend for the year ended 31 October 2014: 2.4p (2013: 3.4p) 4.7 6.6
Total dividends 12.0 14.7
The final dividend of 1.7p per ordinary share will be paid on 8 May 2015 to all shareholders registered at the close of business on 17 April 2015. The ex-dividend date will be 16 April 2015. The total dividend for the year will be 4.1p (2013: 7.2p). The final dividend is subject to approval by the shareholders at the Annual General Meeting, and accordingly, has not been included as a liability in the financial statements for the year ended 31 October 2014.
2014£m
2013£m
Dividends declared on ordinary shares of 1p each Interim dividend for the year ended 31 October 2014: 2.4p (2013: 3.4p) 4.7 6.6Final dividend for the year ended 31 October 2014: 1.7p (2013: 3.8p) 3.2 7.3
Total dividends declared 7.9 13.9
NOTES TO THE GROUP FINANCIAL STATEMENTS CONTINUED
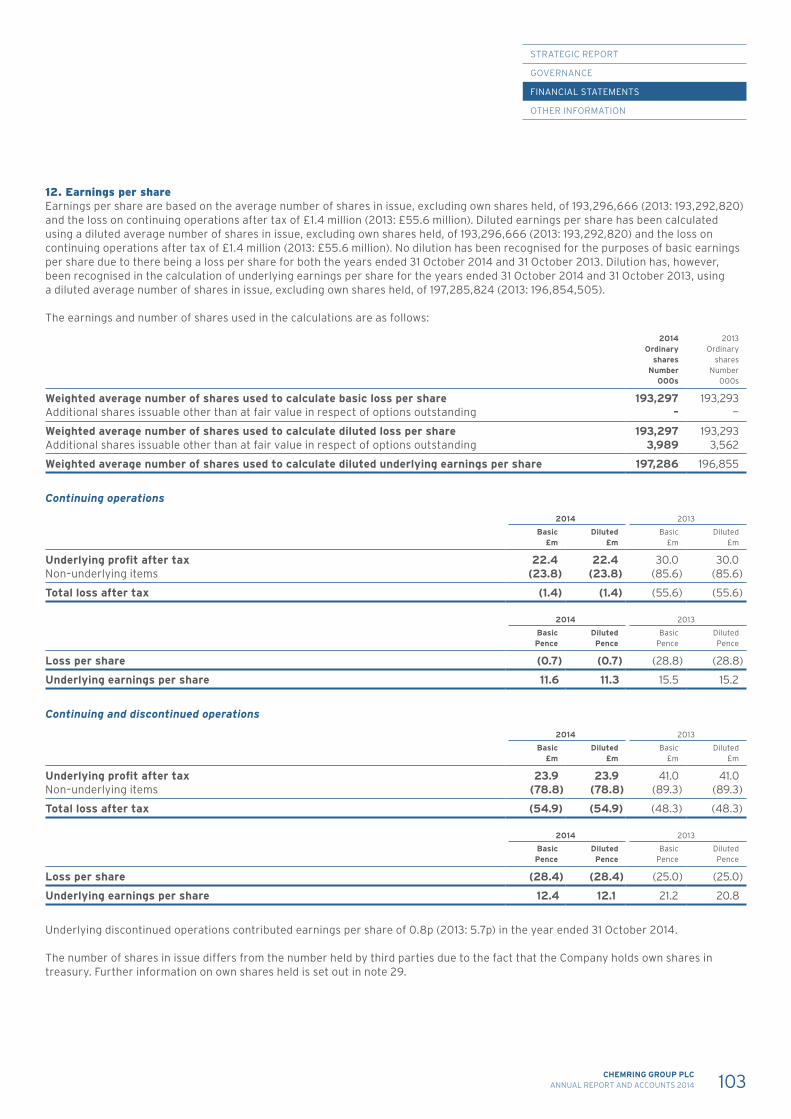
STRATEGIC REPORT
GOVERNANCE
FINANCIAL STATEMENTS
OTHER INFORMATION
103CHEMRING GROUP PLCANNUAL REPORT AND ACCOUNTS 2014
12. Earnings per shareEarnings per share are based on the average number of shares in issue, excluding own shares held, of 193,296,666 (2013: 193,292,820) and the loss on continuing operations after tax of £1.4 million (2013: £55.6 million). Diluted earnings per share has been calculated using a diluted average number of shares in issue, excluding own shares held, of 193,296,666 (2013: 193,292,820) and the loss on continuing operations after tax of £1.4 million (2013: £55.6 million). No dilution has been recognised for the purposes of basic earnings per share due to there being a loss per share for both the years ended 31 October 2014 and 31 October 2013. Dilution has, however, been recognised in the calculation of underlying earnings per share for the years ended 31 October 2014 and 31 October 2013, using a diluted average number of shares in issue, excluding own shares held, of 197,285,824 (2013: 196,854,505).
The earnings and number of shares used in the calculations are as follows:
2014Ordinary
sharesNumber
000s
2013Ordinary
sharesNumber
000s
Weighted average number of shares used to calculate basic loss per share 193,297 193,293Additional shares issuable other than at fair value in respect of options outstanding – —
Weighted average number of shares used to calculate diluted loss per share 193,297 193,293Additional shares issuable other than at fair value in respect of options outstanding 3,989 3,562
Weighted average number of shares used to calculate diluted underlying earnings per share 197,286 196,855
Continuing operations
2014 2013
Basic£m
Diluted£m
Basic£m
Diluted£m
Underlying profit after tax 22.4 22.4 30.0 30.0Non–underlying items (23.8) (23.8) (85.6) (85.6)
Total loss after tax (1.4) (1.4) (55.6) (55.6)
2014 2013
BasicPence
DilutedPence
BasicPence
DilutedPence
Loss per share (0.7) (0.7) (28.8) (28.8)
Underlying earnings per share 11.6 11.3 15.5 15.2
Continuing and discontinued operations
2014 2013
Basic£m
Diluted£m
Basic£m
Diluted£m
Underlying profit after tax 23.9 23.9 41.0 41.0Non–underlying items (78.8) (78.8) (89.3) (89.3)
Total loss after tax (54.9) (54.9) (48.3) (48.3)
2014 2013
BasicPence
DilutedPence
BasicPence
DilutedPence
Loss per share (28.4) (28.4) (25.0) (25.0)
Underlying earnings per share 12.4 12.1 21.2 20.8
Underlying discontinued operations contributed earnings per share of 0.8p (2013: 5.7p) in the year ended 31 October 2014.
The number of shares in issue differs from the number held by third parties due to the fact that the Company holds own shares in treasury. Further information on own shares held is set out in note 29.
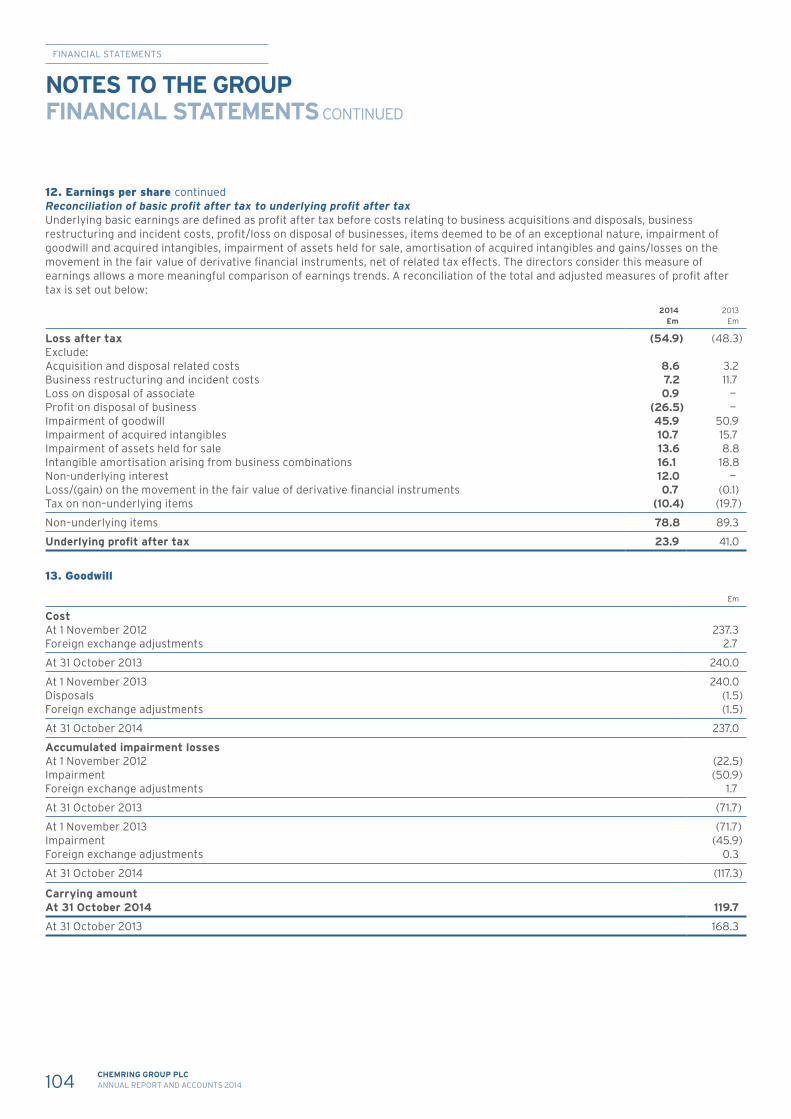
FINANCIAL STATEMENTS
104 CHEMRING GROUP PLCANNUAL REPORT AND ACCOUNTS 2014
Reconciliation of basic profit after tax to underlying profit after tax Underlying basic earnings are defined as profit after tax before costs relating to business acquisitions and disposals, business restructuring and incident costs, profit/loss on disposal of businesses, items deemed to be of an exceptional nature, impairment of goodwill and acquired intangibles, impairment of assets held for sale, amortisation of acquired intangibles and gains/losses on the movement in the fair value of derivative financial instruments, net of related tax effects. The directors consider this measure of earnings allows a more meaningful comparison of earnings trends. A reconciliation of the total and adjusted measures of profit after tax is set out below:
2014£m
2013£m
Loss after tax (54.9) (48.3)Exclude:Acquisition and disposal related costs 8.6 3.2Business restructuring and incident costs 7.2 11.7Loss on disposal of associate 0.9 —Profit on disposal of business (26.5) —Impairment of goodwill 45.9 50.9Impairment of acquired intangibles 10.7 15.7Impairment of assets held for sale 13.6 8.8Intangible amortisation arising from business combinations 16.1 18.8Non-underlying interest 12.0 —Loss/(gain) on the movement in the fair value of derivative financial instruments 0.7 (0.1)Tax on non–underlying items (10.4) (19.7)
Non–underlying items 78.8 89.3
Underlying profit after tax 23.9 41.0
13. Goodwill
£m
CostAt 1 November 2012 237.3Foreign exchange adjustments 2.7
At 31 October 2013 240.0
At 1 November 2013 240.0Disposals (1.5)Foreign exchange adjustments (1.5)
At 31 October 2014 237.0
Accumulated impairment lossesAt 1 November 2012 (22.5)Impairment (50.9)Foreign exchange adjustments 1.7
At 31 October 2013 (71.7)
At 1 November 2013 (71.7)Impairment (45.9)Foreign exchange adjustments 0.3
At 31 October 2014 (117.3)
Carrying amountAt 31 October 2014 119.7
At 31 October 2013 168.3
12. Earnings per share continued
NOTES TO THE GROUP FINANCIAL STATEMENTS CONTINUED
STRATEGIC REPORT
GOVERNANCE
FINANCIAL STATEMENTS
OTHER INFORMATION
105CHEMRING GROUP PLCANNUAL REPORT AND ACCOUNTS 2014
Goodwill acquired in a business combination is allocated at acquisition to the cash–generating units (“CGUs”) that are expected to benefit from that business combination. The carrying amount of the goodwill has been allocated to the Group’s principal CGUs.
The Group tests goodwill at least annually for impairment. Tests are conducted more frequently if there are indications that goodwill might be impaired.
The recoverable amounts of the CGUs are determined from value–in–use calculations. The key assumptions for the value–in–use calculations are those regarding the discount rates, growth rates and expected changes to cash flows during the period for which management has detailed plans. Management estimates discount rates using pre–tax rates that reflect current market assessments of the time value of money and the risks specific to each of the CGUs.
Pre–tax discount rates, derived from the Group’s post–tax weighted average cost of capital of 9.0% (2013: 7.4%) which have been adjusted for a premium specific to each of the CGUs to account for differences in currency risk, country risk and other factors affecting specific CGUs, have been used to discount projected cash flows. These premiums range from 1% to 3% (2013: 1% to 3%).
The calculation has used the Group’s forecast figures for the next four years. This is based on an extrapolation of the three year plan that has been approved by the Board. At the end of four years, the calculations assume the performance of the CGUs will grow at a nominal annual rate of 0.5% in perpetuity. Growth rates are based on management’s view of industry growth forecasts. Changes in selling prices and direct costs are based on past practices and expectations of future changes.
The pre–tax discount rates used for value-in-use calculations and the carrying value of goodwill by the principal CGUs are:
2014%
2013%
2014£m
2013£m
Simmel Difesa S.p.A. – 13.8 – 47.2Roke Manor Research Limited 12.3 10.6 28.4 28.3Chemring Energetics UK Limited 13.6 12.0 18.1 18.1Non–Intrusive Inspection Technology, Inc. 14.5 12.4 15.6 15.5Chemring Detection Systems, Inc. 15.4 13.8 13.8 13.7Chemring Energetic Devices, Inc. 13.1 11.0 13.0 12.9Other 30.8 32.6
119.7 168.3
The weighted average cost of capital is derived using beta values of a comparator group of defence companies adjusted for funding structures as appropriate. The beta values of this group have increased during the year and this has increased the pre-tax discount rates used.
Following a detailed review, no impairment losses have been recognised in the year ended 31 October 2014, other than in relation to the discontinued operations as detailed in note 33. In the year ended 31 October 2013, an impairment of goodwill of £50.9 million was recognised in relation to Hi–Shear Technology Corporation, which has since been merged with Chemring Energetic Devices, Inc. In respect of acquired intangibles, an impairment of £15.7 million was made in the year ended 31 October 2013 in relation to Chemring Energetic Devices’ Clear Lake business, which was subsequently disposed of in the year ended 31 October 2014. The impairments were recognised in the consolidated income statement, as part of non–underlying items within continuing operating profit.
The impairment charges were primarily driven by business valuations that were negatively impacted by lower cash flows within business units, reflecting the challenging economic conditions facing the defence industry in the US in particular.
Stress testing was performed and indicated that, where a 10% fall in the forecast cash flows of the CGUs was modelled, Chemring Energetics UK Limited would require an impairment charge of up to £1.1 million against goodwill, but no impairment would be required for any of the other CGUs in this scenario.
A 1% addition to the discount rate for each CGU was also modelled, and under these circumstances Chemring Energetics UK Limited would require an impairment charge of up to £1.0 million against goodwill. The remaining CGUs would not require any impairment.
The Chemring Energetics UK Limited CGU is expected to grow its annual cash flows strongly over the next two years, benefiting from operational improvements and new product growth.
Setting long–term growth rates beyond the four-year forecast period to zero would not result in any CGUs requiring any impairment.
13. Goodwill continued
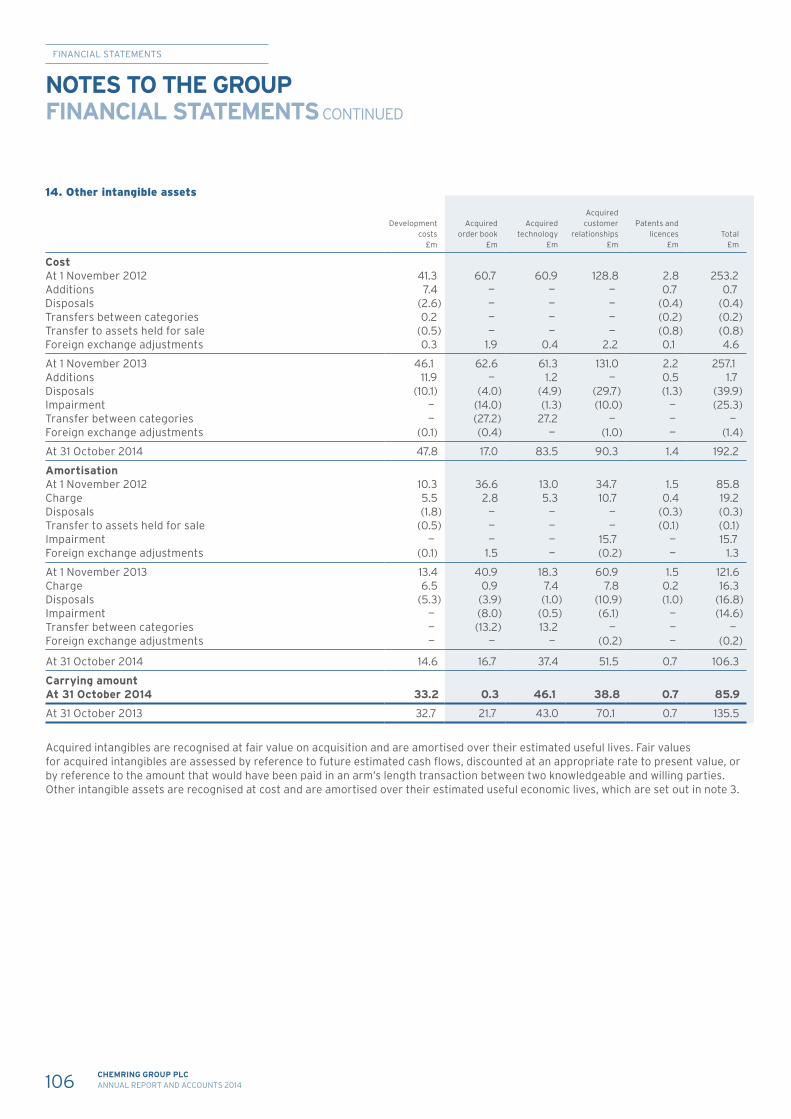
FINANCIAL STATEMENTS
106 CHEMRING GROUP PLCANNUAL REPORT AND ACCOUNTS 2014
14. Other intangible assets
Development costs
£m
Acquired order book
£m
Acquired technology
£m
Acquired customer
relationships£m
Patents and licences
£mTotal
£m
CostAt 1 November 2012 41.3 60.7 60.9 128.8 2.8 253.2Additions 7.4 — — — 0.7 0.7Disposals (2.6) — — — (0.4) (0.4)Transfers between categories 0.2 — — — (0.2) (0.2)Transfer to assets held for sale (0.5) — — — (0.8) (0.8)Foreign exchange adjustments 0.3 1.9 0.4 2.2 0.1 4.6
At 1 November 2013 46.1 62.6 61.3 131.0 2.2 257.1Additions 11.9 — 1.2 — 0.5 1.7Disposals (10.1) (4.0) (4.9) (29.7) (1.3) (39.9)Impairment — (14.0) (1.3) (10.0) — (25.3)Transfer between categories — (27.2) 27.2 — — —Foreign exchange adjustments (0.1) (0.4) — (1.0) — (1.4)
At 31 October 2014 47.8 17.0 83.5 90.3 1.4 192.2
AmortisationAt 1 November 2012 10.3 36.6 13.0 34.7 1.5 85.8Charge 5.5 2.8 5.3 10.7 0.4 19.2Disposals (1.8) — — — (0.3) (0.3)Transfer to assets held for sale (0.5) — — — (0.1) (0.1)Impairment — — — 15.7 — 15.7Foreign exchange adjustments (0.1) 1.5 — (0.2) — 1.3
At 1 November 2013 13.4 40.9 18.3 60.9 1.5 121.6Charge 6.5 0.9 7.4 7.8 0.2 16.3Disposals (5.3) (3.9) (1.0) (10.9) (1.0) (16.8)Impairment — (8.0) (0.5) (6.1) — (14.6)Transfer between categories — (13.2) 13.2 — — —Foreign exchange adjustments — — — (0.2) — (0.2)
At 31 October 2014 14.6 16.7 37.4 51.5 0.7 106.3
Carrying amountAt 31 October 2014 33.2 0.3 46.1 38.8 0.7 85.9
At 31 October 2013 32.7 21.7 43.0 70.1 0.7 135.5
Acquired intangibles are recognised at fair value on acquisition and are amortised over their estimated useful lives. Fair values for acquired intangibles are assessed by reference to future estimated cash flows, discounted at an appropriate rate to present value, or by reference to the amount that would have been paid in an arm’s length transaction between two knowledgeable and willing parties. Other intangible assets are recognised at cost and are amortised over their estimated useful economic lives, which are set out in note 3.
NOTES TO THE GROUP FINANCIAL STATEMENTS CONTINUED
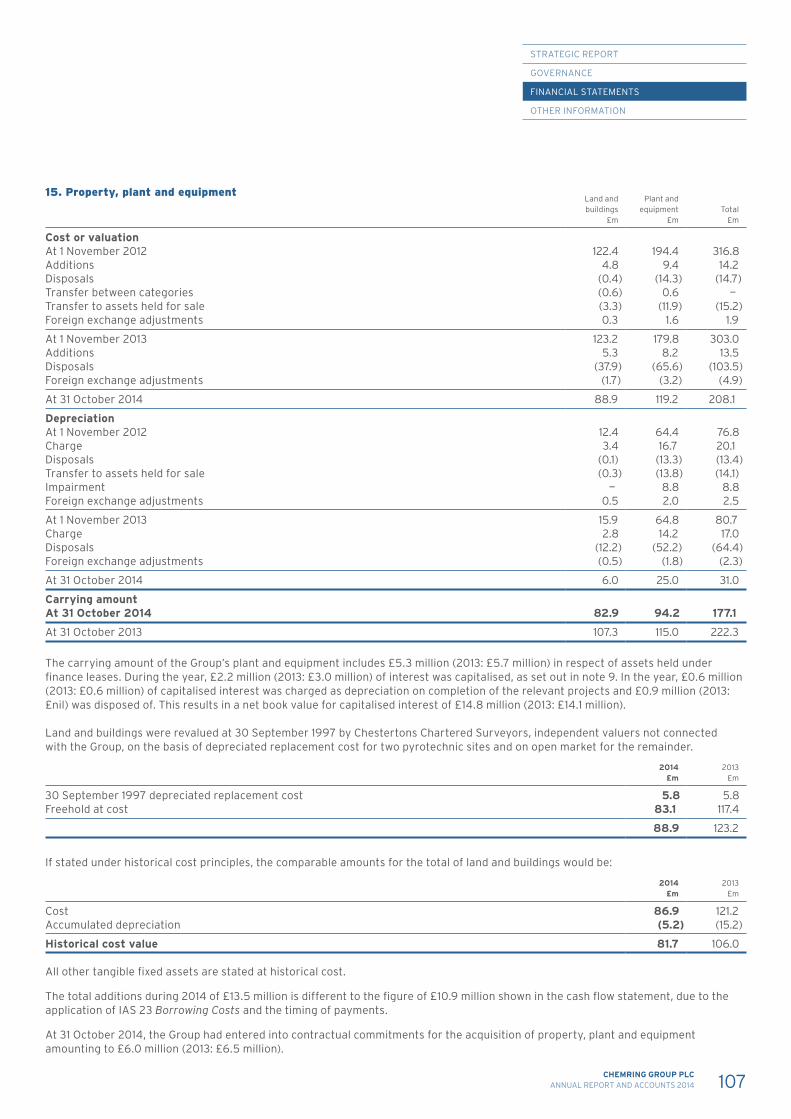
STRATEGIC REPORT
GOVERNANCE
FINANCIAL STATEMENTS
OTHER INFORMATION
107CHEMRING GROUP PLCANNUAL REPORT AND ACCOUNTS 2014
15. Property, plant and equipmentLand and buildings
£m
Plant and equipment
£mTotal
£m
Cost or valuationAt 1 November 2012 122.4 194.4 316.8Additions 4.8 9.4 14.2Disposals (0.4) (14.3) (14.7)Transfer between categories (0.6) 0.6 —Transfer to assets held for sale (3.3) (11.9) (15.2)Foreign exchange adjustments 0.3 1.6 1.9
At 1 November 2013 123.2 179.8 303.0Additions 5.3 8.2 13.5Disposals (37.9) (65.6) (103.5)Foreign exchange adjustments (1.7) (3.2) (4.9)
At 31 October 2014 88.9 119.2 208.1
DepreciationAt 1 November 2012 12.4 64.4 76.8Charge 3.4 16.7 20.1Disposals (0.1) (13.3) (13.4)Transfer to assets held for sale (0.3) (13.8) (14.1)Impairment — 8.8 8.8Foreign exchange adjustments 0.5 2.0 2.5
At 1 November 2013 15.9 64.8 80.7Charge 2.8 14.2 17.0Disposals (12.2) (52.2) (64.4)Foreign exchange adjustments (0.5) (1.8) (2.3)
At 31 October 2014 6.0 25.0 31.0
Carrying amountAt 31 October 2014 82.9 94.2 177.1
At 31 October 2013 107.3 115.0 222.3
The carrying amount of the Group’s plant and equipment includes £5.3 million (2013: £5.7 million) in respect of assets held under finance leases. During the year, £2.2 million (2013: £3.0 million) of interest was capitalised, as set out in note 9. In the year, £0.6 million (2013: £0.6 million) of capitalised interest was charged as depreciation on completion of the relevant projects and £0.9 million (2013: £nil) was disposed of. This results in a net book value for capitalised interest of £14.8 million (2013: £14.1 million).
Land and buildings were revalued at 30 September 1997 by Chestertons Chartered Surveyors, independent valuers not connected with the Group, on the basis of depreciated replacement cost for two pyrotechnic sites and on open market for the remainder.
2014£m
2013£m
30 September 1997 depreciated replacement cost 5.8 5.8Freehold at cost 83.1 117.4
88.9 123.2
If stated under historical cost principles, the comparable amounts for the total of land and buildings would be:
2014£m
2013£m
Cost 86.9 121.2Accumulated depreciation (5.2) (15.2)
Historical cost value 81.7 106.0
All other tangible fixed assets are stated at historical cost.
The total additions during 2014 of £13.5 million is different to the figure of £10.9 million shown in the cash flow statement, due to the application of IAS 23 Borrowing Costs and the timing of payments.
At 31 October 2014, the Group had entered into contractual commitments for the acquisition of property, plant and equipment amounting to £6.0 million (2013: £6.5 million).

FINANCIAL STATEMENTS
108 CHEMRING GROUP PLCANNUAL REPORT AND ACCOUNTS 2014
16. Subsidiary undertakingsAll subsidiary undertakings have been reflected in these financial statements. The subsidiary undertakings held at 31 October 2014 which, in the opinion of the directors, principally affected the results for the year or the net assets of the Group, are shown below. All of these undertakings are wholly controlled by Chemring Group PLC.
Country of incorporation (or registration) and operation Segment
Chemring Countermeasures Limited England CountermeasuresChemring Defence UK Limited England Energetic SystemsChemring EOD Limited England Sensors & ElectronicsChemring Prime Contracts Limited England Energetic SystemsRoke Manor Research Limited England Sensors & ElectronicsChemring Energetics UK Limited Scotland Energetic SystemsAlloy Surfaces Company, Inc. USA CountermeasuresKilgore Flares Company LLC USA CountermeasuresChemring Energetic Devices, Inc. USA Energetic SystemsChemring Ordnance, Inc. USA Energetic SystemsNon–Intrusive Inspection Technology, Inc. USA Sensors & ElectronicsChemring Detection Systems, Inc. USA Sensors & ElectronicsChemring Australia Pty Limited Australia CountermeasuresChemring Nobel AS Norway Energetic Systems3d-Radar AS Norway Sensors & Electronics
17. Interest in associateOn 29 October 2014, the Group’s 49% shareholding in the associate, CIRRA S.A, was sold to Etienne LACROIX Tous Artifices S.A., the 51% shareholder of the associate, for a cash consideration of £0.5 million (€0.6 million). The sale resulted in a loss on disposal after tax of £0.9 million, which has been treated as a non-underlying item. The results of the associate relate to the Group’s share of CIRRA S.A.’s result based on the locally-produced management accounts.
2014£m
2013£m
Interest in associate — 1.5
Amounts relating to associate: 2014
£m2013
£m
Non–current assets — 0.2Current assets — 1.6Current liabilities — (0.6)
Net assets — 1.2
Group’s share of net assets of associate — 0.6
2014£m
2013£m
Revenue 1.1 1.6Loss after tax (0.1) (0.1)Group’s share of loss after tax — —Loss on disposal before tax – non-underlying 0.9 —Loss on disposal after tax – non-underlying 0.9 —
18. Inventories
2014£m
2013£m
Raw materials 25.0 37.9Work in progress 36.3 60.9Finished goods 16.8 14.9
78.1 113.7
There are no significant differences between the replacement cost of inventory and the fair values shown above.
NOTES TO THE GROUP FINANCIAL STATEMENTS CONTINUED

STRATEGIC REPORT
GOVERNANCE
FINANCIAL STATEMENTS
OTHER INFORMATION
109CHEMRING GROUP PLCANNUAL REPORT AND ACCOUNTS 2014
19. Trade and other receivables
2014£m
2013£m
Trade receivables 59.7 77.8Allowance for doubtful debts (0.4) (1.6)
59.3 76.2Contract receivables 20.2 104.8Other debtors 4.2 7.1Prepayments and accrued income 7.0 15.8
90.7 203.9
All amounts shown above are due within one year.
The average credit period taken by customers on sales of goods, calculated using a countback basis, is 29 days (2013: 27 days). No interest is charged on receivables from the date of invoice to payment.
The Group’s policy is to provide in full for trade receivables outstanding for more than 120 days beyond agreed terms, unless extenuating circumstances exist.
An ageing analysis has not been shown, as all significant overdue receivables are covered by the allowance for doubtful debts. The majority of the trade receivables balance was not yet due at the year end based on the credit terms provided to customers.
The directors consider that the carrying amount of trade and other receivables approximates to their fair values.
Of the trade receivables balance at the end of the year, £3.9 million was due from Al Tuff International, UAE and £19.6 million was due from the US Department of Defense. There are no other customers who represent more than 5% of the total trade receivables.
20. Cash and cash equivalentsBank balances and cash comprise cash held by the Group and short–term deposits with an original maturity of three months or less. The carrying amount of these assets approximates to their fair value.
Included within cash is £0.6 million (2013: £0.8 million) of restricted cash.
21. Borrowings
2014£m
2013£m
Within current liabilities Bank loans and overdrafts – Sterling denominated 0.3 0.3
– US dollar denominated — 0.1Finance leases – Sterling denominated 1.0 1.6
Borrowings due within one year 1.3 2.0
Within non–current liabilities UK bank loans – Sterling denominated — 0.3Loan notes – Sterling denominated 8.1 12.5
– US dollar denominated 147.5 246.6Finance leases – Sterling denominated 0.4 1.4Preference shares 0.1 0.1
Borrowings due after more than one year 156.1 260.9
157.4 262.9
Analysis of borrowings by currency:
2014£m
2013£m
Sterling 9.9 16.2US dollar 147.5 246.7
157.4 262.9
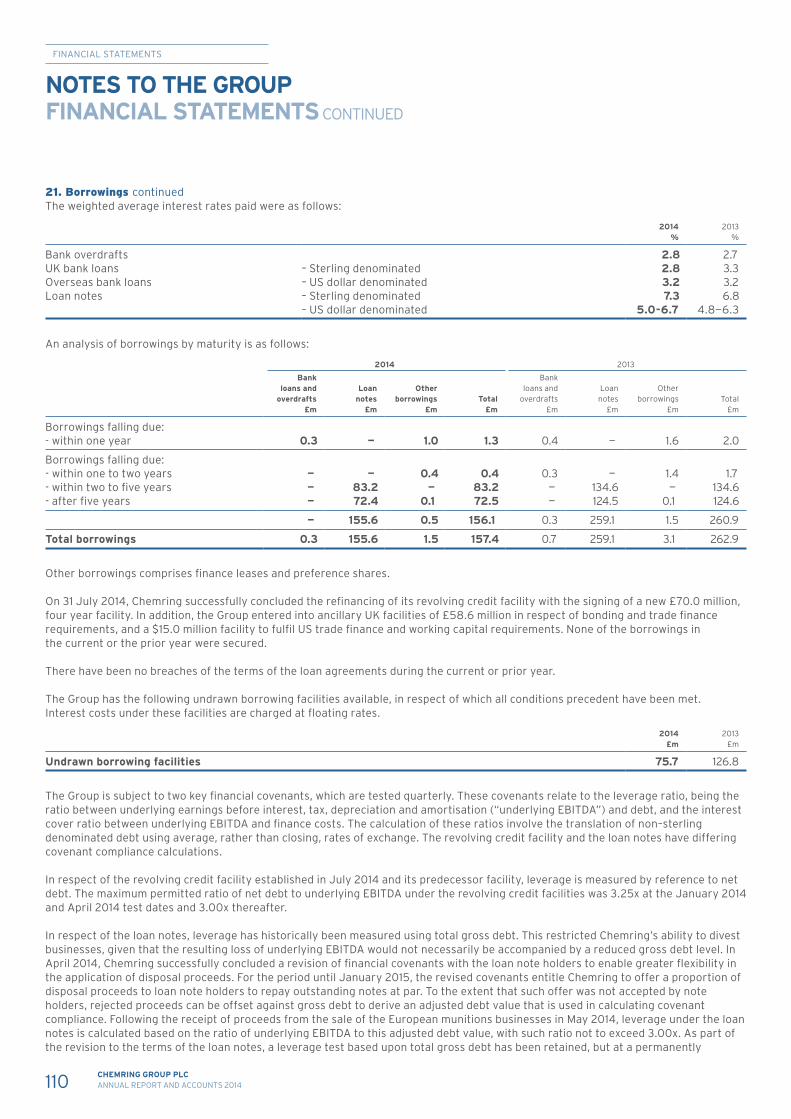
FINANCIAL STATEMENTS
110 CHEMRING GROUP PLCANNUAL REPORT AND ACCOUNTS 2014
The weighted average interest rates paid were as follows:
2014%
2013%
Bank overdrafts 2.8 2.7UK bank loans – Sterling denominated 2.8 3.3Overseas bank loans – US dollar denominated 3.2 3.2Loan notes – Sterling denominated 7.3 6.8
– US dollar denominated 5.0-6.7 4.8—6.3
An analysis of borrowings by maturity is as follows:
2014 2013
Bank loans and
overdrafts£m
Loan notes
£m
Other borrowings
£mTotal
£m
Bank loans and
overdrafts£m
Loan notes
£m
Other borrowings
£mTotal
£m
Borrowings falling due:- within one year 0.3 — 1.0 1.3 0.4 — 1.6 2.0
Borrowings falling due:- within one to two years — — 0.4 0.4 0.3 — 1.4 1.7- within two to five years — 83.2 — 83.2 — 134.6 — 134.6- after five years — 72.4 0.1 72.5 — 124.5 0.1 124.6
— 155.6 0.5 156.1 0.3 259.1 1.5 260.9
Total borrowings 0.3 155.6 1.5 157.4 0.7 259.1 3.1 262.9
Other borrowings comprises finance leases and preference shares.
On 31 July 2014, Chemring successfully concluded the refinancing of its revolving credit facility with the signing of a new £70.0 million, four year facility. In addition, the Group entered into ancillary UK facilities of £58.6 million in respect of bonding and trade finance requirements, and a $15.0 million facility to fulfil US trade finance and working capital requirements. None of the borrowings in the current or the prior year were secured.
There have been no breaches of the terms of the loan agreements during the current or prior year.
The Group has the following undrawn borrowing facilities available, in respect of which all conditions precedent have been met. Interest costs under these facilities are charged at floating rates.
2014£m
2013£m
Undrawn borrowing facilities 75.7 126.8
The Group is subject to two key financial covenants, which are tested quarterly. These covenants relate to the leverage ratio, being the ratio between underlying earnings before interest, tax, depreciation and amortisation (“underlying EBITDA”) and debt, and the interest cover ratio between underlying EBITDA and finance costs. The calculation of these ratios involve the translation of non–sterling denominated debt using average, rather than closing, rates of exchange. The revolving credit facility and the loan notes have differing covenant compliance calculations.
In respect of the revolving credit facility established in July 2014 and its predecessor facility, leverage is measured by reference to net debt. The maximum permitted ratio of net debt to underlying EBITDA under the revolving credit facilities was 3.25x at the January 2014 and April 2014 test dates and 3.00x thereafter.
In respect of the loan notes, leverage has historically been measured using total gross debt. This restricted Chemring’s ability to divest businesses, given that the resulting loss of underlying EBITDA would not necessarily be accompanied by a reduced gross debt level. In April 2014, Chemring successfully concluded a revision of financial covenants with the loan note holders to enable greater flexibility in the application of disposal proceeds. For the period until January 2015, the revised covenants entitle Chemring to offer a proportion of disposal proceeds to loan note holders to repay outstanding notes at par. To the extent that such offer was not accepted by note holders, rejected proceeds can be offset against gross debt to derive an adjusted debt value that is used in calculating covenant compliance. Following the receipt of proceeds from the sale of the European munitions businesses in May 2014, leverage under the loan notes is calculated based on the ratio of underlying EBITDA to this adjusted debt value, with such ratio not to exceed 3.00x. As part of the revision to the terms of the loan notes, a leverage test based upon total gross debt has been retained, but at a permanently
21. Borrowings continued
NOTES TO THE GROUP FINANCIAL STATEMENTS CONTINUED
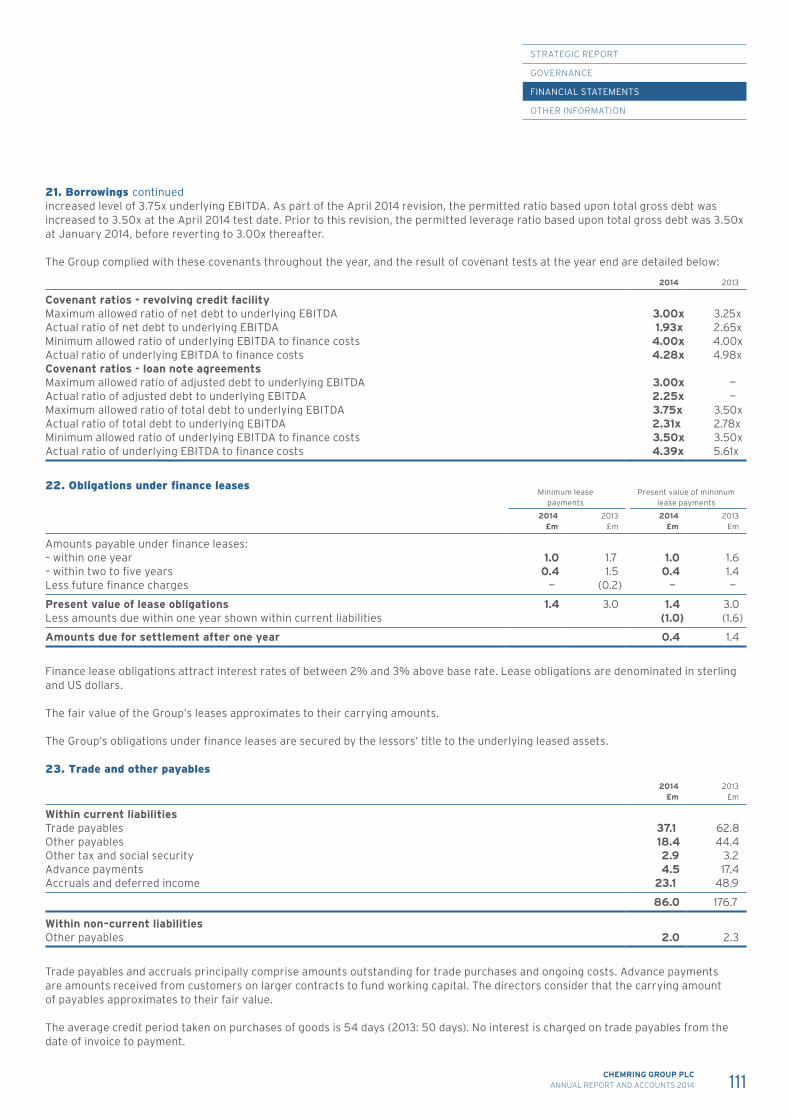
STRATEGIC REPORT
GOVERNANCE
FINANCIAL STATEMENTS
OTHER INFORMATION
111CHEMRING GROUP PLCANNUAL REPORT AND ACCOUNTS 2014
increased level of 3.75x underlying EBITDA. As part of the April 2014 revision, the permitted ratio based upon total gross debt was increased to 3.50x at the April 2014 test date. Prior to this revision, the permitted leverage ratio based upon total gross debt was 3.50x at January 2014, before reverting to 3.00x thereafter.
The Group complied with these covenants throughout the year, and the result of covenant tests at the year end are detailed below:
2014 2013
Covenant ratios - revolving credit facility Maximum allowed ratio of net debt to underlying EBITDA 3.00x 3.25xActual ratio of net debt to underlying EBITDA 1.93x 2.65xMinimum allowed ratio of underlying EBITDA to finance costs 4.00x 4.00xActual ratio of underlying EBITDA to finance costs 4.28x 4.98xCovenant ratios - loan note agreements Maximum allowed ratio of adjusted debt to underlying EBITDA 3.00x —Actual ratio of adjusted debt to underlying EBITDA 2.25x —Maximum allowed ratio of total debt to underlying EBITDA 3.75x 3.50xActual ratio of total debt to underlying EBITDA 2.31x 2.78xMinimum allowed ratio of underlying EBITDA to finance costs 3.50x 3.50xActual ratio of underlying EBITDA to finance costs 4.39x 5.61x
22. Obligations under finance leasesMinimum lease
paymentsPresent value of minimum
lease payments
2014£m
2013£m
2014£m
2013£m
Amounts payable under finance leases: – within one year 1.0 1.7 1.0 1.6– within two to five years 0.4 1.5 0.4 1.4Less future finance charges — (0.2) — —
Present value of lease obligations 1.4 3.0 1.4 3.0Less amounts due within one year shown within current liabilities (1.0) (1.6)
Amounts due for settlement after one year 0.4 1.4
Finance lease obligations attract interest rates of between 2% and 3% above base rate. Lease obligations are denominated in sterling and US dollars.
The fair value of the Group’s leases approximates to their carrying amounts.
The Group’s obligations under finance leases are secured by the lessors’ title to the underlying leased assets.
23. Trade and other payables
2014£m
2013£m
Within current liabilitiesTrade payables 37.1 62.8Other payables 18.4 44.4Other tax and social security 2.9 3.2Advance payments 4.5 17.4Accruals and deferred income 23.1 48.9
86.0 176.7
Within non–current liabilitiesOther payables 2.0 2.3
Trade payables and accruals principally comprise amounts outstanding for trade purchases and ongoing costs. Advance payments are amounts received from customers on larger contracts to fund working capital. The directors consider that the carrying amount of payables approximates to their fair value.
The average credit period taken on purchases of goods is 54 days (2013: 50 days). No interest is charged on trade payables from the date of invoice to payment.
21. Borrowings continued
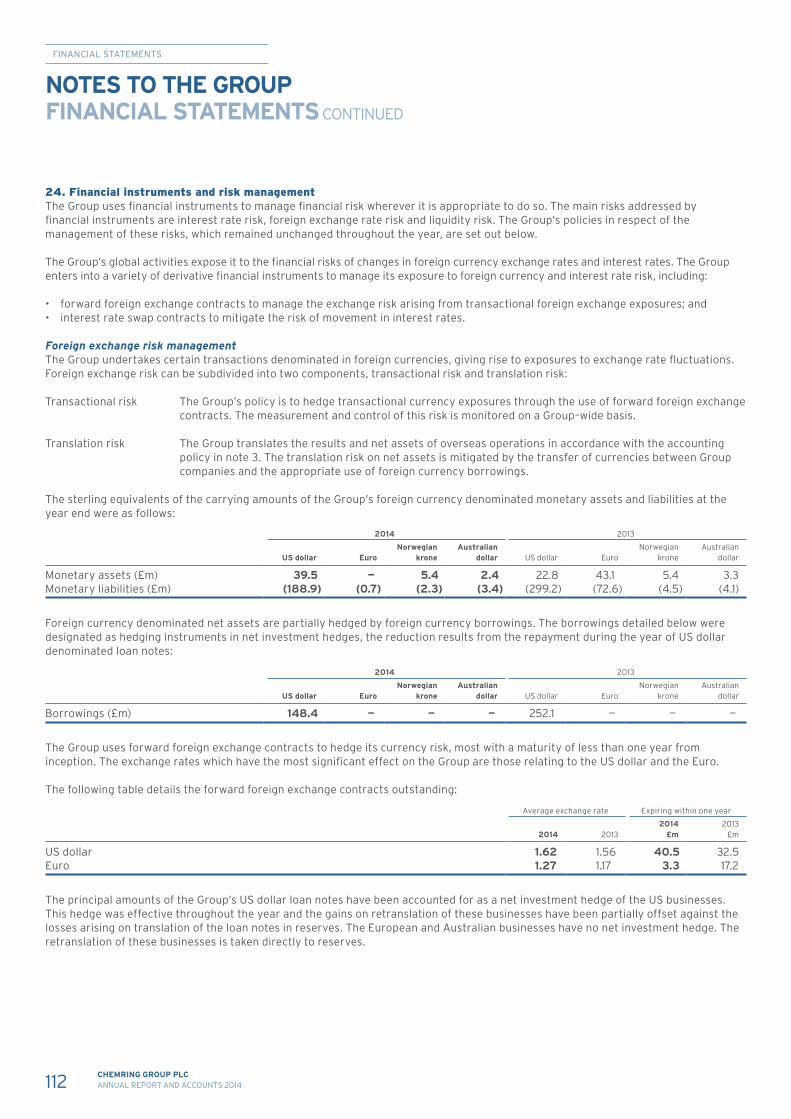
FINANCIAL STATEMENTS
112 CHEMRING GROUP PLCANNUAL REPORT AND ACCOUNTS 2014
24. Financial instruments and risk management The Group uses financial instruments to manage financial risk wherever it is appropriate to do so. The main risks addressed by financial instruments are interest rate risk, foreign exchange rate risk and liquidity risk. The Group’s policies in respect of the management of these risks, which remained unchanged throughout the year, are set out below.
The Group’s global activities expose it to the financial risks of changes in foreign currency exchange rates and interest rates. The Group enters into a variety of derivative financial instruments to manage its exposure to foreign currency and interest rate risk, including:
• forward foreign exchange contracts to manage the exchange risk arising from transactional foreign exchange exposures; and • interest rate swap contracts to mitigate the risk of movement in interest rates.
Foreign exchange risk management The Group undertakes certain transactions denominated in foreign currencies, giving rise to exposures to exchange rate fluctuations. Foreign exchange risk can be subdivided into two components, transactional risk and translation risk:
Transactional risk The Group’s policy is to hedge transactional currency exposures through the use of forward foreign exchange contracts. The measurement and control of this risk is monitored on a Group–wide basis.
Translation risk The Group translates the results and net assets of overseas operations in accordance with the accounting policy in note 3. The translation risk on net assets is mitigated by the transfer of currencies between Group companies and the appropriate use of foreign currency borrowings.
The sterling equivalents of the carrying amounts of the Group’s foreign currency denominated monetary assets and liabilities at the year end were as follows:
2014 2013
US dollar EuroNorwegian
kroneAustralian
dollar US dollar EuroNorwegian
kroneAustralian
dollar
Monetary assets (£m) 39.5 — 5.4 2.4 22.8 43.1 5.4 3.3Monetary liabilities (£m) (188.9) (0.7) (2.3) (3.4) (299.2) (72.6) (4.5) (4.1)
Foreign currency denominated net assets are partially hedged by foreign currency borrowings. The borrowings detailed below were designated as hedging instruments in net investment hedges, the reduction results from the repayment during the year of US dollar denominated loan notes:
2014 2013
US dollar EuroNorwegian
kroneAustralian
dollar US dollar EuroNorwegian
kroneAustralian
dollar
Borrowings (£m) 148.4 — — — 252.1 — — —
The Group uses forward foreign exchange contracts to hedge its currency risk, most with a maturity of less than one year from inception. The exchange rates which have the most significant effect on the Group are those relating to the US dollar and the Euro.
The following table details the forward foreign exchange contracts outstanding:
Average exchange rate Expiring within one year
2014 20132014
£m2013
£m
US dollar 1.62 1.56 40.5 32.5Euro 1.27 1.17 3.3 17.2
The principal amounts of the Group’s US dollar loan notes have been accounted for as a net investment hedge of the US businesses. This hedge was effective throughout the year and the gains on retranslation of these businesses have been partially offset against the losses arising on translation of the loan notes in reserves. The European and Australian businesses have no net investment hedge. The retranslation of these businesses is taken directly to reserves.
NOTES TO THE GROUP FINANCIAL STATEMENTS CONTINUED
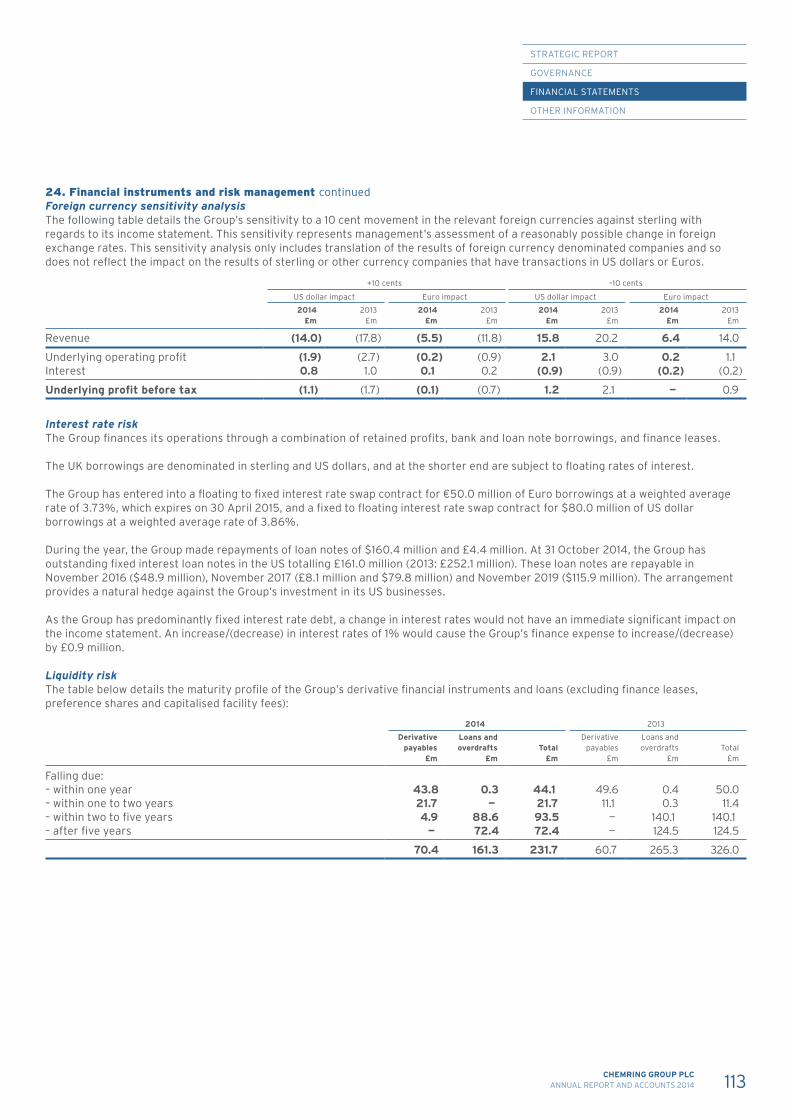
STRATEGIC REPORT
GOVERNANCE
FINANCIAL STATEMENTS
OTHER INFORMATION
113CHEMRING GROUP PLCANNUAL REPORT AND ACCOUNTS 2014
Foreign currency sensitivity analysis The following table details the Group’s sensitivity to a 10 cent movement in the relevant foreign currencies against sterling with regards to its income statement. This sensitivity represents management’s assessment of a reasonably possible change in foreign exchange rates. This sensitivity analysis only includes translation of the results of foreign currency denominated companies and so does not reflect the impact on the results of sterling or other currency companies that have transactions in US dollars or Euros.
+10 cents –10 cents
US dollar impact Euro impact US dollar impact Euro impact
2014£m
2013£m
2014£m
2013£m
2014£m
2013£m
2014£m
2013£m
Revenue (14.0) (17.8) (5.5) (11.8) 15.8 20.2 6.4 14.0
Underlying operating profit (1.9) (2.7) (0.2) (0.9) 2.1 3.0 0.2 1.1Interest 0.8 1.0 0.1 0.2 (0.9) (0.9) (0.2) (0.2)
Underlying profit before tax (1.1) (1.7) (0.1) (0.7) 1.2 2.1 — 0.9
Interest rate risk The Group finances its operations through a combination of retained profits, bank and loan note borrowings, and finance leases.
The UK borrowings are denominated in sterling and US dollars, and at the shorter end are subject to floating rates of interest.
The Group has entered into a floating to fixed interest rate swap contract for €50.0 million of Euro borrowings at a weighted average rate of 3.73%, which expires on 30 April 2015, and a fixed to floating interest rate swap contract for $80.0 million of US dollar borrowings at a weighted average rate of 3.86%.
During the year, the Group made repayments of loan notes of $160.4 million and £4.4 million. At 31 October 2014, the Group has outstanding fixed interest loan notes in the US totalling £161.0 million (2013: £252.1 million). These loan notes are repayable in November 2016 ($48.9 million), November 2017 (£8.1 million and $79.8 million) and November 2019 ($115.9 million). The arrangement provides a natural hedge against the Group’s investment in its US businesses.
As the Group has predominantly fixed interest rate debt, a change in interest rates would not have an immediate significant impact on the income statement. An increase/(decrease) in interest rates of 1% would cause the Group’s finance expense to increase/(decrease) by £0.9 million.
Liquidity risk The table below details the maturity profile of the Group’s derivative financial instruments and loans (excluding finance leases, preference shares and capitalised facility fees):
2014 2013
Derivative payables
£m
Loans and overdrafts
£mTotal
£m
Derivative payables
£m
Loans and overdrafts
£mTotal
£m
Falling due: – within one year 43.8 0.3 44.1 49.6 0.4 50.0– within one to two years 21.7 — 21.7 11.1 0.3 11.4– within two to five years 4.9 88.6 93.5 — 140.1 140.1– after five years — 72.4 72.4 — 124.5 124.5
70.4 161.3 231.7 60.7 265.3 326.0
24. Financial instruments and risk management continued

FINANCIAL STATEMENTS
114 CHEMRING GROUP PLCANNUAL REPORT AND ACCOUNTS 2014
The profile of the Group’s financial assets by underlying currency and balance sheet classification is as follows:
2014£m
2013£m
Sterling 68.0 65.5US dollar 75.2 43.6Australian dollar 2.4 3.4Euro — 103.7Other currencies 5.0 5.2
150.6 221.4Overdraft offset (48.6) (24.7)
102.0 196.7
2014£m
2013£m
Cash at bank and in hand 21.8 14.2Trade receivables 59.3 76.2Contract receivables 20.2 104.8Derivative financial instruments 0.7 1.5
102.0 196.7
The majority of cash balances held in the UK and the US have a right of offset against overdraft balances.
The foreign currency balances are predominantly attributable to overseas business units and therefore do not result in significant exposure to transactional risks for the Group. Included within cash is £0.6 million of restricted cash (2013: £0.8 million).
The profile of the Group’s financial liabilities by underlying currency and balance sheet classification is as follows:
2014 2013
Floating rate£m
Fixed rate£m
Total£m
Floating rate£m
Fixed rate£m
Total£m
Sterling — 51.0 51.0 — 72.5 72.5US dollar 50.0 160.3 210.3 49.8 222.2 272.0Euro — 0.5 0.5 — 54.1 54.1Other currencies — 7.2 7.2 — 6.8 6.8
50.0 219.0 269.0 49.8 355.6 405.4Overdraft offset (48.6) (24.7)
220.4 380.7
2014£m
2013£m
Bank loans and overdrafts 0.3 0.4UK loans — 0.3Loan notes 155.6 259.1
155.9 259.8Preference shares (note 27) 0.1 0.1Obligations under finance leases (note 22) 1.4 3.0
157.4 262.9Trade payables due within one year 37.1 62.8Accruals 18.6 46.6Other tax and social security 2.9 3.2Derivative financial instruments due within one year 1.7 0.4Other payables due after more than one year 2.0 2.3Derivative financial instruments due after more than one year 0.7 2.5
220.4 380.7
The weighted average interest rate of fixed rate financial liabilities at 31 October 2014 was 5.4% (2013: 5.8%) and the weighted average period of funding was four years (2013: five years).
24. Financial instruments and risk management continued
NOTES TO THE GROUP FINANCIAL STATEMENTS CONTINUED

STRATEGIC REPORT
GOVERNANCE
FINANCIAL STATEMENTS
OTHER INFORMATION
115CHEMRING GROUP PLCANNUAL REPORT AND ACCOUNTS 2014
Derivative financial instruments The Group has two interest rate swap contracts, one from floating rate to fixed rate that expires on 30 April 2015 at a weighted average interest rate of 3.73%, and one from fixed rate to floating rate that expires in November 2019, and is callable in May 2015, at a weighted average interest rate of 3.86%. The fair value of these interest rate swap contracts recognised on the balance sheet at 31 October 2014 was a liability of £0.8 million (2013: £2.5 million). The Group also has forward foreign exchange contracts with fair values of £1.6 million liability (2013: £0.4 million liability) and £0.7 million asset (2013: £1.5 million asset). The net value of these derivative financial instruments is a liability of £1.7 million (2013: £1.4 million).
The following table details the fair value of derivative financial instrument (liabilities)/assets recognised in the balance sheet:
2014£m
2013£m
Interest rate swap contracts (0.8) (2.5)Forward foreign exchange contracts (0.9) 1.1
(1.7) (1.4)
These derivative financial instruments are classified on the balance sheet as follows:
2014£m
2013£m
Included in current assets 0.7 1.5Included in current liabilities (1.7) (0.4)Included in non–current liabilities (0.7) (2.5)
(1.7) (1.4)
The following table details the loss/(gain) on the movement in the fair value of derivative financial instruments recognised in the income statement:
2014£m
2013£m
Loss/(gain) on the movement in the fair value of derivative financial instruments 0.7 (0.1)
Fair value hierarchy IFRS 7 Financial Instruments: Disclosures requires companies that carry financial instruments at fair value in the balance sheet to disclose their level of visibility, determining into which category those financial instruments fall under the fair value hierarchy.
The fair value measurement hierarchy is as follows:
• Level 1 – quoted prices (unadjusted) in active markets for identical assets or liabilities; • Level 2 – inputs other than quoted prices included within Level 1 that are observable for the asset or liability, either directly
(ie as prices) or indirectly (ie derived from prices); and • Level 3 – inputs for the asset or liability that are not based on observable market data (ie as unobservable inputs).
The following tables present the Group’s assets and liabilities that are measured at fair value:
2014 2013
Level 1£m
Level 2£m
Total£m
Level 1£m
Level 2£m
Total£m
AssetsForward foreign exchange contracts — 0.7 0.7 — 1.5 1.5
Total assets — 0.7 0.7 — 1.5 1.5
2014 2013
Level 1£m
Level 2£m
Total£m
Level 1£m
Level 2£m
Total£m
LiabilitiesBorrowings — (155.6) (155.6) — (259.1) (259.1)Interest rate swaps — (0.8) (0.8) — (2.5) (2.5)Forward foreign exchange contracts — (1.6) (1.6) — (0.4) (0.4)
Total liabilities — (158.0) (158.0) — (262.0) (262.0)
24. Financial instruments and risk management continued
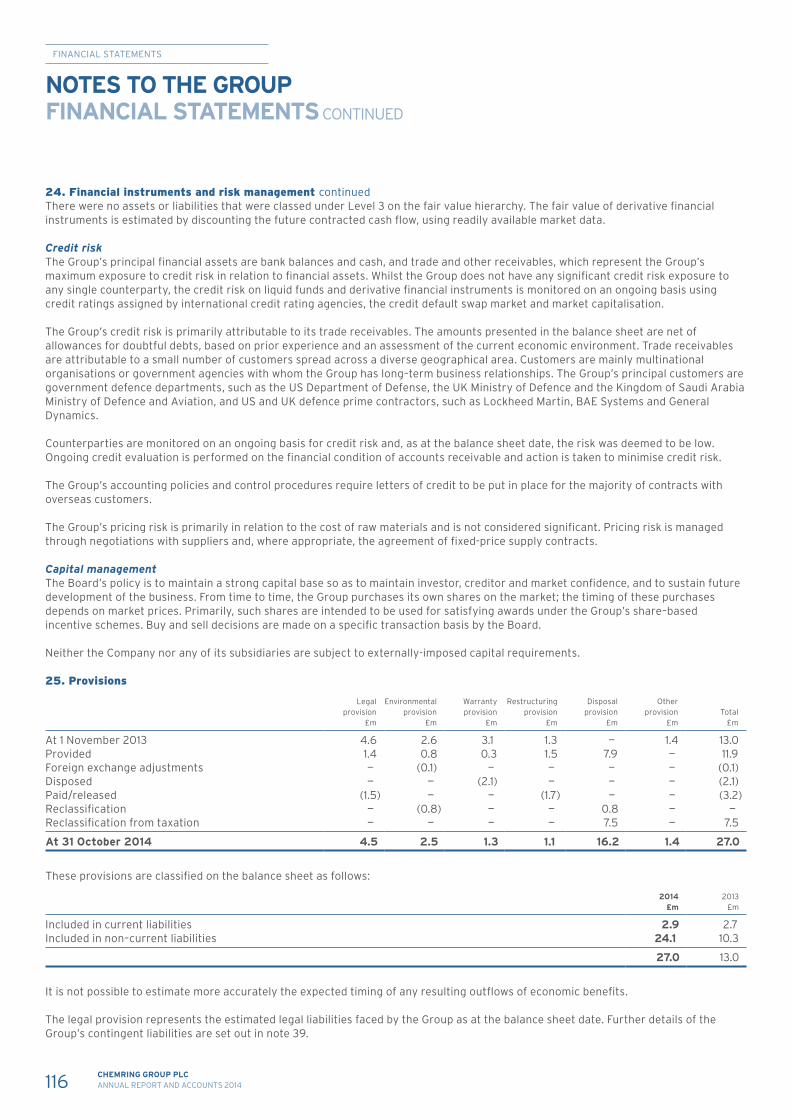
FINANCIAL STATEMENTS
116 CHEMRING GROUP PLCANNUAL REPORT AND ACCOUNTS 2014
There were no assets or liabilities that were classed under Level 3 on the fair value hierarchy. The fair value of derivative financial instruments is estimated by discounting the future contracted cash flow, using readily available market data.
Credit risk The Group’s principal financial assets are bank balances and cash, and trade and other receivables, which represent the Group’s maximum exposure to credit risk in relation to financial assets. Whilst the Group does not have any significant credit risk exposure to any single counterparty, the credit risk on liquid funds and derivative financial instruments is monitored on an ongoing basis using credit ratings assigned by international credit rating agencies, the credit default swap market and market capitalisation.
The Group’s credit risk is primarily attributable to its trade receivables. The amounts presented in the balance sheet are net of allowances for doubtful debts, based on prior experience and an assessment of the current economic environment. Trade receivables are attributable to a small number of customers spread across a diverse geographical area. Customers are mainly multinational organisations or government agencies with whom the Group has long–term business relationships. The Group’s principal customers are government defence departments, such as the US Department of Defense, the UK Ministry of Defence and the Kingdom of Saudi Arabia Ministry of Defence and Aviation, and US and UK defence prime contractors, such as Lockheed Martin, BAE Systems and General Dynamics.
Counterparties are monitored on an ongoing basis for credit risk and, as at the balance sheet date, the risk was deemed to be low. Ongoing credit evaluation is performed on the financial condition of accounts receivable and action is taken to minimise credit risk.
The Group’s accounting policies and control procedures require letters of credit to be put in place for the majority of contracts with overseas customers.
The Group’s pricing risk is primarily in relation to the cost of raw materials and is not considered significant. Pricing risk is managed through negotiations with suppliers and, where appropriate, the agreement of fixed-price supply contracts.
Capital management The Board’s policy is to maintain a strong capital base so as to maintain investor, creditor and market confidence, and to sustain future development of the business. From time to time, the Group purchases its own shares on the market; the timing of these purchases depends on market prices. Primarily, such shares are intended to be used for satisfying awards under the Group’s share–based incentive schemes. Buy and sell decisions are made on a specific transaction basis by the Board.
Neither the Company nor any of its subsidiaries are subject to externally-imposed capital requirements.
25. Provisions
Legal provision
£m
Environmental provision
£m
Warranty provision
£m
Restructuring provision
£m
Disposal provision
£m
Other provision
£mTotal
£m
At 1 November 2013 4.6 2.6 3.1 1.3 — 1.4 13.0Provided 1.4 0.8 0.3 1.5 7.9 — 11.9Foreign exchange adjustments — (0.1) — — — — (0.1)Disposed — — (2.1) — — — (2.1)Paid/released (1.5) — — (1.7) — — (3.2)Reclassification — (0.8) — — 0.8 — —Reclassification from taxation — — — — 7.5 — 7.5
At 31 October 2014 4.5 2.5 1.3 1.1 16.2 1.4 27.0
These provisions are classified on the balance sheet as follows:
2014£m
2013£m
Included in current liabilities 2.9 2.7Included in non–current liabilities 24.1 10.3
27.0 13.0
It is not possible to estimate more accurately the expected timing of any resulting outflows of economic benefits.
The legal provision represents the estimated legal liabilities faced by the Group as at the balance sheet date. Further details of the Group’s contingent liabilities are set out in note 39.
24. Financial instruments and risk management continued
NOTES TO THE GROUP FINANCIAL STATEMENTS CONTINUED
STRATEGIC REPORT
GOVERNANCE
FINANCIAL STATEMENTS
OTHER INFORMATION
117CHEMRING GROUP PLCANNUAL REPORT AND ACCOUNTS 2014
The environmental provision is held in respect of potential liabilities associated with the Group’s facility in Downers Grove, Illinois, USA.
The warranty provision represents management’s best estimate of the Group’s liability for defective products, based on past experience.
The restructuring provision at 31 October 2014 relates to Chemring Countermeasures, Chemring Energetics UK and Alloy Surfaces. The provision is associated with the Performance Recovery Programme and represents management’s best estimate of the costs to be incurred on restructuring programmes during 2015.
The disposal provision relates to estimated liabilities faced by the Group in respect of Mecar, Simmel and Chemring Defence Germany under the terms of their respective sale agreements.
26. Deferred tax The following are the principal deferred tax liabilities/(assets) recognised by the Group and movements thereon:
Accelerated tax depreciation
£m
Retirement benefit
obligations£m
Tax losses
£m
Acquired intangibles
£mOther
£mTotal
£m
At 1 November 2012 17.7 (6.2) (4.1) 16.9 11.5 35.8Credit to income (0.3) — (0.4) (13.3) (7.4) (21.4)Charge to equity — 0.9 — 0.9 0.9 2.7Reclassification — — — 16.4 (16.4) —
At 1 November 2013 17.4 (5.3) (4.5) 20.9 (11.4) 17.1(Credit)/charge to income (2.5) 1.8 (5.7) (5.7) 2.8 (9.3)Credit to equity — (1.1) — (0.4) (0.1) (1.6)Amounts arising on disposals — 0.2 2.7 (10.1) 4.6 (2.6)
At 31 October 2014 14.9 (4.4) (7.5) 4.7 (4.1) 3.6
The Finance Act 2013 provided for a reduction in the main rate of UK corporation tax from 21% to 20% effective from 1 April 2015. This rate reduction has been reflected in the calculation of deferred tax at the balance sheet date.
Certain deferred tax assets and liabilities have been offset in accordance with the Group’s accounting policy. Deferred tax balances after offset are analysed on the balance sheet as follows:
2014£m
2013£m
Non–current liabilities 35.5 38.8Non–current assets (31.9) (21.7)
3.6 17.1
At the balance sheet date, the Group had unrecognised tax losses of £0.7 million (2013: £48.2 million) potentially available for offset against future profits in certain circumstances, the decrease arising primarily as a result of the disposals and recognition of UK losses. No deferred tax asset has been recognised in respect of this amount because of the unpredictability of future taxable qualifying profit streams.
27. Share capital
2014£m
2013£m
Issued and fully paid195,495,925 (2013: 195,493,918) ordinary shares of 1p each 2.0 2.0
During the year, 2,007 ordinary shares (2013: 2,577) were issued for cash to employees under the Group’s approved savings–related share schemes.
The Company’s share capital also includes 62,500 7% cumulative preference shares of £1 each, which are all issued and fully paid–up, and are classified for accounting purposes within non–current liabilities. The cumulative preference shares carry an entitlement to a dividend at the rate of 7p per share per annum, payable in equal instalments on 30 April and 31 October each year. Holders of the preference shares have the right on a winding–up to receive, in priority to any other classes of shares, the sum of £1 per share together with any arrears of dividends.
25. Provisions continued
FINANCIAL STATEMENTS
118 CHEMRING GROUP PLCANNUAL REPORT AND ACCOUNTS 2014
28. Reserves The share premium account, the special capital reserve and the revaluation reserve are not distributable.
Included within retained earnings are £nil of retained profits (2013: £1.4 million) relating to the associated undertaking, £2.1 million (2013: £0.9 million) relating to the share–based payment reserve, and £1.9 million (2013: £0.8 million) of the Company’s own shares held by the Group’s Employment Share Ownership Plan Trust.
29. Own shares
2014£m
2013£m
At beginning and end of the year 9.6 9.6
The own shares reserve represents the cost of shares in the Company purchased in the market and held by the Group to satisfy awards under the Group’s share–based incentive schemes, details of which are set out in note 31. No ordinary shares (2013: nil) were acquired during the year and no ordinary shares (2013: nil) were distributed following the vesting of awards under the PSP. The total number of ordinary shares held in treasury at 31 October 2014 was 2,198,814 (2013: 2,198,814), with an average cost of 439.0p (2013: 439.0p) per share.
This represents 1.1% of the total issued and fully–paid ordinary share capital.
30. Obligations under non–cancellable operating leases
2014£m
2013£m
Minimum lease payments under operating leases recognised in the income statement 2.6 3.5
At the balance sheet date, the Group had outstanding commitments for future minimum lease payments under non–cancellable operating leases, falling due as follows:
2014£m
2013£m
Within one year 2.7 2.0In the second to fifth years 5.8 4.7Over five years 1.9 —
10.4 6.7
Operating lease payments represent rentals payable by the Group. Leases are negotiated for an average term of three years and rentals are fixed for the lease period, with an option to extend for a further period at the then prevailing market rate.
31. Share–based paymentsThe Group operates share–based compensation arrangements to provide incentives to the Group’s senior management and eligible employees. The Group recognised a net charge of £1.2 million (2013: £0.9 million) in respect of share –based payments during the year.
Details of the four schemes which operated during the year are set out below.
The Chemring Group Performance Share Plan (the “PSP”) Under the PSP, conditional awards of ordinary shares are made at nil cost to employees. Awards ordinarily vest on the third anniversary of the award date. The scheme commenced in March 2006.
Number of conditional shares
2014 2013
Outstanding at beginning of the year 2,929,675 2,231,393Awarded 2,057,945 1,753,267Lapsed (1,801,168) (1,054,985)
Outstanding at end of the year 3,186,452 2,929,675
Subject to vesting at end of the year — —
NOTES TO THE GROUP FINANCIAL STATEMENTS CONTINUED
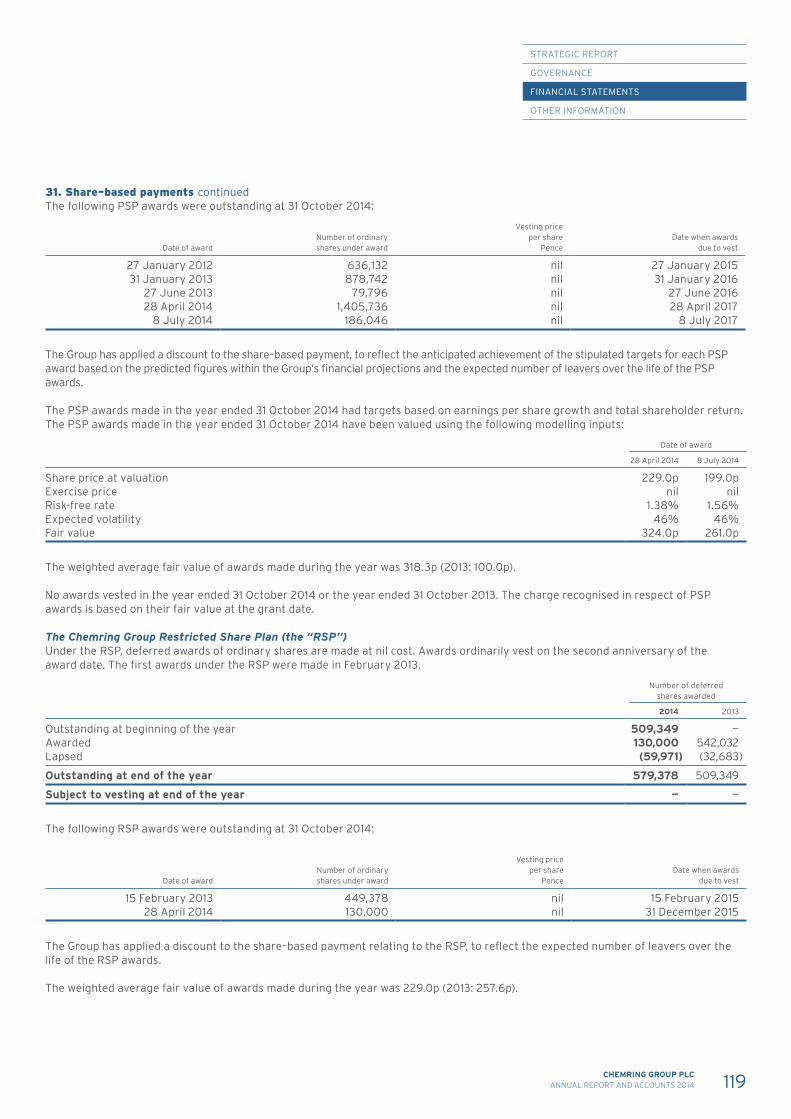
STRATEGIC REPORT
GOVERNANCE
FINANCIAL STATEMENTS
OTHER INFORMATION
119CHEMRING GROUP PLCANNUAL REPORT AND ACCOUNTS 2014
The following PSP awards were outstanding at 31 October 2014:
Date of awardNumber of ordinary shares under award
Vesting price per share
PenceDate when awards
due to vest
27 January 2012 636,132 nil 27 January 201531 January 2013 878,742 nil 31 January 2016
27 June 2013 79,796 nil 27 June 201628 April 2014 1,405,736 nil 28 April 2017
8 July 2014 186,046 nil 8 July 2017
The Group has applied a discount to the share–based payment, to reflect the anticipated achievement of the stipulated targets for each PSP award based on the predicted figures within the Group’s financial projections and the expected number of leavers over the life of the PSP awards.
The PSP awards made in the year ended 31 October 2014 had targets based on earnings per share growth and total shareholder return. The PSP awards made in the year ended 31 October 2014 have been valued using the following modelling inputs:
Date of award
28 April 2014 8 July 2014
Share price at valuation 229.0p 199.0pExercise price nil nilRisk-free rate 1.38% 1.56%Expected volatility 46% 46%Fair value 324.0p 261.0p
The weighted average fair value of awards made during the year was 318.3p (2013: 100.0p).
No awards vested in the year ended 31 October 2014 or the year ended 31 October 2013. The charge recognised in respect of PSP awards is based on their fair value at the grant date.
The Chemring Group Restricted Share Plan (the “RSP”) Under the RSP, deferred awards of ordinary shares are made at nil cost. Awards ordinarily vest on the second anniversary of the award date. The first awards under the RSP were made in February 2013.
Number of deferred shares awarded
2014 2013
Outstanding at beginning of the year 509,349 —Awarded 130,000 542,032Lapsed (59,971) (32,683)
Outstanding at end of the year 579,378 509,349
Subject to vesting at end of the year — —
The following RSP awards were outstanding at 31 October 2014:
Date of awardNumber of ordinary shares under award
Vesting price per share
Pence Date when awards
due to vest
15 February 2013 449,378 nil 15 February 201528 April 2014 130,000 nil 31 December 2015
The Group has applied a discount to the share–based payment relating to the RSP, to reflect the expected number of leavers over the life of the RSP awards.
The weighted average fair value of awards made during the year was 229.0p (2013: 257.6p).
31. Share–based payments continued
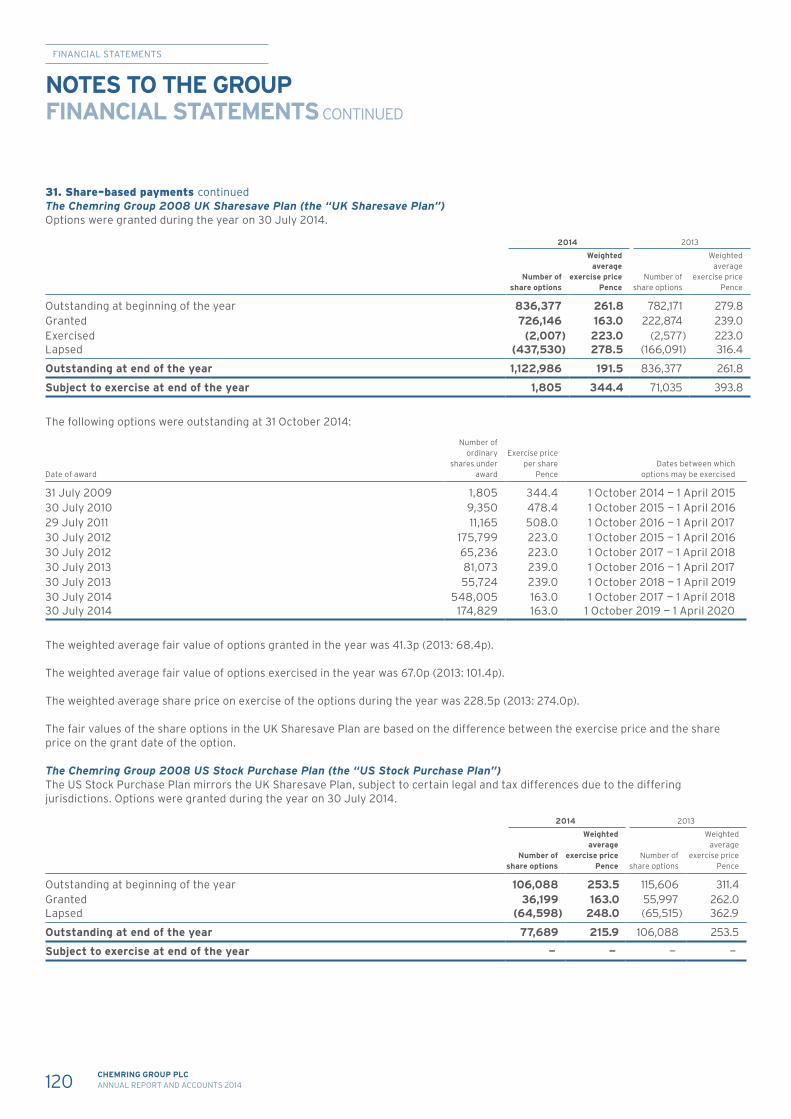
FINANCIAL STATEMENTS
120 CHEMRING GROUP PLCANNUAL REPORT AND ACCOUNTS 2014
The Chemring Group 2008 UK Sharesave Plan (the “UK Sharesave Plan”) Options were granted during the year on 30 July 2014.
2014 2013
Number of share options
Weighted average
exercise pricePence
Number of share options
Weighted average
exercise pricePence
Outstanding at beginning of the year 836,377 261.8 782,171 279.8Granted 726,146 163.0 222,874 239.0Exercised (2,007) 223.0 (2,577) 223.0Lapsed (437,530) 278.5 (166,091) 316.4
Outstanding at end of the year 1,122,986 191.5 836,377 261.8
Subject to exercise at end of the year 1,805 344.4 71,035 393.8
The following options were outstanding at 31 October 2014:
Date of award
Number of ordinary
shares under award
Exercise price per share
PenceDates between which
options may be exercised
31 July 2009 1,805 344.4 1 October 2014 — 1 April 201530 July 2010 9,350 478.4 1 October 2015 — 1 April 201629 July 2011 11,165 508.0 1 October 2016 — 1 April 201730 July 2012 175,799 223.0 1 October 2015 — 1 April 201630 July 2012 65,236 223.0 1 October 2017 — 1 April 2018 30 July 2013 81,073 239.0 1 October 2016 — 1 April 201730 July 2013 55,724 239.0 1 October 2018 — 1 April 201930 July 2014 548,005 163.0 1 October 2017 — 1 April 201830 July 2014 174,829 163.0 1 October 2019 — 1 April 2020
The weighted average fair value of options granted in the year was 41.3p (2013: 68.4p).
The weighted average fair value of options exercised in the year was 67.0p (2013: 101.4p).
The weighted average share price on exercise of the options during the year was 228.5p (2013: 274.0p).
The fair values of the share options in the UK Sharesave Plan are based on the difference between the exercise price and the share price on the grant date of the option.
The Chemring Group 2008 US Stock Purchase Plan (the “US Stock Purchase Plan”) The US Stock Purchase Plan mirrors the UK Sharesave Plan, subject to certain legal and tax differences due to the differing jurisdictions. Options were granted during the year on 30 July 2014.
2014 2013
Number of share options
Weighted average
exercise pricePence
Number of share options
Weighted average
exercise pricePence
Outstanding at beginning of the year 106,088 253.5 115,606 311.4Granted 36,199 163.0 55,997 262.0Lapsed (64,598) 248.0 (65,515) 362.9
Outstanding at end of the year 77,689 215.9 106,088 253.5
Subject to exercise at end of the year — — — —
31. Share–based payments continued
NOTES TO THE GROUP FINANCIAL STATEMENTS CONTINUED
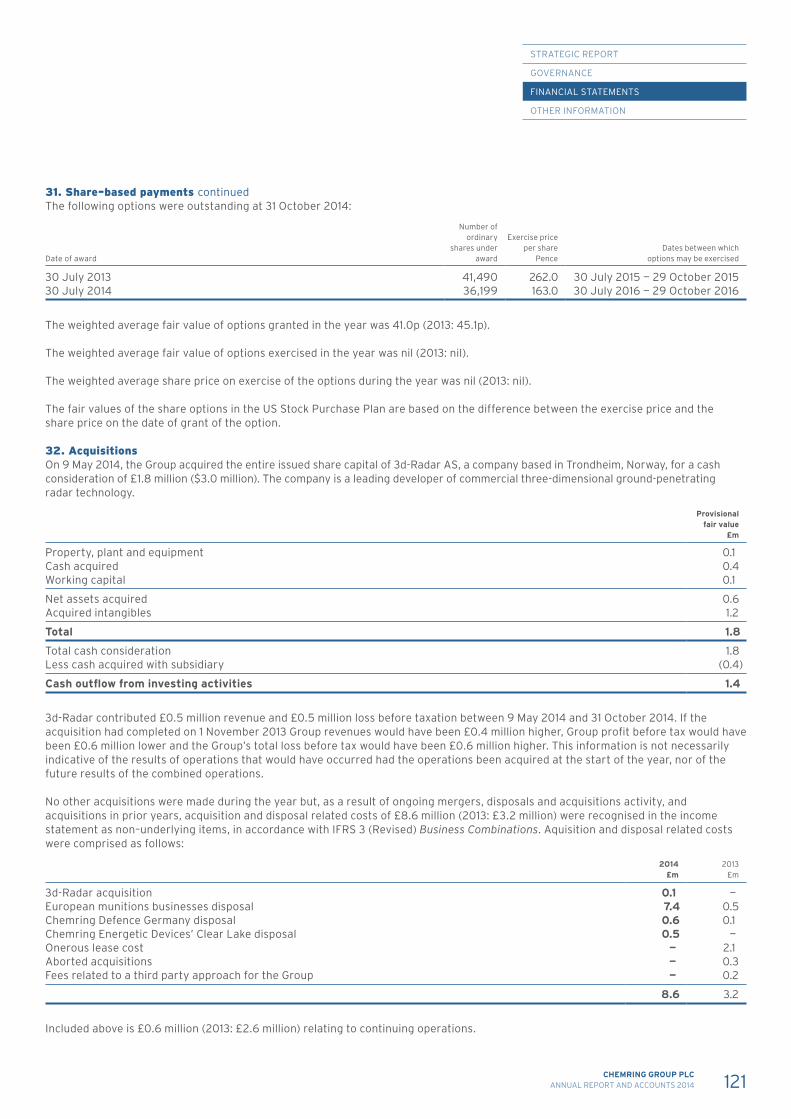
STRATEGIC REPORT
GOVERNANCE
FINANCIAL STATEMENTS
OTHER INFORMATION
121CHEMRING GROUP PLCANNUAL REPORT AND ACCOUNTS 2014
The following options were outstanding at 31 October 2014:
Date of award
Number of ordinary
shares under award
Exercise price per share
PenceDates between which
options may be exercised
30 July 2013 41,490 262.0 30 July 2015 — 29 October 201530 July 2014 36,199 163.0 30 July 2016 — 29 October 2016
The weighted average fair value of options granted in the year was 41.0p (2013: 45.1p).
The weighted average fair value of options exercised in the year was nil (2013: nil).
The weighted average share price on exercise of the options during the year was nil (2013: nil).
The fair values of the share options in the US Stock Purchase Plan are based on the difference between the exercise price and the share price on the date of grant of the option.
32. Acquisitions On 9 May 2014, the Group acquired the entire issued share capital of 3d-Radar AS, a company based in Trondheim, Norway, for a cash consideration of £1.8 million ($3.0 million). The company is a leading developer of commercial three-dimensional ground-penetrating radar technology.
Provisional fair value
£m
Property, plant and equipment 0.1Cash acquired 0.4Working capital 0.1
Net assets acquired 0.6Acquired intangibles 1.2
Total 1.8
Total cash consideration 1.8Less cash acquired with subsidiary (0.4)
Cash outflow from investing activities 1.4
3d-Radar contributed £0.5 million revenue and £0.5 million loss before taxation between 9 May 2014 and 31 October 2014. If the acquisition had completed on 1 November 2013 Group revenues would have been £0.4 million higher, Group profit before tax would have been £0.6 million lower and the Group’s total loss before tax would have been £0.6 million higher. This information is not necessarily indicative of the results of operations that would have occurred had the operations been acquired at the start of the year, nor of the future results of the combined operations.
No other acquisitions were made during the year but, as a result of ongoing mergers, disposals and acquisitions activity, and acquisitions in prior years, acquisition and disposal related costs of £8.6 million (2013: £3.2 million) were recognised in the income statement as non–underlying items, in accordance with IFRS 3 (Revised) Business Combinations. Aquisition and disposal related costs were comprised as follows:
2014£m
2013£m
3d-Radar acquisition 0.1 —European munitions businesses disposal 7.4 0.5Chemring Defence Germany disposal 0.6 0.1Chemring Energetic Devices’ Clear Lake disposal 0.5 —Onerous lease cost — 2.1Aborted acquisitions — 0.3Fees related to a third party approach for the Group — 0.2
8.6 3.2
Included above is £0.6 million (2013: £2.6 million) relating to continuing operations.
31. Share–based payments continued
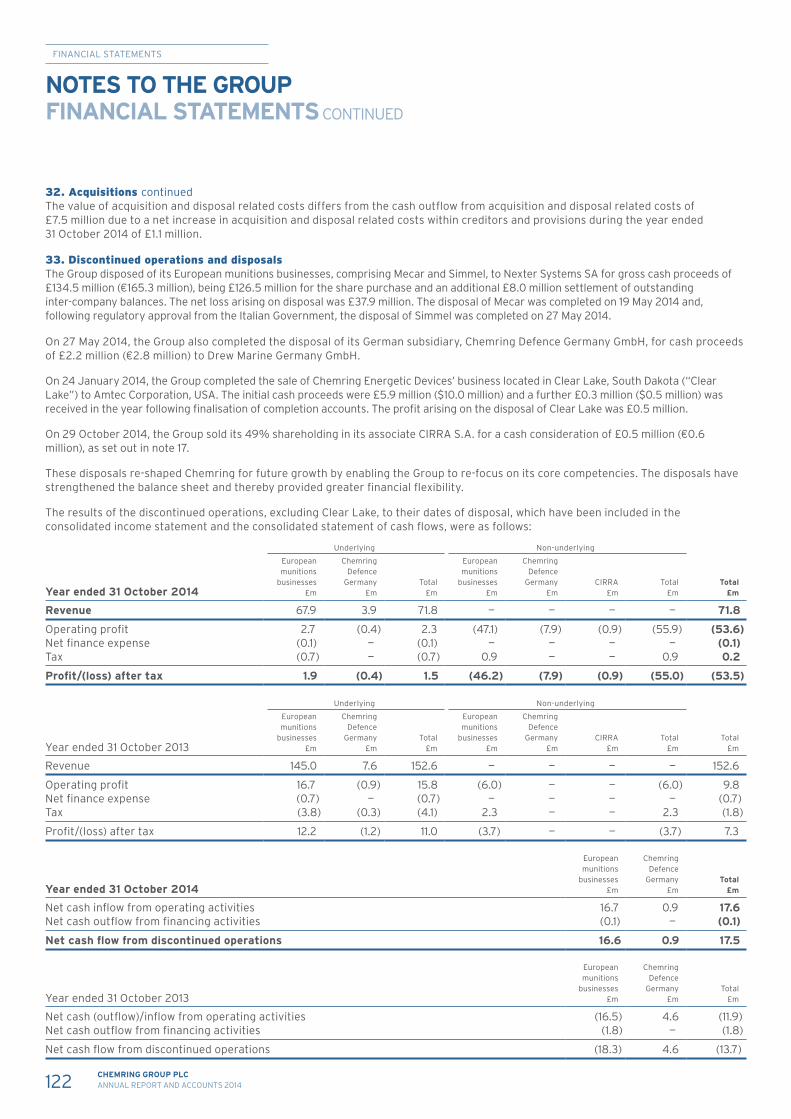
FINANCIAL STATEMENTS
122 CHEMRING GROUP PLCANNUAL REPORT AND ACCOUNTS 2014
The value of acquisition and disposal related costs differs from the cash outflow from acquisition and disposal related costs of £7.5 million due to a net increase in acquisition and disposal related costs within creditors and provisions during the year ended 31 October 2014 of £1.1 million.
33. Discontinued operations and disposalsThe Group disposed of its European munitions businesses, comprising Mecar and Simmel, to Nexter Systems SA for gross cash proceeds of £134.5 million (€165.3 million), being £126.5 million for the share purchase and an additional £8.0 million settlement of outstanding inter-company balances. The net loss arising on disposal was £37.9 million. The disposal of Mecar was completed on 19 May 2014 and, following regulatory approval from the Italian Government, the disposal of Simmel was completed on 27 May 2014.
On 27 May 2014, the Group also completed the disposal of its German subsidiary, Chemring Defence Germany GmbH, for cash proceeds of £2.2 million (€2.8 million) to Drew Marine Germany GmbH.
On 24 January 2014, the Group completed the sale of Chemring Energetic Devices’ business located in Clear Lake, South Dakota (“Clear Lake”) to Amtec Corporation, USA. The initial cash proceeds were £5.9 million ($10.0 million) and a further £0.3 million ($0.5 million) was received in the year following finalisation of completion accounts. The profit arising on the disposal of Clear Lake was £0.5 million.
On 29 October 2014, the Group sold its 49% shareholding in its associate CIRRA S.A. for a cash consideration of £0.5 million (€0.6 million), as set out in note 17.
These disposals re-shaped Chemring for future growth by enabling the Group to re-focus on its core competencies. The disposals have strengthened the balance sheet and thereby provided greater financial flexibility.
The results of the discontinued operations, excluding Clear Lake, to their dates of disposal, which have been included in the consolidated income statement and the consolidated statement of cash flows, were as follows:
Year ended 31 October 2014
Underlying Non-underlying
European munitions
businesses £m
Chemring Defence
Germany £m
Total £m
European munitions
businesses £m
Chemring Defence
Germany £m
CIRRA £m
Total £m
Total £m
Revenue 67.9 3.9 71.8 — — — — 71.8
Operating profit 2.7 (0.4) 2.3 (47.1) (7.9) (0.9) (55.9) (53.6)Net finance expense (0.1) — (0.1) — — — — (0.1)Tax (0.7) — (0.7) 0.9 — — 0.9 0.2
Profit/(loss) after tax 1.9 (0.4) 1.5 (46.2) (7.9) (0.9) (55.0) (53.5)
Year ended 31 October 2013
Underlying Non-underlying
European munitions
businesses £m
Chemring Defence
Germany £m
Total £m
European munitions
businesses £m
Chemring Defence
Germany £m
CIRRA £m
Total £m
Total £m
Revenue 145.0 7.6 152.6 — — — — 152.6
Operating profit 16.7 (0.9) 15.8 (6.0) — — (6.0) 9.8Net finance expense (0.7) — (0.7) — — — — (0.7)Tax (3.8) (0.3) (4.1) 2.3 — — 2.3 (1.8)
Profit/(loss) after tax 12.2 (1.2) 11.0 (3.7) — — (3.7) 7.3
Year ended 31 October 2014
European munitions
businesses£m
Chemring Defence
Germany £m
Total £m
Net cash inflow from operating activities 16.7 0.9 17.6Net cash outflow from financing activities (0.1) — (0.1)
Net cash flow from discontinued operations 16.6 0.9 17.5
Year ended 31 October 2013
European munitions
businesses£m
Chemring Defence
Germany £m
Total £m
Net cash (outflow)/inflow from operating activities (16.5) 4.6 (11.9)Net cash outflow from financing activities (1.8) — (1.8)
Net cash flow from discontinued operations (18.3) 4.6 (13.7)
32. Acquisitions continued
NOTES TO THE GROUP FINANCIAL STATEMENTS CONTINUED
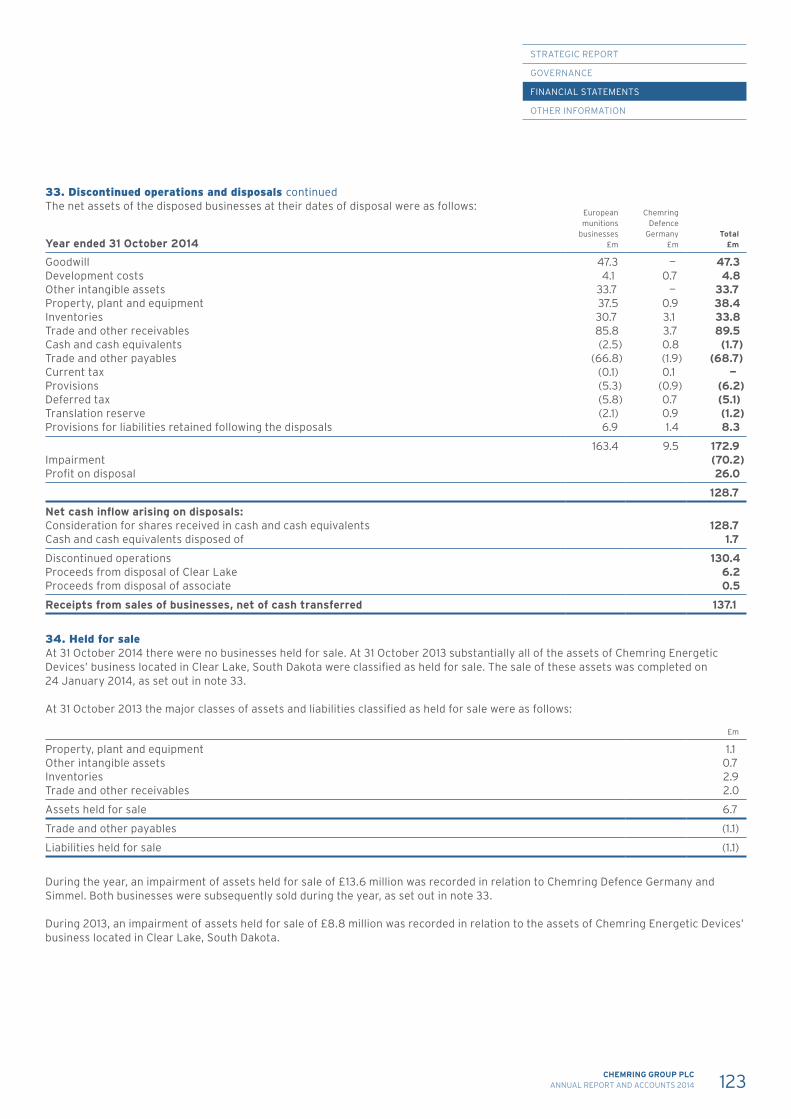
STRATEGIC REPORT
GOVERNANCE
FINANCIAL STATEMENTS
OTHER INFORMATION
123CHEMRING GROUP PLCANNUAL REPORT AND ACCOUNTS 2014
The net assets of the disposed businesses at their dates of disposal were as follows:
Year ended 31 October 2014
European munitions
businesses £m
Chemring Defence
Germany £m
Total £m
Goodwill 47.3 — 47.3Development costs 4.1 0.7 4.8Other intangible assets 33.7 — 33.7Property, plant and equipment 37.5 0.9 38.4Inventories 30.7 3.1 33.8Trade and other receivables 85.8 3.7 89.5Cash and cash equivalents (2.5) 0.8 (1.7)Trade and other payables (66.8) (1.9) (68.7)Current tax (0.1) 0.1 —Provisions (5.3) (0.9) (6.2)Deferred tax (5.8) 0.7 (5.1)Translation reserve (2.1) 0.9 (1.2)Provisions for liabilities retained following the disposals 6.9 1.4 8.3
163.4 9.5 172.9Impairment (70.2)Profit on disposal 26.0
128.7
Net cash inflow arising on disposals:Consideration for shares received in cash and cash equivalents 128.7Cash and cash equivalents disposed of 1.7
Discontinued operations 130.4Proceeds from disposal of Clear Lake 6.2Proceeds from disposal of associate 0.5
Receipts from sales of businesses, net of cash transferred 137.1
34. Held for sale At 31 October 2014 there were no businesses held for sale. At 31 October 2013 substantially all of the assets of Chemring Energetic Devices’ business located in Clear Lake, South Dakota were classified as held for sale. The sale of these assets was completed on 24 January 2014, as set out in note 33.
At 31 October 2013 the major classes of assets and liabilities classified as held for sale were as follows:
£m
Property, plant and equipment 1.1Other intangible assets 0.7Inventories 2.9Trade and other receivables 2.0
Assets held for sale 6.7
Trade and other payables (1.1)
Liabilities held for sale (1.1)
During the year, an impairment of assets held for sale of £13.6 million was recorded in relation to Chemring Defence Germany and Simmel. Both businesses were subsequently sold during the year, as set out in note 33.
During 2013, an impairment of assets held for sale of £8.8 million was recorded in relation to the assets of Chemring Energetic Devices’ business located in Clear Lake, South Dakota.
33. Discontinue d operations and disposals continued

FINANCIAL STATEMENTS
124 CHEMRING GROUP PLCANNUAL REPORT AND ACCOUNTS 2014
In the UK, the Group operates a defined benefit scheme (the “Chemring Group Staff Pension Scheme”). In Norway, Chemring Nobel operates a defined benefit scheme (the “Chemring Nobel Scheme”). The Group’s other UK and overseas pension arrangements are all defined contribution schemes, with a combined cost of £6.0 million (2013: £6.3 million).
The Chemring Group Staff Pension Scheme is a funded scheme and the assets of the scheme are held in a separate trustee administered fund. The scheme was closed to future accrual on 6 April 2012. A full actuarial valuation of the Chemring Group Staff Pension Scheme as at 6 April 2012 has been completed and updated to 31 October 2014 by a qualified actuary, using the projected unit credit method. The main assumptions for the scheme are detailed below. The deficit of the Chemring Group Staff Pension Scheme was £22.0 million at 31 October 2014 (2013: £24.2 million).
Under the funding plan agreed with the trustees following the 2012 actuarial valuation, the Company has agreed to eliminate the deficit indicated by that valuation over a period of seven years. This funding plan provides for contributions of £8.2 million to be paid by the Group in monthly instalments during the year ended 31 October 2014 and, thereafter, £5.0 million per annum to be paid in monthly instalments until 2019. The Company and the trustees monitor funding levels annually, and a new funding plan is agreed with the trustees every three years, based on actuarial valuations. The Group considers that the current contribution rates agreed with the trustees are sufficient to eliminate the calculated deficit over the agreed period.
The Group has provided a bank guarantee and letters of credit totalling £21.6 million (2013: £27.2 million) to the Chemring Group Staff Pension Scheme, comprising a £14.4 million letter of credit and a £7.2 million bank guarantee, which may only be drawn upon certain events of default by the Company. The value of the bank guarantee and letters of credit has reduced during the year as deficit reduction payments have been made by the Company.
The unfunded pension scheme relating to Chemring Defence Germany (the “Chemring Defence Germany Scheme”) transferred to the purchaser of that business on 27 May 2014, as set out in note 33. The net deficit of that scheme was £0.9 million at 31 October 2013.
The Chemring Nobel Scheme is an unfunded scheme. The actuarial liability has been calculated at 31 October 2014 by a qualified actuary using the projected unit credit method. The main assumptions used were a discount rate of 3.0% and rate of increase in deferred pensions of 0.1%. The net surplus of the Chemring Nobel Scheme was £0.2 million at 31 October 2014 (2013: £nil).
Chemring Group PLC is the principal employer of all schemes and due to the similarity of the schemes, the schemes have been netted–off in the table below.
The amount recognised in the balance sheet in respect of the Group’s defined benefit schemes is as follows:
2014£m
2013£m
2012£m
Present value of funded and unfunded obligations (80.9) (76.7) (71.6)Fair value of schemes’ assets 59.1 51.6 44.6
Net retirement benefit obligation recognised in the balance sheet (21.8) (25.1) (27.0)
An analysis of the retirement benefit obligation recognised in the balance sheet by scheme is as follows:
2014£m
2013£m
2012£m
Chemring Group Staff Pension Scheme (22.0) (24.2) (25.9)Chemring Defence Germany Scheme — (0.9) (0.8)Chemring Nobel Scheme 0.2 — (0.3)
Net retirement benefit obligation recognised in the balance sheet (21.8) (25.1) (27.0)
Amounts recognised in the income statement in respect of the Group’s defined benefit schemes were as follows:
2014£m
2013 As restated
£m
Amounts included within operating profitCurrent service cost — (0.2)
Amounts included within finance expense Expected return on scheme assets 2.0 1.7Discount on scheme liabilities (3.1) (3.0)
(1.1) (1.3)
Net charge recognised in the income statement (1.1) (1.5)
35. Pensions
NOTES TO THE GROUP FINANCIAL STATEMENTS CONTINUED
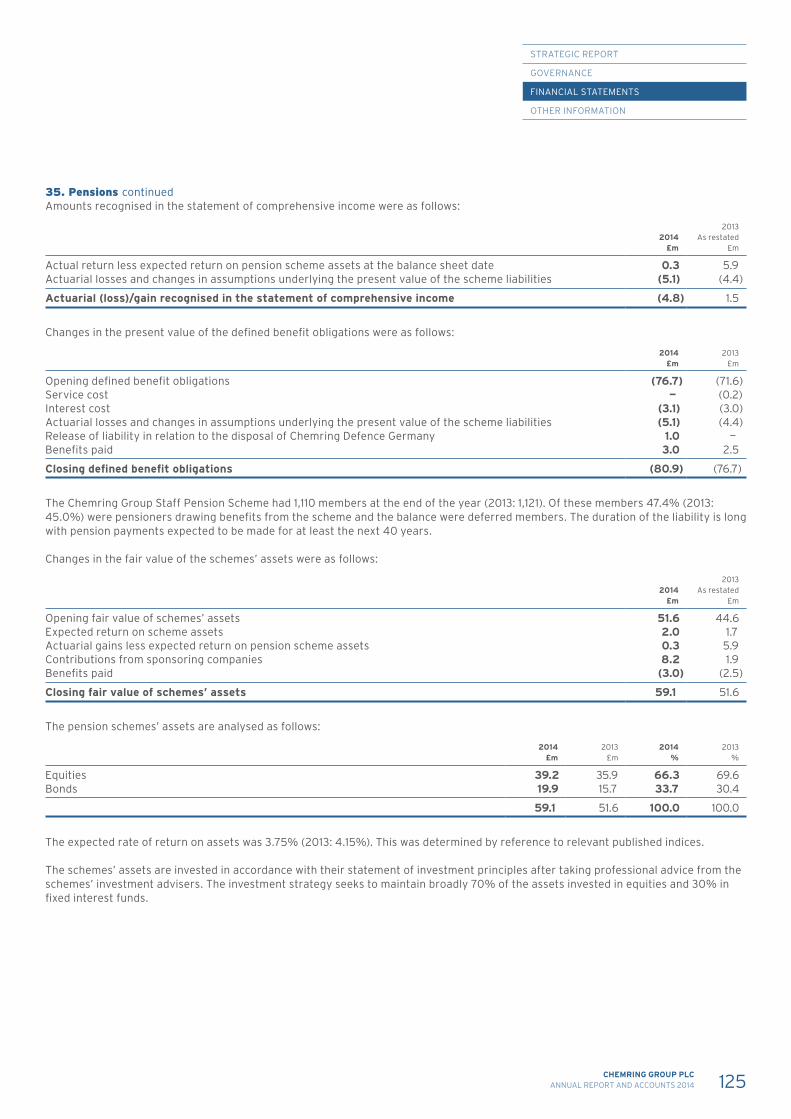
STRATEGIC REPORT
GOVERNANCE
FINANCIAL STATEMENTS
OTHER INFORMATION
125CHEMRING GROUP PLCANNUAL REPORT AND ACCOUNTS 2014
Amounts recognised in the statement of comprehensive income were as follows:
2014£m
2013 As restated
£m
Actual return less expected return on pension scheme assets at the balance sheet date 0.3 5.9Actuarial losses and changes in assumptions underlying the present value of the scheme liabilities (5.1) (4.4)
Actuarial (loss)/gain recognised in the statement of comprehensive income (4.8) 1.5
Changes in the present value of the defined benefit obligations were as follows:
2014£m
2013£m
Opening defined benefit obligations (76.7) (71.6)Service cost — (0.2)Interest cost (3.1) (3.0)Actuarial losses and changes in assumptions underlying the present value of the scheme liabilities (5.1) (4.4)Release of liability in relation to the disposal of Chemring Defence Germany 1.0 —Benefits paid 3.0 2.5
Closing defined benefit obligations (80.9) (76.7)
The Chemring Group Staff Pension Scheme had 1,110 members at the end of the year (2013: 1,121). Of these members 47.4% (2013: 45.0%) were pensioners drawing benefits from the scheme and the balance were deferred members. The duration of the liability is long with pension payments expected to be made for at least the next 40 years.
Changes in the fair value of the schemes’ assets were as follows:
2014£m
2013As restated
£m
Opening fair value of schemes’ assets 51.6 44.6Expected return on scheme assets 2.0 1.7Actuarial gains less expected return on pension scheme assets 0.3 5.9Contributions from sponsoring companies 8.2 1.9Benefits paid (3.0) (2.5)
Closing fair value of schemes’ assets 59.1 51.6
The pension schemes’ assets are analysed as follows:
2014£m
2013£m
2014%
2013%
Equities 39.2 35.9 66.3 69.6Bonds 19.9 15.7 33.7 30.4
59.1 51.6 100.0 100.0
The expected rate of return on assets was 3.75% (2013: 4.15%). This was determined by reference to relevant published indices.
The schemes’ assets are invested in accordance with their statement of investment principles after taking professional advice from the schemes’ investment advisers. The investment strategy seeks to maintain broadly 70% of the assets invested in equities and 30% in fixed interest funds.
35. Pensions continued
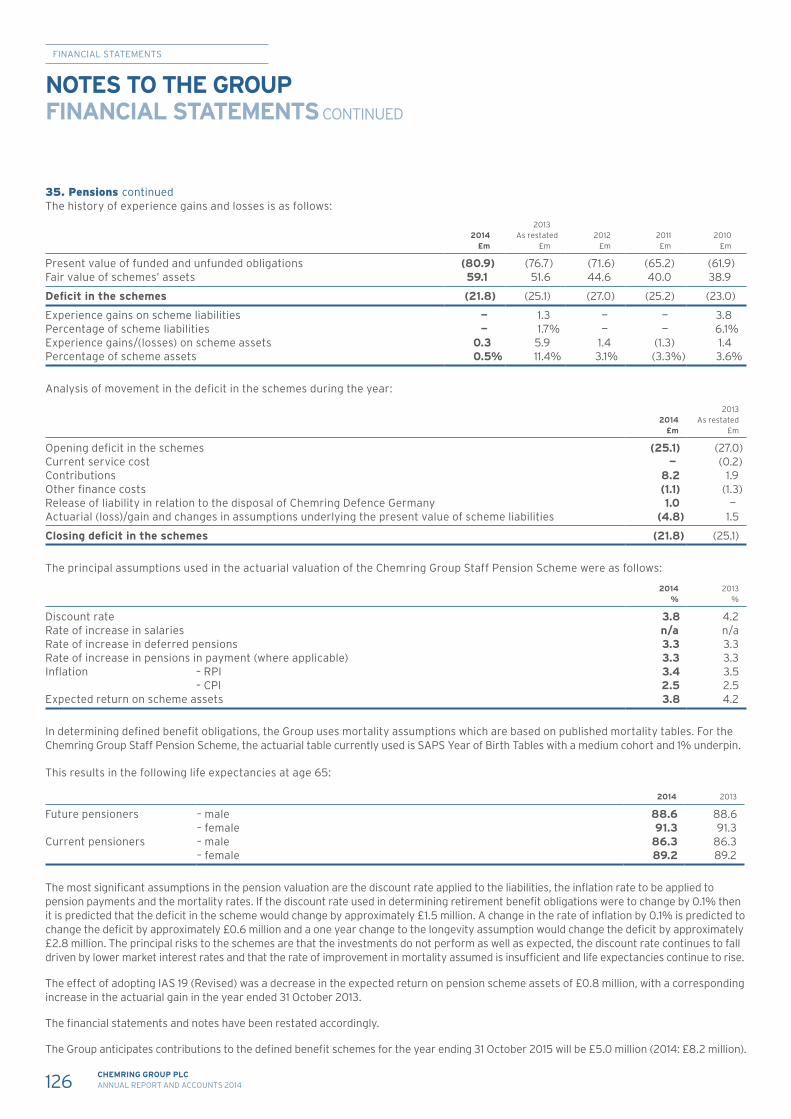
FINANCIAL STATEMENTS
126 CHEMRING GROUP PLCANNUAL REPORT AND ACCOUNTS 2014
The history of experience gains and losses is as follows:
2014£m
2013As restated
£m2012
£m2011£m
2010£m
Present value of funded and unfunded obligations (80.9) (76.7) (71.6) (65.2) (61.9)Fair value of schemes’ assets 59.1 51.6 44.6 40.0 38.9
Deficit in the schemes (21.8) (25.1) (27.0) (25.2) (23.0)
Experience gains on scheme liabilities — 1.3 — — 3.8Percentage of scheme liabilities — 1.7% — — 6.1%Experience gains/(losses) on scheme assets 0.3 5.9 1.4 (1.3) 1.4Percentage of scheme assets 0.5% 11.4% 3.1% (3.3%) 3.6%
Analysis of movement in the deficit in the schemes during the year:
2014£m
2013As restated
£m
Opening deficit in the schemes (25.1) (27.0)Current service cost — (0.2)Contributions 8.2 1.9Other finance costs (1.1) (1.3)Release of liability in relation to the disposal of Chemring Defence Germany 1.0 —Actuarial (loss)/gain and changes in assumptions underlying the present value of scheme liabilities (4.8) 1.5
Closing deficit in the schemes (21.8) (25.1)
The principal assumptions used in the actuarial valuation of the Chemring Group Staff Pension Scheme were as follows:
2014%
2013%
Discount rate 3.8 4.2Rate of increase in salaries n/a n/aRate of increase in deferred pensions 3.3 3.3Rate of increase in pensions in payment (where applicable) 3.3 3.3Inflation – RPI 3.4 3.5 – CPI 2.5 2.5Expected return on scheme assets 3.8 4.2
In determining defined benefit obligations, the Group uses mortality assumptions which are based on published mortality tables. For the Chemring Group Staff Pension Scheme, the actuarial table currently used is SAPS Year of Birth Tables with a medium cohort and 1% underpin.
This results in the following life expectancies at age 65:
2014 2013
Future pensioners – male 88.6 88.6– female 91.3 91.3
Current pensioners – male 86.3 86.3– female 89.2 89.2
The most significant assumptions in the pension valuation are the discount rate applied to the liabilities, the inflation rate to be applied to pension payments and the mortality rates. If the discount rate used in determining retirement benefit obligations were to change by 0.1% then it is predicted that the deficit in the scheme would change by approximately £1.5 million. A change in the rate of inflation by 0.1% is predicted to change the deficit by approximately £0.6 million and a one year change to the longevity assumption would change the deficit by approximately £2.8 million. The principal risks to the schemes are that the investments do not perform as well as expected, the discount rate continues to fall driven by lower market interest rates and that the rate of improvement in mortality assumed is insufficient and life expectancies continue to rise.
The effect of adopting IAS 19 (Revised) was a decrease in the expected return on pension scheme assets of £0.8 million, with a corresponding increase in the actuarial gain in the year ended 31 October 2013.
The financial statements and notes have been restated accordingly.
The Group anticipates contributions to the defined benefit schemes for the year ending 31 October 2015 will be £5.0 million (2014: £8.2 million).
35. Pensions continued
NOTES TO THE GROUP FINANCIAL STATEMENTS CONTINUED
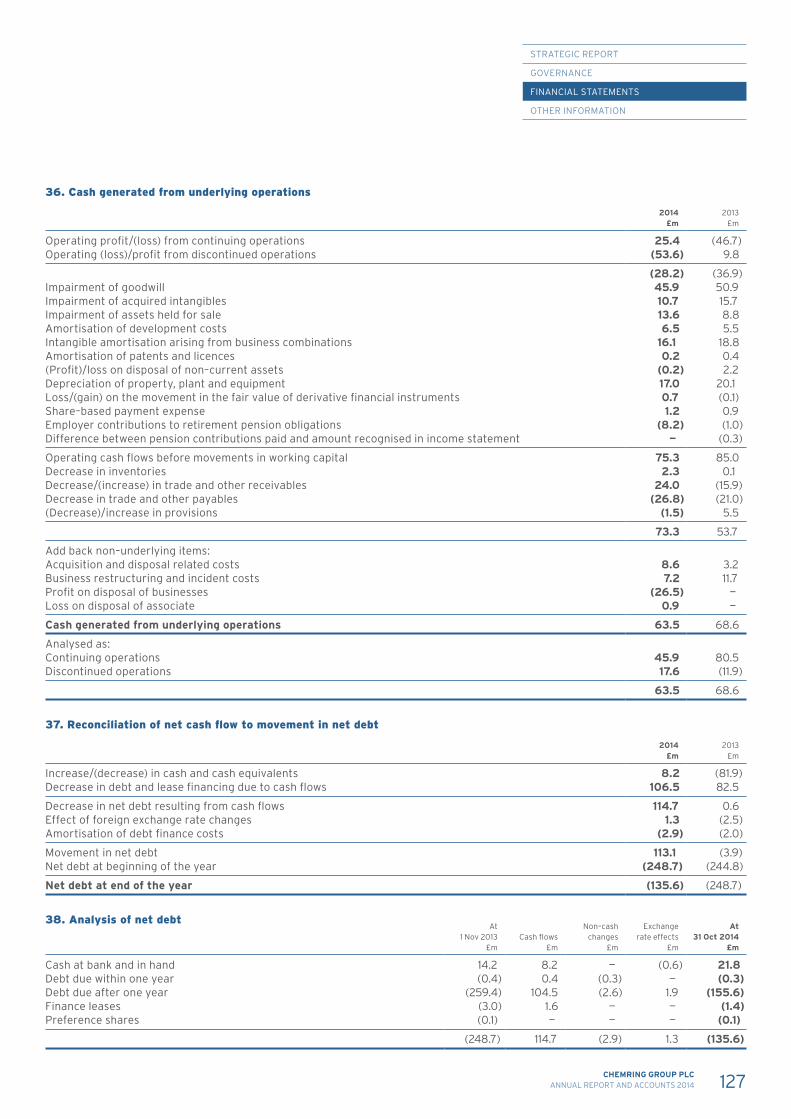
STRATEGIC REPORT
GOVERNANCE
FINANCIAL STATEMENTS
OTHER INFORMATION
127CHEMRING GROUP PLCANNUAL REPORT AND ACCOUNTS 2014
36. Cash generated from underlying operations
2014£m
2013£m
Operating profit/(loss) from continuing operations 25.4 (46.7)Operating (loss)/profit from discontinued operations (53.6) 9.8
(28.2) (36.9)Impairment of goodwill 45.9 50.9Impairment of acquired intangibles 10.7 15.7Impairment of assets held for sale 13.6 8.8Amortisation of development costs 6.5 5.5Intangible amortisation arising from business combinations 16.1 18.8Amortisation of patents and licences 0.2 0.4(Profit)/loss on disposal of non–current assets (0.2) 2.2Depreciation of property, plant and equipment 17.0 20.1Loss/(gain) on the movement in the fair value of derivative financial instruments 0.7 (0.1)Share–based payment expense 1.2 0.9Employer contributions to retirement pension obligations (8.2) (1.0)Difference between pension contributions paid and amount recognised in income statement — (0.3)
Operating cash flows before movements in working capital 75.3 85.0Decrease in inventories 2.3 0.1Decrease/(increase) in trade and other receivables 24.0 (15.9)Decrease in trade and other payables (26.8) (21.0)(Decrease)/increase in provisions (1.5) 5.5
73.3 53.7
Add back non–underlying items:Acquisition and disposal related costs 8.6 3.2Business restructuring and incident costs 7.2 11.7Profit on disposal of businesses (26.5) —Loss on disposal of associate 0.9 —
Cash generated from underlying operations 63.5 68.6
Analysed as: Continuing operations 45.9 80.5Discontinued operations 17.6 (11.9)
63.5 68.6
37. Reconciliation of net cash flow to movement in net debt
2014£m
2013£m
Increase/(decrease) in cash and cash equivalents 8.2 (81.9)Decrease in debt and lease financing due to cash flows 106.5 82.5
Decrease in net debt resulting from cash flows 114.7 0.6Effect of foreign exchange rate changes 1.3 (2.5)Amortisation of debt finance costs (2.9) (2.0)
Movement in net debt 113.1 (3.9)Net debt at beginning of the year (248.7) (244.8)
Net debt at end of the year (135.6) (248.7)
38. Analysis of net debtAt
1 Nov 2013£m
Cash flows£m
Non–cash changes
£m
Exchange rate effects
£m
At 31 Oct 2014
£m
Cash at bank and in hand 14.2 8.2 — (0.6) 21.8Debt due within one year (0.4) 0.4 (0.3) — (0.3)Debt due after one year (259.4) 104.5 (2.6) 1.9 (155.6)Finance leases (3.0) 1.6 — — (1.4)Preference shares (0.1) — — — (0.1)
(248.7) 114.7 (2.9) 1.3 (135.6)
FINANCIAL STATEMENTS
128 CHEMRING GROUP PLCANNUAL REPORT AND ACCOUNTS 2014
39. Contingent liabilities The Group enters into contracts which have offset commitments. These requirements are valued at the time of the contract being awarded. The cost of the offsets are reviewed throughout the contract life and provided for within the contract costings to the extent of the potential liability.
At 31 October 2014, the Group had contingent liabilities in respect of bank and contractual performance guarantees and other matters arising in the ordinary course of business. Where it is expected that a material liability will arise in respect of these matters, appropriate provision is made within the financial statements. As the conditions of these guarantees are currently being met, no obligating event is foreseeable and therefore no provision has been made.
The Group is, from time to time, party to legal proceedings and claims, and is involved in correspondence relating to potential claims, which arise in the ordinary course of business. The Group is currently engaged in pre–action correspondence in relation to the manufacture of certain components for the Next Generation Light Anti-Tank Weapon (“NLAW”) combat weapon by Chemring Energetics UK. In addition, the Group is also engaged in pre-action correspondence with the Defense Contract Audit Agency of the US Department of Defense in relation to disputed pricing calculations on certain contracts fulfilled by Alloy Surfaces.
In light of the current status of these matters, the directors do not consider the outcome of all the proceedings, actions and claims in which it is currently involved, either individually or in aggregate, will have a material adverse effect upon the Group’s financial position. A provision of £4.5 million (2013: £4.6 million) exists to cover estimated legal costs for the Group with regards to pending and probable legal actions. This provision is detailed in note 25.
The Group has a £2.5 million deductible per claim under its material damage and business interruption insurance policy, subject to a maximum aggregate deductible of £3.5 million in any one year.
40. Related party transactions Transactions between the Company and its subsidiaries, which are related parties, have been eliminated on consolidation and are not disclosed in this note. Transactions with the Group’s pension schemes are disclosed in note 35.
Trading transactions There were no trading activities between the Group and its associate.
Remuneration of key management personnel For the purposes of remuneration disclosure, key management personnel includes only the executive directors and excludes the other senior business managers and members of the Executive Committee. Their remuneration is set out below in aggregate for each of the categories specified in IAS 24 Related Party Disclosures. Further information on the remuneration of individual directors is provided in the audited part of the directors’ remuneration report on pages 58 to 77.
The directors of the Company had no material transactions with the Company during the year, other than in connection with their service agreements. The remuneration of the executive directors is determined by the Remuneration Committee, having regard to the performance of the individuals and market trends. The remuneration of the non–executive directors is determined by the Board, having regard to the practice of other companies and the particular demands of the Group.
2014£m
2013£m
Remuneration of key management personnel 1.8 1.5
Further detail can be found in the directors’ remuneration report on pages 58 to 77.
41. Additional information, as required by Listing Rules Requirement 9.8.4Capitalised interest — see notes 9 and 15Long-term incentive schemes — see directors’ remuneration reportAllocation of equity securities for cash — see note 27Contracts of significance — see note 40Election of independent directors — see corporate governance reportContractual arrangements — see directors’ reportDetails of independent directors — see directors’ reportSubstantial shareholders — see directors’ report
No profit forecasts are issued by the Group and no directors have waived any current or future emoluments. Other than in relation to ordinary shares held in treasury, no shareholders have waived or agreed to waive dividends.
None of the shareholders is considered to be a Controlling Shareholder (as defined in Listing Rules 6.1.2A) and the Group complies with the independence provisions of the Listing Rules.
NOTES TO THE GROUP FINANCIAL STATEMENTS CONTINUED
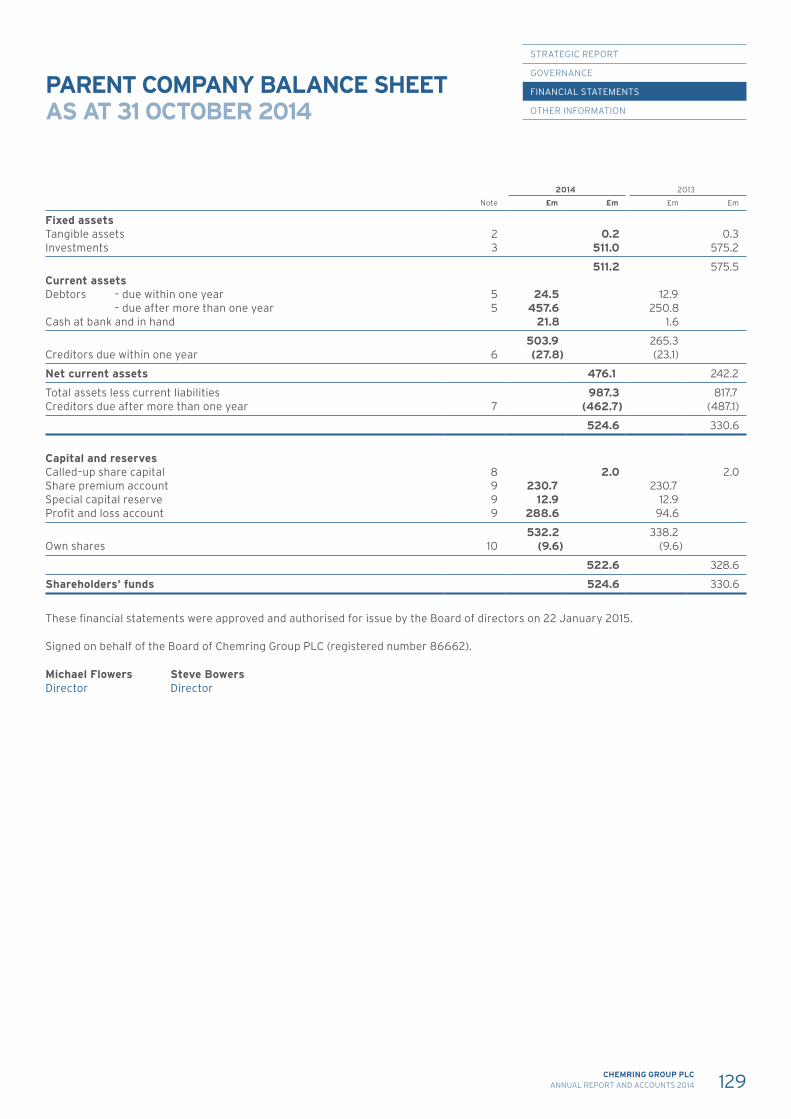
STRATEGIC REPORT
GOVERNANCE
FINANCIAL STATEMENTS
OTHER INFORMATION
129CHEMRING GROUP PLCANNUAL REPORT AND ACCOUNTS 2014
PARENT COMPANY BALANCE SHEETAS AT 31 OCTOBER 2014
2014 2013
Note £m £m £m £m
Fixed assetsTangible assets 2 0.2 0.3Investments 3 511.0 575.2
511.2 575.5Current assets Debtors – due within one year 5 24.5 12.9 – due after more than one year 5 457.6 250.8Cash at bank and in hand 21.8 1.6
503.9 265.3Creditors due within one year 6 (27.8) (23.1)
Net current assets 476.1 242.2
Total assets less current liabilities 987.3 817.7Creditors due after more than one year 7 (462.7) (487.1)
524.6 330.6
Capital and reserves Called–up share capital 8 2.0 2.0Share premium account 9 230.7 230.7Special capital reserve 9 12.9 12.9Profit and loss account 9 288.6 94.6
532.2 338.2Own shares 10 (9.6) (9.6)
522.6 328.6
Shareholders’ funds 524.6 330.6
These financial statements were approved and authorised for issue by the Board of directors on 22 January 2015. Signed on behalf of the Board of Chemring Group PLC (registered number 86662).
Michael Flowers Steve Bowers Director Director
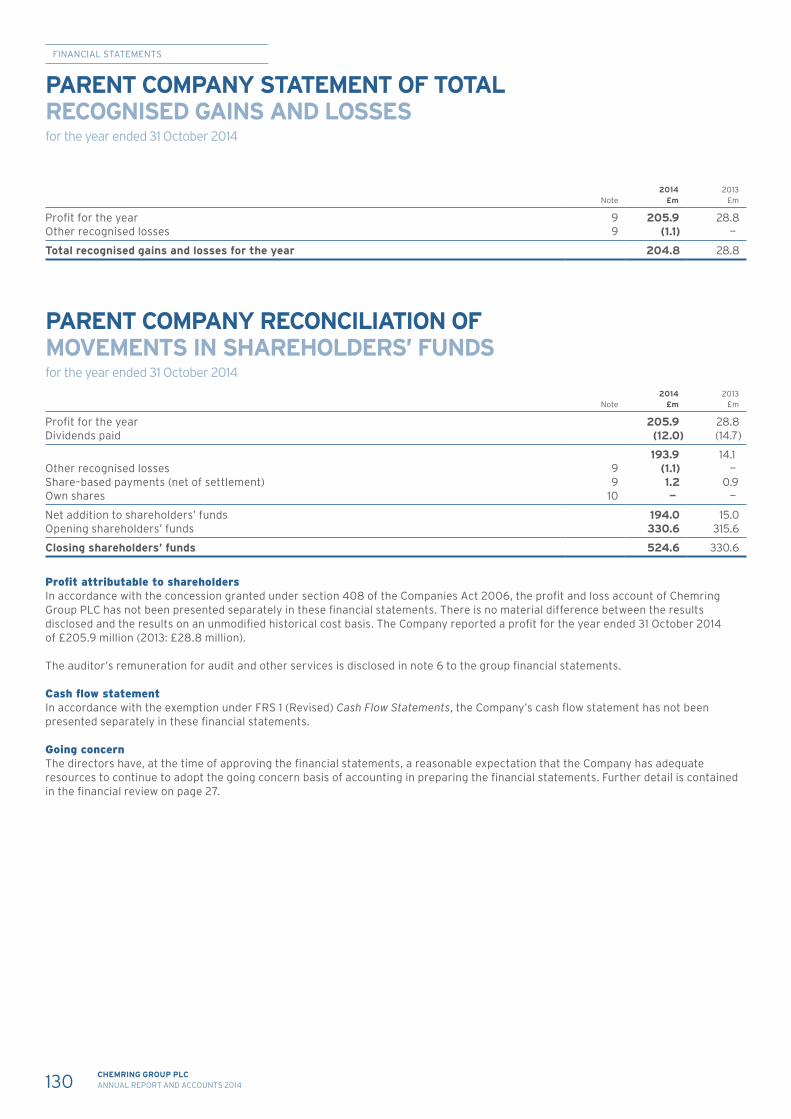
FINANCIAL STATEMENTS
130 CHEMRING GROUP PLCANNUAL REPORT AND ACCOUNTS 2014
PARENT COMPANY STATEMENT OF TOTAL RECOGNISED GAINS AND LOSSES for the year ended 31 October 2014
Note2014
£m2013
£m
Profit for the year 9 205.9 28.8Other recognised losses 9 (1.1) —
Total recognised gains and losses for the year 204.8 28.8
PARENT COMPANY RECONCILIATION OFMOVEMENTS IN SHAREHOLDERS’ FUNDS for the year ended 31 October 2014
Note2014
£m2013
£m
Profit for the year 205.9 28.8Dividends paid (12.0) (14.7)
193.9 14.1Other recognised losses 9 (1.1) —Share–based payments (net of settlement) 9 1.2 0.9Own shares 10 — —
Net addition to shareholders’ funds 194.0 15.0Opening shareholders’ funds 330.6 315.6
Closing shareholders’ funds 524.6 330.6
Profit attributable to shareholders In accordance with the concession granted under section 408 of the Companies Act 2006, the profit and loss account of Chemring Group PLC has not been presented separately in these financial statements. There is no material difference between the results disclosed and the results on an unmodified historical cost basis. The Company reported a profit for the year ended 31 October 2014 of £205.9 million (2013: £28.8 million).
The auditor’s remuneration for audit and other services is disclosed in note 6 to the group financial statements.
Cash flow statement In accordance with the exemption under FRS 1 (Revised) Cash Flow Statements, the Company’s cash flow statement has not been presented separately in these financial statements.
Going concern The directors have, at the time of approving the financial statements, a reasonable expectation that the Company has adequate resources to continue to adopt the going concern basis of accounting in preparing the financial statements. Further detail is contained in the financial review on page 27.
STRATEGIC REPORT
GOVERNANCE
FINANCIAL STATEMENTS
OTHER INFORMATION
131CHEMRING GROUP PLCANNUAL REPORT AND ACCOUNTS 2014
STRATEGIC REPORT
GOVERNANCE
FINANCIAL STATEMENTS
OTHER INFORMATION
NOTES TO THE PARENT COMPANY FINANCIAL STATEMENTS
1. Chemring Group PLC accounting policies The financial statements have been prepared in accordance with applicable United Kingdom accounting standards. The particular accounting policies adopted have been applied consistently throughout the current and previous year and are described below.
Accounting convention The financial statements are prepared under the historical cost convention, as modified by the revaluation of property, in accordance with the Companies Act 2006, applicable accounting standards and UK generally accepted accounting practice (“UK GAAP“).
Related parties The Company is exempt under FRS 8 Related Party Disclosures from disclosing transactions with other members of the Group.
Revenue recognition Interest income is accrued on a time basis, by reference to the principal outstanding and at the effective interest rate applicable, which is the rate that exactly discounts estimated future cash receipts through the expected life of the financial asset to its net carrying amount.
Dividend income from investments is recognised when the shareholder’s rights to receive payment have been established.
Tangible fixed assets Property, plant and equipment is held at cost less accumulated depreciation and any recognised impairment loss. No depreciation is provided on freehold land. On other assets, depreciation is provided at rates calculated to write down their cost or valuation to their estimated residual values by equal instalments over their estimated useful economic lives, which are considered to be:
Leasehold buildings – the period of the lease Plant and equipment – up to ten years
Investment in Group undertakings Investments are stated at cost less any provision for impairment in value.
Operating leases Operating lease rental charges are taken to the profit and loss account on a straight–line basis over the life of the lease.
Provisions A provision is recognised when the Company has a present legal or constructive obligation as a result of a past event and it is probable that settlement will be required of an amount that can be reliably estimated. Long–term liabilities and provisions are discounted when the impact is material.
Current tax Current tax, including UK corporation tax and foreign tax, is provided for at amounts expected to be paid or recovered using the tax rates and laws that have been enacted, or substantively enacted, by the balance sheet date.
Deferred tax Deferred tax is provided in full at the anticipated tax rates on differences arising from the inclusion of items of income and expenditure in tax computations in periods different from those in which they are included in the financial statements. Deferred tax is not provided on timing differences arising from the revaluation of fixed assets where there is no commitment to sell the asset. Deferred tax assets and liabilities are not discounted.
Special capital reserve The special capital reserve was created as part of a capital reduction scheme involving the cancellation of the share premium account which was approved by the Court in 1986, in accordance with the requirements of the Companies Act 1985.
Foreign currencies The functional currency of the Company is sterling. Transactions in foreign currencies are translated into sterling at the rates prevailing on the dates of the transactions. At each balance sheet date, monetary assets and liabilities that are denominated in foreign currencies are retranslated at rates prevailing on the balance sheet date. These translation differences are included in the profit and loss account.
For a forward foreign exchange contract to be treated as a hedge the instrument must be related to actual foreign currency assets or liabilities, or to a probable commitment. It must involve the same currency or similar currencies as the hedged item and must also reduce the risk of foreign currency exchange movements on the Company’s operations. Gains and losses arising on these contracts are deferred and recognised in the profit and loss account, or as adjustments to the carrying amount of fixed assets, only when the hedged transaction has itself been reflected in the Company’s financial statements.
For an interest rate swap to be treated as a hedge the instrument must be related to actual assets or liabilities or a probable commitment, and must change the nature of the interest rate by converting a fixed rate to a variable rate or vice versa. Interest differentials under these swaps are recognised by adjusting interest payable over the periods of the contracts.
If an instrument ceases to be accounted for as a hedge, for example because the underlying hedged position is eliminated, the instrument is marked to market and any resulting profit or loss recognised at that time.
Bank borrowingsInterest bearing bank loans and overdrafts are recorded at the proceeds received, net of direct issue costs. Finance charges, including premiums payable on settlement or redemption, and direct issue costs are accounted for on an accruals basis to the profit and loss account, using the effective interest method, and are added to the carrying amount of the instrument to the extent that they are not settled in the period in which they arise.
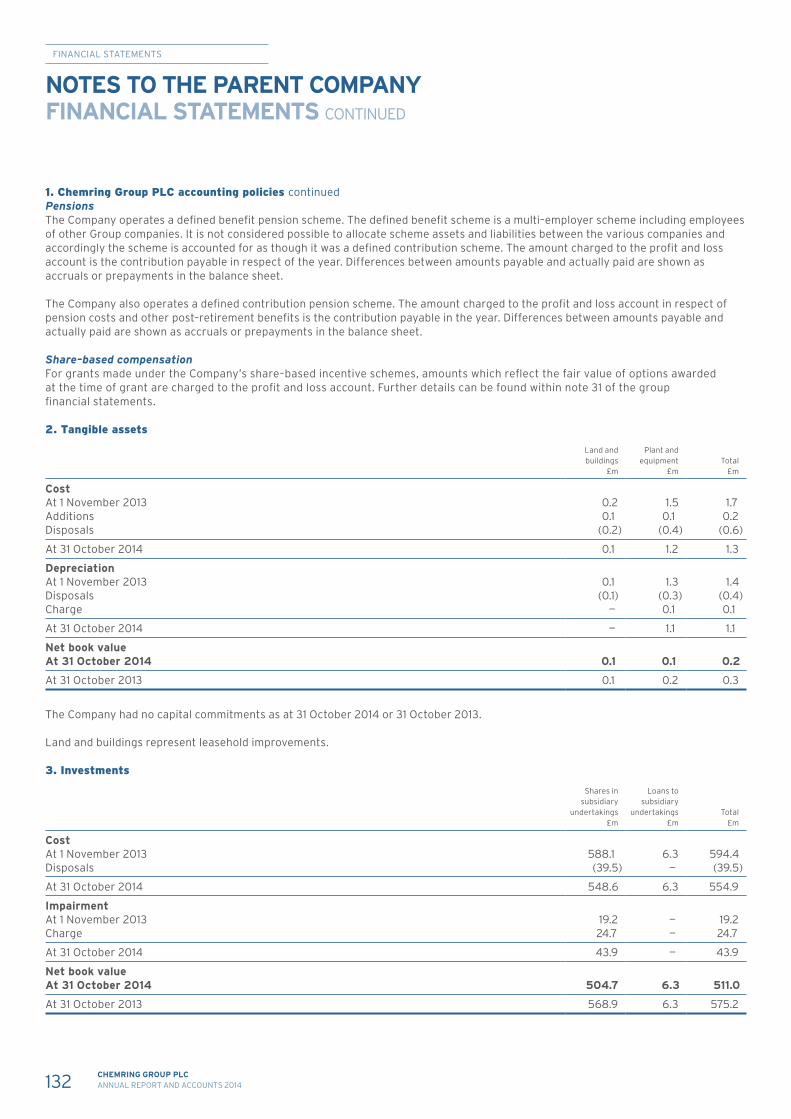
FINANCIAL STATEMENTS
132 CHEMRING GROUP PLCANNUAL REPORT AND ACCOUNTS 2014
PensionsThe Company operates a defined benefit pension scheme. The defined benefit scheme is a multi–employer scheme including employees of other Group companies. It is not considered possible to allocate scheme assets and liabilities between the various companies and accordingly the scheme is accounted for as though it was a defined contribution scheme. The amount charged to the profit and loss account is the contribution payable in respect of the year. Differences between amounts payable and actually paid are shown as accruals or prepayments in the balance sheet.
The Company also operates a defined contribution pension scheme. The amount charged to the profit and loss account in respect of pension costs and other post–retirement benefits is the contribution payable in the year. Differences between amounts payable and actually paid are shown as accruals or prepayments in the balance sheet.
Share–based compensationFor grants made under the Company’s share–based incentive schemes, amounts which reflect the fair value of options awarded at the time of grant are charged to the profit and loss account. Further details can be found within note 31 of the group financial statements.
2. Tangible assets
Land and buildings
£m
Plant and equipment
£mTotal
£m
CostAt 1 November 2013 0.2 1.5 1.7Additions 0.1 0.1 0.2Disposals (0.2) (0.4) (0.6)
At 31 October 2014 0.1 1.2 1.3
Depreciation At 1 November 2013 0.1 1.3 1.4Disposals (0.1) (0.3) (0.4)Charge — 0.1 0.1
At 31 October 2014 — 1.1 1.1
Net book value At 31 October 2014 0.1 0.1 0.2
At 31 October 2013 0.1 0.2 0.3
The Company had no capital commitments as at 31 October 2014 or 31 October 2013.
Land and buildings represent leasehold improvements.
3. Investments
Shares in subsidiary
undertakings £m
Loans to subsidiary
undertakings £m
Total£m
CostAt 1 November 2013 588.1 6.3 594.4Disposals (39.5) — (39.5)
At 31 October 2014 548.6 6.3 554.9
ImpairmentAt 1 November 2013 19.2 — 19.2Charge 24.7 — 24.7
At 31 October 2014 43.9 — 43.9
Net book valueAt 31 October 2014 504.7 6.3 511.0
At 31 October 2013 568.9 6.3 575.2
1. Chemring Group PLC accounting policies continued
NOTES TO THE PARENT COMPANYFINANCIAL STATEMENTS CONTINUED

STRATEGIC REPORT
GOVERNANCE
FINANCIAL STATEMENTS
OTHER INFORMATION
133CHEMRING GROUP PLCANNUAL REPORT AND ACCOUNTS 2014
Following a detailed review, impairment losses have been recognised in relation to CHG Overseas Limited of £24.7 million as a consequence of lower expectations of future trading performance and cash flows. These lower expectations reflect the continuing challenging economic conditions facing the defence industry.
4. Investments in Group undertakings The trading Group undertakings at 31 October 2014 were:
Country of incorporation (or registration) and operation Segment
Chemring Countermeasures Limited England CountermeasuresChemring Defence UK Limited England Energetic Systems *Chemring EOD Limited England Sensors & Electronics Chemring Prime Contracts Limited England Energetic Systems Roke Manor Research Limited England Sensors & Electronics Chemring Energetics UK Limited Scotland Energetic Systems*Alloy Surfaces Company, Inc. USA Countermeasures*Kilgore Flares Company LLC USA Countermeasures*Chemring Energetic Devices, Inc. USA Energetic Systems*Chemring Ordnance, Inc. USA Energetic Systems*Non–Intrusive Inspection Technology, Inc. USA Sensors & Electronics *Chemring Detection Systems, Inc. USA Sensors & Electronics *Chemring Australia Pty Limited Australia Countermeasures*Chemring Nobel AS Norway Energetic Systems*3d-Radar AS Norway Sensors & Electronics
* Investments held by a subsidiary company
The directors consider that the carrying value of the investments does not exceed their fair value.
5. Debtors
2014£m
2013£m
Amounts due within one year Deferred tax asset (see note 11) 6.9 0.3Other debtors 10.0 6.9Corporation tax recoverable 6.8 5.0Prepayments and accrued income 0.8 0.7
24.5 12.9
Amounts due after more than one year Amounts owed by subsidiary undertakings 457.6 250.8
An asset of £0.7 million (2013: £1.5 million) is recognised within other debtors in respect of the fair value of derivative financial instruments, as set out in note 24 of the group financial statements. The directors consider that the carrying value of the debtors approximates to their fair value.
Following a detailed review, amounts owed by subsidiary undertakings have been written down by £225.2 million as a consequence of lower expectations of future trading performance and cash flows. These lower expectations reflect the continuing challenging economic conditions facing the defence industry.
3. Investments continued
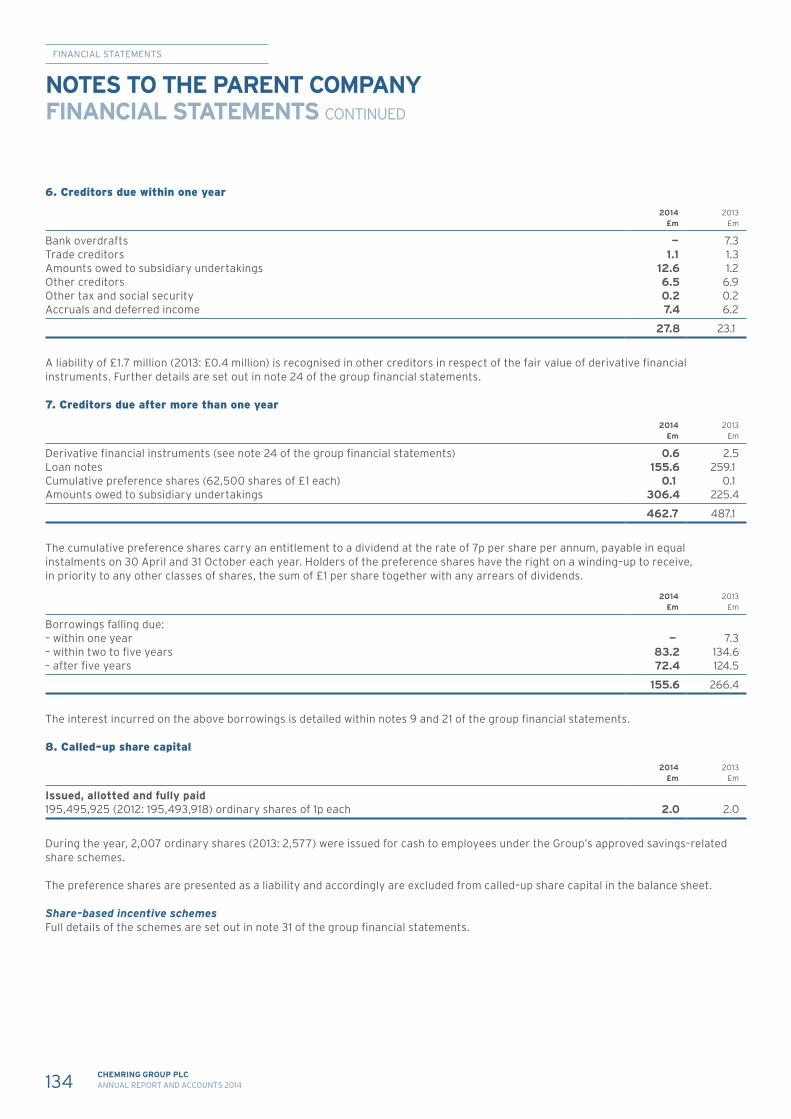
FINANCIAL STATEMENTS
134 CHEMRING GROUP PLCANNUAL REPORT AND ACCOUNTS 2014
6. Creditors due within one year
2014£m
2013£m
Bank overdrafts — 7.3Trade creditors 1.1 1.3Amounts owed to subsidiary undertakings 12.6 1.2Other creditors 6.5 6.9Other tax and social security 0.2 0.2Accruals and deferred income 7.4 6.2
27.8 23.1
A liability of £1.7 million (2013: £0.4 million) is recognised in other creditors in respect of the fair value of derivative financial instruments. Further details are set out in note 24 of the group financial statements.
7. Creditors due after more than one year
2014£m
2013£m
Derivative financial instruments (see note 24 of the group financial statements) 0.6 2.5Loan notes 155.6 259.1Cumulative preference shares (62,500 shares of £1 each) 0.1 0.1Amounts owed to subsidiary undertakings 306.4 225.4
462.7 487.1
The cumulative preference shares carry an entitlement to a dividend at the rate of 7p per share per annum, payable in equal instalments on 30 April and 31 October each year. Holders of the preference shares have the right on a winding–up to receive, in priority to any other classes of shares, the sum of £1 per share together with any arrears of dividends.
2014£m
2013£m
Borrowings falling due: – within one year — 7.3– within two to five years 83.2 134.6– after five years 72.4 124.5
155.6 266.4
The interest incurred on the above borrowings is detailed within notes 9 and 21 of the group financial statements.
8. Called–up share capital
2014£m
2013£m
Issued, allotted and fully paid 195,495,925 (2012: 195,493,918) ordinary shares of 1p each 2.0 2.0
During the year, 2,007 ordinary shares (2013: 2,577) were issued for cash to employees under the Group’s approved savings–related share schemes.
The preference shares are presented as a liability and accordingly are excluded from called–up share capital in the balance sheet.
Share–based incentive schemes Full details of the schemes are set out in note 31 of the group financial statements.
NOTES TO THE PARENT COMPANYFINANCIAL STATEMENTS CONTINUED
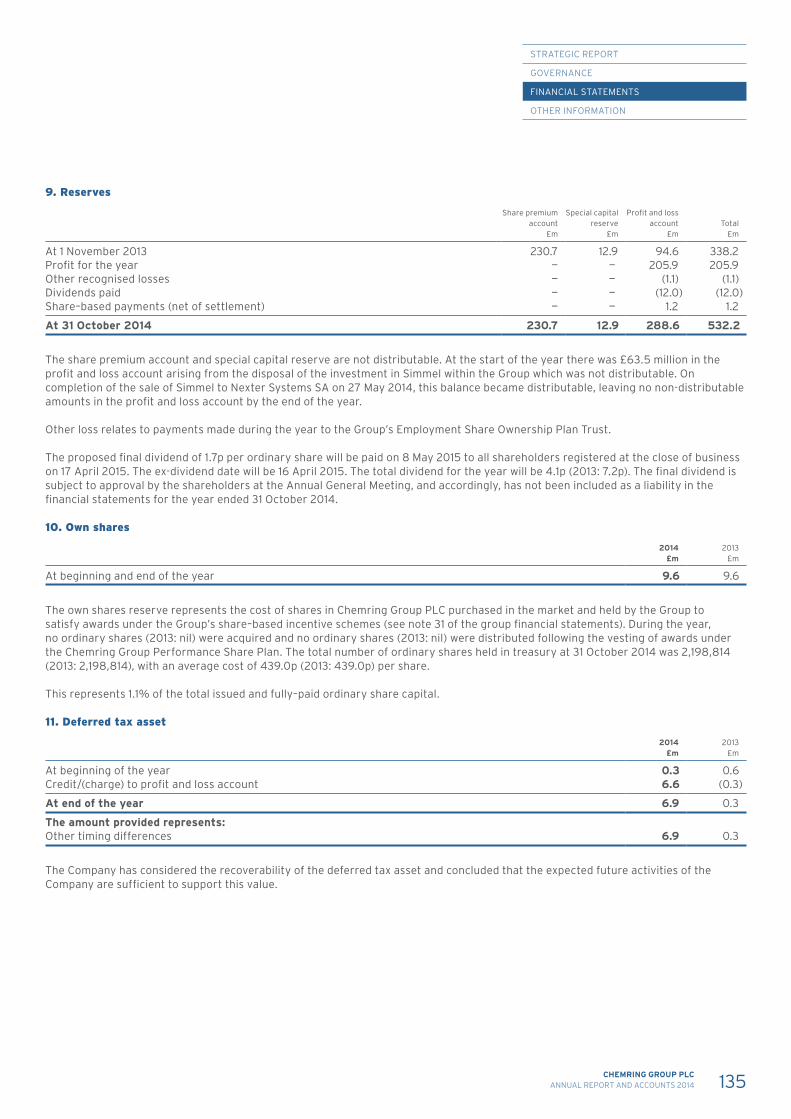
STRATEGIC REPORT
GOVERNANCE
FINANCIAL STATEMENTS
OTHER INFORMATION
135CHEMRING GROUP PLCANNUAL REPORT AND ACCOUNTS 2014
9. Reserves
Share premium account
£m
Special capital reserve
£m
Profit and loss account
£mTotal
£m
At 1 November 2013 230.7 12.9 94.6 338.2Profit for the year — — 205.9 205.9Other recognised losses — — (1.1) (1.1)Dividends paid — — (12.0) (12.0)Share–based payments (net of settlement) — — 1.2 1.2
At 31 October 2014 230.7 12.9 288.6 532.2
The share premium account and special capital reserve are not distributable. At the start of the year there was £63.5 million in the profit and loss account arising from the disposal of the investment in Simmel within the Group which was not distributable. On completion of the sale of Simmel to Nexter Systems SA on 27 May 2014, this balance became distributable, leaving no non-distributable amounts in the profit and loss account by the end of the year.
Other loss relates to payments made during the year to the Group’s Employment Share Ownership Plan Trust.
The proposed final dividend of 1.7p per ordinary share will be paid on 8 May 2015 to all shareholders registered at the close of business on 17 April 2015. The ex-dividend date will be 16 April 2015. The total dividend for the year will be 4.1p (2013: 7.2p). The final dividend is subject to approval by the shareholders at the Annual General Meeting, and accordingly, has not been included as a liability in the financial statements for the year ended 31 October 2014.
10. Own shares
2014£m
2013£m
At beginning and end of the year 9.6 9.6
The own shares reserve represents the cost of shares in Chemring Group PLC purchased in the market and held by the Group to satisfy awards under the Group’s share–based incentive schemes (see note 31 of the group financial statements). During the year, no ordinary shares (2013: nil) were acquired and no ordinary shares (2013: nil) were distributed following the vesting of awards under the Chemring Group Performance Share Plan. The total number of ordinary shares held in treasury at 31 October 2014 was 2,198,814 (2013: 2,198,814), with an average cost of 439.0p (2013: 439.0p) per share.
This represents 1.1% of the total issued and fully–paid ordinary share capital.
11. Deferred tax asset
2014£m
2013£m
At beginning of the year 0.3 0.6Credit/(charge) to profit and loss account 6.6 (0.3)
At end of the year 6.9 0.3
The amount provided represents:Other timing differences 6.9 0.3
The Company has considered the recoverability of the deferred tax asset and concluded that the expected future activities of the Company are sufficient to support this value.
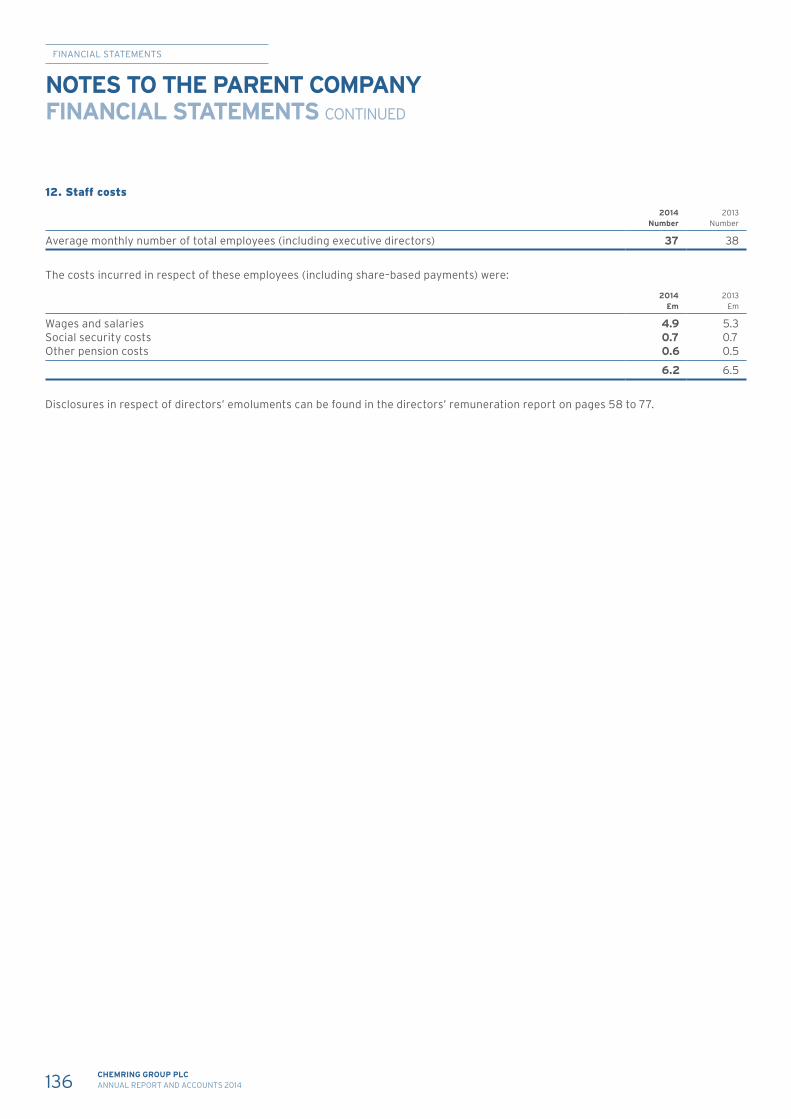
FINANCIAL STATEMENTS
136 CHEMRING GROUP PLCANNUAL REPORT AND ACCOUNTS 2014
12. Staff costs
2014 Number
2013Number
Average monthly number of total employees (including executive directors) 37 38
The costs incurred in respect of these employees (including share–based payments) were:
2014 £m
2013£m
Wages and salaries 4.9 5.3Social security costs 0.7 0.7Other pension costs 0.6 0.5
6.2 6.5
Disclosures in respect of directors’ emoluments can be found in the directors’ remuneration report on pages 58 to 77.
NOTES TO THE PARENT COMPANYFINANCIAL STATEMENTS CONTINUED
STRATEGIC REPORT
GOVERNANCE
FINANCIAL STATEMENTS
OTHER INFORMATION
CORPORATE INFORMATIONAND WEBSITE
Headquarters and Registration numberregistered office 86662Roke Manor Old Salisbury Lane RegistrarsRomsey Computershare Investor Services plcHampshire The PavilionsSO51 0ZN Bridgwater Road
BristolBS13 8AE
T: +44 (0)1794 833901F: +44 (0)1794 833955
Website: www.chemring.co.uk
Find out more onlineFor more information about Chemring Group PLC, please visit www.chemring.co.uk where the latest shareholder information can be accessed, including:• Current share price• Key financial information• Financial calendar• Shareholder services and notices• Corporate governance• RSS news feeds• Results and presentations• Analysts’ forecasts• Regulatory news
Chemring Group PLC’s Annual Report and Accounts 2014 and the Notice for the Annual General Meeting can also be viewed and downloaded at www.chemring.co.uk/investors
© Chemring Group PLC 2015
The information in this document is the property of Chemring Group PLC and may not be copied or communicated to a third party or used for any purpose, other than that for which it is supplied, without the express written consent of Chemring Group PLC. This information is given in good faith based upon the latest information available to Chemring Group PLC; no warranty or representation is given concerning such information, which must not be taken as establishing any contractual or other commitment binding upon Chemring Group PLC or any of its subsidiary or associated companies.
137CHEMRING GROUP PLCANNUAL REPORT AND ACCOUNTS 2014
Chemring Group PLCRoke ManorOld Salisbury LaneRomseyHampshire SO51 0ZNTel: +44(0)1794 833901Email: [email protected]